1 24 th MEETING OF THE LONDON GROUP ON ENVIRONMENTAL ACCOUNTING DUBLIN, IRELAND, 1 – 4 OCTOBER, 2018 Private sector trials of Accounting for Nature, and links with national environmental economic accounts Authors: Dr Celine Steinfeld and Peter Cosier Wentworth Group of Concerned Scientists, Australia Introduction In 2008, the Wentworth Group of Concerned Scientists published the Accounting for Nature model. This model was designed with the objective of establishing a practical, affordable and scientifically robust method for applying scientific information about the biophysical condition of environmental assets (e.g. native vegetation, soil, rivers, estuaries, fauna) into an accounting framework. Environmental condition accounts are critical to the success of the UN System of Environmental Economic Accounting (SEEA) because they provide the foundation for measuring the flow of ecosystem services that those assets provide to society, and valuing the benefits they provide. 1, 2 In 2015, Australia’s Regional Natural Resource Management authorities, in cooperation with scientists, economists and statisticians in universities and Commonwealth and state government agencies, completed a 5‐year continental scale landscape (ecosystem) scale trial to test the practical application of the Accounting for Nature model. 3 This trial formed the basis of a revised methodology published in 2016. 4 The next step was to examine the feasibility of developing private sector environmental condition accounts using the Accounting for Nature methodology. Condition accounting at the enterprise scale is essential for understanding the cumulative impacts of management and investment decisions which drive ecosystem degradation at a landscape scale. The goal of the private sector trials is to evaluate how the Accounting for Nature model can be used as a cost effective pathway for industry, farmers and conservation managers to measure the condition of environmental assets that underpin the sustainability of their businesses. The Wentworth Group collaborated with three private sector enterprises as part of a new trial: Kilter Rural, a $A250 million agri‐business who manage mixed irrigated cropping and environmental grazing across aggregated farms in northern Victoria; Austral Fisheries who operate a Marine Stewardship Council certified Patagonian toothfish fishery in the World Heritage Heard Island and McDonald Islands region in the Southern Ocean; and the Tasmanian Land Conservancy for their 11,100 ha Five Rivers Reserve located within the Tasmanian Wilderness World Heritage Area. This paper describes the outcomes of these trials using case studies, describes new condition accounting concepts that arose from the trials, and discusses the benefits of linking landscape (ecosystem) scale and enterprise (property) scale environmental condition accounts to inform policy settings, underpin ecosystems services markets, and support investment and management decisions.
Transcript
1
24th MEETING OF THE LONDON GROUP ON ENVIRONMENTAL ACCOUNTING DUBLIN, IRELAND, 1 – 4 OCTOBER, 2018
Private sector trials of Accounting for Nature,
and links with national environmental economic accounts
Authors: Dr Celine Steinfeld and Peter Cosier Wentworth Group of Concerned Scientists, Australia
Introduction
In 2008, the Wentworth Group of Concerned Scientists published the Accounting for Nature model.
This model was designed with the objective of establishing a practical, affordable and scientifically
robust method for applying scientific information about the biophysical condition of environmental
assets (e.g. native vegetation, soil, rivers, estuaries, fauna) into an accounting framework.
Environmental condition accounts are critical to the success of the UN System of Environmental
Economic Accounting (SEEA) because they provide the foundation for measuring the flow of
ecosystem services that those assets provide to society, and valuing the benefits they provide.1, 2
In 2015, Australia’s Regional Natural Resource Management authorities, in cooperation with
scientists, economists and statisticians in universities and Commonwealth and state government
agencies, completed a 5‐year continental scale landscape (ecosystem) scale trial to test the practical
application of the Accounting for Nature model.3 This trial formed the basis of a revised
methodology published in 2016.4
The next step was to examine the feasibility of developing private sector environmental condition
accounts using the Accounting for Nature methodology. Condition accounting at the enterprise scale
is essential for understanding the cumulative impacts of management and investment decisions
which drive ecosystem degradation at a landscape scale. The goal of the private sector trials is to
evaluate how the Accounting for Nature model can be used as a cost effective pathway for industry,
farmers and conservation managers to measure the condition of environmental assets that underpin
the sustainability of their businesses.
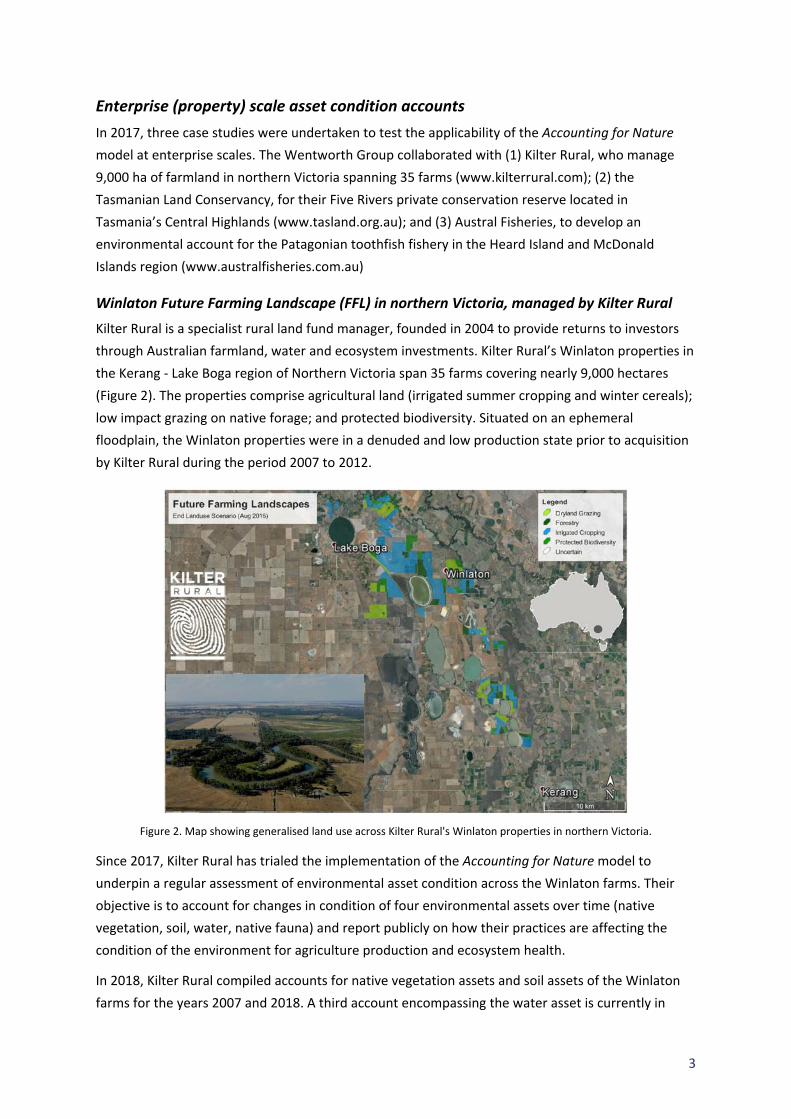
The Wentworth Group collaborated with three private sector enterprises as part of a new trial: Kilter
Rural, a $A250 million agri‐business who manage mixed irrigated cropping and environmental
grazing across aggregated farms in northern Victoria; Austral Fisheries who operate a Marine
Stewardship Council certified Patagonian toothfish fishery in the World Heritage Heard Island and
McDonald Islands region in the Southern Ocean; and the Tasmanian Land Conservancy for their
11,100 ha Five Rivers Reserve located within the Tasmanian Wilderness World Heritage Area.
This paper describes the outcomes of these trials using case studies, describes new condition
accounting concepts that arose from the trials, and discusses the benefits of linking landscape
(ecosystem) scale and enterprise (property) scale environmental condition accounts to inform policy
settings, underpin ecosystems services markets, and support investment and management
decisions.
2
Application of Accounting for Nature at landscape and enterprise scales
Accounting for Nature is a method for building biophysical condition accounts using a common unit
of measure (an Econd). An Econd is an index that describes the condition of any environmental asset
at any scale, enabling scientific information to be placed into an accounting framework. Asset‐based
condition accounting approaches are used in international standards and agreements such as the UN
System of Environmental Economic Accounts (SEEA),5 and the Convention on Biological Diversity.6
This section documents case studies showing the application of the asset‐based Accounting for
Nature condition accounting model at a landscape (ecosystem) scale and enterprise (property)
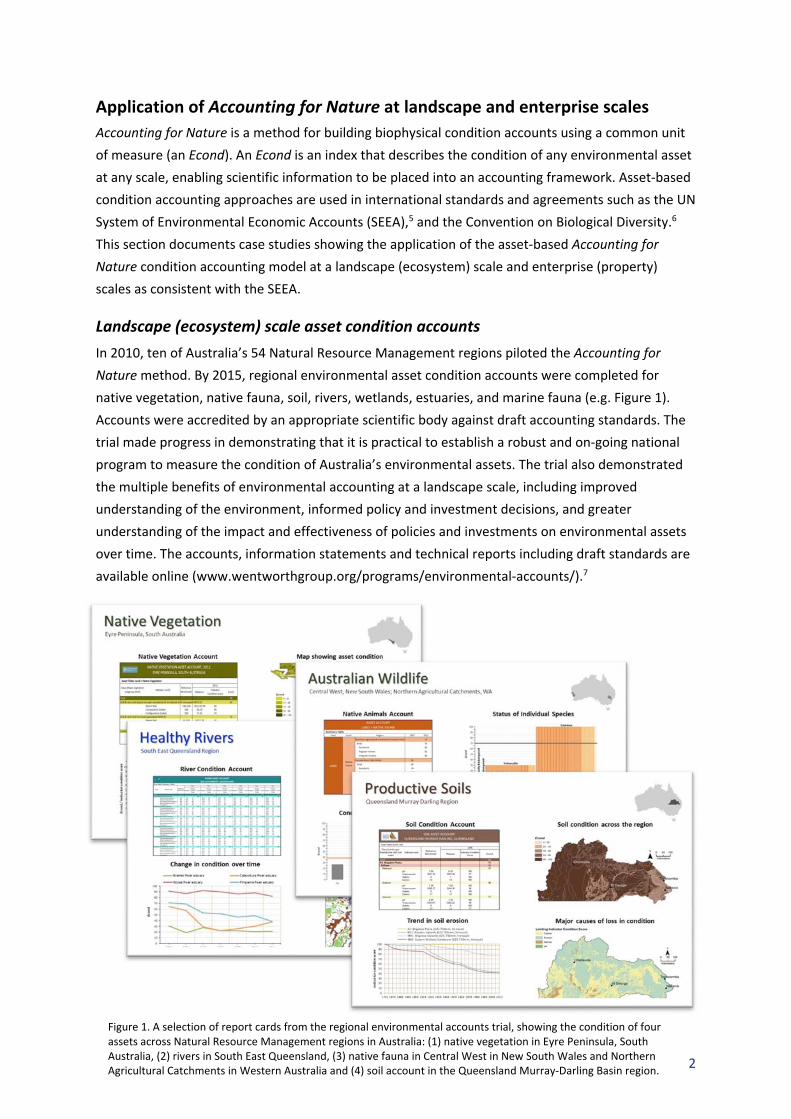
Accounts were accredited by an appropriate scientific body against draft accounting standards. The
trial made progress in demonstrating that it is practical to establish a robust and on‐going national
program to measure the condition of Australia’s environmental assets. The trial also demonstrated
the multiple benefits of environmental accounting at a landscape scale, including improved
understanding of the environment, informed policy and investment decisions, and greater
understanding of the impact and effectiveness of policies and investments on environmental assets
over time. The accounts, information statements and technical reports including draft standards are
available online (www.wentworthgroup.org/programs/environmental‐accounts/).7
Figure 1. A selection of report cards from the regional environmental accounts trial, showing the condition of four assets across Natural Resource Management regions in Australia: (1) native vegetation in Eyre Peninsula, South Australia, (2) rivers in South East Queensland, (3) native fauna in Central West in New South Wales and Northern Agricultural Catchments in Western Australia and (4) soil account in the Queensland Murray‐Darling Basin region.
Figure 4. Asset table from Kilter Rural's soil account showing the Econd and indicator condition scores (ICS) for assets across the 35 Winlaton properties.
Figure 5. Trend in native vegetation and soil Econds between 2007 and 2018, with 2022 management targets.
Figure 6. Maps showing condition of native vegetation (left) and soil (right) across Kilter Rural’s Winlaton properties (in Econds) based on the 2018 environmental account.
0
20
40
60
80
100
2007 2018 2022
Econd
Native Vegetation Econd Soil Econd
*2007 soil values are initial estimates to be refined
6
Five Rivers Reserve in Tasmania’s Central Highlands, Tasmanian Land Conservancy
The Five Rivers Reserve located in Tasmania’s Central Highlands covers an area of 11,113 hectares
(Figure 7). The reserve is situated at elevations ranging from 600 metres to over 1,100 metres,
receives an average of 2,500 mm of rainfall per year and experiences prolonged frost and heavy
snowfalls in winter. The Five Rivers Reserve was acquired by the Tasmanian Land Conservancy (TLC)
in 2011 as private freehold land and is now managed as a permanent conservation reserve. Part of
the reserve ‐ ‘Skullbone Plains’ ‐ has World Heritage status and is included within the Tasmanian
Wilderness World Heritage Area. The remainder of the reserve adjoins the World Heritage
boundary. The Reserve has a range of other neighbouring land tenures including State and private
conservation reserves, State and privately managed forests, pastoral land, private shacks, hydro‐
electricity impoundments and lagoons.
Figure 7. Location of the Five Rivers Reserve in Tasmania’s Central Highlands, Australia.
The TLC applied the Wentworth Group’s Accounting for Nature model to the Five Rivers Reserve
ecological monitoring data to help inform their management priorities10 and to more easily
communicate this information to their supporters. The Five Rivers Management Plan was approved
by the TLC’s Conservation Science and Planning Advisory Council in 2014. It describes the
conservation values (“assets”) of the reserve and guides the management actions needed for their
protection. An ecosystem monitoring program was installed in 2014 to provide reserve managers
with information about the changing condition of ecosystems of the Five Rivers Reserve, the threats
they face, and the effectiveness of conservation management actions.
Environmental assets presented in TLC’s environmental account sourced from the priorities set in
the reserve management plan: native vegetation, native mammals, and rivers and wetlands. Three
classes of native vegetation assets were identified for the account: highland forests, highland
marshes and riparian zones. Three groupings of native mammal were identified: carnivores,
herbivores and omnivores. Five types of rivers were identified: Clarence River, Kenneth Creek, Nive
River, Pine River and the Serpentine Rivulet.
7
Indicators of condition were selected during a workshop with scientists from the Wentworth Group
in consultation with TLC’s scientists. For native vegetation, indicators were extent (hectares),
diversity, structural complexity, recruitment and carbon storage. For native mammals, indicators
were richness, abundance and occupancy. For rivers, indicators were water quality, native fish and
hydrology.
Most of the data used to populate the environmental account were derived from the TLC’s
ecological monitoring program. For native vegetation, 100 permanent photo sites were established
and assessed in 2014, 2016 and 2018, and will be assessed at three yearly intervals thereafter. For
native mammals, 46 motion sensor camera sites were established in 2014 to measure terrestrial
vertebrates and these are assessed annually. Water quality was assessed every 2 to 5 years. The
method used to populate the accounts is described fully in the TLC’s information statement.11 The
account was accredited by the TLC’s Conservation Science and Planning Advisory Council in 2018,
and information in the account will be summarised in the TLC annual report.
TLC’s spreadsheet accounts show the condition of native vegetation on the Five Rivers Reserve has
remained at almost pristine levels (Econd = 98 in 2014 and 2016 accounts; Figure 8).12 This Econd
reflects the high scores for all indicators, except for carbon storage (Econd = 75), as a consequence
of the heavy logging in highland forests prior to acquisition by the TLC.
Figure 8. Summary table from TLC's environmental account showing the condition of native vegetation, native mammals and rivers and wetlands on the Five Rivers Reserve.
The condition of native mammals in the Five Rivers Reserve increased from an Econd of 85 in 2014
to an Econd of 89 in 2017, reflecting the improved status of the Tasmanian devil recovering from
devil facial tumour disease. The account also showed that herbivores (wombats, pademelons,
wallabies) were in a pristine (undegraded) condition, the condition of omnivores (bettongs,
bandicoots, possums, echidnas, potoroos) improved by 6% over 3 years to near‐pristine, and the
condition of carnivores (quolls, devils) has improved mainly due to the improved status of the
Tasmanian devil. The condition of rivers and wetlands in the Five Rivers Reserve was an Econd of
78.5, primarily as a consequence of the infestation of brown trout (an introduced species in
Australia) in nearly all rivers in the reserve. TLC is now investigating the feasibility of removing these
exotic species from some of the areas where they threaten endangered fish populations.
8
Patagonian toothfish fishery of the Heard Island and McDonald Islands, Austral Fisheries
The Heard Island and McDonald Islands Toothfish Fishery targets the Patagonian toothfish
(Dissostichus eleginoides), and operates in the vicinity of Heard Island and the McDonald Islands in
the Southern Ocean (Figure 9). The fishery extends from 13 nautical miles offshore to the edge of
the 200 nautical mile Australian Exclusive Economic Zone around the islands. The islands and the 12
nautical mile territorial sea is listed on the World Heritage List and forms part of the Heard Island
and McDonald Islands Marine Reserve, which is closed to fishing.
Figure 9. Location of the Heard Island and McDonald Islands showing the fishing zone (red line) and the marine reserve (green) (Source: www.agriculture.gov.au/abares/research‐topics/fisheries/fishery‐status/antarctic‐sub‐antarctic).
The Toothfish Fishery is a Commonwealth‐managed fishery under the jurisdiction of the Commission
on the Conservation of Antarctic Marine Living Resources, the Australian Fisheries Management
Authority and the Australian Antarctic Division in accordance with the Australian Antarctic Marine
Resources Conservation Act 1981. The fishery has been certified as sustainable and well managed
under the Marine Stewardship Council’s (MSC) standards since March 2012. Due to its location,
Statutory Fishing Rights govern access to the fishery. The fishing season is year‐round for trawl (from
1 December to 30 November each year), and seasonal for longline (core season of 1 May to 14
September with season extension periods available from 1 April to 30 November). A total allowable
catch is in place for toothfish. There are also catch limits on all bycatch species. Until recently fishing
in the region had been limited to a maximum of three Australian boats at any one time and is subject
to stringent management arrangements. The only operators in the fishery are Austral Fisheries Pty
Ltd and Australian Longline Pty Ltd. The permitted fishing methods are demersal longlining,
demersal trawling and traps, and trapping has taken place on a trial basis.
9
Austral Fisheries applied the Accounting for Nature method in an effort to standardise the vast
amount of scientific information available, and to enable a non‐scientific audience to understand the
condition of the fishery and how it has changed over time. The Patagonian toothfish fishery account
combines scientific information about the condition of the fishery for the target species (Patagonian
toothfish) as well as those assets potentially impacted by the fishery (bycatch, benthic habitat, bait)
based on data already produced as part of MSC certification and environmental risk assessments.
Indicators of condition for the fishery account were derived from the scientific monitoring reports
produced as part of the AFMA and MSC accreditation processes in consultation with managers from
Austral Fisheries. For the Patagonian toothfish, the spawning stock biomass indicator was measured
using modelled data (1982 ‐ 2017) from stock assessments performed by the Australian Antarctic
Division. For bycatch, the indicator was weight in tonnes of major and minor bycatch based on
records from the Convention for the Conservation of Antarctic Marine Living Resources Statistical
Bulletin since 1997. For benthic habitat, the indicators were biomass (tonnes) and extent (hectares)
of benthic zone impacted by fishing, based on data available from the Commonwealth Scientific and
Industrial Research Organisation’s (CSIRO) ecological risk assessments for the period between 1997
and 2013. For bait, the indicator was weight of bait (squid) used by the fishery which was
qualitatively assessed through the MSC assessment process.
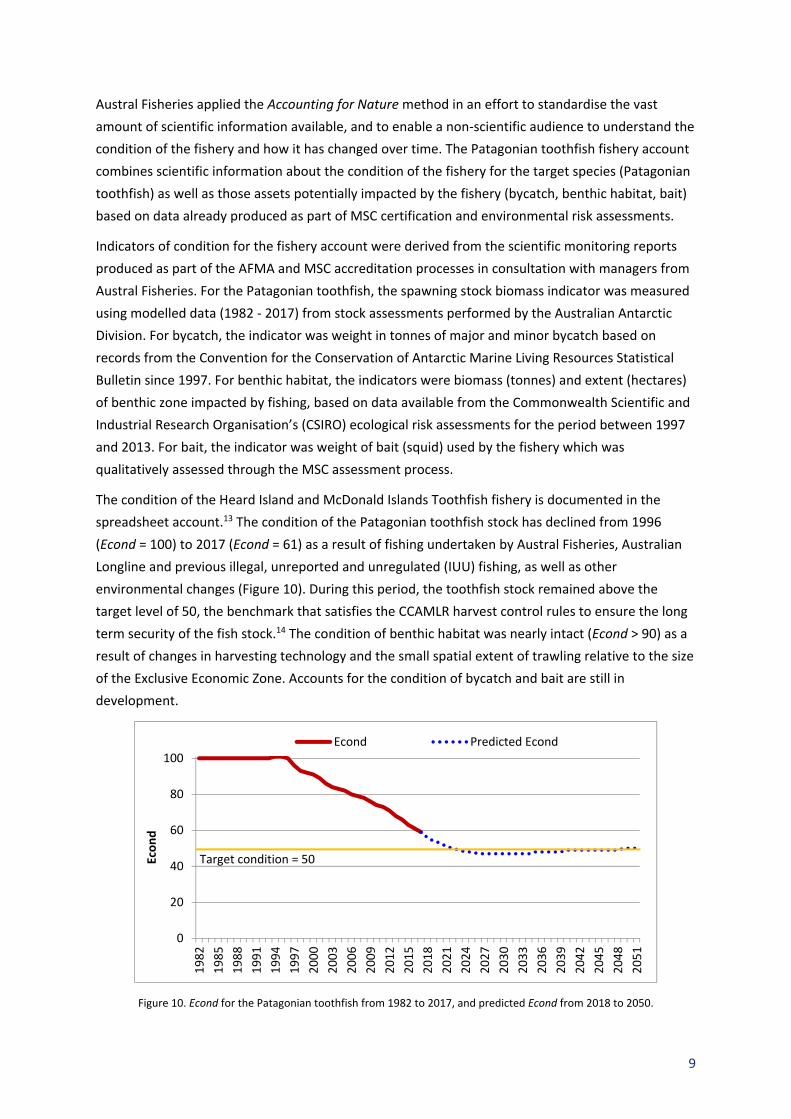
The condition of the Heard Island and McDonald Islands Toothfish fishery is documented in the
spreadsheet account.13 The condition of the Patagonian toothfish stock has declined from 1996
(Econd = 100) to 2017 (Econd = 61) as a result of fishing undertaken by Austral Fisheries, Australian
Longline and previous illegal, unreported and unregulated (IUU) fishing, as well as other
environmental changes (Figure 10). During this period, the toothfish stock remained above the
target level of 50, the benchmark that satisfies the CCAMLR harvest control rules to ensure the long
term security of the fish stock.14 The condition of benthic habitat was nearly intact (Econd > 90) as a
result of changes in harvesting technology and the small spatial extent of trawling relative to the size
of the Exclusive Economic Zone. Accounts for the condition of bycatch and bait are still in
development.
Figure 10. Econd for the Patagonian toothfish from 1982 to 2017, and predicted Econd from 2018 to 2050.
0
20
40
60
80
100
1982
1985
1988
1991
1994
1997
2000
2003
2006
2009
2012
2015
2018
2021
2024
2027
2030
2033
2036
2039
2042
2045
2048
2051
Econd
Econd Predicted Econd
Target condition = 50
10
New concepts in Accounting for Nature
The private sector trials have prompted the development of new concepts which have the potential
to extend the utility of the Accounting for Nature method at the enterprise scale. The first concept is
linking environmental and production information. The second concept is attributing changes in the
Econd at an enterprise scale to management actions. These concepts are still in development and
further results will be published as new information becomes available.
1. Pcond: Linking environmental and production information
A major challenge for sustainable resource management is ensuring primary producers can maintain
production without degrading the environmental assets upon which society depends. The United
Nations Food and Agriculture Organization projected that feeding a world population of 9.1 billion
people in 2050 would require raising overall food production by some 70 percent between 2005/07
and 2050.15 To do so, producers require the ability to measure and report on the capacity of their
biophysical assets to maintain or improve production outcomes without degrading environmental
condition.
The Wentworth Group with the assistance of Kilter Rural has adapted the Accounting for Nature
model to enable information about the condition of biophysical assets used for production to be
placed in an accounting framework alongside environmental accounts. Production condition
accounts could be used, for example, to measure the condition of soils for growing crops, the
condition of rivers for irrigation water, the condition of fish stocks for fish and the condition of
forests for timber. In the same way environmental accounts can use an index of condition (Econd),
production condition accounts can use a production index, or Pcond, a measure of the condition of a
biophysical asset to generate market goods and services. As the Econd and Pcond are indices, it is
possible to observe changes in the condition of one index relative to changes in the other. The
difference being a Pcond of 100 represents the maximum biophysical potential of a biophysical asset
to produce a defined set of goods or services (e.g. stocking density, agriculture output), whereas an
Econd of 100 is a measure of an asset in its natural (reference) state.
In the private sector trial, Kilter Rural applied the Pcond to the soil asset on their Winlaton properties
to better understand trends in the condition of soils for improving crop yield (mainly tomatoes,
cotton, lucerne and organic cereals), and to understand the impact of changes in the Pcond on
environmental condition. They followed the same Seven Step method for developing the Econd,16
but instead of using environmental reference condition benchmarks, they selected benchmarks
which reflected ideal conditions for agricultural production based on knowledge of crop
requirements. For example in loamy clay soils in the Kerang – Lake Boga Region, maximum crop
production is achieved when total soil carbon levels are above 4% (i.e. 4% gives an indicator
condition score of 100). By contrast, for the environmental account, the reference benchmark for
soil condition (Econd = 100) is achieved when total soil carbon levels are above 2.5% due to the
naturally occurring lower levels of soil carbon in these soils.
For Kilter Rural’s Winlaton properties, condition accounting revealed that soils were in better
environmental condition than they were for agricultural production (Econd = 60, Pcond = 52; Figure
11
11). This is mainly due to the higher level of carbon and lower soil acidification levels (pH) for
agricultural production benefit compared to that of natural, pristine soils. Such information is
important for managing farm landscapes for environmental and production outcomes. An area of
exploration for Kilter Rural is whether it is possible to improve the Pcond while achieving the target
Econd of 70 by 2022.
Figure 11. Trend in the environmental condition (left) for native vegetation and soil, and trend in the condition of soils for production (right) of soil for Kilter Rural’s Winlaton properties in northern Victoria, Australia.
In this case study, we found that an improvement in the Pcond also resulted in an improvement in
the Econd between 2007 and 2018, because of the improvement in soil condition that had been
badly degraded by past land management practices. Such relationship will not always be the case.
For example, in a native grassland, the Pcond is likely to increase when fertiliser is applied to
improve agricultural production, but the Econd is likely to decrease because the application of
fertiliser could result in the loss of native grassland species.
2. Icond: Attributing changes in the Econd
Changes in the Econd are driven by a range of interacting pressures operating at multiple scales
which can often be lagged in time (e.g. changes in climate, upstream water pollution, invasive
species management, historical land use). Primary producers and policy makers need to be able to
understand how direct management actions influence the condition of assets within and outside
their enterprise, so that they can manage the impacts of their activities accordingly. Understanding
the factors driving changes in the Econd is particularly important where the activities of a producer
have a relatively small or variable influence on asset condition (e.g. runoff from an irrigation
property into a river system). The impact score, or Icond, can be measured as the relative impact of a
specific activity on the Econd of an asset from one accounting period to the next. An Icond of 100
shows the impact of a specific activity contributed to all of the change in the Econd, while an Icond of
50 shows that the impact of an activity explains only half of the change in the Econd.
The Austral Fisheries case study was an opportunity test the disaggregation of the Econd to
distinguish which changes are due to the direct interventions or activities of primary producers and
which changes are driven by other factors. The goal was to assist Austral Fisheries in understanding
0
20
40
60
80
100
2007 2012 2017 2022
Soil condition (Econd/Pcond) Econd
Pcond
2022 Target
12
the relative impacts of their own fishing activities against the impacts of a range of other stock
pressures (e.g. other regulated fishing boats, illegal, unreported and unregulated fishing,
environmental changes driving population). For the Toothfish Fishery account, the Icond score was
based on the tonnes of toothfish harvested by Austral Fisheries alone, against the overall change in
the toothfish biomass of the fishery. The results of the Icond study are still in development.
Benefits of multi‐scale, public‐private environmental accounting
Measuring condition at a landscape scale is essential for decision makers to understand
environmental degradation at scales at which ecosystems function. This enables governments to
monitor and communicate changes, evaluate management actions, set policies and make
investment decisions. However, many management and investment decisions that impact on the
environment are also made at an enterprise scale. It is the cumulative impact of decisions at multiple
scales that drives degradation of ecosystems.
The benefits of using a common unit of measure of environmental condition is that it can be applied
at multiple scales, enabling changes in condition at the enterprise level to benchmarked against
changes in condition at the ecosystem scale. This should provide important insights for private
sector managers and investors, in the same way as indices for specific financial stocks (e.g. All Ords,
Small Ords and Finance) can be compared against overall market indices to assess the performance
of active fund managers. There are potentially diverse applications of this information. For example,
farmers may attract a premium rating for financing or asset values if they can demonstrate their
environmental assets are maintained in better condition than the regional average.
Another benefit of a common unit of measure of environmental condition is the ability to better
coordinate the development of environmental accounts at multiple scales. For example,
development of the Kilter Rural account was supported by the regional North Central Natural
Resource Management Body through provision of data and geographic information system capacity.
There is also the potential for the exchange of local scale data (e.g. pH, salinity measures, vegetation
classifications) to improve the quality of data in public accounts at regional and national scales. Such
exchanges are mutually important for enhancing the value of the accounts, and improving their
accuracy and affordability.
Acknowledgements
We are grateful for the involvement of Kilter Rural, Tasmanian Land Conservancy, Austral Fisheries
and would like to thank the following people for their contribution in developing the accounts for
the private sector trial: Mr David Heislers, Mr Cullen Gunn, Mr Richard Woods, Ms Michelle Slater,
Dr Sally Bryant, Dr Matthew Taylor, Mr Martin Exel and Mr Rhys Arangio. We thank those who have
provided scientific advice in the development of the accounts: Dr Richard Thackway, Dr Mike
Grundy, Dr Denis Saunders, Dr Tony Smith and Dr Terry Hillman. We also wish to acknowledge this
trial builds on the valuable work of Ms Carla Sbrocchi, Mr Max Kitchell, Professor Bruce Thom and
the contributors to the Accounting for Nature regional trial. This trial was generously supported by
The Ian Potter Foundation and the Purves Environmental Fund.
13
References
1. Commonwealth of Australia. Environmental Economic Accounting: A Common National Approach Strategy and Action Plan. prepared by the Interjurisdictional Environmental‐Economic Accounting Steering Committee for the Meeting of Environment Ministers. Canberra: Commonwealth of Australia; 2018.
2. United Nations, European Commission, Food and Agriculture Organization, et al. System of Environmental‐Economic Accounting Central Framework. White cover publication, pre‐edited text subject to official editing ed.: United Nations Statistics Division; 2012.
3. Sbrocchi, C, Davis, R, Grundy, M, et al. Technical Analysis of the Australian Regional Environmental Accounts Trial. Sydney: Published by the Wentworth Group of Concerned Scientists; 2015.
4. Wentworth Group of Concerned Scientists. Accounting for Nature: A scientific method for constructing environmental asset condition accounts. Sydney; 2016:33.
5. United Nations, European Commission, Organisation for Economic Co‐operation and Development, et al. System of Environmental‐Economic Accounting Experimental Ecosystem Accounting. White cover publication, pre‐edited text subject to official editing ed.; 2013.
6. Convention on Biological Diversity Conference of the Parties. Strategic Plan for Biodiversity 2011‐2020. Nagoya, Aichi Prefecture, Japan; 2010.
7. Wentworth Group of Concerned Scientists in association with NRM Regions Australia. Completion of the Australian Regional Environmental Accounts Trial. Paper for the 22nd meeting of the London Group on Environmental Accounting, Oslo, Norway, 28 ‐ 30 September 2016. Sydney, Australia; 2016.
8. Thackway, R, Sbrocchi, CD, Cosier, P, et al. Protocol for Constructing a Native Vegetation Condition Account: Draft. Environmental Accounting Technical Paper Series. Sydney: Wentworth Group of Concerned Scientists; 2015.
10. Tasmanian Land Conservancy. Five Rivers Reserve Management Plan 2014 – 2019. Tasmania, Australia: Tasmanian Land Conservancy; 2014.
11. Tasmanian Land Conservancy. Five Rivers Reserve Environmental Account Information Statement. Sandy Bay, Tasmania: Tasmanian Land Conservancy; 2018.
12. Tasmanian Land Conservancy. Five Rivers Environmental Account 2018. Sandy Bay, Tasmania: Tasmanian Land Conservancy; 2018.
13. Austral Fisheries. Environmental Account for the Heard Island and McDonald Islands Toothfish Fishery: Draft. Australia: Austral Fisheries; 2018.
14. Ziegler, P. An integrated stock assessment for the Heard Island and McDonald Islands Patagonian toothfish (Dissostichus eleginoides) fishery in Division 58.5.2. Report for the Commission for the Conservation of Antarctic Marine Living Resources. WG‐FSA‐17/19. Tasmania, Australia: Australian Antarctic Division; 2017.
15. FAO. How to feed the world in 2050. How to Feed the World in 2050: High‐Level Expert Forum. Rome, 12‐13 October 2009: Food and Agricultural Organization of the United Nations; 2009.
16. Sbrocchi, C. Guidelines for Constructing Regional Environmental (Asset Condition) Accounts: Quick Guide. Sydney: Wentworth Group of Concerned Scientists; 2013.