73
STRATEGIC FEASIBILITY STUDY MAY 6, 2015 PRIVILEGED AND CONFIDENTIAL DRAFT – June 30, 2015
STRATEG IC FEAS IB I L I TY STUDY
MAY 6 , 2015
PRIVILEGED AND CONFIDENTIAL DRAFT – June 30, 2015

PAGE 1
PRIVILEGED AND CONFIDENTIAL
FEASIBILITY TEAM INTRODUCTION

PAGE 2
MAYO CIVIC CENTER ARENASTRATEGIC FEASIBILITY STUDY
PRIVILEGED AND CONFIDENTIAL – PRESENTED JUNE 30, 2015
Hammes Company is a full‐service real estate development and investment firm.We have been directly involved in leading several of the largest and mostcomplex sports and entertainment destination projects in the industry over thepast decade.

PAGE 3
MAYO CIVIC CENTER ARENASTRATEGIC FEASIBILITY STUDY
PRIVILEGED AND CONFIDENTIAL – PRESENTED JUNE 30, 2015
Hammes Company is one of America’s leading real estate advisory, development and investment companies. Ourprimary business is working with leading institutions – both public and private – to devise and execute communityeconomic development and investment strategies.
Mayo Clinic
National Football League
Green Bay Packers
State of Wisconsin
University of Wisconsin –Madison
Milwaukee Bucks
Cleveland Browns
Minnesota Sports Facility Authority / Minnesota Vikings
City of Allentown, Pennsylvania
Detroit Lions
Ford Family
Tisch Family Interests / NY Giants
Robert Wood Johnson IV / NY Jets
University of Southern California

PAGE 4
MAYO CIVIC CENTER ARENASTRATEGIC FEASIBILITY STUDY
PRIVILEGED AND CONFIDENTIAL – PRESENTED JUNE 30, 2015
Sink Combs Dethlefs has a long standing reputation for excellence in eventfacility design. Over the Past 53 years, we have designed:
50+ Arenas & Event Centers 250+ Sports & Entertainment Projects Projects in 31 States & 5 Countries 45+ Nationally Award‐Winning Projects

PAGE 5
MAYO CIVIC CENTER ARENASTRATEGIC FEASIBILITY STUDY
PRIVILEGED AND CONFIDENTIAL – PRESENTED JUNE 30, 2015
Sink Combs Dethlefs understands the functional aspects of an entertainment venue: the moving parts, that make a building orcomplex successful. The vision; the atmosphere; the impression it leaves; is one of the defining aspects of a facility and the one ofthe hardest to achieve. It takes great consideration of space and place. The building must function to a degree that function goesunnoticed for the atmosphere of a campus venue to shine through.
Target Center
Crisler Center
PPL Center
Cross Insurance Arena
Cedar Park Events Center
MTS Centre
The Schottenstein Center
Inner Mongolia Event Center
Chesapeake Energy Arena
Erie Insurance Arena
1st Bank Event Center
Independence Event Center
Denny Sanford Premier Center
Robins Center
PAGE 6
MAYO CIVIC CENTER ARENASTRATEGIC FEASIBILITY STUDY
PRIVILEGED AND CONFIDENTIAL – PRESENTED JUNE 30, 2015
Since 1996, Johnson Consulting has been serving public‐ and private‐sectorclients in North America and worldwide. Our clients include state, county, andmunicipal governments, sports franchise owners and teams, convention andvisitors bureaus, asset and portfolio managers, financial institutions, private‐sector developers, and universities and colleges.

PAGE 7
PRIVILEGED AND CONFIDENTIAL
INTRODUCTION
PAGE 8
MAYO CIVIC CENTER ARENASTRATEGIC FEASIBILITY STUDY
PRIVILEGED AND CONFIDENTIAL – PRESENTED JUNE 30, 2015
Introduction / Statement of the Problem:Although the $79 million of Civic Center improvements currently under construction are significant, theCity of Rochester is still in need of a modern multi‐purpose community arena which would addsignificant support to the success of to the Civic Center complex as well as helping to establishRochester as a major regional destination for business, hospitality, entertainment and sports.
Benefits:• A new gathering place for the Rochester community
• Increased overall visitation for Rochester
• More activity downtown
• Hotel Room nights
• Restaurant and Bar revenue
• Service revenue
• Retail activity
• New tax revenue
• Jobs

PAGE 9
MAYO CIVIC CENTER ARENASTRATEGIC FEASIBILITY STUDY
PRIVILEGED AND CONFIDENTIAL – PRESENTED JUNE 30, 2015
Key Issues:
• Taylor Arena, the existing venue added to the Civic Center in 1986, can only accommodate amaximum of 3,400 patrons in permanent seats and up to approximately 5,000 patronswhen temporary chairs are added.
• The sightlines from the permanent seating positions are poor for most events as comparedto modern arenas and concert venues.
• Due to these limitations and its age, the Taylor Arena is nearing functional obsolescence andis not allowing Rochester to reach its full potential as a regional destination forentertainment and sports – as well as the significant collateral benefits that are associatedwith these events.
PAGE 10
MAYO CIVIC CENTER ARENASTRATEGIC FEASIBILITY STUDY
PRIVILEGED AND CONFIDENTIAL – PRESENTED JUNE 30, 2015
Overview of the Study:This study provides a vision for a new, state of the art, multi‐purpose arena at the Mayo CivicCenter
• Evaluation of the Rochester market and potential demand to support the arena and specificarena uses including USHL, concerts, family shows and other events.
• Target budget ranges for a range of arena options and preliminary recommendations forarena size, configuration, basic program and potential enhancements (e.g. connection tothe adjacent park)
• Preliminary projections for potential economic and fiscal impacts of the proposed arena anda discussion regarding potential ancillary development.

PAGE 11
PRIVILEGED AND CONFIDENTIAL
MARKET ASSESSMENT

PAGE 12
MAYO CIVIC CENTER ARENASTRATEGIC FEASIBILITY STUDY
PRIVILEGED AND CONFIDENTIAL – PRESENTED JUNE 30, 2015
Market Assessment Overview: We have engaged Johnson Consulting, based in Chicago, to provide additional market data related to USHL, concerts and other events due to their familiarity with the upper Midwest market.
• Assessment of Median Household Income and employment base in comparison to national averages and other competing markets. This is good indicator of greater levels of disposable income for entertainment spending.
• Evaluation of average USHL Attendance per game in other markets as an indicator for potential attendance ranges in Rochester.
• Preliminary assessment of demand for concerts and other events
• Preliminary assessment of potential demand ranges for premium seating including Suites, Club Seats and Loge Boxes.
• Identification of future study needs: User surveys and promoter surveys to better understand detailed demand by segment (Premium, GA other), pricing and event mix.
PAGE 13
MAYO CIVIC CENTER ARENASTRATEGIC FEASIBILITY STUDY
PRIVILEGED AND CONFIDENTIAL – PRESENTED JUNE 30, 2015
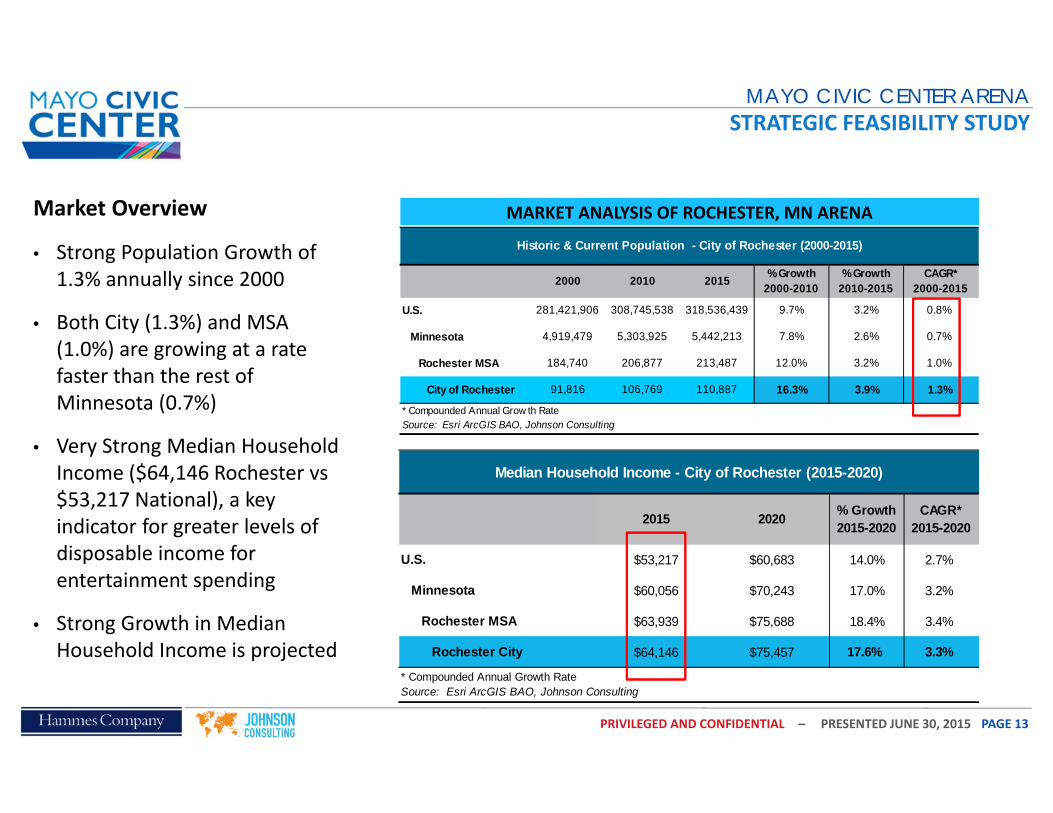
MARKET ANALYSIS OF ROCHESTER, MN ARENA
2000 2010 2015 % Growth 2000-2010
% Growth 2010-2015
CAGR*2000-2015
U.S. 281,421,906 308,745,538 318,536,439 9.7% 3.2% 0.8%
Minnesota 4,919,479 5,303,925 5,442,213 7.8% 2.6% 0.7%
Rochester MSA 184,740 206,877 213,487 12.0% 3.2% 1.0%
City of Rochester 91,816 106,769 110,887 16.3% 3.9% 1.3%
* Compounded Annual Grow th RateSource: Esri ArcGIS BAO, Johnson Consulting
Historic & Current Population - City of Rochester (2000-2015)
Market Overview
• Strong Population Growth of 1.3% annually since 2000
• Both City (1.3%) and MSA (1.0%) are growing at a rate faster than the rest of Minnesota (0.7%)
• Very Strong Median Household Income ($64,146 Rochester vs $53,217 National), a key indicator for greater levels of disposable income for entertainment spending
• Strong Growth in Median Household Income is projected
2015 2020 % Growth 2015-2020
CAGR* 2015-2020
U.S. $53,217 $60,683 14.0% 2.7%
Minnesota $60,056 $70,243 17.0% 3.2%
Rochester MSA $63,939 $75,688 18.4% 3.4%
Rochester City $64,146 $75,457 17.6% 3.3%
* Compounded Annual Growth RateSource: Esri ArcGIS BAO, Johnson Consulting
Median Household Income - City of Rochester (2015-2020)

PAGE 14
MAYO CIVIC CENTER ARENASTRATEGIC FEASIBILITY STUDY
PRIVILEGED AND CONFIDENTIAL – PRESENTED JUNE 30, 2015
2015 MEDIAN HOUSEHOLD INCOME BY ZIP CODE

PAGE 15
MAYO CIVIC CENTER ARENASTRATEGIC FEASIBILITY STUDY
PRIVILEGED AND CONFIDENTIAL – PRESENTED JUNE 30, 2015
MARKET ANALYSIS OF ROCHESTER, MN ARENA
Market Overview
• Relatively high median income levels for local and regionalpopulation base
• City of Rochester has very low unemployment rate of 3%which is about half of the national average of 6.2%
Rate Change Rate Change Rate Change Rate Change Rate Change
2010 5.9% - 7.4% - 5.9% - 6.3% - 9.6% -
2011 5.3% (0.6) 6.5% (0.9) 5.3% (0.6) 5.6% (0.7) 8.9% (0.7)
2012 4.4% (0.9) 5.6% (0.9) 4.4% (0.9) 4.6% (1.0) 8.1% (0.8)
2013 4.0% (0.4) 4.9% (0.7) 4% (0.4) 4.2% (0.4) 7.4% (0.7)
2014* 3.4% (0.6) 4.1% (0.8) 3% (0.6) 3.6% (0.6) 6.2% (1.2)
*December 2014 is most recent data availableSource: Bureau of Labor Statistics, Johnson Consulting
Unemployment Rate - Olmsted County (2004-2013)
Olmsted County Rochester MSA U.S.Rochester City Minnesota
Employer Industry Employees
Mayo Clininc Health Care 35,000
IBM Electronic 4,400*
Rochester Public Schools Education 2,460
Olmsted County Government 1,204
Olmsted Medical Center Health Care 1,200
McNeilus Truck & Manuf Mobile Concrete mixers, garbage trucks
1,050
Charter Communications Communications 873
City of Rochester Local Government 840
Kahler Hospitality Group Hotel/Restaurant Services 680
Crenio Fabricated Metal 652
RCTC Post Secondary Education 500
Federal Medical Center Corrections/Medical 450
Reichel Foods Refrigerated Lunch & Snacks
450
Samaritan Bethany, Inc. Health Care 440
Seneca Food Food Processing 400
Benchmark Electronics Design/Engineering 396
Hiawatha Homes Res.Services 380
Kemps Food Processing 341
McNeilus Steel, Inc Steel Fabrication 321
Cardinal of Minnesota, Ltd Res/Services 300
Pace Dairy Food Processing 280
Halcon Manufacturing 255
Think Bank Banking 250
Rochester Meat Company Meat Processor 250
Bard Medical Manufacturing 250
*Noted on IBM website
Source: Rochester Area Economic Development, Johnson Consulting
Largest Employers - Rochester MSA

PAGE 16
MAYO CIVIC CENTER ARENASTRATEGIC FEASIBILITY STUDY
PRIVILEGED AND CONFIDENTIAL – PRESENTED JUNE 30, 2015
REGIONAL FACILITIES
Venue Year Opened # of Seats Distance from Rochester LocationLa Crosse Center 1980 5,000-7,500 70 LaCrosse, WI
Xcel Energy Center 2000 18,568 80 St. Paul, MN
Verizon Wireless Center 1995 5,280 80 Mankato, MNTarget Center 1990 19,356 85 Minneapolis, MNYoung Arena 1994 3,000 119 Waterloo, IA
UNI-Dome 1976 16,324 120 Cedar Falls, IASources: Johson Consulting, Facility Websites, Mapquest
Competive Regional Venues within 120 Miles/ 2 Hr Drive Time
Market Overview ‐ Conclusions
• Opportunity for Rochester to have the best and mostflexible medium‐size arena within 120 mile radius
• Would be highly competitive geographically for sports,concerts, festivals family shows and other events

PAGE 17
PRIVILEGED AND CONFIDENTIAL
ARENA DEVELOPMENT TRENDS &USHL OVERVIEW

PAGE 18
MAYO CIVIC CENTER ARENASTRATEGIC FEASIBILITY STUDY
PRIVILEGED AND CONFIDENTIAL – PRESENTED JUNE 30, 2015
USHL DEMOGRAPHIC COMPARISONUSHL Profile
• Rochester is consistent with or above average in key demographic variables as compared to other USHL markets
Demographic Variable RochesterRank out
of 17 Average High LowPopulation 110,887 7 120,675 422,895 18,623Total Households 45,067 7 48,412 168,838 6,378Median Household Income $64,146 2 $48,766 $79,896 $24,982Entertainment Spending $34,878,289 5 $28,529,468 $94,190,028 $3,799,214Corporate Inventory 4,924 7 5,742 20,630 1,646
Demographic Variable RochesterRank out
of 17 Average High LowPopulation 206,327 13 725,250 6,685,461 63,107Total Households 81,627 13 279,773 2,503,248 25,188Median Household Income $65,921 1 $54,746 - $41,640Entertainment Spending $61,343,335 9 $200,415,719 $2,023,280,689 $12,668,127Corporate Inventory 8,769 12 5,742 1,646 20,630
Demographic Variable RochesterRank out
of 17 Average High LowPopulation 213,487 11 9,557,057 906,017 54,667Total Households 91,785 11 344,171 292,158 28,132,666Median Household Income $63,939 1 $53,308 - $40,764Entertainment Spending $61,254,719 9 $245,064,075 $2,727,239,308 $10,967,131Corporate Inventory 9,404 11 37,184 385,105 2,902
USHL Markets (City)
USHL Markets (25 mi Radius)
USHL Markets (MSA)

PAGE 19
MAYO CIVIC CENTER ARENASTRATEGIC FEASIBILITY STUDY
PRIVILEGED AND CONFIDENTIAL – PRESENTED JUNE 30, 2015
USHL MARKET ANALYSISUSHL Historical Average Attendance per Game
• 3 ‐ Year Average USHL Attendance per Game = 2,801 2,914
• Percent of Average Attendance per game to population = 3.63% 3.03%
• Applying USHL average percentage to Rochester’s population =
110,887 x 3.03% 3,361 *
* Potential per game attendance
Team* Market 2012-13 2013-2014 2014-15Youngstown Phantoms Youngstown, OH 63,562 1,371 1,402 1,410 1,394 2.19%Chicago Steel Bensenville, IL 18,623 1,402 1,420 1,410 1,411 7.57%Bloomington Thunder Bloomington, IL 79,119 N/A N/A 2,028 2,028 2.56%Muskegon Lumberjacks Muskegon, MI 37,699 2,342 2,208 2,089 2,213 5.87%Des Moines Buccaneers Urbandale, IA 43,067 2,578 2,394 2,414 2,462 5.72%Dubuque Fighting Saint Dubuque, IA 59,085 2,562 2,606 2,527 2,565 4.34%Waterloo Black Hawks Waterloo, IA 69,552 2,667 2,693 2,425 2,595 3.73%Tri-City Storm Kearney, NE 32,208 2,426 2,683 2,704 2,604 8.09%
Cedar Rapids Rough Riders Cedar Rapids, IA 129,383 2,663 2,655 2,735 2,684 2.07%
Sioux City Musketeers Sioux City, IA 83,018 2,523 2,886 2,774 2,728 3.29%121,287 2,798 2,795 2,850 2,801 3.63%
Madison Capitols Madison, WI 240,627 N/A N/A 3,244 3,244 1.35%
Green Bay Gamblers Green Bay, WI 104,952 3,315 3,450 3,416 3,394 3.23%
Omaha Lancers Omaha, NE 422,895 3,587 3,324 3,301 3,404 0.80%Lincoln Stars Lincoln, NE 270,141 3,949 3,642 3,197 3,596 1.33%
Fargo Force Fargo, ND 118,456 3,902 3,515 3,543 3,653 3.08%Sioux Falls Stampede Sioux Falls, SD 168,198 3,884 4,256 6,376 4,839 2.88%
110,887 - - -* Excludes USA Development Team**2014-2015 Expansion Teams
Source: ESRI, Pointstreak, Johnson Consulting
USHL Market Population and Average Team Attendance (2012-2015)
City Population
Attendance% of Historical Avg Attend to
Population
3YR Historical
Avg per GM
Rochester, MN
Average
110,887 x 3.63% 4,028 *

PAGE 20
MAYO CIVIC CENTER ARENASTRATEGIC FEASIBILITY STUDY
PRIVILEGED AND CONFIDENTIAL – PRESENTED JUNE 30, 2015
USHL MARKET ANALYSIS
Applying league Avg Attend to League Avg Pop Ratio = 206,327x 1.21%
2,502 per gameattendance
Expected range of per GM attend = 2,500 – 3,500
• Avg Ratio of Attendance per game to 25 MI Radius population = 1.21%
Team Hockey Arena Location Year Opened Population 25 Mile
Population Capacity*3YR Avg. per
GM Attendance
% of Avg per GM
Attendance to Capacity
City Ratio of Avg
Attend to Population
25 Mile Ratio of Avg
Attend to Population
Sioux Falls Stampede Denny Sanford Premier Center
Sioux Falls, SD 2014 168,198 244,041 10,600 4,839 46% 2.88% 1.98%Omaha Lancers Ralston Arena Omaha, NE 2012 422,895 858,595 4,000 3,404 85% 0.80% 0.40%Dubuque Fighting Saints Mystique Ice Center Dubuque, IA 2010 59,085 157,900 3,079 2,565 83% 4.34% 1.62%Des Moines Buccaneers Buccaneer Arena Urbandale, IA 2008 43,067 606,369 3,408 2,462 72% 5.72% 0.41%Fargo Force Scheels Arena Fargo, ND 2008 118,456 221,888 5,000 3,653 73% 3.08% 1.65%Bloomington Thunder U. S. Cellular Coliseum Bloomington, IL 2006 79,119 222,325 7,000 2,028 29% 2.56% 0.91%Youngstown Phantoms Covelli Centre Youngstown, OH 2005 63,562 661,432 5,717 1,394 24% 2.19% 0.21%Sioux City Musketeers Tyson Event Center Sioux City, IA 2003 83,018 158,428 9,500 2,728 29% 3.29% 1.72%Green Bay Gamblers Resch Center Green Bay, WI 2002 104,952 466,102 8,709 3,394 39% 3.23% 0.73%Cedar Rapids RoughRiders Cedar Rapids Ice Arena Cedar Rapids, IA 2000 129,383 385,045 4,000 2,684 67% 2.07% 0.70%Tri-City Storm Viaero Events Center Kearney, NE 2000 32,208 63,107 5,000 2,604 52% 8.08% 4.13%Chicago Steel Edge Ice Arena Bensenville, IL 1997 18,623 6,685,461 3,000 1,411 47% 7.58% 0.02%Lincoln Stars The Ice Box Lincoln, NE 1995 270,141 339,749 5,010 3,596 72% 1.33% 1.06%Waterloo Black Hawks Young Arena Waterloo, IA 1994 69,552 195,212 3,000 2,595 87% 3.73% 1.33%Madison Capitols Alliant Energy Center Madison, WI 1967 240,627 577,164 7,890 3,244 41% 1.35% 0.56%Muskegon Lumberjacks L. C. Walker Arena Muskegon, MI 1960 37,699 280,104 5,100 2,213 43% 5.87% 0.79%
1999 121,287 362,497 5,626 2,801 56% 3.63% 1.21%
110,887 206,327 4,028 2,502
* Hockey CapacitySource: USHL, Individual Venue Sites, Johnson Consulting
United States Hockey League
Average
Rochester
Comparison of USHL Arenas & Markets

PAGE 21
MAYO CIVIC CENTER ARENASTRATEGIC FEASIBILITY STUDY
PRIVILEGED AND CONFIDENTIAL – PRESENTED JUNE 30, 2015
Facility Name MSA Population Median Income
Entertainment Spending Tenant(s) Capacity
# of Luxury Suites
# of Club Seats
Annual Naming Rights
Term Total Naming Rights
Estimated Cost
(millions)
Year Opened
Denny Sanford PREMIER Center Sioux Falls, SD 248,891 $55,002 $60,526,781 USHL, IFL 12,000* 38 500** - - - $150 2014PPL Center Allentown-Bethlehem-Easton, PA-NJ 835,683 $58,477 $224,607,036 AHL 8,500 36 986 - 10 - $272 2014Cross Insurance Center Bangor, ME 156,378 $40,861 $28,657,652 None 8,078 12 - $200,000 15 $3,000,000 $65 2013Cedar Park Center Austin-Round Rock, TX 1,917,917 $62,597 $546,603,306 AHL, NBADL 6,660 22 541 - - - - 2009ShoWare Center Seattle-Tacoma-Bellevue, WA 3,629,702 $68,802 $1,182,479,316 WHL, WFTDA 7,500 20 500 $317,500 10 $3,175,000 $68 2009Huntington Center Toledo, OH 607,965 $44,818 $130,504,672 ECHL 8,000 20 - $300,000 7 $2,100,000 $105 2009Town Toyota Center Wenatchee, WA 114,715 $51,850 $23,460,682 NAHL, IFL 5,000 26 397 $200,000 5 $1,000,000 $45 2008U.S. Cellular Arena Bloomington, IL 192,567 $59,983 $50,080,652 MISL,USHL 7,000 24 700 $345,000 6 $2,070,000 $37 20061st Bank Center Denver-Aurora-Lakewood, CO 2,703,067 $64,675 $847,956,846 None 6,000 25 900 - 5 - $45 2006Santa Ana Star Center Albuquerque, NM 907,398 $48,813 $205,378,292 NAHL, IFL 6,500 26 500 $500,000 5 $2,500,000 $43 2006Tim's Toyota Center Prescott, AZ 220,671 $43,284 $42,889,379 CHL, AIF 5,100 20 500 $175,000 10 $1,750,000 $24 2006Stockton Events Center Stockton-Lodi, CA 711,503 $53,784 $141,724,907 ECHL, AIF 10,000 24 500 - - - $45 2005Covelli Centre Youngstown-Warren-Boardman, OH-PA 552,952 $41,103 $100,443,018 USHL, WFTDA 5,700 24 500 $120,000 3 $360,000 $41 2005
American Bank Center Corpus Christi, TX 445,656 $48,010 $86,828,124 Texas A&M-CC, NAHL, LSFL 6,000 11 302 - 10 Not Discolsed $50 2004
Budweiser Events Center Fort Collins-Loveland, CO 320,463 $60,647 $91,878,995 ECHL, IFL 5,211 24 777 $75,000 20 $15,000,000 $25 2003Comcast Arena At Everett Events Center Seattle-Tacoma-Bellevue, WA 3,629,702 $68,802 $1,182,479,316 WHL, NLL, RDCL 8,250 20 750 $740,000 10 $7,400,000 $63 2003State Farm Arena McAllen-Edinburg- Mission, TX 838,600 $34,176 $93,826,543 CHL, LSFL 5,500 25 500 $200,000 5 $1,000,000 $20 2003
Orleans Arena Las Vegas-Henderson-Paradise, NV 2,083,955 $52,541 $454,919,669 ECHL, WCC, WAC, LFL, PASL-Pro
7,000 22 220 - - - $150 2003
Ford Arena Beaumont-Port Authur, TX 413,556 $46,025 $76,547,042 ABA 8,200 15 750 $250,000 5 $1,250,000 $70 2003Tyson Events Center Sioux City, IA-NE-SD 171,347 $50,336 $32,728,056 USHL, APFL 10,000 27 0 $200,000 20 $4,000,000 $28.10 2003
1,035,134 $52,729 $280,226,014 7,063 23 548 278,654 9 3,431,154 71 2,007*10,600 Hockey Capacity (Only Profiled Facility w/10,000+ capacity)Estimated based on Stadium MapSource: RSV, Respective Venues, Johnson Consulting
New Arenas Since 2003 with Less Than 10,000-seat Capacity
Average 2007
NEW ARENA DEVELOPMENT TRENDS

PAGE 22
MAYO CIVIC CENTER ARENASTRATEGIC FEASIBILITY STUDY
PRIVILEGED AND CONFIDENTIAL – PRESENTED JUNE 30, 2015
CLUB LEVEL & SUITES OVERVIEW
Team Hockey Arena Location Year Opened Population Capacity* # of Suites
Sioux Falls Stampede Denny Sanford Premier Center Sioux Falls, SD 2014 168,198 10,600 22
Omaha Lancers Ralston Arena Omaha, NE 2012 422,895 4,000 12
Dubuque Fighting Saints Mystique Ice Center Dubuque, IA 2010 59,085 3,079 11
Des Moines Buccaneers Buccaneer Arena Urbandale, IA 2008 43,067 3,408 2
Fargo Force Scheels Arena Fargo, ND 2008 118,456 5,000 38
Bloomington Thunder U. S. Cellular Coliseum Bloomington, IL 2006 79,119 7,000 2
Youngstown Phantoms Covelli Centre Youngstown, OH 2005 63,562 5,717 26
Sioux City Musketeers Tyson Event Center Sioux City, IA 2003 83,018 9,500 30
Green Bay Gamblers Resch Center Green Bay, WI 2002 104,952 8,709 25
Cedar Rapids RoughRiders Cedar Rapids Ice Arena Cedar Rapids, IA 2000 129,383 4,000 7
Tri-City Storm Viaero Events Center Kearney, NE 2000 32,208 5,000 20
Chicago Steel Edge Ice Arena Bensenville, IL 1997 18,623 3,000 9
Lincoln Stars The Ice Box Lincoln, NE 1995 270,141 5,010 2
Waterloo Black Hawks Young Arena Waterloo, IA 1994 69,552 3,000 0
Madison Capitols Alliant Energy Center Madison, WI 1967 240,627 7,890 8
Muskegon Lumberjacks L. C. Walker Arena Muskegon, MI 1960 37,699 5,100 12
1999 121,287 5,626
110,887
Average
Rochester
Comparison of USHL Arenas & MarketsUnited States Hockey League
14
United States Hockey LeagueComparison of USHL Arenas & Markets

PAGE 23
MAYO CIVIC CENTER ARENASTRATEGIC FEASIBILITY STUDY
PRIVILEGED AND CONFIDENTIAL – PRESENTED JUNE 30, 2015
PREMIUM INVENTORY ASSESSMENTBased on comparable arenas in similar markets, including USHL arenas, the Market Assessment indicates the following Premium Inventory for the Arena could be supportable:*
Club Seats: 500 to 700 SeatsUpgraded seats with sideline location, convenient access to adjacent club lounge with enhanced food service. Generally includes premium parking.
Suites: 12 to 20 Suites (including 1‐2 Party Suites for daily rental, which may contain additional seats)Private, enclosed suites including premium finishes and furniture with 12 to14 seating positions including drink rail seating. Generally includes premium parking.
Loge: 8 to 14 Loge BoxesSemi‐Private open boxes with 4 to 6 seating positions including upgraded movable chairs, standing room and drink rails or tables. Seats have a sideline location, convenient access to the club lounge and enhanced food service. Generally includes premium parking.
Note: Additional study and research is required to finalize the premium inventory and establish demand or pricing, including individual user surveys, corporate surveys and focus groups.

PAGE 24
MAYO CIVIC CENTER ARENASTRATEGIC FEASIBILITY STUDY
PRIVILEGED AND CONFIDENTIAL – PRESENTED JUNE 30, 2015
Summary and Conclusions:
• Strong Median Household Income ($64,146 Rochester vs $53,217 National), and growth is a key indicator for greater levels of disposable income for entertainment spending.
• Solid employer base anchored by Mayo Clinic is a key indicator of premium seating demand.
• 3 ‐ Year Average USHL Attendance per Game is approximately 2,800. Johnson Consulting’s analysis indicates average USHL attendance in Rochester may be in the range at 2,500 to 3,500 per game when certain adjustments are made to account for larger markets.
• Suite count in comparable markets and recent arenas is generally 12 ‐ 24 Suites. Mayo may favor Non‐Suite premium seating such as Loge Boxes and Club Seats
• Loge Boxes are a strong trend Nationally and appear to be supportable in Rochester. Potential Inventory could be projected at 8 to 14 Loge Boxes with 4 to 6 seats each.
• Club Seat range in comparable markets and recent arenas is generally 500 to 900. Higher end of the range appears to be supportable in Rochester.

PAGE 25
MAYO CIVIC CENTER ARENASTRATEGIC FEASIBILITY STUDY
PRIVILEGED AND CONFIDENTIAL – PRESENTED JUNE 30, 2015
SIOUX FALLS VS ROCHESTERUSHL PROFILE
• Similar Demographic Profiles
• Similar Portfolio of Facilities
• Similar Regional Competition
Demographic Variable Rochester Rank out of 17 Sioux Falls Rank out of 17 Average High Low
Population 110,887 7 168,198 4 120,675 422,895 18,623Total Households 45,067 7 31,831 10 48,412 168,838 6,378Median Household Income $64,146 2 $52,125 6 $48,766 $79,896 $24,982Entertainment Spending $34,878,289 5 $41,834,558 4 $28,529,468 $94,190,028 $3,799,214Corporate Inventory 4,924 7 8,038 4 5,742 20,630 1,646
Demographic Variable Rochester Rank out of 17 Sioux Falls Rank out of 17 Average High Low
Population 206,327 13 244,041 10 725,250 6,685,461 63,107Total Households 81,627 13 95,977 10 279,773 2,503,248 25,188Median Household Income $65,921 1 $55,443 8 $54,746 $65,921 $41,640Entertainment Spending $61,343,335 9 $60,102,719 10 $200,415,719 $2,023,280,689 $12,668,127Corporate Inventory 8,769 12 11,318 9 5,742 1,646 20,630
Demographic Variable Rochester Rank out of 17 Sioux Falls Rank out of 17 Average High Low
Population 213,487 11 248,891 9 906,017 9,557,057 54,667Total Households 91,785 11 98,124 10 344,171 3,530,229 21,722Median Household Income $63,939 1 $55,002 8 $53,308 $63,939 $40,764Entertainment Spending $61,254,719 9 $60,526,781 10 $245,064,075 $2,727,239,308 $10,967,131Corporate Inventory 9,404 11 11,599 9 37,184 385,105 2,902
Source: ESRI, Johnson Consulting
USHL Markets (City)
USHL Markets (25 mi Radius)
USHL Markets (MSA)

PAGE 26
MAYO CIVIC CENTER ARENASTRATEGIC FEASIBILITY STUDY
PRIVILEGED AND CONFIDENTIAL – PRESENTED JUNE 30, 2015
DENNY STANFORD PREMIER CENTERCase Study – Denny Stanford PREMIER Center
• State‐of‐the‐art arena opened in 2014
• Largest indoor venue in South Dakota
• Market similar to Rochester and lacks professionalsports arenas / concert venues
• Has observed tremendous success in its first six monthsof operations, hosting 94 events and counting
• Home facility for the Sioux Falls Stampede and Storm
• Hosts the Summit League’s NCAA Men’s and Women’sDivision I Basketball Tournament
• Held concerts for large acts such as Elton John, KennyChesney and Rod Stewart
Year Opened 2014
Seating Capacity 12,000Suites 38Main Tenants USHL, IFLIndoor Sq. Ft. 139,000**3YR Avg. USHL Attendance 4,839Events per Year 94****Total Sponsorships 25Estimated Cost $117 millionOwnership City of Sioux Falls
Source: facility websites, Johnson Consulting
Denny Sanford Premier Center
First six months of operations****
PAGE 27
MAYO CIVIC CENTER ARENASTRATEGIC FEASIBILITY STUDY
PRIVILEGED AND CONFIDENTIAL – PRESENTED JUNE 30, 2015
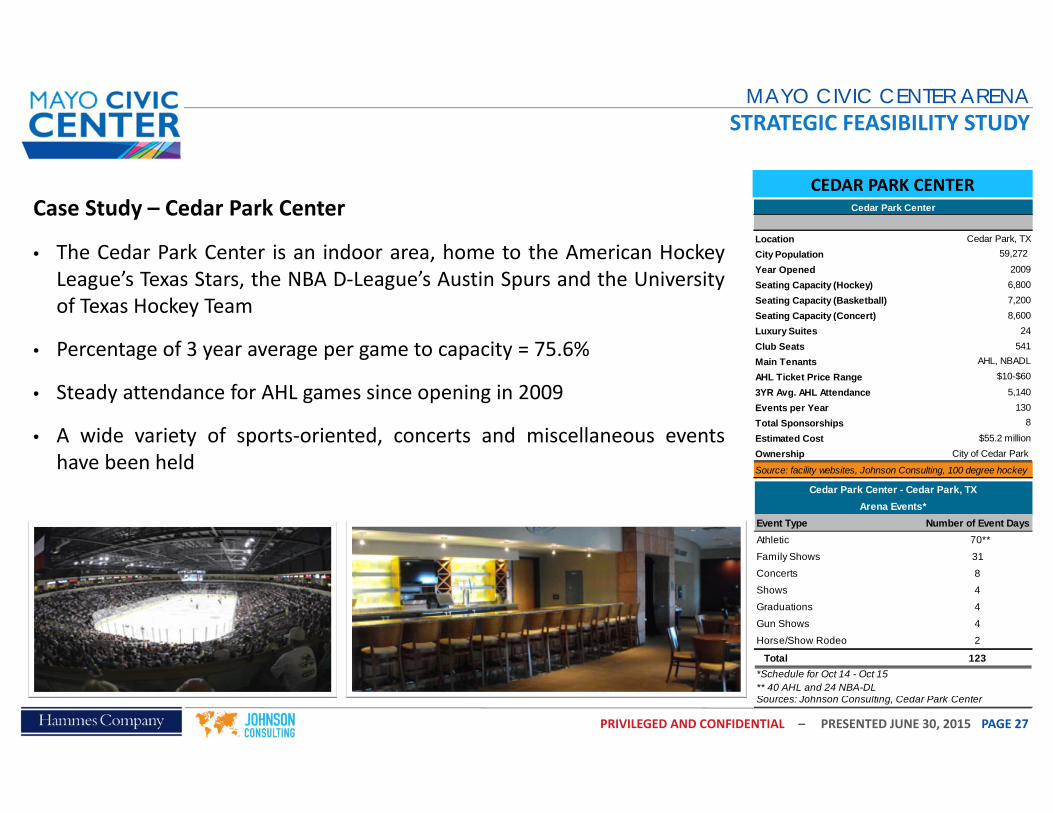
CEDAR PARK CENTERCase Study – Cedar Park Center
• The Cedar Park Center is an indoor area, home to the American HockeyLeague’s Texas Stars, the NBA D‐League’s Austin Spurs and the Universityof Texas Hockey Team
• Percentage of 3 year average per game to capacity = 75.6%
• Steady attendance for AHL games since opening in 2009
• A wide variety of sports‐oriented, concerts and miscellaneous eventshave been held
Location Cedar Park, TXCity Population 59,272
Year Opened 2009Seating Capacity (Hockey) 6,800Seating Capacity (Basketball) 7,200Seating Capacity (Concert) 8,600Luxury Suites 24Club Seats 541Main Tenants AHL, NBADL
AHL Ticket Price Range $10-$60
3YR Avg. AHL Attendance 5,140Events per Year 130Total Sponsorships 8
Estimated Cost $55.2 millionOwnership City of Cedar Park
Source: facility websites, Johnson Consulting, 100 degree hockey
Cedar Park Center
Event Type Number of Event DaysAthletic 70**
Family Shows 31
Concerts 8
Shows 4
Graduations 4
Gun Shows 4
Horse/Show Rodeo 2
Total 123*Schedule for Oct 14 - Oct 15** 40 AHL and 24 NBA-DLSources: Johnson Consulting, Cedar Park Center
Cedar Park Center - Cedar Park, TXArena Events*
PAGE 28
PRIVILEGED AND CONFIDENTIAL
ARENA CONCERT MARKETOVERVIEW
PROGRESS UPDATE

PAGE 29
MAYO CIVIC CENTER ARENASTRATEGIC FEASIBILITY STUDY
PRIVILEGED AND CONFIDENTIAL – PRESENTED JUNE 30, 2015
INDUSTRY TRENDS – CONCERTSIndustry Trends ‐Concerts
• Only a small number of acts in the industry that can sellout larger venues
• Solid market of potential concerts to draw from with a midsize arena (6,000 to 10,000)
• Based on informal discussions, National Promoters like the Rochester Market
PAGE 30
MAYO CIVIC CENTER ARENASTRATEGIC FEASIBILITY STUDY
PRIVILEGED AND CONFIDENTIAL – PRESENTED JUNE 30, 2015
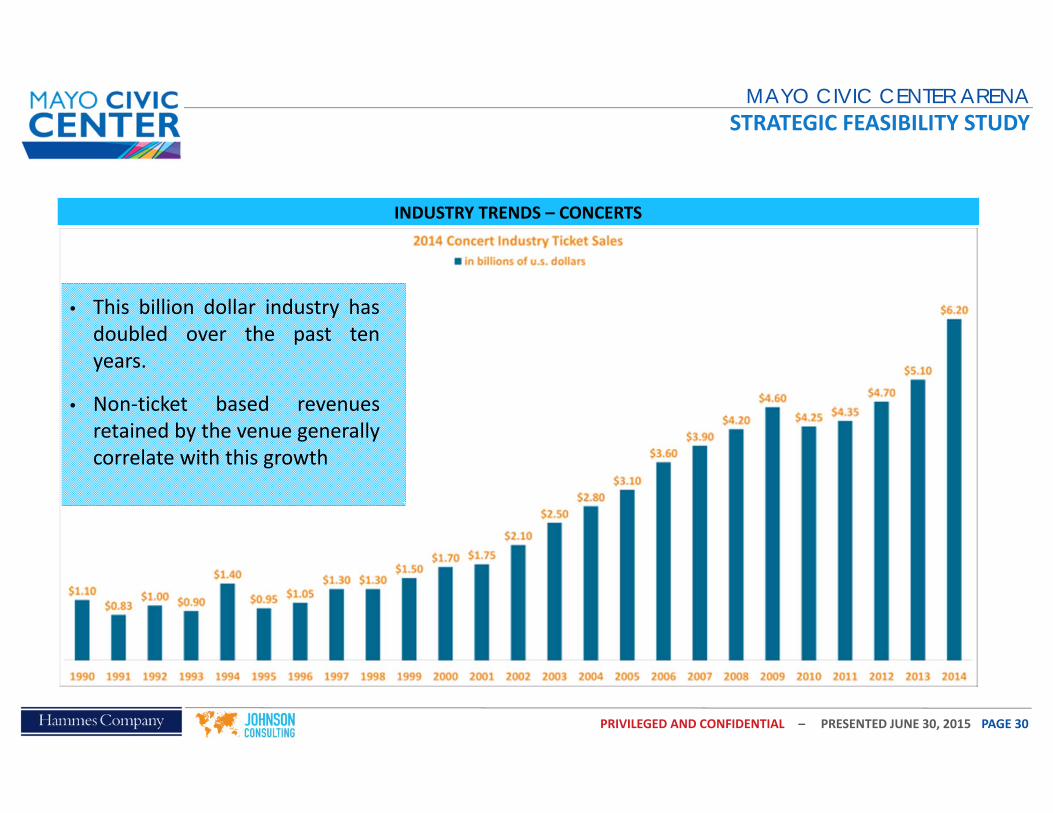
• This billion dollar industry hasdoubled over the past tenyears.
• Non‐ticket based revenuesretained by the venue generallycorrelate with this growth
INDUSTRY TRENDS – CONCERTS

PAGE 31
MAYO CIVIC CENTER ARENASTRATEGIC FEASIBILITY STUDY
PRIVILEGED AND CONFIDENTIAL – PRESENTED JUNE 30, 2015
INDUSTRY TRENDS – FAMILY EVENTSIndustry Trends
• Discussions with promoters from Feld Entertainment were very optimistic for the Rochester marketplace as it relates to their desire to host shows at a new venue
• Such family shows as the WWE are already preforming in the Rochester marketplace, which is a strong indicator given their historically higher than average ticket price per event

PAGE 32
MAYO CIVIC CENTER ARENASTRATEGIC FEASIBILITY STUDY
PRIVILEGED AND CONFIDENTIAL – PRESENTED JUNE 30, 2015
PROJECTED DEMAND
# of Events Avg.
AttendanceTotal
Attendance # of Events Avg.
AttendanceTotal
Attendance # of Events Avg.
AttendanceTotal
AttendanceSports Tenant 32 2,500 80,000 32 3,000 96,000 32 3,500 112,000
Family Shows 16 3,300 51,975 19 3,500 66,150 21 4,000 84,000
Concerts 8 6,000 49,500 10 7,200 71,280 11 8,000 88,000
Non Tenant -Sport Events 17 3,000 51,750 21 3,600 74,520 23 4,000 92,000
Flat-Floor Events 5 2,625 13,781 6 3,150 19,845 7 3,500 24,500
Graduations/Civic 3 3,000 9,000 3 3,600 9,720 3 4,000 12,000
Banquets/Meetings/Parties 8 188 1,547 10 225 2,228 11 250 2,750
Other 5 3,375 17,719 6 4,050 25,515 7 4,500 31,500
Total 95 - 275,272 107 - 365,258 115 - 446,750
Sources: Johnson Consulting
Worst Case Base Case Best Case
Projected Demand for Proposed Arena Rochester, MN
Assumes a USHL team as a Sports Tenant
Johnson Consulting expects that the following projections are reasonable based on comparablefacilities and their knowledge of the market for concerts and other arena events

PAGE 33
PRIVILEGED AND CONFIDENTIAL
ARENA PROGRAM OVERVIEW

PAGE 34
MAYO CIVIC CENTER ARENASTRATEGIC FEASIBILITY STUDY
PRIVILEGED AND CONFIDENTIAL – PRESENTED JUNE 30, 2015
Description
Seat Count
TotalTelescopic Fixed Premium Seating
Total
Option 1A Diagonal, Main Level Concourse, 2 Level
950 1,700 800 4,000 141,242 SF
Option 1B Diagonal, Main Level Concourse, 2 Level
1,500 2,700 800 5,000 150,000 SF
Option 2A Diagonal, Elevated Concourse, 3 Level
1,975 3,434 1,100 6,500 194,546 SF
Option 2B Diagonal, Main Level Concourse, 2 Level
1,660 3,640 700 6,000 156,180 SF
Option 2C Diagonal, Main Level Concourse, 2 Level, Practice Court
1,660 3,640 700 6,000 177,705 SF
Option 3 East‐West, Elevated Concourse, 3 Level
2,230 2,570 1,000 5,800 191,549 SF
ARENA PROGRAMMING OPTIONS

PAGE 35
PRIVILEGED AND CONFIDENTIAL
OPTION 1A: 4,000 SEATS
PAGE 36
MAYO CIVIC CENTER ARENASTRATEGIC FEASIBILITY STUDY
PRIVILEGED AND CONFIDENTIAL – PRESENTED JUNE 30, 2015
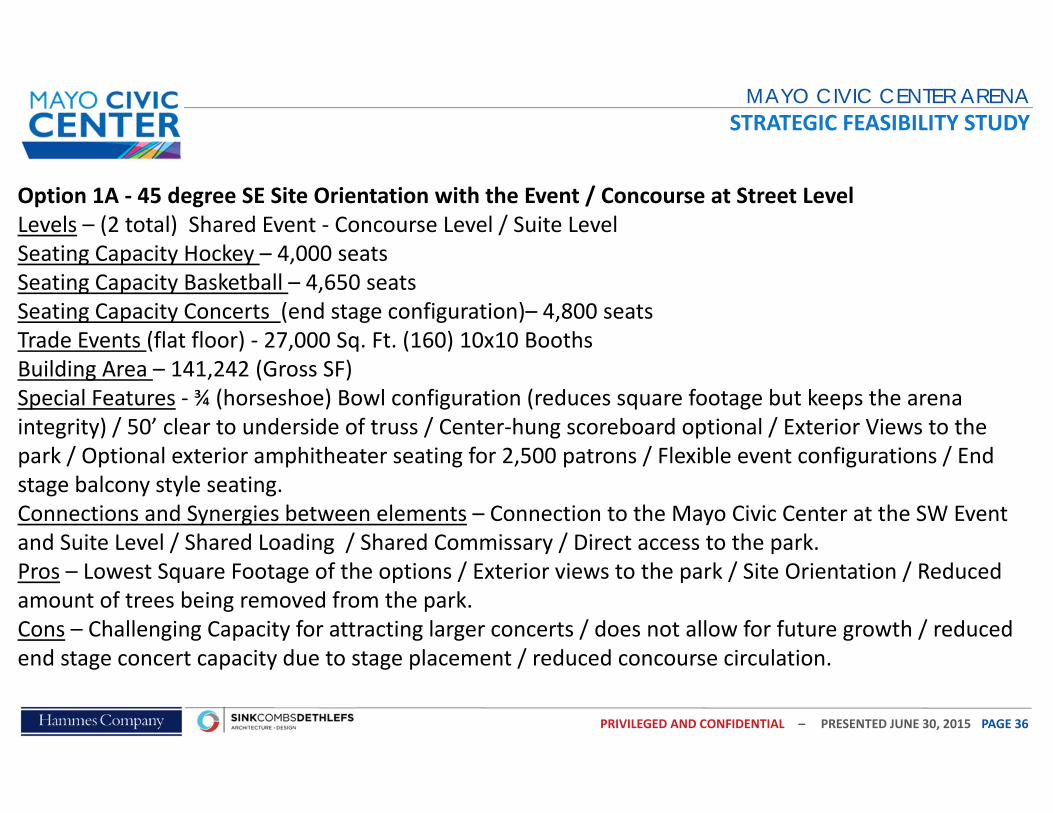
Option 1A ‐ 45 degree SE Site Orientation with the Event / Concourse at Street LevelLevels – (2 total) Shared Event ‐ Concourse Level / Suite Level Seating Capacity Hockey – 4,000 seats Seating Capacity Basketball – 4,650 seatsSeating Capacity Concerts (end stage configuration)– 4,800 seats Trade Events (flat floor) ‐ 27,000 Sq. Ft. (160) 10x10 BoothsBuilding Area – 141,242 (Gross SF)Special Features ‐ ¾ (horseshoe) Bowl configuration (reduces square footage but keeps the arena integrity) / 50’ clear to underside of truss / Center‐hung scoreboard optional / Exterior Views to the park / Optional exterior amphitheater seating for 2,500 patrons / Flexible event configurations / End stage balcony style seating. Connections and Synergies between elements – Connection to the Mayo Civic Center at the SW Event and Suite Level / Shared Loading / Shared Commissary / Direct access to the park. Pros – Lowest Square Footage of the options / Exterior views to the park / Site Orientation / Reduced amount of trees being removed from the park. Cons – Challenging Capacity for attracting larger concerts / does not allow for future growth / reduced end stage concert capacity due to stage placement / reduced concourse circulation.

PAGE 37
MAYO CIVIC CENTER ARENASTRATEGIC FEASIBILITY STUDY
PRIVILEGED AND CONFIDENTIAL – PRESENTED JUNE 30, 2015
TOWN TOYOTA CENTER (WENTACHEE)

PAGE 38
MAYO CIVIC CENTER ARENASTRATEGIC FEASIBILITY STUDY
PRIVILEGED AND CONFIDENTIAL – PRESENTED JUNE 30, 2015
CONCOURSE – DODGE CITY

PAGE 39
MAYO CIVIC CENTER ARENASTRATEGIC FEASIBILITY STUDY
PRIVILEGED AND CONFIDENTIAL – PRESENTED JUNE 30, 2015
Option 1A:‐ 4,000 Seats‐Main Level Concourse‐ 2 Seating Levels
‐ Overall Site Plan

PAGE 40
MAYO CIVIC CENTER ARENASTRATEGIC FEASIBILITY STUDY
PRIVILEGED AND CONFIDENTIAL – PRESENTED JUNE 30, 2015
Option 1A: 4,000 Seats‐ Event / Concourse Level

PAGE 41
MAYO CIVIC CENTER ARENASTRATEGIC FEASIBILITY STUDY
PRIVILEGED AND CONFIDENTIAL – PRESENTED JUNE 30, 2015
Option 1: 4,000 Seats‐ Suite Level

PAGE 42
PRIVILEGED AND CONFIDENTIAL
OPTION 1B: 5,000 SEATS

PAGE 43
MAYO CIVIC CENTER ARENASTRATEGIC FEASIBILITY STUDY
PRIVILEGED AND CONFIDENTIAL – PRESENTED JUNE 30, 2015
Option 1B – 45 degree SE Site Orientation with the Event / Concourse at Street LevelLevels – (2 total) Shared Event ‐ Concourse Level / SuiteSeating Capacity Hockey – 5,000 seats Seating Capacity Basketball – 6,000 seatsSeating Capacity Concerts (end stage configuration)– 6,200 seats Trade Events (flat floor) – 32,000 Sq. Ft. (185) 10x10 BoothsBuilding Area – 150,000 (Gross SF)Special Features ‐ 360 degree Bowl configuration / 50’ clear to underside of truss / Center‐hung scoreboard optional / Exterior Views to the park / Ideal site orientation / Optional exterior amphitheater seating for 2,500 patrons / Flexible event configurations / Loading DockConnections and Synergies between elements – Connection to the Mayo Civic Center at the SW Event and Suite Level / Shared Loading / Shared Commissary / Direct access to the park. Pros – Site Orientation / Reduced Square Footage / Allows Future Growth / Cost per seat reduction due to reduced amount of Telescopic seating locations. Cons – Borderline Capacity for attracting larger concerts / does not allow for future growth / reduced concourse circulation.

PAGE 44
MAYO CIVIC CENTER ARENASTRATEGIC FEASIBILITY STUDY
PRIVILEGED AND CONFIDENTIAL – PRESENTED JUNE 30, 2015
TIM’S TOYOTA CENTER (PRESCOTT VALLEY)

PAGE 45
PRIVILEGED AND CONFIDENTIAL
OPTION 2B: 6,200 SEATSBASE SCHEME
PAGE 46
MAYO CIVIC CENTER ARENASTRATEGIC FEASIBILITY STUDY
PRIVILEGED AND CONFIDENTIAL – PRESENTED JUNE 30, 2015
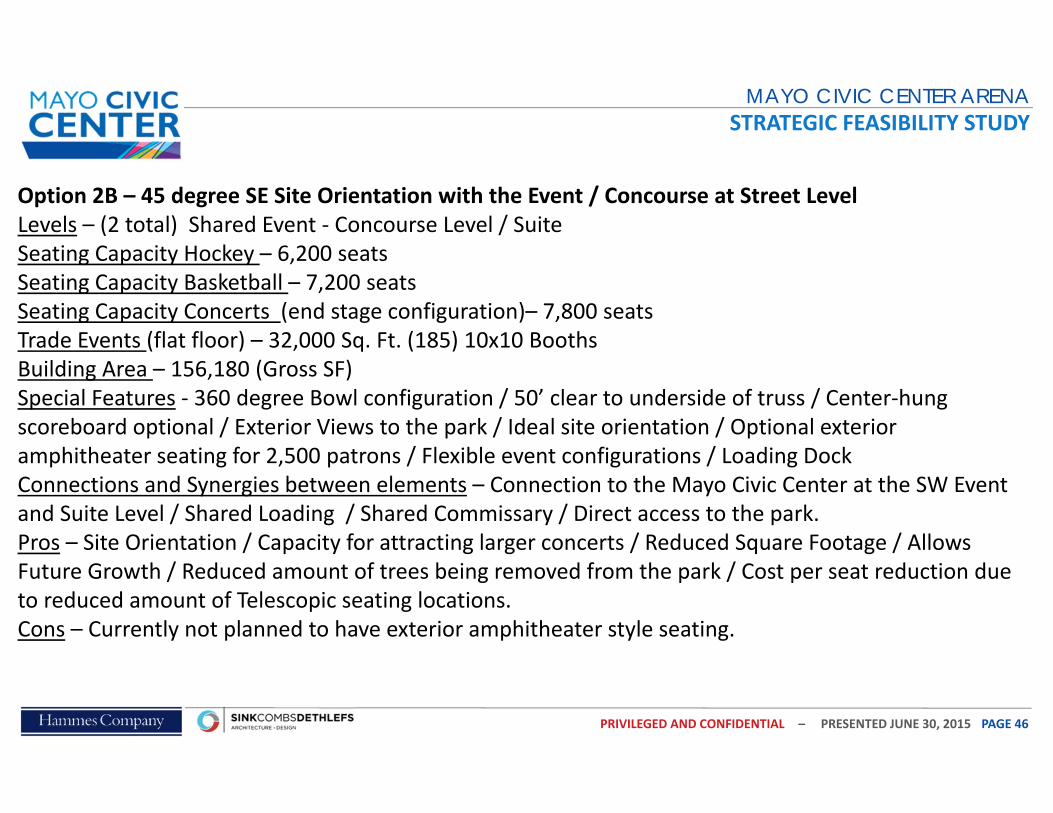
Option 2B – 45 degree SE Site Orientation with the Event / Concourse at Street LevelLevels – (2 total) Shared Event ‐ Concourse Level / SuiteSeating Capacity Hockey – 6,200 seats Seating Capacity Basketball – 7,200 seatsSeating Capacity Concerts (end stage configuration)– 7,800 seats Trade Events (flat floor) – 32,000 Sq. Ft. (185) 10x10 BoothsBuilding Area – 156,180 (Gross SF)Special Features ‐ 360 degree Bowl configuration / 50’ clear to underside of truss / Center‐hung scoreboard optional / Exterior Views to the park / Ideal site orientation / Optional exterior amphitheater seating for 2,500 patrons / Flexible event configurations / Loading DockConnections and Synergies between elements – Connection to the Mayo Civic Center at the SW Event and Suite Level / Shared Loading / Shared Commissary / Direct access to the park. Pros – Site Orientation / Capacity for attracting larger concerts / Reduced Square Footage / Allows Future Growth / Reduced amount of trees being removed from the park / Cost per seat reduction due to reduced amount of Telescopic seating locations. Cons – Currently not planned to have exterior amphitheater style seating.
PAGE 47
MAYO CIVIC CENTER ARENASTRATEGIC FEASIBILITY STUDY
PRIVILEGED AND CONFIDENTIAL – PRESENTED JUNE 30, 2015
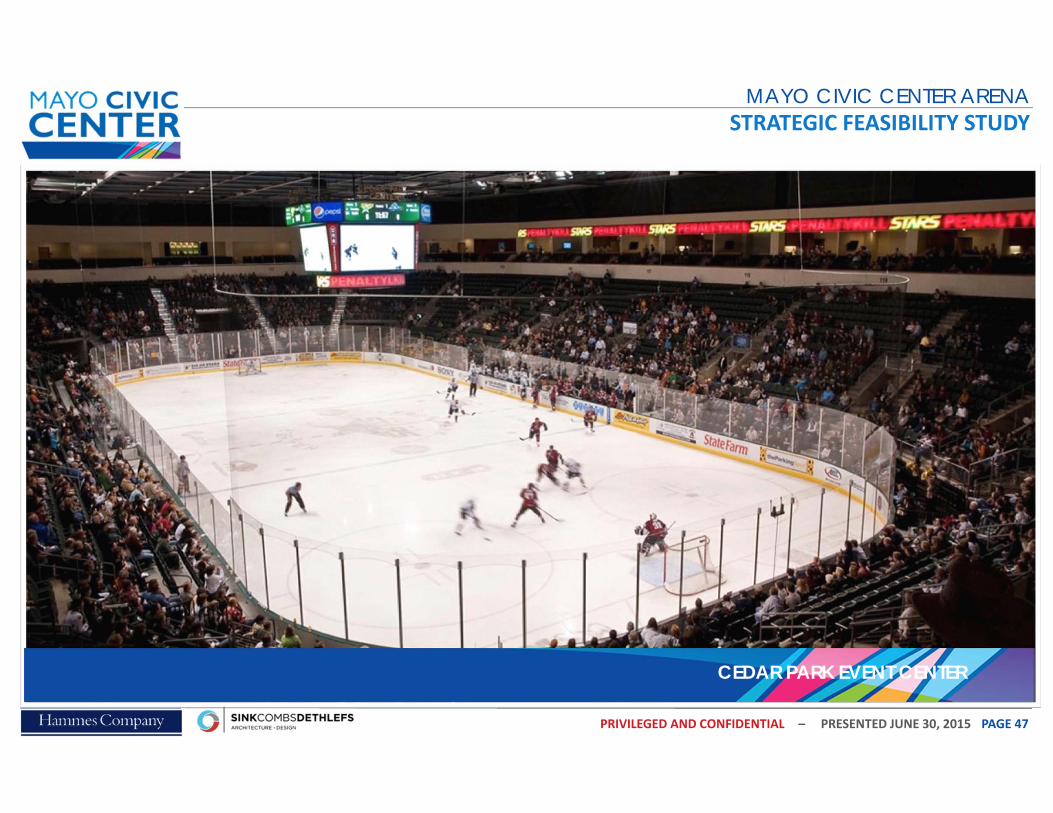
CEDAR PARK EVENT CENTER
PAGE 48
MAYO CIVIC CENTER ARENASTRATEGIC FEASIBILITY STUDY
PRIVILEGED AND CONFIDENTIAL – PRESENTED JUNE 30, 2015
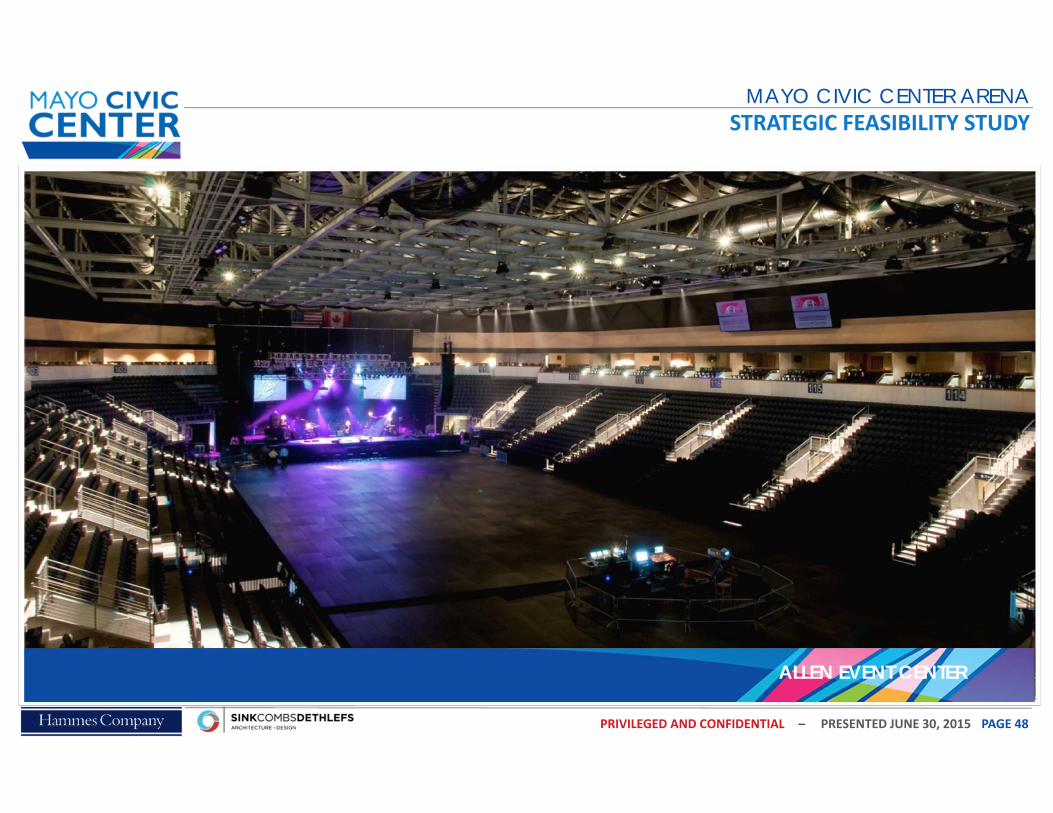
ALLEN EVENT CENTER
PAGE 49
MAYO CIVIC CENTER ARENASTRATEGIC FEASIBILITY STUDY
PRIVILEGED AND CONFIDENTIAL – PRESENTED JUNE 30, 2015
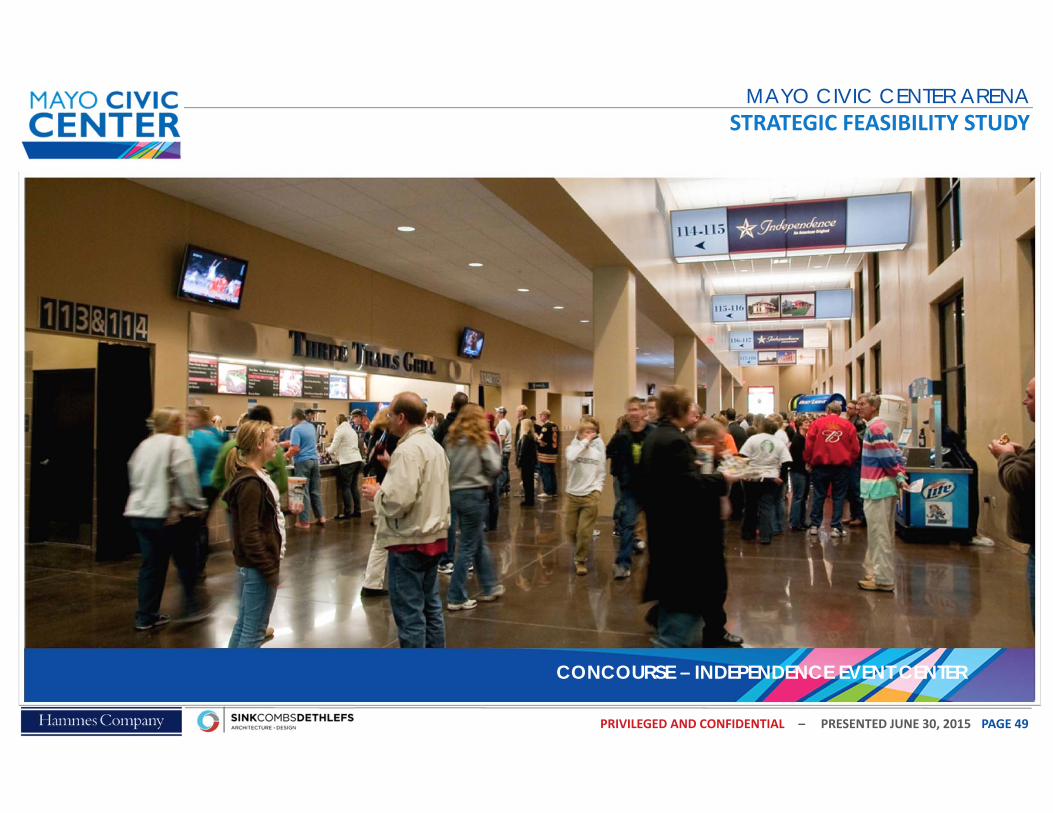
CONCOURSE – INDEPENDENCE EVENT CENTER

PAGE 50
MAYO CIVIC CENTER ARENASTRATEGIC FEASIBILITY STUDY
PRIVILEGED AND CONFIDENTIAL – PRESENTED JUNE 30, 2015
DENNY SANFORD PREMIER CENTER (SIOUX FALLS)

PAGE 51
MAYO CIVIC CENTER ARENASTRATEGIC FEASIBILITY STUDY
PRIVILEGED AND CONFIDENTIAL – PRESENTED JUNE 30, 2015
Option 2B: Base Scheme‐ 6,200 Seats‐Main Level Concourse‐ 2 Seating Levels
‐ Overall Site Plan

PAGE 52
MAYO CIVIC CENTER ARENASTRATEGIC FEASIBILITY STUDY
PRIVILEGED AND CONFIDENTIAL – PRESENTED JUNE 30, 2015
Option 2B: Base Scheme‐ Event / Concourse Level

PAGE 53
MAYO CIVIC CENTER ARENASTRATEGIC FEASIBILITY STUDY
PRIVILEGED AND CONFIDENTIAL – PRESENTED JUNE 30, 2015
Option 2B: Base Scheme‐ Suite Level
PAGE 54
MAYO CIVIC CENTER ARENASTRATEGIC FEASIBILITY STUDY
PRIVILEGED AND CONFIDENTIAL – PRESENTED JUNE 30, 2015
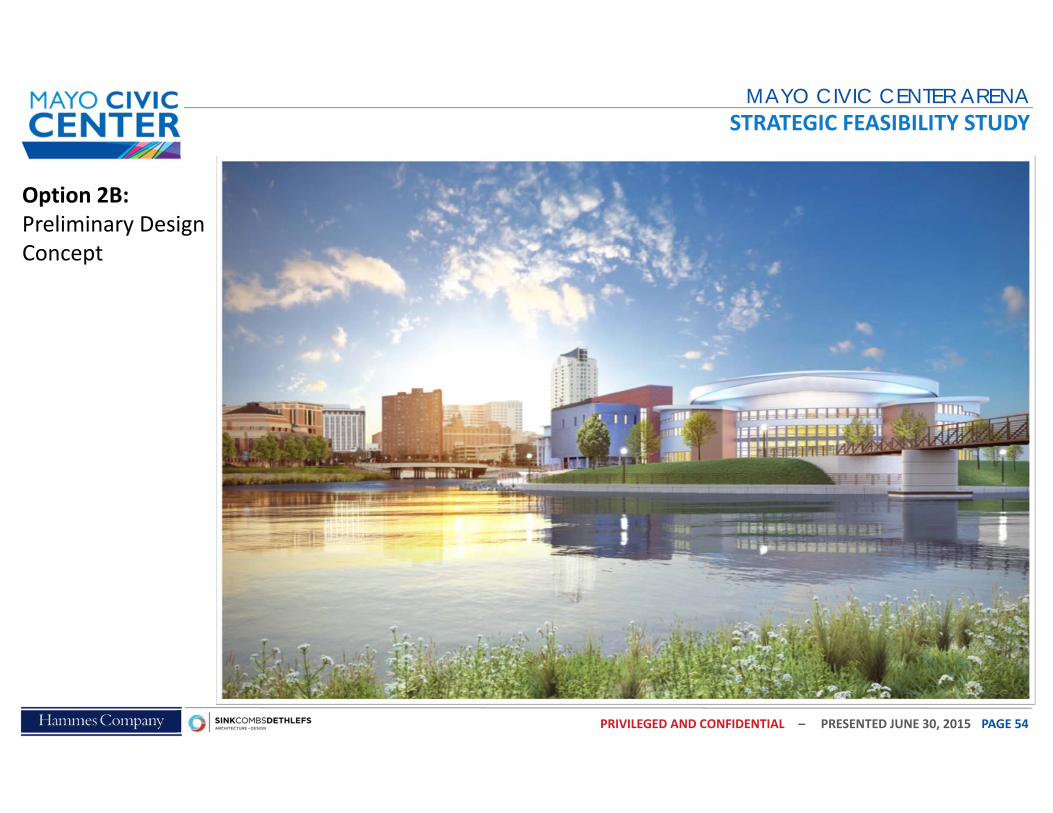
Option 2B:Preliminary Design Concept

PAGE 55
PRIVILEGED AND CONFIDENTIAL
OPTION 2B: 6,200 SEATS PLUS AMPHITHEATER

PAGE 56
MAYO CIVIC CENTER ARENASTRATEGIC FEASIBILITY STUDY
PRIVILEGED AND CONFIDENTIAL – PRESENTED JUNE 30, 2015
Option 2B: Amphitheater‐ 6,200 Seats‐Main Level Concourse‐ 2 Seating Levels
‐ Overall Site Plan

PAGE 57
MAYO CIVIC CENTER ARENASTRATEGIC FEASIBILITY STUDY
PRIVILEGED AND CONFIDENTIAL – PRESENTED JUNE 30, 2015
Option 2B: Amphitheater‐ Event / Concourse Level

PAGE 58
MAYO CIVIC CENTER ARENASTRATEGIC FEASIBILITY STUDY
PRIVILEGED AND CONFIDENTIAL – PRESENTED JUNE 30, 2015
Option 2B: Amphitheater‐ Suite Level

PAGE 59
PRIVILEGED AND CONFIDENTIAL
COST & BUDGET
PAGE 60
MAYO CIVIC CENTER ARENASTRATEGIC FEASIBILITY STUDY
PRIVILEGED AND CONFIDENTIAL – PRESENTED JUNE 30, 2015
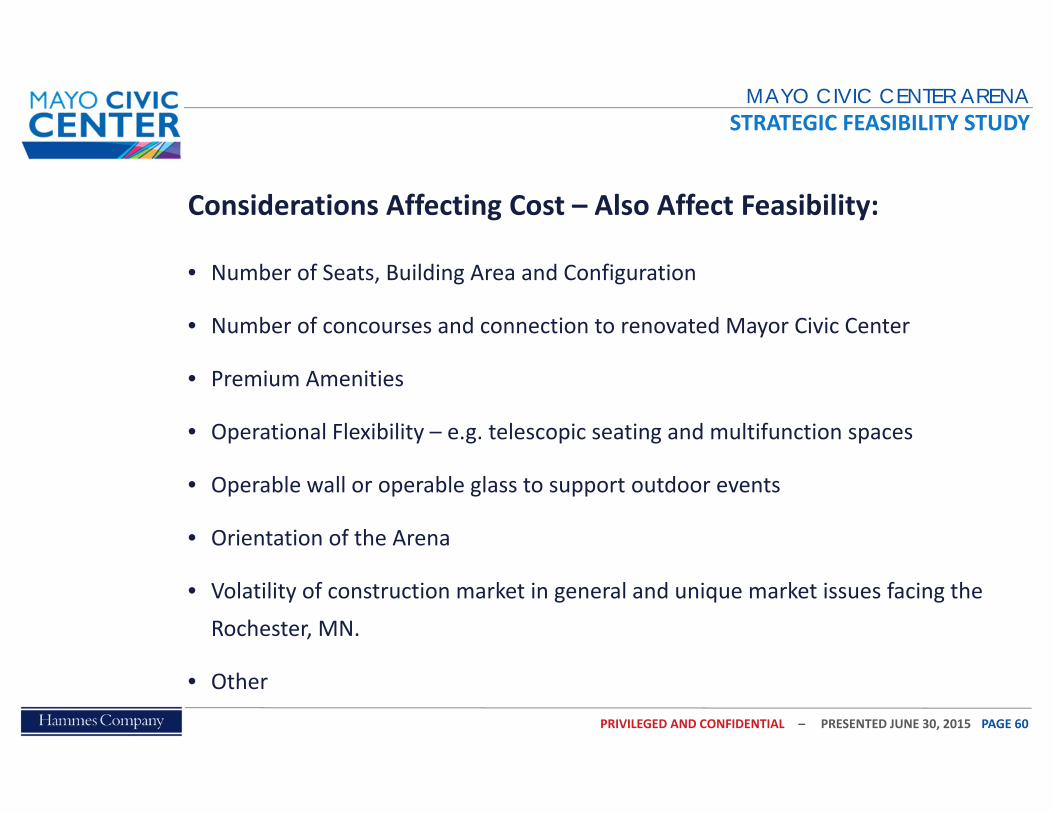
Considerations Affecting Cost – Also Affect Feasibility:
• Number of Seats, Building Area and Configuration
• Number of concourses and connection to renovated Mayor Civic Center
• Premium Amenities
• Operational Flexibility – e.g. telescopic seating and multifunction spaces
• Operable wall or operable glass to support outdoor events
• Orientation of the Arena
• Volatility of construction market in general and unique market issues facing the Rochester, MN.
• Other

PAGE 61
MAYO CIVIC CENTER ARENASTRATEGIC FEASIBILITY STUDY
PRIVILEGED AND CONFIDENTIAL – PRESENTED JUNE 30, 2015
Conceptual Cost Summary*:
• 4,000 Seat Multi‐Purpose Arena: $55 – $60 Million
• 5,000 Seat Multi‐Purpose Arena: $60 – $65 Million
• 6,000 ‐ 6,200 Seat Multi‐Purpose Arena: $65 – $75 Million
• Ancillary Development TBD
* Assumes Approximately $325 / SF for Construction Costs and Approximately $425 to $440 / SF for Total Project Costs in the Rochester, MN, Market assuming a 2017 completion. These assumptions are preliminary and subject to change due the absence of complete design information and the volatility of the current construction market.
PAGE 62
MAYO CIVIC CENTER ARENASTRATEGIC FEASIBILITY STUDY
PRIVILEGED AND CONFIDENTIAL – PRESENTED JUNE 30, 2015
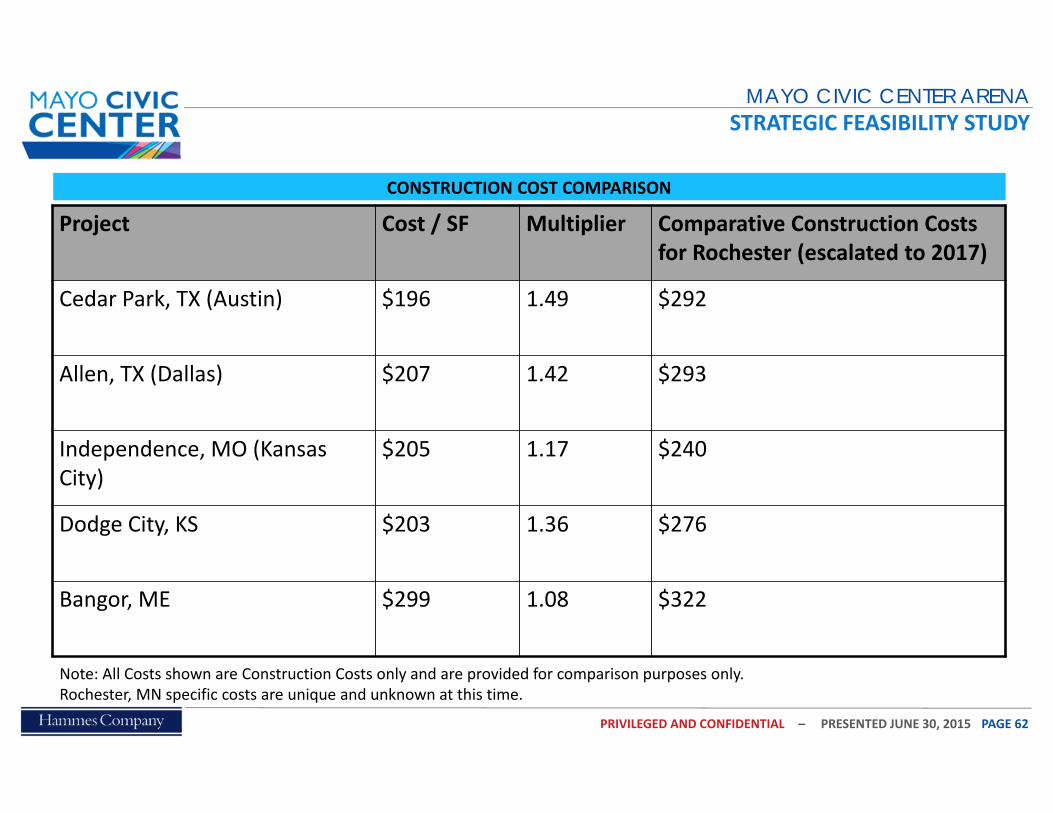
Project Cost / SF Multiplier Comparative Construction Costs for Rochester (escalated to 2017)
Cedar Park, TX (Austin) $196 1.49 $292
Allen, TX (Dallas) $207 1.42 $293
Independence, MO (Kansas City)
$205 1.17 $240
Dodge City, KS $203 1.36 $276
Bangor, ME $299 1.08 $322
CONSTRUCTION COST COMPARISON
Note: All Costs shown are Construction Costs only and are provided for comparison purposes only. Rochester, MN specific costs are unique and unknown at this time.

PAGE 63
MAYO CIVIC CENTER ARENASTRATEGIC FEASIBILITY STUDY
PRIVILEGED AND CONFIDENTIAL – PRESENTED JUNE 30, 2015
Master Project Budget ComparisonThe Master Project Budget format addresses all categories of cost toprovide a complete project budget including:
o Site Costs (Similar among all options)
o Construction Costs (Vary by SF of Building Area and Complexity)
o Furniture, Fixtures and Equipment Costs (FF&E – Similar for all)
o Development Costs (Similar for All)
o Project Contingency (Vary slightly)

PAGE 64
MAYO CIVIC CENTER ARENASTRATEGIC FEASIBILITY STUDY
PRIVILEGED AND CONFIDENTIAL – PRESENTED JUNE 30, 2015
MASTER PROJECT BUDGETSITE IMPROVEMENTS & DEMOLITION
Site Acquisition
Site Utilities & Improvements
Site Preparation and Demolition
Environmental

PAGE 65
MAYO CIVIC CENTER ARENASTRATEGIC FEASIBILITY STUDY
PRIVILEGED AND CONFIDENTIAL – PRESENTED JUNE 30, 2015
MASTER PROJECT BUDGET
General RequirementsSite Work Site Improvements / LandscapingConcrete Foundations / Superstructure Concrete / Structural Precast / Architectural PrecastMasonryMetals Structural Steel & Metal Deck / Metal FabricationWood & Plastics Rough Carpentry / Architectural WoodworkThermal & Moisture Protection Waterproofing / Roofing & S.M. / Metal PanelsDoors & Windows Doors, Frames, & Hardware / Overhead Doors / Glass, Glazing, & CurtainwallFinishesSpecialties Toilet Partitions & Accessories / MiscellaneousSeating SystemsSpecial Construction MiscellaneousConveying Systems Elevators & EscalatorsMechanical Plumbing / Fire Protection / HVACElectricalPerformance & Payment BondOther Construction CostsInsuranceContractor Staffing & Fee Staff Costs / Contractor FeeConstruction Contingency
CONSTRUCTION COSTS

PAGE 66
MAYO CIVIC CENTER ARENASTRATEGIC FEASIBILITY STUDY
PRIVILEGED AND CONFIDENTIAL – PRESENTED JUNE 30, 2015
MASTER PROJECT BUDGET
ArtworkAthletic Equipment Basketball Floor / Baskets / Other Dasher Boards / Other / Zamboni Audio‐Visual including Scoreboards, TVs and Sound System Computer EquipmentCommunication Equipment Radios Press FacilitiesFood Service Food Service / Equipment / Portables / Smallwares Furniture including Premium SpacesGraphics & SignageLaundry EquipmentLoading Dock EquipmentMaintenance EquipmentWindow Washing EquipmentMedia EquipmentParking EquipmentSeating Systems Loose Chairs Security EquipmentStage & Rigging EquipmentVehiclesWaste Handling EquipmentMiscellaneous Window TreatmentsOther FF&EMiscellaneous
FURNISHINGS, FIXTURES & EQUIPMENT

PAGE 67
MAYO CIVIC CENTER ARENASTRATEGIC FEASIBILITY STUDY
PRIVILEGED AND CONFIDENTIAL – PRESENTED JUNE 30, 2015
MASTER PROJECT BUDGET
Architecture & Engineering Design Services / Reimbursables / Other Consultants
Geotechnical & Soil Analysis Geotechnical Services / Other Consultants
Testing & Inspections
Marketing & Collateral Public Relations / Advertising
Development Services Development Services / Reimbursables
Legal Services
Taxes, Insurance & Bonding Builder's Risk Insurance / General Liability Insurance / Professional Liability Insurance
Permits & Regulatory Costs Building and Environmental Permits
Operations & Pre‐Opening Costs Ground Breaking Opening Ceremony Pre‐Opening
Miscellaneous Professional Services
Other Development CostsMiscellaneous
DEVELOPMENT COSTS
Project Contingency
PROJECT CONTINGENCY
PAGE 68
MAYO CIVIC CENTER ARENASTRATEGIC FEASIBILITY STUDY
PRIVILEGED AND CONFIDENTIAL – PRESENTED JUNE 30, 2015
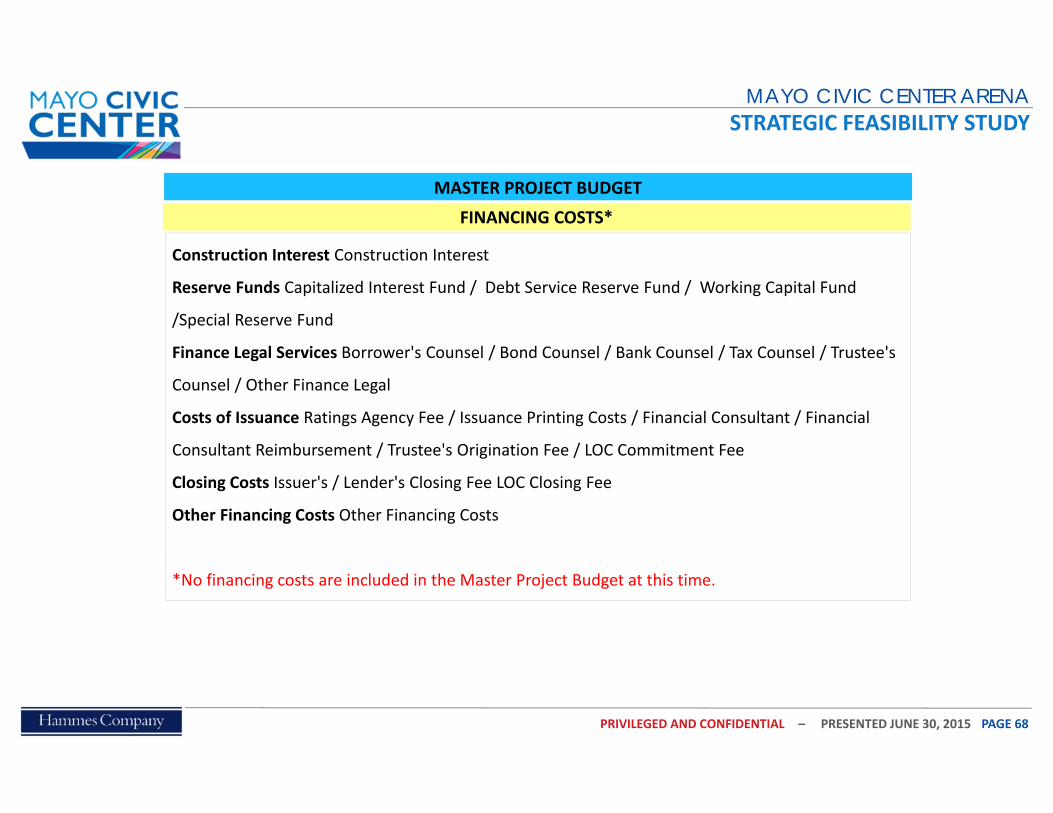
MASTER PROJECT BUDGET
Construction Interest Construction Interest
Reserve Funds Capitalized Interest Fund / Debt Service Reserve Fund / Working Capital Fund
/Special Reserve Fund
Finance Legal Services Borrower's Counsel / Bond Counsel / Bank Counsel / Tax Counsel / Trustee's
Counsel / Other Finance Legal
Costs of Issuance Ratings Agency Fee / Issuance Printing Costs / Financial Consultant / Financial
Consultant Reimbursement / Trustee's Origination Fee / LOC Commitment Fee
Closing Costs Issuer's / Lender's Closing Fee LOC Closing Fee
Other Financing Costs Other Financing Costs
*No financing costs are included in the Master Project Budget at this time.
FINANCING COSTS*

PAGE 69
MAYO CIVIC CENTER ARENASTRATEGIC FEASIBILITY STUDY
PRIVILEGED AND CONFIDENTIAL – PRESENTED JUNE 30, 2015
Option 1 A - 4,000 Seats 141,300 SF
Description Master Project Budget
SITE IMPROVEMENTS & DEMOLITION
Subtotal $2,500,000
CONSTRUCTION COSTS
Subtotal $40,485,275FURNISHINGS, FIXTURES & EQUIPMENT
Subtotal $4,353,230DEVELOPMENT COSTSSubtotal $8,487,300
FINANCING COSTS
Subtotal $0
PROJECT CONTINGENCY
Subtotal $3,500,000PROJECT TOTAL $59,325,805
Schedule of Values
Option 1 B - 5,000 Seats 160,000 SF
Description Master Project Budget
SITE IMPROVEMENTS & DEMOLITION
Subtotal $2,500,000
CONSTRUCTION COSTS
Subtotal $42,750,000
FURNISHINGS, FIXTURES & EQUIPMENT
Subtotal $4,865,000
DEVELOPMENT COSTSSubtotal $9,135,000
FINANCING COSTS
Subtotal $0
PROJECT CONTINGENCY
Subtotal $4,000,000PROJECT TOTAL $63,250,000
Schedule of Values
Option 2 B - 6,200 Seats 156,200 SF
Description Master Project Budget
SITE IMPROVEMENTS & DEMOLITION
Subtotal $2,500,000
CONSTRUCTION COSTS
Subtotal $48,250,000FURNISHINGS, FIXTURES & EQUIPMENT
Subtotal $4,865,000DEVELOPMENT COSTSSubtotal $9,935,000
FINANCING COSTSSubtotal $0
PROJECT CONTINGENCY
Subtotal $4,000,000PROJECT TOTAL $69,550,000
Schedule of Values
OPTION 1A: 4,000 SEATS OPTION 1B: 5,000 SEATS OPTION 2B: 6,200 SEATS

PAGE 70
PRIVILEGED AND CONFIDENTIAL
NEXT STEPS

PAGE 71
MAYO CIVIC CENTER ARENASTRATEGIC FEASIBILITY STUDY
PRIVILEGED AND CONFIDENTIAL – PRESENTED JUNE 30, 2015
Next Steps
• Arena Budget Work Session July 7th or 14th
• Reduce Arena Options to One Preferred Option July 14th
• Issue Strategic Feasibility Report July 31st*
• Additional Market Research and Surveys TBD*
• Premium Seating Pricing Analysis TBD*
• Naming Rights / Sponsorship Analysis TBD*
• Detailed Financial Analysis / Economic Impact TBD*
*based on feedback from working group

STRATEG IC FEAS IB I L I TY STUDY
MAY 6 , 2015
PRIVILEGED AND CONFIDENTIAL


