Page 1
Corrosion Resistance of Bottom Ash and Fly Ash-Based Reinforced Geopolymer Concretes Using Half Cell Potential and Linear Polarization Resistance Methods
Priyanka Morla
Bachelor of Engineering, Jawaharlal Nehru Technology University, 2013
A Report Submitted in Partial Fulfillment of the Requirements for the Degree of
MASTER OF ENGINEERING
In the Department of Mechanical Engineering
Priyanka Morla, 2018
University of Victoria
All rights reserved. This report may not be reproduced in whole or in part, by photocopy or other means, without the permission of the author.
Page 2
ii
Supervisory Committee
The Corrosion Resistance of Bottom Ash and Fly Ash-Based Reinforced Geopolymer Concretes Using Half Cell and Linear Polarization Resistance methods
by
Priyanka Morla
Bachelor of Engineering, Jawaharlal Nehru Technological University, 2013
Supervisory Committee
Dr. Rishi Gupta, Supervisor
Department of Civil Engineering
Dr. Caterina Valeo, Supervisor
Department of Mechanical Engineering
Page 3
iii
Abstract
The production of Portland cement causes environmental pollution due to the amount of
carbon dioxide released into the atmosphere. This environmental pollution can be reduced by
improving the usage of industrial by-products. Geopolymer is a new concept that does not
involve the use of Portland cement as a binder. Geopolymer Concrete (GPC) is formed by using
such by-products and produces concrete without using any Ordinary Portland Cement (OPC). It
produces the concrete by mixing the Alumino–Silicate source materials such as fly ash or slag
with alkali activators such as KOH or NAOH. Due to the wide availability and low cost, industrial
waste residuals such as fly ash are commonly used as the source material for the manufacture
of GPC. The durability of GPC should be calculated and compared to OPC in order to consider
Geopolymer concrete as an alternative to OPC. To achieve this goal, 12 molar Geopolymer
concrete and 40 MPa ordinary Portland cement concrete specimens were prepared and tested
for corrosion rate. A combination of fly ash and bottom ash was used as the basic source
material which is activated by geopolymerization process to be the concrete binder. Instead of
using sodium based activators, the alkaline liquids used in this project for the process of
polymerization are the solutions of potassium hydroxide (KOH) and potassium silicate (K2SiO3),
due to its better contribution on workability and strength. The results have shown that
geopolymer concrete exhibited a higher resistance to chloride-induced corrosion; with low
corrosion rate and low mass loss percentage, compared to OPC concrete.
Page 4
iv
Nomenclature
GPC - Geopolymer concrete
OPC - Ordinary Portland cement/concrete
HCP - Half cell potential
LPR- Linear polarization resistance
SSD – Saturated Surface Dry
RC – Reinforced concrete
Page 5
v
Table of Contents
Supervisory Committee .................................................................................. ii
Abstract ......................................................................................................... iii
Nomenclature ................................................................................................ iv
Table of Contents ............................................................................................ v
List of Tables ................................................................................................. vii
List of Figures ................................................................................................ vii
Acknowledgments ....................................................................................... viii
Dedication ...................................................................................................... x
Chapter 1: Introduction................................................................................. 11
1.1. General ....................................................................................... 11 1.2. Scope of work ............................................................................. 11 1.3. Arrangement of report ................................................................ 12
Chapter 2: Literature Review ........................................................................ 13
2.1. Geopolymers ............................................................................... 13 2.1.1. Geopolymer Chemistry ........................................................ 13 2.1.2. Source materials .................................................................. 16 2.1.3. Alkaline Activator ................................................................ 17 2.1.4. Geopolymer applications ..................................................... 18
2.2. Corrosion of steel in concrete ...................................................... 19 2.3. Corrosion of steel in GPC ............................................................. 21 2.4. Half Cell Potential (HCP) method ................................................. 22 2.5. Linear polarization resistance ...................................................... 23
Chapter 3: Experimental setup ...................................................................... 26
3.1. Materials ..................................................................................... 26 3.1.1. Precursor material ............................................................... 26 3.1.2. Aggregates .......................................................................... 26 3.1.3. Alkali activator ..................................................................... 27 3.1.4. Ordinary Portland cement ................................................... 27
3.2. Preparation of Geopolymer and OPC concretes .......................... 28 3.3. Specimen preparation ................................................................. 29
Page 6
vi
3.4. Curing temperature and conditions ............................................. 29 3.5. Compressive strength test ........................................................... 30 3.6. Experimental program ................................................................. 31
3.6.1. Test specimens .................................................................... 31 3.6.2. Testing apparatus and materials ......................................... 31 3.6.3. Chloride solution ................................................................. 32
3.7. Accelerated reinforced corrosion ................................................ 32 3.8. Test procedure ............................................................................ 33 3.9. Half cell potential ........................................................................ 35 3.10. Linear Polarization Resistance Test ............................................ 36 3.11. Residual Flexural Load Test ........................................................ 37
Chapter 4: Experimental results and discussion ............................................ 39
4.1. Compressive strength .................................................................. 39 4.2. Cracking behaviour of the beams ................................................ 39 4.3. HCP analysis ................................................................................. 40 4.4. LPR analysis ................................................................................. 42 4.5. Residual Flexural Load ................................................................. 44 4.6. Mass loss measurements ............................................................. 45
Chapter 5: Conclusions .................................................................................. 47
References .................................................................................................... 48
Appendix A: LPR data graph of the OPC and GPC beams ............................... 50
Page 7
vii
List of Tables
Table 1 Applications of Geopolymer............................................................................................. 18
Table 2 Potential of cell vs probability of corrosion ..................................................................... 23
Table 3 Typical corrosion rates from LPR measurement [24] ...................................................... 25
Table 4 Chemical Composition of fly ash and bottom ash ........................................................... 26
Table 5 Mix design of Geopolymer concrete ................................................................................ 28
Table 6 Mix design of OPC concrete ............................................................................................. 28
Table 7 Compressive strength development of OPC and GPC beams .......................................... 39
Table 8 Half cell potential test results .......................................................................................... 41
Table 9 Linear polarization resistance test results ....................................................................... 43
Table 10 Residual Flexural Loads of all the beams ....................................................................... 44
Table 11 Percentage of mass loss of reinforced rebar ................................................................. 46
Page 8
viii
List of Figures
Figure 1 Conceptual model of Geopolymerization [4] ................................................................. 15
Figure 2 Chloride attack of steel reinforcement through concrete [14] ...................................... 19
Figure 3 Corrosion reaction of steel reinforcement [14] .............................................................. 20
Figure 4 Linear Polarization Resistance Measurement Setup [23] ............................................... 24
Figure 5 Model diagram of beam mold ........................................................................................ 29
Figure 6 Forney's Compressive Strength Test Machine................................................................ 30
Figure 7 Schematic diagram of beam specimen ........................................................................... 31
Figure 8 Beam specimens immersed in a chloride solution ......................................................... 32
Figure 9 FDOT Accelerated corrosion test setup [29] ................................................................... 33
Figure 10 Schematic of Accelerated Corrosion test setup ........................................................... 34
Figure 11 Experimental setup for Accelerated Corrosion test ..................................................... 35
Figure 12 Schematic of the Half-cell potential measurement setup ............................................ 36
Figure 13 Gamry Potentiostat setup for LPR test ......................................................................... 37
Figure 14 Specimens under center point loading test .................................................................. 38
Figure 15 OPC beam after 200 hours of test ................................................................................ 40
Figure 16 GPC beam after 200 hours of test ................................................................................ 40
Figure 17 Average HCP values of OPC and GPC Beams ................................................................ 41
Figure 18 LPR graphical data of OPC beams ................................................................................. 42
Figure 19 LPR graphical data of GPC beams ................................................................................. 43
Figure 20 Broken OPC and GPC Beams ......................................................................................... 45
Figure 21 LPR data graph of GPC 1 ............................................................................................... 50
Figure 22 LPR data graph of GPC 2 ............................................................................................... 51
Figure 23 LPR data graph of GPC 3 ............................................................................................... 51
Figure 24 LPR data graph of OPC 1 ............................................................................................... 52
Figure 25 LPR data graph of OPC 2 ............................................................................................... 52
Figure 26 LPR data graph of OPC 3 ............................................................................................... 53
Page 9
ix
Acknowledgments
I wish to express my deepest gratitude to my supervisor Dr. Rishi Gupta. His support and
consistent guidance made it possible for me to work on a topic that was of my interest. It was a
great honor to finish this work under his supervision.
I am grateful to my co-supervisor Dr. Caterina Valeo for being an excellent guide. Thank you for
encouraging and supporting me all the time.
I would like to thank Mr. Peyman Azarsa for sharing his knowledge and helping me with the mix
design and casting work. I would like to thank Mr. Pejman Azarsa for helping me with the
experimental setup, which would not have been possible to conduct on my own.
I would also like to thank Dr. Armando Tura and Mr. Mathew Walker for facilitating the
research activities and providing with the materials needed in the lab.
Finally, I would like to acknowledge the love and unconditional support of my family and
friends. I’d like to give special thanks to Renu Prasad Jetty for all his love and support.
Page 10
x
Dedication
This work is dedicated to my beloved parents Krishnaiah Morla, Prasanna Morla and my fiancé
Renu Prasad Jetty who have always been constant source of support in every possible way and
encouragement throughout my life.
Page 11
Chapter 1: Introduction
1.1. General
Geopolymer concrete made up of fly ash, bottom ash, coarse aggregate, fine sand, and an
alkaline solution of potassium hydroxide and potassium silicate can play a vital role in its
environmental control of CO2 emissions. Steel reinforcement which is used in concrete
structures has both advantages and disadvantages. It has a high compressive strength
compared to other building materials; but also reduces the durability and longevity of concrete,
due to its proneness to corrosion. The durability of concrete has a direct impact on its service
behaviour, design life, and safety.
There are several factors that are responsible for degradation/deterioration in reinforced
concrete structures. One of the factors responsible for the degradation is the corrosion of steel.
The corrosion of steel reinforcement is complex. In simple words, it is similar to the
electrochemical reaction of a battery. There are two stages of steel corrosion in concrete. In the
first stage, the elements such as carbon dioxide or chloride present in the surrounding medium
penetrate in concrete. In the second stage, these elements are in high concentration at the
reinforcement level, resulting in rust growth, which can cause concrete cracking [1]. There are
many techniques available for the prevention of corrosion in reinforced concrete structures. An
Epoxy coating can prevent the formation of corrosion but can affect the rebar and concrete
interface. Stainless steel reinforcement can also help to prevent the rust reaction, but cost is an
issue. The cost of repairs can be minimized by delaying the corrosion cracking process.
1.2. Scope of work
Geopolymer concrete cylinders and beams were made to test the strength and corrosion
durability and OPC cylinders and beams were made to test and compare the properties with
GPC. In the beginning stage, cylinders were experimented to find the compressive strength to
know about the properties of GPC at different ages. In the later stage, beams were
experimented to study about the accelerated corrosion testing of centrally reinforced beams to
find out the cracking behaviour of GPC after corrosion of the reinforcement. In the final step,
Page 12
12
the beams were tested for the residual flexural strength of GPC and also to determine the mass
loss of the reinforced steel.
1.3. Arrangement of report
This report starts with the chapter 2 which is the literature review on Geopolymers and their
chemistry. It also gives a brief review on corrosion in GPC.
Chapter 3 describes the experimental set up carried out to develop the mix design, materials
used, the mixing process and the preparation of GPC and OPC specimens. This chapter also
describes the curing temperature and conditions of GPC. The tests performed to study the
properties and behaviour of both OPC and GPC concretes.
Chapter 4 provides and discusses the test results.
Chapter 5 states the summary and conclusion of this project.
There is a list of references at the end of the report.
Page 13
13
Chapter 2: Literature Review
2.1. Geopolymers
2.1.1. Geopolymer Chemistry
The concept of “GEOPOLYMER” was first proposed by Davidovits in the late 1970’s [2]. He
proposed that geopolymer is an alkaline liquid that could react with the aluminum (Al) and the
silicon (Si) in a source or by-product materials such as fly ash to produce binders. In this case,
the chemical reaction that takes place is known as polymerization process. He then introduced
the term geopolymer to represent these binders. Geopolymers are chains or networks of
mineral molecules connected with covalent bonds.
Davidovits suggested a word poly(sialate) to describe the chemical designation of geopolymers
based on silico-aluminates. The term sialate is an abbreviation of silicon-oxo-aluminate.
Poly(sialates) possess this empirical formula:
Mn{-(SiO2)z-AlO2}n, wH2O
Where M = cation or the alkanine element such as potassium, calcium or sodium; n is a dergree
of polymerisation or polycondensation; the symbol – indicates the presence of a bond; z is
1,2,3, upto 32
There are three types of silico-aluminate structures from polymerization reaction (Davidovits
1991),
▪ Poly(sialate), which has {-Si-O-Al-O-} as the repeating unit.
▪ Poly(sialate-siloxo), which has {-Si-O-Al-O-Si-O-} as the repeating unit.
▪ Poly(sialate-disiloxo), which has {-Si-O-Al-O-Si-O-Si-O-} as the repeating unit.
The following two stages chemical reactions represent the development of the geopolymer
developed by davidovits and are accepted widely:
n(Si2O5,Al2O2) + 2nSiO2 + 4nH2O + NaOH or KOH NA+, K++ n(OH)3-Si-O-Al--O-Si-(OH)3
(Si-Al material)
(1)
(OH)2
(Geopolymer precursor)
Page 14
14
n(OH)3-Si-O-Al--O-Si-(OH)3 + NaOH or KOH (Na+, K+)-(-Si-O-Al-O-Si-O-) + 4nH2O
(2)
Geopolymerization is a complicated process responsible for the formation of geopolymer.
Geopolymer is formed when the alumino-silicate oxides (Si2O5, Al2O2) chemically react with
alkali polysilicates producing polymeric Si – O – Al – O bonds. Polysilicates are generally fine
silica powder produced as a by-product of Ferro-silicon metallurgy or potassium or sodium
silicate supplied by chemical Industries [3].
In the last reaction, we can see that water is released during the chemical reaction that occurs
during the formation of geopolymers. Therefore, water plays no role in the chemical reaction.
This is in contrast to the Portland cement concrete mixing during hydration process.
The general mechanism for alkali activation of alumino-silicates has been modeled by
Gluhhovsky by dividing the process into three stages: 1) destruction-coagulation; 2)
coagulation-condensation; 3) condensation-crystallization [4]. Different authors have
elaborated the Gluhhovsky theory and applied the knowledge about zeolite synthesis to explain
the geopolymerization processs. Figure 1 shows a simple reaction mechanism for
geopolymerization.
(OH)2 O O O
(Geopolymer backbone)
Page 15
15
Figure 1 Conceptual model of Geopolymerization [4]
Dissolution of aluminosilicate source produces aluminate and silicate species by consuming the
water. These species are incorporated into the aqueous phase, which contains silicate in the
activating solution. The speciation equilibria within the solution containing aluminate, silicate
and aluminosilicate species have been studied. This process releases water, which was
consumed in the first step during dissolution. While water plays the role of a reaction medium,
it stays within pores in the gel. After gelation, the system continues to reorganize, which will
result in the three-dimensional aluminosilicate network, commonly accredited to geopolymers
[4].
There are two main components of Geopolymers. They are source materials and the alkaline
liquid. The materials that are rich in Silicon and Aluminum are used as source materials. The
alkaline liquids are usually potassium or sodium based that are obtained from soluble alkali
metals.
Page 16
16
2.1.2. Source materials
Any material that is rich in Silicon and Aluminum in amorphous form can be considered as the
possible source material for the manufacture of geopolymer. There are so many by-products
available such as fly ash, slag, red mud, silica fume etc., could be considered as source
materials. These source materials have been studied separately and in combined forms to
produce geopolymer materials. The choice of source materials for making the geopolymer
concretes depends upon the factors such as type of application, cost, availability and specific
demands of the users.
FLY ASH
Fly ash is a by-product obtained in the process of production of coal from coal-fired power
stations. Coal ash is a general term used to define the collection of residuals produced during
the combustion of coal. Coal ash is further divided into two categories depending upon the
particle size. Fly ash is the most voluminous and broadly known constituent. It occupies more
than half of the coal leftovers and is the lightest kind of coal ash. They float on the exhaust
stacks of the power plant. Bottom ash is the coarser component and occupies about 10 percent
of the waste. Bottom ash doesn’t float on to the exhaust stacks. It settles to the bottom of the
boiler of the power plant [5].
Depending on the content of calcium, Fly ash is classified into two main types, namely ASTM
class C and class F. Class F fly ash contains less than 7% lime (CaO). Whereas, Class C generally
contains more than 20% lime. Class C is a self-cementing and does not require any activator.
Class F requires a chemical activator such as sodium silicate or potassium silicate to form a
geopolymer. The presence of calcium does not allow the formation of three dimensional
polymeric network which results in a reduced final strength [6]. Class F is mostly used as a
binder material in the projects since the curing process is performed at elevated temperatures.
Wallah and Rangan [7] conducted a study on fly ash based geopolymer concrete. For their
study, they used low calcium (ASTM class F) dry fly ash obtained from a local coal burning
power station. In this study they have described the long term properties of low-calcium fly ash
based geopolymer concrete. They concluded that geopolymer possess excellent properties.
Heat cured low calcium fly ash based geopolymer concrete has excellent compressive strength.
It possesses excellent resistance to sulphate attack and also good acid resistance. They also
Page 17
17
concluded that fly ash based geopolymer undergoes lesser creep compared to Portland cement
concrete. It has very little drying shrinkage.
KAOLIN
Mustafa Al Bakri et al [8] performed microstructure studies on different types of geopolymer
materials. In their research, they have used a locally supplied Koalin which was of powder type
with maximum 2% of moisture content. These researchers claim that the kaolin geopolymers
contain pores that are predominantly in the meso pore size range, whereas the fly ash
geopolymer contain pores that are predominantly in the micro pore size range. Kaolin based
geopolymers possess sponge like amorphous gel indicating the structure experiences growth. In
this case, the alkali activation is more effective. Kaolin contains more unreacted particles
compared to fly ash. It is also studied that the kaolin based geopolymers have less dense
structure compared to fly ash based geopolymer.
VOLCANIC ASH
Tchakoute et al [9] studied that volcanic ash can be used to produce geopolymer cements. The
experiment used alkali fusion process to promote the dissolution of Si and Al from the volcanic
ash and therefore to improve the reactivity of volcanic ash. This study showed that by
improving the reactivity of volcanic ash by alkali fusion process and balancing the Na/Al through
the addition of metakaolin, volcanic ashes can be used as a source material for the production
of geopolymers.
2.1.3. Alkaline Activator
Alkaline activator is another important factor in the polymerization process. It is required for
the dissolution of Al and Si from the source materials. The most commonly used alkaline liquid
in geopolymerization is the combination of Sodium hydroxide (NaOH) with sodium silicate or
potassium hydroxide (KOH) with potassium silicate.
In the most recent study by Wallah and Rangan [7], the long term properties of low-calcium fly
ash based geopolymer concrete has been studied. Two different mixture proportions were
formulated for making concrete specimens i.e. different amounts of sodium silicate and sodium
hydroxide solution with molarities 8M and 14M. It was concluded that the solution with 8M
possess high compressive strength.
Page 18
18
2.1.4. Geopolymer applications
The first application of geopolymer was building products developed between 1973 and 1976.
A fire resistant chip board panel was built comprised of a wooden core faced with two
geopolymer nano composite coatings with one step manufacturing process [10].
Daviodovits [11] has introduced a wide range of applications of geopolymer in industries such
as aerospace and automobile, metallurgy and civil engineering and plastic industries. According
to davidovits [12] Some of the applications of geopolymers include: geopolymer cement and
concrete, insulated panels and walls, fire resistant wood panels, low tech building materials,
aluminum foundry application, refractory items, and aircraft interior
The type of application of geopolymeric materials is determined by the chemical structure in
terms of the atomic ratio Si:Al in the polysialate. Davidovits proposed the possible applications
of the geopolymer depending on the molar ratio of Si to Al, as given in table 1.
Table 1 Applications of Geopolymer
Si/Al Application
1 Bricks, ceramics, fire protection
2 Low co2 cements, concrete, radioactive and toxic waste encapsulation
3 Heat resistance composites, foundry equipment’s, fibre glass composites
>3 Sealants for industry
20<Si/Al<35 Fire resistance and heat resistance fibre composites
A low ratio of Si:Al of 1, 2, or 3 initiates a 3D-Network that is very rigid, while Si:Al ratio higher
than 15 provides a polymeric character to the geopolymeric material. It can be seen from Table
1 that for many applications in the civil engineering field a low Si:Al ratio is suitable.
Davidovits also explored the application of geopolymer in toxic waste management. It is one of
the potential fields of application because geopolymer acts similar to zeolite materials, which
have been known for their ability to absorb the toxic chemical wastes.
Page 19
19
2.2. Corrosion of steel in concrete
The corrosion of the reinforcing steel is a major problem in concrete. Deterioration of concrete
can be divided into three categories: chemical (or) physical deterioration of the concrete itself,
physical damage, and corrosion of the reinforcement. Two main causes of corrosion of steel in
concrete are carbonation and chloride attack [13]. Corrosion due to chloride attack will be
studied in this paper. It is very important to know that chloride attack do not target the
concrete, but the chloride ions makes their way to pass through the pores in the concrete to
attack the steel.
The steel in concrete is usually in a non-corroding, passive condition. When chloride moves into
the concrete, it damages the passive layer protecting the steel. The corrosion process involves
the breaking down of the passive layer between the concrete and steel interface causing the
steel to rust and pit. The chloride attack of steel reinforcement is shown in the figure 2.
Figure 2 Chloride attack of steel reinforcement through concrete [14]
Once the passive layer starts to break down, corrosion begins to occur through anode and
cathode reactions. When the steel in concrete starts to corrode, it dissolves into the pore water
and gives up the electrons. These electrons will be consumed in the cathodic reaction which
consumes water and oxygen to generate hydroxyl ions [14]. The anode and cathode reactions
are only the first steps in the process of creating rust. This is followed by ferrous hydroxide
becoming ferric hydroxide and then hydrated ferric oxide which is also known as rust.
Page 20
20
The full corrosion process is explained in the figure 3.
Figure 3 Corrosion reaction of steel reinforcement [14]
Unhydrated ferric oxide has a volume of about two times that of the steel it replaces when fully
dense. When ferric oxide becomes hydrated, it starts swelling and becomes porous. This results
in the increase of volume at the steel and concrete interface nearly 6 to 10 times of the original
volume of the steel. This expansion of ferric oxide results in the cracking and spalling of
concrete.
There are a variety of methods available for preventing the corrosion or at least to slow down
the corrosion process. Galvanized reinforced steel can be used when the reinforcement will be
exposed to the weather before construction begins. It can withstand chloride ion
concentrations at least 4 to 5 times higher than the chloride level that causes in black steel
reinforcement. Stainless steel reinforcement can be used, but is so expensive. Epoxy coatings
can be used on rebar to give resistance to water, acids and alkali, but can affect the steel and
concrete interface. It is also possible to slow down the corrosion process by following some
aspects such as water content, concrete cover and compactness. Once the corrosion process
starts, it is recommended to implement various repair methods to extend the service life of a
structure. The cost of repairs can be minimized by delaying the corrosion and cracking process.
Page 21
21
2.3. Corrosion of steel in GPC
Pawel et al [15] carried out experiments on Geopolymer ashes and coal derived products. The
goal of the research was to study the corrosion resistance of Geopolymers to a number of
chemical environments as well as the possibility of combining the new plastic with steel
surfaces to prevent their corrosion. The experiment proved that Geopolymer is resistant to the
action of acetone. The solutions of NAOH for each concentration of the solution were observed
to move from the solution into the material, which resulted in the destruction of the material.
Under high concentrations of HCL acid and the absence of a tight layer of the sediment the
samples underwent rapid corrosion process. In other solutions, there was no case of corrosion
and only the formation of the precipitate formed around the mineral compounds contained in
the solution. They have concluded that the material has excellent corrosion resistance property
which makes it possible to use such materials in industrial pipelines carrying concentrated
acids.
Chandani et al [16] carried out long term tests on chloride ingress and steel corrosion in fly ash
based geopolymer concrete. This study examined the initiation of chloride induced corrosion
and the chloride permeability of geopolymer concrete in accelerated chloride environment
using long term tests. The studies showed that chloride diffusion coefficient is less in fly ash and
slag GPC than that of OPC concrete. With the increase of slag content in the binder, the
diffusion coefficient decreased. When the slag content increases, the resultant binder consists
of more calcium silicate hydrate, calcium aluminate silicate hydrate which have higher binding
capacity for chloride ions to limit the ingress of those ions and higher amount of hydrotalcite
phrases which contains a layered double hydroxide structure that increases the capability to
exchange ions with the concrete pore solutions and absorb anions to its structure. This results
in the decreased diffusion coefficient. They have also concluded that the embedded rebar in fly
ash and slag based GPC has higher resistance to corrosion than a rebar in OPC concrete.
Reddy et al [17] conducted an experiment on durability of reinforced GPC in the marine
environment. This study evaluated the corrosion based durability of low calcium fly ash based
GPC using beams that are centrally reinforced, made with 8M and 14M concentrations of NOAH
and SiO2/Na2O solutions. This experiment proved that GPC has better corrosion resistance
performance compared to OPC. The test results indicated excellent resistance of the
geopolymer concrete to chloride attack, with longer time to corrosion cracking, compared to
OPC. This study also found that GPC is well bonded to the aggregates and is more
homogeneous than OPC concrete.
Farhan et al [18] conducted an experimental study on the effect of corrosion on the bond
between reinforcing steel bars and fibre reinforced geopolymer concrete. Three types of steel
Page 22
22
fibres were used in this study including straight micro steel fibre, deformed steel fibre and
hybrid steel fibre. This experiment proved that the addition of fibres improved the compressive
strength and splitting tensile strength of geopolymer concrete mixes. The fibre reinforced
geopolymer concrete improved the bond strength of reinforcing steel bar. This study also
proved that the addition of steel fibres to the geopolymer concrete resulted in better resistance
to chloride attack and corrosion than control plain geopolymer concrete specimens.
Babaee et al [19] carried experimental study on chloride-induced corrosion of reinforcement in
low-calcium fly ash-based geopolymer concrete. In this study, the performance of chloride-
contaminated reinforced GPC specimens was investigated by parameters such as polarization
resistance, open circuit corrosion potential and tafel slopes. The test results indicated that low-
calcium fly ash based geopolymer concrete shows a comparable electrochemical performance
to Portland cement concrete during the propagation stage of corrosion. The values of corrosion
potential and polarization resistance after depassivation of the reinforcements were
comparable to that of corrosion risk as expected for Portland cement based corroding systems.
The polarization resistance values of geopolymer were comparable to Portland cement based
corroding systems.
2.4. Half Cell Potential (HCP) method
A HCP is a non destructive technique used to find the corrosion risk of steels in reinforced
concrete. It is very important to detect and evaluate the probability of corrosion for the
maintenance of RC structure. By determining the status of corrosion in the early stage, a
convenient repair solution can be planned for the damaged RC structures.
The cell potential (Ecell ) is the measure of the potential difference between two half cells in an
electrochemical cell. The potential difference is caused due to the ability of electrons to move
from one half cell to the other. Electrons are able to move from one half cell to the other
because the chemical reaction that takes place is a redox reaction. The cell potential (Ecell ) is
measured in terms of voltage V.
Wanchai et al [20] studied the influences of chloride content, concrete cover, moisture content
and compressive strength on half-cell potential measurement and the relationship between the
half-cell potential values and the corrosion level. This study was performed on concrete slabs
with various dimensions. After curing of the specimens in water for 28 days, the half cell
potential measurements were measured every week under wet and dry cycle for 140 days. This
study proved that half-cell potential values decreased with the increase in chloride content and
moisture content but increased with the increase in compressive strength.
Page 23
23
According to ASTM C867 [21], the more negative values measured from the voltmeter, there is
more probability of corrosion.
Table 2 Potential of cell vs probability of corrosion
cell potential (Ecell ) Probability of corrosion
>-200 mV 10%
-200 to -350 mV 50%
< -350 mV 90%
2.5. Linear polarization resistance
Linear polarization resistance is an electrochemical technique used to measure the corrosion
rates. It the only corrosion monitoring method that allows corrosion rates to be measured
directly in real time.
The corrosion rate can be computed by using the corrosion current (ICORR) generated by the
flow of electrons from anode to cathode. By applying the modified version of Faraday’s law the
following equation can be generated [22]:
ICORR = 106 B/Rp µA/cm2 (3)
Where Rp is the polarization resistance of a corroding electrode and is defined as the slope of a
potential versus current density plot. The dimension of Rp is ohm-cm2.
B is the Stern-Geary coefficient and the Stern-Geary coefficient is given by
B =babc/2.303(ba+bc) (4)
Where ba and bc are the anodic and cathodic Tafel slopes. B value is often taken as 25 mV for
active corrosion state and 50 mV for passive conditions.
The corrosion rate in µm per year is given by
CR = 3.27 x ICORR x Ew / ρ (5)
Where
ICORR is the corrosion current density in µA/cm2
Ew is the equivalent weight of the corroding metal
Page 24
24
ρ is the density of the corroding metal in g/cm3
Gowers et al [23] performed linear polarization resistance mapping on site on two reinforced
concrete structures. An alternative method has been studied by incorporating the monitoring
bars of known area into concrete structure by physically defining the measurement area during
LPR measurement to increase the accuracy of the results. They made a comparison between
the LPR data and results obtained using potential plus resistivity mapping. This study concluded
that a combination of potential and resistivity mapping is more effective in identifying the sites
where the corrosion is active. This combination of results gave a good indication of the location
and rate of corrosion of steel reinforced concrete structures. The advantage of this combination
is the speed with which it can be carried out.
Figure 4 Linear Polarization Resistance Measurement Setup [23]
Model values of corrosion rates from LPR measurements are given in the following table:
Page 25
25
Table 3 Typical corrosion rates from LPR measurement [24]
Corrosion rate Corrosion rate icorr Corrosion penetration rate
Very low/negligible < 0.1 µA/cm2 < 2 µm/year
Low 0.1-0.5 µA/cm2 2-6 µm/year
Moderate 0.5-1.0 µA/cm2 6-12 µm/year
High >1.0 µA/cm2 >12 µm/year
Corrosion penetration rate is defined as the thickness loss of the material per unit of time due
to the action of corrosion process. It is usually expressed in mils per year or millimetres per year
or micrometers per year.
Andrade and Alonso [24] have explained in their study that for ICORR values higher than 10
µA/cm2, the cross-section of the rebar decreases so drastically that it would result in a very
rapid deterioration. For the ICORR values ranging from 0.5-5 µA/cm2, the life time of the rebar
varies between 20-50 years. On the other hand, ICORR values less than 0.1 µA/cm2 have life times
longer than 100 years.
The main objective of this project was to measure the durability of fly ash and bottom ash
based Geopolymer concrete, compared to Ordinary Portland Cement, by means of accelerated
corrosion testing of the reinforced rebar.
Page 26
26
Chapter 3: Experimental setup
3.1. Materials
3.1.1. Precursor material
In the production of fly ash based geopolymer concretes, class F which is a low calcium fly ash is
mostly used due to the low calcium content. For this project, a class F fly ash which was
obtained from Centralia power plant Washington, USA. Based on ASTM C618 [25], three classes
of fly ash (class N, F, C) are desired for use in GPC mix design but among those, class F were
selected as it is a pozzolanic material and useful for developing the mix design.
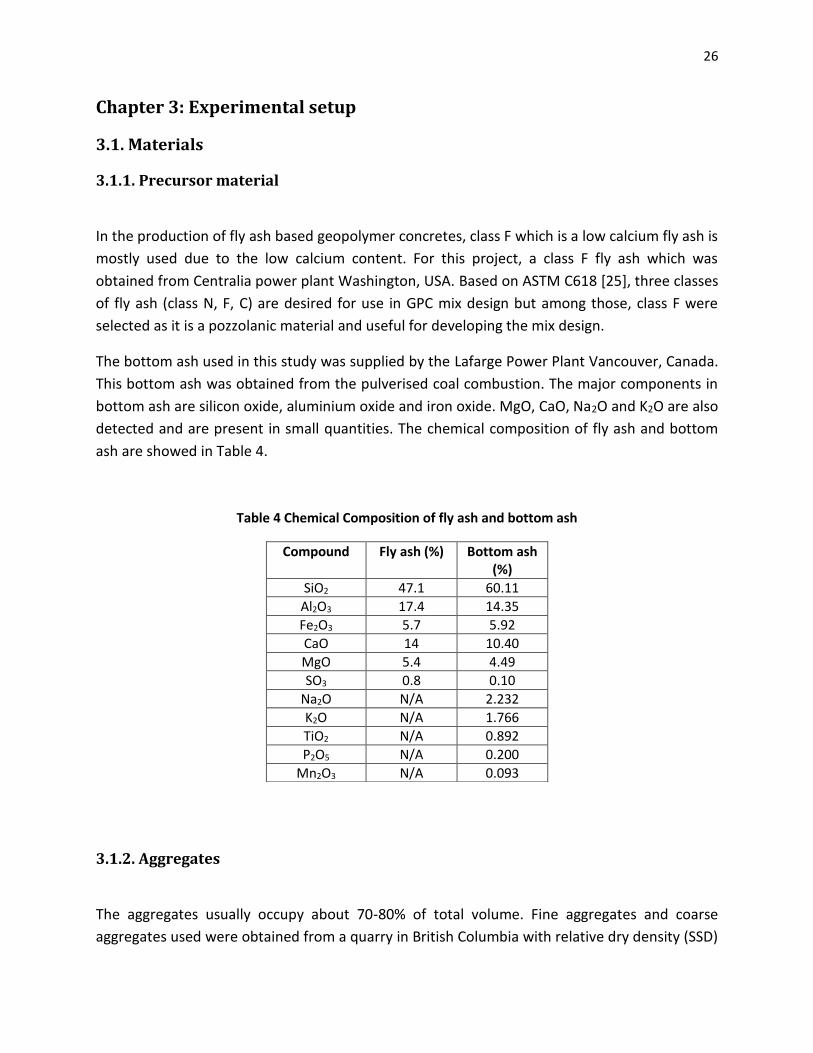
The bottom ash used in this study was supplied by the Lafarge Power Plant Vancouver, Canada.
This bottom ash was obtained from the pulverised coal combustion. The major components in
bottom ash are silicon oxide, aluminium oxide and iron oxide. MgO, CaO, Na2O and K2O are also
detected and are present in small quantities. The chemical composition of fly ash and bottom
ash are showed in Table 4.
Table 4 Chemical Composition of fly ash and bottom ash
3.1.2. Aggregates
The aggregates usually occupy about 70-80% of total volume. Fine aggregates and coarse
aggregates used were obtained from a quarry in British Columbia with relative dry density (SSD)
Compound Fly ash (%) Bottom ash (%)
SiO2 47.1 60.11
Al2O3 17.4 14.35
Fe2O3 5.7 5.92
CaO 14 10.40
MgO 5.4 4.49
SO3 0.8 0.10
Na2O N/A 2.232
K2O N/A 1.766
TiO2 N/A 0.892
P2O5 N/A 0.200
Mn2O3 N/A 0.093
Page 27
27
of 2.671 and 2.713 respectively, and water absorption ratio of 0.79% and 0.69% respectively.
The local aggregates comprising 12.5 mm used as coarse aggregates in GPC and the aggregates
comprising 12.5mm and 6.5 mm used in OPC; the fine aggregates used in both OPC and GPC
was medium coarse sand which was labelled for multipurpose use including concrete mixtures.
These aggregates were kept in the oven for 24hrs and were prepared to be surface-saturated
dry condition (SSD) before use.
3.1.3. Alkali activator
A combination of potassium silicate and potassium hydroxide was used as the alkaline
activator.
Potassium hydroxide was obtained from Sigma-Aldrich, Canada with >85% purity in ACS grade.
This was supplied in flakes form. The potassium hydroxide (KOH) solution was prepared by
dissolving the flakes in water. The mass of KOH solids in a solution varies depending on the
concentration of the solution expressed in terms of molar, M. The concentration of potassium
hydroxide used was 12 Molar. The KOH solution was prepared 24 hours in advance of use by
dissolving measured KOH pellets in required amount of tap water.
Potassium silicate powder (AgSil 16H) was obtained from PQ Cooperation (USA) was used in
this project. Based on the MSDS file provided by the company, chemical composition of the
K2SiO3 Powder was K2O = 32.4%, SiO2= 52.8% and water weight percentage of 14.8%.
Based on the literature review, it was suggested to prepare the K2SiO3 solution. However,
several attempts were made to dissolve the K2SiO3 powder in hydroxide solution or tap water,
were not successful. The solution turned into a gelatinous bulk at the bottom of the mixing
bowl. To avoid this problem, K2SiO3 powder was first dry mixed with the fly ash, bottom ash and
aggregates.
3.1.4. Ordinary Portland cement
ASTM Type 1 Portland cement was used for the manufacture of the control mix concrete. The
controlled concrete mix was designed to achieve the strength and durability as per the
structural requirements.
Page 28
28
3.2. Preparation of Geopolymer and OPC concretes
The aggregates and bottom ash were prepared in saturated surface dry condition and kept in
the plastic buckets with lid. The solid constituents of geopolymer concrete, i.e. the aggregates,
fly ash and bottom ash were first mixed in dry condition in the pan mixer for about 2-3 minutes.
Next, the potassium silicate powder was added to the mixture and mixed for a minute. The
liquid part of the mixture, i.e. potassium hydroxide solution was added to the solids. Then the
wet mixing is usually continued by adding the additional water required for another 5 minutes.
Table 5 Mix design of Geopolymer concrete
Material Content (Kg/m3)
Fly ash 194
Bottom ash 194
Coarse aggregates 1170
Sand 630
KOH (12M) 85.16
K2SiO3 125.74
In order to prepare the OPC concretes, the dry ingredients such as cement, sand and coarse
aggregates are mixed properly and the water is added slowly until the concrete is workable.
Water plays a major role to make the concrete workable. Too much water can result in weak
concrete and too little water can result in unworkable concrete. The mix design for the 40 MPa
concrete is shown in the table 6.
Table 6 Mix design of OPC concrete
Material Kg/m3
Cement 400
Sand 660
12.5 mm aggregate 701
6.5 mm aggregate 467
Water 160
Page 29
29
3.3. Specimen preparation
In this project two different types of samples were used: 6”x 6”x 21” beam samples and 4”x 8”
cylindrical samples. The beam specimens were used in the corrosion study and the cylindrical
samples were used in determining the compressive strength of the geopolymer concrete mix
and OPC mix.
Plywood of ¾” thickness is used in construction of beam molds of 6”x6”x21” dimensions of
height, width and length respectively as shown in the figure 10. The same mix design is used for
both cylinders and beams.
Figure 5 Model diagram of beam mold
3.4. Curing temperature and conditions
The geopolymer concrete test specimens were allowed to set in the molds for one day at room
temperature before being demolded. After demolding, the specimens were kept in the oven at
800C for 24 hours. After that, the specimens were cured in room temperature in water tank
until they reached the 28th day of age. Heat curing is recommended for low calcium based
geopolymer concrete. Heat curing promotes the chemical reaction that occurs in the
Page 30
30
geopolymer concrete. It can be achieved by either dry-curing or steam-curing. Curing time and
curing temperature influence the compressive strength of geopolymer concrete.
After the 28th day, the cylinders were taken out from the water tank and the surfaces are
grounded using a grinding machine. This ensures the distribution of load uniformly for a
compression test. These specimens were rested in the ambient condition until SSD condition
was achieved.
3.5. Compressive strength test
Compression test of the cylinders was conducted using Forney’s compressive test machine in
the materials lab by following ASTM C39-14[26].
Before starting the test, calculate the diameter and area of each concrete specimen. Then the
cylinder was placed in the center of the loading area. The cylinder must be placed on top of the
neoprene cap and set the loading rate to about 0.3 MPa/s. The loading rate was remained
constant until the concrete cylinder starts to fail. The concrete test is complete when the
cylinder begins to crack and splinter. Stop the test, open the cage door and safely remove the
cracked concrete. The recorded maximum load value is in kN and it can be converted into the
compressive strength in MPa by dividing the cross-sectional area of the cylinder.
Figure 6 Forney's Compressive Strength Test Machine
Page 31
31
3.6. Experimental program
3.6.1. Test specimens
For the experimental program, 6”X6”X21” beam specimens, centrally reinforced with ½” steel
rebar were prepared. One end of the rebar was extended so electrical connections could be
made. After curing for 24 hours at 800C, the samples were kept in the water tank.
Figure 7 Schematic diagram of beam specimen
3.6.2. Testing apparatus and materials
A Rubbermaid tank with chloride solution was used for holding the beam specimens. A 12
gauge Copper wire was used to connect the rebar and the stainless steel rod to the power
supply. A 30V D.C. power supply was used to provide the electric potential to the rebar. A
digital multimeter was used to ensure the voltage across the circuit was constant and also for
reading the current passing through the beams. A 3.5% chloride solution was prepared in the
Rubbermaid tank as this can be comparable to the typical salt concentration in sea water. This
concentration will show better performance of the rebar. An epoxy coating was applied to the
exposed rebar to avoid crevice corrosion.
Page 32
32
Figure 8 Beam specimens immersed in a chloride solution
3.6.3. Chloride solution
A commercially available product called ‘Instant Ocean’ was used to prepare the chloride
solution. According to ASTM D1141 [27] for artificial seawater, the ‘Instant Ocean’ product was
able to generate a chloride solution that is similar to natural seawater.
In order to prepare 3.5% Nacl solution, 17.50 kgs of NaCl was added to every 50 litres of water
and stirred with a mixing rod properly until the product completely dissolves into the water.
3.7. Accelerated reinforced corrosion
An accelerated electro-chemical laboratory method, first developed by the Nordest method
[28], followed by the Florida Department of Transportation [29] was used in this experiment.
This method was used to test corrosion resistance of various concrete mixes using centrally
reinforced concrete samples in a chloride solution. A constant voltage is applied to all the
samples and the current to each specimen is measured. The specimen starts to show signs of
corrosion when there is a rise in the current.
OPC Beams
GPC Beams
Chloride Solution
Rubbermaid tank
Page 33
33
Figure 9 FDOT Accelerated corrosion test setup [29]
In this experiment, the durability of fly ash based geopolymer concrete was tested using an
accelerated corrosion method. Corrosion resistance of GPC was tested against OPC in a chloride
solution.
3.8. Test procedure
The Rubbermaid tank was filled with the chloride solution that would allow each beam to be
partially immersed. After 28 days of curing in the water at ambient temperature, the beams
were placed in a chloride solution for a period of 28 days. This helps to keep the initial D.C.
power to a manageable low value. After that, the extended side of rebar acting as an anode
was connected to a 30V power supply. This high voltage accelerates the corrosion process and
decreases the test period time. A Stainless steel rod was used to act as a cathode. The D.C.
power supply was turned on and set to 30V electrical potential.
Page 34
34
Figure 10 Schematic of Accelerated Corrosion test setup
Once the testing procedure started, current readings were taken every day. A rise in the current
indicated the beginning of corrosion process, and eventually the start of the formation of cracks
in the beams. Once the beams reached the high current, there were visible signs of corrosion in
the chloride water and cracking of beams and the beams were considered to be failed. The time
taken to initiate the corrosion in the rebar in geopolymer concrete is higher than that of OPC
concrete. The beams were removed from the chloride water and left to air dry for 24 hours.
After that, the beams were tested for rate of corrosion using LPR. The final step involved
breaking the OPC and GPC beams to determine the effects of corrosion on rebar by measuring
the mass loss of the steel rebar for each beam.
Page 35
35
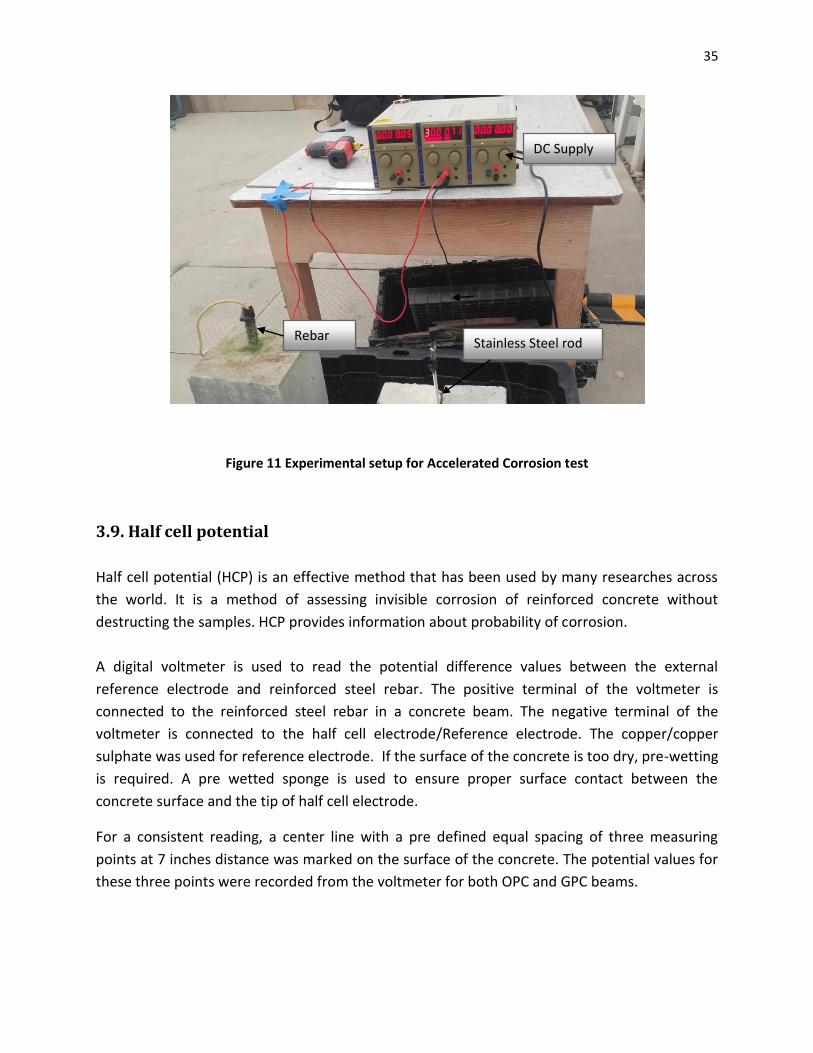
Figure 11 Experimental setup for Accelerated Corrosion test
3.9. Half cell potential
Half cell potential (HCP) is an effective method that has been used by many researches across
the world. It is a method of assessing invisible corrosion of reinforced concrete without
destructing the samples. HCP provides information about probability of corrosion.
A digital voltmeter is used to read the potential difference values between the external
reference electrode and reinforced steel rebar. The positive terminal of the voltmeter is
connected to the reinforced steel rebar in a concrete beam. The negative terminal of the
voltmeter is connected to the half cell electrode/Reference electrode. The copper/copper
sulphate was used for reference electrode. If the surface of the concrete is too dry, pre-wetting
is required. A pre wetted sponge is used to ensure proper surface contact between the
concrete surface and the tip of half cell electrode.
For a consistent reading, a center line with a pre defined equal spacing of three measuring
points at 7 inches distance was marked on the surface of the concrete. The potential values for
these three points were recorded from the voltmeter for both OPC and GPC beams.
DC Supply
Rebar Stainless Steel rod
Page 36
36
Figure 12 Schematic of the Half-cell potential measurement setup
3.10. Linear Polarization Resistance Test
The linear polarization resistance method is a non destructructive testing method used to
measure the corrosion rate. The data graph obtained from the instrument can be used to
calculate the corrosion rate. Polarization resistance measurements are an accurate and rapid
technique to measure the rate of corrosion.
After the specimens were removed from the chloride water and left to air dry for 24 hours, the
LPR test was performed. The specimens were supported on a wooden surface, which helps the
specimen to be on a flat surface. To conduct the LPR test, Gamry Instruments Reference 600+
potentiostat was used. The cell cable was connected to reference electrode, counter electrode,
rebar and ground. If the surface of the concrete is too dry, pre-wetting is required. A pre wetted
sponge is used to ensure proper surface contact between the concrete surface and the tip of
reference electrode. The equipment is connected to a computer to read the data graph. A
complete setup of the Gamry Potentiostat is shown in the figure 13. The Gamry Echem Analyst
Software was used to run the experiment. This is a single program that runs data-analysis for all
type of experiments such as DC Corrosions, EIS and Physical Electrochemistry. Before running
the software, the experimental Setup values are entered manually.
Page 37
37
For a consistent reading, a center line with a pre defined equal spacing of three measuring
points at 7 inches distance was marked on the surface of the concrete. The LPR data graphs for
these three points were recorded in the computer for both OPC and GPC beams.
The following values have been used in the LPR measurement:
Ew = 27.92
ρ = 7.85 g/cm2
B = 25 mV as the steel rebars inside the concrete showed 90% probability of corrosion.
Figure 13 Gamry Potentiostat setup for LPR test
3.11. Residual Flexural Load Test
Corrosion in steel reinforcement is one of the reasons for early degradation of the concrete
structure. Due to the accelerated corrosion process, there is a formation of corrosion in the
steel reinforcement and formation of cracks in the concrete structure. This results in mass loss
and reduces the stiffness of the specimen. After the accelerated corrosion process, recording
Gamry Cell Cable
Counter electrode
Reference electrode
Rebar / Working electrode
Computer
Connection to ground
Page 38
38
half-cell potential and linear polarization resistance tests, flexural load test was performed on
the beams to determine the loading capacity of the beams. MTI- 50K universal testing machine
is used with center point loading method. Figure 18 shows MTI-50K loading machine
performing the flexure loading test on the specimens.
Figure 14 Specimens under center point loading test
GPC and OPC Beams under
loading test
Page 39
39
Chapter 4: Experimental results and discussion
4.1. Compressive strength
The compressive strength of the different types of OPC and GPC concretes was measured for
4”X8” cylinders. The cylinders were tested at 7 days and 28 days of age after casting and steam
curing in the oven at 800C for 24 hours in case of geopolymer cylinders and cured in ambient
temperature for OPC cylinders. A minimum of three GPC and three OPC cylinders were used in
this test. The average compressive strength of the GPC cylinders at 7 days and 28 days were
26.65 MPa and 31.70 MPa respectively. For the OPC, the strengths were 26.93 MPa and 33.67
MPa respectively. It can be concluded from the results that both GPC and OPC cylinders cured
after 28 days are stronger than those were only cured for 7 days.
Table 7 Compressive strength development of OPC and GPC beams
S.No Specimen (cylinders) Compressive strength after 7 days (MPa)
Compressive strength after 28 days (MPa)
1 GPC 1 25.95 32.02
2 GPC 2 26.34 30.82
3 GPC 3 27.67 32.27
4 OPC 1 25.56 33.28
5 OPC 2 26.78 33.65
6 OPC 3 28.46 34.08
4.2. Cracking behaviour of the beams
The OPC beams started to show signs of rusting after 60 hours of accelerated corrosion testing.
On the other hand, the GPC beams showed no signs of rust for the same period of time. The
brown rust stain seen on top of the OPC beams is the first visual evidence of corrosion in the
embedded steel. It was also observed that corrosion products were floating on the surface of
chloride solution. After nearly 200 hours, a crack was observed in the OPC beams. On the other
hand, there were no cracks observed in the GPC beams. This makes it clear that GPC beams are
highly durable than OPC beams. The accelerated corrosion test was stopped at 300 hours and
the beams were removed from the chloride solution tank. Further the beams were visually
inspected and tested for corrosion potential and corrosion rate using HCP and LPR.
Page 40
40
Figure 15 OPC beam after 200 hours of test
Figure 16 GPC beam after 200 hours of test
4.3. HCP analysis
Before performing the accelerated corrosion test, the initial half cell potential readings on day 1
were taken from the voltmeter for both OPC and GPC beams. There was three measuring
points on each specimen and the potential values for these three points were recorded and
their total was averaged. These readings were taken on alternative days until the test reached
300 hours.
Table 8 represents the half cell potential values of GPC and OPC specimens.
Page 41
41
Table 8 Half cell potential test results
Specimen Half cell potential (mV)
Day 1 Day 3 Day 5 Day 7 Day 9 Day 11 Day 13
GPC 1 -93 -127 -147 -165 -220 -310 -370
GPC 2 -101 -132 -160 -217 -268 -362 -425
GPC 3 -125 -167 -196 -228 -279 -389 -447
OPC 1 -190 -220 -287 -390 -439 -467 -490
OPC 2 -173 -200 -269 -387 -420 -455 -489
OPC 3 -198 -229 -298 -410 -447 -498 -524
Figure 17 Average HCP values of OPC and GPC Beams
It can be observed that the half-cell potential values are more negative from day 1 to day 13 for
both the specimens as shown in figure 17. On day 1 the initial potential value of GPC beam 1
was recorded as -93 mV, whereas the potential value of OPC beam 1 was recorded as -190 mV.
The trend line of both GPC and OPC specimens is in a decline manner, which indicates an
increase in the probability of corrosion from day 1 to day 13. After day 13, both the specimens
showed 90% of probability of corrosion.
-600
-500
-400
-300
-200
-100
0
Day 1 Day 3 Day 5 Day 7 Day 9 Day 11 Day 13
Po
ten
tial
Val
ue
s (m
V)
Comparision of Half-cell potential
GPC
OPC
Page 42
42
4.4. LPR analysis
The LPR technique is used for accurately measuring the corrosion rates of the specimens and
the results are tabulated in table 9. The corrosion rate is calculated by using the equations
discussed in literature review in section 2.5. This data gives more detailed information on the
structural condition. The experiments are conducted for Geopolymer concrete specimens and
cement concrete specimens using Gamry Potentiostat. The graphical data for all the specimens
are shown in the below figures:
Figure 18 LPR graphical data of OPC beams
-550-540-530-520-510-500-490-480-470-460-450-440-430-420-410-400-390-380-370-360-350-340-330-320-310-300-290-280-270-260-250
-200 -100 0 100 200
Vf
(V v
s R
ef.
) m
V
Im (A) µA
OPC 1
OPC 2
OPC 3
Page 43
43
Figure 19 LPR graphical data of GPC beams
Table 9 Linear polarization resistance test results
S.NO. Type of Specimen
Corrosion Current ICORR (µA/cm2)
Corrosion rate (µm/year)
Corrosion condition (ASTM standard )
1. GPC 1 0.9113 10.598 Moderate
2. GPC 2 1.2303 14.308 High
3. GPC 3 1.7429 20.270 High
4. OPC 1 4.9214 57.233 Very high
5. OPC 2 4.1010 47.696 Very high
6. OPC 3 5.0471 58.698 Very high
-550-540-530-520-510-500-490-480-470-460-450-440-430-420-410-400-390-380-370-360-350-340-330-320-310-300-290-280-270-260-250
-20 -10 0 10 20V
f (V
vs
Re
f.)
mV
Im (A) µA
GPC 1
GPC 2
GPC 3
Page 44
44
The corrosion rate of the geopolymer concrete specimens is in between 10 µm/year and 20
µm/year. This indicates that these specimens have moderate to high rate of corrosion. No
cracks were observed on the surface of the GPC specimen, but micro cracks may have occurred
in the surrounding areas of the bar due to the corrosion products that was build up inside,
which might have allowed some chloride ions to penetrate into the bar. Whereas, the corrosion
rate of the OPC specimens is in between 40 µm/year and 60 µm/year, which indicates very high
rate of corrosion.
From the results it can be seen that GPC 1 had the best corrosion resistance. It gave the lowest
corrosion rate. We can see the geopolymer concrete shows better results for corrosion rate
compared to ordinary Portland concrete, is a proof of their compactness, and the subsequent
resistance to chloride penetration. The permeability and electric resistivity of the GPC concrete
was not affected by the severe chloride environment in the perspective of reduced cracking.
Hence the geopolymer concrete can be utilized in marine environment.
4.5. Residual Flexural Load
After the HCP and LPR testing, the beams were tested for residual load with center-point loading to find out the loading capacity using universal MTI-K testing machine. The results of the flexural tests are shown in Table 10.
Table 10 Residual Flexural Loads of all the beams
Specimen Type Flexural Load (N)
GPC 1 19678
GPC 2 20678
GPC 3 19325
OPC 1 14789
OPC 2 15908
OPC 3 16342
The table represents that the loading capacity of the OPC beams is less as compared to the GPC
beams. The average flexural strength for the OPC was 4.5 MPa and for the GPC was 6 MPa. This
test was carried after nearly 90 days of casting the beam specimens.
Page 45
45
4.6. Mass loss measurements
The corrosion assessment of steel bars used in the reinforced concrete can be done by mass
loss measurements. The initial mass of each rebar are recorded before the casting procedure.
After HCP and LPR experiments, the beams were completely broken to restore the entire rebar.
Figure 20 Broken OPC and GPC Beams
The rebars were cleaned with deionised water and a metal brush was used to remove the
corrosion products from the rebars. The steel rebars showed critical corrosion damage for the
OPC beams, while the rebars from the GPC beams showed less damage compared to OPC
beams. The more negative values observed in GPC beams however, is not a necessary
indication of high risk of corrosion. This can happen due to a number of reasons such as lack of
oxygen at the steel and concrete interface due to oxygen depletion, binding of the chloride ions
or lower pH level in geopolymer binders compared to OPC binders [30]. After that, these rebars
Page 46
46
were weighed and recorded as final mass. Then the percentage of mass loss is calculated for
both OPC and GPC beams.
Table 11 Percentage of mass loss of reinforced rebar
Specimen Type Initial mass (gms) Final mass (gms) Mass loss (%)
GPC 1 944.5 914.9 3.13
GPC 2 945.5 906.4 4.13
GPC 3 941.9 894.5 5.16
OPC 1 941.9 756.8 21.80
OPC 2 944.3 786.3 16.73
OPC 3 943.7 759.4 19.52
The percentage mass loss for the GPC beams were 3.13%, 4.13% and 5.16% respectively,
whereas, for the OPC beams it is 21.80%, 16.73% and 19.52% respectively. The OPC beams
showed huge mass loss due to the crack formation which makes the chloride ions to penetrate
quickly into the concrete and increase the rate of corrosion.
Page 47
47
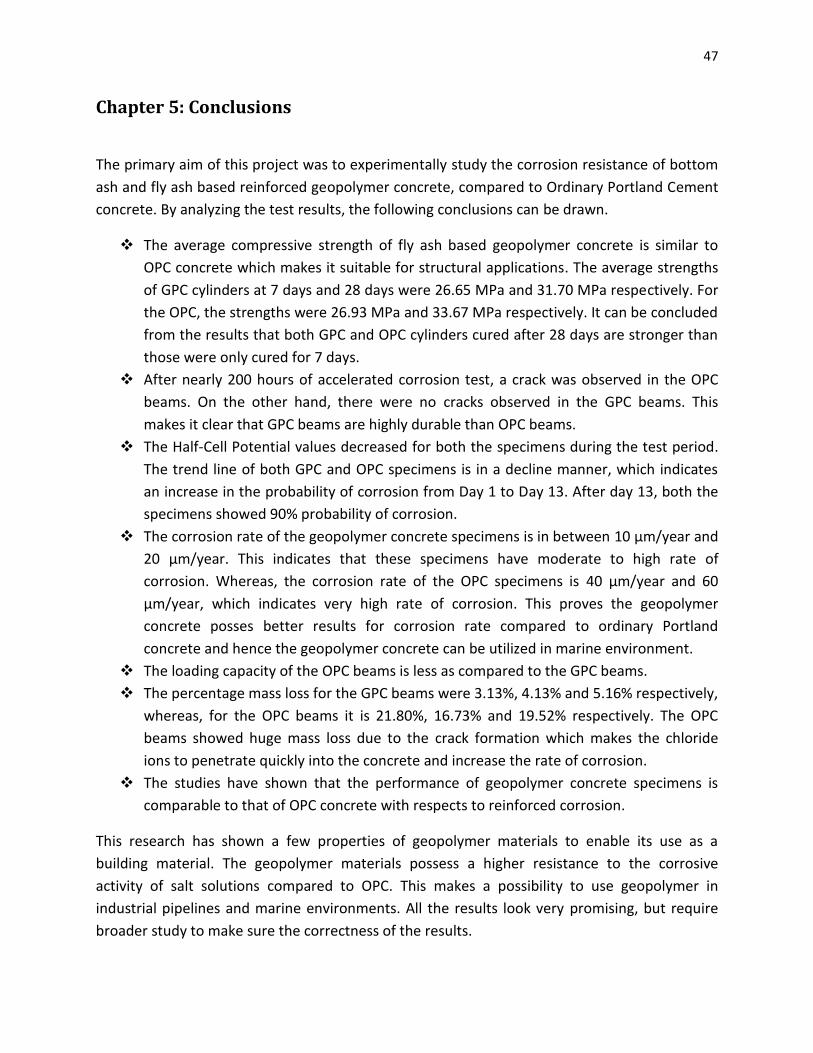
Chapter 5: Conclusions
The primary aim of this project was to experimentally study the corrosion resistance of bottom
ash and fly ash based reinforced geopolymer concrete, compared to Ordinary Portland Cement
concrete. By analyzing the test results, the following conclusions can be drawn.
❖ The average compressive strength of fly ash based geopolymer concrete is similar to
OPC concrete which makes it suitable for structural applications. The average strengths
of GPC cylinders at 7 days and 28 days were 26.65 MPa and 31.70 MPa respectively. For
the OPC, the strengths were 26.93 MPa and 33.67 MPa respectively. It can be concluded
from the results that both GPC and OPC cylinders cured after 28 days are stronger than
those were only cured for 7 days.
❖ After nearly 200 hours of accelerated corrosion test, a crack was observed in the OPC
beams. On the other hand, there were no cracks observed in the GPC beams. This
makes it clear that GPC beams are highly durable than OPC beams.
❖ The Half-Cell Potential values decreased for both the specimens during the test period.
The trend line of both GPC and OPC specimens is in a decline manner, which indicates
an increase in the probability of corrosion from Day 1 to Day 13. After day 13, both the
specimens showed 90% probability of corrosion.
❖ The corrosion rate of the geopolymer concrete specimens is in between 10 µm/year and
20 µm/year. This indicates that these specimens have moderate to high rate of
corrosion. Whereas, the corrosion rate of the OPC specimens is 40 µm/year and 60
µm/year, which indicates very high rate of corrosion. This proves the geopolymer
concrete posses better results for corrosion rate compared to ordinary Portland
concrete and hence the geopolymer concrete can be utilized in marine environment.
❖ The loading capacity of the OPC beams is less as compared to the GPC beams.
❖ The percentage mass loss for the GPC beams were 3.13%, 4.13% and 5.16% respectively,
whereas, for the OPC beams it is 21.80%, 16.73% and 19.52% respectively. The OPC
beams showed huge mass loss due to the crack formation which makes the chloride
ions to penetrate quickly into the concrete and increase the rate of corrosion.
❖ The studies have shown that the performance of geopolymer concrete specimens is
comparable to that of OPC concrete with respects to reinforced corrosion.
This research has shown a few properties of geopolymer materials to enable its use as a
building material. The geopolymer materials possess a higher resistance to the corrosive
activity of salt solutions compared to OPC. This makes a possibility to use geopolymer in
industrial pipelines and marine environments. All the results look very promising, but require
broader study to make sure the correctness of the results.
Page 48
48
References
1) “Steel in the sound concrete.” [online]. Available:
https://www.concretecorrosion.net/html_en/mecanism/contenu.htm [Accessed: 17-
August-2017].
2) J. Davidovits , “Properties of Geopolymer Cements and Concretes,” Scientific Research
Institute on Binders and Materials, Kiev State Technical university, Ukraine, pp. 131-149
1994.
3) H. Xu and J. S. J. Van Deventer, “The geopolymerization of alumino-silicate minerals,”
International Journal of Mineral Processing, vol. 59, no. 3, pp. 247-266, Jun. 2000.
4) P. Duxson, A. Fernandez-Jimenez , and others, “Geopolymer Technology: the current
state of the art,” J Mater Sci, pp. 2917-2933, 2007.
5) “Coal Ash, Fly Ash, Bottom Ash, and Boiler Slag.” [online]. Available:
https://www.nrdc.org/onearth/coal-ash-fly-ash-bottom-ash-and-boiler-slag [Accessed:
20-January-2018].
6) S. V. A. Silva, C. L. Wijewardena, S. M. A. Nanayakkara, and others, “Development of fly
ash based geopolymer concrete,” 2012.
7) S. E. Wallah and B. V. Rangan, “LOW-CALCIUM FLY ASH-BASED GEOPOLYMER
CONCRETE: LONG-TERM PROPERTIES,” Research report GC2, Faculty of Engineering,
Curtin University of Technology , Perth, Australia, 2006.
8) M. Mustafa Al Bakri, S. N. Fifinatasha and others, “Reviews on the Different Sources
Materials to the Geopolymer Performance,” Advances in Environmental Biology, vol. 12.
No. 7, pp. 3835-3842, Oct. 2013.
9) H. Tchakoute Kouamo, J. A. Mbey, and others, “Synthesis of volcano ash-based
geopolymer mortars by fusion method: Effects of adding metakaolin to fused volcanic
ash,” Ceramics International, Vol. 39, pp. 1613-1621, 2013.
10) J. Davidovits, “Geopolymer Chemistry & Applications,” 4th edition, Nov. 2015.
11) J. Davivits, “Geopolymer Chemistry and Properties,” paper presented at the Geopolymer
’88, First European Conference on Soft Mineralurgy,” Compiegne, France, 1988.
12) J. Davidovits, “30 years of Successes and Failures in Geopolymer Applications. Market
Trends and Potential Breakthroughs,” Geopolymer Conference, Melbourne, Australia,
2002.
13) V. Primoz, “Corrosion in concrete steel,” University of Ljubljana, Faculty of mathematics
and physics, Department of physics, Kamnik, Apr. 2008.
14) John P. Broomfield, “corrosion of steel in concrete,” understanding, investigation and
repair, 2nd edition, London, UK.
Page 49
49
15) M. Pawel, M. Janusz, and S. K. Jerzy, “THE CORROSION RESISTANCE OF THE BASE
GEOPOLYMER FLY ASH,” Advances in Science and Technology Research Journal, Vol. 7,
No. 19, pp. 88-92, Sept. 2013.
16) T. Chandani, S. Ahmad, and others, “Chloride ingress and steel corrosion in geopolymer
concrete based on long term tests,” Materials and Design, Vol. 116, pp. 287-299, 2017.
17) D. V. Reddy, and others, “DURABILITY OF REINFORCED FLY ASH-BASED GEOPOLYMER
CONCRETE IN THE MARINE ENVIRONMENT,” 36th Conference on Our World in Concrete
& Structures, Singapore, Aug. 2011.
18) Nabeel A. Farhan, M. Neaz Sheikh, Muhammad N.S. Hadi, “Experimental Investigation
on the Effect of Corrosion on the Bond Between Reinforcing Steel Bars and Fibre
Reinforced Geopolymer Concrete.” Structures, Vol. 14, pp. 251-261, 2018.
19) M. Babaee, A. Castel, “Chloride-induced corrosion of reinforcement in low-calcium fly
ash-based geopolymer concrete,” Cement and Concrete Research, Vol. 88, pp. 96-107,
2016.
20) Y. Wanchai, P. Thanawit, “Facors influencing half-cell potential measurement and its
relationship with corrosion level,” Measurement, Vol. 104, pp. 159-168, 2017.
21) “Standard Test Method for Corrosion Potentials of Uncoated Reinforcing Steel in
Concrete,” ASTM International Standards: C876-15, 2015.
22) “Standard Test method for Conducting Potentiodynamic Polarization Resistance
measurements,” ASTM International Standards: G59-97, 2002.
23) K. R. Gowers and S. G. Millard, “ON-SITE LINEAR POLARIZATION RESISTANCE MAPPING
OF REINFORCED CONCRETE STRUCTURES,” Corrosion Science, Vol. 35, Nos. 5-8, pp.
1593-1600, 1993.
24) C. Andrade, C. Alonso, “Corrosion rate monitoring in the laboratory and on site,”
Construction and Building Materials, Vol. 10, No. 5, pp. 315-328, 1996.
25) “Standard Specification for Coal Fly Ash and Raw or Calcined Natural Pozzolan for Use in
Concrete,” ASTM International Standards: C618-12a, 2014.
26) “Standard Test Method for compressive strength of Cylindrical concrete Specimens,”
ASTM International Standards” C39/C39M- 14, 2014.
27) “Standard Practice for the Preparation of Substitute Ocean Water,” ASTM Iternational:
D 1141-98, 2003.
28) Nordtest, “Nordtest Method,” Espoo, Finland, 1989.
29) Florida Department of Transportation, “Florida Method of Test for an Accelerated
Laboratory Method for Corrosion Testing of Reinforced Concrete Using Impressed
Current,” FM 5-522, FDOT, 2000.
30) C. Gunasekar, S. Bhuiyan, and others, “Corrosion resistance in different fly ash based
geopolymer concretes,” 2017.
Page 50
50
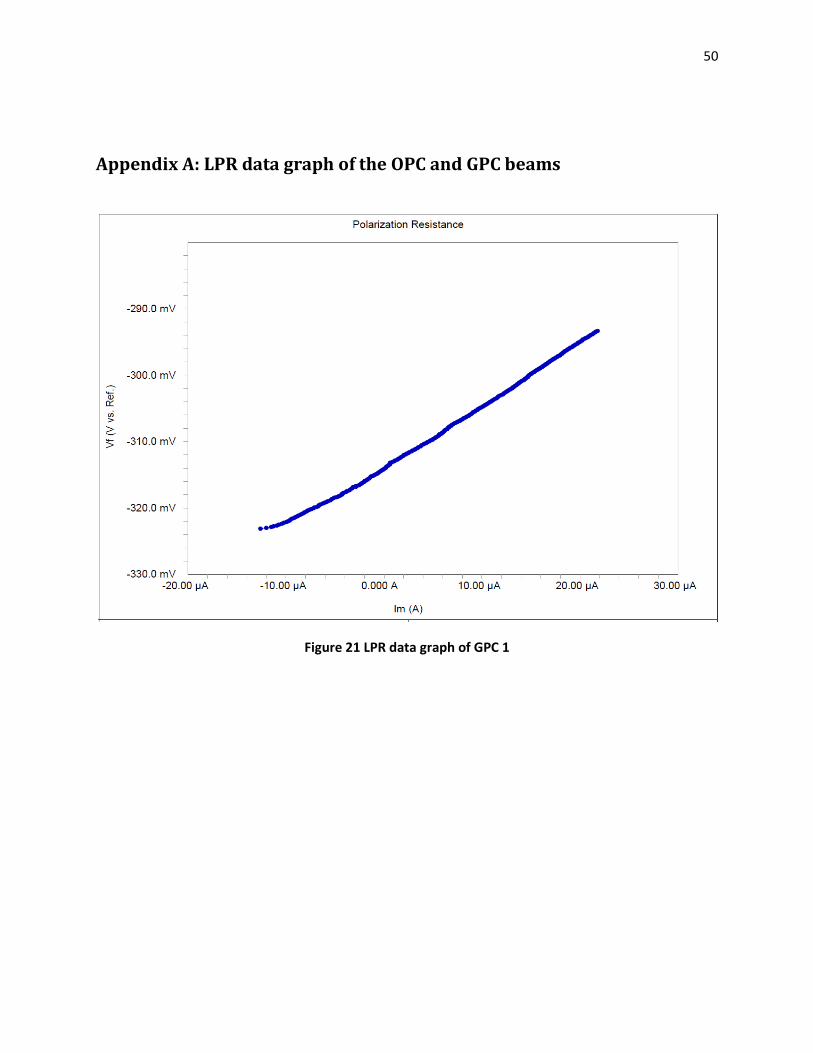
Appendix A: LPR data graph of the OPC and GPC beams
Figure 21 LPR data graph of GPC 1
Page 51
51
Figure 22 LPR data graph of GPC 2
Figure 23 LPR data graph of GPC 3
Page 52
52
Figure 24 LPR data graph of OPC 1
Figure 25 LPR data graph of OPC 2
Page 53
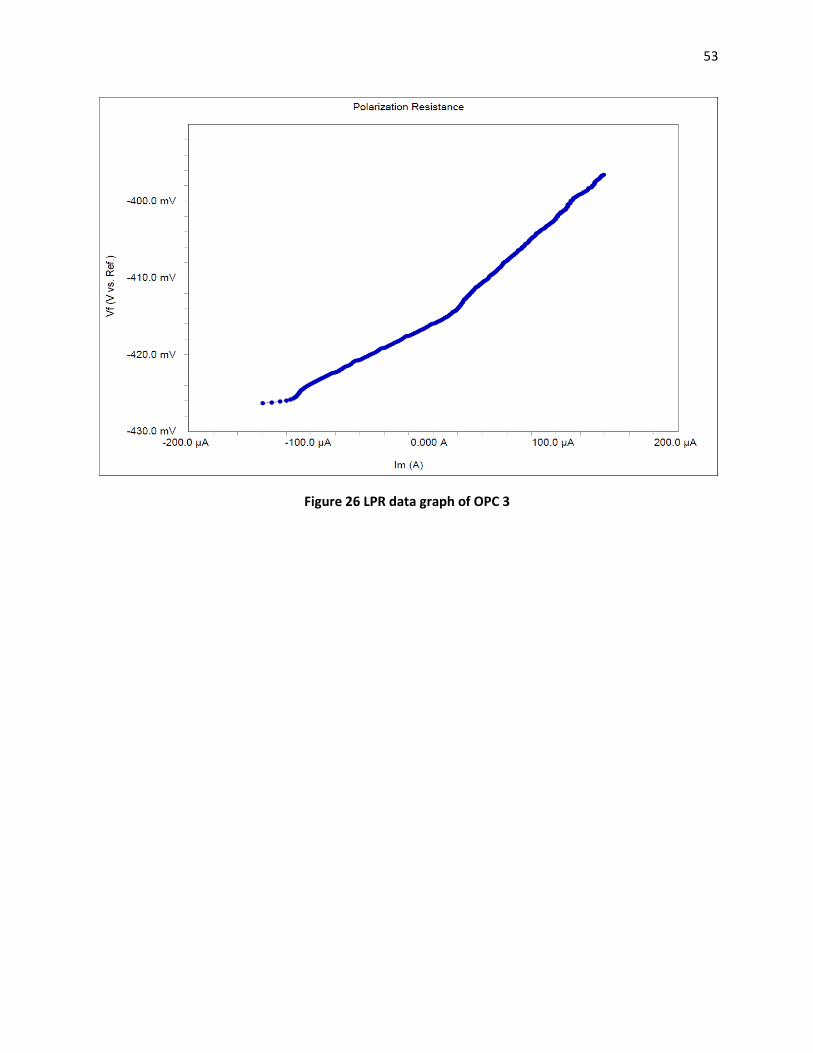
53
Figure 26 LPR data graph of OPC 3