Profiling Event Logs to Configure Risk Indicators for Process Delays Anastasiia Pika 1 , Wil M. P. van der Aalst 2,1 , Colin J. Fidge 1 , Arthur H. M. ter Hofstede 1,2 , and Moe T. Wynn 1 1 Queensland University of Technology, Brisbane, Australia {a.pika,c.fidge,a.terhofstede,m.wynn}@qut.edu.au 2 Eindhoven University of Technology, Eindhoven, The Netherlands {w.m.p.v.d.aalst}@tue.nl Abstract. Risk identification is one of the most challenging stages in the risk management process. Conventional risk management approaches provide little guidance and companies often rely on the knowledge of ex- perts for risk identification. In this paper we demonstrate how risk indi- cators can be used to predict process delays via a method for configuring so-called Process Risk Indicators (PRIs). The method learns suitable configurations from past process behaviour recorded in event logs. To validate the approach we have implemented it as a plug-in of the ProM process mining framework and have conducted experiments using various data sets from a major insurance company. Keywords: process risk indicators, process mining, risk identification 1 Introduction Managing risks is one of the top priorities in corporate and government organ- isations 3 . According to ISO Guide 73:2009, risk is the “effect of uncertainty on objectives” where an effect is “a deviation from the expected — positive and/or negative” [6]. Risk identification is an essential starting point for risk manage- ment. It is defined as a “process of finding, recognizing and describing risks” [6]. Although many risk management approaches provide high-level guidance about risk management strategy, they do not provide any tools to operationalize this strategy [12, 15]. Standard ISO 31000 specifies that “risk identification can in- volve historical data” [15], however it does not provide any further guidelines on how to use historical data. Managing business processes is another important concern of an organisation. Business processes are exposed to different risks. For instance, a process may not be finished within the time-frame defined by a service level agreement, it may produce low-quality results, or it may exceed its budget. We refer to risks that threaten the achievement of process goals as process-related. Most organisations 3 http://www.gartner.com/id=1957716, Gartner report “CEO Survey 2012: CIOs Must Link Risk Management and Compliance to Business Priorities”
Transcript
Profiling Event Logs to ConfigureRisk Indicators for Process Delays
Anastasiia Pika1, Wil M. P. van der Aalst2,1, Colin J. Fidge1,Arthur H. M. ter Hofstede1,2, and Moe T. Wynn1
1 Queensland University of Technology, Brisbane, Australia{a.pika,c.fidge,a.terhofstede,m.wynn}@qut.edu.au
2 Eindhoven University of Technology, Eindhoven, The Netherlands{w.m.p.v.d.aalst}@tue.nl
Abstract. Risk identification is one of the most challenging stages inthe risk management process. Conventional risk management approachesprovide little guidance and companies often rely on the knowledge of ex-perts for risk identification. In this paper we demonstrate how risk indi-cators can be used to predict process delays via a method for configuringso-called Process Risk Indicators (PRIs). The method learns suitableconfigurations from past process behaviour recorded in event logs. Tovalidate the approach we have implemented it as a plug-in of the ProMprocess mining framework and have conducted experiments using variousdata sets from a major insurance company.
Keywords: process risk indicators, process mining, risk identification
1 Introduction
Managing risks is one of the top priorities in corporate and government organ-isations3. According to ISO Guide 73:2009, risk is the “effect of uncertainty onobjectives” where an effect is “a deviation from the expected — positive and/ornegative” [6]. Risk identification is an essential starting point for risk manage-ment. It is defined as a “process of finding, recognizing and describing risks” [6].Although many risk management approaches provide high-level guidance aboutrisk management strategy, they do not provide any tools to operationalize thisstrategy [12, 15]. Standard ISO 31000 specifies that “risk identification can in-volve historical data” [15], however it does not provide any further guidelines onhow to use historical data.
Managing business processes is another important concern of an organisation.Business processes are exposed to different risks. For instance, a process may notbe finished within the time-frame defined by a service level agreement, it mayproduce low-quality results, or it may exceed its budget. We refer to risks thatthreaten the achievement of process goals as process-related. Most organisations
3 http://www.gartner.com/id=1957716, Gartner report “CEO Survey 2012: CIOsMust Link Risk Management and Compliance to Business Priorities”
use information systems supporting their operational business processes. Oftenthese systems also record information about process executions in event logs.Our belief is that this information can be exploited for the identification ofprocess-related risks.
In our preliminary work [14] we introduced the idea of using Process RiskIndicators (PRIs) to predict whether a deadline transgression is likely to happenor not. For example, if an activity is repeated multiple times for a case, thenthe likelihood of delay is significantly higher. We also introduced a method forinstantiating these indicators from event logs based on statistical techniques foroutlier detection. However, our initial experiments showed that further work isrequired to properly calibrate the indicators to reduce the number of “false pos-itives”, i.e., cases that are predicted to be late but in the end are not. In thispaper we present a novel method for configuration of PRIs that uses informa-tion about outcomes from cases executed in the past. The method aligns theseindicators with the specifics of a particular process to minimize the number offalse positives. We demonstrate the feasibility of the proposed approach usingcase studies with data sets from an Australian insurance company (Suncorp).
The remainder of the paper is organized as follows. Section 2 discusses re-lated work. The general approach to process risk identification is presented inSection 3 followed by a description of eight PRIs. We then show how to configurethese PRIs using information about the outcomes of cases in the past. Section 4discusses our implementation in ProM and reports on our experimental results.Section 5 concludes the paper.
2 Related and Previous Work
Few approaches exist that aim to identify and/or assess process risks [7, 8, 21].Wickboldt et al. proposed a framework that uses process execution data forrisk assessment [21]. Risk assessment modules of the framework use informationabout risk events reported during past activity executions. Our approach alsopredicts future risks based on past behaviours, but it does not require risk-relatedinformation to be explicitly stored. Jallow et al. [7] proposed a framework foridentification of operational process risks. However, estimation of the probabili-ties and impacts associated with risk-related activities was assumed to be doneby experts. Our approach avoids subjective opinions and learns such values fromhistoric event data. Jans et al. [8] proposed using process mining for the identi-fication of one particular type of risk (transactional fraud risk) and showed thatavailable process mining tools can help auditors detect fraud. By contrast, ourapproach focuses on quantifiable values such as delays or product quality and itemphasises automatable techniques for risk identification that can be used forrun-time operational support [16].
Van Dongen et al. proposed an approach for predicting the remaining cycletime of a case by applying non-parametric regression and using case data aspredictor variables [20]. The approach for predicting remaining process timeproposed by van der Aalst et al. [18] is based on building an annotated transition
system and estimating the average remaining time of cases that visited the samestate previously. In contrast, our approach predicts the likelihood of case delayrather than the remaining execution time.
Grigori et al. presented a set of integrated tools that help manage processexecution quality supporting such features as analysis and prediction [3]. Inother work they propose a method for exception analysis, prediction, and pre-vention [4]. A common feature of these approaches is that it is the responsibilityof users to specify what process properties (conditions, exceptions etc.) theywould like to analyse. Our approach does not require such input and is based ona set of risk indicators.
In our own earlier work we introduced the idea of using Process Risk Indi-cators for predicting case delays and proposed a method for instantiation of theindicators from event logs [14]. The method is based on statistical techniquesfor outlier detection. It used a simple analysis which assumed that process be-haviours have normal distributions with fixed thresholds being sufficient to iden-tify “risky” behaviours. Our initial experiments revealed that risk indicators canbe used to predict case delays [14], but further work is required to properlycalibrate the indicators to reduce the number of false positives. In this paperwe present a method for configuration of risk indicators for process delays thatsignificantly improves precision of case delays predictions.
3 Risk Identification Method
3.1 Approach
Our goal is to develop a method that can identify the risk of delay for runningcases with a high degree of precision. Our method analyses characteristics ofa current case, compares them with characteristics of similar cases executedin the past and predicts a case delay if a “risky” behaviour is detected. Ouroverall approach consists of three major steps: (1) define Process Risk Indicators;(2) configure PRIs; (3) identify the presence of PRI instances in a current case.
First, we need to identify which behaviour of a process can be considered“risky”. In our initial work we introduced the use of Process Risk Indicators(PRIs) for predicting case delays. We defined a PRI as “a pattern observablein an event log whose presence indicates a higher likelihood of some process-related risk” [14]. For example, an unusually large number of activity repetitionsper case may indicate a likely case delay or low-quality output because thereseems to be a problem processing this case.
In our preliminary work we also introduced a method for identifying the pres-ence of a PRI based on the “sample standard deviations” approach for outlierdetection [14]. For each PRI we defined cut-off thresholds as x`2s. Observationswhose values are higher than this value were considered outliers. A limitation ofthe method is the assumption that some particular process behaviour follows anormal distribution (e.g., activity repetitions in a case) which may not be validin many cases. We also assumed that atypical behaviour of a process can be
considered “risky”, e.g. when some activity in a case has an atypically long du-ration it signals a higher likelihood of the case delay. However, while conductinginitial experiments we learned that though atypical behaviour is often associatedwith case delays it is not always “risky”. For example, if a process contains anautomated activity which typically takes a very small amount of time comparedto the total time that cases take, then variations to the execution time of suchan activity, even relatively large ones, do not affect the case duration.
To overcome these weaknesses of our initial work we present here a methodfor configuration of indicators so that the specific characteristics of a particularprocess are taken into account. We again use cut-off thresholds to identify “risky”behaviours, however we introduce a way of learning the threshold values by usinginformation about outcomes of cases in the past. The method allows us to identifyatypical process behaviour that has been often associated with case delays in thepast rather than assuming any outlier indicates a risk.
3.2 Process Risk Indicators (PRIs)
A PRI is a pattern that signals an increased likelihood of some process-relatedrisk and which can be identified by analysing an event log. In our previouswork [14] we introduced the idea of using Process Risk Indicators to identify therisk of case delay. For the purpose of this paper we use several indicators thatcan be discovered using basic event logs, information about case outcomes andprocess models, all of which were available to us in our industrial case study.Below we define eight Process Risk Indicators for process delays.
PRI 1: Atypical activity execution time. The duration of an activity sig-nificantly exceeds its typical duration. An activity may take more time thanusual due to human factors: an employee executing the activity may be inex-perienced or occupied with many other tasks. Fatigue is a common factor thatmay cause a delay. Another reason can be a complex or exceptional case thatrequires additional investigation/learning. Activity delay is also often caused bya third party’s involvement—reducing the number of contacts with third partiesis one of Business Process Re-engineering’s best practices [11].
PRI 2: Atypical waiting time. An activity has not been started for anatypically long period of time. One possible explanation for long waiting timesis a lack of available resources. Another possible reason is the “too hard basket”syndrome, i.e., the situation where no one is willing to start an activity as itis perceived to be too challenging or time consuming. Also, some employeestend to process certain tasks in batches, which may increase a particular task’swaiting time. A typical example is an approval task. Removing batch-processingis another of the BPR best practices [11], as is reducing waiting times becausethese often occupy 95% of the throughput time of a case [9].
PRI 3: Multiple activity repetitions. The number of times an activity isrepeated in a case significantly exceeds its usual value. It may be necessary
to repeat an activity if previous attempts fail. This can happen due to thirdparty involvement, e.g., not receiving an expected service from subcontractorsor failure to provide required information by a client. Employees may also needto repeat a task because of inexperience or complex case requirements.
PRI 4: Presence of a “risky” activity. A case contains a “risky” activity.An activity is considered “risky” if the majority of the cases that containedthis activity in the past have been delayed. Execution of a “risky” activity maybe related to a case’s specifics. For example, consultation with an expert or amanager may be required for an exceptionally complex case.
PRI 5: Multiple resource involvement. More resources are involved in acase than usually. One possible reason for such a situation is the so-called “hotpotato” phenomenon where a case is forwarded between different resources be-cause nobody is willing to take charge of it. Atypically high resource involvementcan also be needed for a very complex case. Reducing the number of parties in-volved in a case is another of the BPR best practices [11]. Balasubramanian etal. name frequent hand-overs of work between people in a process as one of thefactors that can lead to time overruns [2].
PRI 6: Atypical sub-process duration. The sum of activity duration and itswaiting time in a case (referred to here as a sub-process) is significantly higherthan its typical value. We introduce this indicator to be able to work with eventlogs that only record “complete” events for activities, as is often the case for realevent logs. This indicator tackles the same issues as PRIs 1 and 2.
PRI 7: High resource workload. An activity has been assigned to or startedby a resource with a high workload. The workload of a resource at a point intime is the number of items that were started by or assigned to the resource butnot yet completed. High resource workload is often mentioned in the literatureas a reason for such risks as time overruns or low-quality outputs [5, 13].
PRI 8: Use of a “risky” resource. An activity has been assigned to orstarted by a“risky” resource. A “risky” resource for some activity is the one thatwas often involved in execution of this activity in delayed cases. Some humanresources may be incompetent or inexperienced when it comes to the execution ofsome activities in a process. It is important to use recent data for identificationof this PRI as the qualification levels and experience of resources will changeover time. Another reason for a resource to be considered risky is a tendency topostpone execution of certain activities, e.g., approval tasks.
3.3 Configuring Process Risk Indicators
Our method for configuration of indicators requires information about knownoutcomes from cases that happened in the past, i.e., whether they were delayedor completed in time. We aim to find for the PRIs the values of parameters that
could predict delays with a required degree of precision in the past. If we cannotdetect such values for an indicator then it is not used for a particular process.
An input parameter to our method is a desired precision level. Precision is thefraction of cases predicted to be delayed that are actually delayed. Increasingprecision is usually done at the expense of decreasing recall, which is definedas the fraction of delayed cases that can be successfully predicted against theactually delayed cases. If a user deals with a critical process, he may prefermonitoring alerts with lower precision levels in order to increase recall, while fora non-critical process he may want to check only those alerts that indicate avery high likelihood of a case delay.
For each relevant process behaviour (e.g., the number of activity repetitionsin a case) we look for the smallest value that allows distinguishing betweendelayed and in time cases with a required degree of precision. This value is usedas a cut-off threshold. In order to define this threshold we need to check theeffectiveness of various candidate values. However, there could be a wide rangeof these. Analysing past logs can be time consuming, so in order to reduce thesearch space we learn cut-off thresholds for the PRIs by checking only thosevalues from a pool of selected candidates. We use the following heuristic todefine candidate values. First, we discard those values lower than the mean x(which gives us a measure of central tendency). We then include those valuescalculated as x ` n ˚ s, where s is the standard deviation (as a measure ofstatistical dispersion), and n is in the range of 0 to 10 with an increment of 0.25(these values were used for the experiments, they are input parameters). We donot necessarily assume a normal distribution. Nevertheless, these conventionalstatistical measures provide a natural starting point for searching for thresholds.We then check all values from the defined pool of candidates.
We are interested in indicators that can predict delays during a case’s exe-cution. Therefore, while learning parameters of PRIs from past execution data,our method considers only those events that happened before a deadline, i.e., wediscard activities that have been started after the deadline has been missed.
As an example of the calculation, consider PRI 5 “ Multiple resource involve-ment”. PRI 5 is a case-based PRI, i.e., it can have only one value per case andwe define one cut-off threshold. In order to identify and use PRI 5 the followingsteps are performed:
1. Define candidate values T for the cut-off threshold t:(a) Identify average number of resources involved in a case before deadline
(x) and standard deviation s of the population.(b) T fi tx` n ˚ s | n P t0, 0.25, 0.50, ..., 10uu
2. Define the cut-off threshold t:For each ti P T :(a) Collect a subset Ctrue of the training set comprising all cases that are
delayed and whose number of resources involved before the deadline ishigher than ti;
(b) Collect a subset Cfalse of the training set comprising all cases that arein time and whose number of resources is higher than ti;
(c) pi “
#
|Ctrue|{p|Ctrue| ` |Cfalse|q, if p|Ctrue| ` |Cfalse|q ą 0
0 otherwise.
Here t = arg mintiPT ppi ą pq, where p is the desired precision level.
3. Check the number of resources involved in the current case and alert a like-lihood of a case delay if the number is higher than the value of the learnedthreshold t.
For activity-based PRIs such as PRI 1 (“Atypical activity execution time”),PRI 2 (“Atypical waiting time”), PRI 3 (“Multiple activity repetitions”) andPRI 6 (“Atypical sub-process duration”) a similar procedure is repeated foreach activity to learn proper thresholds. A case can have multiple instancesof an activity-based PRI, e.g., several activities may be delayed or repeated.We consider that there is a chance of a case delay if the case contains at leastone instance of an activity-based PRI. For resource-based PRI 7 “High resourceworkload” we learn appropriate values for cut-off thresholds for each resource. Ifin a current case an activity is assigned to or started by a resource with a highworkload (defined by the learned threshold), a case delay is more likely.
PRIs 4 and 8 do not follow the general procedure described above. These areexamples of indicators that can only be identified using information about theoutcomes of cases in the past. To identify PRI 4 “Presence of a risky activity”we check if there exists an activity that is executed mainly in delayed cases. ForPRI 8 we check for each pair “activity-resource” if some resource’s involvementin the execution of an activity mainly occurs in delayed cases. Then we checkif a current case contains a “risky” activity or if an activity is assigned to a“risky” resource. Identification of such behaviour signals increased likelihood ofcase delay.
4 Validation Using Real Event Logs
4.1 Experimental Setup
To estimate the quality of case delay predictions by our method we use hold-outcross-validation [10]. This is a commonly used statistical practice that impliespartitioning of data into two subsets, where one subset is used for initial learn-ing (a training set), and the results are validated using the other subset (a testset). To facilitate validation of our approach we have implemented a plug-inof the process mining framework ProM 64. The plug-in takes as an input twoevent logs. It uses one log as a training set to configure the PRIs, then it anal-yses cases in the other log (a test set) to identify occurrences of these PRIs.An input parameter is the expected case duration. Cases that take longer thanthis value are considered to be delayed. If any of the indicators is found in acase it is predicted to be delayed. We compare predicted case delays with the
4 http://www.promtools.org/prom6/
actual case durations and evaluate the performance of the process risk identifica-tion method by estimating the values of “precision” and “recall”. These metricsare often used in different machine learning areas to estimate performance ofprediction techniques. Precision is calculated as the fraction of cases correctlypredicted to be delayed against the total number of cases predicted to be de-layed. Recall is calculated as the fraction of delayed cases that are successfullypredicted against the number of cases that are actually delayed. These values arecalculated separately for each indicator to evaluate their individual performance.We also calculate the values of precision and recall for all indicators combinedto evaluate their cumulative performance.
We used two different approaches to splitting data into a training set and atest set. In one approach, we split event logs randomly, such that 75% of caseswere put into a training set and 25% of cases in a test set (referred to lateras a “random” split). In the other approach, cases that were completed duringone period of time (four months) were put into a training set while cases thatwere started within the next period (two months) were put into the test set(referred to later as a “time” split). As our approach is based on learning frompast execution data it is important to use large data sets for training, thereforewe decided to put more data in the training set while still having enough datain the test set for meaningful validation.
Before applying our method for risk identification it is important to performdata pre-processing. Processes tend to evolve over time. To avoid learning fromoutdated information recent data should be used. For our experiments we pickedcases that were active over the same period of six months. The algorithm shoulduse only completed cases to properly configure PRIs, therefore partial tracesrepresenting running process instances should be filtered out. The results of anyprocess mining algorithm depend on input data, therefore the quality of event logdata is crucial [1]. For example, if event log data contains mislabelled activities,the performance of the algorithm may be affected, therefore it is important toclean event log first (e.g., filtering out mislabelled events). It is also important toseparately analyse cases that are executed in different contexts that affect theirdurations. For example, the expected case duration may depend on the type ofcustomer (“gold” versus “silver”) or type of service (“premium” versus “nor-mal”). If such execution contexts are known, event log data should be first splitand cases that are executed in different contexts should be analysed separately.
4.2 Data Properties and Preprocessing
We evaluated our approach using two data sets from Suncorp, a large Australianinsurance company. Both data sets represent insurance claim processes fromdifferent organisational units, referred to here as data set A and data set B.Both event logs provided by Suncorp contained only completed cases. Data setB contains cases from five departments and was split into five sets (referred tohere as B1–B5) which were used in separate experiments. Each data set (A,B1–B5) was split into a training set and a test set. The training set was used bythe algorithm for learning the cut-off thresholds. Cases in the test set were usedfor evaluating the performance of the PRIs.
We first cleaned up the data sets by filtering out cases with activities thatappear only once in the whole log. In most cases, such activities were not reallyunique though their label was. Typically this was a consequence of combining anactivity’s name with the name of the employee who executed that activity. Weused original unfiltered data sets to more accurately estimate resource workloads(required for PRI 7).
To more accurately estimate waiting times (for PRIs 2 and 6) we used processmodels. We first identified the pre-set of an activity, i.e. the set of activities thatcan directly precede a given activity. We then calculated the waiting time for theactivity as the difference between its “start” time and the “complete” time ofthe last activity from its pre-set preceding it in the case. Since we did not haveprocess models, we instead used process mining to discover them from the eventlogs. First we filtered the logs so that they contained only cases representingmainstream process behaviour and used these filtered logs to discover processmodels represented by Petri nets with one of the ProM process mining plug-ins [19]. For data set A we used 95% of the cases representing the most frequentprocess variants. Data sets B1–B5 proved to have a large variety of processvariants. For these data sets only those cases were used for process discoverythat share the same process variant with at least four other cases. These filteredlogs were only used for process discovery and not in the experiments.
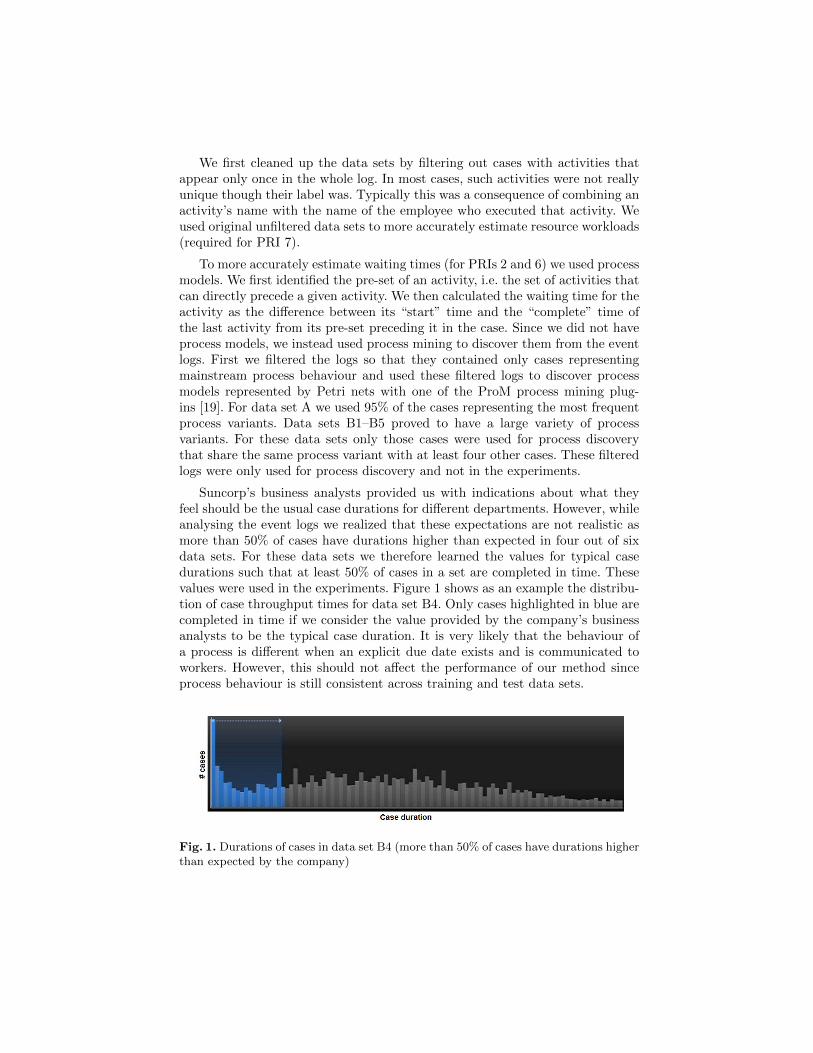
Suncorp’s business analysts provided us with indications about what theyfeel should be the usual case durations for different departments. However, whileanalysing the event logs we realized that these expectations are not realistic asmore than 50% of cases have durations higher than expected in four out of sixdata sets. For these data sets we therefore learned the values for typical casedurations such that at least 50% of cases in a set are completed in time. Thesevalues were used in the experiments. Figure 1 shows as an example the distribu-tion of case throughput times for data set B4. Only cases highlighted in blue arecompleted in time if we consider the value provided by the company’s businessanalysts to be the typical case duration. It is very likely that the behaviour ofa process is different when an explicit due date exists and is communicated toworkers. However, this should not affect the performance of our method sinceprocess behaviour is still consistent across training and test data sets.
Fig. 1. Durations of cases in data set B4 (more than 50% of cases have durations higherthan expected by the company)
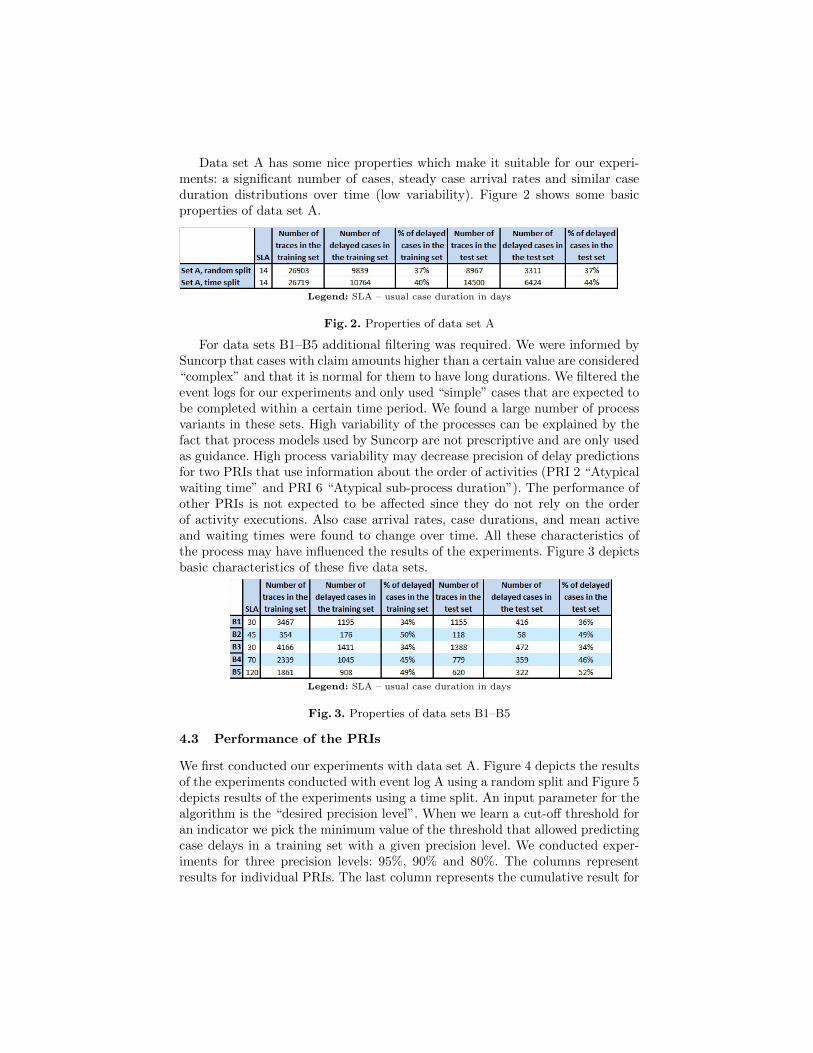
Data set A has some nice properties which make it suitable for our experi-ments: a significant number of cases, steady case arrival rates and similar caseduration distributions over time (low variability). Figure 2 shows some basicproperties of data set A.
Legend: SLA – usual case duration in days
Fig. 2. Properties of data set A
For data sets B1–B5 additional filtering was required. We were informed bySuncorp that cases with claim amounts higher than a certain value are considered“complex” and that it is normal for them to have long durations. We filtered theevent logs for our experiments and only used “simple” cases that are expected tobe completed within a certain time period. We found a large number of processvariants in these sets. High variability of the processes can be explained by thefact that process models used by Suncorp are not prescriptive and are only usedas guidance. High process variability may decrease precision of delay predictionsfor two PRIs that use information about the order of activities (PRI 2 “Atypicalwaiting time” and PRI 6 “Atypical sub-process duration”). The performance ofother PRIs is not expected to be affected since they do not rely on the orderof activity executions. Also case arrival rates, case durations, and mean activeand waiting times were found to change over time. All these characteristics ofthe process may have influenced the results of the experiments. Figure 3 depictsbasic characteristics of these five data sets.
Legend: SLA – usual case duration in days
Fig. 3. Properties of data sets B1–B5
4.3 Performance of the PRIs
We first conducted our experiments with data set A. Figure 4 depicts the resultsof the experiments conducted with event log A using a random split and Figure 5depicts results of the experiments using a time split. An input parameter for thealgorithm is the “desired precision level”. When we learn a cut-off threshold foran indicator we pick the minimum value of the threshold that allowed predictingcase delays in a training set with a given precision level. We conducted exper-iments for three precision levels: 95%, 90% and 80%. The columns representresults for individual PRIs. The last column represents the cumulative result for
all indicators: a case is predicted to be delayed if any of the indicators is foundin the case. For a desired precision level the first two rows represent the numberof True Positives (TP ) and the number of False Positives (FP ) produced. Thesepredictions are produced before expiry of the deadline. The next two rows arethe number of False Negatives (FN) and the number of True Negatives (TN).TP `FP is the number of cases predicted to be delayed. The precision is calcu-lated as the fraction TP
TP`FP . TP ` FN is the number of cases actually delayedand can be used to compute the recall which is the fraction of delayed cases thatare successfully predicted and the actually delayed cases, i.e., TP
TP`FN . Figures 4and 5 show both precision and recall values for the test sets.
Fig. 4. Performance of the PRIs in data set A. “Random” split experiment
The results of the experiments for the two different types of event log splitwere comparable in terms of the indicators’ performance. Most predictions inboth cases came from PRIs 1, 2 and 6. Some delays were indicated by PRIs 4and 8. Poorly performing indicators for this data set were PRIs 3, 5 and 7. In thevast majority of cases it was only possible to identify PRIs 3 (“Multiple activityrepetitions”) and 5 (“Multiple resource involvement”) after the deadline wasmissed. One of the reasons for the poor performance of PRI 7 (“High resourceworkload”) for this log may be the fact that we do not have all data for theprocess (incomplete cases were filtered out). We also assumed that resourcesare involved full-time in this one particular process which may not be true.Figures 4 and 5 also demonstrate the number of delays that can be predicted withthese indicators for different precision levels. In the “random” split experimentit can be observed that lowering the desired precision level leads to a decrease inprecision and an increase in recall. While this can also be observed in the “time”split experiment the decrease of precision is more pronounced while the increasein recall is less.
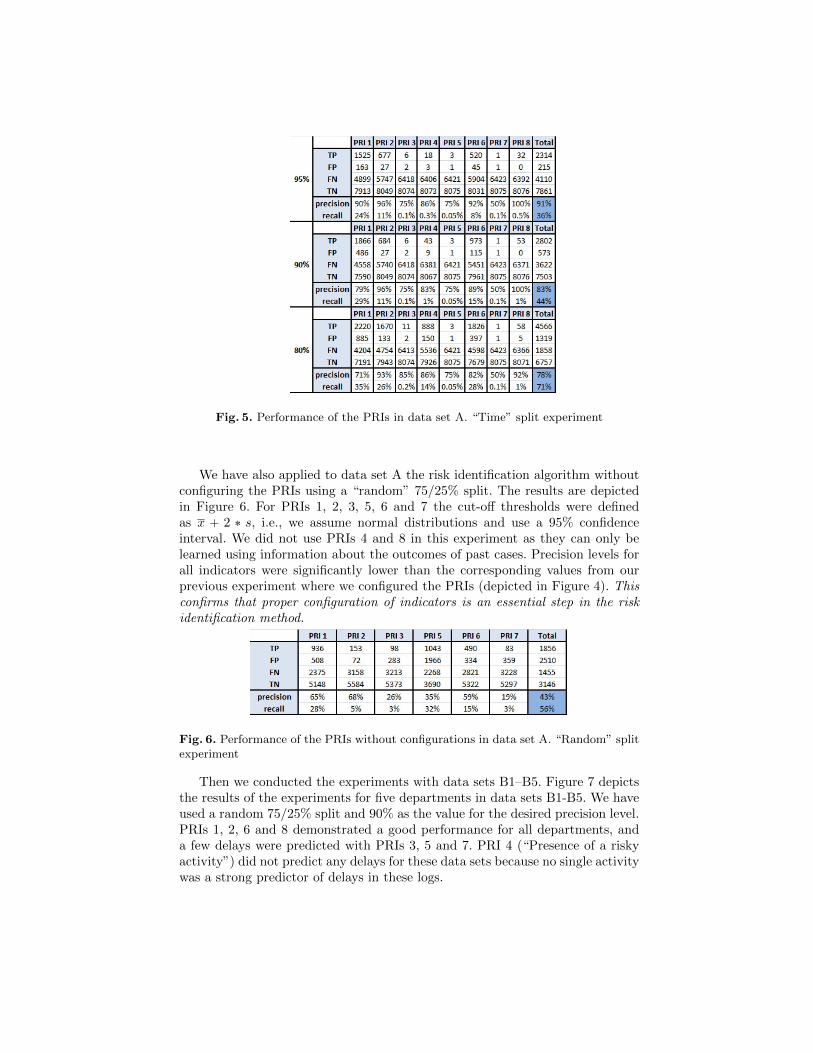
Fig. 5. Performance of the PRIs in data set A. “Time” split experiment
We have also applied to data set A the risk identification algorithm withoutconfiguring the PRIs using a “random” 75/25% split. The results are depictedin Figure 6. For PRIs 1, 2, 3, 5, 6 and 7 the cut-off thresholds were definedas x ` 2 ˚ s, i.e., we assume normal distributions and use a 95% confidenceinterval. We did not use PRIs 4 and 8 in this experiment as they can only belearned using information about the outcomes of past cases. Precision levels forall indicators were significantly lower than the corresponding values from ourprevious experiment where we configured the PRIs (depicted in Figure 4). Thisconfirms that proper configuration of indicators is an essential step in the riskidentification method.
Fig. 6. Performance of the PRIs without configurations in data set A. “Random” splitexperiment
Then we conducted the experiments with data sets B1–B5. Figure 7 depictsthe results of the experiments for five departments in data sets B1-B5. We haveused a random 75/25% split and 90% as the value for the desired precision level.PRIs 1, 2, 6 and 8 demonstrated a good performance for all departments, anda few delays were predicted with PRIs 3, 5 and 7. PRI 4 (“Presence of a riskyactivity”) did not predict any delays for these data sets because no single activitywas a strong predictor of delays in these logs.
Fig. 7. Performance of the PRIs in data sets B1-B5. “Random” split experiment
4.4 Moment of Delay Prediction
We also evaluated the ability to predict delays early during a case’s executionwhich is obviously a highly desirable capability. In order to do so we checkedhow many true positive and false positive predictions (coming from any of theindicators) were generated before a given point in time during a case’s execution,to find the earliest point when we can identify risks. Since the event logs availableto us do not have “assign” events recorded, we consider the time of the “start”event for an activity to be the discovery time for PRIs 3, 4, 5, 7 and 8, e.g., whenan activity has been started by a “risky” resource (PRI 8), or by a resource with ahigh workload (PRI 7). The earliest time when we can observe PRI 1 (“Atypicalactivity duration”) is the time of the “start” event of an activity plus the valueof PRI 1’s threshold for this activity. For example, if an activity is not completedwithin three days (the threshold value) after it has been started there is a higherlikelihood of the case delay, i.e., at this point we can already predict delay. Theearliest time when PRI 2 (“Atypical waiting time”) can be observed is either the
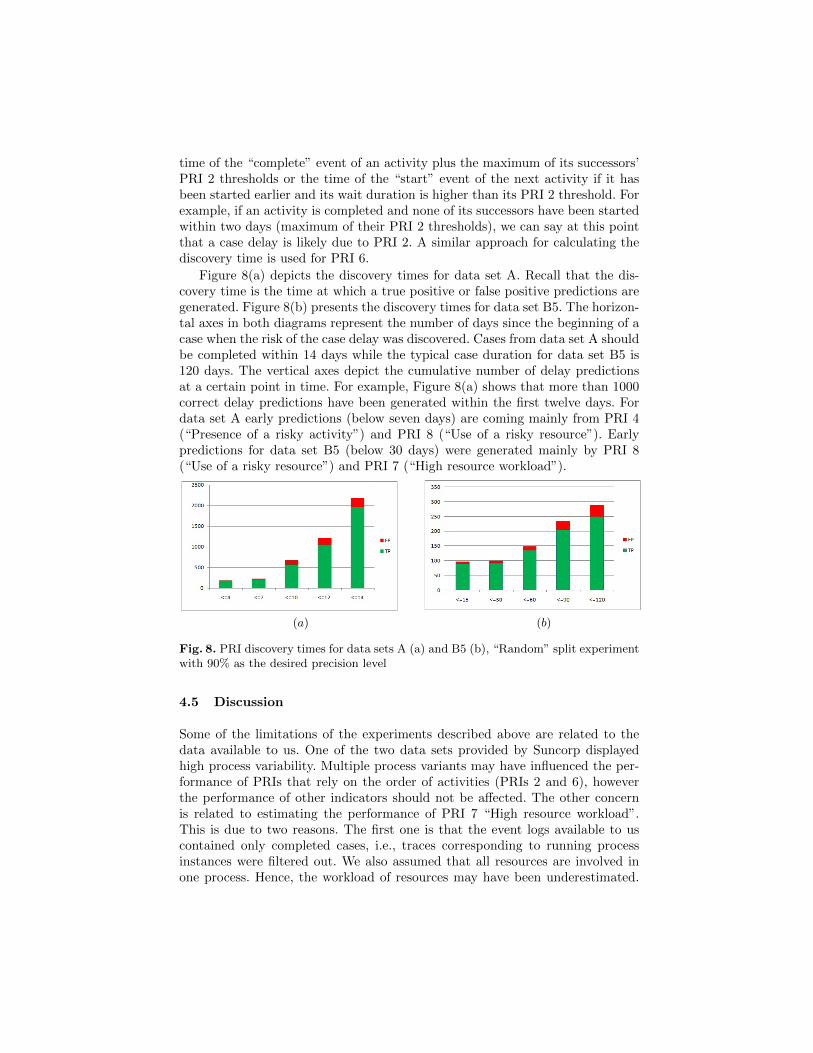
time of the “complete” event of an activity plus the maximum of its successors’PRI 2 thresholds or the time of the “start” event of the next activity if it hasbeen started earlier and its wait duration is higher than its PRI 2 threshold. Forexample, if an activity is completed and none of its successors have been startedwithin two days (maximum of their PRI 2 thresholds), we can say at this pointthat a case delay is likely due to PRI 2. A similar approach for calculating thediscovery time is used for PRI 6.
Figure 8(a) depicts the discovery times for data set A. Recall that the dis-covery time is the time at which a true positive or false positive predictions aregenerated. Figure 8(b) presents the discovery times for data set B5. The horizon-tal axes in both diagrams represent the number of days since the beginning of acase when the risk of the case delay was discovered. Cases from data set A shouldbe completed within 14 days while the typical case duration for data set B5 is120 days. The vertical axes depict the cumulative number of delay predictionsat a certain point in time. For example, Figure 8(a) shows that more than 1000correct delay predictions have been generated within the first twelve days. Fordata set A early predictions (below seven days) are coming mainly from PRI 4(“Presence of a risky activity”) and PRI 8 (“Use of a risky resource”). Earlypredictions for data set B5 (below 30 days) were generated mainly by PRI 8(“Use of a risky resource”) and PRI 7 (“High resource workload”).
paq pbq
Fig. 8. PRI discovery times for data sets A (a) and B5 (b), “Random” split experimentwith 90% as the desired precision level
4.5 Discussion
Some of the limitations of the experiments described above are related to thedata available to us. One of the two data sets provided by Suncorp displayedhigh process variability. Multiple process variants may have influenced the per-formance of PRIs that rely on the order of activities (PRIs 2 and 6), howeverthe performance of other indicators should not be affected. The other concernis related to estimating the performance of PRI 7 “High resource workload”.This is due to two reasons. The first one is that the event logs available to uscontained only completed cases, i.e., traces corresponding to running processinstances were filtered out. We also assumed that all resources are involved inone process. Hence, the workload of resources may have been underestimated.
In order to more accurately estimate the performance of this PRI complete in-formation about all processes in a company is required. This limitation shouldnot affect the performance of other indicators.
A limitation of the approach is our assumption that a process is in a steadystate, i.e. it is not changing over time. To deal with this limitation in this paperwe used data from a relatively short period (six months). However, if a process’sbehaviour is constantly changing, the amount of available up-to-date data maybe insufficient for proper configuration of PRIs.
We considered instance and process contexts, however we did not considersocial and external contexts using the terminology of [17], that may also influencecase durations. This is a direction for possible future research. Another directionfor future work is to investigate the relation between PRIs and the extent of theexpected delay.
5 ConclusionsIn this paper, we presented a method for configuration of risk indicators forprocess delays. The method learns parameters of indicators by analysing eventlogs and exploiting information about the outcomes of cases completed in thepast. Such configuration of indicators takes the specifics of a particular processinto account thus improving the accuracy of the predictions. We conducted anumber of experiments with different data sets from an Australian insurancecompany that confirmed that this approach decreases the level of false positivealerts and thus significantly improves the precision of case delay predictions.
The experiments demonstrated the ability to predict case delays with eightselected PRIs. Some of the indicators showed a consistently good performancein all data sets (e.g., PRIs 1, 2 and 6), others are good predictors of delays forsome processes but did not predict delays for others (e.g., PRIs 4, 7 and 8).PRIs 3 and 5 produced few predictions for this particular data set due to thefact that it was typically possible to discover these indicators after the deadlinewas missed. As is often the case in the data retrieval field, there is a trade-offbetween precision and recall. It is hard to predict more than 50% of case delayswith a high degree of precision using our indicators, while many delays can bepredicted with a degree of precision of 80%. We expect that our approach canbe applied for configuration of indicators for other types of process risks such ascost overruns or low-quality outputs, but this should be explored in future work.
Acknowledgements. This research is funded by the ARC Discovery Project“Risk-aware Business Process Management” (DP110100091). We would like tothank Suncorp for providing the data sets for analysis.
References
1. W.M.P. Aalst et al. Process mining manifesto. In Business Process ManagementWorkshops, pages 169–194. Springer, 2012.
2. S. Balasubramanian and M. Gupta. Structural metrics for goal based businessprocess design and evaluation. Business Process Management Journal, 11(6):680–694, 2005.
3. D. Grigori, F. Casati, M. Castellanos, U. Dayal, M. Sayal, and M.C. Shan. Businessprocess intelligence. Computers in Industry, 53(3):321–343, 2004.
4. D. Grigori, F. Casati, U. Dayal, and M.C. Shan. Improving business process qualitythrough exception understanding, prediction, and prevention. In 27th InternationalConference on Very Large Databases (VLDB 2001). Morgan Kaufmann PublishersInc., 2001.
5. J.G. Hollands and C.D. Wickens. Engineering psychology and human performance.Prentice Hall New Jersey, 1999.
6. International Organization for Standardization. Risk management: vocabulary =Management du risque: vocabulaire (ISO guide 73). Geneva, 2009.
7. A.K. Jallow, B. Majeed, K. Vergidis, A. Tiwari, and R. Roy. Operational riskanalysis in business processes. BT Technology Journal, 25(1):168–177, 2007.
8. M. Jans, N. Lybaert, K. Vanhoof, and J.M. van der Werf. A business processmining application for internal transaction fraud mitigation. Expert Systems withApplications, 38(10):13351–13359, 2011.
9. M.H. Jansen-Vullers and H.A. Reijers. Business process redesign in healthcare:Towards a structured approach. Quality Control and Applied Statistics, 52(1):99,2007.
10. Ron Kohavi et al. A study of cross-validation and bootstrap for accuracy estimationand model selection. In International joint Conference on artificial intelligence,volume 14, pages 1137–1145. Lawrence Erlbaum Associates Ltd, 1995.
11. S.L. Mansar and H.A. Reijers. Best practices in business process redesign: use andimpact. Business Process Management Journal, 13(2):193–213, 2007.
12. R. Moeller. COSO enterprise risk management: understanding the new integratedERM framework, chapter 3: Components of COSO ERM, pages 47–93. John Wiley& Sons, Inc., Hoboken, NJ, 2007.
13. J. Nakatumba and W.M.P. van der Aalst. Analyzing resource behavior using pro-cess mining. In Business Process Management Workshops, pages 69–80. Springer,2010.
14. A. Pika, W.M.P. van der Aalst, C.J. Fidge, A.H.M. ter Hofstede, and M.T. Wynn.Predicting deadline transgressions using event logs. In M. La Rosa and P. Sof-fer, editors, Proceedings of the Eighth International Workshop on Business ProcessIntelligence (BPI12), volume 132 of Lecture Notes in Business Information Pro-cessing, pages 211–216. Springer-Heidelberg, 2013.
15. Standards Australia and Standards New Zealand. Risk management: principlesand guidelines (AS/NZS ISO 31000:2009). Sydney, NSW, Wellington, NZ, 3rdedition, 2009.
16. W.M.P. van der Aalst. Process Mining: Discovery, Conformance and Enhancementof Business Processes. Springer-Verlag, Berlin, 2011.
17. W.M.P. van der Aalst and Schahram Dustdar. Process mining put into context.Internet Computing, IEEE, 16(1):82–86, 2012.
18. W.M.P. van der Aalst, M.H. Schonenberg, and M. Song. Time prediction basedon process mining. Information Systems, 36(2):450–475, 2011.
19. W.M.P. van der Aalst, T. Weijters, and L. Maruster. Workflow mining: Discov-ering process models from event logs. Knowledge and Data Engineering, IEEETransactions on, 16(9):1128–1142, 2004.
20. B. van Dongen, R. Crooy, and W.M.P. van der Aalst. Cycle time prediction: Whenwill this case finally be finished? On the Move to Meaningful Internet Systems:OTM 2008, pages 319–336, 2008.
21. J.A. Wickboldt, L.A. Bianchin, R.C. Lunardi, L.Z. Granville, L.P. Gaspary, andC. Bartolini. A framework for risk assessment based on analysis of historical infor-mation of workflow execution in it systems. Computer Networks, 55(13):2954–2975,2011.