“ Proactive Performance Monitoring for Citrix XenApp & XenDesktop TECHNOLOGY OVERVIEW In approximately one week, support tickets dropped by 25% ” Our customers were complaining about persistent slowness with Citrix. The Goliath team quickly identified the root cause of several issues and suggested remediation actions. Once we implemented them, our support tickets dropped by 25% in approximately one week. Chad Brisendine CIO of St. Luke’s University Health Network #324 Fortune 500
Transcript
“
Proactive Performance Monitoring for Citrix XenApp & XenDesktop
TECHNOLOGY OVERVIEW
In approximately one week,
support tickets dropped by 25%
” Our customers were complaining about persistent slowness with Citrix. The Goliath team quickly identified the root cause of several issues and suggested remediation actions. Once we implemented them, our support tickets dropped by 25% in approximately one week.
Purpose Built for Citrix Environments ................................................................................................. 3
Coexistence with Enterprise Monitoring Tools............................................................................... 4
Three Citrix Focused Products ............................................................................................................. 5
Purpose Built Monitoring for Citrix XenApp & XenDesktop ................................................................. 6
a . Topology View........................................................................................................................................................ 6
b . Real-Time Citrix Performance Graphs..................................................................................................................... 7
b. Real-Time XenApp & XenDesktop Session Display ..................................................................................................7
c. Real-Time ICA Channel Drill Down From Session Display ........................................................................................8
d. Real-Time Session Logon Duration Drill Down From Session Display …....................................................................8
e. Out-of-the-Box Monitoring Intelligence for Common Failure Points ....................................................................10
Proactive Functionality to Guarantee Citrix End User Experience by Predicting & Preventing ........... 11
a. Goliath Application Availability Monitor Dashboard & Drill Down .......................................................................11
Advanced Remediation Capabilities to Improve Troubleshooting & Help Desk
a. Threshold-Based Alerting ........................................................................................................................................12
b. Alert Resolution Feature .........................................................................................................................................12
c. Automated Remediation Actions .............................................................................................................................13
Goliath for NetScaler provides both Web Traffic Information Alongside Citrix Session Details .......... 14
a. Real-Time Web Traffic & Load Balance Dashboard.................................................................................................14
b. Alert on Faults & Errors...........................................................................................................................................14
c. Citrix Sessions Dashboard & Drill Down ..................................................................................................................15
d. Share Reports via Email, Live Share, or CSV ............................................................................................................16
This document highlights a few of the differentiating features Goliath offers that are currently unavailable with any other solutions in the marketplace and that have allowed organizations to more proactively manage their Citrix environments and the associated end user experience.
Purpose Built for Citrix Environments
Application & desktop virtualization brings a unique set of challenges to organizations that already leverage a complex combination of infrastructure technologies. Goliath’s solutions address the evolving challenges of managing Citrix environments by allowing IT professionals to proactively anticipate, troubleshoot, resolve and prevent performance issues for Citrix-specific elements as well as the supporting virtual and cloud infrastructures upon which they rely for application delivery.
In particular, Goliath’s solutions fill the gap left in the marketplace between simplistic native utilities/point products, and expensive, services-intensive enterprise solutions. As a Premier Citrix Ready Partner, Goliath works alongside Citrix product managers to bring to market solutions which allow Citrix customers to proactively manage and improve the experience for their Citrix XenApp and XenDesktop end users.
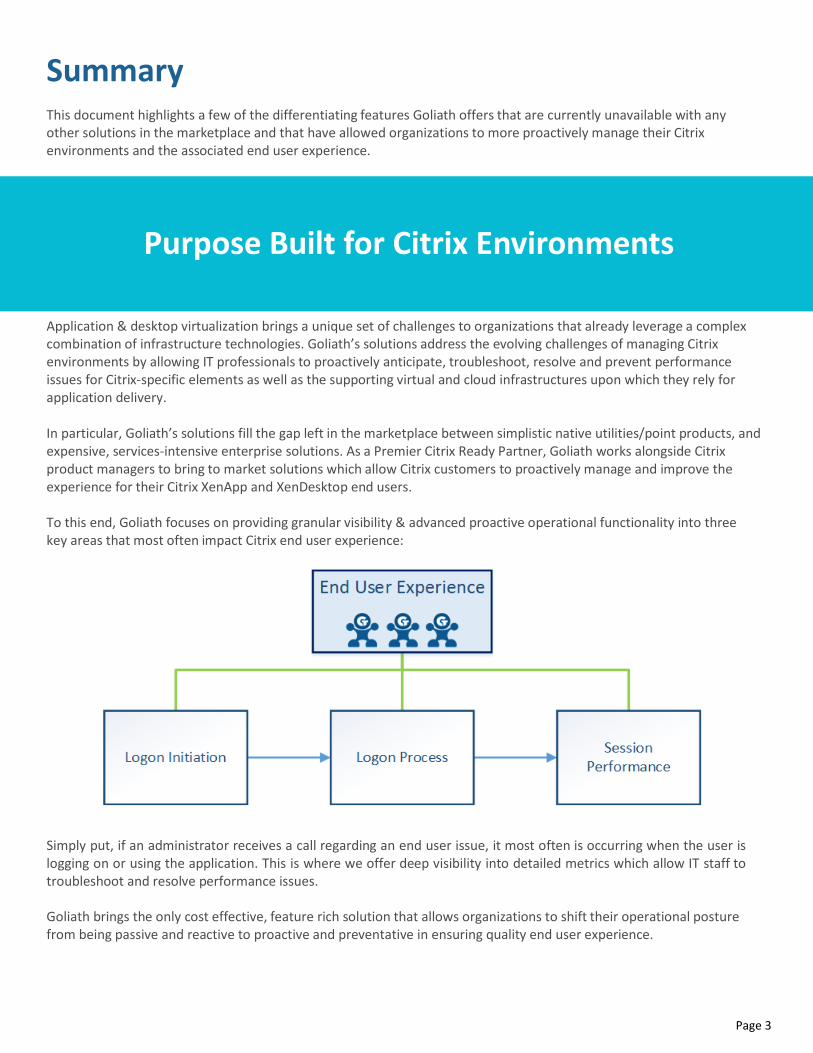
To this end, Goliath focuses on providing granular visibility & advanced proactive operational functionality into three key areas that most often impact Citrix end user experience:
Simply put, if an administrator receives a call regarding an end user issue, it most often is occurring when the user is logging on or using the application. This is where we offer deep visibility into detailed metrics which allow IT staff to troubleshoot and resolve performance issues.
Goliath brings the only cost effective, feature rich solution that allows organizations to shift their operational posture from being passive and reactive to proactive and preventative in ensuring quality end user experience.
Page 4
Co-existence with Enterprise Monitoring Tools
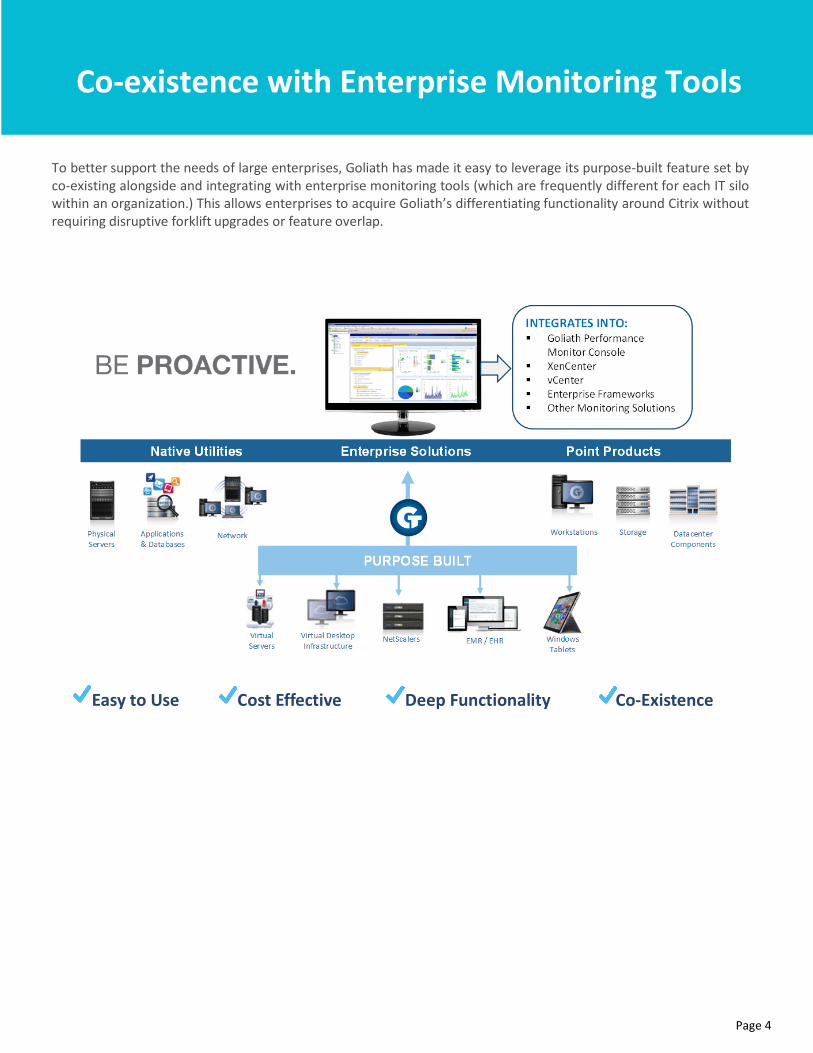
To better support the needs of large enterprises, Goliath has made it easy to leverage its purpose-built feature set by co-existing alongside and integrating with enterprise monitoring tools (which are frequently different for each IT silo within an organization.) This allows enterprises to acquire Goliath’s differentiating functionality around Citrix without requiring disruptive forklift upgrades or feature overlap.
Easy to Use Cost Effective Deep Functionality Co-Existence
Page 5
Three Citrix Focused Products
I. GOLIATH PERFORMANCE MONITOR
Proactive IT Performance Monitoring for Virtual Server, Virtual Desktop, Hybrid Cloud, and Mobile Environments
Goliath Performance Monitor provides complete support for monitoring virtual server, virtual desktop and hybrid cloud environments, and provides specialized modules for certain EHR and EMR applications. The technology has been architected from the ground up to help IT administrators anticipate issues before they become problems, troubleshoot and resolve problems quickly and with minimal end user impact when they do occur, and ultimately prevent them from happening in the future.
II. GOLIATH FOR NETSCALER
Proactive Analysis and Reporting for Citrix NetScaler
Goliath for NetScaler is Citrix Verified Ready technology that translates AppFlow data into real-time performance dashboards, unlimited historical reports, and threshold-based alerts.
Goliath for NetScaler enhances the functionality of your Enterprise and Platinum Edition of NetScaler by adding functionality like performance analysis, trending, and data exports via API or CSV.
III. APPLICATION AVAILABILITY MONITOR
Confirm Citrix is Available for Local or Remote End Users This is a complete early warning system that lets you know in advance if an end user is going to have a problem when they try to access an application so you can fix it before they are negatively impacted. The technology is designed to:
Confirm that applications and the IT delivery infrastructure are available and working
Send alerts if they fail or are slow for troubleshooting
Provide reports as objective evidence of success, slowness or failure so permanent fix actions can be put in place to prevent issues in the future.
Page 6
Purpose-Built Monitoring for Citrix XenApp & XenDesktop
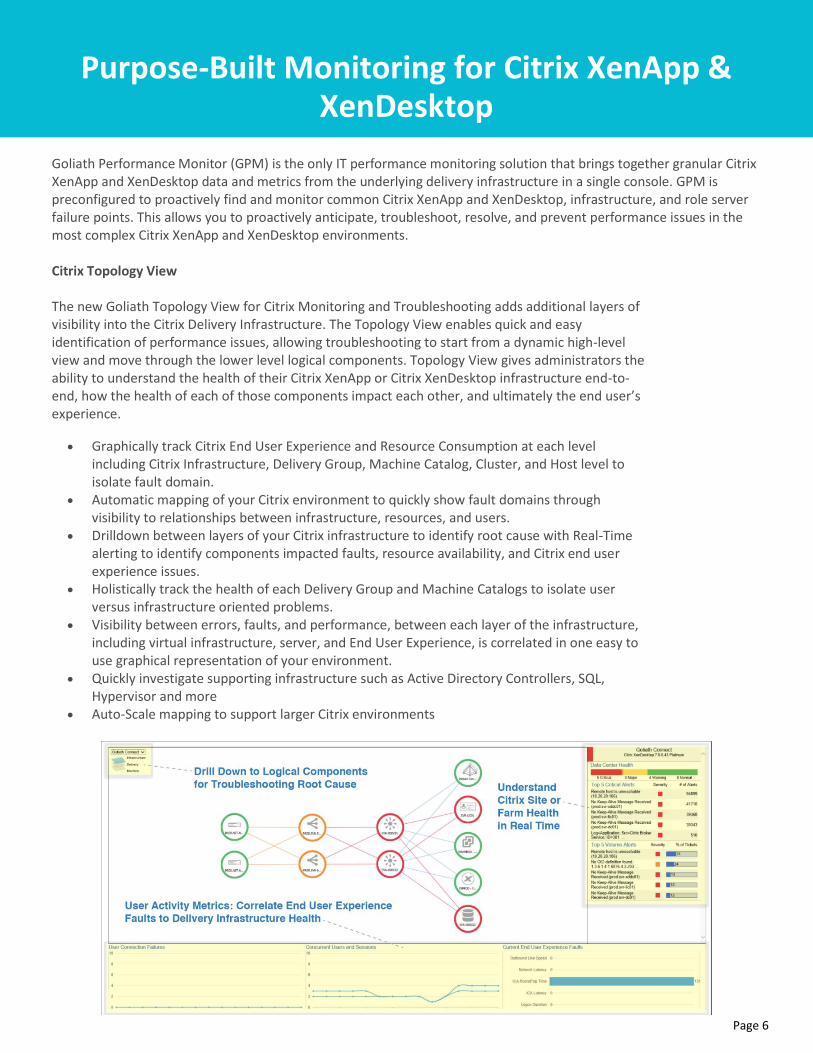
Goliath Performance Monitor (GPM) is the only IT performance monitoring solution that brings together granular Citrix XenApp and XenDesktop data and metrics from the underlying delivery infrastructure in a single console. GPM is preconfigured to proactively find and monitor common Citrix XenApp and XenDesktop, infrastructure, and role server failure points. This allows you to proactively anticipate, troubleshoot, resolve, and prevent performance issues in the most complex Citrix XenApp and XenDesktop environments. Citrix Topology View The new Goliath Topology View for Citrix Monitoring and Troubleshooting adds additional layers of visibility into the Citrix Delivery Infrastructure. The Topology View enables quick and easy identification of performance issues, allowing troubleshooting to start from a dynamic high-level view and move through the lower level logical components. Topology View gives administrators the ability to understand the health of their Citrix XenApp or Citrix XenDesktop infrastructure end-to-end, how the health of each of those components impact each other, and ultimately the end user’s experience.
Graphically track Citrix End User Experience and Resource Consumption at each level including Citrix Infrastructure, Delivery Group, Machine Catalog, Cluster, and Host level to isolate fault domain.
Automatic mapping of your Citrix environment to quickly show fault domains through visibility to relationships between infrastructure, resources, and users.
Drilldown between layers of your Citrix infrastructure to identify root cause with Real-Time alerting to identify components impacted faults, resource availability, and Citrix end user experience issues.
Holistically track the health of each Delivery Group and Machine Catalogs to isolate user versus infrastructure oriented problems.
Visibility between errors, faults, and performance, between each layer of the infrastructure, including virtual infrastructure, server, and End User Experience, is correlated in one easy to use graphical representation of your environment.
Quickly investigate supporting infrastructure such as Active Directory Controllers, SQL, Hypervisor and more
Auto-Scale mapping to support larger Citrix environments
Page 7
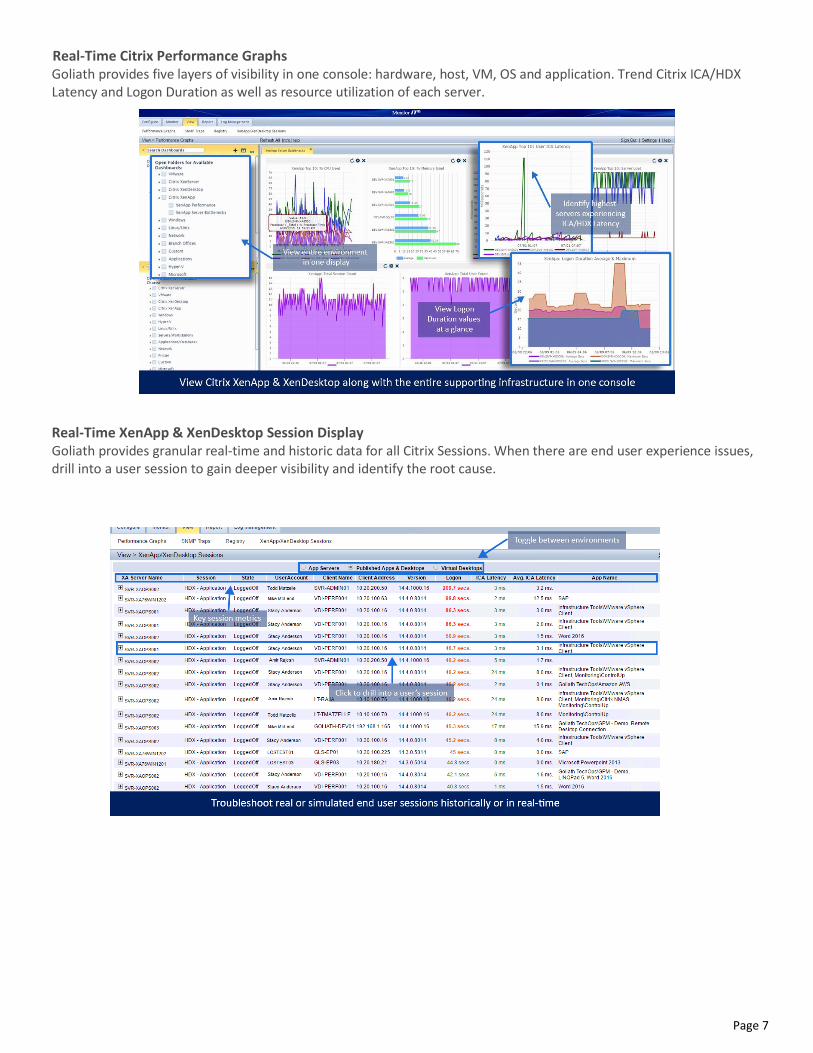
Real-Time Citrix Performance Graphs Goliath provides five layers of visibility in one console: hardware, host, VM, OS and application. Trend Citrix ICA/HDX Latency and Logon Duration as well as resource utilization of each server.
Real-Time XenApp & XenDesktop Session Display Goliath provides granular real-time and historic data for all Citrix Sessions. When there are end user experience issues, drill into a user session to gain deeper visibility and identify the root cause.
Page 8
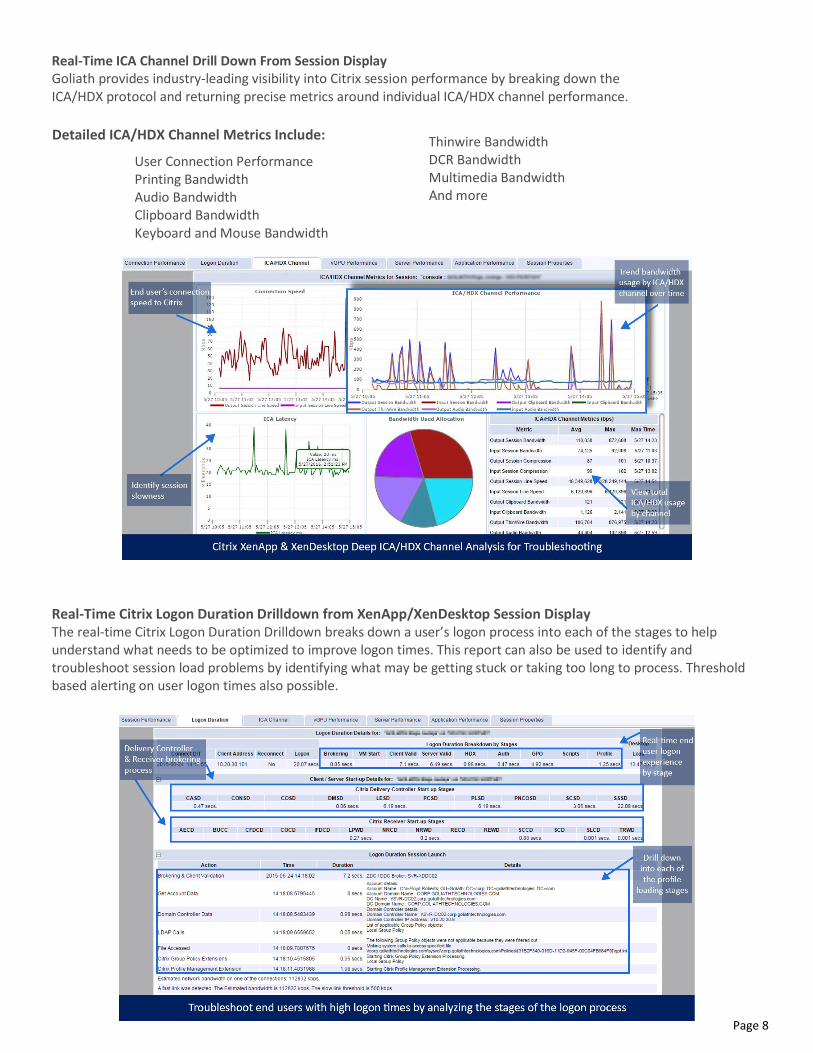
Real-Time ICA Channel Drill Down From Session Display Goliath provides industry-leading visibility into Citrix session performance by breaking down the ICA/HDX protocol and returning precise metrics around individual ICA/HDX channel performance.
Detailed ICA/HDX Channel Metrics Include:
User Connection Performance Printing Bandwidth Audio Bandwidth Clipboard Bandwidth Keyboard and Mouse Bandwidth
Thinwire Bandwidth DCR Bandwidth Multimedia Bandwidth And more
Real-Time Citrix Logon Duration Drilldown from XenApp/XenDesktop Session Display The real-time Citrix Logon Duration Drilldown breaks down a user’s logon process into each of the stages to help understand what needs to be optimized to improve logon times. This report can also be used to identify and troubleshoot session load problems by identifying what may be getting stuck or taking too long to process. Threshold based alerting on user logon times also possible.
Page 9
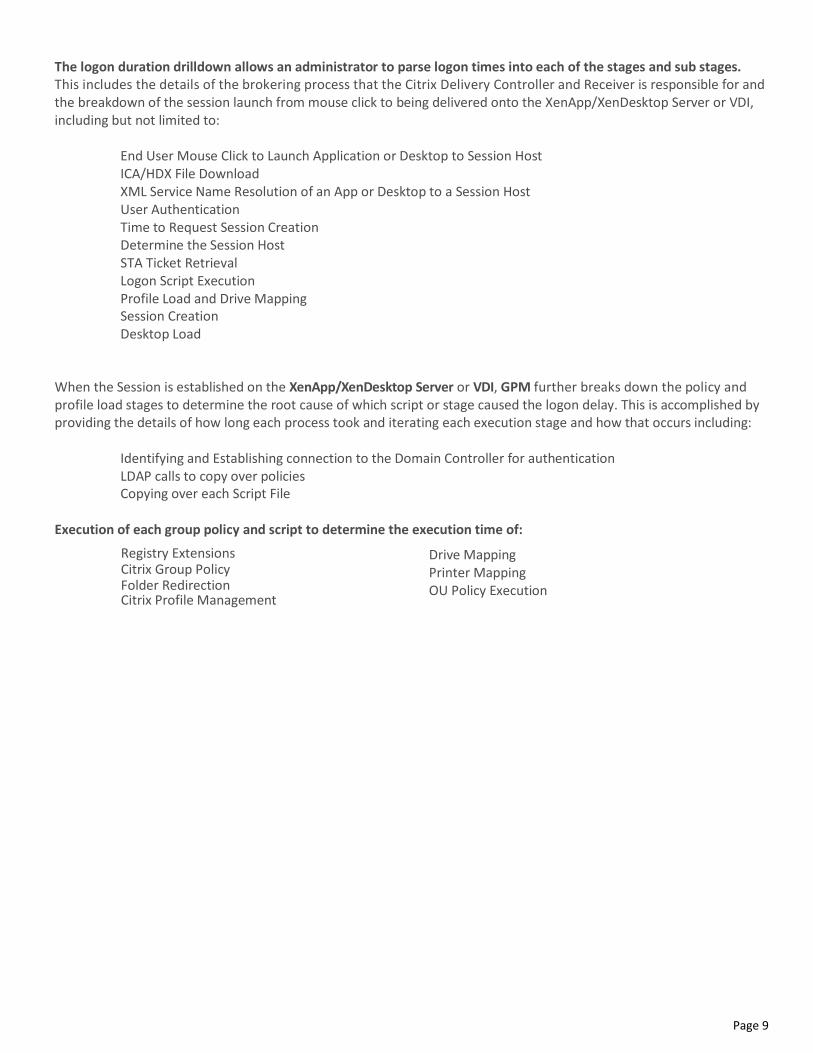
The logon duration drilldown allows an administrator to parse logon times into each of the stages and sub stages. This includes the details of the brokering process that the Citrix Delivery Controller and Receiver is responsible for and the breakdown of the session launch from mouse click to being delivered onto the XenApp/XenDesktop Server or VDI, including but not limited to:
End User Mouse Click to Launch Application or Desktop to Session Host ICA/HDX File Download XML Service Name Resolution of an App or Desktop to a Session Host User Authentication Time to Request Session Creation Determine the Session Host STA Ticket Retrieval Logon Script Execution Profile Load and Drive Mapping Session Creation Desktop Load
When the Session is established on the XenApp/XenDesktop Server or VDI, GPM further breaks down the policy and profile load stages to determine the root cause of which script or stage caused the logon delay. This is accomplished by providing the details of how long each process took and iterating each execution stage and how that occurs including:
Identifying and Establishing connection to the Domain Controller for authentication LDAP calls to copy over policies Copying over each Script File
Execution of each group policy and script to determine the execution time of:
Registry Extensions Citrix Group Policy Folder Redirection Citrix Profile Management
Drive Mapping Printer Mapping OU Policy Execution
Page 10
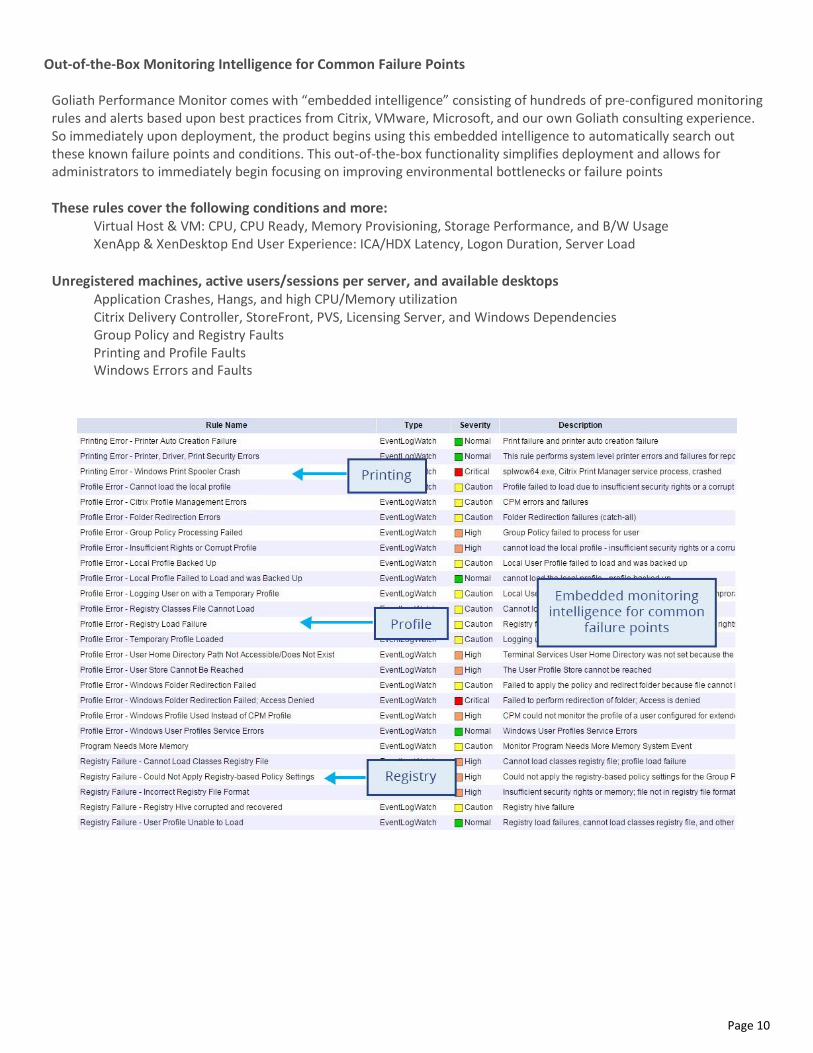
Out-of-the-Box Monitoring Intelligence for Common Failure Points
Goliath Performance Monitor comes with “embedded intelligence” consisting of hundreds of pre-configured monitoring rules and alerts based upon best practices from Citrix, VMware, Microsoft, and our own Goliath consulting experience. So immediately upon deployment, the product begins using this embedded intelligence to automatically search out these known failure points and conditions. This out-of-the-box functionality simplifies deployment and allows for administrators to immediately begin focusing on improving environmental bottlenecks or failure points
These rules cover the following conditions and more:
Virtual Host & VM: CPU, CPU Ready, Memory Provisioning, Storage Performance, and B/W Usage XenApp & XenDesktop End User Experience: ICA/HDX Latency, Logon Duration, Server Load
Unregistered machines, active users/sessions per server, and available desktops
Application Crashes, Hangs, and high CPU/Memory utilization Citrix Delivery Controller, StoreFront, PVS, Licensing Server, and Windows Dependencies Group Policy and Registry Faults Printing and Profile Faults Windows Errors and Faults
Page 11
Proactive Funtionality to Guarentee Citrix End User Experience by Predicting & Preventing
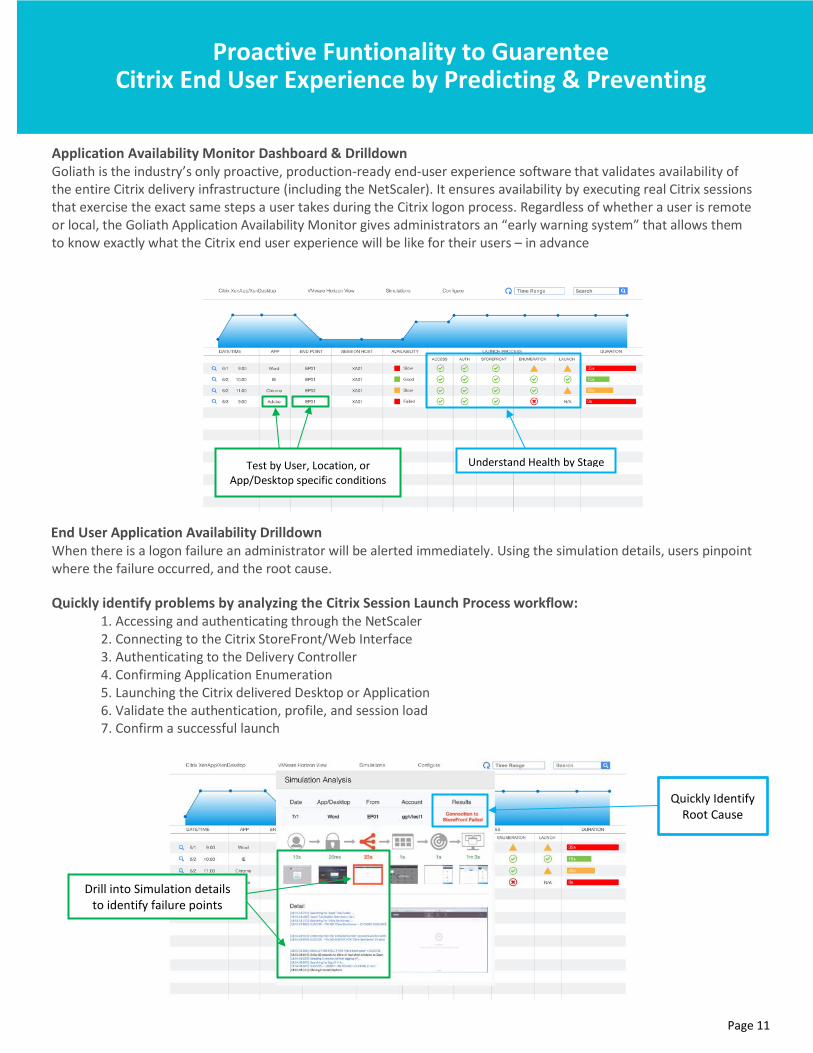
Application Availability Monitor Dashboard & Drilldown Goliath is the industry’s only proactive, production-ready end-user experience software that validates availability of the entire Citrix delivery infrastructure (including the NetScaler). It ensures availability by executing real Citrix sessions that exercise the exact same steps a user takes during the Citrix logon process. Regardless of whether a user is remote or local, the Goliath Application Availability Monitor gives administrators an “early warning system” that allows them to know exactly what the Citrix end user experience will be like for their users – in advance
End User Application Availability Drilldown
When there is a logon failure an administrator will be alerted immediately. Using the simulation details, users pinpoint where the failure occurred, and the root cause.
Quickly identify problems by analyzing the Citrix Session Launch Process workflow:
1. Accessing and authenticating through the NetScaler 2. Connecting to the Citrix StoreFront/Web Interface 3. Authenticating to the Delivery Controller 4. Confirming Application Enumeration 5. Launching the Citrix delivered Desktop or Application 6. Validate the authentication, profile, and session load 7. Confirm a successful launch
Test by User, Location, or App/Desktop specific conditions
Understand Health by Stage
Drill into Simulation details to identify failure points
Quickly Identify Root Cause
Page 12
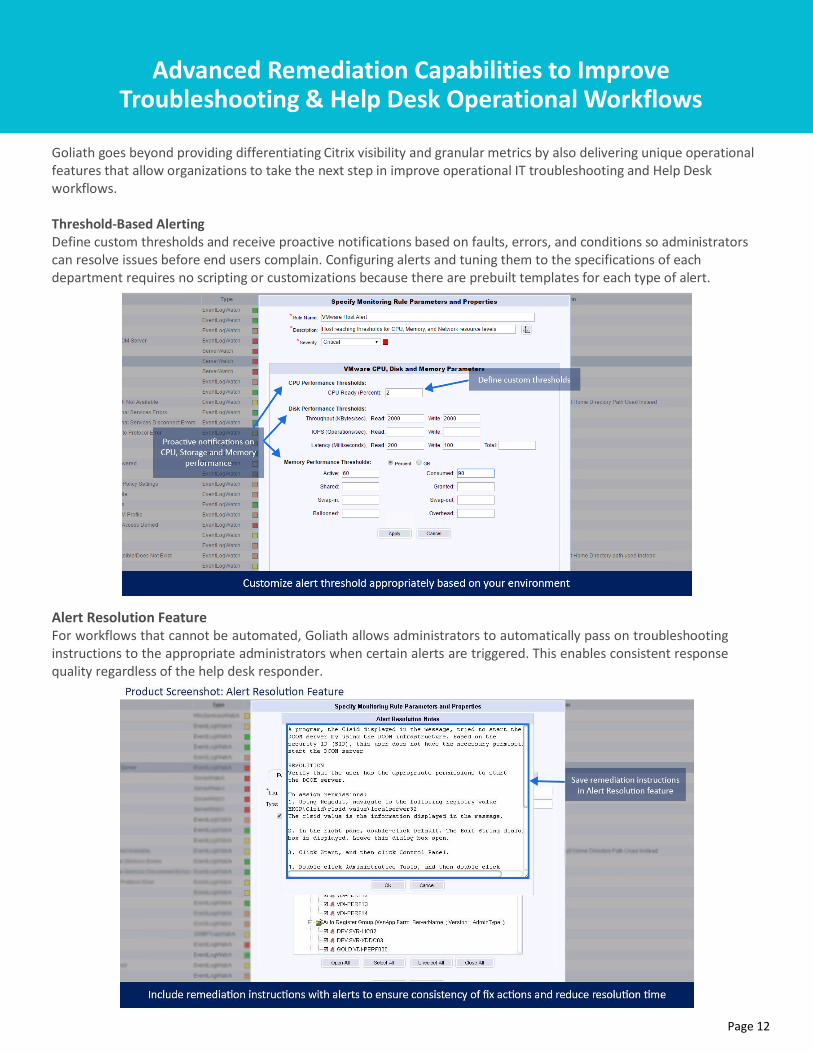
Advanced Remediation Capabilities to Improve Troubleshooting & Help Desk Operational Workflows
Goliath goes beyond providing differentiating Citrix visibility and granular metrics by also delivering unique operational features that allow organizations to take the next step in improve operational IT troubleshooting and Help Desk workflows.
Threshold-Based Alerting Define custom thresholds and receive proactive notifications based on faults, errors, and conditions so administrators can resolve issues before end users complain. Configuring alerts and tuning them to the specifications of each department requires no scripting or customizations because there are prebuilt templates for each type of alert.
Alert Resolution Feature For workflows that cannot be automated, Goliath allows administrators to automatically pass on troubleshooting instructions to the appropriate administrators when certain alerts are triggered. This enables consistent response quality regardless of the help desk responder.
Page 13
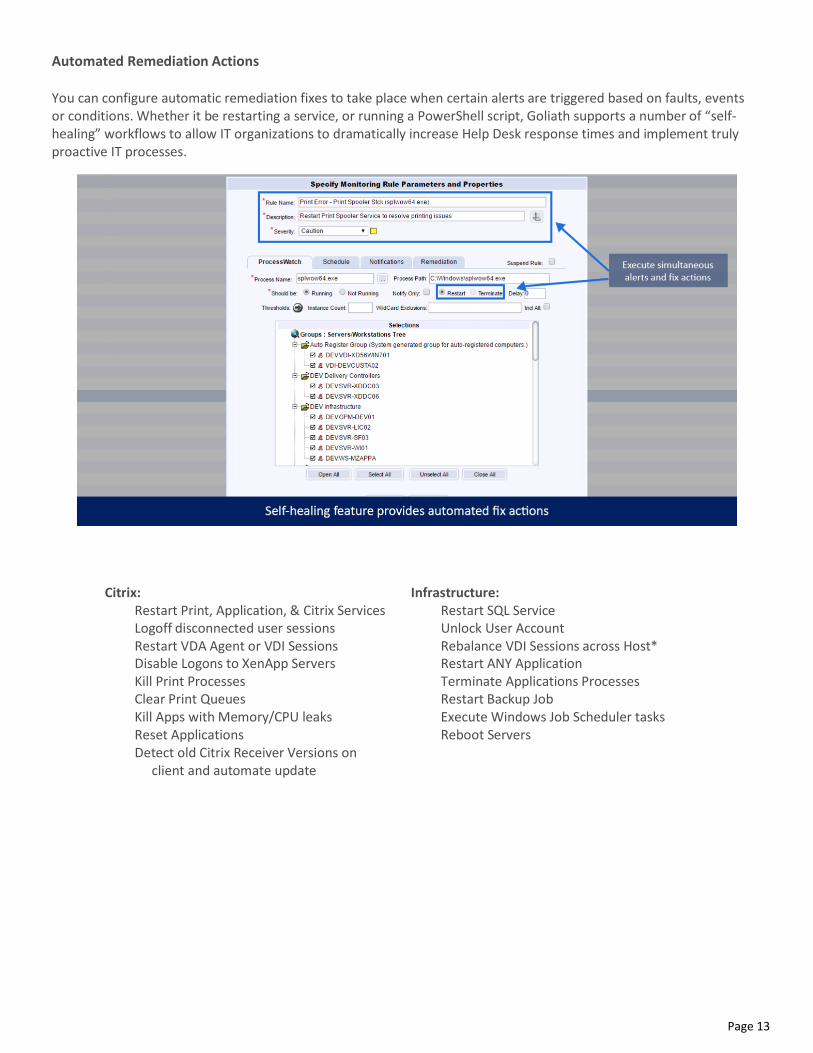
Automated Remediation Actions
You can configure automatic remediation fixes to take place when certain alerts are triggered based on faults, events or conditions. Whether it be restarting a service, or running a PowerShell script, Goliath supports a number of “self- healing” workflows to allow IT organizations to dramatically increase Help Desk response times and implement truly proactive IT processes.
Citrix: Restart Print, Application, & Citrix Services Logoff disconnected user sessions Restart VDA Agent or VDI Sessions Disable Logons to XenApp Servers Kill Print Processes Clear Print Queues Kill Apps with Memory/CPU leaks Reset Applications Detect old Citrix Receiver Versions on
client and automate update
Infrastructure: Restart SQL Service Unlock User Account Rebalance VDI Sessions across Host* Restart ANY Application Terminate Applications Processes Restart Backup Job Execute Windows Job Scheduler tasks Reboot Servers
Page 14
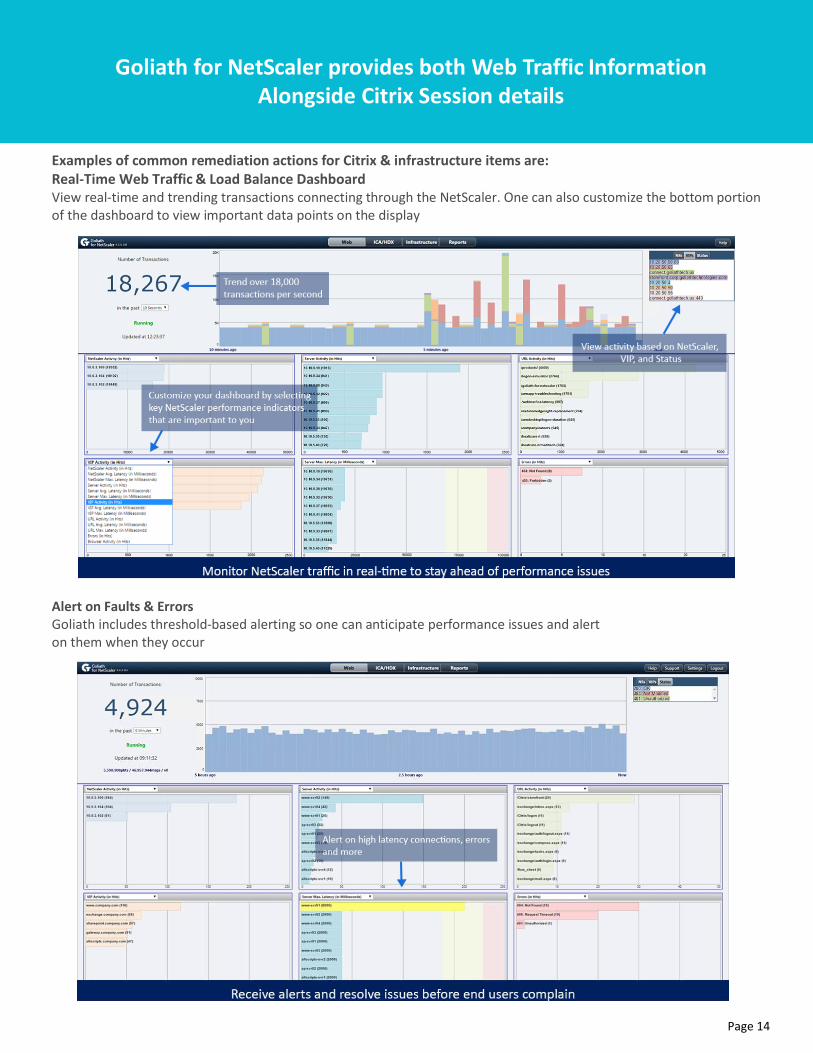
Goliath for NetScaler provides both Web Traffic Information Alongside Citrix Session details
Examples of common remediation actions for Citrix & infrastructure items are: Real-Time Web Traffic & Load Balance Dashboard View real-time and trending transactions connecting through the NetScaler. One can also customize the bottom portion of the dashboard to view important data points on the display
Alert on Faults & Errors Goliath includes threshold-based alerting so one can anticipate performance issues and alert on them when they occur
Page 15
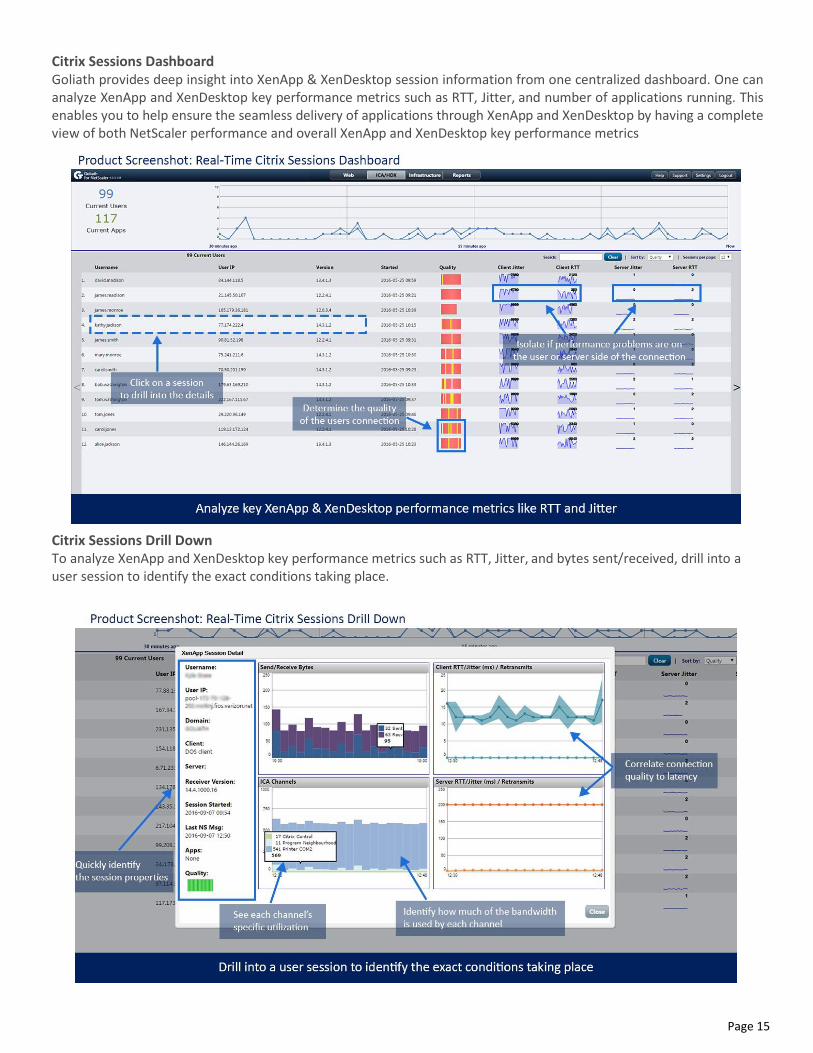
Citrix Sessions Dashboard Goliath provides deep insight into XenApp & XenDesktop session information from one centralized dashboard. One can analyze XenApp and XenDesktop key performance metrics such as RTT, Jitter, and number of applications running. This enables you to help ensure the seamless delivery of applications through XenApp and XenDesktop by having a complete view of both NetScaler performance and overall XenApp and XenDesktop key performance metrics
Citrix Sessions Drill Down To analyze XenApp and XenDesktop key performance metrics such as RTT, Jitter, and bytes sent/received, drill into a user session to identify the exact conditions taking place.
Page 16
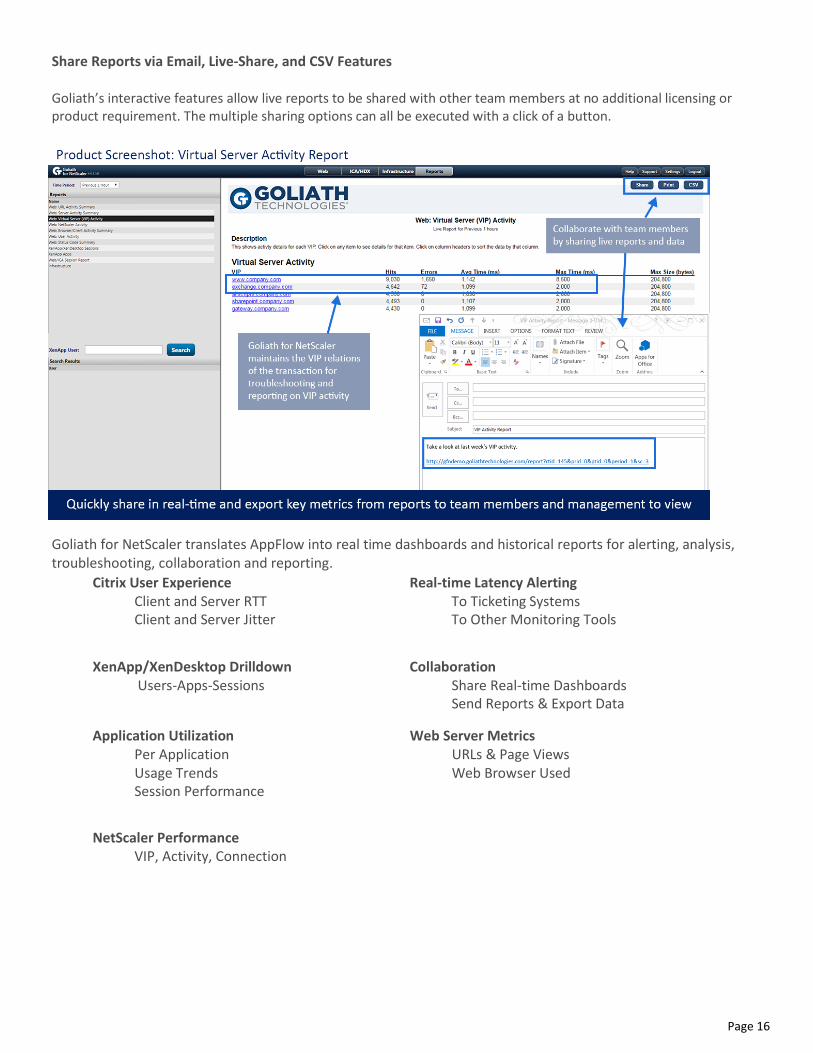
Share Reports via Email, Live-Share, and CSV Features
Goliath’s interactive features allow live reports to be shared with other team members at no additional licensing or product requirement. The multiple sharing options can all be executed with a click of a button.
Goliath for NetScaler translates AppFlow into real time dashboards and historical reports for alerting, analysis, troubleshooting, collaboration and reporting.
Citrix User Experience Client and Server RTT Client and Server Jitter
Real-time Latency Alerting To Ticketing Systems To Other Monitoring Tools
XenApp/XenDesktop Drilldown Users-Apps-Sessions
Collaboration Share Real-time Dashboards Send Reports & Export Data
Application Utilization Per Application Usage Trends Session Performance
Web Server Metrics URLs & Page Views Web Browser Used
NetScaler Performance VIP, Activity, Connection
Page 17
Reporting
66 Out Of The Box Reports For Full Visibility Into Your Infrastructure, Performance Issues & End User Experience
Citrix XenApp & Xen Desktop Reports
With the XenApp & XenDesktop reports in Goliath Performance Monitor (which includes modules for NVIDIA vGPU & EMR/EHR Apps) you get complete end-to-end visibility into the underlying delivery infrastructure so you can see how your environment is performing.
XenApp Reports Client Report End User Activity Report Environment Summary Report License Usage Report Peak Usage Server Health Session Activity
XenDesktop Reports Client Report End User Activity Report Environment Summary Report License Usage Report Peak Usage Session Activity Gold Image Health
Citrix XenApp & XenDesktop End User Experience Reports & VMware Reports
To proactively manage the Citrix XenApp/XenDesktop end user experience using, this set of reports will allow you to proactively detect and troubleshoot issues such as printing, profile and logon failures, and high ICA latency in order to remediate issues before end users complain.
Citrix End User Experience Reports XenApp Logon Duration XenDesktop Logon Duration XenApp ICA Latency XenDesktop ICA Latency XenApp End User Experience XenApp End to End Connection RDS & Terminal Services Errors User Logon Problems
Citrix NetScaler Reports Goliath for NetScaler translates AppFlow data into historical reports and unlimited time frame reports. The data can be exported via API or CSV and shared with your team so you can proactively troubleshoot and remediate performance issues by instantly sharing performance data with your team.
NetScaler Reports Web: URL Activity Summary
Web: Server Activity Summary
Web: Virtual Server (VIP) Activity
Web: NetScaler Activity
Web: Browser/Client Activity Summary
Web: User Activity
Web: Status Code Summary
XenApp/XenDesktop Sessions
XenApp Apps
Web: URL Detail
Web: Server Detail
Web: VIP Detail
Web: NetScaler Detail
Web: Browser Detail
Web: User Detail
Web: Status Code Detail
XenApp Applications Detail
XenApp/XenDesktop Session Detail
IT Infrastructure Reporting To proactively manage your entire virtual and physical IT infrastructure and elements like OS, Network, Goliath has a series of IT Infrastructure Performance Reports that can help you get ahead of infrastructure performance issues that may cause end users to experience problems such as printing and profile failures.
Alert Analysis
Group Policy & Registry Health
Logical Drive Utilization Status
Memory Utilization Status
Printing Health
Profile Errors
Registry Monitor Status
Server Configuration Details
Server Monitoring Rules Assignments
SSL & Communication Errors
Syslog Message Analysis
Uptime & Availability
Windows Event Log Analysis
Windows Server & Configuration Errors
Operating System Inventory
Group Inventory
User Security
Page 19
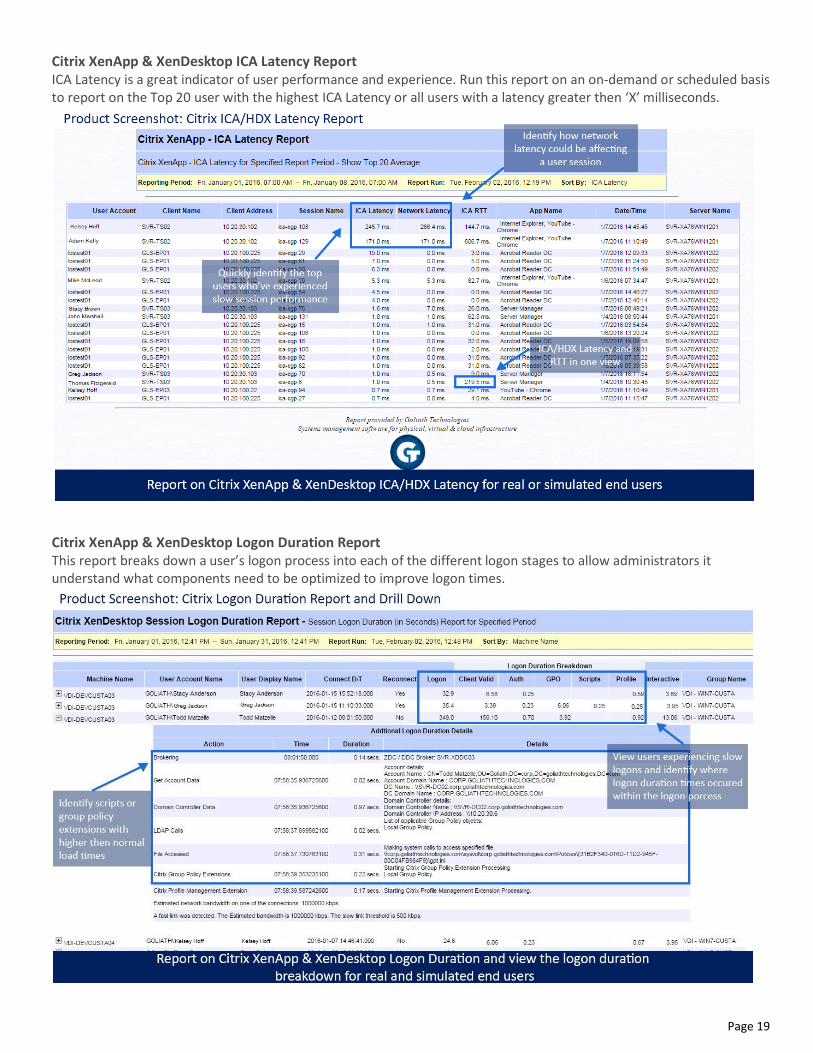
Citrix XenApp & XenDesktop ICA Latency Report ICA Latency is a great indicator of user performance and experience. Run this report on an on-demand or scheduled basis to report on the Top 20 user with the highest ICA Latency or all users with a latency greater then ‘X’ milliseconds.
Citrix XenApp & XenDesktop Logon Duration Report This report breaks down a user’s logon process into each of the different logon stages to allow administrators it understand what components need to be optimized to improve logon times.
You can try Goliath Performance Monitor,
Goliath Logon Simulator or Goliath for
NetScaler for Free
To see how Goliath can help you improve Citrix XenApp & XenDesktop end user experience,