Proactive Strategies for Designing Thermoelectric Materials for Power Generation PNNL / ONAMI Joint Project on Advanced TE Materials & Systems Project ID #PM014 Dr. Terry J. Hendricks, P.E. 1 Professor Mas Subramanian 2 1 Hydrocarbon Processing Group, Energy & Environment Directorate Pacific Northwest National Laboratory Corvallis, OR 2 Department of Chemistry Oregon State University Corvallis, OR Office of Vehicle Technologies 2010 Annual Merit Review 10 June 2010 “This presentation does not contain any proprietary, confidential, or otherwise restricted information”
Transcript
Proactive Strategies for Designing Thermoelectric Materials for Power Generation
PNNL / ONAMI Joint Project on Advanced TE Materials & SystemsProject ID #PM014
Dr. Terry J. Hendricks, P.E.1 Professor Mas Subramanian2
1Hydrocarbon Processing Group, Energy & Environment DirectoratePacific Northwest National Laboratory
Corvallis, OR
2Department of Chemistry Oregon State University
Corvallis, OR
Office of Vehicle Technologies 2010 Annual Merit Review 10 June 2010
“This presentation does not contain any proprietary, confidential, or otherwise restricted information”
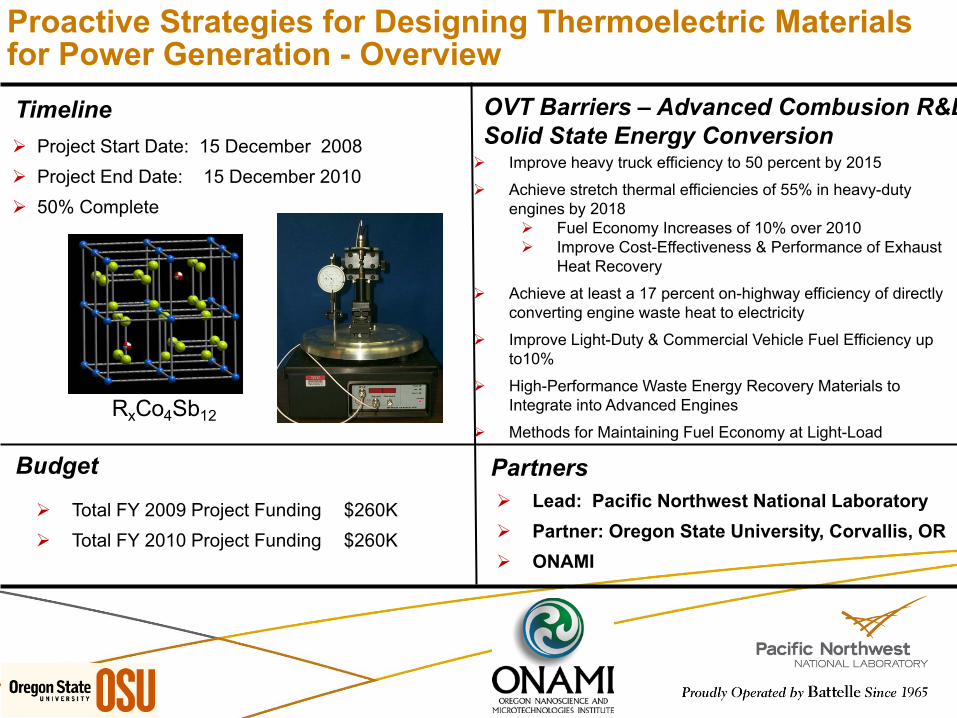
Proactive Strategies for Designing Thermoelectric Materials for Power Generation - Overview
Project Start Date: 15 December 2008 Project End Date: 15 December 2010 50% Complete
OVT Barriers – Advanced Combusion R&DSolid State Energy Conversion
Budget
Total FY 2009 Project Funding $260K Total FY 2010 Project Funding $260K
Improve heavy truck efficiency to 50 percent by 2015
Achieve stretch thermal efficiencies of 55% in heavy-duty engines by 2018 Fuel Economy Increases of 10% over 2010 Improve Cost-Effectiveness & Performance of Exhaust
Heat Recovery
Achieve at least a 17 percent on-highway efficiency of directly converting engine waste heat to electricity
Improve Light-Duty & Commercial Vehicle Fuel Efficiency up to10%
High-Performance Waste Energy Recovery Materials to Integrate into Advanced Engines
Methods for Maintaining Fuel Economy at Light-Load
Partners Lead: Pacific Northwest National Laboratory Partner: Oregon State University, Corvallis, OR ONAMI
Timeline
RxCo4Sb12
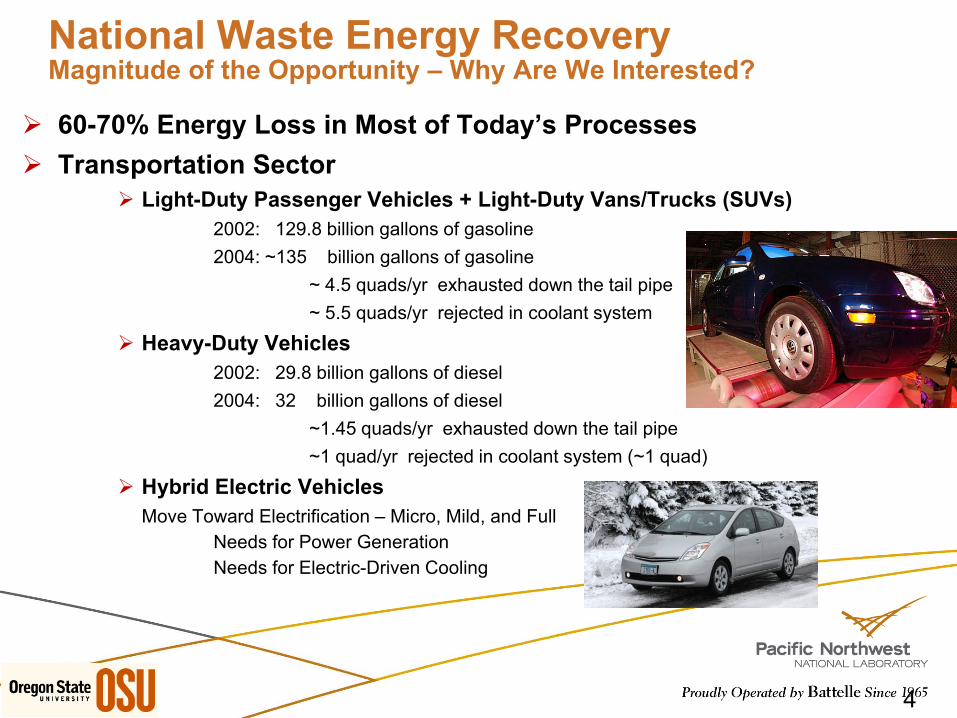
National Waste Energy RecoveryMagnitude of the Opportunity – Why Are We Interested?
4
60-70% Energy Loss in Most of Today’s Processes Transportation Sector
Light-Duty Passenger Vehicles + Light-Duty Vans/Trucks (SUVs)2002: 129.8 billion gallons of gasoline 2004: ~135 billion gallons of gasoline
~ 4.5 quads/yr exhausted down the tail pipe~ 5.5 quads/yr rejected in coolant system
Heavy-Duty Vehicles2002: 29.8 billion gallons of diesel2004: 32 billion gallons of diesel
~1.45 quads/yr exhausted down the tail pipe~1 quad/yr rejected in coolant system (~1 quad)
Hybrid Electric VehiclesMove Toward Electrification – Micro, Mild, and Full
Needs for Power GenerationNeeds for Electric-Driven Cooling
Project Objectives Develop new high-performance n-type and p-type thermoelectric
(TE) material compositions to enable: 10% fuel efficiency improvements from waste energy recovery in advanced light-
duty engines and vehicles. Heavy truck efficiencies to 50% by 2015 Stretch thermal efficiencies of 55% in advanced heavy-duty engines by 2018. Achieve 17% on-highway efficiency of directly converting engine waste heat to
electricity
Improve cost-effectiveness and performance of exhaust heat recovery in light- and heavy-duty vehicles.
Develop TE materials with operational temperatures as high as 800 K to 900 K.
Advanced n-type and p-type bulk TE materials that have peak ZT (Figure of Merit xTemperature) of approximately 1.6 or higher at 600 K
Minimize temperature-dependency in properties to achieve high performance in the 350 K to 820 K range.
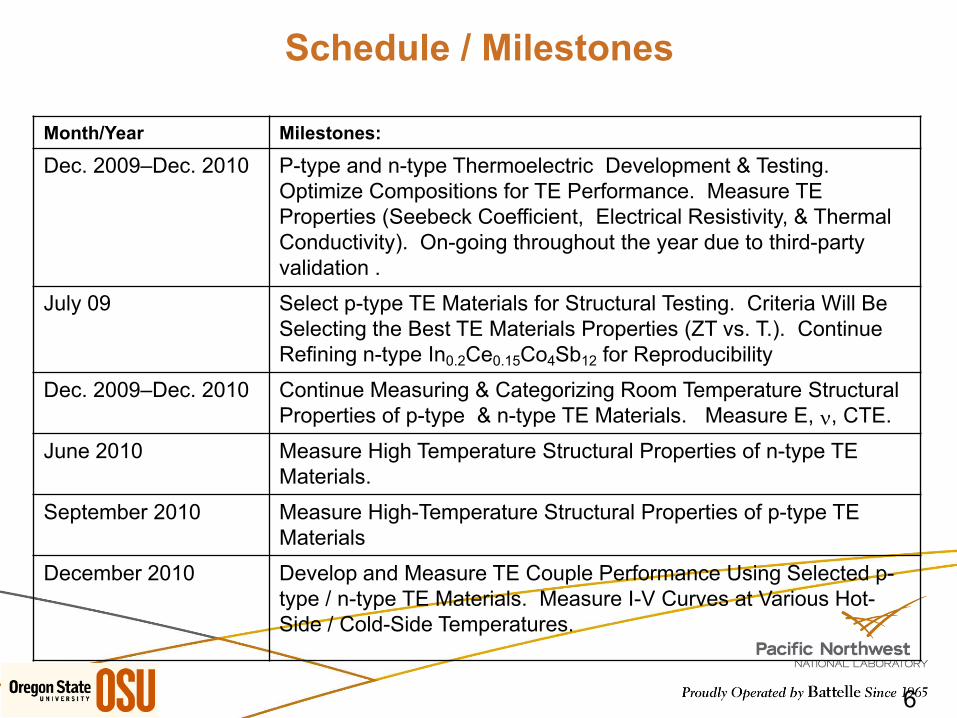
Schedule / Milestones
6
Month/Year Milestones:
Dec. 2009–Dec. 2010 P-type and n-type Thermoelectric Development & Testing. Optimize Compositions for TE Performance. Measure TE Properties (Seebeck Coefficient, Electrical Resistivity, & Thermal Conductivity). On-going throughout the year due to third-party validation .
July 09 Select p-type TE Materials for Structural Testing. Criteria Will Be Selecting the Best TE Materials Properties (ZT vs. T.). Continue Refining n-type In0.2Ce0.15Co4Sb12 for Reproducibility
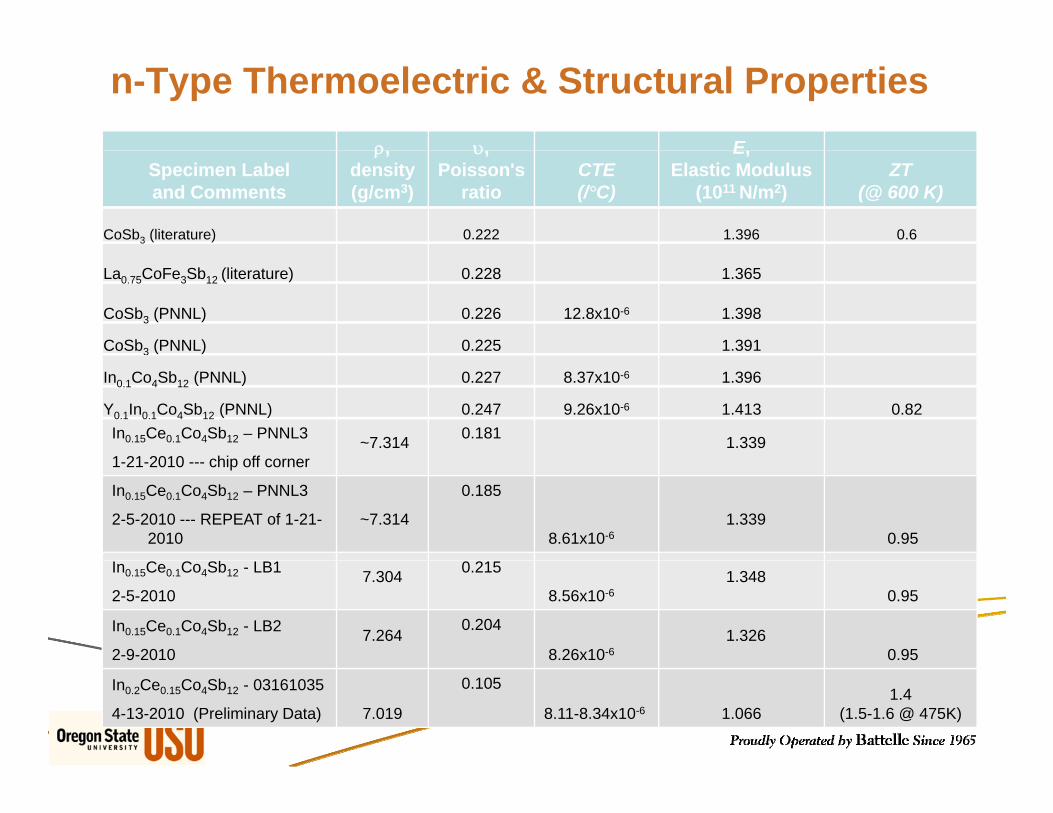
Dec. 2009–Dec. 2010 Continue Measuring & Categorizing Room Temperature Structural Properties of p-type & n-type TE Materials. Measure E, ν, CTE.
June 2010 Measure High Temperature Structural Properties of n-type TE Materials.
September 2010 Measure High-Temperature Structural Properties of p-type TE Materials
December 2010 Develop and Measure TE Couple Performance Using Selected p-type / n-type TE Materials. Measure I-V Curves at Various Hot-Side / Cold-Side Temperatures.
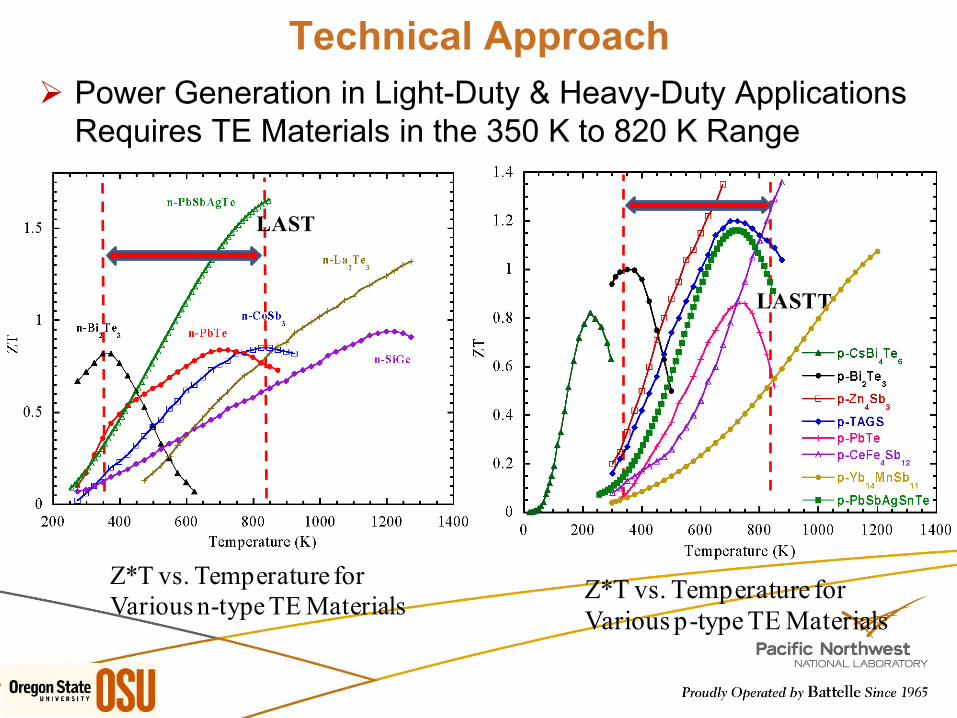
Technical Approach Power Generation in Light-Duty & Heavy-Duty Applications
Requires TE Materials in the 350 K to 820 K Range
T
Z*T vs. Temperature forVarious n-type TE Materials
LAST
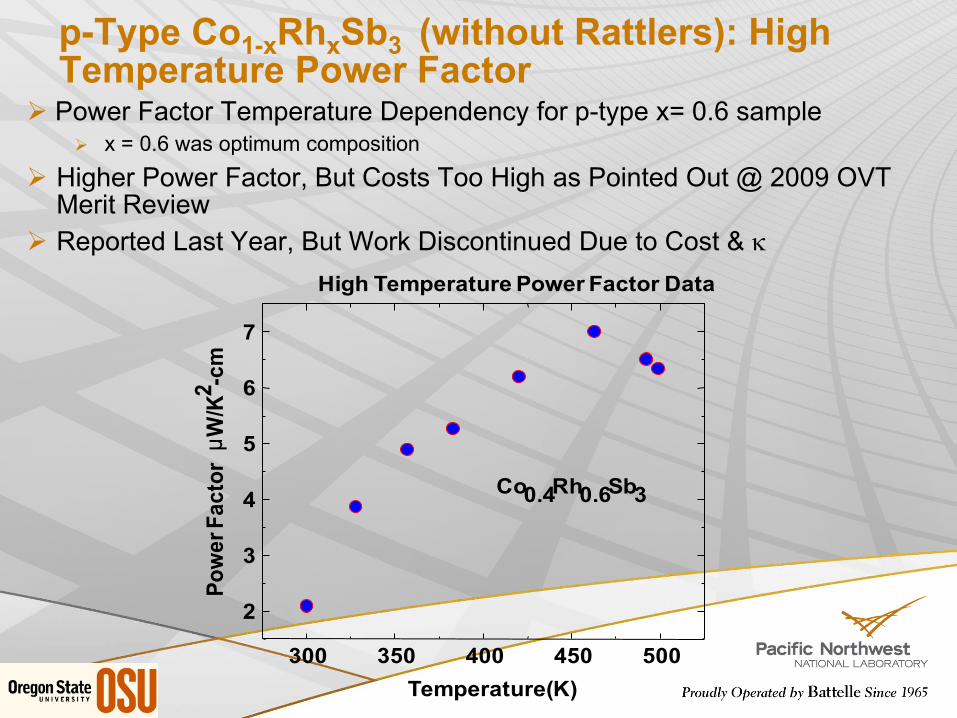
Z*T vs. Temperature forVarious p-type TE Materials
LAST
Single and Multiple Rattlers
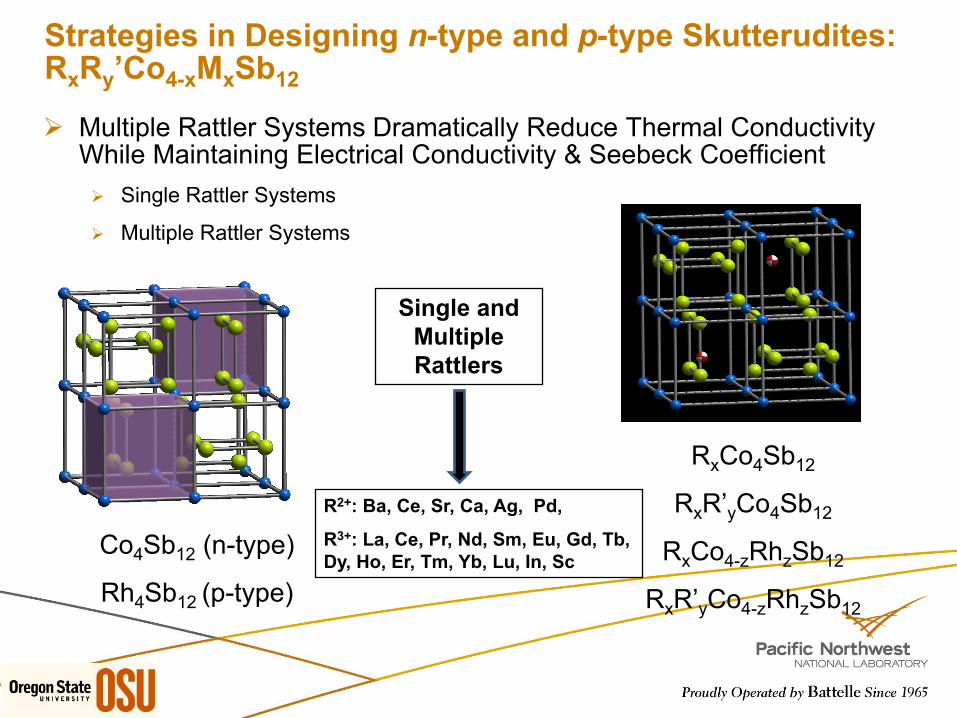
Co4Sb12 (n-type)
Rh4Sb12 (p-type)
RxCo4Sb12
RxR’yCo4Sb12
RxCo4-zRhzSb12
RxR’yCo4-zRhzSb12
Strategies in Designing n-type and p-type Skutterudites: RxRy’Co4-xMxSb12
Multiple Rattler Systems Dramatically Reduce Thermal Conductivity While Maintaining Electrical Conductivity & Seebeck Coefficient Single Rattler Systems
Multiple Rattler Systems
R2+: Ba, Ce, Sr, Ca, Ag, Pd,
R3+: La, Ce, Pr, Nd, Sm, Eu, Gd, Tb, Dy, Ho, Er, Tm, Yb, Lu, In, Sc
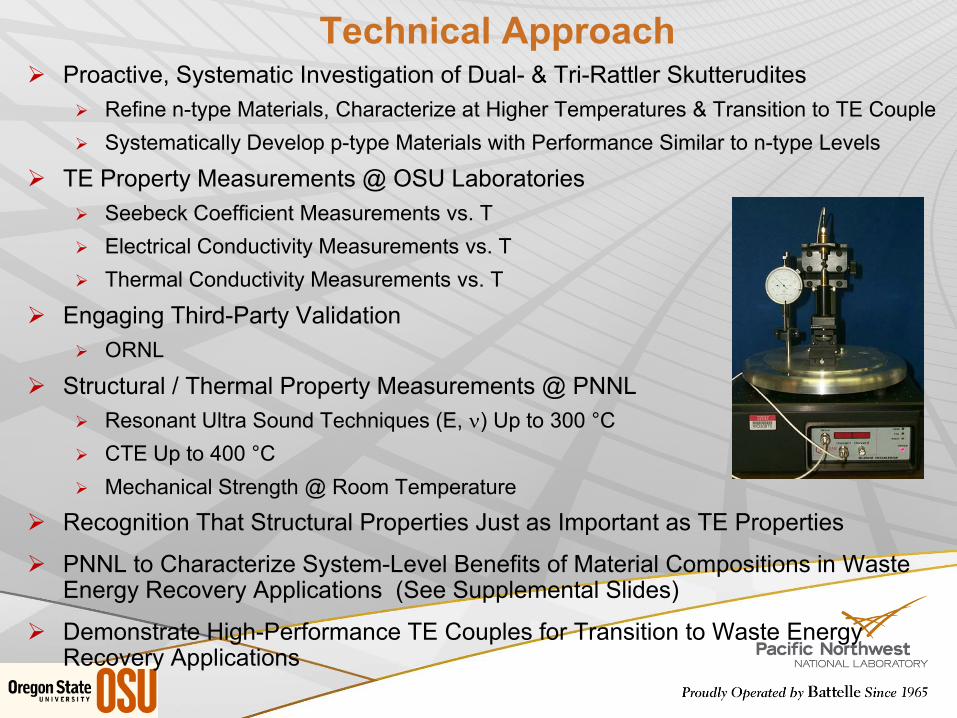
Technical Approach Proactive, Systematic Investigation of Dual- & Tri-Rattler Skutterudites
Refine n-type Materials, Characterize at Higher Temperatures & Transition to TE Couple Systematically Develop p-type Materials with Performance Similar to n-type Levels
TE Property Measurements @ OSU Laboratories Seebeck Coefficient Measurements vs. T Electrical Conductivity Measurements vs. T Thermal Conductivity Measurements vs. T
Engaging Third-Party Validation ORNL
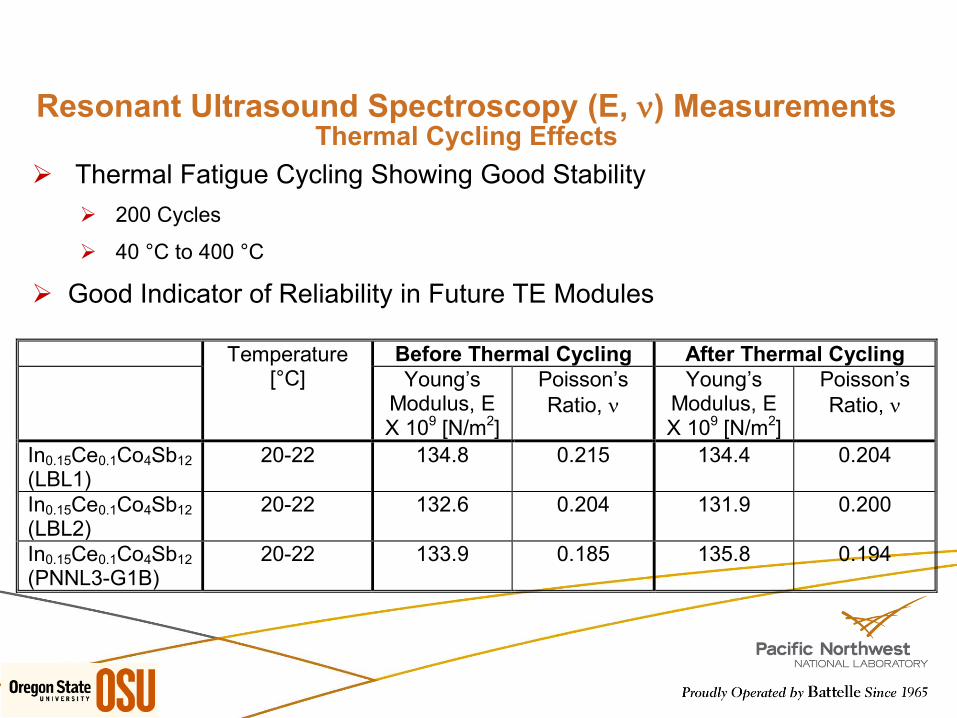
Structural / Thermal Property Measurements @ PNNL Resonant Ultra Sound Techniques (E, ν) Up to 300 °C CTE Up to 400 °C Mechanical Strength @ Room Temperature
Recognition That Structural Properties Just as Important as TE Properties
PNNL to Characterize System-Level Benefits of Material Compositions in Waste Energy Recovery Applications (See Supplemental Slides)
Demonstrate High-Performance TE Couples for Transition to Waste Energy Recovery Applications
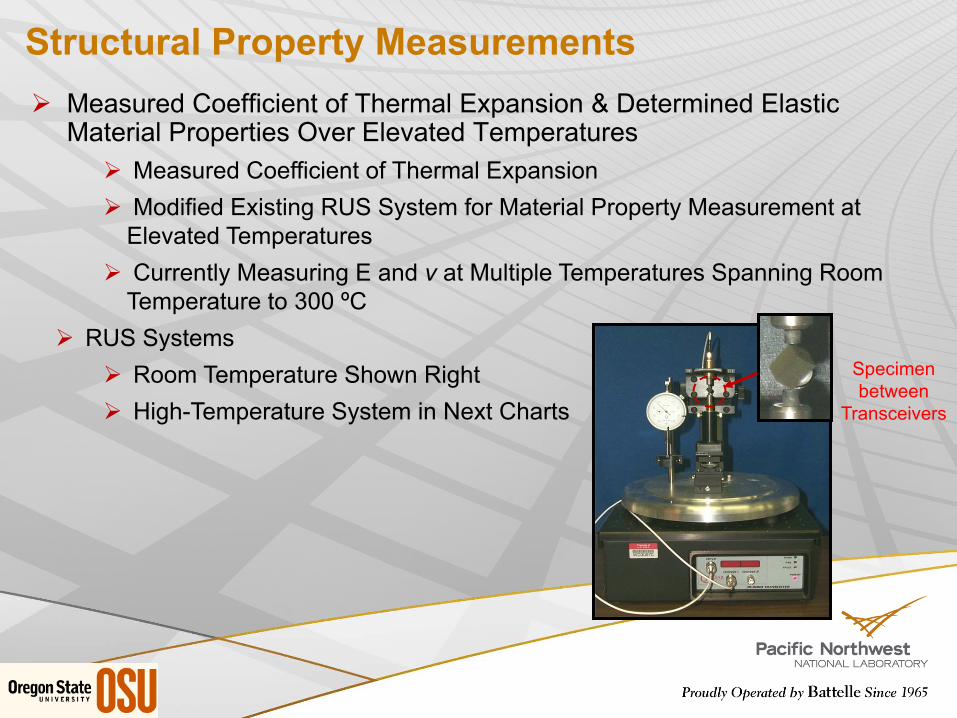
Material Properties Over Elevated Temperatures Measured Coefficient of Thermal Expansion Modified Existing RUS System for Material Property Measurement at
Elevated Temperatures Currently Measuring E and ν at Multiple Temperatures Spanning Room
Temperature to 300 ºC RUS Systems
Room Temperature Shown Right High-Temperature System in Next Charts
Specimen between
Transceivers
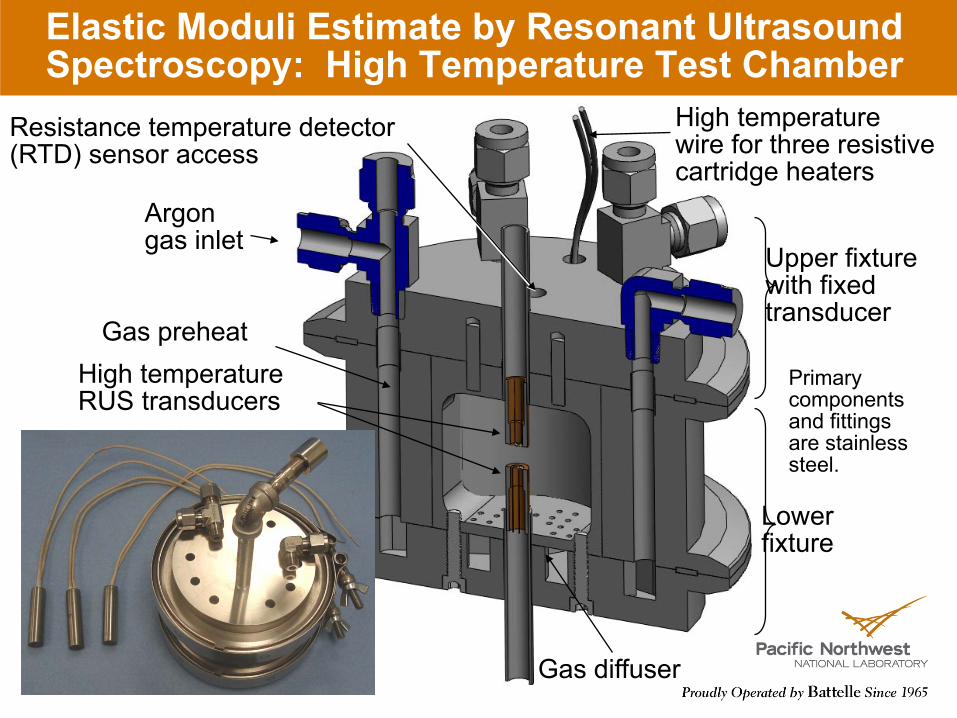
Elastic Moduli Estimate by Resonant Ultrasound Spectroscopy: High Temperature Test Chamber
Argon gas inlet
Gas preheat
High temperature wire for three resistive cartridge heaters
Gas diffuser
High temperature RUS transducers
Primary components and fittings are stainless steel.
Upper fixture with fixed transducer
Lower fixture
Resistance temperature detector (RTD) sensor access
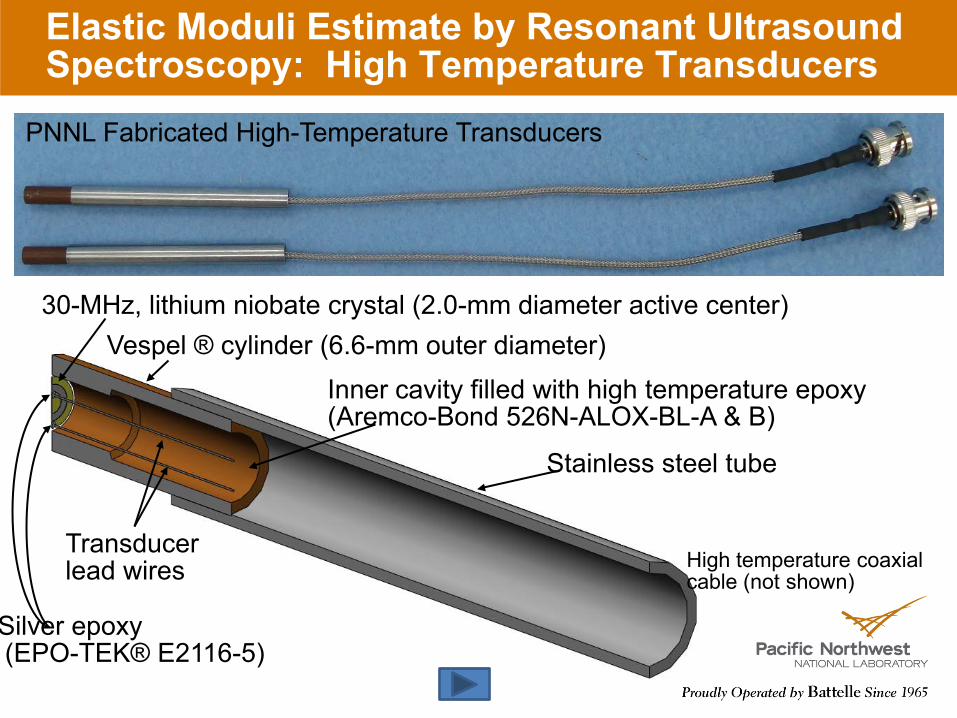
Elastic Moduli Estimate by Resonant Ultrasound Spectroscopy: High Temperature Transducers
Vespel ® cylinder (6.6-mm outer diameter)
High temperature coaxial cable (not shown)
Silver epoxy(EPO-TEK® E2116-5)
Inner cavity filled with high temperature epoxy (Aremco-Bond 526N-ALOX-BL-A & B)
Stainless steel tube
Transducer lead wires
PNNL Fabricated High-Temperature Transducers
30-MHz, lithium niobate crystal (2.0-mm diameter active center)
14
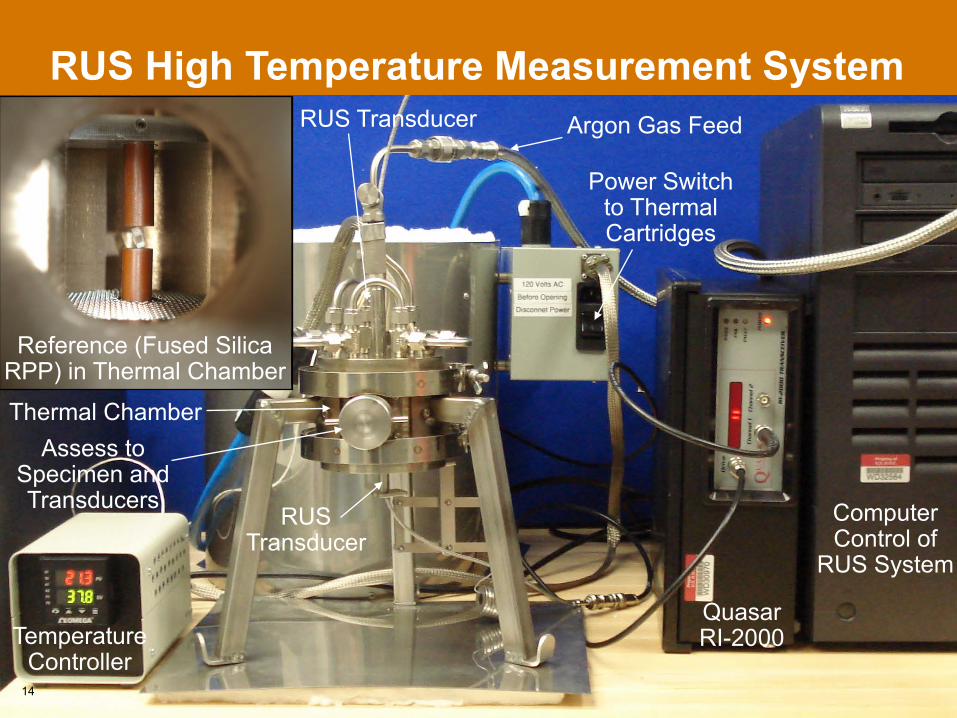
Thermal Chamber
Temperature Controller
Assess to Specimen and Transducers
RUS Transducer
RUS Transducer
Power Switch to Thermal Cartridges
QuasarRI-2000
Computer Control of
RUS System
Reference (Fused Silica RPP) in Thermal Chamber
Argon Gas Feed
RUS High Temperature Measurement System
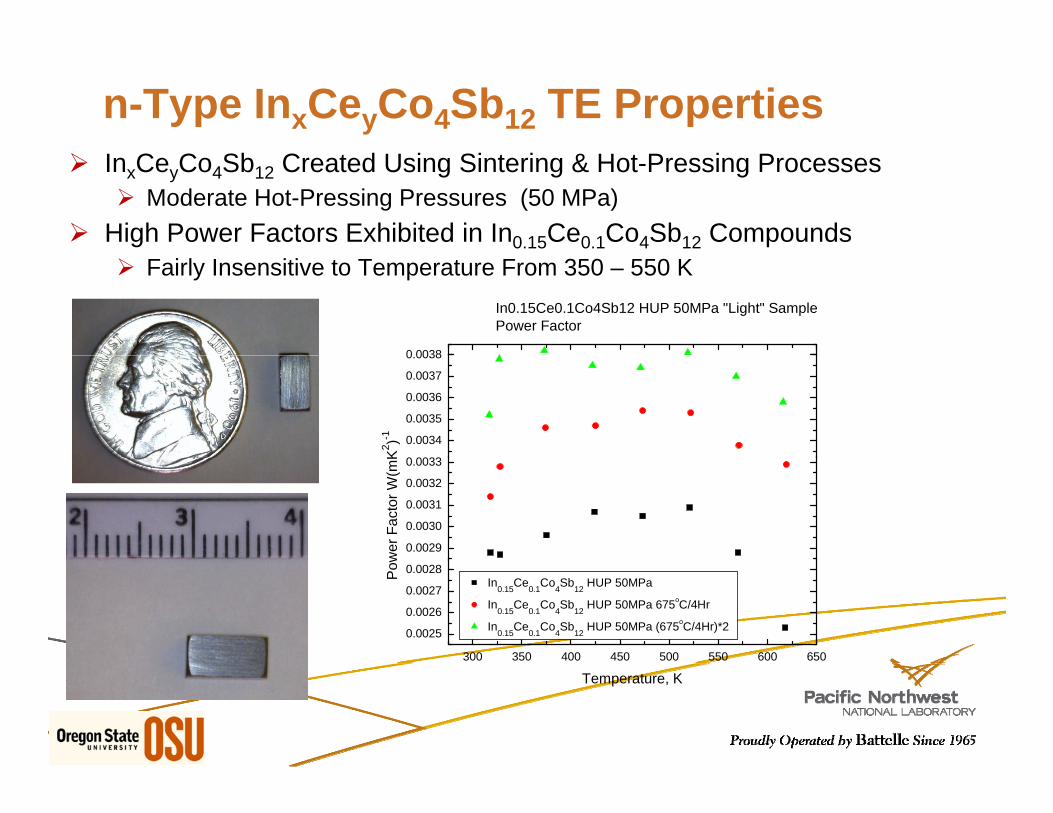
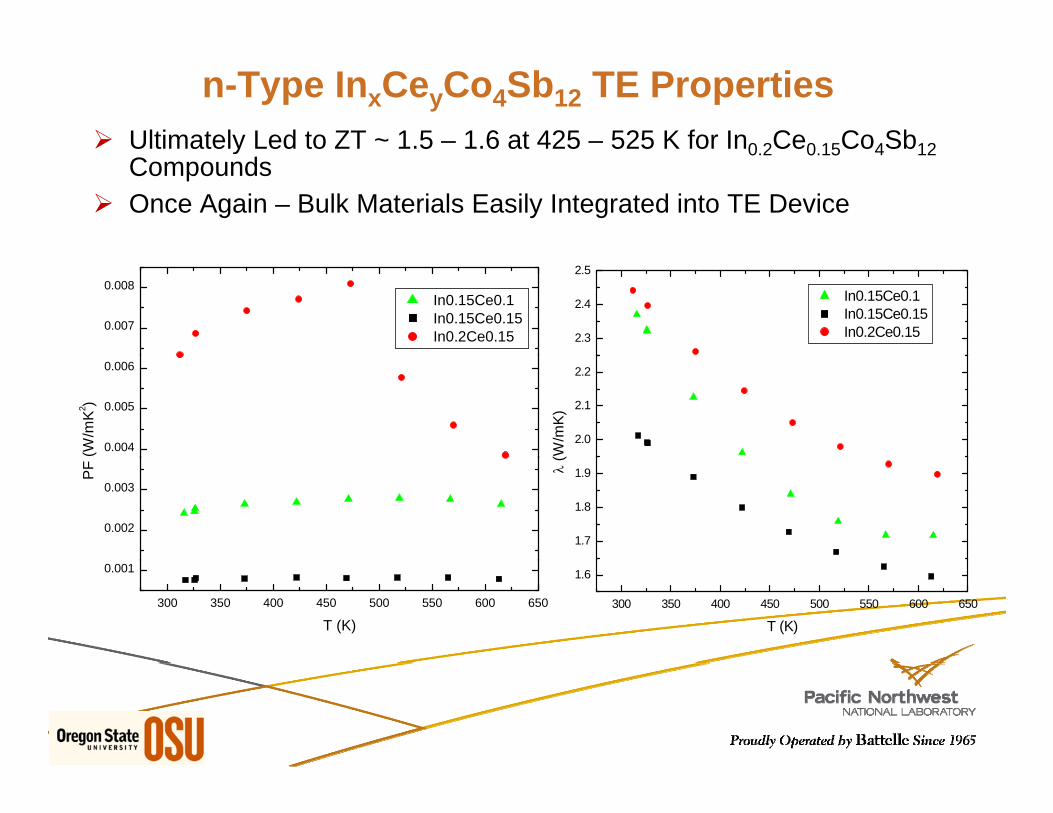
n-Type InxCeyCo4Sb12 TE Properties InxCeyCo4Sb12 Created Using Sintering & Hot-Pressing Processes
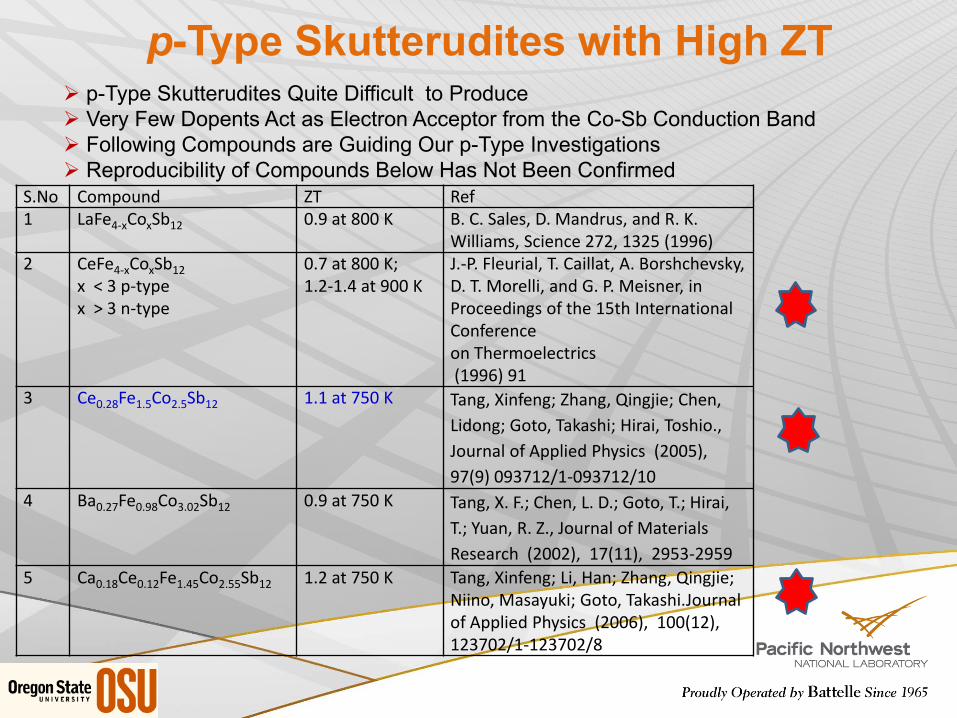
J.-P. Fleurial, T. Caillat, A. Borshchevsky, D. T. Morelli, and G. P. Meisner, in Proceedings of the 15th International Conferenceon Thermoelectrics(1996) 91
3 Ce0.28Fe1.5Co2.5Sb12 1.1 at 750 K Tang, Xinfeng; Zhang, Qingjie; Chen, Lidong; Goto, Takashi; Hirai, Toshio., Journal of Applied Physics (2005), 97(9) 093712/1-093712/10
4 Ba0.27Fe0.98Co3.02Sb12 0.9 at 750 K Tang, X. F.; Chen, L. D.; Goto, T.; Hirai, T.; Yuan, R. Z., Journal of Materials Research (2002), 17(11), 2953-2959
p-Type Skutterudites with High ZT p-Type Skutterudites Quite Difficult to Produce Very Few Dopents Act as Electron Acceptor from the Co-Sb Conduction Band Following Compounds are Guiding Our p-Type Investigations Reproducibility of Compounds Below Has Not Been Confirmed
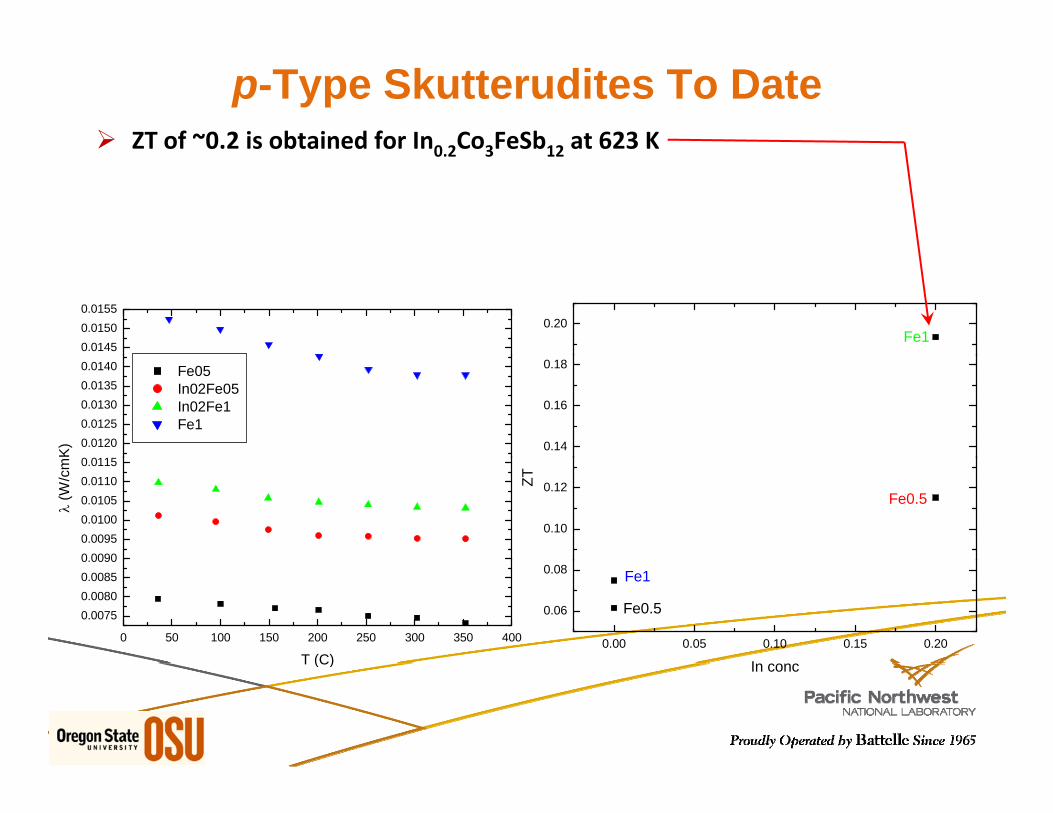
ZT of ~0.2 is obtained for In0 2Co3FeSb12 at 623 K
p-Type Skutterudites To Date0.2 3 12
0.01450.01500.0155
0.20Fe1
0 01150.01200.01250.01300.01350.0140 Fe05
In02Fe05 In02Fe1 Fe1
K) 0.14
0.16
0.18
0 00900.00950.01000.01050.01100.0115
(W
/cm
0.10
0.12Fe0.5
ZT
0 50 100 150 200 250 300 350 400
0.00750.00800.00850.0090
T (C)0.00 0.05 0.10 0.15 0.20
0.06
0.08 Fe1
Fe0.5
IT (C) In conc
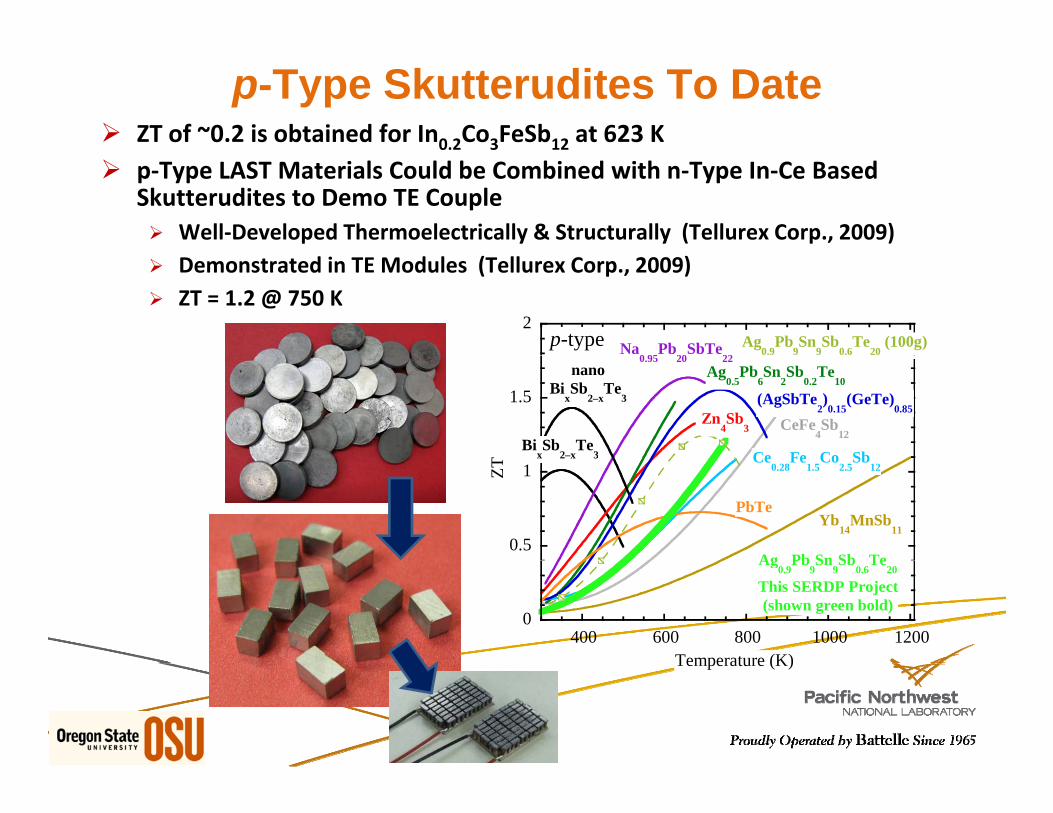
ZT of ~0.2 is obtained for In0.2Co3FeSb12 at 623 K
p-Type Skutterudites To Date
p‐Type LAST Materials Could be Combined with n‐Type In‐Ce Based Skutterudites to Demo TE Couple Well‐Developed Thermoelectrically & Structurally (Tellurex Corp., 2009) Demonstrated in TE Modules (Tellurex Corp., 2009) ZT = 1.2 @ 750 K
2Na
0 95Pb
20SbTe
22p-type Ag
0.9Pb
9Sn
9Sb
0.6Te
20 (100g)
1.5
T
BixSb
2–xTe
3
0.95 20 22
Zn4Sb
3
Ag0.5
Pb6Sn
2Sb
0.2Te
10
CeFe4Sb
12
(AgSbTe2)0.15
(GeTe)0.85
Ce Fe Co Sb
nanoBi
xSb
2–xTe
3
0.5
1ZT
x 2 x 3
PbTeYb
14MnSb
11
Ce0.28
Fe1.5
Co2.5
Sb12
Ag Pb Sn Sb Te
0400 600 800 1000 1200
Temperature (K)
Ag0.9
Pb9Sn
9Sb
0.6Te
20
This SERDP Project(shown green bold)
Temperature (K)
Partners Oregon State University, MicroProduct Breakthrough
Institute Oregon Nanoscience & Microtechnology Institute Oak Ridge National Laboratory – Validation Testing
Technology Transfer Tellurex Corporation BSST LLC ZT Plus
Coordination with OVT Waste Heat Recovery & Utilization Project
Collaboration and Coordination with Other Institutions
Future Work & Path Forward
Optimize Synthesis Procedures for n-type (In,R)Co4Sb12 Compositions Good Reproducibility Fabricating Highly Dense Samples
Introduce Single & Multiple “Rattlers” (In, Rare Earth) in FexCo4-xSb12 , (i.e., Iny FexCo4-xSb12 ; Cey FexCo4-xSb12 ) For Better p-Type Materials
Characterize TE Properties & Validate with Third Party Testing (ORNL) Structural Property Measurements
n-type Skutterudite TE Materials Showing Excellent TE Properties (See Publication) p-type Skutterudite TE Materials Are More Challenging Structural & CTE Testing On-Going; Good Structural Stability Upon Thermal Cycling High Temperature Structural Test Equipment Operational & Calibrated
Challenges Batch to Batch ZT Reproducibility and Consistent Properties Sintering to High Dense Samples
Continue Evaluating Stability Issues During Thermal Cycling Benefits
System-Level Analyses Show OSU/PNNL Skutterudites Superiority (See Supplements) Higher Performance Than TAGS / PbTe Combinations & Other Skutterudite
Combinations TE Conversion Efficiencies Can Be High
9-10% in Automotive Applications in Preferred TE Design Regions 11-12%+ in a Direct-Fired APU System Potential Superiority to Other Materials in Automotive TE Systems
Bulk TE Materials for Easy Integration into TE Module / System Designs
24
Questions & Discussion
We are What We Repeatedly do. Excellence, Then, is not an Act, But a Habit.
Aristotle
AcknowledgementWe sincerely thank Jerry Gibbs, Office of Vehicle Technologies Propulsion Materials, for his support of this project.