18
Probabilistic Estimates of Deepwater Offshore Field Abandonment Cost 25-May-16

Probabilistic Estimates of Deepwater Offshore Field Abandonment Cost
25-May-16
2
3
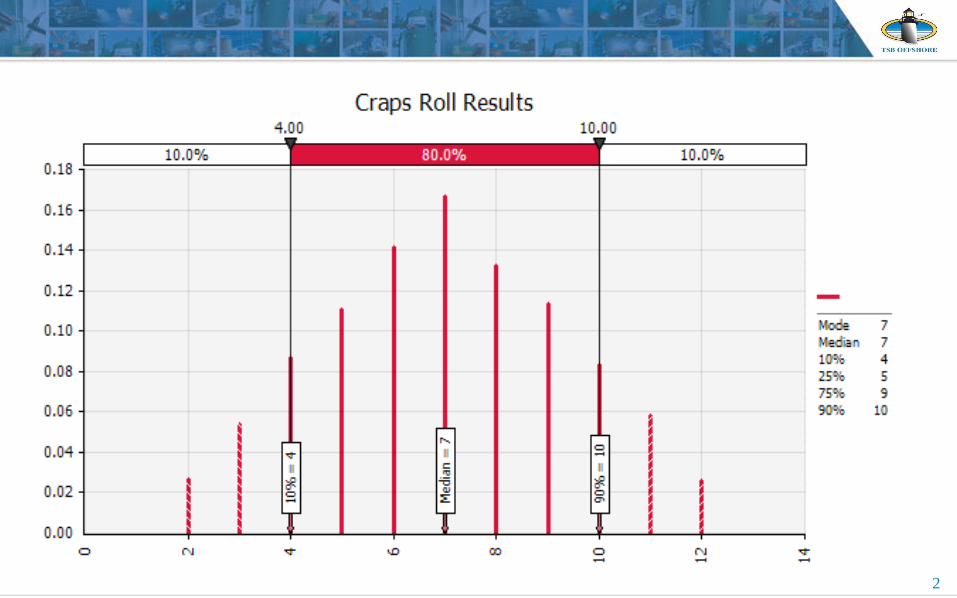
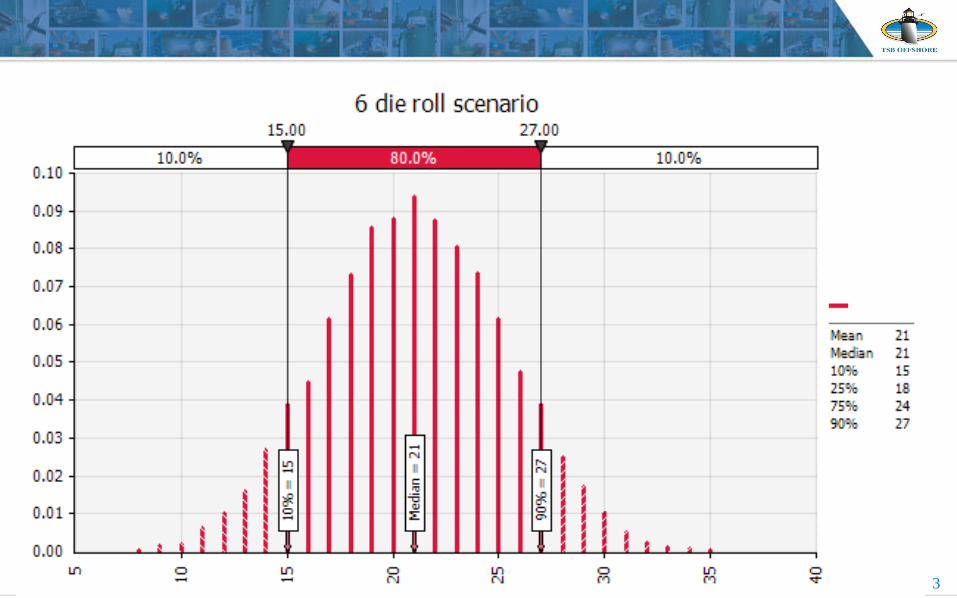
Why probabilistic?
What is known?
What is not known?
What can change (uncertainty)?
How can probabilistic estimates improve?
How to deal with uncertainty? – Probability!!!
4
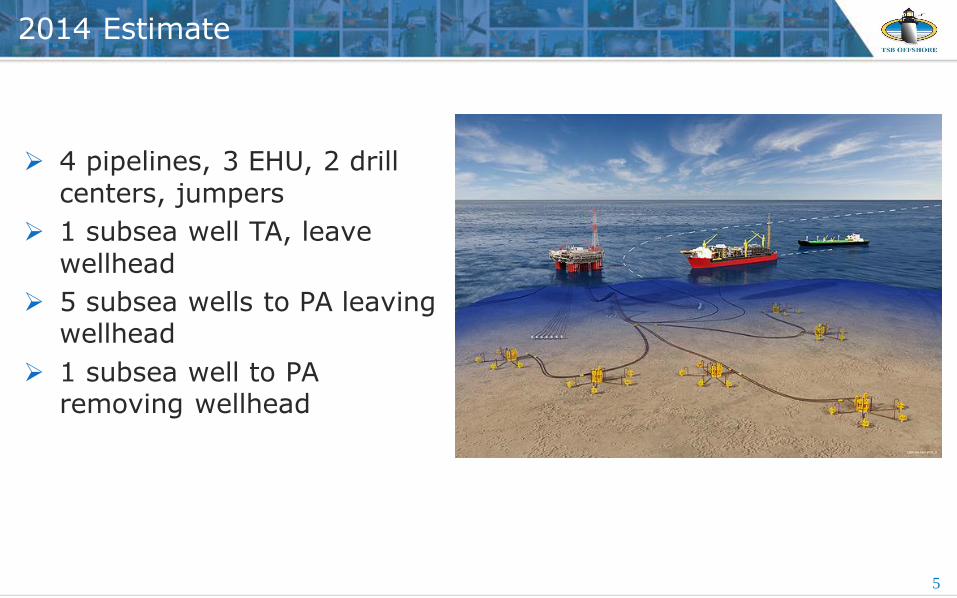
2014 Estimate
5
4 pipelines, 3 EHU, 2 drill centers, jumpers
1 subsea well TA, leave wellhead
5 subsea wells to PA leaving wellhead
1 subsea well to PA removing wellhead
2014 Estimate -> Update to 2016
6
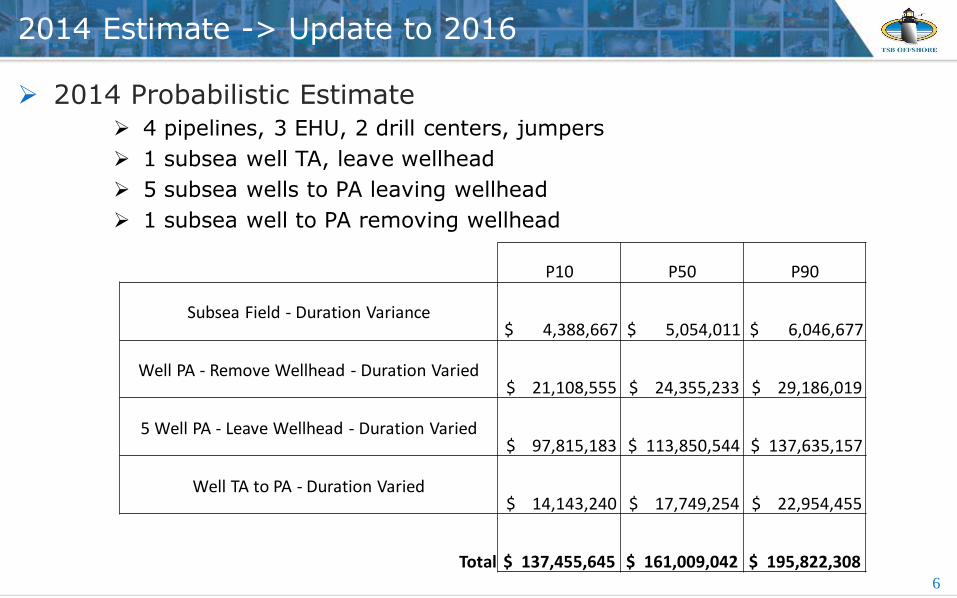
2014 Probabilistic Estimate 4 pipelines, 3 EHU, 2 drill centers, jumpers
1 subsea well TA, leave wellhead
5 subsea wells to PA leaving wellhead
1 subsea well to PA removing wellhead
P10 P50 P90
Subsea Field - Duration Variance$ 4,388,667 $ 5,054,011 $ 6,046,677
Well PA - Remove Wellhead - Duration Varied$ 21,108,555 $ 24,355,233 $ 29,186,019
5 Well PA - Leave Wellhead - Duration Varied$ 97,815,183 $ 113,850,544 $ 137,635,157
Well TA to PA - Duration Varied$ 14,143,240 $ 17,749,254 $ 22,954,455
Total $ 137,455,645 $ 161,009,042 $ 195,822,308
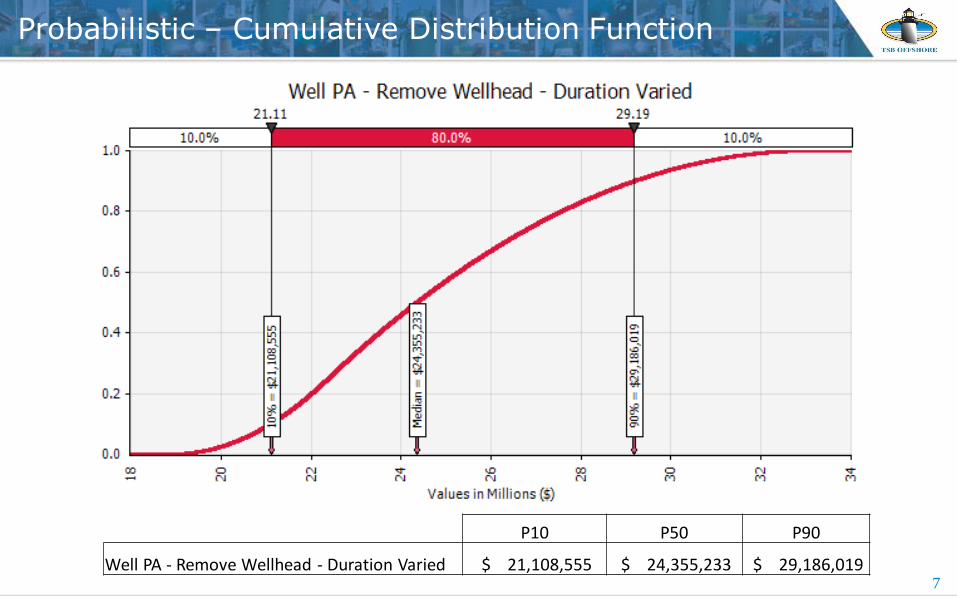
Probabilistic – Cumulative Distribution Function
7
P10 P50 P90
Well PA - Remove Wellhead - Duration Varied $ 21,108,555 $ 24,355,233 $ 29,186,019

What is known? Subsea field:
4 pipelines, 3 EHU, 2 drill centers, jumpers
1 subsea well TA, leave wellhead 5 subsea wells to PA leaving wellhead 1 subsea well to PA removing wellhead
Define actions Identify steps and durations for each
step Refine durations with minimum, most
likely, maximum Define requirements & limitations of
actions• Run rates, trip times, time to surface,
tool up, tool down, flush time, cut, etc…• Define limitations due to company or
vendor requirements
Start to build the model
8
Min Time (Hrs) Max Estimated Cost
13.6 16.0 19.2 $561,578
4.3 5.1 6.1 $177,833
5.1 6.0 7.2 $210,592
0.0 0.0 0.0 $0
0.0 0.0 0.0 $0
0.0 0.0 0.0 $0
0.0 0.0 0.0 $0
0.0 0.0 0.0 $0
12.8 15.0 26.3 RU riser, attach to well head, pull tree cap $501,480
4.3 5.0 6.5 $167,160
6.8 8.0 10.4$283,056
6.0 7.0 9.1 $234,024
8.5 10.0 17.5 Perform injectivity test, POOH CT, RIH CT with cement head $334,320
3.4 4.0 5.2 $152,228
Work Breakdown StructureDock Loadout and unload is Shared btw # of wells
Diagnostics
RU test and chart annulars
Contingency to squeeze annulars if injection established
Mobilize and Demobilize is Shared btw # of wells
Sea Trials (Ballast)
Arrange Equipment on Deck
RU cementing equipment, mix, pump, & squeeze perforations
RU pump on tubing, establish injection, squeeze perfs
RU SL for dummy run,Run dummy run to perf depth
RU e-line, RIH perf assy to perf to establish communication to each
zone
RU CT, RIH to perf depth
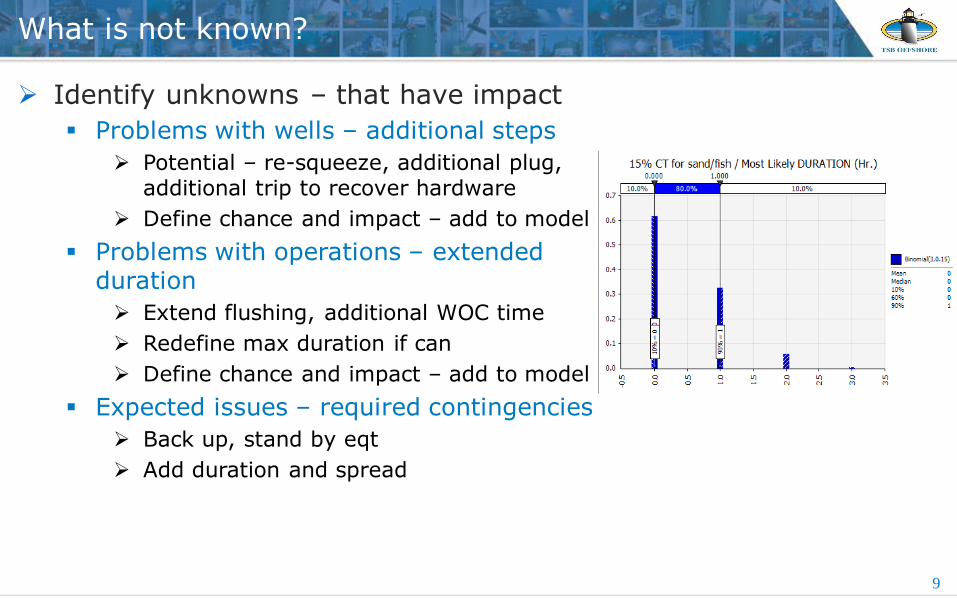
Identify unknowns – that have impact
Problems with wells – additional steps
Potential – re-squeeze, additional plug, additional trip to recover hardware
Define chance and impact – add to model
Problems with operations – extended duration
Extend flushing, additional WOC time
Redefine max duration if can
Define chance and impact – add to model
Expected issues – required contingencies
Back up, stand by eqt
Add duration and spread
What is not known?
9
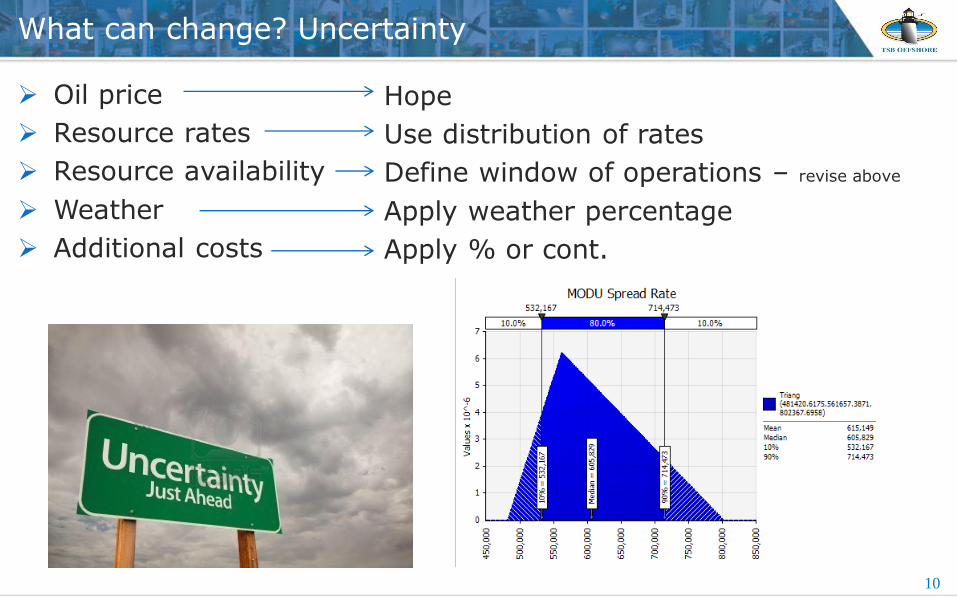
Oil price
Resource rates
Resource availability
Weather
Additional costs
What can change? Uncertainty
10
Hope
Use distribution of rates
Define window of operations – revise above
Apply weather percentage
Apply % or cont.
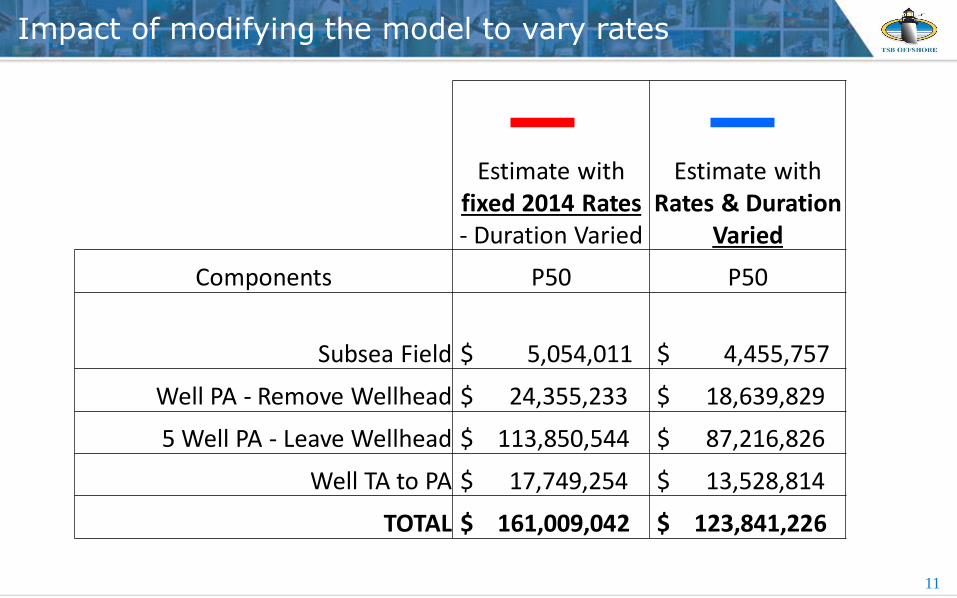
Impact of modifying the model to vary rates
11
Estimate with fixed 2014 Rates - Duration Varied
Estimate with Rates & Duration
Varied
Components P50 P50
Subsea Field $ 5,054,011 $ 4,455,757
Well PA - Remove Wellhead $ 24,355,233 $ 18,639,829
5 Well PA - Leave Wellhead $ 113,850,544 $ 87,216,826
Well TA to PA $ 17,749,254 $ 13,528,814
TOTAL $ 161,009,042 $ 123,841,226

Impact of modifying the model to vary rates
12
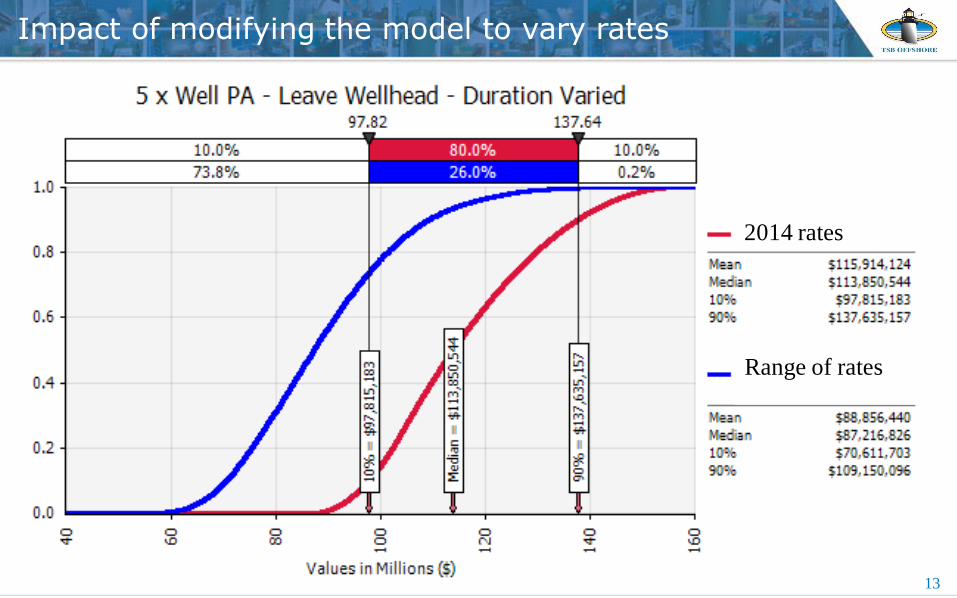
Impact of modifying the model to vary rates
13
2014 rates
Range of rates
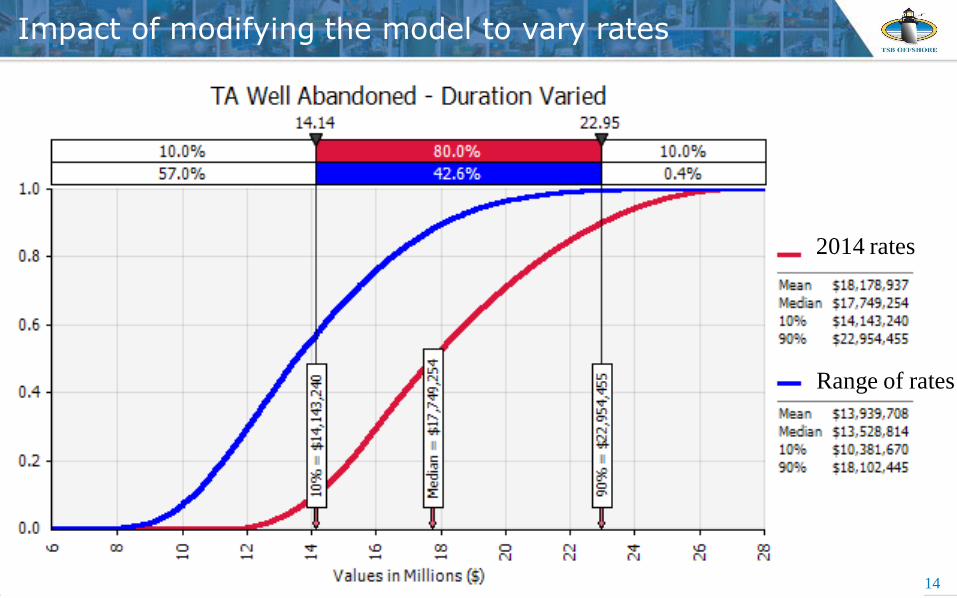
Impact of modifying the model to vary rates
14
2014 rates
Range of rates
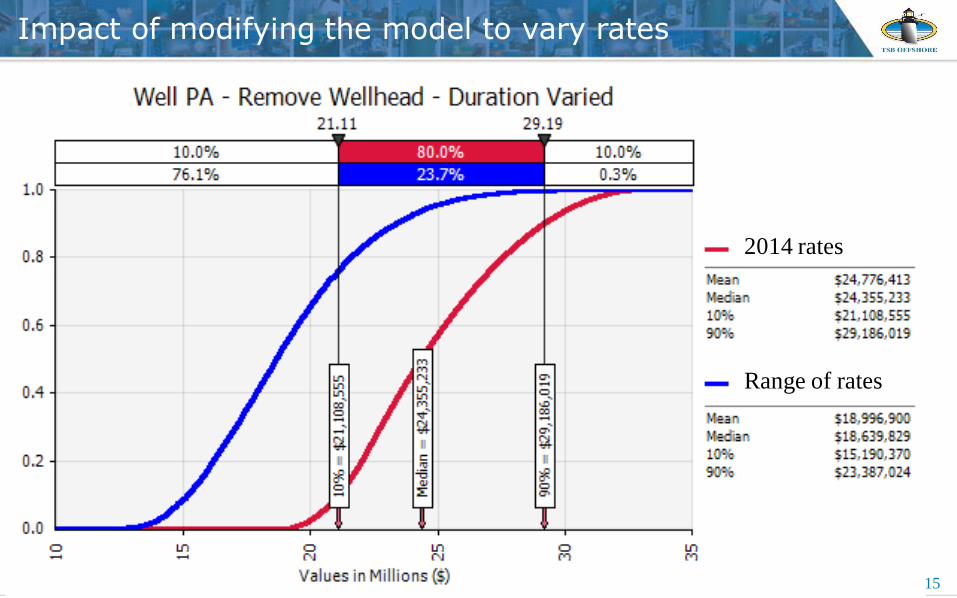
Impact of modifying the model to vary rates
15
2014 rates
Range of rates
How to make a better crystal ball…
Job data:
Field specific data – percentage problem wells, percentage squeeze success, durations of tasks (min/most likely/max)
WOC durations - effectiveness
Range of rates vs date of operation
Impact of previous problems – cost & duration
Better information = more accurate estimate
More data – larger pool
How can probabilistic estimates improve?
16
Will use of resins be more cost effective vs risk of a repeat squeeze?
Will use of Riserless intervention be more cost effective?
Probabilistic analysis can better define the costs for comparison
Can probabilistic estimates determine a methodology?
17

Questions?
Probabilistic analysis for the future…
18


