Probabilistic Projections of Mortality in Countries with Generalized HIV/AIDS Epidemics for Use in Total Population Projection * David J. Sharrow 1,6 , Yanjun He 2 , Samuel J. Clark 3,4,5 , and Adrian E. Raftery 2,3 1 University of Washington 2 Department of Statistics, University of Washington 3 Department of Sociology, University of Washington 4 Institute of Behavioral Science (IBS), University of Colorado at Boulder 5 MRC/Wits Rural Public Health and Health Transitions Research Unit (Agincourt), School of Public Health, Faculty of Health Sciences, University of the Witwatersrand 6 Corresponding author: [email protected]26 September 2014 * This work was supported by grants R01 HD054511, R01 HD070936, and K01 HD057246 from the Eunice Kennedy Shriver National Institute of Child Health and Human Development (NICHD). Raftery’s work was also supported by a Science Foundation Ireland E.T.S. Walton visitor award, grant reference 11/W.1/I2079.
Transcript
Probabilistic Projections of Mortality in Countries with
Generalized HIV/AIDS Epidemics for Use in Total
Population Projection∗
David J. Sharrow1,6, Yanjun He2, Samuel J. Clark3,4,5, and Adrian E.
Raftery2,3
1University of Washington
2Department of Statistics, University of Washington
3Department of Sociology, University of Washington
4Institute of Behavioral Science (IBS), University of Colorado at Boulder
5MRC/Wits Rural Public Health and Health Transitions Research Unit (Agincourt), School
of Public Health, Faculty of Health Sciences, University of the Witwatersrand
∗This work was supported by grants R01 HD054511, R01 HD070936, and K01 HD057246 from the EuniceKennedy Shriver National Institute of Child Health and Human Development (NICHD). Raftery’s work wasalso supported by a Science Foundation Ireland E.T.S. Walton visitor award, grant reference 11/W.1/I2079.
Abstract
The UN issued official probabilistic population projections for all countries to 2100
for the first time in July 2014. This was done by simulating future levels of total fertility
and life expectancy from Bayesian hierarchical models, and combining the results using
a standard cohort-component projection method. The 40 countries with generalized
HIV/AIDS epidemics were treated differently from others, in that the projections used
the highly multistate Spectrum/EPP model, a more complex 15-compartment model
that was designed for short-term projections of quantities relevant to policy for the epi-
demic. Here we propose a simpler approach that is more compatible with the existing
UN probabilistic projection methodology for other countries. Changes in life expectancy
are projected probabilistically using a simple time series regression model on current
life expectancy, HIV prevalence and ART coverage. These are then converted to age-
and sex-specific mortality rates using a new family of model life tables designed for
countries with HIV/AIDS epidemics that reproduces the characteristic hump in middle
adult mortality. These are then input to the standard cohort-component method, as
for other countries. The method performed well in an out-of-sample cross-validation
experiment. It gives similar population projections to Spectrum/EPP, while being sim-
where ∆e0,c,(t−5:t) is the change in life expectancy for country c at time t−5 to t, ∆eDL0,c,(t−5:t) is
the double logistic fitted change in life expectancy at time t−5 to t acting on life expectancy
at time t−5, γc,t−5 is HIV prevalence at time t−5 multiplied by the proportion of seropositive
individuals not receiving ART at time t− 5, and δc,t−5 is the error term.
The double logistic term mirrors the model used for countries not substantially impacted
by HIV/AIDS (Raftery et al. 2013) and reflects the transition from high to low mortality,
which can be broken down into two processes each represented by a single logistic function.
The first being initial slow growth in e0 with small improvements in mortality at low levels of
e0 resulting from gains in hygiene and nutrition followed by a quicker pace of improvement and
the second represents continuing gains from combating non-communicable diseases (United
Nations, Department of Economic and Social Affairs, Population Division 2013b, p. 28).
The model (Eq. 3) is estimated using five-year life expectancy estimates from 1985-2010
for the 40 countries experiencing a generalized HIV epidemic obtained from WPP 2012.2
We use median HIV prevalence for 1985-2010 as estimated by the EPP program. We use
estimates of ART coverage (percentage of seropositive individuals receiving ART) for the
period 1985-2010 obtained from UNPD internal tabulations (United Nations, Department
of Economic and Social Affairs, Population Division 2011). To make this model compatible
with the model for countries without generalized epidemics, we set β1, the coefficient for the
2These data are available in the R package wpp2012 (Sevcıkova et al. 2013).
7
double logistic curve, to 1 when we fit the model using regression. To project life expectancy
to 2100, we input each trajectory of HIV prevalence and life expectancy period by period
into the model starting from 2010.
2.3 Converting e0 and HIV Prevalence Projections to Age-Specific
Mortality Rates
Once we have obtained probabilistic projections of life expectancy and HIV prevalence, we
need to map those quantities onto a set of age-specific mortality rates that can be combined
with age-specific fertility rates and net migration using the cohort component method. In the
WPP 2012 Revision, for countries without high HIV prevalence, e0 projections are converted
to age-specific mortality rates using model mortality patterns (United Nations, Department
of Economic and Social Affairs, Population Division 2013b, p. 34), but these patterns are
unable to replicate the particular age pattern of mortality resulting from large scale HIV
epidemics (United Nations, Department of Economic and Social Affairs, Population Division
2013b, p. 35) and they have no relationship to HIV prevalence.
To convert the life expectancy and HIV prevalence projections to age-specific mortality
rates we use a model by Sharrow et al. (2014), shown in Eq. 4. This model can reproduce
the characteristic age pattern of mortality associated with generalized epidemics, i.e. an
accentuated adult mortality hump concentrated at ages 30 to 45. The model represents the
age pattern of mortality rates as a weighted sum of three age-varying components. The
components, bi,x in Eq. 4, are derived from a Singular Value Decomposition of the matrix of
observed mortality rates and the weights, ωi,`, are modeled as a function of HIV prevalence
and life expectancy at birth.3 We refer to this model as “HIV MLT,” for “HIV-calibrated
3Although ART coverage is not directly included as a predictor with HIV prevalence and life expectancy,the model mimics the likely effect of future ART scale up on age-specific mortality rates, because at highlevels of life expectancy (resulting from ART scale up), the model reduces the adult mortality hump even atvery high prevalence (Sharrow et al. 2014).
8
model life table.” The model is defined as follows:
ln(mx,`) = c` +3∑
i=1
ωi,`bi,x + εx,`, (4)
where mx,` is the period age-specific mortality rate for age x in life table `, c` is a constant
specific to life table `, bi,x is the value of the ith component for age x, ωi,` is the weight of
the ith component for life table `, and εx,`iid∼ N(0, σ2) is the error term.
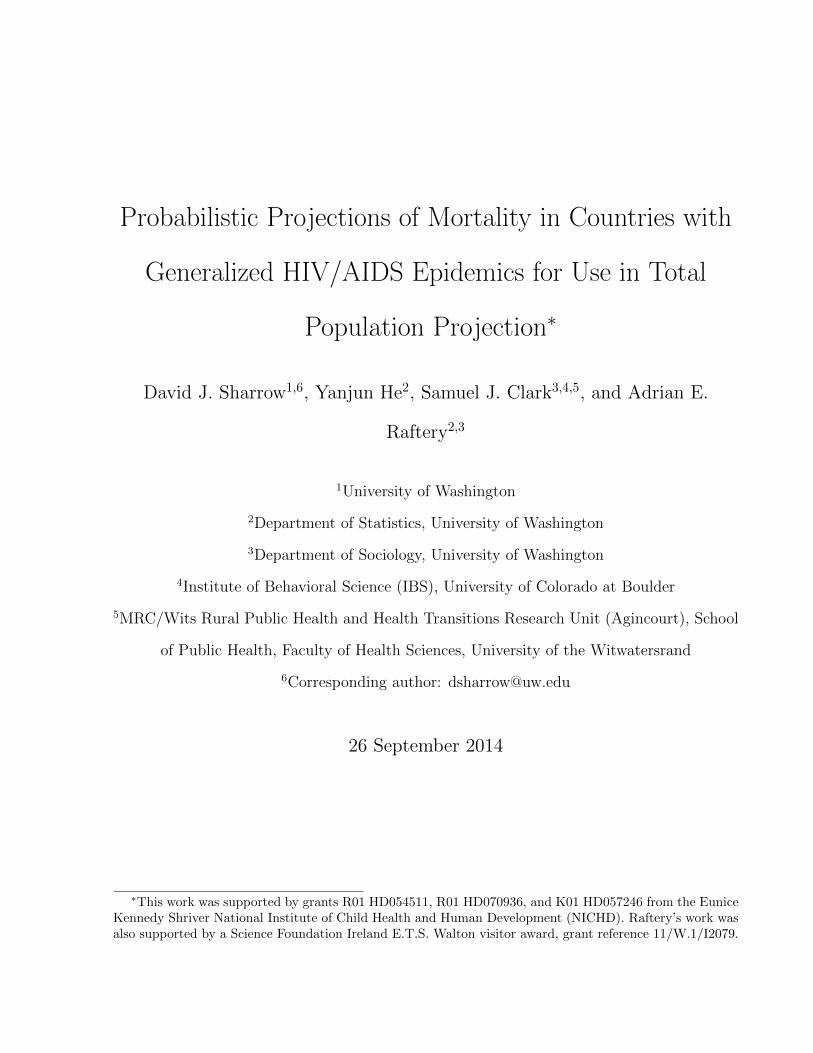
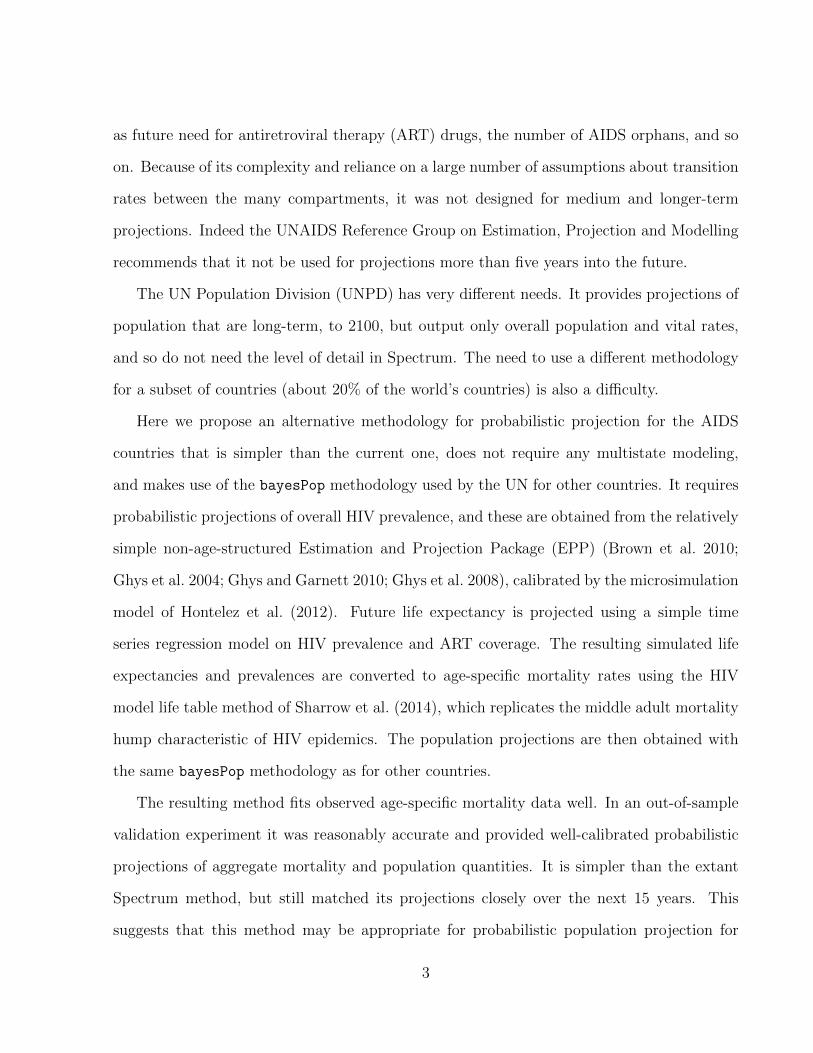
Figure 1 plots the fit from the HIV MLT model and four existing model life table systems
for Botswana females 2005-2010. HIV prevalence has remained high in Botswana and was
roughly 25 percent during this period, resulting in a large adult mortality hump. Figure
1 demonstrates how this pattern is fully captured only by the HIV MLT model. All other
systems tend to produce high, flat patterns of mortality rates that match the overall level
of mortality as measured by period life expectancy at birth but miss the age-specific rates,
which are critical for accurate population projection.
This model takes e0 and HIV prevalence as inputs and produces a set of age-specific
mortality rates that reflect those two inputs. HIV MLT is designed to produce a set of
age-specific mortality rates that yield an output life expectancy matching the input life
expectancy. The HIV MLT model was originally calibrated with sex-specific e0 (Sharrow
et al. 2014), but for the present purpose we have re-calibrated the model with the total
(non-sex-specific) e0 because that is what is projected by the model described in section 2.2.
To maintain the gap between male and female e0, the re-calibrated model produces complete
sets of male and female age-specific mortality rates simultaneously and matches the input e0
to the combined life expectancy derived from the output male and female mortality rates by
adjusting the intercept, c` in Eq. 4. Figure 1b plots the sex-specific output e0 from the HIV
MLT model while varying the two input parameters: non-sex-specific e0 and HIV prevalence.
The gap in life expectancy is maintained over all combinations of the two input parameters.
9
●
●
●
●
●
●
●
●●
●
●
● ●
●
●
●
●
●
●
●
●
●
0.001
0.002
0.005
0.010
0.020
0.050
0.100
0.200
0.500
Botswana 2005−2010
Age (years)
mor
talit
y ra
te (
log
scal
e)
0
1−4
5−9
10−
14
15−
19
20−
24
25−
29
30−
34
35−
39
40−
44
45−
49
50−
54
55−
59
60−
64
65−
69
70−
74
75−
79
80−
84
85−
89
90−
94
95−
99
100+
● WPP 2010HIV MLTWHOCDUNLog−Quad
(a) Fit of HIV MLT model for Botswana fe-males 2005-2010
● ● ● ● ● ● ● ● ● ● ● ● ●
50
60
70
80
90
% HIV Prevalence (model input)
e0 (
mod
el o
utpu
t)
0 2.5 5 7.5 10 12.5 15 17.5 20 22.5 25 27.5 30
● ● ● ● ● ● ● ● ● ● ● ● ●
●
Female input e0
50 60 70 80 90 ●
Male input e0
50 60 70 80 90
(b) Sex-specific e0 output for HIV MLT modelat varying e0 and prevalence inputs
Figure 1 Output from HIV MLT model. (a) Fit of HIV MLT model for Botswana females2005-2010. HIV MLT model shown with black line. For comparison, fits from the WHOmodified logit model (Murray et al. 2003) [red solid line], Coale and Demeny model lifetables (Coale and Demeny 1966; Coale et al. 1983) [green solid line], UN model life tablesfor developing countries (United Nations. Department of International Economic and SocialAffairs 1982) [teal solid line], and the Log-Quad model (Wilmoth et al. 2012) [purple solidline] are also shown. (b) Sex-specific output e0, varying the two HIV MLT model inputs:non-sex-specific e0 and HIV prevalence.
The HIV MLT model is calibrated with five-year age-specific mortality rates obtained
from WPP 2012 from 1985-2010 for the 40 countries experiencing a generalized epidemic.
HIV prevalence for calibrating this model is the same as for the model for projecting e0
(see section 2.2). To produce a draw from the predictive distribution of the vector of age-
specific mortality rates, a sample from each of the predictive distributions of e0 and prevalence
projections is first produced. Then a sample vector of age-specific mortality rates is produced
conditionally on the simulated values of e0 and HIV prevalence using Eq. 4.
10
2.4 Making Full Probabilistic Population Projections
We modified the bayesPop software (Sevcıkova and Raftery 2014), which combines the fer-
tility and mortality projections using the cohort component method, to make full population
projections. The software uses the method described by Raftery et al. (2012) to produce mor-
tality projections, so the package functions were altered to include the mortality methodology
described above.
3 Results
We discuss results here for four countries: Botswana, Lesotho, Mozambique and Ghana.
These countries were chosen to represent different levels of current HIV prevalence. In 2010
Botswana and Lesotho represent the largest epidemics with HIV prevalences of roughly 25
percent; Mozambique represents a smaller but still substantial epidemic (HIV prevalence in
2010 ≈ 15 percent); while Ghana has a small generalized epidemic (HIV prevalence in 2010
≈ 1.5 percent). Results for Botswana are shown in Figure 2, while results for the other three
countries are in Figs. S1-S3 in Supplemental Materials.
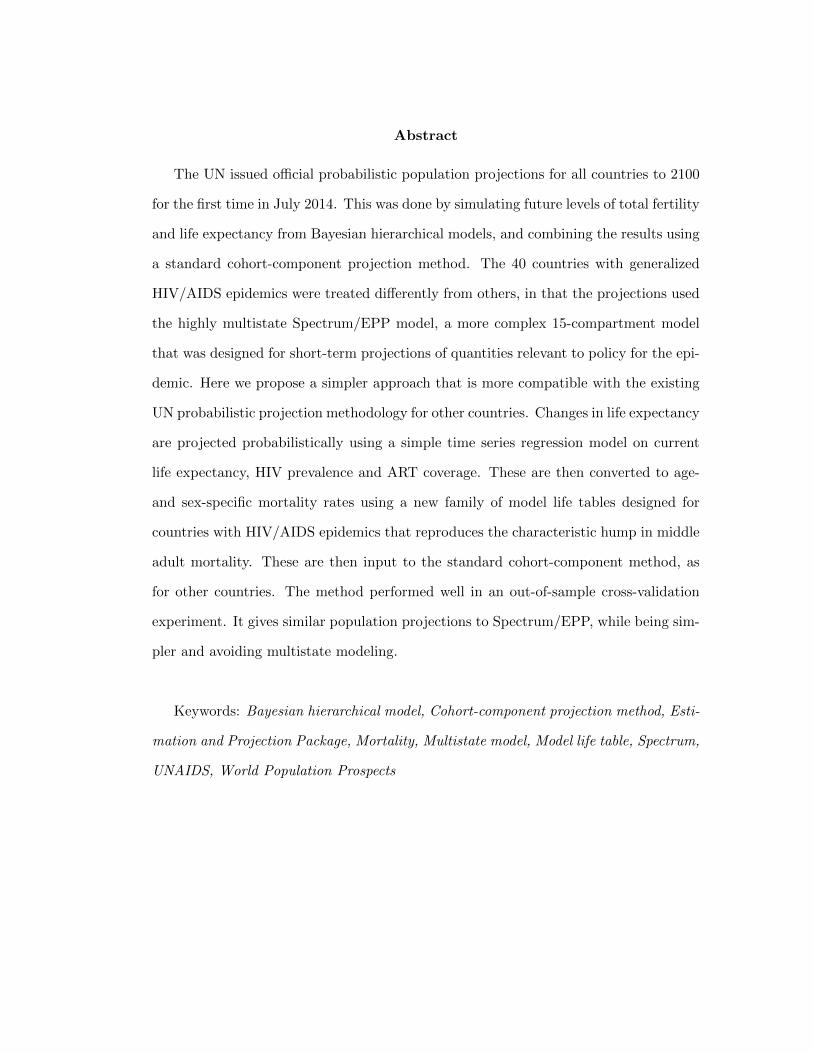
Panel a (top left) of Figure 2 plots the total population projection for Botswana. We
project an increase in population until about 2075 when the total population begins to decline.
Also in Figure 2a note the increasing width of the prediction intervals as the projection reaches
farther into the future reflecting the increase in uncertainty, a feature of the projection for all
countries. WPP 2012 (solid blue line) also shows sustained population growth followed by a
mild reversal in that trend around 2075, but our median projection predicts fewer people in
the total population over the entire projection horizon.
The differences from WPP result mainly from our treatment of mortality, which is de-
pendent on projection of HIV prevalence and life expectancy. Botswana is experiencing one
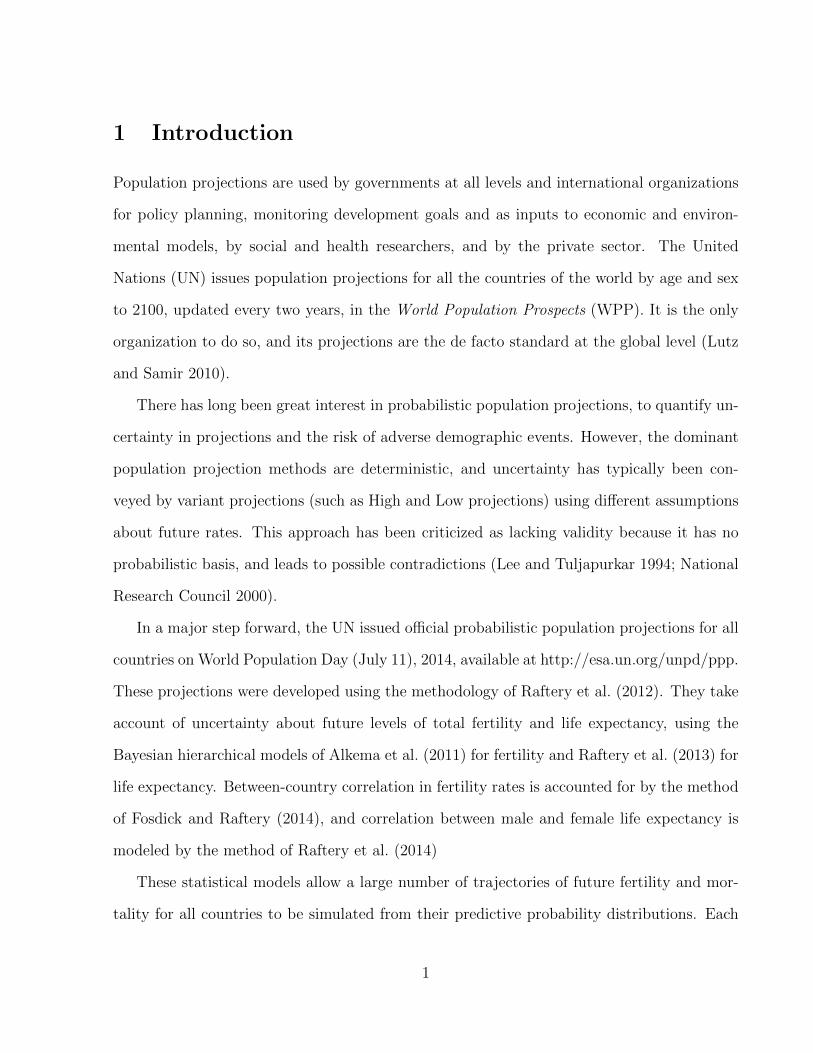
of the largest HIV epidemics in the world in terms of prevalence. Figure 3 shows the prob-
11
● ● ●●
●●
●
●
●
●
●●
●
Botswana
Pop
ulat
ion
Pro
ject
ion
(1,
000s
)
1950 1975 2000 2025 2050 2075 2100
1000
2000
3000
4000
●
median80% PI95% PIWPP 2012observed
(a) Population Projection: total population
●
●
●
●
●
●
●
●● ● ● ●
●
50
100
150
200
250
300
Botswana
Pop
ulat
ion
Pro
ject
ion
Age
0−
4 (1
,000
s)1950 1975 2000 2025 2050 2075 2100
●
median80% PI95% PIWPP 2012observed
(b) Population Projection: age 0-4
● ● ●●
●●
●
●
●
●
●
●●
200
400
600
800
1000
Botswana
Pop
ulat
ion
Pro
ject
ion
Age
15−
49 F
emal
e (1
,000
s)
1950 1975 2000 2025 2050 2075 2100
●
median80% PI95% PIWPP 2012observed
(c) Population Projection: female age 15-49
0.0
0.1
0.2
0.3
0.4
0.5
0.6
Botswana
Pro
babi
lity
of D
eath
, Age
10−
44 F
emal
e
2020 2040 2060 2080 2100
●
median80% PI95% PIWPP 2012observed
(d) Projection of female 35q10
Figure 2 Probabilistic population projections for Botswana 2010-2100. Observed data: blackcircles; median probabilistic projection: solid red line, 80% predictive interval: dashed redlines; 95% predictive interval: dotted red lines; WPP 2012 projection: solid blue line.
12
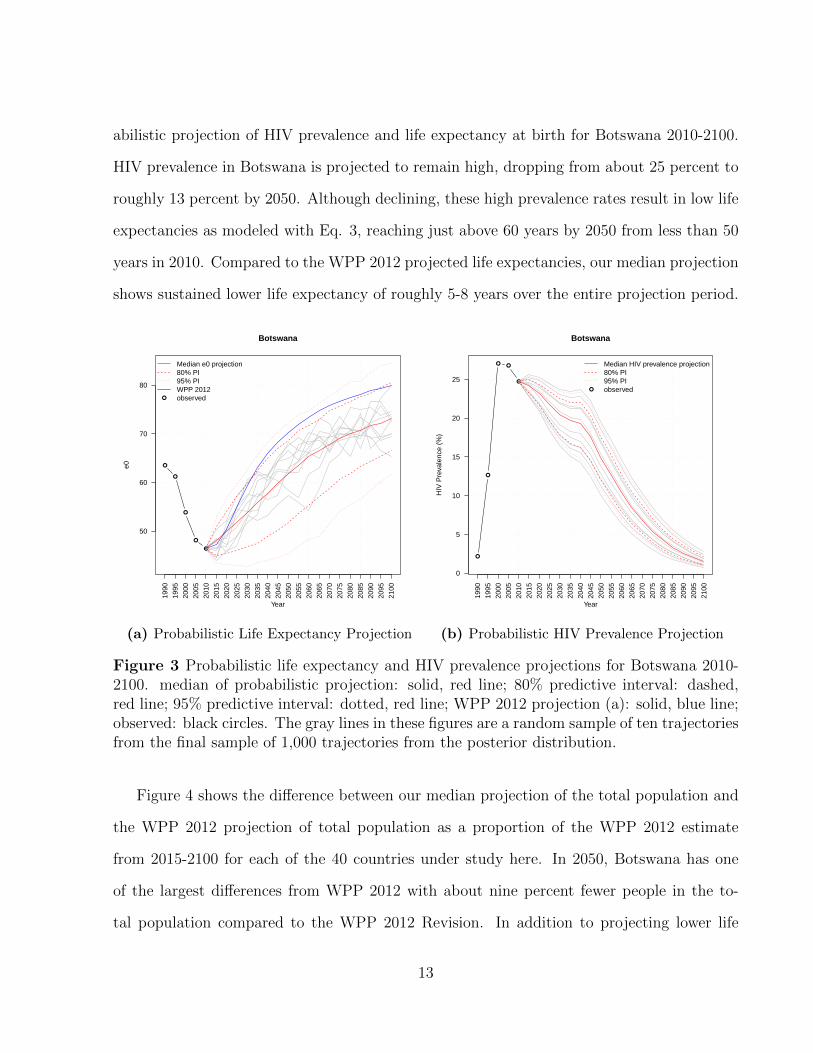
abilistic projection of HIV prevalence and life expectancy at birth for Botswana 2010-2100.
HIV prevalence in Botswana is projected to remain high, dropping from about 25 percent to
roughly 13 percent by 2050. Although declining, these high prevalence rates result in low life
expectancies as modeled with Eq. 3, reaching just above 60 years by 2050 from less than 50
years in 2010. Compared to the WPP 2012 projected life expectancies, our median projection
shows sustained lower life expectancy of roughly 5-8 years over the entire projection period.
●
●
●
●
●
50
60
70
80
Botswana
Year
e0
1990
1995
2000
2005
2010
2015
2020
2025
2030
2035
2040
2045
2050
2055
2060
2065
2070
2075
2080
2085
2090
2095
2100
●
Median e0 projection80% PI95% PIWPP 2012observed
(a) Probabilistic Life Expectancy Projection
●
●
● ●
●
0
5
10
15
20
25
Botswana
Year
HIV
Pre
vale
nce
(%)
1990
1995
2000
2005
2010
2015
2020
2025
2030
2035
2040
2045
2050
2055
2060
2065
2070
2075
2080
2085
2090
2095
2100
●
Median HIV prevalence projection80% PI95% PIobserved
(b) Probabilistic HIV Prevalence Projection
Figure 3 Probabilistic life expectancy and HIV prevalence projections for Botswana 2010-2100. median of probabilistic projection: solid, red line; 80% predictive interval: dashed,red line; 95% predictive interval: dotted, red line; WPP 2012 projection (a): solid, blue line;observed: black circles. The gray lines in these figures are a random sample of ten trajectoriesfrom the final sample of 1,000 trajectories from the posterior distribution.
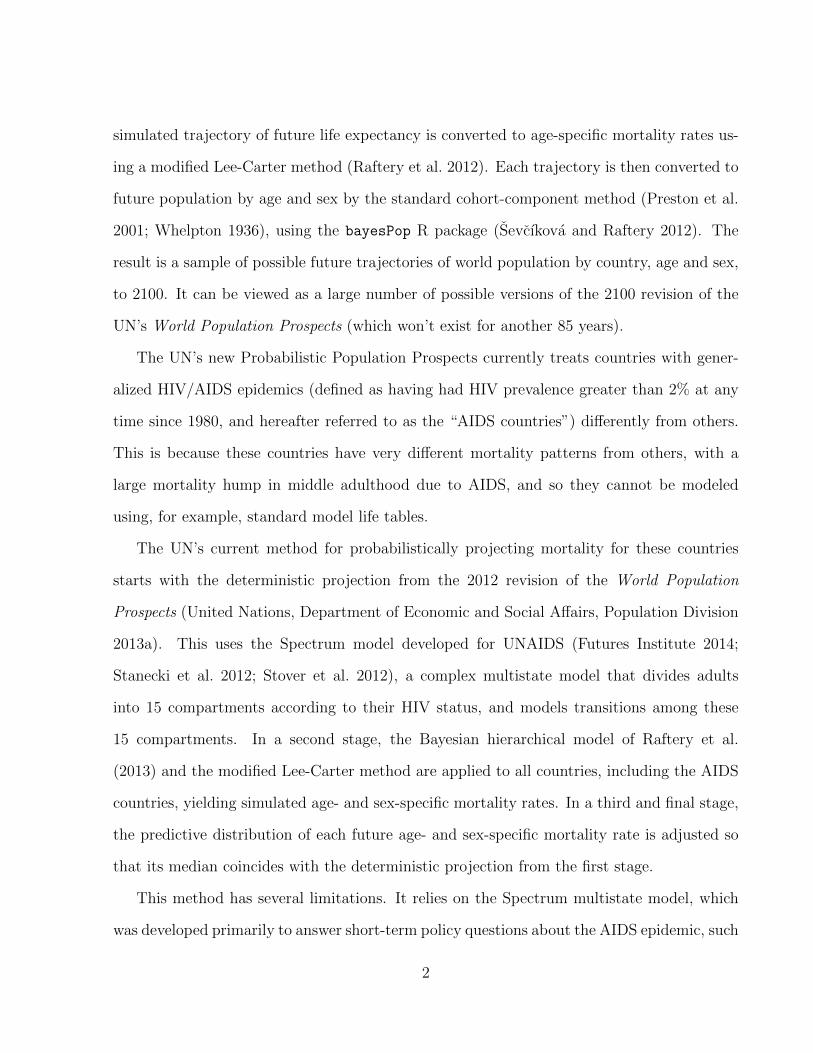
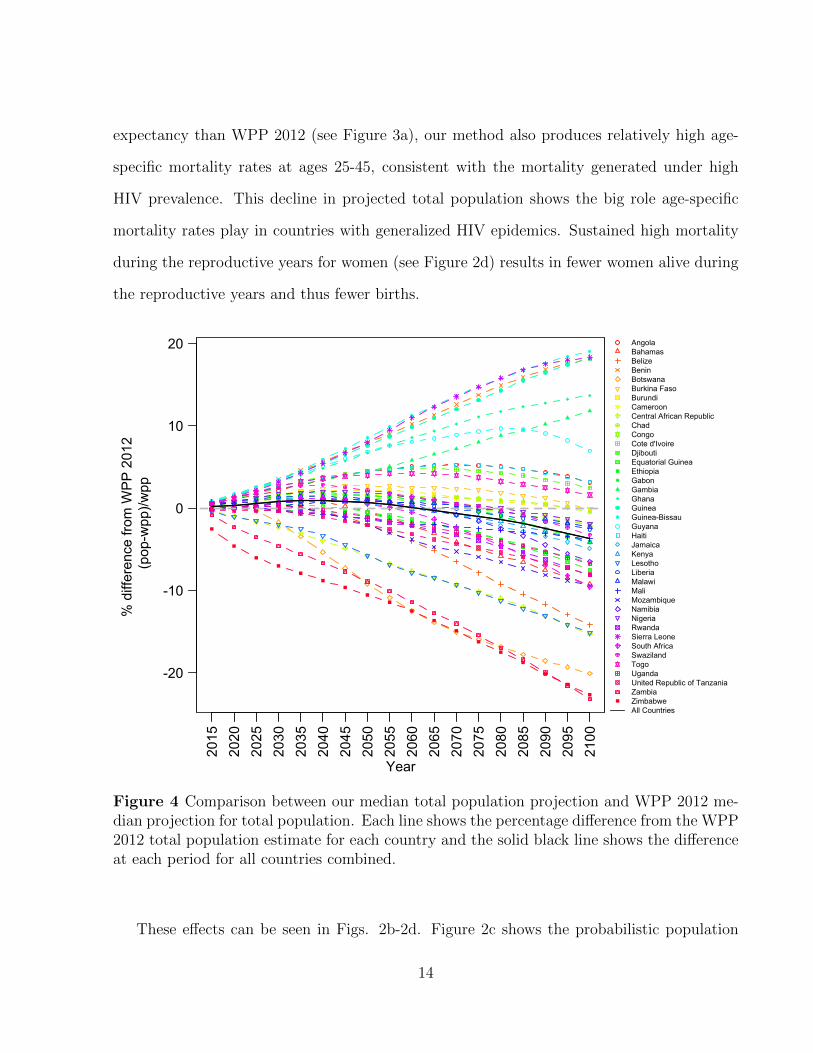
Figure 4 shows the difference between our median projection of the total population and
the WPP 2012 projection of total population as a proportion of the WPP 2012 estimate
from 2015-2100 for each of the 40 countries under study here. In 2050, Botswana has one
of the largest differences from WPP 2012 with about nine percent fewer people in the to-
tal population compared to the WPP 2012 Revision. In addition to projecting lower life
13
expectancy than WPP 2012 (see Figure 3a), our method also produces relatively high age-
specific mortality rates at ages 25-45, consistent with the mortality generated under high
HIV prevalence. This decline in projected total population shows the big role age-specific
mortality rates play in countries with generalized HIV epidemics. Sustained high mortality
during the reproductive years for women (see Figure 2d) results in fewer women alive during
the reproductive years and thus fewer births.
-20
-10
0
10
20
Year
% d
iffer
ence
from
WP
P 2
012
(pop
-wpp
)/wpp
2015
2020
2025
2030
2035
2040
2045
2050
2055
2060
2065
2070
2075
2080
2085
2090
2095
2100
AngolaBahamasBelizeBeninBotswanaBurkina FasoBurundiCameroonCentral African RepublicChadCongoCote d'IvoireDjiboutiEquatorial GuineaEthiopiaGabonGambiaGhanaGuineaGuinea-BissauGuyanaHaitiJamaicaKenyaLesothoLiberiaMalawiMaliMozambiqueNamibiaNigeriaRwandaSierra LeoneSouth AfricaSwazilandTogoUgandaUnited Republic of TanzaniaZambiaZimbabweAll Countries
Figure 4 Comparison between our median total population projection and WPP 2012 me-dian projection for total population. Each line shows the percentage difference from the WPP2012 total population estimate for each country and the solid black line shows the differenceat each period for all countries combined.
These effects can be seen in Figs. 2b-2d. Figure 2c shows the probabilistic population
14
projection for women aged 15-49. We project a decline in the number of women in this age
category beginning around 2050, and Figure 2b shows a shrinking population under age five
over the entire projection period. The effect of high mortality in the reproductive adult years
on future population size, especially for women, reverberates for a number of years as smaller
cohorts are born in each projected period, resulting in smaller total population compared to
WPP 2012. Combined with declining fertility, the effect of high adult mortality yields an
eventual reversal in population growth for Botswana.
Similar conditions exist for the other countries with the top five negative proportional
differences at 2050 (Zimbabwe, Botswana, Zambia, Lesotho, and Central African Republic
all with differences of greater than five percent) shown in Figure 4. All five of these countries
have large scale HIV epidemics (> 10% prevalence), again reducing the number of women of
reproductive age resulting in smaller birth cohorts. Lesotho is projected to have about 5.8
percent fewer people in the total population in 2050 compared to the WPP 2012 Revision.
HIV prevalence is also projected to decline from about 24 percent to 18 percent between 2010
and 2050. We project higher probabilities of death for women of reproductive age compared
to WPP 2012 (Figure S1d) over almost the entire projection period resulting in a likely
decreasing number of women of reproductive age past 2050 (Figure S1c) and consequently
smaller birth cohorts over the projection horizon (Figure S1b).
For countries with smaller HIV epidemics, the reduction in the number of women of
reproductive age is less severe and thus the difference between our projections and WPP
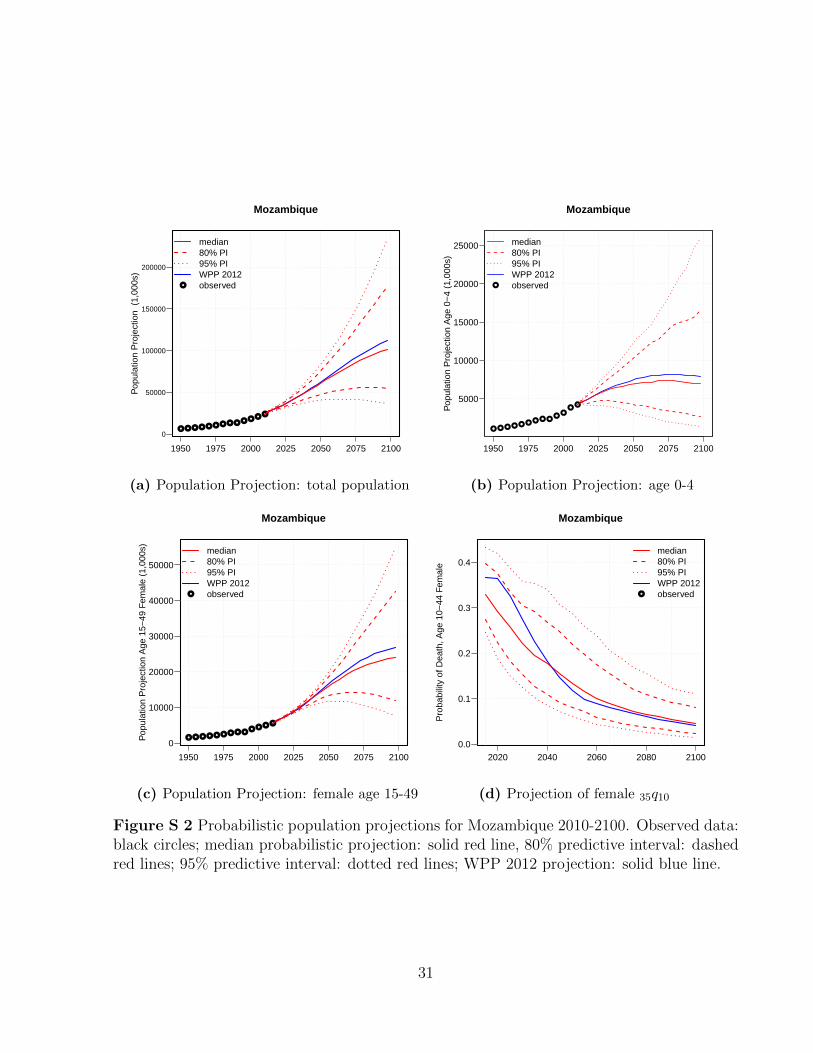
2012 tends to be smaller. Mozambique is projected to have just under 10 percent prevalence
(median projection) by 2050, down from around 15 percent in 2010. Figure S2a shows that
our median projection of the total population is similar to the WPP 2012 projection, but
we again project a smaller total population (2 percent fewer people in 2050, see Figure 4).
The smaller differences from WPP 2012 can also be seen in Figs. S2b and S2c showing the
population projections for under age five and women age 15-49 respectively.
15
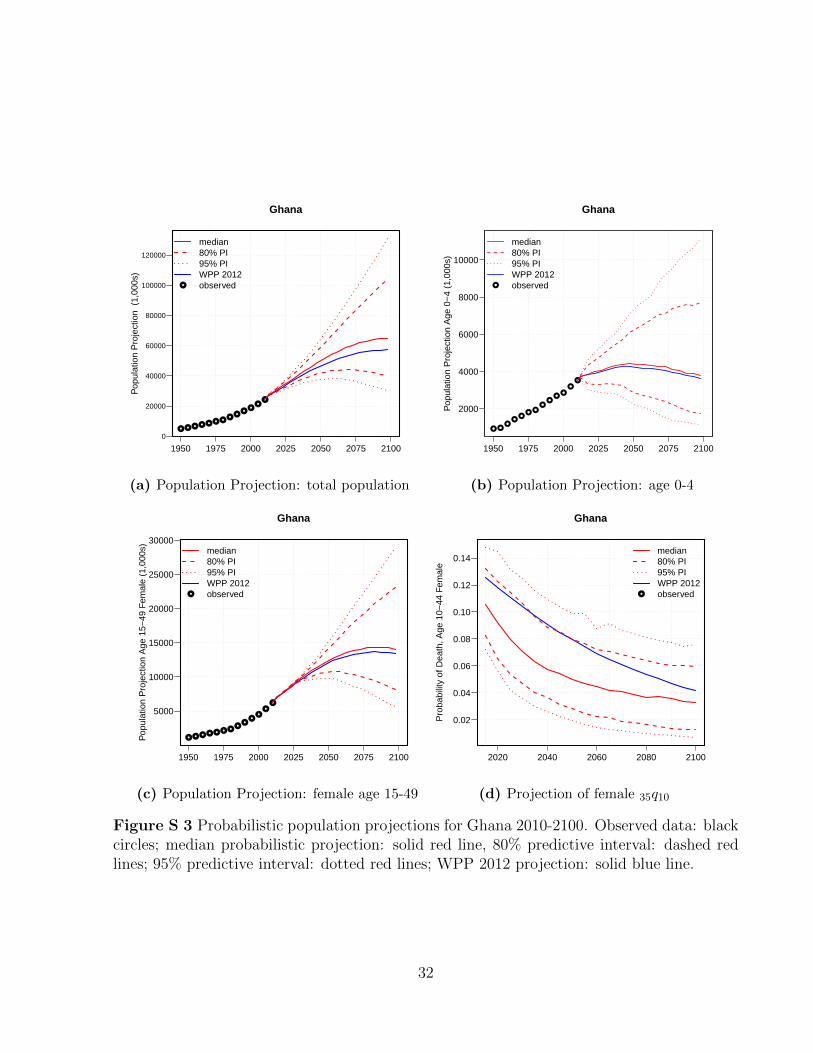
For Ghana, where HIV prevalence is projected to decrease from about 1.5 percent in 2010
to under one percent by 2050, the difference from WPP 2012 is in the opposite direction. We
project about 6.7 percent more people in the total population by 2050 compared to WPP
2012. The much lower rates of HIV prevalence have a far less extreme depressing effect on
total population in Ghana in the long run as evidenced by Figs. S3b and S3c. In addition to
relatively little effect from HIV on the age-specific mortality rates, compared to WPP 2012,
we project consistently higher life expectancy over the projection period for Ghana along
with the other top five positive difference countries compared to WPP 2012 (Guinea-Bissau,
Sierra Leone, Benin, Guinea, and Guyana; see Figure 4).
Figure 5 plots the probabilistic projections of life expectancy for the six countries with the
largest positive proportional differences in projected population at 2050, as shown in Figure
4. Figure 5 also depicts the life expectancy derived from the WPP 2012 mortality projections
for these countries As this figure shows, a large portion of the difference between the WPP
2012 total population projections and our median projections for these countries arises from
differences in the projections of life expectancy, since these countries have comparatively small
HIV epidemics, which will limit the influence of prevalence on the age pattern of mortality
rates.
4 Validation
4.1 Out-of-Sample Validation
To validate our method, we calibrated the e0 projection and HIV MLT models with 5-
year data from the WPP 2012 revision 1985-2005 and used those models to generate a
population projection for the 2005-2010 period for 38 countries.4 We then compare the
4Sierra Leone and Liberia were excluded from this validation experiment because they do not have ante-natal clinic or national population based survey data before 2005 so we cannot make prevalence projections.
16
●
●
●●
●
50
60
70
80
90
Guinea−Bissau
Year
e0
1990
1995
2000
2005
2010
2015
2020
2025
2030
2035
2040
2045
2050
2055
2060
2065
2070
2075
2080
2085
2090
2095
2100
●
Median e0 projection80% PI95% PIWPP 2012observed
(a) Guinea-Bissau
●
●●
●
●
40
50
60
70
80
Sierra Leone
Year
e0
1990
1995
2000
2005
2010
2015
2020
2025
2030
2035
2040
2045
2050
2055
2060
2065
2070
2075
2080
2085
2090
2095
2100
●
Median e0 projection80% PI95% PIWPP 2012observed
(b) Sierra Leone
●
● ●
●
●
60
70
80
90
Benin
Year
e0
1990
1995
2000
2005
2010
2015
2020
2025
2030
2035
2040
2045
2050
2055
2060
2065
2070
2075
2080
2085
2090
2095
2100
●
Median e0 projection80% PI95% PIWPP 2012observed
(c) Benin
●
● ● ●
●
50
60
70
80
90
Guinea
Year
e0
1990
1995
2000
2005
2010
2015
2020
2025
2030
2035
2040
2045
2050
2055
2060
2065
2070
2075
2080
2085
2090
2095
2100
●
Median e0 projection80% PI95% PIWPP 2012observed
(d) Guinea
●
●●
●
●65
70
75
80
85
90
Guyana
Year
e0
1990
1995
2000
2005
2010
2015
2020
2025
2030
2035
2040
2045
2050
2055
2060
2065
2070
2075
2080
2085
2090
2095
2100
●
Median e0 projection80% PI95% PIWPP 2012observed
(e) Guyana
●
●●
●
●60
70
80
90
Ghana
Year
e0
1990
1995
2000
2005
2010
2015
2020
2025
2030
2035
2040
2045
2050
2055
2060
2065
2070
2075
2080
2085
2090
2095
2100
●
Median e0 projection80% PI95% PIWPP 2012observed
(f) Ghana
Figure 5 Probabilistic life expectancy projections for six countries 2010-2100. median ofprobabilistic projection: solid, red line; 80% predictive interval: dashed, red line; 95% predic-tive interval: dotted, red line; WPP 2012 projection: solid, blue line; observed: black circles.The gray lines in these figures are a random sample of ten trajectories from the final sampleof 1,000 trajectories from the posterior distribution.
17
resulting mortality and population distributions with the observations from WPP 2012 for
2005-2010.
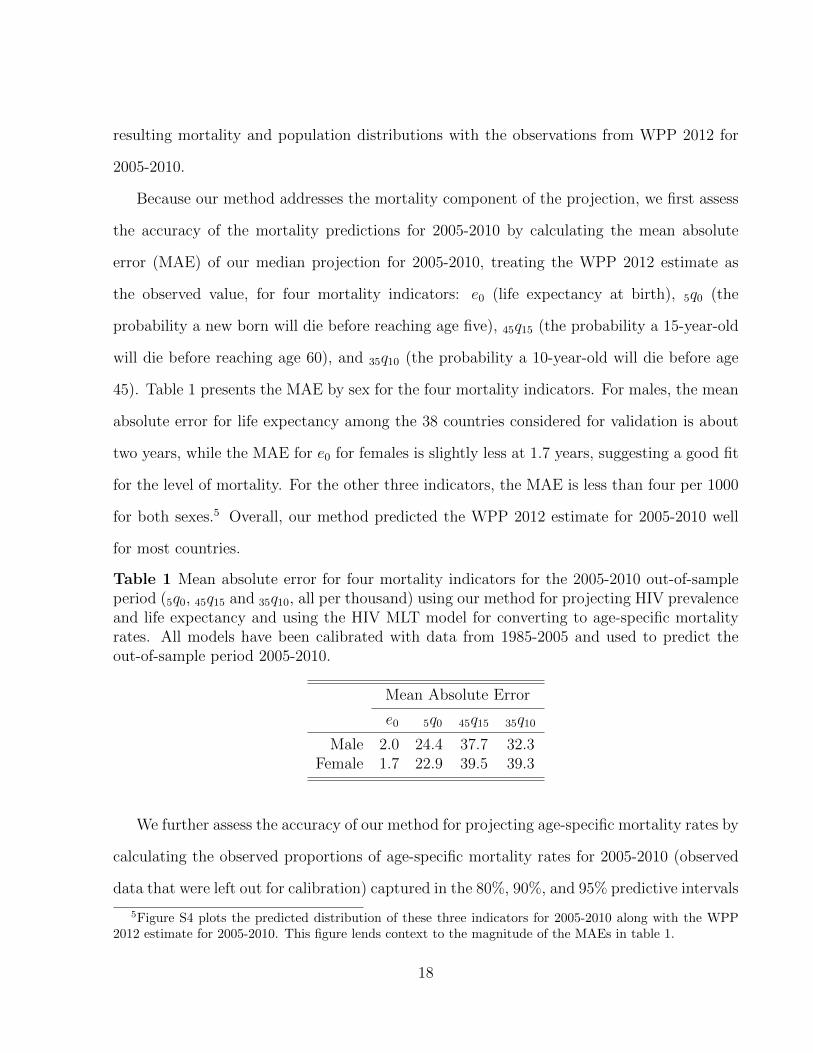
Because our method addresses the mortality component of the projection, we first assess
the accuracy of the mortality predictions for 2005-2010 by calculating the mean absolute
error (MAE) of our median projection for 2005-2010, treating the WPP 2012 estimate as
the observed value, for four mortality indicators: e0 (life expectancy at birth), 5q0 (the
probability a new born will die before reaching age five), 45q15 (the probability a 15-year-old
will die before reaching age 60), and 35q10 (the probability a 10-year-old will die before age
45). Table 1 presents the MAE by sex for the four mortality indicators. For males, the mean
absolute error for life expectancy among the 38 countries considered for validation is about
two years, while the MAE for e0 for females is slightly less at 1.7 years, suggesting a good fit
for the level of mortality. For the other three indicators, the MAE is less than four per 1000
for both sexes.5 Overall, our method predicted the WPP 2012 estimate for 2005-2010 well
for most countries.
Table 1 Mean absolute error for four mortality indicators for the 2005-2010 out-of-sampleperiod (5q0, 45q15 and 35q10, all per thousand) using our method for projecting HIV prevalenceand life expectancy and using the HIV MLT model for converting to age-specific mortalityrates. All models have been calibrated with data from 1985-2005 and used to predict theout-of-sample period 2005-2010.
Mean Absolute Error
e0 5q0 45q15 35q10
Male 2.0 24.4 37.7 32.3Female 1.7 22.9 39.5 39.3
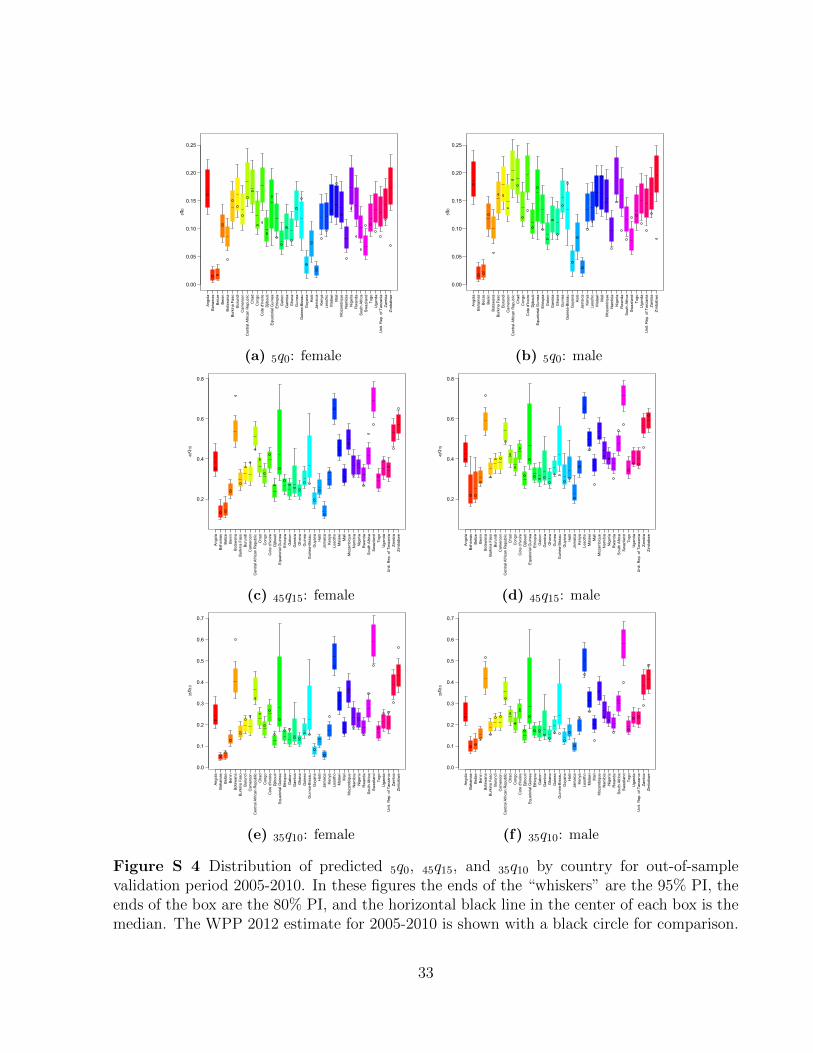
We further assess the accuracy of our method for projecting age-specific mortality rates by
calculating the observed proportions of age-specific mortality rates for 2005-2010 (observed
data that were left out for calibration) captured in the 80%, 90%, and 95% predictive intervals
5Figure S4 plots the predicted distribution of these three indicators for 2005-2010 along with the WPP2012 estimate for 2005-2010. This figure lends context to the magnitude of the MAEs in table 1.
18
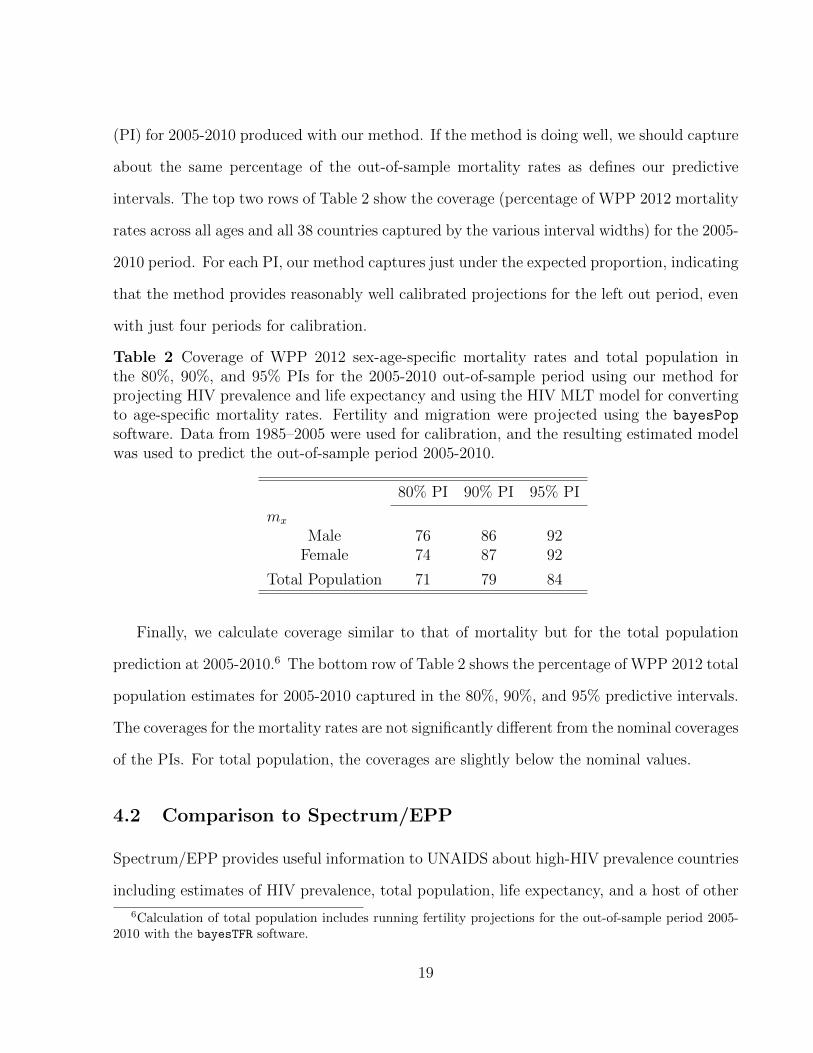
(PI) for 2005-2010 produced with our method. If the method is doing well, we should capture
about the same percentage of the out-of-sample mortality rates as defines our predictive
intervals. The top two rows of Table 2 show the coverage (percentage of WPP 2012 mortality
rates across all ages and all 38 countries captured by the various interval widths) for the 2005-
2010 period. For each PI, our method captures just under the expected proportion, indicating
that the method provides reasonably well calibrated projections for the left out period, even
with just four periods for calibration.
Table 2 Coverage of WPP 2012 sex-age-specific mortality rates and total population inthe 80%, 90%, and 95% PIs for the 2005-2010 out-of-sample period using our method forprojecting HIV prevalence and life expectancy and using the HIV MLT model for convertingto age-specific mortality rates. Fertility and migration were projected using the bayesPop
software. Data from 1985–2005 were used for calibration, and the resulting estimated modelwas used to predict the out-of-sample period 2005-2010.
80% PI 90% PI 95% PI
mx
Male 76 86 92Female 74 87 92
Total Population 71 79 84
Finally, we calculate coverage similar to that of mortality but for the total population
prediction at 2005-2010.6 The bottom row of Table 2 shows the percentage of WPP 2012 total
population estimates for 2005-2010 captured in the 80%, 90%, and 95% predictive intervals.
The coverages for the mortality rates are not significantly different from the nominal coverages
of the PIs. For total population, the coverages are slightly below the nominal values.
4.2 Comparison to Spectrum/EPP
Spectrum/EPP provides useful information to UNAIDS about high-HIV prevalence countries
including estimates of HIV prevalence, total population, life expectancy, and a host of other
6Calculation of total population includes running fertility projections for the out-of-sample period 2005-2010 with the bayesTFR software.
19
demographic and epidemiological variables in the short term (five years). However, it is, of
necessity, quite complex. We propose a simpler method to project over a longer projection
horizon.
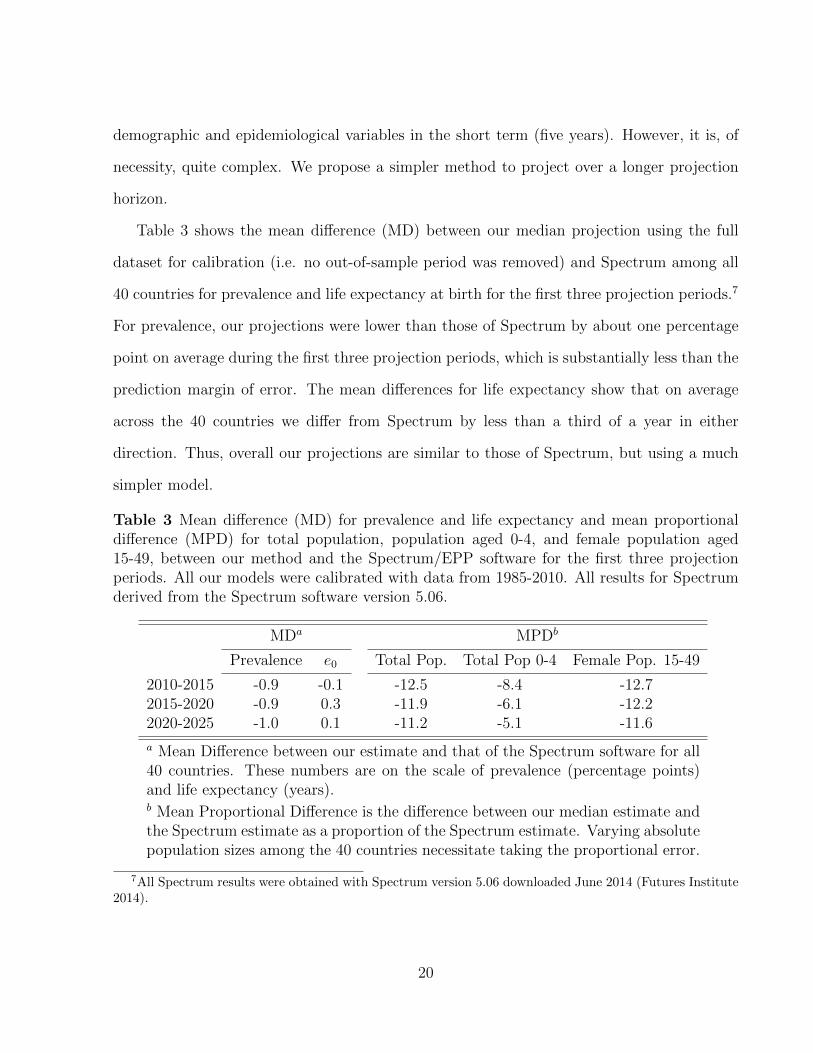
Table 3 shows the mean difference (MD) between our median projection using the full
dataset for calibration (i.e. no out-of-sample period was removed) and Spectrum among all
40 countries for prevalence and life expectancy at birth for the first three projection periods.7
For prevalence, our projections were lower than those of Spectrum by about one percentage
point on average during the first three projection periods, which is substantially less than the
prediction margin of error. The mean differences for life expectancy show that on average
across the 40 countries we differ from Spectrum by less than a third of a year in either
direction. Thus, overall our projections are similar to those of Spectrum, but using a much
simpler model.
Table 3 Mean difference (MD) for prevalence and life expectancy and mean proportionaldifference (MPD) for total population, population aged 0-4, and female population aged15-49, between our method and the Spectrum/EPP software for the first three projectionperiods. All our models were calibrated with data from 1985-2010. All results for Spectrumderived from the Spectrum software version 5.06.
MDa MPDb
Prevalence e0 Total Pop. Total Pop 0-4 Female Pop. 15-49
a Mean Difference between our estimate and that of the Spectrum software for all40 countries. These numbers are on the scale of prevalence (percentage points)and life expectancy (years).b Mean Proportional Difference is the difference between our median estimate andthe Spectrum estimate as a proportion of the Spectrum estimate. Varying absolutepopulation sizes among the 40 countries necessitate taking the proportional error.
7All Spectrum results were obtained with Spectrum version 5.06 downloaded June 2014 (Futures Institute2014).
20
The right three columns of Table 3 show the mean proportional difference (MPD) between
our median projection and Spectrum for three population quantities: the total population
across all ages, the total population aged 0-4, and the female population aged 15-49. The
MPD is the average difference between our median estimate and Spectrum as a proportion of
the Spectrum estimate for a given population indicator. Again, we present a simpler method
but it should approximate Spectrum at least in the short run. For total population, our
median estimates of total population were about 12.5% lower than the Spectrum estimate
for the most recent projection period, 2005-2010. The mean proportional difference declines
for each of the next two periods. Our projections of the population aged 0-4 are also lower
than the Spectrum result but by smaller proportional differences than for total population
with average proportional differences of less than 10% for all three periods. Finally, our
short term projection results for the female reproductive age population are also close to
the Spectrum result with just 11-13% average proportional difference over all three periods.
In sum, results from table 3 suggest our less complex method reasonably approximates the
short-term projections of Spectrum.
5 Discussion
We have presented a method for making probabilistic population projections for countries
with generalized HIV epidemics. We accomplish this by following the Bayesian probabilis-
tic projection method described by Raftery et al. (2012) for fertility and the international
migration assumptions of the UNPD, but because of the singular nature of mortality in gen-
eralized HIV epidemics, we modify the mortality component of the projection to incorporate
the future trajectory of the epidemic in terms of HIV prevalence and ART coverage. The
probabilistic fertility and mortality projections and the UN’s assumptions about future mi-
gration are combined using the cohort component method of projection. These projections
21
are potentially useful to researchers and policy makers as this method provides a predictive
distribution for population quantities of interest such as total population, life expectancy,
and support ratios into the future. Our method takes into account uncertainty about future
levels of mortality and fertility, the major drivers of population change, as well as uncertainty
about the trajectory of HIV prevalence. Our approach is less complex than the UN’s current
method for projecting mortality in high-HIV prevalence settings and better captures the age
pattern of mortality rates during a generalized HIV epidemic.
Results from the projections described here show that by 2050 and beyond, we project
smaller total populations for 15 of the 40 countries under study here compared to WPP 2012.
Many of the countries with the largest negative differences in projected total population com-
pared to WPP 2012 have large scale HIV epidemics. For these countries, we tend to project
lower total life expectancy over the course of the projection period. Combined with projected
high HIV prevalence, the lower life expectancies result in high age-specific mortality rates
during the younger adult years, and thus fewer women of reproductive age and consequently
smaller birth cohorts. Projected into the future, these trends lead to smaller total population
projections compared to WPP 2012. Coupled with declining fertility, high mortality rates
resulting from HIV/AIDS-related deaths produce a reversal in population growth by 2100 for
some countries with very large epidemics. Overall, these trends amount to a -3.7% difference
in total population amongst all 40 countries by 2100 compared to WPP 2012, a difference of
approximately 114 million people.
Although the method presented here for mortality and elsewhere for fertility takes into
account uncertainty about future levels of fertility and mortality, it does not include un-
certainty about international migration in the future, which can be an important source of
forecast errors. Likewise, the life expectancy projection model and the model used to convert
e0 projections to age-specific mortality rates are calibrated with results from WPP 2012, some
of which are themselves modeled, so they reproduce only the variability in the quantities of
22
interest contained in the WPP results. To the extent that the WPP 2012 data and results
used to calibrate these models reflect the empirical reality, the models we present here should
as well. Finally, as in Raftery et al. (2012), this method does not take into account random
variation in the number of birth or deaths, given the fertility and mortality rates.
23
References
Alkema, L., Raftery, A. E., and Clark, S. J. (2007). Probabilistic projections of HIV preva-
lence using Bayesian melding. The Annals of Applied Statistics, 1(1):229–248.
Alkema, L., Raftery, A. E., Gerland, P., Clark, S. J., and Pelletier, F. (2011). Probabilistic
projections of the total fertility rate for all countries. Demography, 48(3):815–839.
Blacker, J. (2004). The impact of AIDS on adult mortality: Evidence from national and
regional statistics. AIDS, 18(suppl. 2):S19–S26.
Brown, T., Bao, L., Raftery, A. E., Salomon, J. A., Baggaley, R. F., Stover, J., and Gerland,
P. (2010). Modeling HIV epidemics in the antiretroviral era: the UNAIDS Estimation and
Futures Institute (2014). Spectrum/EPP 2014 version 5.06. (downloaded June 2014).
http://www.futuresinstitute.org/spectrum.aspx.
Ghys, P. D., Brown, T., Grassly, N. C., Garnett, G., Stanecki, K. A., Stover, J., and Walker,
N. (2004). The UNAIDS estimation and projection package: A software package to estimate
and project national HIV epidemics. Sexual Transmitted Infections, 80:i5–i9.
24
Ghys, P. D. and Garnett, G. P. (2010). The 2009 HIV and AIDS estimates and projections:
methods, tools and analyses. Sexually Transmitted Infections, 86(Suppl. 2):ii1–ii2.
Ghys, P. D., Walker, N., McFarland, W., Miller, R., and Garnett, G. P. (2008). Improved
data, methods and tools for the 2007 HIV and AIDS estimates and projections. Sexually
Transmitted Infections, 84:i1–i4.
Hontelez, J. A., de Vlas, S. J., Baltussen, R., Newell, M. L., Bakker, R., Tanser, F., Lurie,
M., and Barnighausen, T. (2012). The impact of antiretroviral treatment on the age
composition of the HIV epidemic in Sub-Saharan Africa. AIDS (London, England), 26:19–
30.
Lee, R. D. and Tuljapurkar, S. (1994). Stochastic population forecasts for the United States:
Beyond high, medium, and low. Journal of the American Statistical Association, 89:1175–
1189.
Lutz, W. and Samir, K. C. (2010). Dimensions of global population projections: what do we
know about future population trends and structures? Philosophical Transactions of the
Royal Society B, 365:2779–2791.
Murray, C. J. L., Ferguson, B. D., Lopez, A. D., Guillot, M., Salomon, J. A., and Ahmad, O.
(2003). Modified logit life table system: Principles, empirical validation, and application.
Population Studies, 57:165–182.
National Research Council (2000). Beyond Six Billion: Forecasting the World’s Population.
National Academy Press, Washington, D.C.
Ngom, P. and Clark, S. J. (2003). Adult mortality in the era of HIV/AIDS: Sub-Saharan
Africa. Technical report, Population Division, United Nations, New York.
25
Obermeyer, Z., Rajaratnam, J. K., Park, C. H., Gakidou, E., Hogan, M. C., Lopez, A. D.,
Murray, C. J. L., and Timaeus, I. (2010). Measuring adult mortality using sibling survival:
A new analytical method and new results for 44 countries, 1974-2006. PLoS Medicine,
7(4).
Poit, P., Bartos, M., Ghys, P. D., Walker, N., and Schwartlander, B. (2001). The global
impact of HIV/AIDS. Nature, 410:968–973.
Preston, S. H., Heuveline, P., and Guillot, M. (2001). Demography: Measuring and Modeling
Population Processes. Blackwell, Malden, MA.
Raftery, A. E. and Bao, L. (2010). Estimating and projecting trends in HIV/AIDS generalized
epidemics using incremental mixture importance sampling. Biometrics, 66(4):1162–1173.
Raftery, A. E., Chunn, J. L., Gerland, P., and Sevcıkova, H. (2013). Bayesian probabilistic
projections of life expectancy for all countries. Demography, 50(3):777–801.
Raftery, A. E., Lalic, N., and Gerland, P. (2014). Joint probabilistic projection of female and
male life expectancy. Demographic Research, 30(4):795–822.
Raftery, A. E., Li, N., Sevcıkova, H., Gerland, P., and Heilig, G. K. (2012). Bayesian
probabilistic population projections for all countries. Proceedings of the National Academy
of Sciences.
Sevcıkova, H., Alkema, L., and Raftery, A. E. (2011). bayesTFR: An R package for proba-
bilistic projections of the total fertility rate. Journal of Statistical Software, 43(1):1–29.
Sevcıkova, H., Gerland, P., Andreev, K., Li, N., Gu, D., and Spoorenberg, T. (2013).
wpp2012: World Population Prospects 2012. R package version 2.0-0.
Sevcıkova, H. and Raftery, A. (2014). bayesPop: Probabilistic Population Projection. R
package version 5.0-0.
26
Sharrow, D. J., Clark, S. J., Collinson, M., Kahn, K., and Tollman, S. (2013). The age pattern
of increases in mortality affected by HIV: Bayesian fit of the Heligman-Pollard model to
data from the Agincourt HDSS field site in rural northeast South Africa. Demographic
Research, 29(39):1039–1096.
Sharrow, D. J., Clark, S. J., and Raftery, A. E. (2014). Modeling age-specific mortality for
countries with generalized HIV epidemics. PLoS ONE, 9(5).
Stanecki, K., Garnett, G. P., and Ghys, P. D. (2012). Developments in the field of HIV
estimates: methods, parameters and trends. Sexually Transmitted Infections, Supplement
(December).
Stover, J., Brown, T., and Marston, M. (2012). Updates to the Spectrum/Estimation and
Projection Package (EPP) model to estimate HIV trends for adults and children. Sexually
Transmitted Infections, 88:11–6.
Timaeus, I. M. and Jasseh, M. (2004). Adult mortality in Sub-Saharan Africa: Evidence
from Demographic and Health Surveys. Demography, 41(4):757–772.
UNAIDS (2014). Quick Start Guide for Spectrum. UNAIDS.
United Nations, Department of Economic and Social Affairs, Population Division (2011).
World Population Prospects: The 2010 Revision, Special Tabulations.
United Nations, Department of Economic and Social Affairs, Population Division (2013a).
World Population Prospects: The 2012 Revision. New York: United Nations.
United Nations, Department of Economic and Social Affairs, Population Division (2013b).
World Population Prospects: The 2012 Revision, Methodology of the United Nations Esti-
mation and Projections. New York: United Nations.
27
United Nations. Department of International Economic and Social Affairs (1982). Model life
tables for developing countries. United Nations, New York.
Sevcıkova, H. and Raftery, A. E. (2012). bayesPop: Probabilistic Population Projection. R
package version 1.0-3.
Whelpton, P. K. (1936). An empirical method of calculating future population. Journal of
the American Statistical Association, 31(195):457–473.
Wilmoth, J., Zureick, S., Canudas-Romo, V., Inoue, M., and Sawyer, C. (2012). A flexi-
ble two-dimensional mortality model for use in indirect estimation. Population Studies,
66(1):1–28.
28
Supplemental Material
Probabilistic Population Projections for selected countries
29
● ● ●●
●●
●●
●●
● ●●
Lesotho
Pop
ulat
ion
Pro
ject
ion
(1,
000s
)
1950 1975 2000 2025 2050 2075 2100
1000
2000
3000
4000
5000
6000
●
median80% PI95% PIWPP 2012observed
(a) Population Projection: total population
●●
●
●
●
●
●
●●
●●
● ●
100
200
300
400
Lesotho
Pop
ulat
ion
Pro
ject
ion
Age
0−
4 (1
,000
s)1950 1975 2000 2025 2050 2075 2100
●
median80% PI95% PIWPP 2012observed
(b) Population Projection: age 0-4
● ● ●●
●●
●●
●
●●
●●
200
400
600
800
1000
1200
1400
Lesotho
Pop
ulat
ion
Pro
ject
ion
Age
15−
49 F
emal
e (1
,000
s)
1950 1975 2000 2025 2050 2075 2100
●
median80% PI95% PIWPP 2012observed
(c) Population Projection: female age 15-49
0.1
0.2
0.3
0.4
0.5
0.6
Lesotho
Pro
babi
lity
of D
eath
, Age
10−
44 F
emal
e
2020 2040 2060 2080 2100
●
median80% PI95% PIWPP 2012observed
(d) Projection of female 35q10
Figure S 1 Probabilistic population projections for Lesotho 2010-2100. Observed data:black circles; median probabilistic projection: solid red line, 80% predictive interval: dashedred lines; 95% predictive interval: dotted red lines; WPP 2012 projection: solid blue line.
30
● ● ● ● ● ● ● ● ● ● ● ● ●
Mozambique
Pop
ulat
ion
Pro
ject
ion
(1,
000s
)
1950 1975 2000 2025 2050 2075 2100
0
50000
100000
150000
200000
●
median80% PI95% PIWPP 2012observed
(a) Population Projection: total population
● ● ● ● ● ● ● ● ●●
●●
●5000
10000
15000
20000
25000
Mozambique
Pop
ulat
ion
Pro
ject
ion
Age
0−
4 (1
,000
s)1950 1975 2000 2025 2050 2075 2100
●
median80% PI95% PIWPP 2012observed
(b) Population Projection: age 0-4
● ● ● ● ● ● ● ● ●● ● ● ●
0
10000
20000
30000
40000
50000
Mozambique
Pop
ulat
ion
Pro
ject
ion
Age
15−
49 F
emal
e (1
,000
s)
1950 1975 2000 2025 2050 2075 2100
●
median80% PI95% PIWPP 2012observed
(c) Population Projection: female age 15-49
0.0
0.1
0.2
0.3
0.4
Mozambique
Pro
babi
lity
of D
eath
, Age
10−
44 F
emal
e
2020 2040 2060 2080 2100
●
median80% PI95% PIWPP 2012observed
(d) Projection of female 35q10
Figure S 2 Probabilistic population projections for Mozambique 2010-2100. Observed data:black circles; median probabilistic projection: solid red line, 80% predictive interval: dashedred lines; 95% predictive interval: dotted red lines; WPP 2012 projection: solid blue line.
31
● ● ● ● ● ● ●●
●●
●●
●
Ghana
Pop
ulat
ion
Pro
ject
ion
(1,
000s
)
1950 1975 2000 2025 2050 2075 2100 0
20000
40000
60000
80000
100000
120000
●
median80% PI95% PIWPP 2012observed
(a) Population Projection: total population
● ●●
●●
● ●●
●●
●●
●
2000
4000
6000
8000
10000
Ghana
Pop
ulat
ion
Pro
ject
ion
Age
0−
4 (1
,000
s)1950 1975 2000 2025 2050 2075 2100
●
median80% PI95% PIWPP 2012observed
(b) Population Projection: age 0-4
● ● ● ● ● ● ●●
●●
●●
●
5000
10000
15000
20000
25000
30000
Ghana
Pop
ulat
ion
Pro
ject
ion
Age
15−
49 F
emal
e (1
,000
s)
1950 1975 2000 2025 2050 2075 2100
●
median80% PI95% PIWPP 2012observed
(c) Population Projection: female age 15-49
0.02
0.04
0.06
0.08
0.10
0.12
0.14
Ghana
Pro
babi
lity
of D
eath
, Age
10−
44 F
emal
e
2020 2040 2060 2080 2100
●
median80% PI95% PIWPP 2012observed
(d) Projection of female 35q10
Figure S 3 Probabilistic population projections for Ghana 2010-2100. Observed data: blackcircles; median probabilistic projection: solid red line, 80% predictive interval: dashed redlines; 95% predictive interval: dotted red lines; WPP 2012 projection: solid blue line.
32
0.00
0.05
0.10
0.15
0.20
0.25
5q0
Angola
Bahamas
Belize
Benin
Botswana
Bur
kina
Fas
oBurundi
Cameroon
Cen
tral A
frica
n R
epub
licChad
Congo
Cot
e d'
Ivoi
reDjibouti
Equ
ator
ial G
uine
aEthiopia
Gabon
Gambia
Ghana
Guinea
Guinea-Bissau
Guyana
Haiti
Jamaica
Kenya
Lesotho
Malawi
Mali
Mozambique
Namibia
Nigeria
Rwanda
Sou
th A
frica
Swaziland
Togo
Uganda
Uni
t. R
ep. o
f Tan
zani
aZambia
Zimbabwe
(a) 5q0: female
0.00
0.05
0.10
0.15
0.20
0.25
5q0
Angola
Bahamas
Belize
Benin
Botswana
Bur
kina
Fas
oBurundi
Cameroon
Cen
tral A
frica
n R
epub
licChad
Congo
Cot
e d'
Ivoi
reDjibouti
Equ
ator
ial G
uine
aEthiopia
Gabon
Gambia
Ghana
Guinea
Guinea-Bissau
Guyana
Haiti
Jamaica
Kenya
Lesotho
Malawi
Mali
Mozambique
Namibia
Nigeria
Rwanda
Sou
th A
frica
Swaziland
Togo
Uganda
Uni
t. R
ep. o
f Tan
zani
aZambia
Zimbabwe
(b) 5q0: male
0.2
0.4
0.6
0.8
45q 15
Angola
Bahamas
Belize
Benin
Botswana
Bur
kina
Fas
oBurundi
Cameroon
Cen
tral A
frica
n R
epub
licChad
Congo
Cot
e d'
Ivoi
reDjibouti
Equ
ator
ial G
uine
aEthiopia
Gabon
Gambia
Ghana
Guinea
Guinea-Bissau
Guyana
Haiti
Jamaica
Kenya
Lesotho
Malawi
Mali
Mozambique
Namibia
Nigeria
Rwanda
Sou
th A
frica
Swaziland
Togo
Uganda
Uni
t. R
ep. o
f Tan
zani
aZambia
Zimbabwe
(c) 45q15: female
0.2
0.4
0.6
0.8
45q 15
Angola
Bahamas
Belize
Benin
Botswana
Bur
kina
Fas
oBurundi
Cameroon
Cen
tral A
frica
n R
epub
licChad
Congo
Cot
e d'
Ivoi
reDjibouti
Equ
ator
ial G
uine
aEthiopia
Gabon
Gambia
Ghana
Guinea
Guinea-Bissau
Guyana
Haiti
Jamaica
Kenya
Lesotho
Malawi
Mali
Mozambique
Namibia
Nigeria
Rwanda
Sou
th A
frica
Swaziland
Togo
Uganda
Uni
t. R
ep. o
f Tan
zani
aZambia
Zimbabwe
(d) 45q15: male
0.0
0.1
0.2
0.3
0.4
0.5
0.6
0.7
35q 10
Angola
Bahamas
Belize
Benin
Botswana
Bur
kina
Fas
oBurundi
Cameroon
Cen
tral A
frica
n R
epub
licChad
Congo
Cot
e d'
Ivoi
reDjibouti
Equ
ator
ial G
uine
aEthiopia
Gabon
Gambia
Ghana
Guinea
Guinea-Bissau
Guyana
Haiti
Jamaica
Kenya
Lesotho
Malawi
Mali
Mozambique
Namibia
Nigeria
Rwanda
Sou
th A
frica
Swaziland
Togo
Uganda
Uni
t. R
ep. o
f Tan
zani
aZambia
Zimbabwe
(e) 35q10: female
0.0
0.1
0.2
0.3
0.4
0.5
0.6
0.7
35q 10
Angola
Bahamas
Belize
Benin
Botswana
Bur
kina
Fas
oBurundi
Cameroon
Cen
tral A
frica
n R
epub
licChad
Congo
Cot
e d'
Ivoi
reDjibouti
Equ
ator
ial G
uine
aEthiopia
Gabon
Gambia
Ghana
Guinea
Guinea-Bissau
Guyana
Haiti
Jamaica
Kenya
Lesotho
Malawi
Mali
Mozambique
Namibia
Nigeria
Rwanda
Sou
th A
frica
Swaziland
Togo
Uganda
Uni
t. R
ep. o
f Tan
zani
aZambia
Zimbabwe
(f) 35q10: male
Figure S 4 Distribution of predicted 5q0, 45q15, and 35q10 by country for out-of-samplevalidation period 2005-2010. In these figures the ends of the “whiskers” are the 95% PI, theends of the box are the 80% PI, and the horizontal black line in the center of each box is themedian. The WPP 2012 estimate for 2005-2010 is shown with a black circle for comparison.


![Producing the Dutch and Belgian mortality projections: a ... · animation by animate[2016/07/27] Introduction: EU mortality. Similar evolution of life expectancy for several EU countries.](https://static.documents.pub/doc/80x56/60012a47266f39379002d6ac/producing-the-dutch-and-belgian-mortality-projections-a-animation-by-animate20160727.jpg)


![Advances in Stochastic Mortality Modelling[Toczydlowska and Peters, 2017]considered stochastic projection methods of dimensionality reduction)Probabilistic Principal Component Analysis](https://static.documents.pub/doc/80x56/61207bccc7108002d73aba5b/advances-in-stochastic-mortality-modelling-toczydlowska-and-peters-2017considered.jpg)

