47
Chapter 6 Probability PowerPoint Lecture Slides Essentials of Statistics for the Behavioral Sciences Eighth Edition by Frederick J. Gravetter and Larry B. Wallnau
| Date post: | 15-Jul-2015 |
| Category: |
Education |
| Upload: | jasondroesch |
| View: | 122 times |
| Download: | 0 times |

Chapter 6
Probability
PowerPoint Lecture Slides
Essentials of Statistics for the Behavioral Sciences Eighth Edition
by Frederick J. Gravetter and Larry B. Wallnau
Chapter 6 Learning Outcomes
• Understand definition of probability1
• Explain assumptions of random sampling2
• Use unit normal table to find probabilities3
• Use unit normal table to find scores for given proportion4
• Find percentiles and percentile rank in normal distribution5

Tools You Will Need
• Proportions (Math Review, Appendix A)
– Fractions
– Decimals
– Percentages
• Basic algebra (Math Review, Appendix A)
• z-scores (Chapter 5)

6.1 Introduction to Probability
• Research begins with a question about an
entire population.
• Actual research is conducted using a
sample.
• Inferential statistics use sample data to
answer questions about the population
• Relationships between samples and
populations are defined in terms of
probability

Figure 6.1 Role of probabilityin inferential statistics
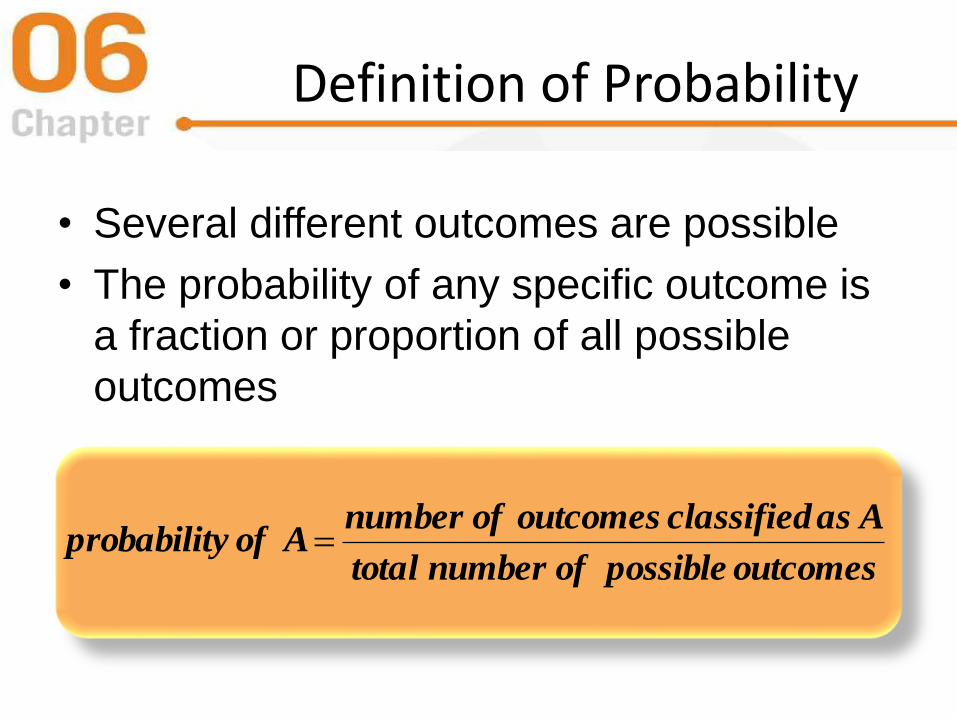
Definition of Probability
• Several different outcomes are possible
• The probability of any specific outcome is
a fraction or proportion of all possible
outcomes
outcomespossible of number total
A as classified outcomes of number A ofy probabilit

Probability Notation
• p is the symbol for “probability”
• Probability of some specific outcome is
specified by p(event)
• So the probability of drawing a red ace
from a standard deck of playing cards
could be symbolized as p(red ace)
• Probabilities are always proportions
• p(red ace) = 2/52 ≈ 0.03846 (proportion is
2 red aces out of 52 cards)

(Independent)Random Sampling
• A process or procedure used to draw
samples
• Required for our definition of probability to
be accurate
• The “Independent” modifier is generally
left off, so it becomes “random sampling”
Definition of Random Sample
• A sample produced by a process that
assures:
– Each individual in the population has an equal
chance of being selected
– Probability of being selected stays constant
from one selection to the next when more
than one individual is selected
• Requires sampling with replacement

Probability andFrequency Distributions
• Probability usually involves population of
scores that can be displayed in a frequency
distribution graph
• Different portions of the graph represent
portions of the population
• Proportions and probabilities are equivalent
• A particular portion of the graph
corresponds to a particular probability in the
population

Figure 6.2 PopulationFrequency Distribution Histogram

Learning Check
• A deck of 52 cards contains 12 royalty cards. If
you randomly select a card from the deck, what
is the probability of obtaining a royalty card?
• p = 1/52A
• p = 12/52B
• p = 3/52C
• p = 4/52D

Learning Check - Answer
• A deck of 52 cards contains 12 royalty cards. If
you randomly select a card from the deck, what
is the probability of obtaining a royalty card?
• p = 1/52A
• p = 12/52B
• p = 3/52C
• p = 4/52D

Learning Check TF
• Decide if each of the following statements
is True or False.
• Choosing random individuals who walk by yields a random sampleT/F
• Probability predicts what kind of population is likely to be obtainedT/F

Learning Check - Answers
• Not all individuals walk by, so not all have an equal chance of being selected for the sample
False
• The population is given. Probability predicts what a sampleis likely to be like
False
6.2 Probability and theNormal Distribution
• Normal distribution is a common shape
– Symmetrical
– Highest frequency in the middle
– Frequencies taper off towards the extremes
• Defined by an equation
• Can be described by the proportions of
area contained in each section.
• z-scores are used to identify sections

Figure 6.3 The Normal Distribution
22 2/)(
22
1
XeY

Figure 6.4 Normal Distribution with z-scores

Characteristics of theNormal Distribution
• Sections on the left side of the distribution
have the same area as corresponding
sections on the right
• Because z-scores define the sections, the
proportions of area apply to any normal
distribution
– Regardless of the mean
– Regardless of the standard deviation

Figure 6.5 Distribution for Example 6.2

The Unit Normal Table
• The proportion for only a few z-scores can
be shown graphically
• The complete listing of z-scores and
proportions is provided in the unit normal
table
• Unit Normal Table is provided in Appendix
B, Table B.1

Figure 6.6 Portion of the Unit Normal Table

Figure 6.7 Proportions Corresponding to z = ±0.25
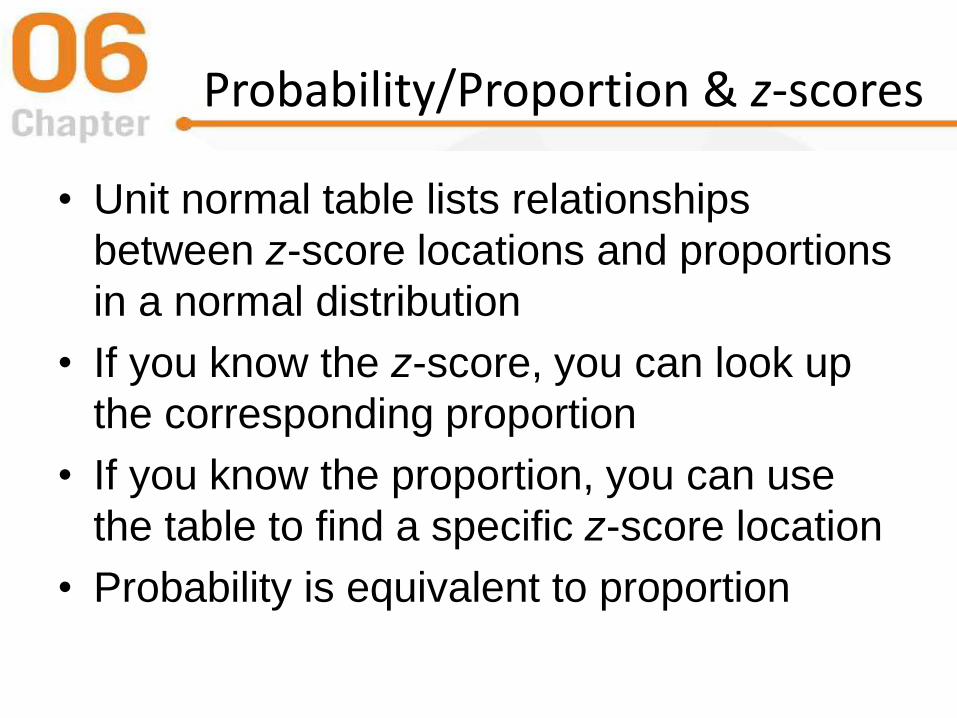
Probability/Proportion & z-scores
• Unit normal table lists relationships
between z-score locations and proportions
in a normal distribution
• If you know the z-score, you can look up
the corresponding proportion
• If you know the proportion, you can use
the table to find a specific z-score location
• Probability is equivalent to proportion
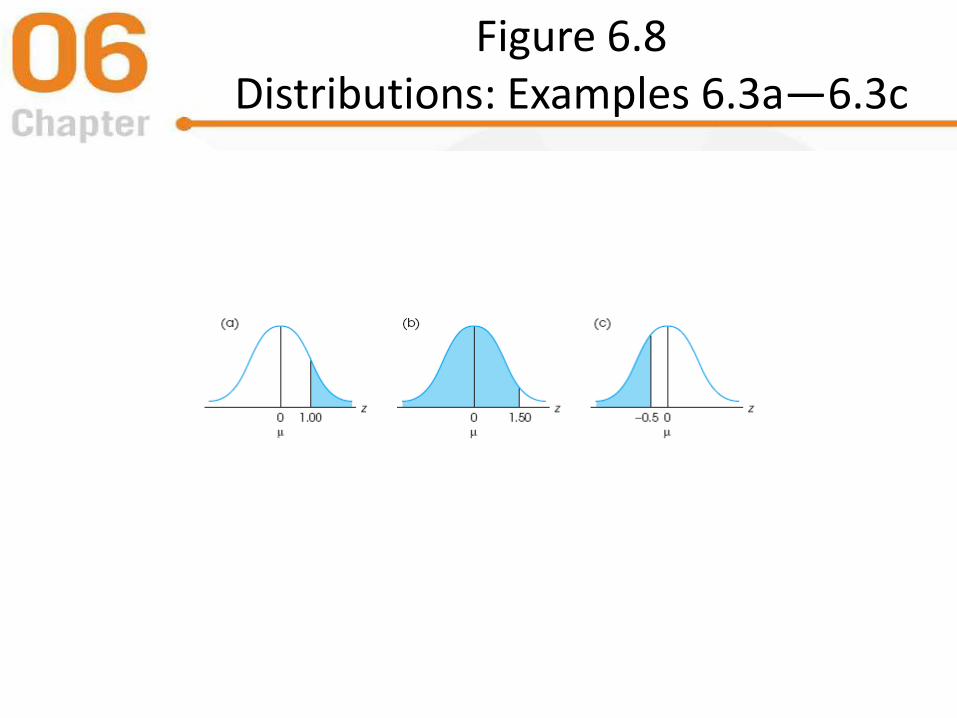
Figure 6.8 Distributions: Examples 6.3a—6.3c

Figure 6.9 Distributions: Examples 6.4a—6.4b

Learning Check
• Find the proportion of the normal curve
that corresponds to z > 1.50
• p = 0.9332A
• p = 0.5000B
• p = 0.4332C
• p = 0.0668 D

Learning Check - Answer
• Find the proportion of the normal curve
that corresponds to z > 1.50
• p = 0.9332A
• p = 0.5000B
• p = 0.4332C
• p = 0.0668 D

Learning Check
• Decide if each of the following statements
is True or False.
• For any negative z-score, the tail will be on the right hand sideT/F
• If you know the probability, you can find the corresponding z-scoreT/F

Learning Check - Answer
• For negative z-scores the tail will always be on the left sideFalse
• First find the proportion in the appropriate column then read the z-score from the left column
True

6.3 Probabilities/Proportions for Normally Distributed Scores
• The probabilities given in the Unit Normal
Table will be accurate only for normally
distributed scores so the shape of the
distribution should be verified before using it.
• For normally distributed scores
– Transform the X scores (values) into z-scores
– Look up the proportions corresponding to the z-
score values.

Figure 6.10 Distribution of IQ scores

Figure 6.11 Example 6.6 Distribution

Box 6.1 Percentile ranks
• Percentile rank is the percentage of
individuals in the distribution who have
scores that are less than or equal to the
specific score.
• Probability questions can be rephrased as
percentile rank questions.

Figure 6.12 Example 6.7 Distribution

Figure 6.13 Determining Normal Distribution Probabilities/Proportions

Figure 6.14 Commuting Time Distribution

Figure 6.15Commuting Time Distribution

Learning Check
• Membership in MENSA requires a score of 130 on the Stanford-Binet 5 IQ test, which has μ = 100 and σ = 15. What proportion of the population qualifies for MENSA?
• p = 0.0228A
• p = 0.9772B
• p = 0.4772C
• p = 0.0456 D

Learning Check - Answer
• Membership in MENSA requires a score of 130 on the Stanford-Binet 5 IQ test, which has μ = 100 and σ= 15. What proportion of the population qualifies for MENSA?
• p = 0.0228A
• p = 0.9772B
• p = 0.4772C
• p = 0.0456 D
Learning Check
• Decide if each of the following statements is True or False.
• It is possible to find the X score corresponding to a percentile rank in a normal distribution
T/F
• If you know a z-score you can find the probability of obtaining that z-score in a distribution of any shape
T/F
Learning Check - Answer
• Find the z-score for the percentile rank, then transform it to XTrue
• If a distribution is skewed the probability shown in the unit normal table will not be accurate
False

6.4 Looking Ahead toInferential Statistics
• Many research situations begin with a population that forms a normal distribution
• A random sample is selected and receives a treatment, to evaluate the treatment
• Probability is used to decide whether the treated sample is “noticeably different” from the population

Figure 6.16Research Study Conceptualization

Figure 6.17Research Study Conceptualization
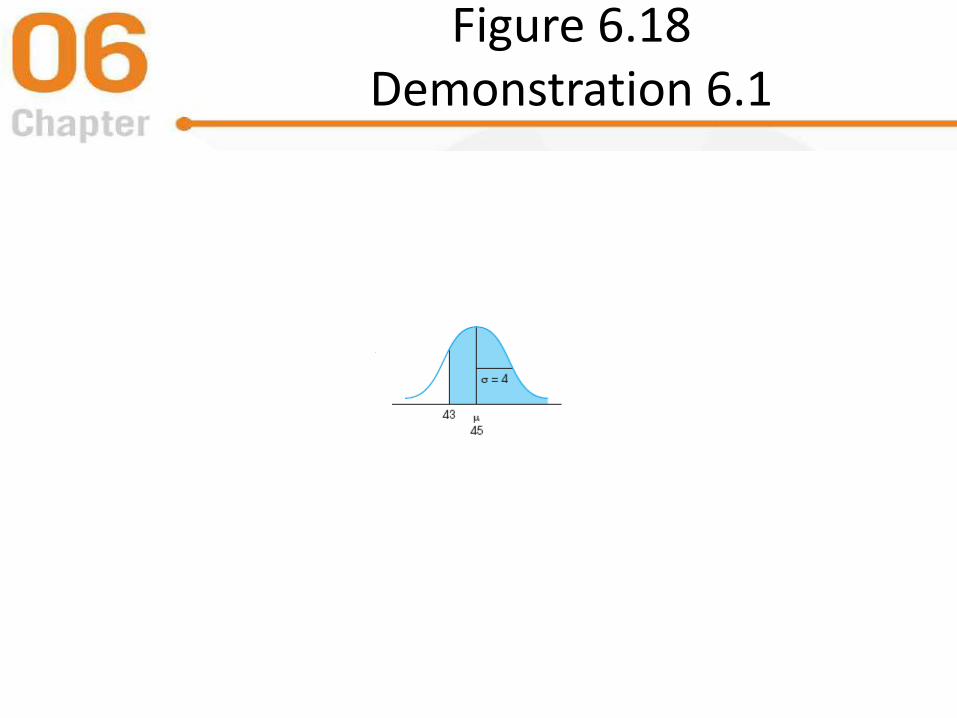
Figure 6.18Demonstration 6.1
AnyQuestions
?
Concepts?
Equations?


