B & E Review Vol. 7 No.1 1994 - 1996 PROBING INTO THE ECONOMIES OF SCALE IN STATE UNIVERSITIES AND COLLEGES (SUCs) IN THE PHILIPPINES Mia Margaret Y. Alinsonorin, Maria Judith Z. Jala and Maria Roma L. Lara Economics of scale is defined as that case wherein the lowest cost per unit of output is incurred, that is , average cost declines as output increases. It is a widely-accepted fact that economics of scale exist in the agricultural and industrial sectors of the economy. Simply put, with mass production and with the application of mechanization and automa- tion , the unit cost of production is relatively reduced. The question there- fore arises, whether the concept of economies of scale exist in the edu- cational sector and may it be made applicable particularly to State Uni- versities and Colleges (SUCS), or to universities and colleges which are subsidized by the national government. However, it must be emphasized that this is not an oversimplifica- tion of the issue at hand, because any suggestion to reduce unit costs in education equivalent to mechanization and automation is certain to pro- voke reactions about the quality of education and how it may suffer. It is interesting to know if there is an optimum organization of schools which has as one of its features, schools of the most econom ic size, given a specific set of educational objectives and considerations . Hence, the study of educational costs has aimed at deriving stat istical means to help decision-makers plan the sizes of their schools. It is be- lieved that a certain degree of knowledge of the costs and benefits of producing different levels and mixes of educat ional output is necessary for the people responsible for the dev elopment of the educational sys- tem . In essence, comparison of costs and benefits ultimately determines the overall size of the educational budget. the broad allocation of the budget between the major educational sectors, as well as more detailed choices relating to curricula , class sizes, teaching methods , etc .. This study is significant since it will highlight the way of analyzing the effi- ciency of SUCs .
Transcript
B & E Review Vol. 7 No.1 1994 - 1996
PROBING INTO THE ECONOMIES OF SCALE IN STATE UNIVERSITIES AND
COLLEGES (SUCs) IN THE PHILIPPINES
Mia Margaret Y. Alinsonorin, Maria Judith Z. Jala
and Maria Roma L. Lara
Economics of scale is defined as that case wherein the lowest cost per unit of output is incurred, that is , average cost declines as output increases . It is a widely-accepted fact that economics of scale exist in the agricultural and industrial sectors of the economy. Simply put, with mass production and with the application of mechanization and automation , the unit cost of production is relatively reduced. The question therefore arises, whether the concept of economies of scale exist in the educational sector and may it be made applicable particularly to State Universities and Colleges (SUCS), or to universities and colleges which are subsidized by the national government.
However, it must be emphasized that this is not an oversimplification of the issue at hand, because any suggestion to reduce unit costs in education equivalent to mechanization and automation is certain to provoke reactions about the quality of education and how it may suffer.
It is interesting to know if there is an optimum organization of schools which has as one of its features , schoo ls of the most econom ic size , given a specific set of educational objectives and considerations . Hence, the study of educational costs has aimed at deriving statistical means to help decision-makers plan the sizes of their schools. It is believed that a certain degree of knowledge of the costs and benefits of producing different levels and mixes of educationa l output is necessary for the people responsible for the development of the educational system . In essence, comparison of costs and benefits ultimately determines the overall size of the educational budget. the broad allocation of the budget between the major educational sectors, as well as more detailed choices relating to curricula , class sizes , teaching methods, etc .. This study is significant since it will highlight the way of analyzing the efficiency of SUCs.
2 ECONOMIES OF SCALE IN SUCS IN THE PHILIPPINES
Wiith regart:! to the scale economies in public and private education , inquiry into this has not received adequate treatment due to the magnitude of the resources involved and the rapid growth of their amounts. This is the result of lack of data; in other cases, data present only minor difficulties but the ideal model was not employed . Then , if a study indicates an economic advantage for large-sized schools, there is a question if this fact should affect policy dimensions when there are other factors to be involved.
PROBLEM
Do economies of scale exist in State Universities and Colleges (SUCs)?
OBJECTIVES
1. To identify the budgetary allocations of State Universities and Colle\;les.
2. To outline the enrollment structure of State Universities and Colle\;les.
3. To estimate the average costs of State Universities and Colleges. 4 . To determine whether economies of scale exist in State Universi
ties and Colleges.
THEORETICAL FRAMEWORK
A convenient way to represent the dependence of costs on output or scale and to illustrate the relationship between total average costs is via the analytical device of the cost function. Cost analysis may be concerned with the total costs of education or with unit costs , wh ich measure the costs of educating one student. The relationship can be represented by the equation :
TC = ..t + ..t S o ,
where TC is the total cost; ..to is the fixed cost; .,/, is the variable cost; and S is the number of stUdents.
This equation can be used to derive the expression for average cost sincl~ it is implicit in the total cost function . Average cost is simply total cost divided by output.
"/0 S AC = TC / S = __ + f - ,
S S
ALiNSONORIN, JALA, and LARA 3
There are three possible relationships between size and average cost, namely: a. constant returns to scale where average costs remain the same
regardless of the number of units; b. economies of scale where average costs fall as the number of
units increases; c. diseconomies of scale where average costs increase as the num
ber of units increase.
The model formulated by C.R.S. Dougherty determines the existence of economies of scale in education . The basic hypothesis of the model is that economies of scale would cause total expenditures to rise less rapidly than enrollments , in cross-section. A conventional model which might capture this effect is the log-linear relationship :
LOG TCE = ~o + ~110g n + u
where TCE represents the total current expenditures ; n is the enrollment size; u is a disturbance term; with the coefficient of log n less than one indicating economies of scale.
OPERATIONAL FRAMEWORK
A method by which economies of scale might be discerned is to observe the relationship between cost and size. One must begin with a production function that provides the information concerning the relationship . The per pupil costs can then be computed , and a cost-size relationship be delineated.
In computing for the per pupil costs, two alternative formulas may be used. The first one makes use of the total cost or budget of each of the SUCs and its total actual enrollment.
AC = BUDGET
TOTAL ACTUAL ENROLLMENT
The second alternative formula makes use of the total weighted enrollment as the divisor. The weights represent the proportion that each level of education receives from the total budget. the weights can be derived from secondary data or by the formulation of assumptions. That is, it can be assumed that one-half of the cost of college education is equal to the cost of pre-college education . Thus, the formula for average cost is given as:
AC = BUDGET
TOTAL WEIGHTED ENROLLMENT
4 ECONOMIES OF SCALE IN SUCS IN THE PHILIPPINES
where weighted enrollment is equal to weights multiplied by total actual enrollment
Economies of scale are said to exist whenever an inverse relationshio betwE!en size and cost is depicted.
The model of C.R .S. Dougherty was operationalized by substituting total costs or the budget for the total current expenditures. The unit current cost was likewise substituted by the computed average cost. Thus , in this study, the revised log-linear relationship was represented by:
Nevertheless, the assumption of the model, that is, economies of scale wou ld cause total expenditures to increase less rapidly than total enrollments, in cross-section , still holds true. Economies of scale exist if the resulting ~1 is less than 1.
METHODOLOGICAL FRAMEWORK
It has been noted that obtaining costs in order to determine the set of economically feasible alternatives is the first step in educational planning. Put clearly and concisely, this is the main reason why the costs of education should be measured.
The study made use of secondary data on actual and weighted enrollment structure and budgetary allocations for the year 1993. These were obtained from the Philippine Association of State Universities and Colleges (PASUC) and from the 1993 General Appropriations Act (G.AA), respectively. The data on the actual and weighted enrollment sizes were treated by grouping them into three , namely, into small-sized , mediumsized and large-sized.
In any cost analysis, the first step to be done is to carefully gather historical cost data because a sophisticated economic analysis based on poor data may impress by its scientific expertise and lend apparent weight to erroneolJs conclusions. In answering the first objective, the 1993 budgetary allocations of all S UCs were presented
To answer the second objective, data on the actual and weighted enrollment structures for all SUCs were presented in tabular form .
Objective number three required the cost to be related to production . In order to be able to make such comparisons ,unit costs were calcUlated. Data used in objectives 1 cmd 2 were used in answering the third objective . As stated in the operational framework , .average cost was obtained by getting the ratio of the budget to the total enrollment.
The fourth objective of the study involved three levels of analyses . The reason for having three different levels of analyses is to confirm the findings of each level - whether economies of scale exist in SUCs. The first level of analysis is the numberica l-graphical wh erein the computed average cost is plotted in the Y axis wh ereas tota l enrollment is plotted in
ALiNSONORIN, JALA, and LARA 5
the X axis. This was done for both actual and weighted variables. The second level of analysis involved the simple regression of the data where average cost is assumed as the dependent variable and total enrollment as the independent variable. This was done for the actual and weighted variables. This third and last level of analysis is also a regression analysis. This time, however, the model of C.R.S. Dougherty was applied. The total expenditures was assigned as the dependent variable and total enrollment as the independent variable.
Park test was conducted to this model to determine if heteroscedasticity is present. Heteroscedasticity occurs if the OLS assumption that the variance of the error term is constant for all values of the independent variable does not hold . The problem of heteroscedasticity leads to unbiased but inefficient estimates of the standard errors. The first thing that was done was to run a regression using the data . The residuals obtained from this regression were again regressed using LNRES as the dependent variable and LN as the independent variable . If the coefficient obtained is statistically significant, it would suggest the presence of heteroscedasticity in the data. If otherwise , it can be assumed that there is homoscedasticity
PRESENTATION AND ANALYSIS OF DATA
1. Identifying the Budgetary Allocation . Data showed that the University of the Philippines System (UP System) has the highest budgetary allocation amounting to P1,510,361 ,OOO whereas Camarines Sur Polytechnic College (CSPC) has the lowest budget receiving only P6 ,165,OOO Classifying the SUCs into 14 regions , data showed that the SUCs in the National Capital Region (NCR) have the highest appropriation totaling to P2,007,810,OOO. The lowest budget is granted to the SUCs in the Southern Mindanao Region with P54,360,OOO.
2. Outline of the Enrollment Structure . The bulk of the population (33.33%) in most of the SUCs are enrolled in the priority undergraduate courses. From the proliferation of institutions of higher learning , there is an unequal distribution in terms of geography. There is a high concentration of state as well as private colleges and universities in the NCR and the Southern Tagalog Region where 30 per cent were concentrated in these areas while the rest was distributed in the remaining regions. Another proof of the unequal distribution is the varying enrollment sizes in schools , from less than 563 students in some areas outside of Metro Manila and over 30 ,000 students in NCR. Some programs produce graduates way beyond the job market demands whereas other programs needed for economic development have very little enrollment. Oversubscribed courses are business, engineering , tea cher training and liberal arts. Undersubscribed courses, but which are really needed
6 ECONOMIES OF SCALE IN SUCS IN THE PHILIPPINES
are the sciences. In fact, science programs attract less than three per cent of the students . Geographic maldistribution , on the otherhand , is seen in terms of ratios of tertiary institutions and total populations as well as uneven enrollments in different fields of discipline .
3. Estimating the Average Costs. The highest per student cost among all SUCs is incurred in the UP System amounting to P44 ,544.22. On the contrary, the lowest per student cost, which is way beyond the highest, is incurred in the Tawi-tawi Regional Agricultural College (TRAC) The value of which amounted to P2 ,267 . Thus, the actual average costs in all SUCs range from P2 ,267 to P44,544 .22 . Looking at the weighted average costs , the UP System incurs the highest per student cost amounting to P31 ,045.45 . The lowest per unit cost which is equal to P 1,868.43 is shouldered by students from TRAC . Thus , for the weighted average costs , the range is between P1 ,868.43 and P31 ,045.45. The difference in per student cost in each SUC is a result of the variations in the SUC's budget and enrollment size.
4 . Determ ining Economics of Scale. 4 .1. Numerical-Graphical Analysis . The graphs for the small
sized, medium-sized and large-sized enrollments depict the absence of a pattern indicating the presence of economies of scale. However, when the average costs and enrollment sizes of all the SUCs were plotted together in one graph , economies of scale can be seen . The downward-sloping curve depicts the negative relation between average cost and enrollment size. In other words, as enrollment size increases, average cost tends to decrease. Thus, economies of scale exist in SUCs.
4 .2. Simple Regression Analysis . The regression was done on both actual and weighted variables with average cost as the dependent variable and enrollment size as the independent variable . The resulting equations for the actual and weighted data are as follows :
AC = 9.4628254 - 0.0612184 n (equation 1) AC = 9.0285143 - 0.0336122 wn (equation 2)
In both equations, a negative sign for the coefficient was obtained telling us that average cost is indirectly related to the enrollment size. The size of the coefficient in equation 1 tens us that for every unit change in enrollment, average cost changes by -0.0612184 unit. From the second equation , on the otherhand , it can be deduced that as enrollment increases by 1 unit , average cost goes down by 0.03361 22 unit. Thus, the size and sign of the coefficien ts in both reg ression models are co nsistent with the hypoth l~sis that average cost declines as enrollment size goes up.
ALiNSONORIN, JALA, and LARA 7
The regression model for actual data had an R-squared of .74 per cent. This means that only .74% of the change in enrollment is accounted for by the change in average cost. The model for weighted variables had an R-squared equal to .25 per cent. This, likewise, means that only .25% of the change in enrollment is explained by the change in average cost. The R-squared of the two regression models are fairly small values indicating a very poor goodness of fit.
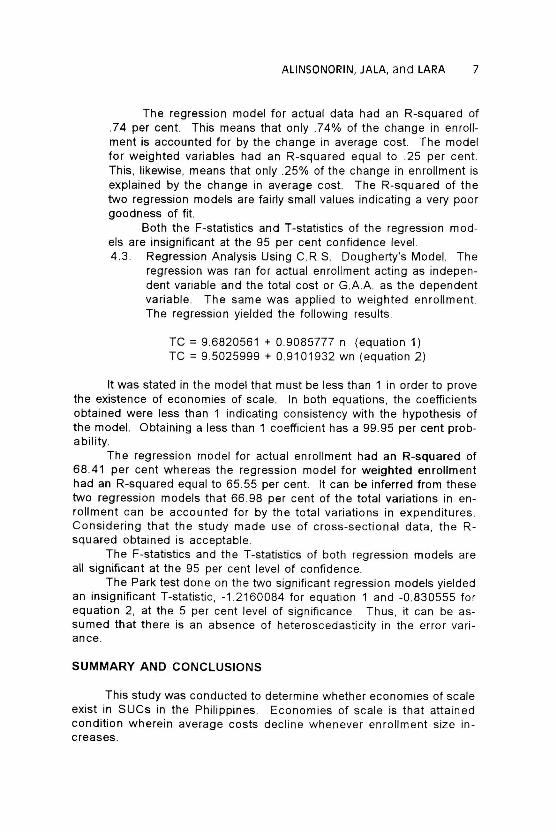
Both the F-statistics and T-statistics of the regression models are insignificant at the 95 per cent confidence level. 4.3 . Regression Analysis Using C.R.S. Dougherty's Model. The
regression was ran for actual enrollment acting as independent variable and the total cost or GAA. as the dependent variable . The same was applied to weighted enrollment. The regression yielded the following results
It was stated in the model that must be less than 1 in order to prove the existence of economies of scale. In both equations, the coefficients obtained were less than 1 indicating consistency with the hypothesis of the model. Obtaining a less than 1 coefficient has a 99.95 per cent probability.
The regression model for actual enrollment had an R-squared of 68.41 per cent whereas the regression model for weighted enrollment had an R-squared equal to 65 .55 per cent. It can be inferred from these two regression models that 66 .98 per cent of the total variations in enrollment can be accounted for by the total variations in expenditures. Considering that the study made use of cross-sectional data , the Rsquared obtained is acceptable.
The F-statistics and the T -statistics of both regression models are all significant at the 95 per cent level of confidence.
The Park test done on the two significant regression models yielded an insignificant T -statistic , -1 .2160084 for equation 1 and -0.830555 for equation 2, at the 5 per cent level of significance Thus, it can be assumed that there is an absence of heteroscedasticity in the error variance .
SUMMARY AND CONCLUSIONS
This study was conducted to determine whether economies of scale exist in SUCs in the Philippines . Economies of scale is that attained condition where in average costs decline whenever enrollment size increases.
8 ECONOMIES OF SCALE IN SUCS IN THE PHILIPPINES
The first aim of the study was to identify the budgetary allocations of SUCs. This was achieved by presenting the General Appropriations Act for the year 1993.
The next objective was to outline the enrollment structure of SUCs. This was done by showing the various levels of enrollment and their correspondin!~ actual and weighted enrollment sizes. The data used here were obtained from the PASUC.
The third objective of the study was to estimate the average costs of SUCs. Both the actual and weighted average costs were computed using the basic formula AC = Budget I Enrollment. In computing for the weighted average cost, weighted enrollment was substituted as the divi-sor.
Last!ly, the study aimed to determine whether economies of scale exist in SUCs. The first level of analysis employed to answer this objective is the numerical-graphical. This level showed that economies of sale are present when the average costs and enrollment sizes of all the SUCs were combined together in a single graph. The second level involved the simple regression of average costs and enrollments. The results, although statistically insignificant, indicated that economies of scale exist in SUCs . Thus, the need to find another model arose. The researchers applied the model formulated by C.R .S. Dougherty. This model assumes that, in cross-section , the total expenditure increases less than enrollments if economies of scale are to exist. The results of the regression, aside from being statistically significant, were in consistency with the basic hypothesis of the model.
As a general conclusion, scale economies are evident in SUCs. In other words, educational units with large-sized enrollments prove to be more economically beneficial.
POLICY RECOMMENDATIONS
BasE~d on the findings of the study, the researchers have come up with the following recommendations . These recommendations are vital in forming policy prescriptions that would upgrade the educational stan dards of the SUCs.
In relation with the first objective of the study, a goal must be arrived at specifying what percentage of the operating budget should be raised from tuition and other fees and from the national subsidy. With a specific percentage on where to source will be greatly reduced. Common guidelines must likewise be arrived at in the allo cation of the budget for instruction, research and development and administration . Thes e guidelines would serve as aids for decision-makers in determining which areas should be given top prio rity.
It was mentioned in the findings obtained in the second objective that the prol iferation of programs have resulted to an unevenn ess in student enrol lment, geographic distributions of edu catio nal units, etc .. In
ALiNSONORIN, JALA, and LARA 9
light of these findings, it is recommended that SUCs m:.Jst not expand programs which are already adequately served by the private sector in a given geographic area. In areas where there exists an undersupply of courses, the SUCs should fill in the gaps. However, consideration must be taken as regards availability of faculty or facilities before undergoing any expansion program.
As regards the third objective, it is recommended that the operating cost per student eventually be standardized, taking into account the level of education and regional differences. The very wide range of per student cost across all SUCs depicts that there is an unequal distribution of wealth among individuals. The standardization of the average cost will have economic and social consequences.
Finally, in connection with the fourth objective, it is recommended that the SUCs in a particular locality whose enrollment level tends to be low should be integrated. It would be increasingly inefficient to maintain small-sized schools. With integration, the national government will not put to waste its appropriations on schools which are not of economical size. This is also a way which could alleviate the government's problem on budget deficit. However, the size of the educational unit must be manageable . It should be small enough for one person to be able to coordinate the activities of the entire unit efficiently; large enough for the number of students to prevent service and equipment costs from becoming too heavy for the school's budget.
REFERENCES
Blaug, Mark. "An Introduction to the Economics of Education". Lon-don : The Allen Lane Penguin Press, 1970.
Canlas, Dante B. "Some Issues in the Economics of Tertiary Education" . Journal of Philippine Development, Vol. XIV, No. 24, First Semester 1987.
Cohn, Elchanon. "The Economics of Education" . Massachusetts: Ballinger Publishing Company, 1979.
Dougherty, C.R.S. "Unit Costs of Economies of Scale in Vocational and Technical Education: Evidence from the People's Republic of China". Economics of Education Review, Vol. IX, No 4, 1990.
Gilmore, Jeffrey. "Price and Quality in Higher Education ". Washington , D.C.: U.S.Government Printing Office, 1990.
Maynard, James. "Some Microeconomics of Higher Education : Economics of Scale". Lincoln : University of Nebraska Press, 1971 .
Psacharopoulos, George, ed . "Economics of Education : Research and Studies". Oxford (Oxfordshire): Pergamon Press, 1971.
Rogers, Daniel C. and Hirsch S. Ruchlin . "Economics of Education : Principles and Application" . New York: The Free Press, 1976.
Shechan, John. "Economics of Education". London: Allen and Unwin, 1973.
10 ECONOMIES OF SCALE IN SUCS IN THE PHILIPPINES
Tan =dita A. "Structure and Performance of Philippine Secondary Schools". Washington, D.C.: World Bank, 1991 .
Tan , Jee··Ping. "Education in Asia : A Comparative Study of Cost and Financing". Washington , D.C.: World Bank, 1992.
Tullao, T,~reso S. , Jr. "Streamlining the Bureaucracy: Sectoral Framework for Governance: Education Sector". De La Salle University.