Probing of local polarity in poly(methyl methacrylate) with thecharge transfer transition in Nile redAydan Yadigarli, Qimeng Song, Sergey I. Druzhinin* and Holger Schönherr*
Full Research Paper Open Access
Address:Physical Chemistry I and Research Center of Micro andNanochemistry and Engineering (Cμ), Department of Chemistry andBiology, University of Siegen, Adolf-Reichwein-Str. 2, 57076, Siegen,Germany
AbstractThe permittivity of polymers and its spatial distribution play a crucial role in the behavior of thin films, such as those used, e.g., assensor coatings. In an attempt to develop a conclusive approach to determine these quantities, the polarity of the model polymerpoly(methyl methacrylate) (PMMA) in 600 nm thin films on a glass support was probed by the energy of the charge transfer transi-tion in the oxazine dye Nile red (NR) at 25 °C. The absorption and fluorescence spectra of NR were observed to shift to the redwith increasing solvent polarity, because of the intramolecular charge transfer character of the optical transition. New types ofsolvatochromic plots of emission frequency against absorption frequency and vice versa afforded the Onsager radius-free estima-tion of the ground and excited states dipole moment ratio. With this approach the values of these dipole moments of 11.97 D and18.30–19.16 D, respectively, were obtained for NR. An effective local dielectric constant of 5.9–8.3 for PMMA thin films wascalculated from the solvatochromic plot and the fluorescence maximum of NR observed in the PMMA films. The fluorescenceband of NR in the rigid PMMA films shifted to the red by 130 cm−1 with increasing excitation wavelength from 470 to 540 nm,while in a series of liquids the position of the emission maximum of NR remained constant within same range of the excitationwavelength. It is concluded that the fluorescence spectrum of NR in PMMA undergoes inhomogeneous broadening due to differentsurroundings of NR molecules in the ground state and slow sub-glass transition (Tg) relaxations in PMMA.
2552
IntroductionThe chain and segment mobility as well as the permittivity ofpolymers possess an enormous impact on the properties of poly-mers and polymer thin films. For ultrathin films, in which the
film thickness is in the order of the radius of gyration, specialeffects of confinement have been observed. Prominent exam-ples are the properties of substrate-supported ultrathin polymer
films, in which the values of the glass transition temperature(Tg) and segmental mobilities were found to be altered. Like-wise, this holds for transport properties, including polymernanocapsule membrane permeability [1], enzyme-triggered bac-terial sensors [2-5] and intelligent self-controlled drug deliverysystems [4,6-10], as well as dynamics of polymers at interfaces[11].
To be able to understand local properties of polymers, in partic-ular in nanoenvironments of polymeric vesicles (polymer-somes), comprising a hydrophilic corona and a hydrophobicwall [1,12], or in substrate-supported ultrathin films [13], theanalysis of the photophysical properties of tracer dye moleculeswas found to be beneficial. In time-resolved fluorescence mea-surements and dye diffusion studies, the nanoenvironments inpolymersomes could be assigned [1,12], solute transport becharacterized [1] and segment mobilities inferred [13], respec-tively. For other purposes the oxazine tracer dye Nile red (NR,Figure 1) served as a local probe to enable the study of degrada-tion of enzyme labile polymersomes [14]. The same dye hasbeen reported as probe for local permittivity in polymers, inparticular, the spatial distribution of the dielectric constantmeasured for thin PMMA films was described using NR as a re-ported dye [15].
Figure 1: Molecular structure of Nile red (NR).
Because NR is (i) a photostable dye, (ii) possesses convenientoptical properties, such as excitation with visible light, and fluo-rescence, which does not overlay with absorption of many bio-molecules, and (iii) exhibits fluorescence, which is stronglyinfluenced by the polarity of the environment, it has been em-ployed as a polarity probe in biological applications [16-19] andmaterials/nanoscience [15,20-23]. For instance, the spatial dis-tribution of the dielectric constant for thin PMMA films wasmapped by analyzing the position of the fluorescence of NRemployed as a reporter dye [15]. Besides polarity, the Young’smodulus of the polymer matrix was found to be related to thefluorescence lifetimes (τf) of NR [21]. Furthermore, the spec-tral position of NR fluorescence was used to detect a lipid drop-let in monkey aortic smooth muscle cells [16], for visualizingdifferent proteins, such as lactoglobulin, casein and albumin[17]. In fluorescence lifetime imaging microscopy τf as a viablecontrast parameter was employed to image lipid droplets inliving HeLa cells stained with NR [19]. Recently, the phase of
the microcapsules and their energy release were analyzed bymonitoring the color of NR fluorescence in an energy storagemicrosystem [22].
Although NR solvent effects are a useful tool in biology andtechnology, an adequate description and characterization of thephenomenon is still far from accurate. Fortunately, a contribu-tion of solute to the large amplitude motion of the diethylaminogroup (twisting) in intramolecular charge transfer excited stateof NR, postulated in references [21,24,25] was later associatedwith an artefact [26]. However, the characteristics of NR in sol-vents and in matrices, such as the polarity of NR in the groundand excited states, as one can see in detail below, remains stillrather controversial.
Here we aim at the development of a conclusive approach to de-termine the permittivity of polymers and its spatial distributionas they play a crucial role in the behavior of thin films, asalluded to above. Poly(methyl methacrylate) (PMMA) insubmicrometer thin films on a glass support served as a modelsystem.
The relaxation processes in bulk PMMA are well establishedand have been well characterized by dielectric [27-29] anddynamic mechanical analyses [30-32], NMR spectroscopy [33],and fluorescence spectroscopy [28]. For PMMA, the α-relaxa-tion as slowest relaxation is observed at the glass transition(Tg = 95–110 °C) [34]. It corresponds to long-range conforma-tional changes of the polymer backbone. This relaxation isfrozen in the current experiments. However, the secondary β-,γ-, and δ-relaxations, which correspond to the side chainmotions of the ester group and rotations of the methyl groupsattached to the main as well as to the side chains, possess char-acteristic relaxation temperatures Tβ = 10–40 °C, Tγ = −100 to−170 °C, and Tδ = −180 °C [28,31]. In PMMA, the dynamics ofthe ester group (β-relaxation) can furthermore be coupled withthe α-relaxation [29].
Results and DiscussionFor the development of a quantitative understanding of thepolar probe NR in various nanoenvironments it is imperative toobtain a consistent description of the charge transfer at the elec-tronic transition. For this purpose, the best choice is to studyNR in dipolar solvents free from specific interactions with thissolute. Finally, the polarity of the polymer matrix that does notpossess comparable solute–solvent interactions will be probedwith NR.
Dipole momentsWith increasing solvent polarity, the maxima in the fluores-cence spectra of NR in liquid solvents at 25 °C were observed
Beilstein J. Org. Chem. 2019, 15, 2552–2562.
2554
Table 1: Absorption (νa) and fluorescence (νf) maxima of NR, fluorescence maxima (νfs) of the intramolecular charge transfer state of 4-(diisopropyl-amino)benzonitrile (DIABN) in different solvents, solvent dielectric constants (ε), refractive indexes (n) and Lippert polarity functions at 25 °C.
N Solvent εa nb f(ε) − f(n2)c νa, cm−1 νf, cm−1 νfsd, cm−1
10 MeCNi 36.65 1.342 0.306 18680 16090 20490aDielectric constants from ref [49]. bRefractive indexes from ref [50]. cLippert polarity function f(ε) − f(n2). dHalf-sum of wavenumbers for the maximaof the first and second vibronic peaks in the spectrum possessing practically equal intensities, see Figure 1. eChloroform. fEthyl acetate.gDichloromethane. h1,2-Dichloroethane. iAcetonitrile.
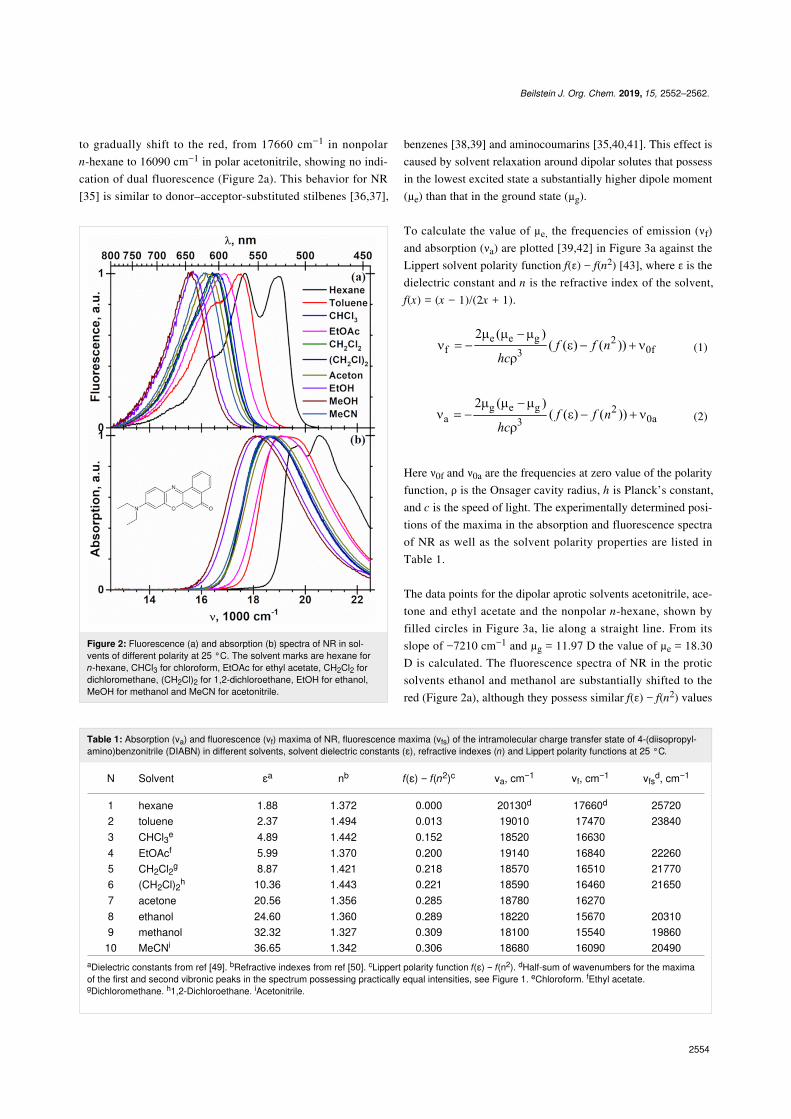
Figure 2: Fluorescence (a) and absorption (b) spectra of NR in sol-vents of different polarity at 25 °C. The solvent marks are hexane forn-hexane, CHCl3 for chloroform, EtOAc for ethyl acetate, CH2Cl2 fordichloromethane, (CH2Cl)2 for 1,2-dichloroethane, EtOH for ethanol,MeOH for methanol and MeCN for acetonitrile.
to gradually shift to the red, from 17660 cm−1 in nonpolarn-hexane to 16090 cm−1 in polar acetonitrile, showing no indi-cation of dual fluorescence (Figure 2a). This behavior for NR[35] is similar to donor–acceptor-substituted stilbenes [36,37],
benzenes [38,39] and aminocoumarins [35,40,41]. This effect iscaused by solvent relaxation around dipolar solutes that possessin the lowest excited state a substantially higher dipole moment(μe) than that in the ground state (μg).
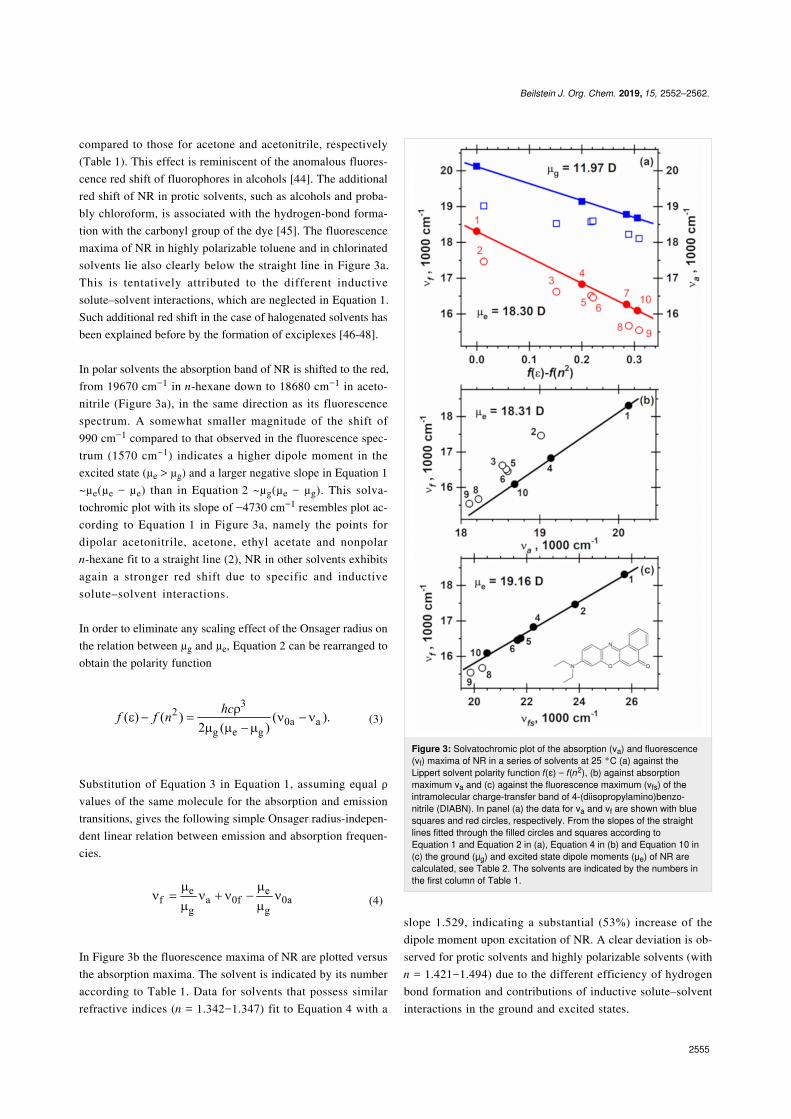
To calculate the value of μe, the frequencies of emission (νf)and absorption (νa) are plotted [39,42] in Figure 3a against theLippert solvent polarity function f(ε) − f(n2) [43], where ε is thedielectric constant and n is the refractive index of the solvent,f(x) = (x − 1)/(2x + 1).
(1)
(2)
Here ν0f and ν0a are the frequencies at zero value of the polarityfunction, ρ is the Onsager cavity radius, h is Planck’s constant,and c is the speed of light. The experimentally determined posi-tions of the maxima in the absorption and fluorescence spectraof NR as well as the solvent polarity properties are listed inTable 1.
The data points for the dipolar aprotic solvents acetonitrile, ace-tone and ethyl acetate and the nonpolar n-hexane, shown byfilled circles in Figure 3a, lie along a straight line. From itsslope of −7210 cm−1 and μg = 11.97 D the value of μe = 18.30D is calculated. The fluorescence spectra of NR in the proticsolvents ethanol and methanol are substantially shifted to thered (Figure 2a), although they possess similar f(ε) − f(n2) values
Beilstein J. Org. Chem. 2019, 15, 2552–2562.
2555
compared to those for acetone and acetonitrile, respectively(Table 1). This effect is reminiscent of the anomalous fluores-cence red shift of fluorophores in alcohols [44]. The additionalred shift of NR in protic solvents, such as alcohols and proba-bly chloroform, is associated with the hydrogen-bond forma-tion with the carbonyl group of the dye [45]. The fluorescencemaxima of NR in highly polarizable toluene and in chlorinatedsolvents lie also clearly below the straight line in Figure 3a.This is tentatively attributed to the different inductivesolute–solvent interactions, which are neglected in Equation 1.Such additional red shift in the case of halogenated solvents hasbeen explained before by the formation of exciplexes [46-48].
In polar solvents the absorption band of NR is shifted to the red,from 19670 cm−1 in n-hexane down to 18680 cm−1 in aceto-nitrile (Figure 3a), in the same direction as its fluorescencespectrum. A somewhat smaller magnitude of the shift of990 cm−1 compared to that observed in the fluorescence spec-trum (1570 cm−1) indicates a higher dipole moment in theexcited state (μe > μg) and a larger negative slope in Equation 1~μe(μe − μe) than in Equation 2 ~μg(μe − μg). This solva-tochromic plot with its slope of −4730 cm−1 resembles plot ac-cording to Equation 1 in Figure 3a, namely the points fordipolar acetonitrile, acetone, ethyl acetate and nonpolarn-hexane fit to a straight line (2), NR in other solvents exhibitsagain a stronger red shift due to specific and inductivesolute–solvent interactions.
In order to eliminate any scaling effect of the Onsager radius onthe relation between μg and μe, Equation 2 can be rearranged toobtain the polarity function
(3)
Substitution of Equation 3 in Equation 1, assuming equal ρvalues of the same molecule for the absorption and emissiontransitions, gives the following simple Onsager radius-indepen-dent linear relation between emission and absorption frequen-cies.
(4)
In Figure 3b the fluorescence maxima of NR are plotted versusthe absorption maxima. The solvent is indicated by its numberaccording to Table 1. Data for solvents that possess similarrefractive indices (n = 1.342−1.347) fit to Equation 4 with a
Figure 3: Solvatochromic plot of the absorption (νa) and fluorescence(νf) maxima of NR in a series of solvents at 25 °C (a) against theLippert solvent polarity function f(ε) − f(n2), (b) against absorptionmaximum νa and (c) against the fluorescence maximum (νfs) of theintramolecular charge-transfer band of 4-(diisopropylamino)benzo-nitrile (DIABN). In panel (a) the data for νa and νf are shown with bluesquares and red circles, respectively. From the slopes of the straightlines fitted through the filled circles and squares according toEquation 1 and Equation 2 in (a), Equation 4 in (b) and Equation 10 in(c) the ground (μg) and excited state dipole moments (μe) of NR arecalculated, see Table 2. The solvents are indicated by the numbers inthe first column of Table 1.
slope 1.529, indicating a substantial (53%) increase of thedipole moment upon excitation of NR. A clear deviation is ob-served for protic solvents and highly polarizable solvents (withn = 1.421−1.494) due to the different efficiency of hydrogenbond formation and contributions of inductive solute–solventinteractions in the ground and excited states.
Beilstein J. Org. Chem. 2019, 15, 2552–2562.
2556
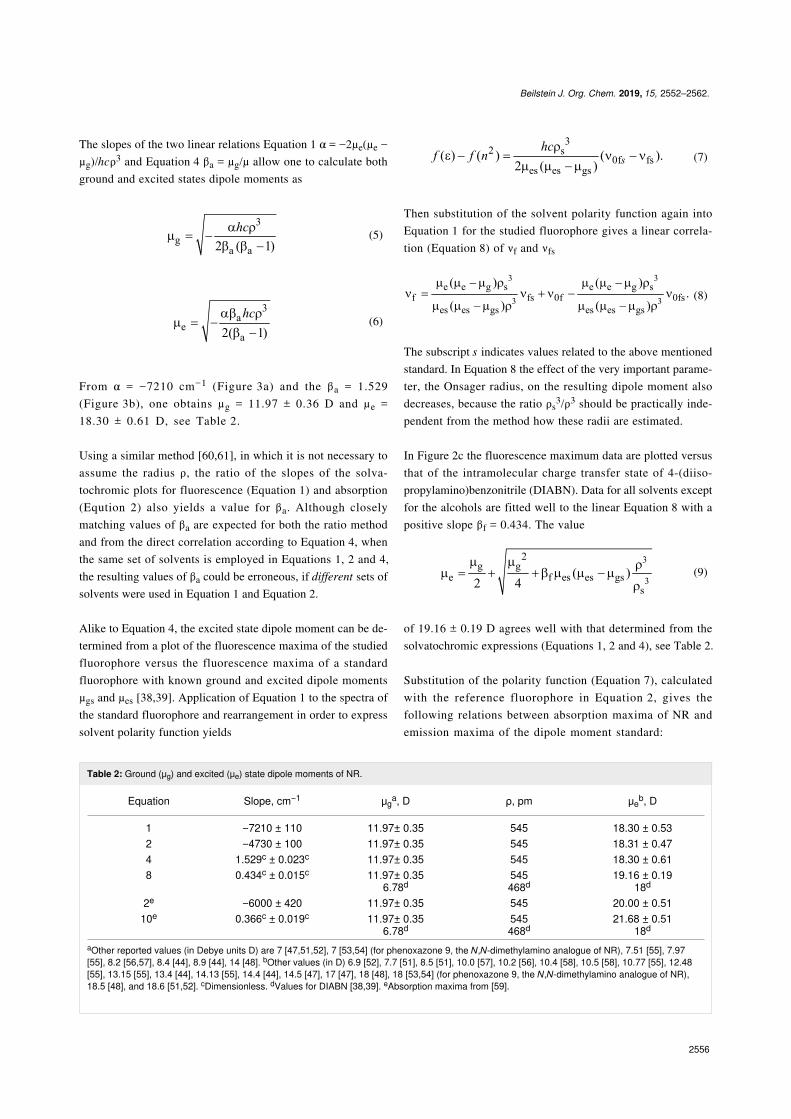
Table 2: Ground (μg) and excited (μe) state dipole moments of NR.
aOther reported values (in Debye units D) are 7 [47,51,52], 7 [53,54] (for phenoxazone 9, the N,N-dimethylamino analogue of NR), 7.51 [55], 7.97[55], 8.2 [56,57], 8.4 [44], 8.9 [44], 14 [48]. bOther values (in D) 6.9 [52], 7.7 [51], 8.5 [51], 10.0 [57], 10.2 [56], 10.4 [58], 10.5 [58], 10.77 [55], 12.48[55], 13.15 [55], 13.4 [44], 14.13 [55], 14.4 [44], 14.5 [47], 17 [47], 18 [48], 18 [53,54] (for phenoxazone 9, the N,N-dimethylamino analogue of NR),18.5 [48], and 18.6 [51,52]. cDimensionless. dValues for DIABN [38,39]. eAbsorption maxima from [59].
The slopes of the two linear relations Equation 1 α = −2μe(μe −μg)/hcρ3 and Equation 4 βa = μg/μ allow one to calculate bothground and excited states dipole moments as
(5)
(6)
From α = −7210 cm−1 (Figure 3a) and the βa = 1.529(Figure 3b), one obtains μg = 11.97 ± 0.36 D and μe =18.30 ± 0.61 D, see Table 2.
Using a similar method [60,61], in which it is not necessary toassume the radius ρ, the ratio of the slopes of the solva-tochromic plots for fluorescence (Equation 1) and absorption(Eqution 2) also yields a value for βa. Although closelymatching values of βa are expected for both the ratio methodand from the direct correlation according to Equation 4, whenthe same set of solvents is employed in Equations 1, 2 and 4,the resulting values of βa could be erroneous, if different sets ofsolvents were used in Equation 1 and Equation 2.
Alike to Equation 4, the excited state dipole moment can be de-termined from a plot of the fluorescence maxima of the studiedfluorophore versus the fluorescence maxima of a standardfluorophore with known ground and excited dipole momentsμgs and μes [38,39]. Application of Equation 1 to the spectra ofthe standard fluorophore and rearrangement in order to expresssolvent polarity function yields
(7)
Then substitution of the solvent polarity function again intoEquation 1 for the studied fluorophore gives a linear correla-tion (Equation 8) of νf and νfs
(8)
The subscript s indicates values related to the above mentionedstandard. In Equation 8 the effect of the very important parame-ter, the Onsager radius, on the resulting dipole moment alsodecreases, because the ratio ρs
3/ρ3 should be practically inde-pendent from the method how these radii are estimated.
In Figure 2c the fluorescence maximum data are plotted versusthat of the intramolecular charge transfer state of 4-(diiso-propylamino)benzonitrile (DIABN). Data for all solvents exceptfor the alcohols are fitted well to the linear Equation 8 with apositive slope βf = 0.434. The value
(9)
of 19.16 ± 0.19 D agrees well with that determined from thesolvatochromic expressions (Equations 1, 2 and 4), see Table 2.
Substitution of the polarity function (Equation 7), calculatedwith the reference fluorophore in Equation 2, gives thefollowing relations between absorption maxima of NR andemission maxima of the dipole moment standard:
Beilstein J. Org. Chem. 2019, 15, 2552–2562.
2557
(10)
With the slope of the linear function (10)
(11)
The excited state dipole moment can be evaluated as
(12)
The published values of the dipole moments [44,47,48,51-56]of NR, summarized in the footnote of Table 2, are almostuniformly dispersed in the wide range from 7 to 14 D for μg andfrom 6.9 to 19.6 D for μe, respectively. All data demonstrate anincreasing of dipole moment at the excitation μe − μg between1.8 and 11.6 D [44,51,56,62,63], also with μg = 7 D andμe = 6.9 ± 2.1 D [52] it is still correct within the experimentaluncertainty. Thus, the values of NR μg = 11.97 D and μe − μgfrom 6.34 to 7.20 D obtained here (Table 2) agree with thepublished data. The excited state dipole moment μe from 18.30to 19.16 D and the slightly higher μe = 20–22 D (Figure S1,Supporting Information File 1, Table 2) calculated fromthe published absorption maxima of NR [59] using Equation 2and Equation 10 is on the upper bound of the published μevalues.
From a theoretical point of view, the very broad distribution ofdipole moments published in the literature [44,47,48,51-58]might be caused because (i) various experimental approacheswere used, including solvatochromic, thermochromic anddielectric friction techniques, and (ii) different theoreticalmodels of solvatochromic effects were employed, some of themtake inductive solute–solvent interactions and solute polariz-ability into account, others neglect them, and (iii) different defi-nitions of the molecular dipole moment in solvent-free condi-tions in vacuum or in solvents with zero polarity functionf(ε) − f(n2) were used. Most of these divergences can becompensated by an appropriate selection of the solvent set. Forexample, the effect of inductive solute–solvent interactions onνa or νf becomes practically invariant, when the refractive indexis constant in a series of solvents. From an experimental pointof view, the broad distribution of reported dipole momentscould also be the result of an imprecise correction of emission
spectra for the spectral response or their imprecise presentationon the wavenumber scale. The major challenge appears to bethe lack of independently determined parameters of the NRground state dipole moment and/or its cavity radius, which areboth important.
Two values of the Onsager radius, 410 pm [51,52,55,57,58] and500 pm [44,47,57,62], were used in [44,47,48,51-56,62,63] toevaluate μe or μe − μg. The first value is the van der Waalsradius ρ = (3V/4π)1/3, where the van der Waals volume V is thesum of atomic increments [64]. The second value was chosenarbitrarily as a typical value. In addition, both these values of ρwere not verified with respect to their applicability for use insolvatochromy of NR.
In the present paper, we used ρ = ρ0(M/M0)1/3, where M is themolar mass of the fluorophore and the lower index ‘0’ marksthe corresponding quantity related to N,N-dimethylaminoben-zonitrile (DMABN). The Onsager radius of DMABN wastailored to ρ0 = 420 pm [39] in order to get μe = 17 D for thecharge transfer excited state of DMABN from the solva-tochromic plot (Equation 1). The corresponding dipolemoments were determined with cavity radius free techniques:μg = 6.60 D [39] by dielectric spectroscopy and μe = 17 D [65]by time-resolved microwave conductivity. For the secondarystandard DIABN ρs = 468 pm is calculated from ρ0, μgs = 6.78was measured by dielectric spectroscopy and μgs = 18 D wasdetermined from the solvatochromic plot (Equation 8) relativeto the wavenumber maxima of the excited state charge transferemission spectra of DMABN [38,39]. For NR a cavity radius ofρ = 545 pm is calculated based on ρ0 and M.
When the literature values of the absorption maxima of NR[59], ρ = 545 pm and μg = 11.97 D are fitted with Equation 2and Equation 10, values that are close to the values ofμe = 20–22 D reported here are obtained (Table 2). Because thecavity radius for NR is adapted for solvatochromy in our work,reliable values of the ground state and excited state dipolemoments of NR can indeed be calculated.
The crucial importance of the correct value for the Onsagerradius is demonstrated by fitting data from Table 1 with Equa-tion 2 and Equation 5 for a van der Waals radius ρ = 410[51,52,55,57,58]. This fit yields μg = 7.81 D instead of 11.97 D(Table 2) and μe = 11.94 D instead of 18.30 D (Table 2). Thesevalues are close to μg = 8.2 D and μe = 14.4 D from reference[56], where both dipole moments were determined by similaranalysis of absorption and fluorescence spectra of NR. Thus,the large dispersion of reported NR dipole moments[44,47,48,51-56,62,63] is mainly caused by insufficient preci-sion of the value for the cavity radius of NR.
Beilstein J. Org. Chem. 2019, 15, 2552–2562.
2558
Polymer polarity probed with NRThe fluorescence spectra of NR in low and high molarmass PMMA films (Figure 4, Figure S2, Supporting Informa-tion File 1) were found to be close to spectra acquiredin ethyl acetate (Figure 2a), which may be used as amodel for the polymer repeat unit. The broad structurelessfluorescence maximum at ≈600 nm for NR in PMMAreported in references [62,66] might be caused by remainingtraces of solvent from PMMA solution (toluene) [66] in closevicinity to NR molecules, similar to results for NR inpoly(vinylidene fluoride) films cast from dimethyl sulfoxide[15]. This notion is supported by fluorescence maxima (λf)of NR in PMMA at the excitation wavelength λe = 500 nm,which are in the range of 571 < λf < 579 nm, dependingon the polymer molar mass and casting solvents. For ethylacetate, the fluorescence of NR occurs at longer wavelengthλf = 588 nm, which does not agree with the results in reference[66].
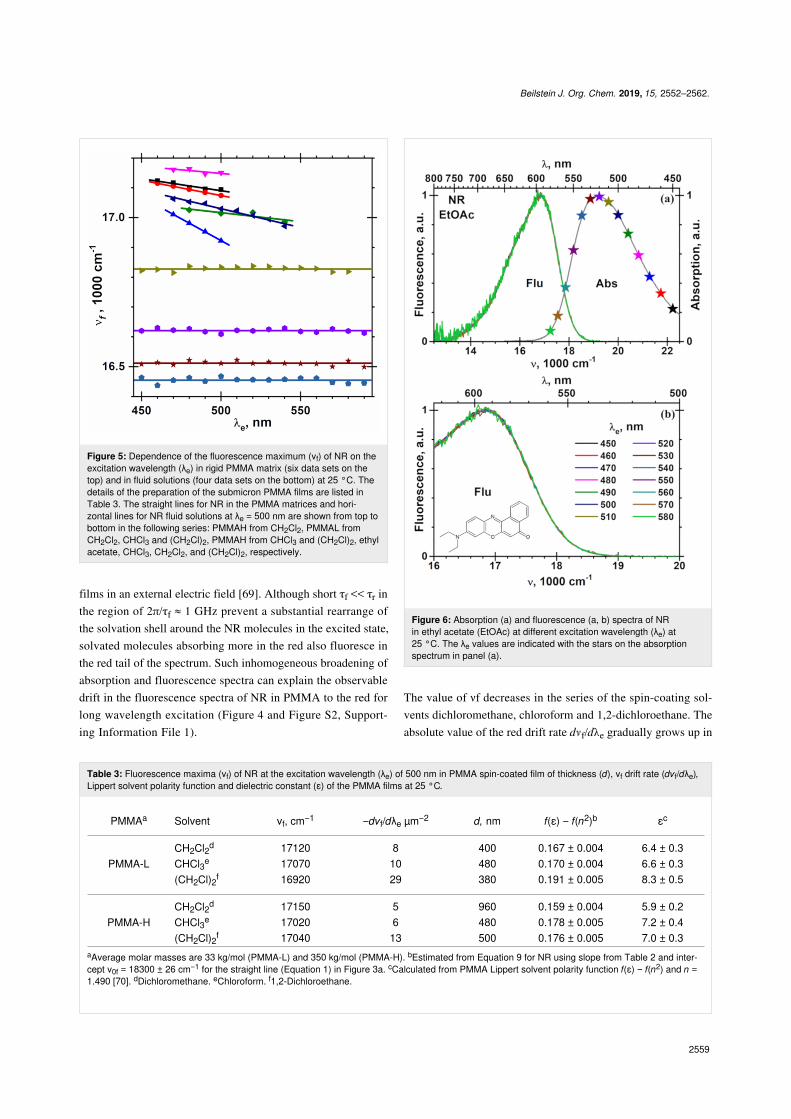
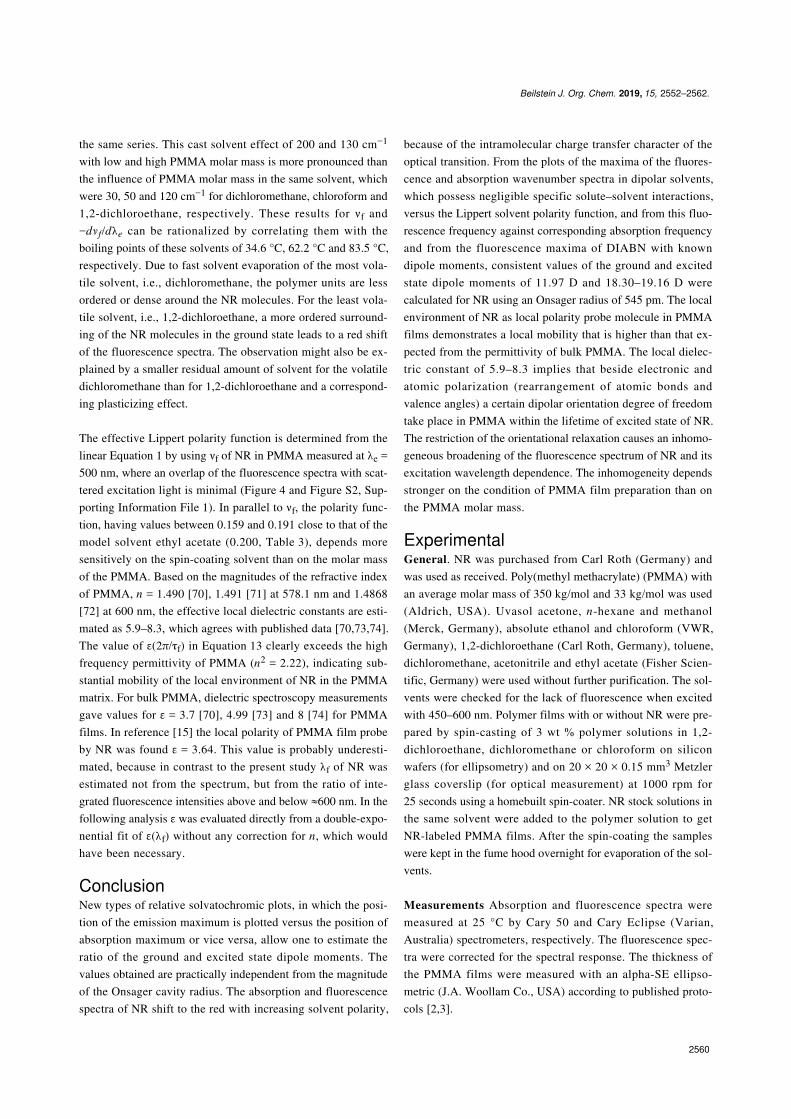
When λe increases, the fluorescence spectrum of NR in thepolymer matrix shifts linearly to the red by 130 cm−1 from17100 at λe = 470 nm to 16970 cm−1 at λe = 540 nm, mainly inthe blue part of the spectrum and at the maximum (Figure 4,Figure 5 and Figure S2, Supporting Information File 1). Incontrast to PMMA, neither the shape of the fluorescence spec-trum of NR nor the position of its maximum depend on λe inliquid solutions, such as in the polymer repeat unit model ethylacetate, and in solvents used for preparation of spin-coatedPMMA films, such as chloroform, dichloromethane and 1,2-dichloroethane (Figure 5, Figure 6 and Figures S3, S4 and S5,Supporting Information File 1). These facts and the blue shiftedfluorescence of NR in PMMA in comparison to mentionedabove solutions (Figure 5) demonstrate that the local polarity inPMMA and/or its dynamics are different than in similar liquidsolutions. The fluorescence maxima of NR at λe = 500 nm, theslopes dνf/dλe of the fluorescence spectrum drift with the exci-tation wavelength and the thicknesses of spin-coated PMMAfilms are collected in Table 3. On the one hand, such indepen-dence of the fluorescence spectra of NR in liquid solutionsupports the high purity of the NR used and its high stabilityalso in the chlorinated solvents, cf. with a lack of a red edgeeffect for 4-fluoro-N,N-dimethylaniline [67]. On the other hand,when the relaxation time of the molecules or segments (τr) ofthe polymer matrix is much longer than the NR fluorescencedecay time τf = 3.87 ns [62] in PMMA and of ≈5 ns [62] in theliquid solvents used, the orientational relaxation of the mole-cules or segments around in the excited NR is not complete.Consequently, the fluorescence of NR in polymers originatingfrom a not solvent-relaxed excited state possesses higherenergy. The corresponding matrix polarity is characterized byan effective dielectric constant ε(2π/τf) between ε, the zero fre-
quency, and ε∞ = n2, the optical frequency permittivity of themedium.
(13)
Figure 4: Absorption (a) and fluorescence (a, b) spectra of NR inPMMA (350 kg/mol) film 500 nm thin at different excitation wavelength(λe). The film was prepared by spin-coating of PMMA solution in 1,2-dichloroethane ((CH2Cl)2) on the 20 × 20 × 0.15 mm3 glass dopedwith NR. The concentration of NR in the PMMA film of 2.1 mM wascalculated from the optical density (panel (a)) and thickness of PMMAfilm with the molar extinction coefficient NR in 1,4-dioxane of38000 M−1·cm−1 [68]. The λe values are indicated with stars on theabsorption spectrum in panel (a). The regions λe ± 5 nm in the fluores-cence spectra (a, b) are not shown due to overlap with strong scat-tering excitation light.
In a similar manner, the dipolar units are dispersed around NRmolecules in the ground state. The observable absorption spec-trum is a superposition of the spectra of such partial solvates ofNR. According to Equation 2 the absorption of strongersolvated NR molecules is shifted to the red. The more NR isirradiated in the red, the higher is the contribution of strongersolvated NR molecules that are excited. A response time τr ofseconds for a polarization dynamics was estimated for PMMA
Beilstein J. Org. Chem. 2019, 15, 2552–2562.
2559
Table 3: Fluorescence maxima (νf) of NR at the excitation wavelength (λe) of 500 nm in PMMA spin-coated film of thickness (d), νf drift rate (dνf/dλe),Lippert solvent polarity function and dielectric constant (ε) of the PMMA films at 25 °C.
aAverage molar masses are 33 kg/mol (PMMA-L) and 350 kg/mol (PMMA-H). bEstimated from Equation 9 for NR using slope from Table 2 and inter-cept ν0f = 18300 ± 26 cm−1 for the straight line (Equation 1) in Figure 3a. cCalculated from PMMA Lippert solvent polarity function f(ε) − f(n2) and n =1.490 [70]. dDichloromethane. eChloroform. f1,2-Dichloroethane.
Figure 5: Dependence of the fluorescence maximum (νf) of NR on theexcitation wavelength (λe) in rigid PMMA matrix (six data sets on thetop) and in fluid solutions (four data sets on the bottom) at 25 °C. Thedetails of the preparation of the submicron PMMA films are listed inTable 3. The straight lines for NR in the PMMA matrices and hori-zontal lines for NR fluid solutions at λe = 500 nm are shown from top tobottom in the following series: PMMAH from CH2Cl2, PMMAL fromCH2Cl2, CHCl3 and (CH2Cl)2, PMMAH from CHCl3 and (CH2Cl)2, ethylacetate, CHCl3, CH2Cl2, and (CH2Cl)2, respectively.
films in an external electric field [69]. Although short τf << τr inthe region of 2π/τf ≈ 1 GHz prevent a substantial rearrange ofthe solvation shell around the NR molecules in the excited state,solvated molecules absorbing more in the red also fluoresce inthe red tail of the spectrum. Such inhomogeneous broadening ofabsorption and fluorescence spectra can explain the observabledrift in the fluorescence spectra of NR in PMMA to the red forlong wavelength excitation (Figure 4 and Figure S2, Support-ing Information File 1).
Figure 6: Absorption (a) and fluorescence (a, b) spectra of NRin ethyl acetate (EtOAc) at different excitation wavelength (λe) at25 °C. The λe values are indicated with the stars on the absorptionspectrum in panel (a).
The value of νf decreases in the series of the spin-coating sol-vents dichloromethane, chloroform and 1,2-dichloroethane. Theabsolute value of the red drift rate dνf/dλe gradually grows up in
Beilstein J. Org. Chem. 2019, 15, 2552–2562.
2560
the same series. This cast solvent effect of 200 and 130 cm−1
with low and high PMMA molar mass is more pronounced thanthe influence of PMMA molar mass in the same solvent, whichwere 30, 50 and 120 cm−1 for dichloromethane, chloroform and1,2-dichloroethane, respectively. These results for νf and−dνf/dλe can be rationalized by correlating them with theboiling points of these solvents of 34.6 °C, 62.2 °C and 83.5 °C,respectively. Due to fast solvent evaporation of the most vola-tile solvent, i.e., dichloromethane, the polymer units are lessordered or dense around the NR molecules. For the least vola-tile solvent, i.e., 1,2-dichloroethane, a more ordered surround-ing of the NR molecules in the ground state leads to a red shiftof the fluorescence spectra. The observation might also be ex-plained by a smaller residual amount of solvent for the volatiledichloromethane than for 1,2-dichloroethane and a correspond-ing plasticizing effect.
The effective Lippert polarity function is determined from thelinear Equation 1 by using νf of NR in PMMA measured at λe =500 nm, where an overlap of the fluorescence spectra with scat-tered excitation light is minimal (Figure 4 and Figure S2, Sup-porting Information File 1). In parallel to νf, the polarity func-tion, having values between 0.159 and 0.191 close to that of themodel solvent ethyl acetate (0.200, Table 3), depends moresensitively on the spin-coating solvent than on the molar massof the PMMA. Based on the magnitudes of the refractive indexof PMMA, n = 1.490 [70], 1.491 [71] at 578.1 nm and 1.4868[72] at 600 nm, the effective local dielectric constants are esti-mated as 5.9–8.3, which agrees with published data [70,73,74].The value of ε(2π/τf) in Equation 13 clearly exceeds the highfrequency permittivity of PMMA (n2 = 2.22), indicating sub-stantial mobility of the local environment of NR in the PMMAmatrix. For bulk PMMA, dielectric spectroscopy measurementsgave values for ε = 3.7 [70], 4.99 [73] and 8 [74] for PMMAfilms. In reference [15] the local polarity of PMMA film probeby NR was found ε = 3.64. This value is probably underesti-mated, because in contrast to the present study λf of NR wasestimated not from the spectrum, but from the ratio of inte-grated fluorescence intensities above and below ≈600 nm. In thefollowing analysis ε was evaluated directly from a double-expo-nential fit of ε(λf) without any correction for n, which wouldhave been necessary.
ConclusionNew types of relative solvatochromic plots, in which the posi-tion of the emission maximum is plotted versus the position ofabsorption maximum or vice versa, allow one to estimate theratio of the ground and excited state dipole moments. Thevalues obtained are practically independent from the magnitudeof the Onsager cavity radius. The absorption and fluorescencespectra of NR shift to the red with increasing solvent polarity,
because of the intramolecular charge transfer character of theoptical transition. From the plots of the maxima of the fluores-cence and absorption wavenumber spectra in dipolar solvents,which possess negligible specific solute–solvent interactions,versus the Lippert solvent polarity function, and from this fluo-rescence frequency against corresponding absorption frequencyand from the fluorescence maxima of DIABN with knowndipole moments, consistent values of the ground and excitedstate dipole moments of 11.97 D and 18.30–19.16 D werecalculated for NR using an Onsager radius of 545 pm. The localenvironment of NR as local polarity probe molecule in PMMAfilms demonstrates a local mobility that is higher than that ex-pected from the permittivity of bulk PMMA. The local dielec-tric constant of 5.9–8.3 implies that beside electronic andatomic polarization (rearrangement of atomic bonds andvalence angles) a certain dipolar orientation degree of freedomtake place in PMMA within the lifetime of excited state of NR.The restriction of the orientational relaxation causes an inhomo-geneous broadening of the fluorescence spectrum of NR and itsexcitation wavelength dependence. The inhomogeneity dependsstronger on the condition of PMMA film preparation than onthe PMMA molar mass.
ExperimentalGeneral. NR was purchased from Carl Roth (Germany) andwas used as received. Poly(methyl methacrylate) (PMMA) withan average molar mass of 350 kg/mol and 33 kg/mol was used(Aldrich, USA). Uvasol acetone, n-hexane and methanol(Merck, Germany), absolute ethanol and chloroform (VWR,Germany), 1,2-dichloroethane (Carl Roth, Germany), toluene,dichloromethane, acetonitrile and ethyl acetate (Fisher Scien-tific, Germany) were used without further purification. The sol-vents were checked for the lack of fluorescence when excitedwith 450–600 nm. Polymer films with or without NR were pre-pared by spin-casting of 3 wt % polymer solutions in 1,2-dichloroethane, dichloromethane or chloroform on siliconwafers (for ellipsometry) and on 20 × 20 × 0.15 mm3 Metzlerglass coverslip (for optical measurement) at 1000 rpm for25 seconds using a homebuilt spin-coater. NR stock solutions inthe same solvent were added to the polymer solution to getNR-labeled PMMA films. After the spin-coating the sampleswere kept in the fume hood overnight for evaporation of the sol-vents.
Measurements Absorption and fluorescence spectra weremeasured at 25 °C by Cary 50 and Cary Eclipse (Varian,Australia) spectrometers, respectively. The fluorescence spec-tra were corrected for the spectral response. The thickness ofthe PMMA films were measured with an alpha-SE ellipso-metric (J.A. Woollam Co., USA) according to published proto-cols [2,3].
Beilstein J. Org. Chem. 2019, 15, 2552–2562.
2561
Supporting InformationSupporting Information File 1Solvatochromic plots and fluorescence spectra of NR.[https://www.beilstein-journals.org/bjoc/content/supplementary/1860-5397-15-248-S1.pdf]
AcknowledgementsThis work was supported by the University of Siegen.
ORCID® iDsSergey I. Druzhinin - https://orcid.org/0000-0002-6545-8819Holger Schönherr - https://orcid.org/0000-0002-5836-5569
5. Milo, S.; Thet, N. T.; Liu, D.; Nzakizwanayo, J.; Jones, B. V.;Jenkins, A. T. A. Biosens. Bioelectron. 2016, 81, 166–172.doi:10.1016/j.bios.2016.02.059
41. Andreatta, D.; Sen, S.; Pérez Lustres, J. L.; Kovalenko, S. A.;Ernsting, N. P.; Murphy, C. J.; Coleman, R. S.; Berg, M. A.J. Am. Chem. Soc. 2006, 128, 6885–6892. doi:10.1021/ja0582105
42. Baumann, W.; Bischof, H.; Fröhling, J.-C.; Brittinger, C.; Rettig, W.;Rotkiewicz, K. J. Photochem. Photobiol., A 1992, 64, 49–72.doi:10.1016/1010-6030(92)85093-a
43. Lippert, E. Z. Naturforsch., A: Astrophys., Phys. Phys. Chem. 1955, 10,541–545. doi:10.1515/zna-1955-0707
44. Golini, C. M.; Williams, B. W.; Foresman, J. B. J. Fluoresc. 1998, 8,395–404. doi:10.1023/a:1020584801600
45. Klymchenko, A. S.; Duportail, G.; Demchenko, A. P.; Mély, Y.Biophys. J. 2004, 86, 2929–2941. doi:10.1016/s0006-3495(04)74344-1
46. Ghoneim, N.; Suppan, P. J. Lumin. 1989, 44, 83–86.doi:10.1016/0022-2313(89)90024-0
47. Ghoneim, N. Spectrochim. Acta, Part A 2000, 56, 1003–1010.doi:10.1016/s1386-1425(99)00199-7
48. Renge, I. J. Photochem. Photobiol., A 2018, 353, 433–444.doi:10.1016/j.jphotochem.2017.11.048
49. Static Dielectric Constants of Pure Liquids and Binary Liquid Mixtures.In Landolt-Börnstein. Numerical Data and Functional Relationships inScience and Technology - Group IV Physical Chemistry; Madelung, O.,Ed.; Springer: Berlin, 1991; Vol. 6. doi:10.1007/b44266
50. Optical Constants. Refractive Indices of Organic Liquids. InLandolt-Börnstein. Numerical Data and Functional Relationships inScience and Technology - Group III Condensed Matter;Lechner, M. D., Ed.; Springer: Berlin, 1996; Vol. 38B.doi:10.1007/b85533
59. Deye, J. F.; Berger, T. A.; Anderson, A. G.Anal. Chem. (Washington, DC, U. S.) 1990, 62, 615–622.doi:10.1021/ac00205a015
60. Suppan, P. Chem. Phys. Lett. 1983, 94, 272–275.doi:10.1016/0009-2614(83)87086-9
61. Suppan, P. J. Photochem. Photobiol., A 1990, 50, 293–330.doi:10.1016/1010-6030(90)87021-3
62. Dutta, A. K.; Kamada, K.; Ohta, K. J. Photochem. Photobiol., A 1996,93, 57–64. doi:10.1016/1010-6030(95)04140-0
63. Sarkar, N.; Das, K.; Nath, D. N.; Bhattacharyya, K. Langmuir 1994, 10,326–329. doi:10.1021/la00013a048
64. Edward, J. T. J. Chem. Educ. 1970, 47, 261. doi:10.1021/ed047p26165. Schuddeboom, W.; Jonker, S. A.; Warman, J. M.; Leinhos, U.;
Kuehnle, W.; Zachariasse, K. A. J. Phys. Chem. 1992, 96,10809–10819. doi:10.1021/j100205a041
66. Samsonova, L. G.; Selivanov, N. I.; Kopylova, T. N. Opt. Spectrosc.2014, 116, 72–76. doi:10.1134/s0030400x14010196
67. Zachariasse, K. A.; Demeter, A.; Druzhinin, S. I. J. Phys. Chem. A2017, 121, 1223–1232. doi:10.1021/acs.jpca.6b12142
68. Taniguchi, M.; Lindsey, J. S. Photochem. Photobiol. 2018, 94,290–327. doi:10.1111/php.12860
69. Chen, R.; Zhang, G.; Gao, Y.; Xiao, L.; Jia, S. Appl. Phys. Lett. 2012,100, 203118. doi:10.1063/1.4717049
70. Van Krevelen, D. W.; Te Nijenhuis, K. Magnetic Properties; Propertiesof Polymers; Elsevier: Amsterdam, Netherlands, 2009; pp 287–318.doi:10.1016/B978-0-08-054819-7.00010-8
71. Sultanova, N.; Kasarova, S.; Nikolov, I. Acta Phys. Pol., A 2009, 116,585–587. doi:10.12693/aphyspola.116.585
73. Clayton, L. M.; Sikder, A. K.; Kumar, A.; Cinke, M.; Meyyappan, M.;Gerasimov, T. G.; Harmon, J. P. Adv. Funct. Mater. 2005, 15,101–106. doi:10.1002/adfm.200305106
74. Nasr, G. M.; Ahmed, R. M. Mod. Phys. Lett. B 2010, 24, 911–919.doi:10.1142/s0217984910022962
License and TermsThis is an Open Access article under the terms of theCreative Commons Attribution License(http://creativecommons.org/licenses/by/4.0). Please notethat the reuse, redistribution and reproduction in particularrequires that the authors and source are credited.
The license is subject to the Beilstein Journal of OrganicChemistry terms and conditions:(https://www.beilstein-journals.org/bjoc)
The definitive version of this article is the electronic onewhich can be found at:doi:10.3762/bjoc.15.248