YI-CHUN CHEN and FANG-YING YANG PROBING THE RELATIONSHIP BETWEEN PROCESS OF SPATIAL PROBLEMS SOLVING AND SCIENCE LEARNING: AN EYE TRACKING APPROACH Received: 1 August 2013; Accepted: 8 December 2013 ABSTRACT. There were two purposes in the study. One was to explore the cognitive activities during spatial problem solving and the other to probe the relationship between spatial ability and science concept learning. Twenty university students participated in the study. The Purdue Visualization of Rotations Test (PVRT) was used to assess the spatial ability, whose items were divided into different types of problems with respect to the rotation angles and levels of plane invisibility. The eye tracking technology and the interview technique were employed to analyze subjects’ the online cognitive processes and problem solving strategies. Students’ concept gains were examined by content analysis after reading a science report. The result shows that, first, the interview analysis shows that students of different PVRT performances employed different problem solving strategies. Second, rotation angles as well as levels of plane invisibility inserted significant effects on the online processes and performances of the spatial problem solving. Third, the accuracy performance of PVRT was correlated with eye movement patterns. At last, it was found that concept performance was not correlated with PVRT performance but associated with spatial memory and problem solving strategies. KEY WORDS: 3D mental rotation, eye movements, eye tracking, science learning, spatial ability, spatial problem solving INTRODUCTION Spatial ability is usually considered to be related to science learning. Mathewson (1999) pointed out that visual-spatial thinking plays an important role in the science domain, especially in scientific creativity and communication. Wai, Lubinski & Benbow (2009) proposed spatial ability as a salient psychological characteristic among young adolescents who selected advanced degrees or professional careers in the science, technology, engineering, and mathematics (STEM) domains. Recently, many investigators are paying attention to the role of spatial ability in the learning of multimedia materials characterized by graphical displays such as static pictures and animations (Höffler, 2010). Although educational studies in general agree with the importance of the ability, it is not yet clear what spatial ability is. There are heterogeneous definitions of its structure and components (Carrolls, 1993; Hegarty & Waller, 2006; International Journal of Science and Mathematics Education 2014 # National Science Council, Taiwan 2014
Transcript
YI-CHUN CHEN and FANG-YING YANG
PROBING THE RELATIONSHIP BETWEEN PROCESS OF SPATIALPROBLEMS SOLVING AND SCIENCE LEARNING: AN EYE
TRACKING APPROACH
Received: 1 August 2013; Accepted: 8 December 2013
ABSTRACT. There were two purposes in the study. One was to explore the cognitiveactivities during spatial problem solving and the other to probe the relationship betweenspatial ability and science concept learning. Twenty university students participated in thestudy. The Purdue Visualization of Rotations Test (PVRT) was used to assess the spatialability, whose items were divided into different types of problems with respect to therotation angles and levels of plane invisibility. The eye tracking technology and theinterview technique were employed to analyze subjects’ the online cognitive processesand problem solving strategies. Students’ concept gains were examined by contentanalysis after reading a science report. The result shows that, first, the interview analysisshows that students of different PVRT performances employed different problem solvingstrategies. Second, rotation angles as well as levels of plane invisibility inserted significanteffects on the online processes and performances of the spatial problem solving. Third, theaccuracy performance of PVRT was correlated with eye movement patterns. At last, it wasfound that concept performance was not correlated with PVRT performance but associatedwith spatial memory and problem solving strategies.
KEY WORDS: 3D mental rotation, eye movements, eye tracking, science learning, spatialability, spatial problem solving
INTRODUCTION
Spatial ability is usually considered to be related to science learning.Mathewson (1999) pointed out that visual-spatial thinking plays animportant role in the science domain, especially in scientific creativity andcommunication. Wai, Lubinski & Benbow (2009) proposed spatial abilityas a salient psychological characteristic among young adolescents whoselected advanced degrees or professional careers in the science,technology, engineering, and mathematics (STEM) domains. Recently,many investigators are paying attention to the role of spatial ability in thelearning of multimedia materials characterized by graphical displays suchas static pictures and animations (Höffler, 2010). Although educationalstudies in general agree with the importance of the ability, it is not yetclear what spatial ability is. There are heterogeneous definitions of itsstructure and components (Carrolls, 1993; Hegarty & Waller, 2006;
International Journal of Science and Mathematics Education 2014# National Science Council, Taiwan 2014
Höffler, 2010), but its vague definition has become one of the mainbarriers for further studies on its effects on science learning.
In short, what spatial ability is and how it influences science learning areissues that have not reached final agreement. To have an in-depthunderstanding of the role of spatial ability in learning, it is necessary toexamine how individuals exercise the ability during spatial problem-solvingtasks, and how the problem-solving steps might interact with learning. In thisstudy, we employed eye tracking technology, which is able to record onlinecognitive processes, to explore the process of spatial problem solving. Inaddition, a concept-learning task was also conducted to test the associationbetween the online problem-solving processes and science concept learning.By examining process and performance, we hope to gain more insights intothe effects of spatial ability on science learning.
LITERATURE REVIEW
The Definition of Spatial Ability
Although the term “spatial ability” has been widely used in many studies,this construct has not been thoroughly clarified. An earlier studyconducted by Michael and associates (1957) proposed three factors ofspatial ability, namely spatial visualization, spatial relations and orienta-tion, and kinesthetic imagery. Later, based on an exploratory factoranalysis, Carrolls (1993) proposed six spatial factors in the domain ofvisual perception, including spatial visualization, spatial relations, closurespeed, flexibility of closure, perceptual speed, and visual memory.Recently in a review study, Hegarty & Waller (2006) argued that spatialability was not a unitary factor but rather a compound construct, based onstudies determining the factor structure of spatial ability in the mid-twentieth century (e.g. French, 1951; Guilford & Lacey, 1947; Thurstone,1950; Zimmerman, 1954). In short, across different research areas, thereis still no consensus on how spatial ability should be defined andmeasured (Eliot & Smith, 1983; Carrolls, 1993; Hegarty & Waller, 2006).These inconsistencies might be due to inconsistent naming conventionsamong investigators or spatial tests. Moreover, it has been found thatthese tests were not loaded consistently on distinct factors (Carrolls, 1993;Hegarty & Waller, 2006). Consequently, what spatial ability is and whatit consists of are issues still in dispute (e.g. Blazhenkova &Kozhevnikov, 2010; Hegarty, Richardson, Montello, Lovelace & Subbiah,2002; Zhang, 2004).
YI-CHUN CHEN AND FANG-YING YANG
For educational purposes, it is necessary to identify the crucial componentsof spatial ability before discussing its relation with learning or academicachievement (e.g. Rohde & Thompson, 2007; Uttal & Cohen, 2012). In thisstudy, we specifically explored learners’ spatial ability regarding mentalrotation because mental rotation has been widely recognized as a crucial spatialability for problem solving in the domain of science and engineering education.Many relevant tests have been developed (e.g. Stieff, 2007; Onyancha, Derov& Kinsey, 2009). In the following, what mental rotation ability is and factorsinfluencing the solving of mental rotation problems are discussed.
Solving Mental Rotation ProblemsThe Structure of Mental Rotation Ability. As mentioned, the structure ofspatial ability in psychological studies was mostly determined by the factoranalysis on the corresponding spatial test. It was found that “spatialvisualization” was a significant factor for the three-dimension complex, while“spatial relation” contributes most to the two-dimension (the Card RotationTest, for example) or simple mental rotation tasks (Lohman, Pellegrino,Alderton & Regian, 1987; Carroll, 1993). By definition, spatial visualizationinvolves imagining object movements in 3D space or manipulating objects inthe imagination (French, 1951). The 1963 Educational Testing Service (ETS)defined spatial visualization as the skill to manipulate or transform the image ofspatial patterns into other visual arrangements. Meanwhile, the 1976 ETSdefined spatial orientation or “spatial relation” as it is called by Carrolls (1993)as the skill to perceive spatial patterns or to maintain orientation withrespect to objects in space. In sum, according to above literaturereview, at least two distinct skills might be involved in solving themental rotation problems. One is the skill to maintain or memorizespatial orientation or relation (i.e. spatial orientation or relation), andthe other the skill to manipulate spatial or visual patterns (spatialvisualization).
Factors Affecting the Solving of Mental Rotation Problems. A pioneeringstudy on mental rotation was conducted by Shepard & Metzler (1971) whoused 2D pictures showing 3D geometric forms as the testing material. Themain finding of their study showed that participants’ response time linearlyincreased according to the degree of the angles of rotation. Moreover, therewere no significant differences between geometric forms rotated in thepicture plane and in the depth plane. The results of the study have beenreplicated numerous times with various stimuli (Sternberg, 2009; Hegarty,2010). In solving mental rotation problems, speed (or reaction time) wasoften found to be correlated with the complexity of the item to be rotated (e.g.
PROCESS OF SPATIAL PROBLEMS SOLVING AND SCIENCE LEARNING
the rotation angles as mentioned before, the characteristics of the stimulus,etc.) and the experience of practicing certain problem-solving strategies, butnot with the accuracy of performance (e.g. Kyllonen, Lohman & Woltz,1984;Mumaw, Pellegrino, Kail, & Carter, 1984). It was also found that somecomplex mental rotation tasks cannot be solved by all participants, even withan unlimited amount of time to solve the task (Lohman, 1979). In short, thecomplexity of the stimulus as well as the participants’ prior problem-solvingexperiences would affect the spatial problems solving performance.
The Strategies Needed for Solving Mental Rotation Problems. Just &Carpenter (1985) identified three strategies used to perform cubecomparisons, including the mental rotating strategy, the perspective-taking strategy, and the strategy of comparing orientation-free descrip-tions of the cubes. It was found that when most participants used themental rotation strategy, the high-performance individuals tended to rotatearound non-canonical axes, while low-performance individuals rotatedaxes orthogonal to the faces of the cubes. Kyllonen et al. (1984)discovered that participants sometimes solved complex spatial problemsusing analytical strategies without imagining a sequence of transforma-tions to the figure. Hegarty (2010) adopted the think-aloud method toprobe the strategies used during the Vendenberg Mental Rotation Test,which is a test investigating visualization ability. Four strategy categorieswere found, including mental imagery strategy, spatial analytic strategy,pure analytic strategy and test taking strategy. Among these categories,the “spatial analytic strategy” category was found to be positivelycorrelated with test performance. Such a result reveals that strategiesused in solving mental rotation problems are analytic by nature.
Based on the above literature review, it is concluded the so-calledspatial ability (as the mental rotation ability discussed here) should bedefined by the spatial memory capacity, basic skills (such as visualizationand rotation skills) and analytic strategies. Moreover, the problemcomplexity would interact with the exercises of the spatial ability.Accordingly, to study further about what basic skills and strategies areinvolved in solving mental rotation problems of different levels ofcomplexity, a process approach must be adopted given that most existingstudies used post-hoc research methods.
The Eye Tracking Method
The eye tracking method is known for its ability to record online cognitiveprocesses (Rayner, 2009). It is able to reveal the temporal changes in visualattention as well as the basic mechanisms of information decoding and
YI-CHUN CHEN AND FANG-YING YANG
integration (Rayner, 2009, Ozcelik, Arslan-Ari & Cagiltay, 2010). The useof the eye tracking method to explore learners’ cognitive processes in thedomain of science education is a new research approach. There have beensome studies dealing with science problem-solving and learning withmultimedia presentation (e.g. Hegarty & Just, 1993; Yang, Chang, Chien,Chien & Tseng, 2013). In this study, an attempt was made to use the eyetracking method and interview technique to probe the visual attentiondistribution during the solving of the Purdue Visualization of Rotations Test(PVRT).
RESEARCH QUESTIONS
By examining students’ 3D problem-solving processes and scienceconcept learning, we intend to address the following questions:
1. How well could the university students solve the PVRT problems?2. To what extent might the rotation angle and plane visibility affect the
PVRT performance?3. What cognitive strategies would the university students use to solve
the PVRT problems?4. How (in terms of eye movements) do university students attribute their
visual attention when solving PVRT problems?5. What associations could be found among the PVRT problem solving
performance, accuracy of performance and eye movement patterns?6. What associations could be found among types of questions (regarding
angles of rotation and plane visibility) and eye movement patterns?7. Is there an association between PVRT performance and science
learning in terms of concept achievement?
METHOD
Participants
A total of 20 university students aged from 21 to 24 voluntarily participatedin the study, of whom 11 were science related majors (including 10 malesand 1 female) while 9 were humanities related (including 1 male and8 females). In all, 16 took part in interviews. All of the 20 participants’ eyemovements were successfully recorded, but two of them did not completethe concept performance task.
PROCESS OF SPATIAL PROBLEMS SOLVING AND SCIENCE LEARNING
Test Material
The Purdue Visualization of Rotations Test (PVRT) consisting of 20items (Bodner & Guay, 1997) was used to probe the participants’ spatialproblem-solving performance. Participants were awarded 5 points foreach correct item and 0 otherwise, giving a total score of 100. Althoughthe test items involve 3D objects, they are presented on 2D paper. In ourstudy, the PVRT was displayed on a computer screen (1,280 × 1,024).Participants solved problems one at time on the screen. After selecting ananswer, they pressed the page down button for the next item whichconsists of three-dimension mental rotation problems. An unlimited testtime was adopted for data collection to ensure that participants couldwork through every problem item without being forced to guess due tolimited time.
To explore the visual attention distributions, an eye tracking systemwas used to record the students’ eye movements during the solving of the20 PVRT questions. For data analysis, each item of the PVRT wasdivided into three different LookZones (LZs) as Fig. 1 shows, to indicatedifferent problem solving stages. In the first stage (LZ1), an object isshown and rotated to a different angle and/or plane. In the second stage(LZ2), a new object is shown and the problem solver has to figure out
Figure 1. An example of the eye movement patterns during spatial problem solving. Theblack dots indicate fixation points and the square areas are LookZones
YI-CHUN CHEN AND FANG-YING YANG
which object in LZ3 (stage 3) matches the one shown in LZ2 as it isrotated in exactly the same manner as indicated in LZ1.
Given the necessities of imagery and visualization during 3D problemsolving, we hypothesized that not only the rotation angle, but also thevisibility of the to-be-rotated objects would affect the success of the spatialproblem solving in that a 3D object projected on 2D paper should block theproblem solver’s view of several planes. Therefore, the PVRT items werefurther grouped into two problem types with respect to “rotation angle” and“plane invisibility.” The grouping technique is described below.
Problem ClassificationProblems Classified with Respect to Rotation Angle. The PVRTproblems were classified into four angle types: Type I: an object in stage 1(LZ1) was rotated 90° around one axis; Type II: an object in stage 1 (LZ1)was rotated 180° around one axis, and Type III: an object in stage 1 (LZ1)was rotated 90° around one axis and then rotated 90° again around anotheraxis; Type IV: an object in stage 1 (LZ1) was rotated 90° around one axis andthen rotated 180° again around another axis.
Problems Classified with Respect to Plane Invisibility. It has beenhypothesized that not only the rotation angle but also the visibility of theto-be-rotated object may influence rotation performance. Accordingly, theto-be-rotated object in stage 2 (LZ2) was compared to the correct objectin stage 3 (LZ3) to define its visibility. The visibility variable in the studyis defined as the “number of invisible planes.” As mentioned, when a 3Dobject with six planes (including the top, bottom, right, left, front, andback planes) is presented on a 2D paper or monitor, it can exhibit onlythree planes at maximum, while the other three cannot be exposed due tothe limitation of the 2D display. By examining the number of visibleplanes in the initial position (in stage 2) of a rotated object (in stage 3), weobtained the levels of plane invisibility. Noticeably, some objects are“reflective symmetry” objects, as there is a symmetry plane parallel to therotation axis. Consequently, the shape on either side of the symmetryplane is identical. Since the problem solver can quickly picture the shapeof the non-exposed plane through the symmetry plane, this kind of non-exposed plane is also classified as a visible one.
The visibility classification leads to four levels of invisibility, includingLevel I: 0 invisible planes (i.e. with respect to the correct object in LZ3,three planes of the to-be-rotated object in LZ2 are visible to the problemsolver); Level II: 1 invisible plane; Level III: 2 invisible planes; and LevelIV: 3 invisible planes (i.e. with respect to the correct object in LZ3, none
PROCESS OF SPATIAL PROBLEMS SOLVING AND SCIENCE LEARNING
of the planes of the to-be-rotated object in LZ2 are visual to the problemsolver). It is hypothesized that the lower the level of plane invisibility, theless effort would be needed to visualize the shape of the non-exposedsides.
Interview
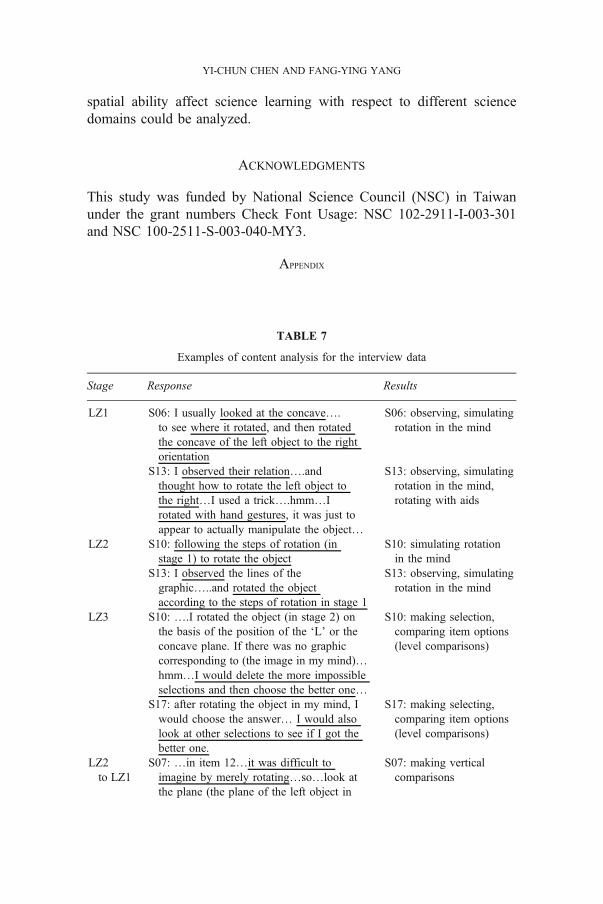
In order to clarify the cognitive strategies employed for solving the PVRTproblems, 16 participants were interviewed (4 participants did not comeback to complete the interview task). The main interview question was:What did you do to solve the PVRT problems? The question was given inevery problem-solving stage, including LZ1, LZ2, LZ3, LZ2 back to LZ1(LZ21), and LZ3 back to LZ2 (LZ32). Four PVRT items were randomlyselected for the participants to describe their strategies. The interviewresponses were collected through tape and video recordings. Via contentanalysis, the cognitive strategies which appeared in the students’ oralresponses were abstracted. The strategy categories was either determinedfrom students’ explicitly responses or inferred from the contextualinformation. Two coders together performed the coding analysis. Asshown in the Appendix Table 7, for example, the strategy “makingvertical comparisons” in the stage of LZ3 to LZ2 assigned to subject S07was inferred from the sequence of problem-solving steps that the subjectdescribed. Whereas, the strategy “observing” in the stage 1 assigned toS13 was extracted from the subject’s explicitly response. The percentageof a particular strategy was then measured. More examples of theinterview coding analysis are shown in the Appendix Table 7.
Concept Performance
To examine the possible association between spatial ability and sciencelearning, the subjects of the study were asked to take part in a conceptlearning activity. In the activity, participants were asked to read a sciencereport regarding the green-house effect and the global warming issue. Thecontent of the science report came from two articles published inScientific American. One article is “How did humans first alter globalclimate” published on March 2005 and the other “Methane, plants andclimate change” published on February 2007. The report contains 737Chinese characters and 9 graphics showing scientific information,experimental equipment, model of the planet system, model of earthaxial precession, and numerical data. Since the report contains both verbaland graphical information, it was assumed that a variety of cognitive
YI-CHUN CHEN AND FANG-YING YANG
abilities, including spatial ability, should be involved in comprehending it(see Fig. 2 for the example).
After reading the science report, participants took a 5-min break.Afterward, they were asked to write down what they could recall of theconcepts or conceptual knowledge from the report. The numbers ofconcepts and propositions abstracted from the student responses by thecontent analysis were taken as the indicator of concept performance.There are different types of conceptual knowledge abstracted from studentresponses. Table 1 shows the conceptual categories discussed in thestudy. The basic type of conceptual category is the concept. Another typeof conceptual category is the proposition indicating conceptual ideasrelated to the content of the science report used for the study. The inter-rater reliability coefficients of different categories ranged from 0.78 to0.96. The discrepancies of the evaluation criteria between raters were thendiscussed until they reached a consensus.
For example, the concepts extracted from the responses of subject S15were: precession, northern hemisphere, 22,000 years, methane, liveplants, rye, Nicaragua savanna, and ice core. Since the concept of“Nicaragua savanna” does not appear in the report, the frequencies ofdifferent concept categories recalled by the subject are 1, 6 and 7 forNTRC, TRC, and TC respectively. Similarly, propositions extracted fromthe responses written by student S09 were: “Earth’s axis is tilted,” “Earth-Sun distance changing over time,” “irradiated to the sun at differentlengths of times and amount,” and “A 22,000-year cycle.” Since the fourpropositions were all introduced in the report, the frequencies of TP, TRP,CP, and TRCP were 4, and those of SDP, SDCP and TUCP were 0.
Figure 2. Readers will need to imagine and visualize that natural variations in the earth’sorbit, such as those related to precession (as shown in the very left diagram), redistributethe sunlight that reaches the globe over long timescales
PROCESS OF SPATIAL PROBLEMS SOLVING AND SCIENCE LEARNING
Apparatus
The study employed the FaceLAB 4.6 eye tracking to record the subjects’ eyemovements during PVRT problem solving. The apparatus is a non-intrusiveand fully automated eye and head tracking instrument. The data rate is 60 Hz.The identification of fixation is determined by the GazeTracker 9.0 software.According to Rayner (2009), fixation durations may range from 100 to500ms, with an average of about 250ms regarding English text reading. Tsai,Yen &Wang (2005) also found a similar result among Chinese readers. To beconservative, the study defines 100 ms as the threshold for a fixation.
Procedure
Before the study, each participant went through a calibration process forthe eye tracker to capture the correct viewing positions. All of the subjectspassed the calibrations with an accepted angular error of less than 1.0°measured by the eye tracker FaceLAB 4.6. Participants solved PVRTproblems displayed on a computer screen working at their own pace.After the PVRT, the participants read a science report and then completedthe concept recalling test. Finally, the participants were interviewed.
Data Analysis
In the study, the fixation measures were the focus of the analysis of theeye movement data. To analyze the overall problem-solving process of a
TABLE 1
Types of concepts and propositions abstracted from student responses by the contentanalysis
Category Definition Code
Concept Total concepts TCText-related concepts TRCNon-text-related concepts NTRC
Propositions Total propositions TPText-related propositions TRPSelf-derived propositions SDPCorrect propositions CPText-related and correct propositions TRCPSelf-derived and correct propositions SDCPText-unrelated but correct propositions TUCP
Frequency of each category appearing in student responses was then counted to indicate the conceptgain with respect to the category
YI-CHUN CHEN AND FANG-YING YANG
PVRT question, Total Fixation Duration (TFD) suggesting time forinformation processing and Average Fixation Duration (AFD) indicatingmental efforts or task difficulty (Rayner, 2009) were the main eyemovement measures. Since a problem was further divided into severalareas of interest (i.e. LookZones (LZs)) to indicate different problem-solving stages, TFDs in LZs, AFDs in LZs, and percentages of totalfixation duration (PTFDs) of LZs were also abstracted for analysis. Inaddition, number of regressions (NOR), meaning the number of fixationscoming back from a latter LZ to a former one was also examined. Thedetailed definitions of the eye movement measures are shown in Table 2.
The statistical methods employed in the study include t-tests forfinding the gender or academic background effects, one-way ANOVA forrevealing the differences in PVRT performance and eye movement datawith respect to different problem types, and correlation analysis forprobing the relationships between concept achievement, the PVRTperformance and eye movement patterns.
RESULTS AND DISCUSSION
Student Performance on the PVRT
The mean of the PVRT performance of the 20 university students was75.48 and the standard deviation was 20.64. The accuracy of performanceindicated by the percentage of students who gave the correct answerranged from 45% to 95% (mean = 76.25%, SD= 0.14). The higher the
TABLE 2
Definitions for eye movement measures
Eye movement measures Definition
Total fixation duration/in aLookZone (TFD)
Sum of duration of total fixated points in an interestedarea or a LookZone
Average fixation duration/in aLookZone (AFD)
Mean of duration of every fixated point in an interestedarea or a LookZone
Percentage of Total FixationDuration (PTFD)
The percentage of fixation duration of a LZ (Totalfixation duration in a zone divided by overall totalfixation duration)
Number of Regressions(NOR)
The number of fixations coming back from a latter LZto a former one. There are three situations: from LZ2to LZ1, from LZ3 to LZ2 and from LZ3 to LZ1.
PROCESS OF SPATIAL PROBLEMS SOLVING AND SCIENCE LEARNING
accuracy, the easier the test item. An independent t test indicated nosignificant gender difference in the PVRT performance scores (t (18) = 0.86,p9 0.10), but a significant difference was found between the PVRTperformance of the two different majors with a large effect size (t (10.67) =2.85, Cohen’s d=1.37, pG 0.05), favoring the science-related majors.
Based on the score distribution, two groups, namely a highperformance group (HG) and a low performance group (LG), wereclassified. The HG was defined as having scores higher than one standarddeviation from the PVRT mean (above and equal to 95 points). Therewere 5 participants in this group. Meanwhile, those who had scores lowerthan one standard deviation from the mean (less than 55 points) wereassigned to the LG. Four participants were included in the LG.
The Effects of Rotation Angle and Plane Visibility on PVRT Performance
The accuracy of performance (and standard deviation) with respect to thefour types of rotation angle (Type I, II, III, IV) was 85.00% (24.17),73.00% (29.22), 83.00% (21.79), and 64.00% (28.73), respectively.Meanwhile, the accuracy of performance (and standard deviation) for thefour levels of plane invisibility (Level I, II, III, IV) was: 82.50% (24.47),81.25% (23.82), 72.50% (24.20), and 63.75% (30.86), respectively. One-way ANOVA indicated that there were significant effects of rotationangles (Greenhouse-Geisser corrected F (2.46, 46.67)=6.23, partial η2 =0.25, pG 0.05) and plane invisibility (Greenhouse-Geisser corrected F(2.48, 47.08) = 5.27, partial η2 = 0.22, pG0.05) on accuracy performance.Further linear model comparison (GLM) showed a significant linear trend(with a negative slope) between accuracy performance and level ofinvisibility (partial η2 = 0.33, p G 0.01). Such findings suggest thataccuracy performance is aligned more with the level of plane invisibility.
The Cognitive Strategies Used in Solving the PVRT Problems
By interviewing 16 students, we abstracted the major problem-solvingstrategies in each problem-solving stage as shown in Table 3. It should benoted that only those strategies verbally mentioned by the students weretaken into account.
As Table 3 shows, the solving of the PVRT problems involvedcognitive activities other than mental rotation. All of the subjectsmentioned that they performed observing or recognizing in the firststage, simulating rotation in their mind in the first and second stages, andmaking the right selection of options in the third stage. In addition tothese cognitive strategies, strategies such as making comparisons among
YI-CHUN CHEN AND FANG-YING YANG
options or making vertical comparisons to reconfirm the rotation result (instage 3) also appeared frequently in the students’ responses. Besides, thestudents often did not solve the PVRT problems in the sequence of LZ1,LZ2 and LZ3. They would make regressions either from LZ2 back to LZ1or from LZ3 back to LZ2.
Between the HG and LG, as shown in Fig. 3, the HG subjects placed moreemphasis on observing/recognizing, memorizing, and imagining than the LGstudents did in the first and second stages (i.e. LZ1 and LZ2). The LGstudents might have encountered more difficulties in solving the spatialproblems because the interview responses indicated that they were morelikely to rotate objects with aid (e.g. using their hands to simulate the steps ofrotation). In LZ3, both the HG and LG subjects performed option selectionand comparison (i.e. comparing options in order to make a better selection),but the HG subjects seemed to perform option selection more often than theLG students. When making regressions, a higher percentage of HG studentsperformed regressions from LZ2 back to LZ1, but a higher percentage of LGstudents made regressions from LZ3 to LZ2. It was noted that no subject ofthe LG mentioned a vertical comparison from LZ2 to LZ1. Compared to theHG, the LG students reported more disorientation when making regressionsfrom LZ3 to LZ2. In addition, when making regressions from LZ3 to LZ2,
TABLE 3
Cognitive strategies for solving PVRT problems mentioned by 16 participants in differentstages
Stage Cognitive strategies for solving the PVRT problems
LZ1 Observing/recognizing (16, 100%), simulating rotation in themind (16, 100%), rotating with aids (3, 18.75%), memorizing(4, 25%)
LZ2 Observing/recognizing (2, 12.5%), simulating rotation in themind (16, 100%), rotating with aids (3, 18.75%), imagining(7, 43.75%)
Making vertical comparisons (4, 25%), reconfirming the detailsor non-exposed planes of the object in LZ2 (6, 37.5%), re-anchoring (1, 6.25%), disorientation (8,, 50%)
The numbers in parentheses indicate the number and the percentage of students who mentioned therelevant strategies
PROCESS OF SPATIAL PROBLEMS SOLVING AND SCIENCE LEARNING
the LG students mentioned more actions related to re-anchoring, confirmingand disorientation.
As illustrated in Fig. 3, it seems that theHG students tended to observe, rotate,imagine and memorize the to-be-tested objects more intensively. They mademainly vertical comparisons between LZ2 and LZ1, and they showed fewerregressions from LZ3 back to LZ2. Such problem-solving behaviors indicatethat the HG students performed more forward steps. In the problem-solvingliterature, it has been well documented that experts usually work forward whilenovices tend to work backward (Gagné, Yekovich &Yekovich, 1993). Besides,experts appear to spend more time than novices determining how to represent aproblem (Sternberg, 2009). Our study supports these arguments.
Furthermore, two distinct differences in strategy application betweenthe HG and LG are worth further discussion. One is that all LG but noHG students mentioned the use of aids when making rotations in LZ1 or
Figure 3. Strategy comparisons between the HG and LG subjects in solving the PVRTproblems in each stage
YI-CHUN CHEN AND FANG-YING YANG
LZ2. The other is that most HG but no LG subjects mentioned makingvertical comparisons between LZ2 and LZ1. Although the purpose ofrotating with aids by gesture (or motion) was to assist memorization ofthe rotating steps, students who used aids in rotation actually performedpoorly in the study. The vertical comparisons during regressions fromLZ2 to LZ1 made by most HG students imply that these students wouldre-examine or evaluate their problem-solving steps before proceeding tothe final stage. Such a strategy should have helped the HG students toreduce their cognitive load when making the final selection. Since the useof aids and the making of vertical comparisons concern individuals’memory capacity and analytical thinking, it was thus concluded that theHG subjects possessed better spatial memory and analytical strategies.
The Cognitive Processes (In Terms of Eye Movement Patterns)that the University Students Experienced when Solvingthe PVRT Problems
Table 4 shows the descriptive statistics of the eye movement measures for allparticipants. In general, according to the TFDs in LZs and PTFDs, thestudents spent most of their reading time and attention in LZ1, followed byLZ2. LZ3 was the least attended to. However, the subjects displayed thehighest AFD in LZ2, indicating higher mental efforts. Regarding regres-sions, more were performed from LZ3 to LZ2, compared to those from LZ2to LZ1. Between the HG and LG, the t test result indicated that there were nosignificant differences in the eye movement patterns, except that anapproximate difference in AFD in LZ3 was found (t (7) =−1.9, pG 0.10)where the LG showed higher AFD indicating possibly higher mental efforts.
Based on Table 4, two distinct differences between the HG and LG can bedrawn. One was that the LG had higher AFD in LZ3 as mentioned above.The other was that the HG subjects performed more regressions from LZ2back to LZ1 than did the LG subjects, but the LG subjects regressed fromLZ3 back to LZ2, more often than did the HG subjects. Although the latterfinding did not reach statistical significance, the means supported theprevious interview result that the HG students mentioned the regressionsfrom LZ2 to LZ1 more frequently than the LG students did.
The Associations Between PVRT Performance and Eye MovementPatterns
As Table 5 shows, significant correlations between accuracy performanceand some eye movement measures including TFD, NORs and TFDs inzone were found.
PROCESS OF SPATIAL PROBLEMS SOLVING AND SCIENCE LEARNING
The correlation coefficients in Table 5 imply that when the 3Dmental rotation problems became more difficult (indicated by thelower accuracy performance), the participants increased the inspectiontime (TFD) in every LookZone (LZ1, LZ2, and LZ3), and theylooked back more from “LZ2 to LZ1,” “LZ3 to LZ2,” and “LZ3 toLZ1.” These findings suggest that the time and mental efforts neededfor 3D problem solving correlate with the item difficulty. Table 5 also showsthat neither the PTFD nor the AFD in the three LZs were associated with theaccuracy performance. Such a result implies that the success of 3D problemsolving depends on not just some simple cognitive activities (such as mentalrotation mainly in LZ2 or option selection largely in LZ3) but the integrationof different cognitive strategies.
Regarding the relationship between PVRT performance and eyemovement measures, only some approximate correlations were foundbetween PVRT performance and PTFD in LZ3 (r=−0.40, pG 0.10), andPVRT performance and AFD in LZ3 (r=−0.42, pG 0.10). The negativeapproximate correlations demonstrated that the higher the problem-solving performance, the lower the percentage of total fixation duration
TABLE 4
Means and standard deviations (in the parentheses) of eye movement measures fordifferent performance groups
Group TFD (s) TFD in LZ1 (s) TFD in LZ2 (s) TFD in LZ3 (s)
TFD total fixation duration/in a LookZone, PTFD percentage of total fixation duration, AFD averagefixation duration/in a LookZone, NOR number of regressions(*)pG 0.1; **pG 0.01
YI-CHUN CHEN AND FANG-YING YANG
TABLE5
The
correlationcoefficientsforaccuracy
performance
andeyemov
ementmeasures
Eye
movem
entmeasures
TFD
AFD
NOR
NOR
NOR
LZ2to
LZ1
LZ3to
LZ2
LZ3to
LZ1
Pearson
’sr
−0.72*
*−0
.35
−0.68*
*−0
.64*
*−0
.62*
*Eye
mov
ementmeasures
TFD
PTFD
AFD
Loo
kZon
e(LZ)
LZ1
LZ2
LZ3
LZ1
LZ2
LZ3
LZ1
LZ2
LZ3
Pearson
’sr
−0.65*
*−0
.68*
*−0
.69*
*0.33
−0.39
0.11
−0.14
−0.20
−0.31
TFD
totalfixatio
ndu
ratio
n/in
aLoo
kZone,
PTFD
percentage
oftotalfixatio
ndu
ratio
n,AFD
averagefixatio
ndu
ratio
n/in
aLoo
kZone,
NORnumberof
regressions
*pG0.05;**pG0.01
PROCESS OF SPATIAL PROBLEMS SOLVING AND SCIENCE LEARNING
in LZ3 and the less average fixation duration in LZ3. These findingssupport that high performance students might have already found theiranswers before proceeding to the last stage (LZ3); as a result, their mentalefforts in stage 3 were reduced.
The Associations Between Problem Types and Eye Movement Patterns
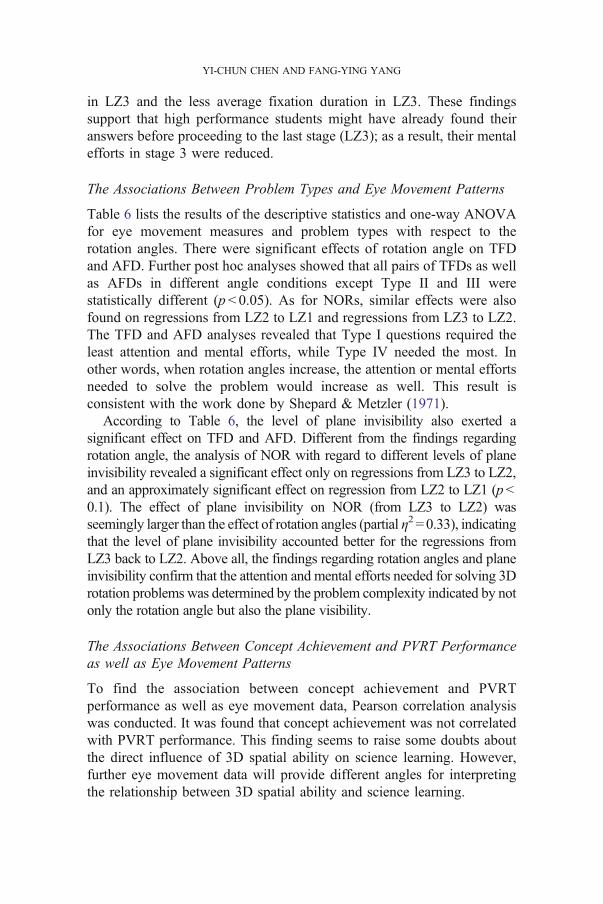
Table 6 lists the results of the descriptive statistics and one-way ANOVAfor eye movement measures and problem types with respect to therotation angles. There were significant effects of rotation angle on TFDand AFD. Further post hoc analyses showed that all pairs of TFDs as wellas AFDs in different angle conditions except Type II and III werestatistically different (pG 0.05). As for NORs, similar effects were alsofound on regressions from LZ2 to LZ1 and regressions from LZ3 to LZ2.The TFD and AFD analyses revealed that Type I questions required theleast attention and mental efforts, while Type IV needed the most. Inother words, when rotation angles increase, the attention or mental effortsneeded to solve the problem would increase as well. This result isconsistent with the work done by Shepard & Metzler (1971).
According to Table 6, the level of plane invisibility also exerted asignificant effect on TFD and AFD. Different from the findings regardingrotation angle, the analysis of NOR with regard to different levels of planeinvisibility revealed a significant effect only on regressions from LZ3 to LZ2,and an approximately significant effect on regression from LZ2 to LZ1 (pG0.1). The effect of plane invisibility on NOR (from LZ3 to LZ2) wasseemingly larger than the effect of rotation angles (partial η2 = 0.33), indicatingthat the level of plane invisibility accounted better for the regressions fromLZ3 back to LZ2. Above all, the findings regarding rotation angles and planeinvisibility confirm that the attention and mental efforts needed for solving 3Drotation problems was determined by the problem complexity indicated by notonly the rotation angle but also the plane visibility.
The Associations Between Concept Achievement and PVRT Performanceas well as Eye Movement Patterns
To find the association between concept achievement and PVRTperformance as well as eye movement data, Pearson correlation analysiswas conducted. It was found that concept achievement was not correlatedwith PVRT performance. This finding seems to raise some doubts aboutthe direct influence of 3D spatial ability on science learning. However,further eye movement data will provide different angles for interpretingthe relationship between 3D spatial ability and science learning.
YI-CHUN CHEN AND FANG-YING YANG
TABLE6
Means
(Stand
ardDeviatio
ns)andresults
ofon
e-way
ANOVA
foreyemov
ementmeasureswith
respectto
differentprob
lem
types
Eye
movem
ent
measures
Typeof
rotatio
nan
gle
ANOVAresults
TypeI
TypeII
TypeIII
TypeIV
F,pa
rtialη2
(Greenho
use-Geisser
corrected),compa
risons
amon
gtypes
TFD
(s)**
15.02(6.80)
24.51(11.52
)21
.25(9.24)
36.36(19.42
)F(1.73,
32.87)=19
.09,
partialη2=0.50
;Typ
eIG
Typ
eII**
,Typ
eIII*,andTyp
eIV
**;Typ
eIIGTyp
eIV
*;Typ
eIIIG
Typ
eIV
*AFD
(ms)**
290(40.82
)31
1(32.87
)31
5(37.38
)33
0(50.20
)F(3,57
)=12
.97,
partialη2=0.40
;Typ
eIG
Typ
eII*,
Typ
eIII*,
andTyp
eIV
*;Typ
eIIGTyp
eIV
*,Typ
eIIIG
Typ
eIV
*NOR
LZ21
*1.59
(1.01)
2.02
(1.12)
2.01
(1.04)
2.76
(1.64)
F(3,57
)=4.38
,partialη2=0.19
;Typ
eIG
Typ
eII(*)
andTyp
eIV
*;Typ
eIIGTyp
eIV
(*);Typ
eIIIG
Typ
eIV
(*)
LZ32
**2.57
(1.02)
4.22
(1.86)
2.97
(1.55)
5.08
(2.69)
F(3,57
)=9.52
,partialη2=0.33
;Typ
eIG
Typ
eII*andTyp
eIV
*,Typ
eIIGTyp
eIII(*);Typ
eIIIG
Typ
eIV
*Eye
mov
ement
measures
Level
ofplaneinvisibility
ANOVA
results
Level
ILevel
IILevel
III
Level
IVF,partialη2
(Greenho
use-Geisser
corrected),comparisons
amon
gtypes
TFD
(s)**
20.79(8.80)
17.38(7.27)
31.67(17.18
)34
.19(17.34
)F(2.06,
39.09)=15
.15,
partialη2=0.44
;Typ
eIG
Typ
eII*,
Typ
eIII*,andTyp
eIV
*;Typ
eIIGTyp
eIII**;
Typ
eIIIG
Typ
eIV
**AFD
(ms)**
311(36.81
)29
8(34.95
)31
7(40.95
)33
2(48.09
)F(3,57
)=13
.61,
partialη2=0.42
;Typ
eIG
Typ
eII*andTyp
eIV
*;Typ
eIIGTyp
eIII*
andTyp
eIV
**;Typ
eIIIG
Typ
eIV
(*)
NOR
LZ21
(*)
2.14
(1.23)
1.73
(1.00)
2.26
(1.34)
2.63
(1.46)
F(3,57
)=2.43
,partialη2=0.11
;Typ
eIIGTyp
eIII(*)
and
Typ
eIV
*LZ32
**2.96
(1.64)
2.98
(1.11)
4.70
(1.83)
4.93
(2.43)
F(3,57
)=10
.69,
partialη2=0.36
;Typ
eIG
Typ
eIII**andTyp
eIV
*,Typ
eIIGTyp
eIII**andTyp
eIV
*
Noticeably,
nosign
ificantassociationwas
foundforNORLZ31.Therefore,thetabledo
esno
tinclud
ethedata
TFD
totalfixatio
ndu
ratio
n,AFD
averagefixatio
ndu
ratio
n,NORnumberof
regressions
(*)pG0.10
;*p
G0.05;**
pG0.01
PROCESS OF SPATIAL PROBLEMS SOLVING AND SCIENCE LEARNING
The correlation analysis showed that the concept achievement in terms ofself-derived propositions (SDP) was correlated with PTFD in LZ1 (r=−0.54,pG 0.05) and PTFD in LZ2 (r=0.55, pG 0.05). In theory, self-derivedpropositions implicated the construction of new information based on subjects’prior knowledge. Accordingly, the negative correlation between SDP andPTFD in LZ1 revealed that individuals who were more capable of generatingnew ideas attributed less attention to LZ1, indicating better spatial memory inthat, as the interview data suggested (Appendix Table 7), the subjectsperformed observing/recognizing, rotating, and memorizing in stage 1.Meanwhile, since in LZ2 the subjects needed to attribute more of theirattention to mentally manipulating the objects to be rotated, the positivecorrelation between SDP and PTFD in LZ2 implies that those subjects whowere better at constructing new knowledge would attribute more of theircognitive resources to the process of spatial visualization.
In sum, the correlations between SDP and the eye movement measure,PTFD, suggest associations between concept achievement and 3D spatialability in terms of spatial memory, and problem solving strategy that could notbe detected by the PVRT performance. Such a result echoes our argument that3D spatial problem solving involves complicated cognitive activities.
EDUCATIONAL IMPLICATIONS
In this study, it was found that in addition to rotation angles, the numberof invisible planes of the to-be-rotated object was negatively associatedwith PVRT performance. In other words, other than mental rotation, theability to visualize invisible planes also contributes to the success ofPVRT problem solving. As far as PVRT is concerned, it was found thatone of the evident differences between the high spatial performance groupand the low spatial performance group is the use of the re-inspectionstrategy. That is, the HG subjects regressed more often than the LG onesdid from LZ2 to LZ1. The regressions from LZ2 to LZ1 indicate the re-examination of the problem-solving step before the final option selection.Accordingly, to enhance students’ spatial problem-solving ability asdiscussed in PVRT, it might be critical for instructors to help learners tonot only dissect the problem-solving steps, but also to encourage them toreexamine problem conditions before proceeding to the last step forproblem solution. Re-examining problem-solving steps could be a crucialproblem-solving strategy for any type of spatial problem in that it is bydefinition a metacognitive strategy that could be widely applied.
This study shows that concept achievement as assessed by the contentanalysis was not correlated with PVRT performance. In other words, although
YI-CHUN CHEN AND FANG-YING YANG
the science learning material used in the study involved various graphicalrepresentations that were presumably related to spatial information, the spatialability as assessed in PVRTmight not have contributed to concept learning. Itis possible that the spatial ability assessed by PVRT did not accurately reflectthe ability needed to learn the material. Nevertheless, the analysis of theconcept achievements and eye movement data collected during the PVRTproblem solving suggests a trend that better knowledge construction, betterspatial memory indicated by less attention to LZ1, and more mental efforts allcontributed to spatial visualization in LZ2. Such a finding suggests thatinstead of evaluating whether a learner possesses certain spatial abilities forbetter science learning, educators should consider how to create meaningfulenvironments that help learners to direct their attention to effective learningprocesses. As the ability-as-compensator hypothesis (Höffler & Leutner,2011) points out, if the spatial abilities involved in multimedia learning taskscan be compensated for by instructional design, the cognitive load needed tocomprehend the multimedia material could be reduced.
STUDY LIMITATIONS
Given that small sample size tends to reduce the power of the statistical analysis,some statistical results of the study (such as correlations in the 0.40 range) mightnot be statistically significant but of sufficiently large size to be of interest.Further studies with larger sample sizes will strengthen the generalizations ofthe study findings. Nevertheless, it should be noticed that for the eye movementdata, since every participants in the study solved the same 20 items, as a result,there were actually 400 sets of eye movement data in total (20 people times 20items). Not to mention that for each set of eye movement data, various eyemovement measures were calculated. When these data were pooled together,the size of data was actually quite large for an explorative study. This is actuallya major difficulty of applying eye tracking method in the educational research.On one hand, when sample size increases, the eyemovement data become quitelarge and would complicate the consequent data analyses, but on the other,educational studies need large sizes of subjects to identify significant behaviors.
Meanwhile, since the study probed the spatial ability by a content-freeinstrument focusing mainly on the mental rotation ability, how differentaspects of spatial ability affect science learning in different domainsremain uncertain. It is suggested that future studies place learners inspatial tasks specifically designed to reflect the science subject matters.By studying students’ eye movement patterns and strategies used forsolving domain-specific spatial tasks, as well as the performances, how
PROCESS OF SPATIAL PROBLEMS SOLVING AND SCIENCE LEARNING
spatial ability affect science learning with respect to different sciencedomains could be analyzed.
ACKNOWLEDGMENTS
This study was funded by National Science Council (NSC) in Taiwanunder the grant numbers Check Font Usage: NSC 102-2911-I-003-301and NSC 100-2511-S-003-040-MY3.
APPENDIX
TABLE 7
Examples of content analysis for the interview data
Stage Response Results
LZ1 S06: I usually looked at the concave….to see where it rotated, and then rotatedthe concave of the left object to the rightorientation
S06: observing, simulatingrotation in the mind
S13: I observed their relation….andthought how to rotate the left object tothe right…I used a trick….hmm…Irotated with hand gestures, it was just toappear to actually manipulate the object…
S13: observing, simulatingrotation in the mind,rotating with aids
LZ2 S10: following the steps of rotation (instage 1) to rotate the object
S10: simulating rotationin the mind
S13: I observed the lines of thegraphic…..and rotated the objectaccording to the steps of rotation in stage 1
S13: observing, simulatingrotation in the mind
LZ3 S10: ….I rotated the object (in stage 2) onthe basis of the position of the ‘L’ or theconcave plane. If there was no graphiccorresponding to (the image in my mind)…hmm…I would delete the more impossibleselections and then choose the better one…
S10: making selection,comparing item options(level comparisons)
S17: after rotating the object in my mind, Iwould choose the answer… I would alsolook at other selections to see if I got thebetter one.
S17: making selecting,comparing item options(level comparisons)
LZ2to LZ1
S07: …in item 12…it was difficult toimagine by merely rotating…so…look atthe plane (the plane of the left object in
S07: making verticalcomparisons
YI-CHUN CHEN AND FANG-YING YANG
REFERENCES
Blazhenkova, O. & Kozhevnikov, M. (2010). Visual-object ability: A new dimension ofnon-verbal intelligence. Cognition, 117(3), 276–301.
Bodner, G. M., & Guay, R. B. (1997). The purdue visualization of rotation test. TheChemical Educator, 2(4).
Carroll, J. B. (1993). Human cognitive abilities: a survey of factor-analytic studies.Cambridge: Cambridge University Press.
Eliot, J., & Smith, I. M. (1983). An international directory of spatial tests. Windsor,England: NFER/Nelson; and Atlantic Highlands, NJ: Humanities Press.
French, J. W. (1951). The description of aptitude and achievement tests in terms of rotatedfactors. Psychometric Monographs, No. 5.
Gagné, E. D., Yekovich, C. W. & Yekovich, F. R. (1993). The cognitive psychology ofschool learning (2nd ed.). New York, NY: Harper-Collins.
Guilford, J. P. & Lacey, J. I. (1947). Printed classification tests, A.A.F. Aviation PsychologicalProgress Research Report, No. 5. Washington: Government Printing Office.
Hegarty, M. (2010). Components of spatial intelligence. Psychology of Learning andMotivation, 52, 265–297.
Hegarty, M. & Just, M. A. (1993). Constructing mental models of machines from text anddiagrams. Journal of memory and language, 32(6), 717–742.
stage 1)…it turned into here (the positionof the plane after rotating the right objectin stage 1)…so…the plane (the plane ofthe left object in stage 1) was equal tothe plane (the plane of the to-be-rotatedobject in stage 2, whose relative positionwas equal to the plane, as mentioned, ofthe left object), and then it should turninto the side…
S19: …because of the complex steps orstrange rotation angles…I would return(to stage 1) to re-memorize….or toconfirm
S19: reminding, confirming
LZ3to LZ2
S07: (in item 17) the plane of the bottomturned into the top (in stage 1)…so if Ichose the better one, the (bottom) planeof the to-be-rotated object would beturned toward there (indicating the topposition)…so the correct answer wouldnot be A, C, or D, so it should be ‘B’…
S07: making verticalcomparisons
S14: when I did not make sense of theselections (I would go back to stage 2)…I could not imagine or I was uncertain ofthe actual appearance…
S14: disorientation,reconfirming the detailsor non-exposed planesof the object in LZ2
PROCESS OF SPATIAL PROBLEMS SOLVING AND SCIENCE LEARNING
Hegarty, M., Richardson, A. E., Montello, D. R., Lovelace, K. & Subbiah, I. (2002).Development of a self-report measure of environmental spatial ability. Intelligence,30(5), 425–447.
Hegarty, M. & Waller, D. (2006). Individual differences in spatial abilities. In P. Shah &A. Miyake (Eds.). Handbook of Visuospatial Thinking. (pp.121-169). CambridgeUniversity Press.
Höffler, T. N. (2010). Spatial ability: Its influence on learning with visualizations—ameta-analytic review. Educational psychology review, 22(3), 245–269.
Höffler, T. N. & Leutner, D. (2011). The role of spatial ability in learning frominstructional animations–Evidence for an ability-as-compensator hypothesis. Computersin human behavior, 27(1), 209–216.
Just, M. A. & Carpenter, P. A. (1985). Cognitive coordinate systems: Accounts of mentalrotation and individual differences in spatial ability. Psychological Review, 92, 137–172.
Kyllonen, P. C., Lohman, D. F. &Woltz, D. J. (1984). Componential modeling of alternativestrategies for performing spatial tasks. Journal of Educational Psychology, 6, 1325–1345.
Lohman, D. F. (1979). Spatial ability: A review and reanalysis of the correlationalliterature (Tech. Rep. No. 8). Stanford, CA: Stanford University School of Education.
Lohman, D. F., Pellegrino, J. W., Alderton, D. L., & Regian, J. W. (1987). Dimensionsand components of individual differences in spatial abilities. In S. H. Irvine & S. E.Newstead (Eds.), Intelligence and cognition: Contemporary frames of reference (pp.253-312). Springer Netherlands.
Mathewson, J. H. (1999). Visual-spatial thinking: an aspect of science overlooked byeducators. Science Education, 83(1), 33–54.
Michael, W. B., Guilford, J. P., Fruchter, B. & Zimmerman, W. S. (1957). The description ofspatial-visualization abilities. Educational and Psychological Measurement, 17, 185–199.
Mumaw, R. J., Pellegrino, J. W., Kail, R. V. & Carter, P. (1984). Different slopes for differentfolks: Process analysis of spatial aptitude. Memory & Cognition, 12(5), 515–521.
Onyancha, R. M., Derov, M. & Kinsey, B. L. (2009). Improvements in spatial ability as aresult of targeted training and computer-aided design software use: Analyses of objectgeometries and rotation types. Journal of Engineering Education, 98(2), 157–167.
Ozcelik, E., Arslan-Ari, I. & Cagiltay, K. (2010). Why does signaling enhance multimedialearning? Evidence from eye movements. Computers in Human Behavior, 26(1), 110–117.
Rayner, K. (2009). Eye movements and attention in reading, scene perception, and visualsearch. Quarterly Journal of Experimental Psychology, 62(8), 1457–1506.
Rohde, T. E. & Thompson, L. A. (2007). Predicting academic achievement with cognitiveability. Intelligence, 35(1), 83–92.
Shepard, R. N. & Metzler, J. (1971). Mental rotation of three-dimensional objects.Science, 171(3972), 701–703.
Sternberg, R. J. (2009). Cognitive psychology (5th ed.). Belmont, CA: ThomsonWadsworth.
Stieff, M. (2007). Mental rotation and diagrammatic reasoning in science. Learning andInstruction, 17(2), 219–234.
Thurstone, L. L. (1950). Some primary abilities in visual thinking. Proceedings of theAmerican Philosophical Society, 94(6), 517–521.
Tsai, J. L., Yen, M. H. &Wang, C. A. (2005). Eye movement recording and the application inresearch of reading Chinese. Research in Applied Psychology, 28, 91–104.
YI-CHUN CHEN AND FANG-YING YANG
Uttal, D. H., & Cohen, C. A. (2012). Spatial thinking and STEM education: When, Why, andHow? In B. Ross (Ed.), Psychology of Learning and Motivation (Vol. 57, pp. 147–181).Oxford: Academic Press.
Wai, J., Lubinski, D. & Benbow, C. (2009). Spatial ability for STEM domains: Aligningover 50 years of cumulative psychological knowledge solidifies its importance. Journalof Educational Psychology, 101(4), 817–835.
Yang, F. Y., Chang, C. Y., Chien, W. R., Chien, Y. T. & Tseng, Y. H. (2013). Trackinglearners’ visual attention during a multimedia presentation in a real classroom.Computers & Education, 62, 208–220.
Zhang, L. F. (2004). Field-dependence/independence: cognitive style or perceptualability? - validating against thinking styles and academic achievement. Personalityand Individual Differences, 37(6), 1295–1311.
Zimmerman, W. S. (1954). Hypotheses concerning the nature of the spatial factors.Educational and Psychological Measurement, 14, 396–400.
Graduate Institute of Science EducationNational Taiwan Normal University88 Sec. 4 Ting-Zhou Road, Taipei 116, TaiwanE-mail: [email protected]
PROCESS OF SPATIAL PROBLEMS SOLVING AND SCIENCE LEARNING