Probing Valence Orbital Composition with Iron KX-ray Emission Spectroscopy Nicole Lee, † Taras Petrenko, ‡ Uwe Bergmann,* ,§ Frank Neese,* ,‡ and Serena DeBeer* ,† Department of Chemistry and Chemical Biology, Cornell UniVersity, Ithaca, New York 14853, Institut fu ¨r Physikalische und Theoretische Chemie, UniVersita ¨t Bonn, D-53115 Bonn, Germany, and Linac Coherent Light Source, SLAC National Accelerator Laboratory, Menlo Park, California 94025 Received February 12, 2010; E-mail: [email protected]; [email protected]; [email protected]Abstract: A systematic study of 12 ferric and ferrous KX-ray emission spectra (XES) is presented. The factors contributing to the Kmain line and the valence to core region of the spectra are experimentally assessed and quantitatively evaluated. While the Kmain line spectra are dominated by spin state contributions, the valence to core region is shown to have greater sensitivity to changes in the chemical environment. A density functional theory (DFT) based approach is used to calculate the experimental valence spectra and to evaluate the contributions to experimental intensities and energies. The spectra are found to be dominated by iron np to 1s electric dipole allowed transitions, with pronounced sensitivity to spin state, ligand identity, ligand ionization state, hybridization state, and metal-ligand bond lengths. These findings serve as an important calibration for future applications to iron active sites in biological and chemical catalysis. Potential applications to Compound II heme derivatives are highlighted. Introduction Iron-containing active sites form the catalytic cores of numerous metalloenzymes, which are responsible for the activation of small molecules. These include nitrogenase 1,2 (which converts dinitrogen to ammonia) as well as cytochrome P450 3,4 and methane monooxygenase 5 (both which enable alkane hydroxylation). The ability of metalloenzymes to carry out remarkably difficult chemical transformations has inspired decades of research aimed at understanding the correlations between structure and function. Ultimately, this requires a clear description of the ground state geometric and electronic structure, as well as the structures of the intermediates in the reaction cycles. It is here that spectroscopic methods have played a key role. Electron paramagnetic resonance (EPR) and Mo ¨ss- bauer studies have provided details on the spin state and oxidation state of numerous iron active sites, including reaction intermediates. 6,7 Complementary information has been obtained utilizing X-ray absorption spectroscopy (XAS), where the shift in the Fe K-edge energy provides a measure of effective nuclear charge on the absorbing atom, and the intensity of pre-edge transitions provides information on the local site symmetry. 8,9 In addition, extended X-ray absorption fine structure (EXAFS) is frequently utilized to obtain parameters for the coordination number, type, and distance of ligating atoms with respect to the absorber. 10 Yet, often, key questions remain, and many are focused on the identity of coordinated ligands. These include fundamental questions such as the nature of the central atom (C, N, or O) in nitrogenase, 11,12 the nature of the oxygen binding mode in methane monooxygenase, 13 and the protonation state of ferryl intermediates. 14,15 These challenges arise in part due to inherent limitations of the currently employed experimental methods. For instance, EXAFS cannot distinguish between similar scatterers (i.e., C, N, O), and protonation states of the scatterers can only be indirectly inferred based on bond lengths. As EXAFS has intrinsic limitations in its resolution, in many cases the individual metal-ligand bonds cannot be uniquely † Cornell University. ‡ Universita ¨t Bonn. § SLAC National Accelerator Laboratory. (1) Burgess, B. K.; Lowe, D. L. Chem. ReV. 1996, 96, 2983. (2) Hoffman, B. M.; Dean, D. R.; Seefeldt, L. C. Acc. Chem. Res. 2009, 42, 609. (3) Denisov, I. G.; Makris, T. M.; Sligar, S. G.; Schlichting, I. Chem. ReV. 2005, 105, 2253. (4) Sono, M.; Roach, M. P.; Coulter, E. D.; Dawson, J. H. Chem. ReV. 1996, 96, 2841. (5) Wallar, B. J.; Lipscomb, J. D. Chem. ReV. 1996, 96, 2625. (6) Krebs, C.; Fujimori, D. G.; Walsh, C. T.; Bollinger, J. M., Jr. Acc. Chem. Res. 2007, 40, 484. (7) Solomon, E. I.; Brunold, T. C.; Davis, M. I.; Kemsley, J. N.; Lee, S. K.; Lehnert, N.; Neese, F.; Skulan, A. J.; Yang, Y. S.; Zhou, J. Chem. ReV. 2000, 100, 235. (8) Roe, A. L.; Schneider, D. J.; Mayer, R. J.; Pyrz, W.; Widom, J.; Que, L., Jr. J. Am. Chem. Soc. 1984, 106, 1676. (9) Westre, T. E.; Kennepohl, P.; DeWitt, J. G.; Hedman, B.; Hodgson, K. O.; Solomon, E. I. J. Am. Chem. Soc. 1997, 119, 6297. (10) Levina, A.; Armstrong, R. S.; Lay, P. A. Coord. Chem. ReV. 2005, 249, 141. (11) Einsle, O.; Tezcan, F. A.; Andrade, S. L. A.; Schmid, B.; Yoshida, M.; Howard, J. B.; Rees, D. C. Science 2002, 297, 1696. (12) Howard, J. B.; Rees, D. C. Proc. Natl. Acad. Sci. U.S.A. 2006, 103, 17088. (13) Xue, G. Q.; Fiedler, A. T.; Martinho, M.; Munck, E.; Que, L. Proc. Natl. Acad. Sci. U.S.A. 2008, 105, 20615. (14) Green, M. T.; Dawson, J. H.; Gray, H. B. Science 2004, 304, 1653. (15) Newcomb, M.; Halgrimson, J. A.; Horner, J. H.; Wasinger, E. C.; Chen, L. X.; Sligar, S. G. Proc. Natl. Acad. Sci. U.S.A. 2008, 105, 8179. Published on Web 06/28/2010 10.1021/ja101281e 2010 American Chemical Society J. AM. CHEM. SOC. 2010, 132, 9715–9727 9 9715
Transcript
Probing Valence Orbital Composition with Iron K� X-rayEmission Spectroscopy
Nicole Lee,† Taras Petrenko,‡ Uwe Bergmann,*,§ Frank Neese,*,‡ andSerena DeBeer*,†
Department of Chemistry and Chemical Biology, Cornell UniVersity, Ithaca, New York 14853,Institut fur Physikalische und Theoretische Chemie, UniVersitat Bonn, D-53115 Bonn, Germany,
and Linac Coherent Light Source, SLAC National Accelerator Laboratory,Menlo Park, California 94025
Abstract: A systematic study of 12 ferric and ferrous K� X-ray emission spectra (XES) is presented. Thefactors contributing to the K� main line and the valence to core region of the spectra are experimentallyassessed and quantitatively evaluated. While the K� main line spectra are dominated by spin statecontributions, the valence to core region is shown to have greater sensitivity to changes in the chemicalenvironment. A density functional theory (DFT) based approach is used to calculate the experimental valencespectra and to evaluate the contributions to experimental intensities and energies. The spectra are foundto be dominated by iron np to 1s electric dipole allowed transitions, with pronounced sensitivity to spinstate, ligand identity, ligand ionization state, hybridization state, and metal-ligand bond lengths. Thesefindings serve as an important calibration for future applications to iron active sites in biological and chemicalcatalysis. Potential applications to Compound II heme derivatives are highlighted.
Introduction
Iron-containing active sites form the catalytic cores ofnumerous metalloenzymes, which are responsible for theactivation of small molecules. These include nitrogenase1,2
(which converts dinitrogen to ammonia) as well as cytochromeP4503,4 and methane monooxygenase5 (both which enablealkane hydroxylation). The ability of metalloenzymes to carryout remarkably difficult chemical transformations has inspireddecades of research aimed at understanding the correlationsbetween structure and function. Ultimately, this requires a cleardescription of the ground state geometric and electronicstructure, as well as the structures of the intermediates in thereaction cycles. It is here that spectroscopic methods have playeda key role. Electron paramagnetic resonance (EPR) and Moss-bauer studies have provided details on the spin state andoxidation state of numerous iron active sites, including reactionintermediates.6,7 Complementary information has been obtainedutilizing X-ray absorption spectroscopy (XAS), where the shift
in the Fe K-edge energy provides a measure of effective nuclearcharge on the absorbing atom, and the intensity of pre-edgetransitions provides information on the local site symmetry.8,9
In addition, extended X-ray absorption fine structure (EXAFS)is frequently utilized to obtain parameters for the coordinationnumber, type, and distance of ligating atoms with respect tothe absorber.10 Yet, often, key questions remain, and many arefocused on the identity of coordinated ligands. These includefundamental questions such as the nature of the central atom(C, N, or O) in nitrogenase,11,12 the nature of the oxygen bindingmode in methane monooxygenase,13 and the protonation stateof ferryl intermediates.14,15 These challenges arise in part dueto inherent limitations of the currently employed experimentalmethods. For instance, EXAFS cannot distinguish betweensimilar scatterers (i.e., C, N, O), and protonation states of thescatterers can only be indirectly inferred based on bond lengths.As EXAFS has intrinsic limitations in its resolution, in manycases the individual metal-ligand bonds cannot be uniquely
† Cornell University.‡ Universitat Bonn.§ SLAC National Accelerator Laboratory.
(1) Burgess, B. K.; Lowe, D. L. Chem. ReV. 1996, 96, 2983.(2) Hoffman, B. M.; Dean, D. R.; Seefeldt, L. C. Acc. Chem. Res. 2009,
42, 609.(3) Denisov, I. G.; Makris, T. M.; Sligar, S. G.; Schlichting, I. Chem.
ReV. 2005, 105, 2253.(4) Sono, M.; Roach, M. P.; Coulter, E. D.; Dawson, J. H. Chem. ReV.
1996, 96, 2841.(5) Wallar, B. J.; Lipscomb, J. D. Chem. ReV. 1996, 96, 2625.(6) Krebs, C.; Fujimori, D. G.; Walsh, C. T.; Bollinger, J. M., Jr. Acc.
Chem. Res. 2007, 40, 484.(7) Solomon, E. I.; Brunold, T. C.; Davis, M. I.; Kemsley, J. N.; Lee,
S. K.; Lehnert, N.; Neese, F.; Skulan, A. J.; Yang, Y. S.; Zhou, J.Chem. ReV. 2000, 100, 235.
(8) Roe, A. L.; Schneider, D. J.; Mayer, R. J.; Pyrz, W.; Widom, J.; Que,L., Jr. J. Am. Chem. Soc. 1984, 106, 1676.
(9) Westre, T. E.; Kennepohl, P.; DeWitt, J. G.; Hedman, B.; Hodgson,K. O.; Solomon, E. I. J. Am. Chem. Soc. 1997, 119, 6297.
(10) Levina, A.; Armstrong, R. S.; Lay, P. A. Coord. Chem. ReV. 2005,249, 141.
(11) Einsle, O.; Tezcan, F. A.; Andrade, S. L. A.; Schmid, B.; Yoshida,M.; Howard, J. B.; Rees, D. C. Science 2002, 297, 1696.
(12) Howard, J. B.; Rees, D. C. Proc. Natl. Acad. Sci. U.S.A. 2006, 103,17088.
(13) Xue, G. Q.; Fiedler, A. T.; Martinho, M.; Munck, E.; Que, L. Proc.Natl. Acad. Sci. U.S.A. 2008, 105, 20615.
(14) Green, M. T.; Dawson, J. H.; Gray, H. B. Science 2004, 304, 1653.(15) Newcomb, M.; Halgrimson, J. A.; Horner, J. H.; Wasinger, E. C.;
Chen, L. X.; Sligar, S. G. Proc. Natl. Acad. Sci. U.S.A. 2008, 105,8179.
Published on Web 06/28/2010
10.1021/ja101281e 2010 American Chemical Society J. AM. CHEM. SOC. 2010, 132, 9715–9727 9 9715
determined. While isotope substitution provides a means todistinguish C, N, and O atoms by EPR or vibrational methods,such experiments pose a challenge in a protein matrix, due inpart to the abundance of these elements and difficulties endemicto isotopic substitution.
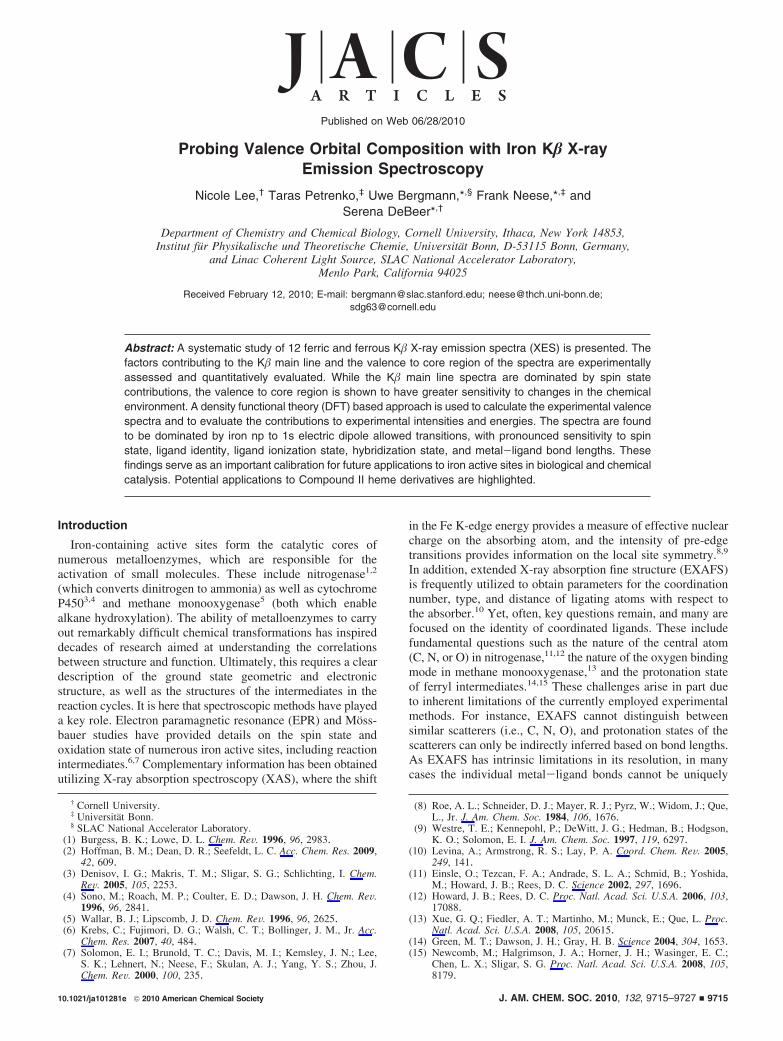
These challenges, however, may be addressed by Fe K� X-rayemission spectroscopy (XES).16 Though K� XES phenomenahave been known for some time,17 recent developments of high-resolution spectrometers in the hard X-ray range, utilizingsynchrotron sources, have provided greater accessibility to thesetypes of measurements. However, very few K� XES studieshave been performed on structurally well-characterized, lowmolecular weight model complexes, and as such, many questionsremain about the factors governing the intensities, energies, andrelative distributions of spectral features.18,19 Here we focus onthe development of Fe K� XES as a quantitative probe of ironactive site structure, including metal spin state,20,21 oxidationstate, and ligand identity. K� XES involves following theemission of photons by decay of electrons after ionization ofthe metal 1s electron (Figure 1). The K�1,3 emission linecorresponds to an electric dipole allowed 3p-1s transition,which will have significant contributions from 3p-3d electronexchange interactions as well as 3p spin-orbit coupling (SOC)contributions.16 To higher energy are transitions that correspondto valence electron transitions into the metal 1s core hole, theso-called K�2,5/K� (or valence to core) region. These transitionshave been previously assigned as ligand np to metal 1s (K�2,5)and ligand ns to metal 1s (“K�” or “satellite”) transitions.22,23
However, the selection rules governing the intensities and thecontribution of oxidation state, spin state, and ligand identityhave not been investigated in detail.
Here, we present a systematic study of the K� XES spectraof 12 ferrous and ferric complexes in high- and low-spin states.The oxidation and spin state dependent changes of both the K�main line and the valence to core region are identified. Thoughthe spin state dependence of the K� main line has beenpreviously investigated,24,25 to our knowledge the spin statecontribution to the valence to core region has not beenpreviously noted. In addition, the contributions of site symmetry,oxidation state, and ligand identity to the iron valence to corespectra are investigated and quantitatively assessed.
The experimental valence to core spectra are correlated tocalculated spectra, which have been obtained using a straight-forward density functional theory (DFT) approach. The strongcorrelation between experiment and theory not only validatesthe computational protocol but also indicates that these spectracan be used as a quantitative map of valence orbital composition.This also allows us to individually assess the contributions ofsymmetry, spin state, metal-ligand bond lengths, and ligandidentity in an in silico fashion The potential of these methodsfor identifying subtle perturbations in biological iron active sitestructures is discussed and illustrated by pilot calculations onthe compound II intermediate in cytochrome P450.
Experimental Procedures
Sample Preparation. K3[Fe(CN)6], K4[Fe(CN)6], and[Fe(bipy)3](PF6)2 (where bipy ) 2,2′-bipyriine) were purchasedfrom Aldrich and used without further purification. [Fe(tpfp)Cl](where tpfp ) tetra(pentafluoro)phenylporphyrin) was purchasedfrom Frontier Scientific. [Et4N]2[FeCl4],
26 (Et4N)[FeCl4],27
NaK3FeCl6,28 [Fe(acac)3],
29 [Fe(tacn)2]Cl3,30 [Fe(tacn)2]Cl2,
30
[Fe(III)(tpp)(ImH)2]Cl,31 and [Fe(II)(MeIm)6][B(C6H5)4]232 were
prepared according to published procedures (acac ) acetylacetonate,tacn ) 1,4,7-tiazacyclononane, tpp ) tetraphenylporphyrin, MeIm) N-methyl-imidazole). All samples were prepared as dilutions inboron nitride, pressed into 1 mm Al spacers, and sealed with 38µm Kapton tape. All ferrous samples were prepared in an inertatmosphere glovebox. A complete list of all samples, includingthe oxidation state, spin state, and iron site symmetry, is givenin Table 1.
XES Measurements. All XES data were collected at SSRLbeamline 6-2 (54-pole wiggler, 1 T). The incident energy was setto 9 keV utilizing at Si(111) a liquid nitrogen cooled monochro-mator. Vertical and horizontal focusing mirrors were used to achievea beam size of 200 × 800 µm with a flux of ∼4 × 10¹² photons/sat 100 mA. The energy of the incident beam was calibrated withan iron foil, setting the first inflection point to 7111.2 eV.
(16) Glatzel, P.; Bergmann, U. Coord. Chem. ReV. 2005, 249, 65.(17) (a) Kasrai, M.; Urch, D. S. J. Chem. Soc., Faraday Trans. 2 1979,
75, 1522. (b) Tsutsumi, K. J. Phys. Soc. Jpn. 1959, 14, 1696.(18) Smolentsev, G.; Soldatov, A. V.; Messinger, J.; Merz, K.; Weyher-
muller, T.; Bergmann, U.; Pushkar, Y.; Yano, J.; Yachandra, V. K.;Glatzel, P. J. Am. Chem. Soc. 2009, 131, 13161.
(19) Pushkar, Y.; Long, X.; Glatzel, P.; Brudvig, G. W.; Dismukes, G. C.;Collins, T. J.; Yachandra, V. K.; Yano, J.; Bergmann, U. Angew.Chem., Int. Ed. 2009, 48, 800.
(20) (a) Vanko, G.; de Groot, F. M. F. Phys. ReV. B 2007, 75, 177101. (b)Vanko, G.; Neisius, T.; Molnar, G.; Renz, F.; Karpati, S.; Shukla, A.;de Groot, F. M. F. J. Phys. Chem. B 2006, 110, 11647. (c) Antonov,V. N.; Germash, L. P.; Shpak, A. P.; Yaresko, A. N. Phys. StatusSolidi B 2009, 246, 411.
(21) Lengsdorf, R.; Rueff, J. P.; Vanko, G.; Lorenz, T.; Tjeng, L. H.; Abd-Elmeguid, M. M. Phys. ReV. B 2007, 75, 180401.
(22) Bergmann, U.; Horne, C. R.; Collins, T. J.; Workman, J. M.; Cramer,S. P. Chem. Phys. Lett. 1999, 302, 119.
(23) Bergmann, U.; Bendix, J.; Glatzel, P.; Gray, H. B.; Cramer, S. P.J. Chem. Phys. 2002, 116, 2011.
(24) Glatzel, P.; Bergmann, U.; de Groot, F. M. F.; Cramer, S. P. Phys.ReV. B 2001, 64, 045109.
(25) Peng, G.; Degroot, F. M. F.; Hamalainen, K.; Moore, J. A.; Wang,X.; Grush, M. M.; Hastings, J. B.; Siddons, D. P.; Armstrong, W. H.;Mullins, O. C.; Cramer, S. P. J. Am. Chem. Soc. 1994, 116, 2914.
(26) Lauher, J. W.; Ibers, J. A. Inorg. Chem. 1975, 14, 348.(27) Kistenmacher, T. J.; Stucky, G. D. Inorg. Chem. 1968, 7, 2150.(28) Beattie, J. K.; Moore, C. J. Inorg. Chem. 1982, 21, 1292.(29) Iball, J.; Morgan, C. H. Acta Crystallogr. 1967, 23, 239.(30) Wieghardt, K.; Schmidt, W.; Herrmann, W.; Kuppers, H. J. Inorg.
Chem. 1983, 22, 2953.(31) Scheidt, W. R.; Osvath, S. R.; Lee, Y. J. J. Am. Chem. Soc. 1987,
109, 1958.(32) Miller, L. L.; Jacobson, R. A.; Chen, Y. S.; Kurtz, D. M. Acta
Crystallogr. C 1989, 45, 527.
Figure 1. Fe K� XES spectrum for [Fe(III)Cl4]1-. The box indicates thevalence to core region of the spectrum, which has been expanded by 100-fold above. A simplified energy diagram showing the origin of the K�1,3
and valence to core transitions is given on the right.
XES spectra were recorded with a crystal array spectrometer,which employs three spherically bent Ge(620) crystals (100 mmdiameter, 1 m radius of curvature) aligned on intersecting Rowlandcircles (the schematic setup is shown, e.g., in Figure 5 in ref 16).An energy resolving Si drift detector (Vortex or Ketek) with a 3mm vertical slit was used as the X-ray photon detector. Sampleswere positioned at 45 degrees with respect to the incident beamand were maintained at a temperature of 10 K in an Oxford CF1208continuous flow liquid helium cryostat. A helium-filled flight pathwas utilized between the cryostat and the spectrometer to minimizesignal attenuation of the fluorescence.
Iron K� XES spectra were collected from 7020 to 7120 eV, witha step size of ∼0.2 eV over the K�1,3 main line (7020-7070 eV)and steps of ∼0.15 eV over the valence to core region (7070-7120eV). Spectra were normalized to the incident flux I0 measured in aHe-filled ion chamber. The spectrometer energy was calibrated bymeasuring the energy of the elastically scattered beam as a functionof spectrometer position using a monochromator calibration of7111.2 eV for the first derivative maximum of the Fe metal XANES.The spectrometer energy resolution is estimated at ∼1.4 eV fullwidth at half-maximum (fwhm) by Gaussian deconvolution of themeasured elastic peak widths (1.6-1.8 eV fwhm) using thetheoretical Darwin width of ∼1.0 eV fwhm for the Si(111)monochromator. This compares to a Lorentzian core hole lifetimebroadening of ∼1.5 eV for Fe K� XES spectra (given by the sumof the metal 1s broadening (1.3 eV) and the metal 3p, np, or ligand2s broadenings, respectively). However, emission spectra are furtherbroadened by mutiplet effects. Fe2O3 was used as a reference samplefor calibrating the spectrometer energy between different experi-mental runs, with the maximum of the K�1,3 main line calibratedto 7060.6 eV and the maximum of the K�2,5 line calibrated to 7107.2eV.
For all samples, radiation damage studies were performed, andthe maximum exposure time per spot was determined. Multiplespots were utilized on each sample, and the averaged data representonly those scans which showed no evidence of radiation damage.The total integrated area of the averaged spectra was set to a valueof 1. The valence to core region was fit using the programEDG_FIT.38 The background tail from the K�1,3 main line and thevalence to core features were modeled using pseudo-Voigt line
shapes (simple sums of Gaussian and Lorenztian functions). Thetail from the K�1,3 background was subtracted from the reportedareas in Table 2. Representative fits to the data are given in theSupporting Information. Reported areas are the average of all goodfits (with an estimated error of ∼10%). All areas have beenmultiplied by 1000.
XES Calculations. All calculations were performed with theORCA quantum chemistry program39 using the theoretical protocolsummarized in the text. The Fe valence to core XES spectra of allcomplexes were calculated using both the experimental X-raystructures (method 1, as referenced in Table 1) and geometryoptimized structures (method 2). Geometry optimizations wereperformed using the BP86 functional, the zeroth-order regularapproximation for relativistic effects (ZORA)40 following the modelpotential implementation of van Wullen,41 and the scalar-relativ-istically recontracted def2-TZVP(-f) basis set.42 The negative chargeon the complexes was compensated with the conductor-likescreening model (COSMO) in an infinite dielectric. Molecularorbitals were visualized using Chimera.43
For all XES calculations presented in this study, the BP86functional44,45 was utilized in conjunction with the CP(PPP) basisset46 for the Fe (with a special integration accuracy of 7) and theTZVP basis set for all other atoms. Calculations were carried outin a dielectric continuum using the conductor-like screening model(COSMO)47 in an infinite dielectric. The calculations used a denseintegration grid (ORCA Grid4). This combination of basis set andfunctional has previously proven successful for TDDFT calculation
(33) Song, B.; Swenson, D. C.; Goff, H. M. Acta Crystallogr., Sect. C1998, 54, IUC9800058.
(34) Overgaard, J.; Svendsen, H.; Chevalier, M. A.; Iversen, B. B. ActaCrystallogr. 2005, E61, m268.
(35) Figgis, B. N.; Skelton, B. W.; White, A. H. Aust. J. Chem. 1978, 31,57.
(36) Kuchar, J.; Cernak, J.; Massa, W. Acta Crystallogr. 2004, C60, m418.(37) Boeyens, J. C. A.; Forbes, A. G. S.; Hancock, R. D.; Wieghardt, K.
Inorg. Chem. 1985, 24, 2926.(38) George, G. N. EXAFSPAK, SSRL, SLAC; Stanford University:
Stanford, CA, 2000.
(39) Neese, F.; Becker, U.; Ganyushin, D.; Hansen, A.; Liakos, D. G.;Kollmar, C.; Kossmann, S.; Petrenko, T.; Reimann, C.; Riplinger, C.;Sivalingam, K.; Valeev, E.; Wezisla, B.; Wennmohs, F. ORCA: Anab initio, DFT, and Semiempirical Electronic Structure Package,version 2.7.0; University of Bonn: Bonn, Germany, 2009.
(40) van Lenthe, E.; van der Avoird, A.; Wormer, P. E. S. J. Chem. Phys.1998, 108, 478.
(41) van Wullen, C. J. Chem. Phys. 1998, 109, 392.(42) Pantazis, D. A.; Chen, X. Y.; Landis, C. R.; Neese, F. J. Chem. Theory
Comput. 2008, 4, 908.(43) Pettersen, E. F.; Goddard, T. D.; Huang, C. C.; Couch, G. S.;
Greenblatt, D. M.; Meng, E. C.; Ferrin, T. E. J. Comput. Chem. 2004,13, 1605.
(44) Becke, A. D. Phys. ReV. A 1988, 38, 3098.(45) Perdew, J. P. Phys. ReV. B 1986, 33, 8822.(46) Neese, F. Inorg. Chim. Acta 2002, 337C, 181.(47) Klamt, A.; Schuurmann, G. J. Chem. Soc., Perkin. Trans. 1993, 2,
799.
Table 1. Oxidation States, Spin States, Geometries, andCrystallographic Structure References for the Iron ModelComplexes Investigated by XES
complex Fe oxidation state spin state geometrycrystal structure
reference
[FeCl4]1- III 5/2 Td 27[Fe(acac)3]0 III 5/2 Oh 29[Fe(tpfp)Cl]0 III 5/2 C4V 33[Fe(CN)6]3- III 1/2 Oh 34[Fe(tacn)2]3+ III 1/2 Oh 30[Fe(tpp)(ImH)2]1+ III 1/2 D4h 31[FeCl4]2- II 2 Td 26[FeCl6]4- II 2 Oh 28[Fe(bipy)3]2+ II 2 Oh 35[Fe(MeIm)6]2+ II 2 Oh 32[Fe(CN)6]4- II 0 Oh 36[Fe(tacn)2]2+ II 0 Oh 37
Table 2. Energies and Areas for Fe K� XES Spectra
complex K�1,3 energy (eV) K�2,5 energy (eV)area (valence to
a The reported areas are based on fits to the normalized data and havebeen multiplied by 1000. The reported areas are the average of all goodfits (estimated errors are ∼10%).
J. AM. CHEM. SOC. 9 VOL. 132, NO. 28, 2010 9717
Probing Valence Orbital Composition with Iron K� XES A R T I C L E S
of XAS spectra.48-50 A detailed investigation of the contributionof the functional, basis sets, and scalar relativistic effects to thecalculated XES spectra will be the focus of a future study.
Results and Analysis
K� XES Spectra: Ferric Complexes. The normalized Fe K�XES spectra for the high-spin ferric complexes [FeCl4]1-,[Fe(acac)3]0, and [Fe(tpfp)Cl]0 are shown in Figure 2, withthe K� main line spectra given in 2A and an expansion of thecorresponding valence to core region given in 2B. All of thehigh-spin ferric complexes are characterized by a K�1,3 mainline with a maximum at ∼7060 eV (Table 2) and a K�′ featureat ∼7045 eV. The K�′ feature arises from mutiplet effects andcan be modeled through inclusion of electron-electron interac-tions; however, this is not the focus of the present study.24,25
The valence to core region of the spectra is characterized by abroad envelope of transitions (between 7100 and 7115 eV) withmaxima at ∼7105-7109 eV and integrated areas of 8-12 unitsof intensity (Table 2). While the K� main line spectra areessentially identical to each other, the valence to core spectrashow clear variations in the energy and intensity distributions,indicating that these spectra are much more sensitive to a changein ligation than the K� main line.
Figures 2C and D show the K� main line spectra and valenceto core spectra, respectively, for a series of low-spin ferriccomplexes ([Fe(III)(CN)6]3-, [Fe(III)(tacn)2]3+, and [Fe(III)(t-pp)(ImH)2]1+). In contrast to the high-spin complexes, the K�main line spectra no longer have a distinct K�′ feature, and the
peak maximum has decreased in energy by ∼1-2 eV, consistentwith a decrease in spin state.16 There are also pronouncedchanges in the valence to core region of the spectra. In thisspectral region, the transition envelope is generally narrower(7102-7113 eV) for the low-spin complexes, and the integratedarea relative to the full spectral range has increased by a factorof 2 or more (16-22 units, Table 2) over that of the high-spincomplexes. Again, the valence to core region shows a muchgreater variation in energy and intensity distribution as comparedto the K� main line, demonstrating the strongly increasedsensitivity to the ligand environment.
K� XES Spectra: Ferrous Complexes. The normalized Fe K�XES spectra for a series of high-spin and low-spin ferrouscomplexes are given in Figure 3A,B and 3C,D, respectively.Similar to the high-spin ferric complexes, the high-spin ferrouscomplexes ([FeCl4]2-, [FeCl6]4-, [Fe(bipy)3]2+, and [Fe-(MeIm)6]2+) all exhibit a pronounced K�′ feature at ∼7045 eVin the K� main line spectra, with a maximum at ∼7060 eV(Figure 3A). Comparison of [Fe(III)Cl4]1- to [Fe(II)Cl4]2- showsa 0.8 eV decrease in energy upon reduction, which may beattributed to the decrease in spin state from S ) 5/2 to S ) 2.However, care must be taken in using the energy of the K�main line as an isolated indicator of spin state as there is clearoverlap in the S ) 2 and S ) 5/2 K� energies (Table 2). Thevalence to core region of the high-spin ferrous spectra showsgreater spectral variation and has integrated areas of 7-11 unitsof intensity, very similar to what is observed for the high-spinferric complexes. Interestingly, the maximum peak energy inthe valence to core region decreases by 1.2 eV going from[Fe(III)Cl4]1- to [Fe(II)Cl4]2-. This indicates that there aredifferent contributions to the observed energy shift in the K�1,3
vs valence to core region of the spectra. While the K� main
(48) DeBeer George, S.; Petrenko, T.; Neese, F. J. Phys. Chem. A 2008,112, 12936.
Figure 2. Fe K� main line XES spectra for high-spin ferric complexes (A). Valence to core region for the complexes shown in A (B). Fe K� main line XESspectra for low-spin ferric complexes (C). Valence to core region for the complexes shown in C (D).
line energies are most likely dominated by 3p-3d exchangeinteractions,16 the valence to core region likely has a largercontribution due to a change in the effective nuclear charge (Zeff)on the metal.
It is also of interest to note that the K�1,3 main line andvalence to core spectra of Td-[FeCl4]2- and Oh-[FeCl6]4- areessentially identical. This indicates that the iron site symmetryis not a significant factor in determining the spectral intensity.As will be further developed below, this result also providesexperimental evidence that these transitions are dominantlydipole allowed in origin and is consistent with previous MnK� XES studies by Glatzel et al.18
Ongoing to the low-spin ferrous complexes, the K�1,3 spectra(analogous to the low-spin ferric complexes) show no K�′feature at 7045 eV. However, there is evidence for a weakershoulder at ∼7050 eV, indicating that upon decreasing spin statethe shoulder and the main peak move closer in energy. TheK�1,3 peak maximum is shifted down in energy by severalelectronvolts relative to the high-spin ferrous complexes, againreflecting a decrease in 3p-3d exchange correlation due to adecrease in spin. Examination of the valence to core regionshows that the low spin ferrous complexes have 2-3 timesgreater intensity than the high-spin complexes, paralleling thetrend observed for the ferric complexes. Comparing the ferrouscomplexes to the analogous ferric complexes, a smaller decreasein the K�1,3 peak maximum (0.6-1 eV) is observed uponreduction relative to the shift in the valence to core region(1.3-1.5 eV). These data suggest the valence to core region isthus a more sensitive probe of the changes in effective nuclearcharge.
From these data, several general trends emerge. The K� mainline is most sensitive to the spin state on the Fe, with the overall
K� line shape providing a clear indicator for high-spincomplexes (due to the presence of a 7045 eV shoulder) or low-spin complexes. This is consistent with previous XES studieson, e.g., Mn (see ref 16 and references therein). This region ofthe spectrum is essentially insensitive to the ligand environment.In contrast, the valence to core region shows sensitivity tooxidation state, spin state, and changes in the ligand environ-ment. Changes in oxidation state result in ∼1-1.5 eV decreasesin energy upon reduction, while differences in spin state arecorrelated with an increase in valence to core intensity upondecreasing spin state. A change in the coordination environmentresults in alteration of the overall spectral shape and intensitydistribution. This will be systematically investigated belowthrough electronic structure calculations.
Calculation of Valence to Core XES Spectra. To betterunderstand the experimental trends and their origins, we haveutilized density functional theory calculations to predict thevalence to core region of the XES spectra.
Theory. The total number of photons emitted per unit timeIIF that correspond to the transition of an initial core-ionized orcore-excited state |I⟩ to the final state |F⟩ in the limit of lowconcentration of the absorbing species and small path length ofthe incident beam is given by
where ∆N is the total number of absorbing species in theirradiated volume, and WGI is the transition rate between theground state |G⟩ and state |I⟩ (capital letters are used for manyelectron states, lowercase letters for orbitals). WGI is related tothe photoionization cross section σGI(ω0) at the incident photonfrequency ω0 as
Figure 3. Fe K� main line XES spectra for high-spin ferrous complexes (A). Valence to core region for the complexes shown in A (B). Fe K� main lineXES spectra for low-spin ferrous complexes (C). Valence to core region for the complexes shown in C (D).
IIF ) WGI∆NAIF
DI(1)
J. AM. CHEM. SOC. 9 VOL. 132, NO. 28, 2010 9719
Probing Valence Orbital Composition with Iron K� XES A R T I C L E S
The emission rate corresponding to the transition of state |I⟩ tostate |F⟩ is given by the Einstein coefficient AIF which isproportional to the emission oscillator strength fIF
51
where γel is the classical radiative decay rate of the single-electron oscillator at frequency ωIF which is equal to thetransition frequency between the initial and final states (CGSunits)
Here, me is the mass of the electron; e is the electron charge; cis the speed of light; and DI is the total decay rate of the core-excited state |I⟩ which is the sum of the radiative (DI
R) andnonradiative (DI
N) decay rates
According to eqs 1-4, the relative intensities of differenttransitions in the XES spectrum can be written as
Then, the normalized XES spectrum IIR(ωem) corresponding to
emission from state |I⟩ is
where L(ωem, ωIF, Γ, σ) is a line shape function which, ingeneral, depends on homogeneous (Γ) and inhomogeneous (σ)broadening parameters. From eq 7 it follows that the calculatedXES spectrum has an integrated area of unity (∫IR(ωem) ) 1)and thus can be directly compared with the normalizedexperimental XES spectrum. In this work, we take the line shapefunction to be a Gaussian function, but other choices such as aVoigt shape may be more appropriate if a mixture of homoge-neous and inhomogeneous broadening mechanisms is to bemodeled.52 It is known that the decay of the core excited statedirectly influences the energy resolution of the XES spectrum.53
The lifetime of the core hole is given by τI ) (DI)-1 whichleads, in a first approximation, to a Lorentzian line shape withthe full-width at half-maximum height given by
In principle, the analysis of the homogeneous broadening inthe XES spectra would enable one to obtain the total decayrate of state |I⟩ and compare it with the theoretical value of DI
(eq 5). However, the latter would require us to take account ofthe nonradiative dacay rates that are known to be dominated
by the Auger process.54 An in-depth study of this problem isbeyond the scope of the present study.
The emission oscillator strength fIF is related to the absorptionoscillator fFI strength as fIF ) -fFI. The oscillator strength canbe expanded as a power series in terms of the dimensionlessfine structure constant R () 1/137.03599). The first term in thisexpansion represents the electric dipole oscillator strength (f IF
ed).For orientationally averaged transition rates, the term linear inR is zero, and the next leading term ∼R2 can be written as thesum of the electric quadrupole (f IF
eq) and magnetic dipole (f IFmd)
oscillator strengths
In atomic units, these three contributions to the oscillatorstrengths can be expressed as follows
Here, EIF is the transition energy between states |I⟩ and |F⟩, mbIF,µbIF, and {(Qab)IF} are the corresponding matrix elements of theelectric dipole, magnetic dipole, and electric quadrupole opera-tors, respectively (see ref 49 for precise definitions).
In this work, the theoretical framework presented above hasbeen implemented in a simple quasi-one-electron approach. Inprinciple, the XES experiment involves the excitation of anelectron from the 1s-orbital (of the XAS absorber being probed)into the continuum, thus forming a N-1 electron detached state.This state relaxes by emission of a photon from the higher lying2sp, 3sp, or valence orbitals into the final N-1 electron state.Concomitant with the electron ejection, the valence and sub-valence orbitals experience an increased nuclear charge at theXAS absorber that will tend to distort the orbitals to some extent(“electronic relaxation”). This effect has previously been mod-eled by Glatzel and co-workers by running the calculations withan increased nuclear charge at the absorber atom.18 However,they found that this approximate treatment of electronicrelaxation did not improve the agreement between theory andexperiment. Hence, we have resorted to the simplest possibleapproach in which the electronic relaxation in the intermediatestate is neglected.
The orbitals used in the present treatment come from a densityfunctional theory (DFT) calculation and satisfy the canonicalKohn-Sham equations
where Fσ is the Kohn-Sham operator; |pσ⟩ is a spin-orbital withspin σ ) R,�; and εp
σ is the orbital energy. The Kohn-Shamoperator is
(51) Corney, A. Atomic and Laser Spectroscopy; Clarendon: Oxford, 1977.(52) Petrenko, T.; Neese, F. J. Chem. Phys. 2007, 127, 164319.(53) Krause, M. O.; Oliver, J. H. J. Phys. Chem. Ref. Data 1979, 8, 329.
(54) Schieffer, P.; Guivarc’h, A.; Lallaizon, C.; Lepine, B.; Sebilleau, D.;Turban, P.; Jezequel, G. Appl. Phys. Lett. 2006, 89, 161923.
WGI ) σGI(ω0)I0 (2)
AIF ) -3fIFγel (3)
γel )2e2ωIF
2
3mec3
(4)
DI ) DIR + DI
N
DIR ) ∑
F'
AIF'(5)
IIFR )
ωIF2 fIF
∑F'
ωIF′2 fIF′
(6)
IIR(ωem) ) ∑
F
IIFR L(ωem, ωIF, Γ, σ) (7)
∆ωI ) DI ) (τI)-1 ) 2ΓI (8)
fIF ) fIFed + fIF
md + fIFeq (9)
fIFed ) -2
3EIF|mbIF|2 (10)
fIFmd ) -2
3R2EIF|µfIF|2 (11)
fIFeq ) - 1
20R2EIF
3 ∑a,b
|(Qab)IF|2 (12)
Fσ|pσ⟩ ) εpσ|pσ⟩ (13)
Fσ ) h + ∫ F(r′)|r - r′| dr′ + VXC[F](r) (14)
9720 J. AM. CHEM. SOC. 9 VOL. 132, NO. 28, 2010
A R T I C L E S Lee et al.
where h is the one-electron Hamiltonian (kinetic energy pluselectron-nuclear potential, together with other external potentialssuch as external electric fields which may be present). Thesecond term presents the Coulomb repulsion, where
is the electron density, and the exchange correlation potentialis
The quantity EXC[F] is the exchange-correlation functional.Associated with the Kohn-Sham procedure is the ground stateKohn-Sham determinant
In general, occupied orbitals of the electronic ground state arelabeled with i,j,k, ... and unoccupied ones with a,b,c, ... In theone-electron approach, the initial core-excited and final statesare constructed as
For the specific application at hand, orbital i is a core orbital,e.g., the metal 1s derived orbital of a given absorber atom; a isan arbitrary unoccupied orbital (or a continuum unbound one-electron level); and j is another semicore or valence orbital ofthe same atom.
Rather than trying to obtain accurate total energies for all ofthese states, the simple approximation is adopted for theemission energy
This is of course fairly simplistic. In terms of time-dependentDFT, it can be shown that the orbital energy difference is awell-defined approximation to the state energy difference if noHartree-Fock exchange is present in the DFT potential.55,56
For a semiquantitative discussion, this should be good enoughsince the substantial errors of the presently used DFT potentialsprevent the calculations from predicting accurate absolutetransition energies anyways (for reviews, see refs 57 and 58).In addition, we have consistently observed that core/valenceexcitations are strongly dominated by the orbital energycontribution since the contributions of the exchange-correlationkernel are very small for such excitations. In fact, for XAScalculations, the absolute transition energies obtained from theTD-DFT linear response equations and the orbital energyapproximation differ by at most a few tenths of an electronvoltwhich is considered to be negligible for the present application.59
Equations 6-7 and 9-12 have been implemented into adevelopment version of the ORCA electronic structure pack-age.39 The electric quadrupole and magnetic dipole contributions
to the emission rate are calculated in a way previously discussedfor X-ray absorption spectra.49 As will be pointed out below,the electric dipole contributions have been found to be stronglydominant for XES calculations. Hence, while the final intensitiesdo include the electric quadrupole and magnetic dipole contribu-tions, we will not discuss their relative contributions below.
Obviously, the simple one-electron approximation falls shortof properly including electronic relaxation, and hence one cannotmodel multielectron phenomena such as shake-up or shake-downtransitions with such an approach. Second, the approach doesnot take proper care of multiplet effects since it is based onsimple individual determinants that do not span the proper spinand space manifolds to provide the correct multiplet structureinherent in the multielectron nature of the electronic states thatare involved. This is expected to adversely affect the resultsobtained for the K� main line but should be less serious for thevalence to core region. Efforts are underway in our laboratoriesto remove the restrictions mentioned above.
Results. As anticipated from the discussion above, the K�main line region of the spectra is not particularly well-predictedby the simple one-electron-like DFT approach. First of all, thecalculations underestimate the exchange-based splitting, thuspointing to deficiencies of the DFT potential in the semicoreregion (consistent with too small of a contribution from spinpolarization49,60). Second, the calculations do not provide thecorrect intensity ratio of the two K� main line peaks presumablybecause multiplet effects are not properly treated. Hence, wewill not examine this spectral region further in the present studybut will instead concentrate on the valence to core region, whichshows greater sensitivity to changes in the chemical environ-ment. The valence to core XES spectra were calculated both atthe experimental structures (method 1) and using geometryoptimized structures (method 2), as described in the Experi-mental Section.
Figure 4 shows the relationship between the calculatedvalence to core energies and the experimental energies. Thereported experimental energies correspond to the measured peakmaximum in the valence to core region. Calculated energieswere determined by applying a 2.5 eV broadening to thecalculated valence to core spectra and reporting the energy ofthe highest intensity peak. Each dot in Figure 4 corresponds toone of the twelve complexes from this study, calculated usingeither method 1 (blue open circles) or method 2 (red dots). Forboth method 1 and method 2, the calculated absolute transitionenergies are underestimated. This is expected due to thelimitations of DFT in modeling potentials near the nucleus andis analogous to the situation met in calculating XAS spectra.There we have shown that the underestimation depends on theparticular DFT functional and the basis set used and is highlysystematic. Hence, it can be dealt with by proper calibration,and the required energy shift at a given level of theory can be
(55) Petersilka, M.; Gross, E. K. U. Int. J. Quantum Chem. 1996, 60, 1393.(56) Petersilka, M.; Gossmann, U. J.; Gross, E. K. U. Phys. ReV. Lett. 1996,
76, 1212.(57) Neese, F. Coord. Chem. ReV. 2009, 253, 526.(58) Neese, F. J. Biol. Inorg. Chem. 2006, 11, 702.
(59) Consider for example the system [Ni(LS,S)2] discussed previously: Ray,K.; DeBeer George, S.; Solomon, E. I.; Wieghardt, K.; Neese, F.Chem.sEur. J. 2007, 13, 2753. DeBeer George, S.; Neese, F. Inorg.Chem. 2010, 49, 1849. Using the protocol discussed in: DeBeerGeorge, S.; Neese, F. Inorg. Chem. 2010, 49, 1849. the TD-DFTtransition energies for the lowest three excitations at the S-K-edgeare 2409.248, 2410.337, and 2410.486 eV, respectively, and thecorresponding eigenvectors consist to 99.9% of one single excitation.The simple one-electron approximation yields 2409.588, 2410.673,and 2410.816 eV. Thus, there is merely a small ∼ .3 eV shift to higherenergy in the one-electron approximation, but overall little seems tobe lost.
(60) Orio, M.; Pantazis, D. A.; Petrenko, T.; Neese, F. Inorg. Chem. 2009,48, 7251.
F(r) ) FR(r) + F�(r)
) ∑iR
|iR(r)|2 + ∑i�
|i�(r)|2 (15)
VXCσ [F](r) )
δEXC
δFσ(r)(16)
|G⟩ ) |i...j...n| (17)
|I⟩ ) |a...j...n| (18)
|F⟩ ) |a...i...n| (19)
EIFσ ) pωIF
σ ) εjσ - εi
σ (20)
J. AM. CHEM. SOC. 9 VOL. 132, NO. 28, 2010 9721
Probing Valence Orbital Composition with Iron K� XES A R T I C L E S
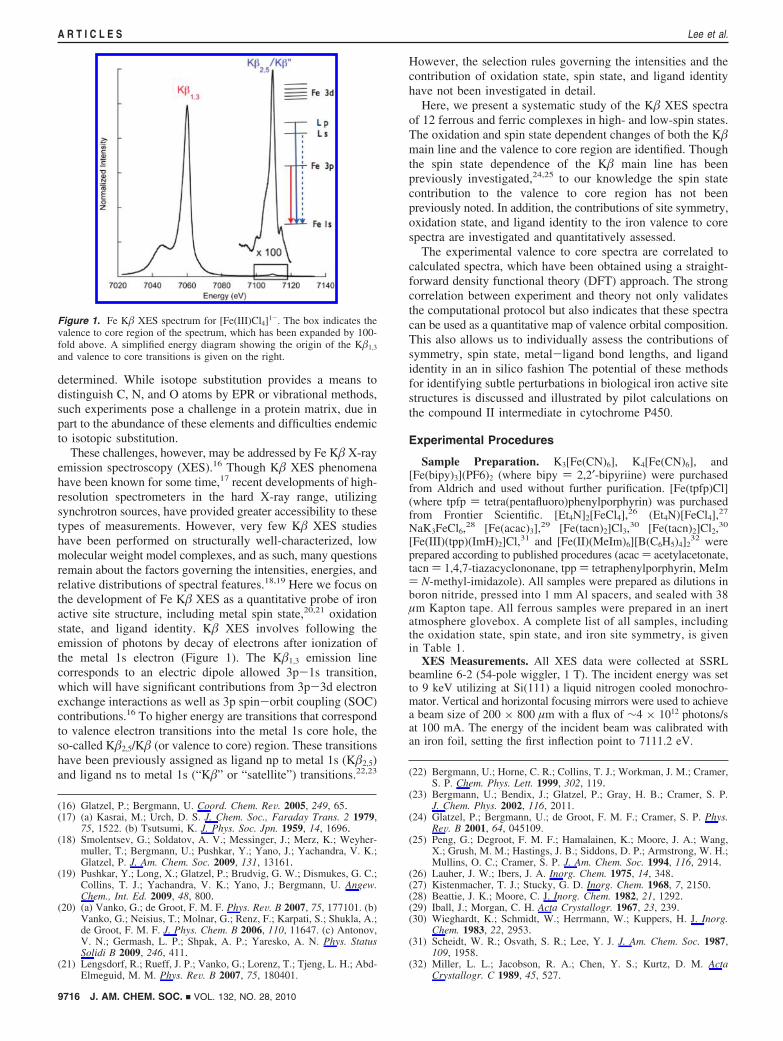
determined.48-50 For the presently employed method of calcula-tion, the required shifts are of 182.7 ( 0.8 eV and 182.5 ( 0.8eV for methods 1 and 2, respectively. This indicates that thegeometry optimizations only affect the relative energy shiftslightly and that the error in the predicted energy does notchange. An extensive calibration study using different func-tionals and basis sets is outside the scope of this work but willbe reported in due course.
Figure 5 presents the relationship between calculated totaloscillator strength and the experimental areas (as reported inTable 2) for each of the 12 complexes examined in this study,using both method 1 (blue open circles) and method 2 (red dots).The total calculated oscillator strength is comprised of electricdipole, electric quadrupole, and magnetic dipole contributions.However, electric dipole contributions dominate (representingon average 97% of the calculated intensity). The relationshipbetween experimental areas and total calculated intensity forthe valence to core region, using method 1, is reasonably linearwith a slope of 9.88 ( 1.87 (or an error of ∼19%). The errors
in the calculated intensities are signficantly reduced upon usinggeometry optimized structures (method 2). Here, a slope of 9.37( 1.39 or an error of ∼14% has been found.
We note that the errors in both transition energies andintensities are larger than those observed for analogous TDDFTcalculations of XAS spectra.48-50 This may derive in part fromthe more simplified approach used for calculations of XESspectra and will be the subject of a more detailed investigationin future studies. However, it should also be noted that theexperimental errors in transition energies and intensities are alsolarger for valence to core emission spectra than what we havepreviously reported for XAS spectra.48-50 This orginates in partfrom the very weak signal relative to the background (resultingin larger uncertainties in experimental areas, ∼10% as discussedin the experimental), as well as from the method employed forenergy calibration (which introduces an uncertainty of (0.2 eV).
Having established acceptable linear correlations betweenexperimental and calculated transition energies and intensities,it is instructive to examine the experimental data with respectto the calculated spectra. Figure 6 compares the experimentalhigh-spin ferric spectra (A) to the calculated spectra (method2) (B). A constant shift of 182.5 eV and a broadening of 2.5eV have been applied to all calculated spectra. A parallelcomparison for the ferrous complexes is made in Figure 7.
These comparisons demonstrate that in addition to predictingthe relative energies and intensities the calculations also reliablypredict the relative splittings and intensity distributions. It shouldbe noted that in some cases features in the 7090-7100 eV“satellite region” are very weak or absent in the experimentalspectra. However, this is at least in part due to the strongbackground from the K� main peak. In addition, there areexperimentally observed features at ∼7115 eV that are notreproduced by the calculations. These transitions likely cor-respond to double photoionizations (i.e., Fe K + Fe L excita-tions), which could be eliminated by tuning the incident beamto lower energies. This will be the subject of future investiga-tions. In any case, such multielectron excitations are notaccounted for in our simple DFT approach. Nevertheless, thestrong general agreement between experiment and theory allowsus to use the calculations for a more detailed analysis of theinformation content of the valence to core spectra.
Nature of the Core/Valence Features. As noted above, thespectra are dominated by dipole allowed Fe np to Fe 1stransitions. Figure 8 presents the calculated spectrum of [Fe(II)-Cl4]2- together with representative molecular orbitals thatdominate each set of observed transitions. The primary valenceto core peak at ∼7109 eV arises from intermediate states withcontributions from six molecular orbitals that are dominantlyCl 3p in character (two representative molecular orbitals areshown in Figure 8). A weak shoulder at ∼7111 eV correspondsto the transition from the t2 set of 3d orbitals. The isolated peakat ∼7097 eV corresponds to transitions from dominantly Cl 3s-based molecular orbitals. In all cases, the transitions aredominated by a dipole mechanism. As will be elaborated below,the calculated intensity arises from 5-10% Fe np charactermixed into each of the molecular orbitals.
Figure 9 shows the calculated spectrum of [Fe(II)(tacn)2]2+,together with the key molecular orbitals corresponding to theobserved transitions. Similar to ferric tetrachloride, the valenceto core spectrum is dominated by ligand p molecular orbitals,which have some (1-7%) Fe np character mixed in. A lower-energy feature appears at ∼7091 eV which corresponds totransitions from dominantly nitrogen, and to a lesser extent
Figure 4. Experimental vs calculated valence to core energies using method1 and method 2.
Figure 5. Experimental vs calculated valence to core intensities usingmethod 1 and method 2. The lines have been forced through the origin andgive slopes of 9.88 ( 1.87 (method 1) and 9.37 ( 1.39 (method 2).
carbon, 2s molecular orbitals. These features are shifted by ∼6eV relative to the satellite region in [Fe(II)Cl4]2- and reflect asignificant difference in the ligand Cl 3s and N 2s ionization
energies. None of the intense transitions are associated withmolecular orbitals having any significant d-character. The t2g
set of d-orbitals contributes as a very weak shoulder at ∼7111
Figure 6. Experimental valence to core spectra for high-spin ferric complexes (A) and the corresponding calculated spectra (B). Experimental valence tocore spectra for low-spin ferric complexes (C) and the corresponding calculated spectra (D). A 2.5 eV broadening and a constant shift of 182.5 eV have beenapplied to all calculated spectra.
Figure 7. Experimental valence to core spectra for high-spin ferrous complexes (A) and the corresponding calculated spectra (B). Experimental valence tocore spectra for low-spin ferrous complexes (C) and the corresponding calculated spectra (D). A 2.5 eV broadening and a constant shift of 182.5 eV havebeen applied to all calculated spectra.
J. AM. CHEM. SOC. 9 VOL. 132, NO. 28, 2010 9723
Probing Valence Orbital Composition with Iron K� XES A R T I C L E S
eV, again demonstrating the dominantly dipole allowed natureof these transitions.
High-Spin vs Low-Spin Complexes. As noted above, theexperimental valence to core data show an approximately 2-foldincrease in intensity on going from high-spin to low-spincomplexes. This difference is reproduced by the calculations;however, the origin of the intensity difference is not immediatelyobvious. To systematically understand the increased intensityon going to low-spin systems, we performed a series of in silicoinvestigations on hypothetical molecules. Figure 10A shows thecalculated spectra for high-spin Td-[Fe(III)Cl4]1-, high-spin D4h-[Fe(III)Cl4]1-, and hypothetical low-spin analogues. In all cases,the Fe-Cl bond was fixed at 2.15 Å. The distortion to D4h
perturbs the spectrum only slightly, increasing the transitionenergies by ∼0.2 eV and resulting in slightly increasedintensities. It is clear, however, that there is very little geometriccontribution to the observed intensities. Upon going to thehypothetical low-spin [Fe(III)Cl4]1- complexes, the transitionenergies decrease by ∼1 eV relative to the high-spin complexes,
indicating greater stabilization of the occupied ligand-basedvalence orbitals in the low-spin complexes due to increasedbonding character. However, there is no significant change inintensity.
Having ruled out any significant direct contribution fromgeometry or spin state, we then examined the variation of thespectral features with respect to bond distances. A hypotheticalseries of D4h-[Fe(III)Cl4]1- complexes with Fe-Cl bondsranging from 1.95 to 2.55 Å are shown in Figure 10B. Theobserved intensities clearly correlate with the Fe-Cl distances,decreasing essentially exponentially as the Fe-Cl bond islengthened (Figure 11). Hence, these calculations indicate thatthe Fe np contributions to the valence orbitals are distancedependent and affect both the primary valence to core transitionand the satellite transitions in a similar manner. The origin ofthe effect must be the increased ligand/Fe-np overlap that leadsto stronger orbital interactions and hence more ligand/Fe-nporbital mixing.
However, the calculations do not indicate whether thecontribution derives from the iron 3p or 4p orbitals. This is animportant question in evaluating the possible contribution of4p orbitals to bonding in transition metal complexes, which hasbeen a subject of some controversy.61-64
To evaluate this question, an additional set of calculationswere performed utilizing the ano-pVDZ basis set.65 This is anatomic natural orbital basis set, which has the advantage thatindividual 3p or 4p orbitals can be cleanly identified in the basisset and hence also in the final molecular orbital vectors.Examination of the calculations for the hypothetical series ofD4h-[Fe(III)Cl4]1- complexes (with Fe-Cl bonds ranging from1.95 to 2.35 Å) showed that the calculated intensity is roughlyproportional to the total p-character. However, there aresignificant contributions from both the Fe 3p and 4p orbitals tothe calculated XES spectra. No significant Fe-2p or Fe-5pcontributions were found. Therefore, one can attribute theobserved effects on one hand to intensity borrowing fromthe K� main line (reflecting the Fe-3p contributions) and onthe other hand to the Fe-4p contributions to bonding. Unfortu-nately, it appears to be difficult to cleanly separate these twoimportant contributions to the observed intensity.
Correlation of Spectral Features with Ligand Identity. A finalset of calculations addressed the key question of how thechemical identity of the ligands contributes to the valence tocore region of the XES spectra. Figure 12 shows the calculatedspectra for high-spin Td-[Fe(III)(X)4]1-, where X is varied fromPH2
- to SH- and Cl- (top) and from NH2- and OH- to F-
(bottom).These two series allow us to evaluate the ligand 3s/3p (or
2s/2p in NH2-, OH- to F-) contributions to the spectra. On
going from PH2- to SH- to Cl-, the ∼7110 eV feature increases
in intensity and decreases in energy by ∼2 eV. A parallel, butmore dramatic effect, is seen in the satellite region where the∼7100 eV feature shifts by more than 3 eV over the series.This reflects the increase in the ligand 3s ionization energy ongoing from P to Cl. For the NH2
-/OH-/F- series, morepronounced changes are observed. The overall shape of the main
(61) Maseras, F.; Morokuma, K. Chem. Phys. Lett. 1992, 195, 500.(62) Bayse, C. A.; Hall, M. B. J. Am. Chem. Soc. 1999, 121, 1348.(63) Landis, C. R.; Cleveland, T.; Firman, T. K. J. Am. Chem. Soc. 1998,
120, 2641.(64) Landis, C. R.; Firman, T. K.; Root, D. M.; Cleveland, T. J. Am. Chem.
∼7110 eV feature changes, and the satellite features shift by∼6 eV in energy, reflecting a larger change in ligand 2sionization energies than in the 3s ionization energies. The overallspectral intensity increases from NH2
- to F- consistent withthe decrease in Fe-L bond length (from 1.96 Å for [Fe(III)-(NH2)4]1-; 1.90 Å for [Fe(III)(OH)4]1-; 1.83 Å for [Fe(III)-(F)4]1-).22
It is also expected that the ligand hybridization and proton-ation state should contribute to the observed spectra. Toinvestigate these possibilities, two additional sets of calculationswere performed. Figure 13A shows a comparison of [Fe(II)-(NH3)6]2+ (sp3 hybridized nitrogen) to [Fe(II)(MeIm)6]2+ (sp2
hybridized nitrogen). These calculations demonstrate that ongoing from an sp3 to an sp2 ligand there is a clear effect on thesatellite region of the spectrum, with the pronounced N 2sfeature at ∼7093 eV decreasing in intensity and new featuresappearing at higher energy. The higher-energy features(∼7097-7102 eV) correspond to both N and C 2s contributionsfrom the imidazole and clearly indicate that they are not“atomic” in origin but will vary in energy and intensity due todelocalization of s/p character over the ligand, indicating amolecular orbital description is most appropriate.
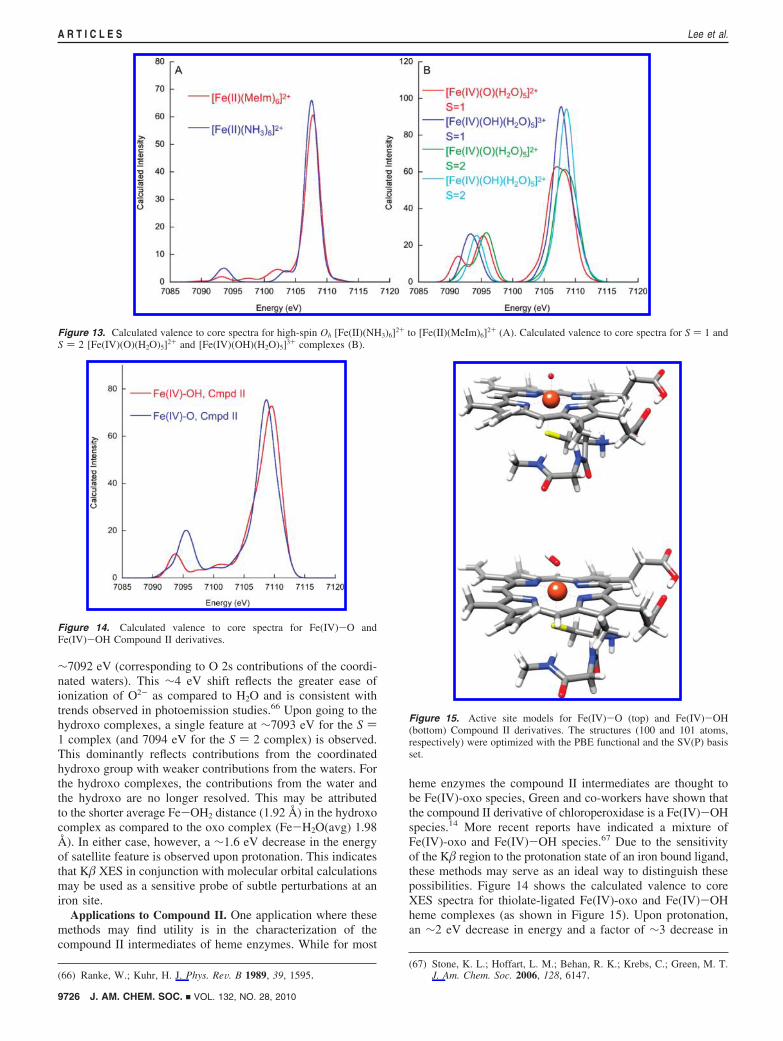
Figure 13B presents the valence to core XES calculationsfor [Fe(IV)(O)(H2O)5]2+ and [Fe(IV)(OH)(H2O)5]3+ in both S) 1 and S ) 2 spin states. The calculated energies for the S )2 complexes are ∼1 eV higher than the corresponding S ) 1complexes. For both Fe(IV)-oxo complexes, the K�2,5 featurehas decreased in intensity relative to the corresponding hyrdroxocomplexes. Two features are apparent in the satellite regionsamore intense feature at ∼7096 eV (dominated by O 2scontributions from the oxo group) and a weaker shoulder at
Figure 10. Calculated valence to core spectra for high-spin Td-[Fe(III)Cl4]1-, high-spin D4h-[Fe(III)Cl4]1-, and hypothetical low-spin Td-[Fe(III)Cl4]1 andD4h-[Fe(III)Cl4]1- (A). Calculated valence to core spectra for high-spin D4h-[Fe(III)Cl4]1- at different Fe-Cl bond lengths (B).
Figure 11. Relationship between bond length and the calculated intensityof the valence to core region.
Figure 12. Calculated valence to core XES spectra for [Fe(III)(X)4]1-,where X is varied from PH2
- to SH- and Cl- (top) and from NH2- and
OH- to F- (bottom).
J. AM. CHEM. SOC. 9 VOL. 132, NO. 28, 2010 9725
Probing Valence Orbital Composition with Iron K� XES A R T I C L E S
∼7092 eV (corresponding to O 2s contributions of the coordi-nated waters). This ∼4 eV shift reflects the greater ease ofionization of O2- as compared to H2O and is consistent withtrends observed in photoemission studies.66 Upon going to thehydroxo complexes, a single feature at ∼7093 eV for the S )1 complex (and 7094 eV for the S ) 2 complex) is observed.This dominantly reflects contributions from the coordinatedhydroxo group with weaker contributions from the waters. Forthe hydroxo complexes, the contributions from the water andthe hydroxo are no longer resolved. This may be attributedto the shorter average Fe-OH2 distance (1.92 Å) in the hydroxocomplex as compared to the oxo complex (Fe-H2O(avg) 1.98Å). In either case, however, a ∼1.6 eV decrease in the energyof satellite feature is observed upon protonation. This indicatesthat K� XES in conjunction with molecular orbital calculationsmay be used as a sensitive probe of subtle perturbations at aniron site.
Applications to Compound II. One application where thesemethods may find utility is in the characterization of thecompound II intermediates of heme enzymes. While for most
heme enzymes the compound II intermediates are thought tobe Fe(IV)-oxo species, Green and co-workers have shown thatthe compound II derivative of chloroperoxidase is a Fe(IV)-OHspecies.14 More recent reports have indicated a mixture ofFe(IV)-oxo and Fe(IV)-OH species.67 Due to the sensitivityof the K� region to the protonation state of an iron bound ligand,these methods may serve as an ideal way to distinguish thesepossibilities. Figure 14 shows the calculated valence to coreXES spectra for thiolate-ligated Fe(IV)-oxo and Fe(IV)-OHheme complexes (as shown in Figure 15). Upon protonation,an ∼2 eV decrease in energy and a factor of ∼3 decrease in
(66) Ranke, W.; Kuhr, H. J. Phys. ReV. B 1989, 39, 1595.(67) Stone, K. L.; Hoffart, L. M.; Behan, R. K.; Krebs, C.; Green, M. T.
J. Am. Chem. Soc. 2006, 128, 6147.
Figure 13. Calculated valence to core spectra for high-spin Oh [Fe(II)(NH3)6]2+ to [Fe(II)(MeIm)6]2+ (A). Calculated valence to core spectra for S ) 1 andS ) 2 [Fe(IV)(O)(H2O)5]2+ and [Fe(IV)(OH)(H2O)5]3+ complexes (B).
Figure 14. Calculated valence to core spectra for Fe(IV)-O andFe(IV)-OH Compound II derivatives.
Figure 15. Active site models for Fe(IV)-O (top) and Fe(IV)-OH(bottom) Compound II derivatives. The structures (100 and 101 atoms,respectively) were optimized with the PBE functional and the SV(P) basisset.
intensity of the valence to core satellite is predicted, indicatingthat these two possibilities should be readily distinguished.However, these predictions await experimental verification.
Conclusions
A systematic experimental as well as computational studyof the K� XES spectra for a series of ferrous and ferriccomplexes has been presented. The K� main line spectra aredominated by spin state contributions, while the valence to corespectra are affected by spin state, oxidation state, and coordina-tion environment. Due to the greater spectral sensitivity of thevalence to core region to changes in chemical environment, wehave focused our efforts on understanding this region of thespectra. A straightforward DFT approach has been implemented.The generally good to excellent agreement between experimentand theory has allowed for a more detailed in silico investigationof the contributions to the experimental valence to core spectra.The spectra are dominated by dipole allowed Fe np to 1stransitions and are relatively insensitive to changes in the Fesite symmetry. However, changes in the spin state are shownto have pronounced contributions to both the intensity andenergy distribution of the valence to core spectra. The decreasedintensity of the high-spin complexes primarily derives from thelonger iron-ligand bond lengths, which reduces iron np mixingwith the ligand valence orbitals. The spectra are also shown tohave a strong sensitivity to the ligand identity, showing ligandnp and ns contributions, which are dependent on the identity(O, N, F), hybridization (sp2 vs sp3), and ionization state (O2-,OH-, H2O) of the ligand.
These results indicate that the valence to core region of theXES spectra may have great utility for the examination of iron
active sites in biological systems. The potential for applicationto heme protein intermediates has been discussed and compu-tationally assessed. Key questions as to the identity of the centralatom in nitrogenase and the nature of the O2 binding mode inmethane monooxygenase could be addressed and are the subjectof ongoing studies in our laboratories. These applications clearlyextend beyond iron active sites, where parallel developmentsfor other transition metal active sites could answer key questionsin biological and chemical catalysis.
Acknowledgment. We thank Prof. F. Ann Walker (Universityof Arizona) for kindly providing the [Fe(III)(tpp)(ImH)2]Cl2 samplefor XES measurements. S.D. thanks the Department of Chemistryand Chemical Biology at Cornell University for generous financialsupport. F.N. gratefully acknowledges financial support from theUniversity of Bonn, the Max-Planck society (via a “Max-Planckfellowship” to F.N.), and the SFB 813 ‘Chemistry at spin centers’.Portions of this research were carried out at the Stanford Synchro-tron Radiation Lightsource, a national user facility operated byStanford University on behalf of the U.S. Department of Energy,Office of Basic Energy Sciences. The SSRL Structural MolecularBiology Program is supported by the Department of Energy, Officeof Biological and Environmental Research, and by the NationalInstitutes of Health, National Center for Research Resources,Biomedical Technology Program.
Supporting Information Available: Representative fits to thevalence to core spectra. This material is available free of chargevia the Internet at http://pubs.acs.org.
JA101281E
J. AM. CHEM. SOC. 9 VOL. 132, NO. 28, 2010 9727
Probing Valence Orbital Composition with Iron K� XES A R T I C L E S