Problem of Salinity in Coastal Aquifers of Tunisia DR. MOHAMED FETHI BEN HAMOUDA Fulbright Visiting Scholar Division of Earth and Ocean Sciences Duke University, NC, USA CNSTN, Isotope Hydrology and Geochemistry Unit, Tunisia Kelibia Beach, Tunisia University of Hawaii, Manoa Honolulu, April 2, 2015 1
Transcript
Problem of Salinity in Coastal Aquifers of Tunisia
DR. MOHAMED FETHI BEN HAMOUDA
Fulbright Visiting Scholar Division of Earth and Ocean Sciences
Duke University, NC, USA
CNSTN, Isotope Hydrology and Geochemistry Unit, Tunisia
Kelibia Beach, Tunisia
University of Hawaii, Manoa Honolulu, April 2, 2015
1
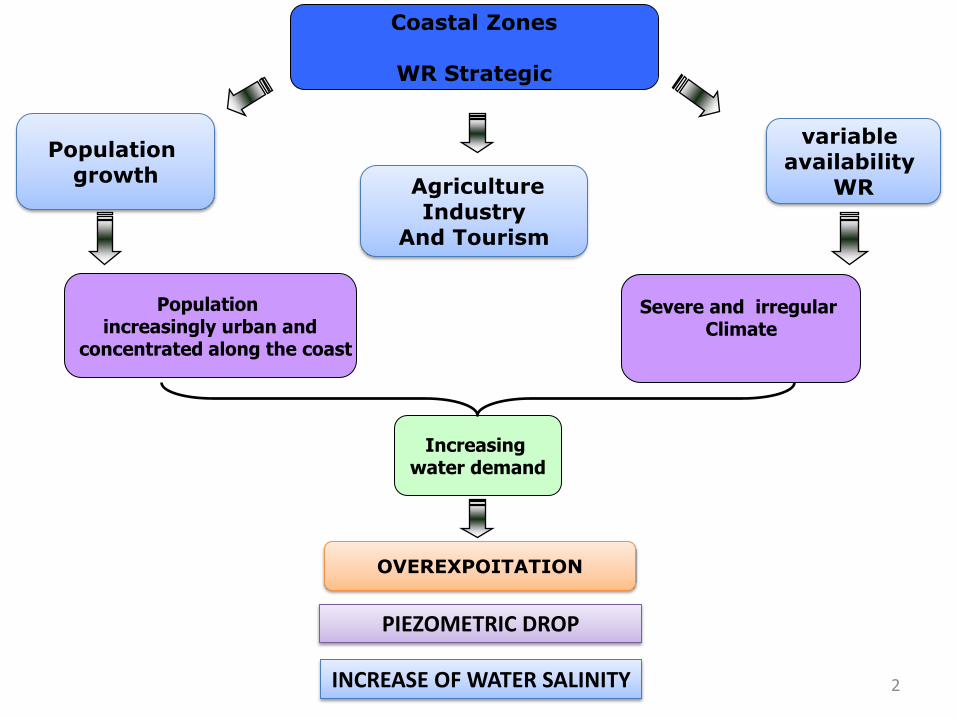
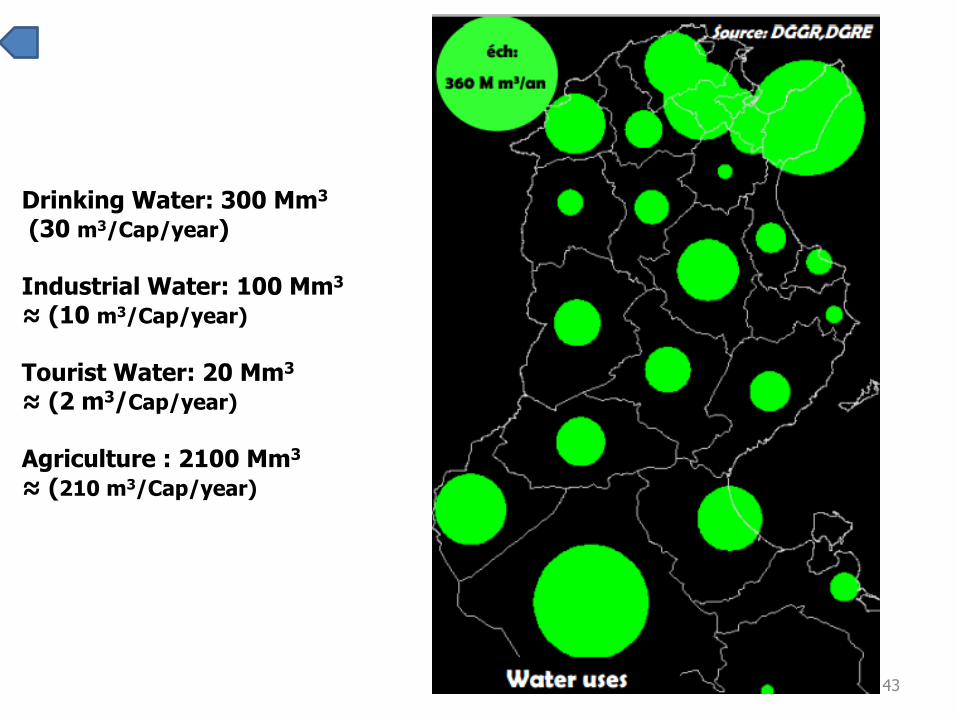
Agriculture Industry
And Tourism
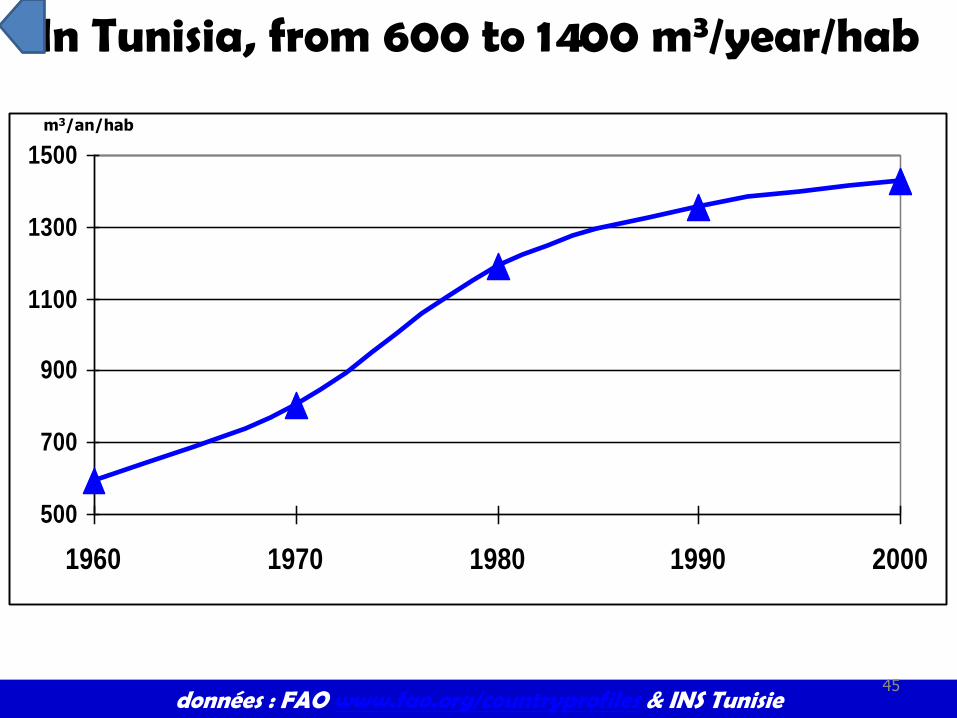
Population growth
Severe and irregular Climate
Coastal Zones
WR Strategic
Population increasingly urban and
concentrated along the coast
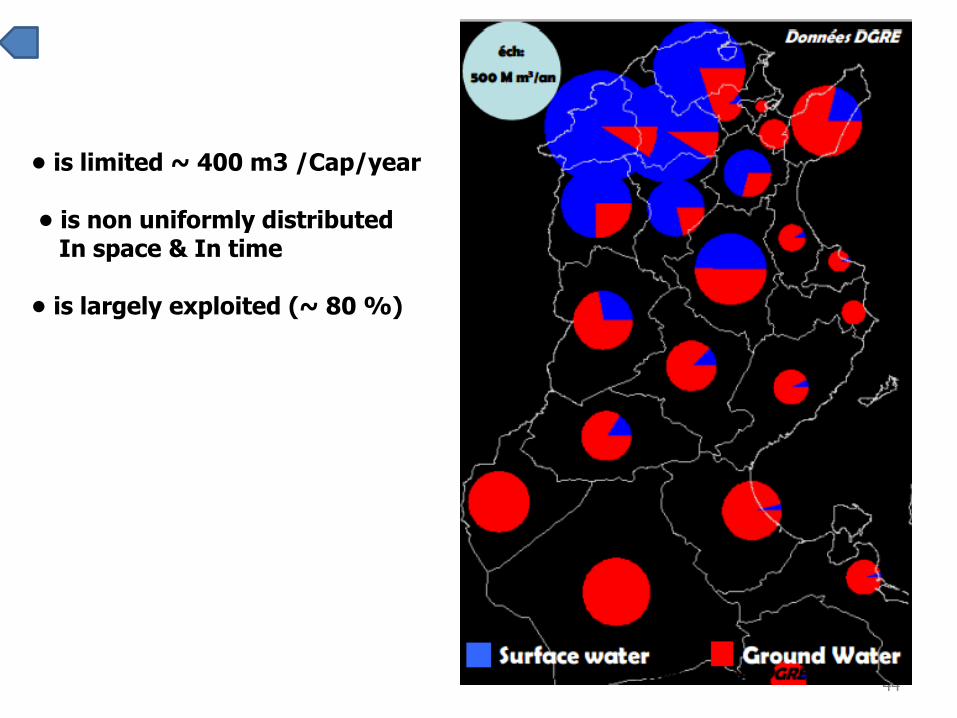
variable availability
WR
Increasing water demand
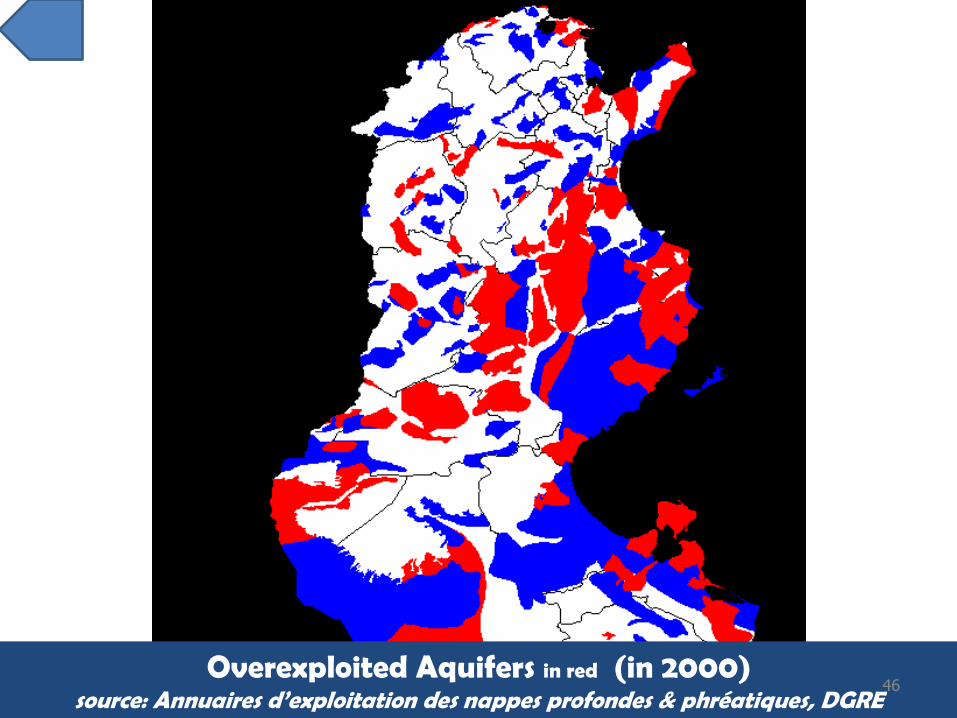
OVEREXPOITATION
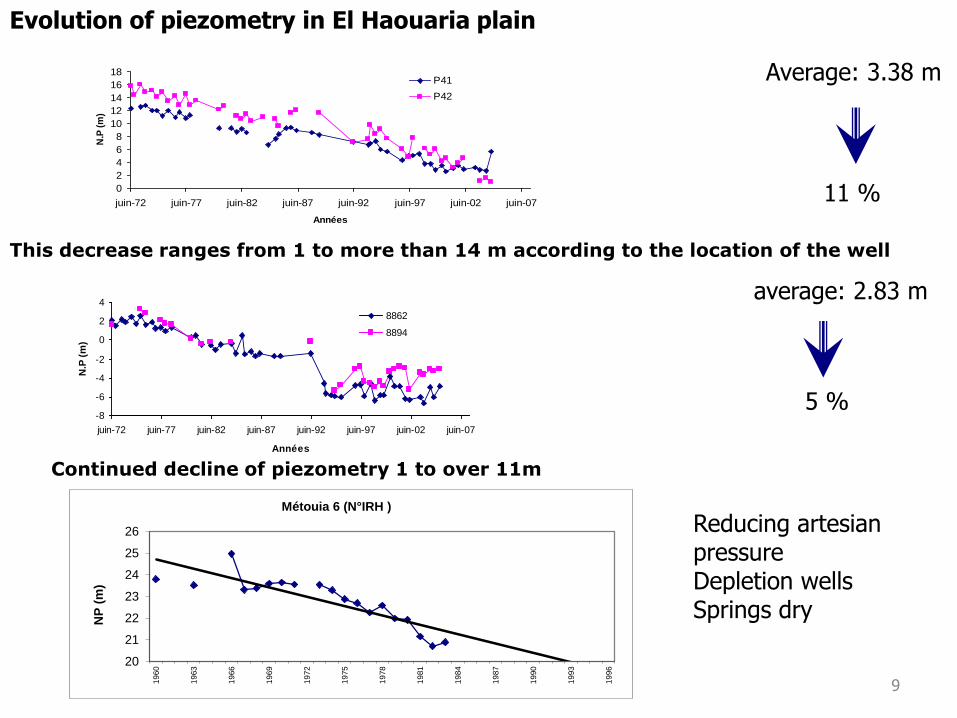
PIEZOMETRIC DROP
INCREASE OF WATER SALINITY 2
3
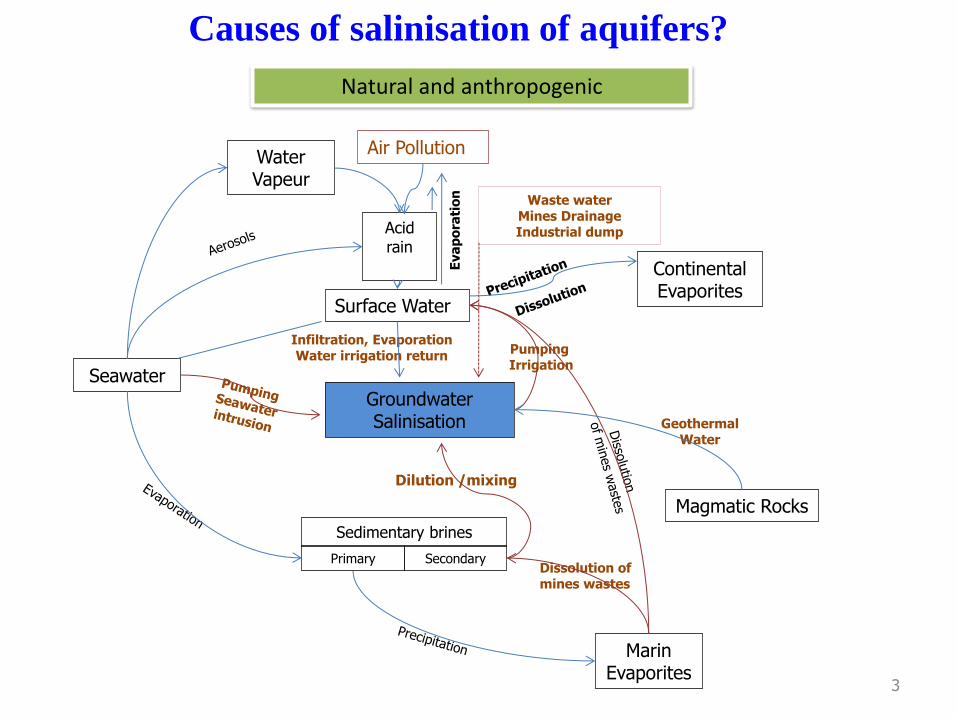
Seawater
Water Vapeur
Air Pollution
Waste water Mines Drainage Industrial dump
Groundwater Salinisation
Eva
po
rati
on
Surface Water
Marin Evaporites
Sedimentary brines
Primary Secondary
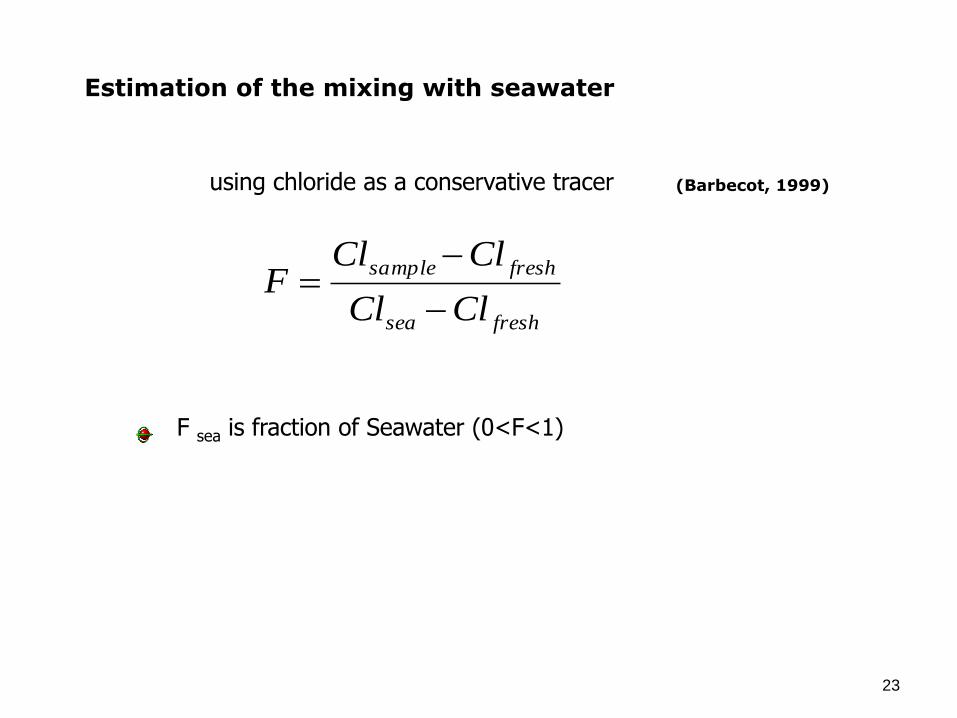
Dilution /mixing
Acid rain
Continental Evaporites
Pumping Irrigation
Dissolution of mines wastes
Geothermal Water
Infiltration, Evaporation Water irrigation return
Magmatic Rocks
Causes of salinisation of aquifers?
Natural and anthropogenic
4
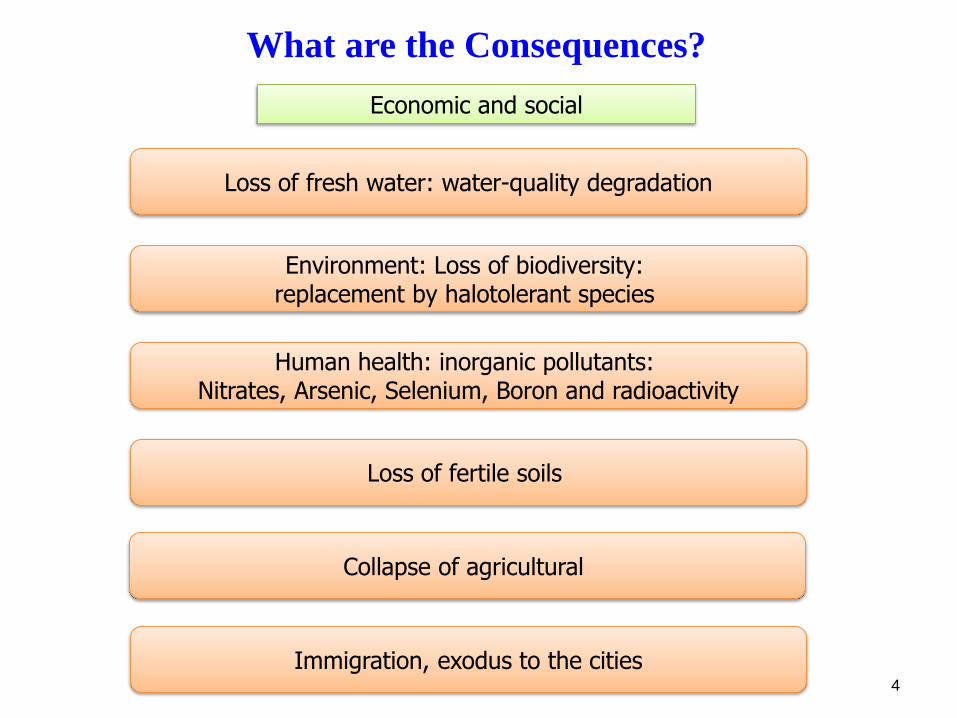
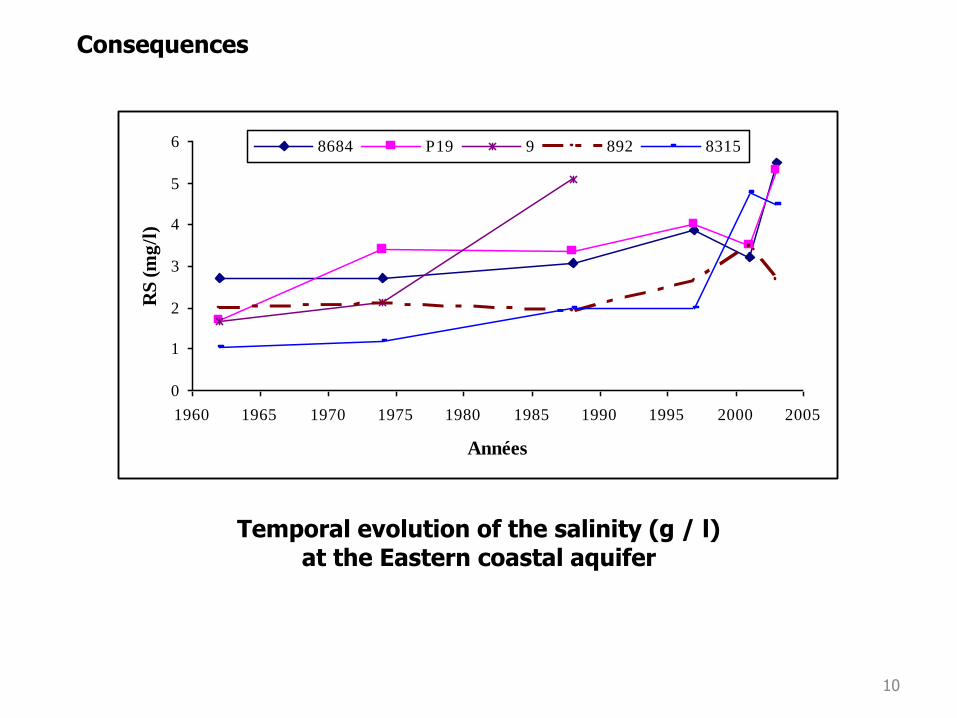
What are the Consequences?
Environment: Loss of biodiversity: replacement by halotolerant species
Human health: inorganic pollutants:
Nitrates, Arsenic, Selenium, Boron and radioactivity
Immigration, exodus to the cities
Loss of fertile soils
Collapse of agricultural
Loss of fresh water: water-quality degradation
Economic and social
5
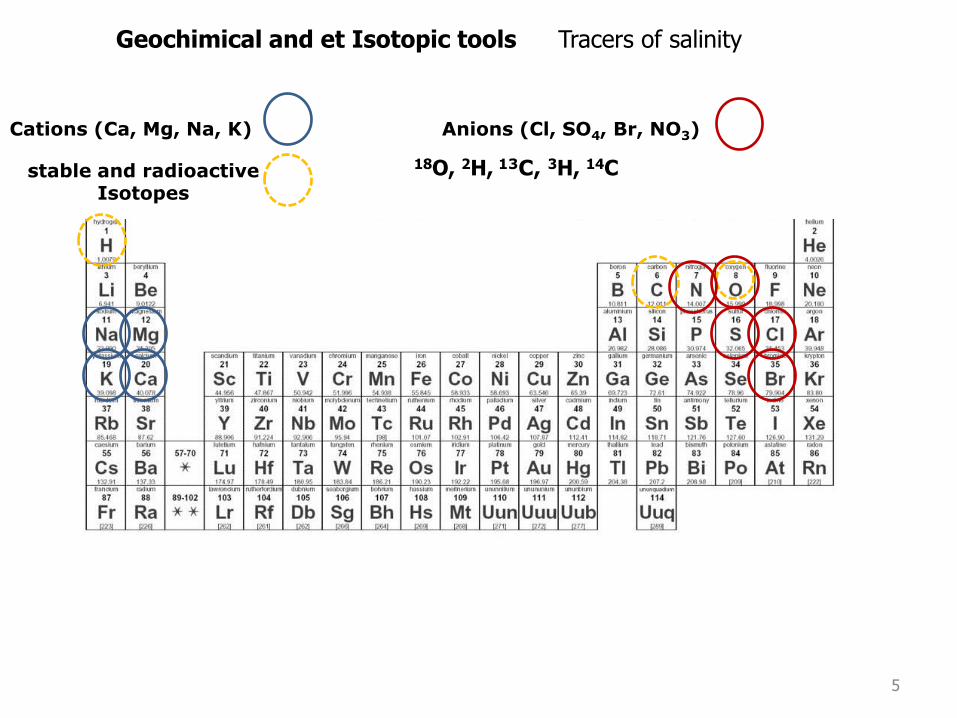
Geochimical and et Isotopic tools Tracers of salinity
Cations (Ca, Mg, Na, K) Anions (Cl, SO4, Br, NO3)
stable and radioactive Isotopes
18O, 2H, 13C, 3H, 14C
6
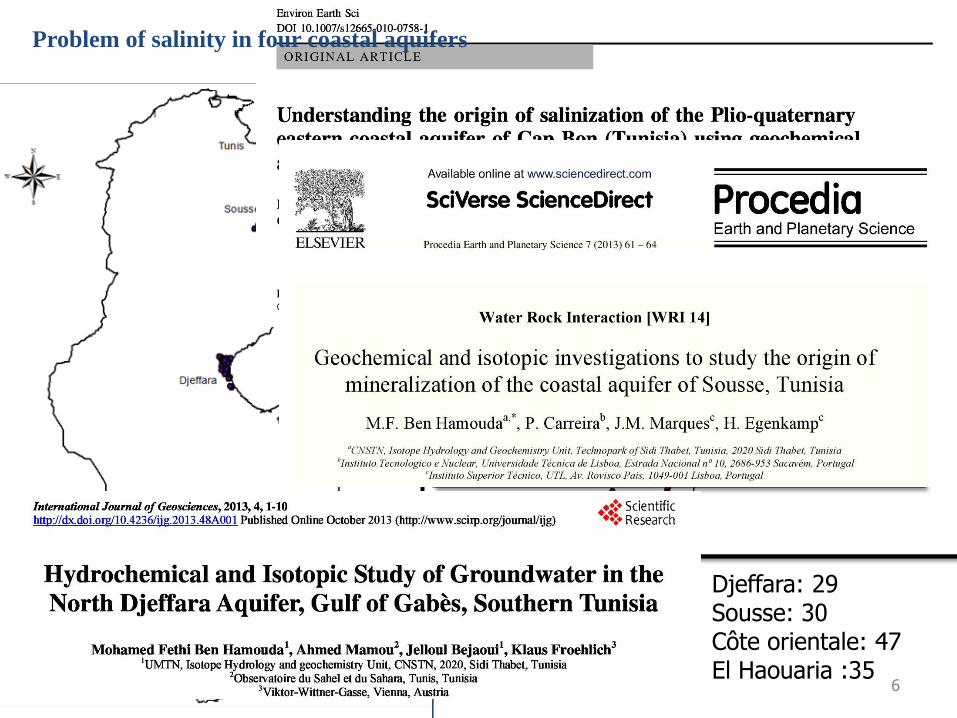
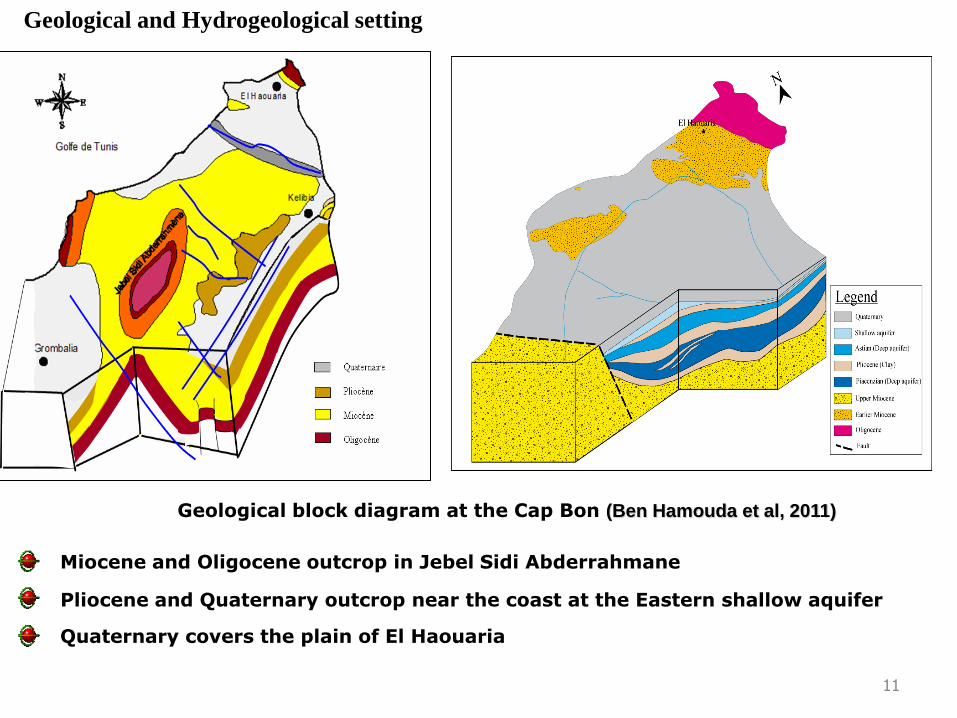
Sampling and measurement
Djeffara: 29 Sousse: 30 Côte orientale: 47 El Haouaria :35
Problem of salinity in four coastal aquifers
7
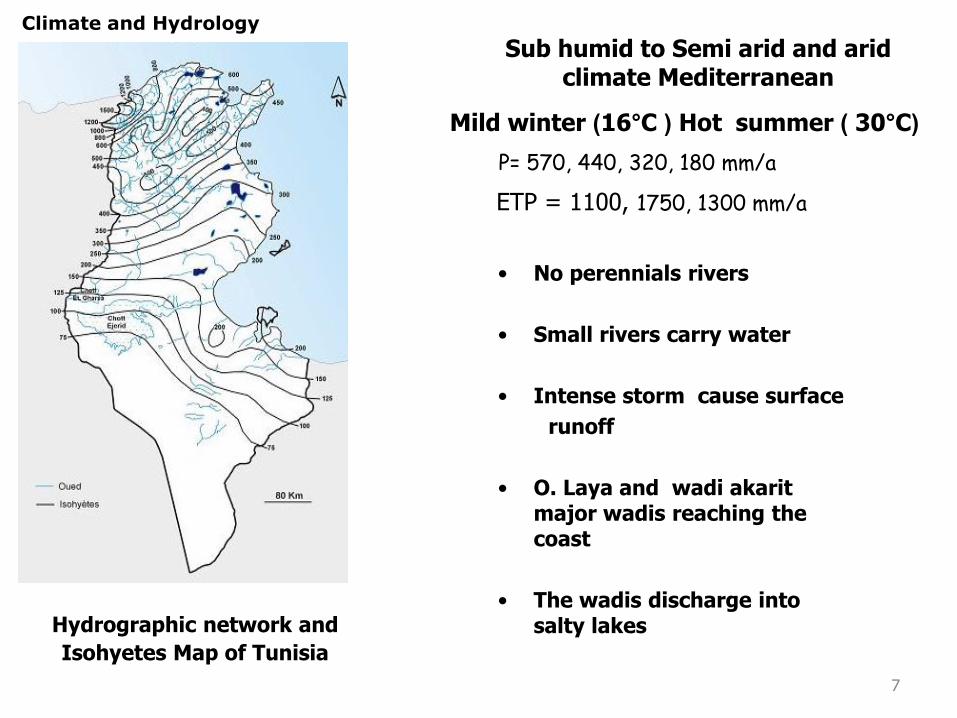
Climate and Hydrology
ETP = 1100, 1750, 1300 mm/a
P= 570, 440, 320, 180 mm/a
Sub humid to Semi arid and arid climate Mediterranean
(30°C )summer Hot (16°C ) Mild winter
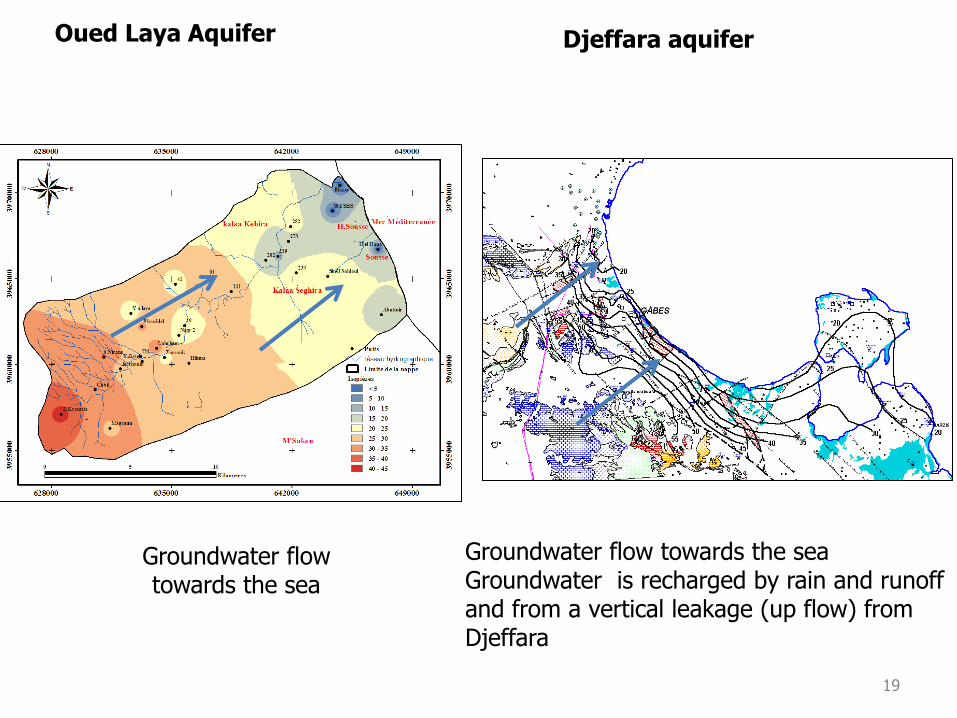
• No perennials rivers
• Small rivers carry water
• Intense storm cause surface
runoff
• O. Laya and wadi akarit major wadis reaching the coast
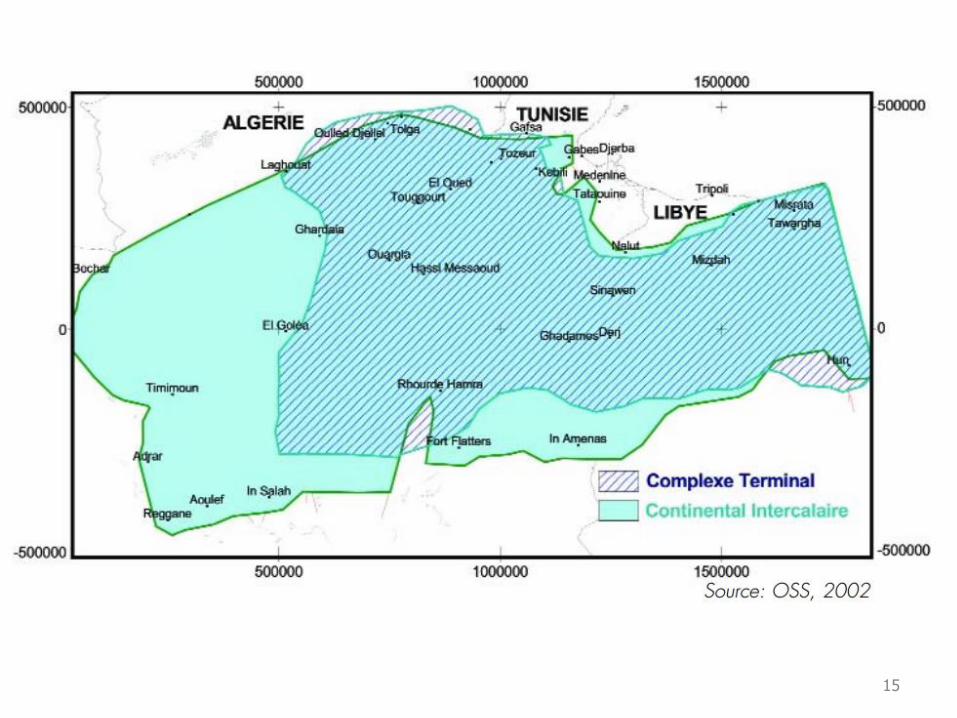
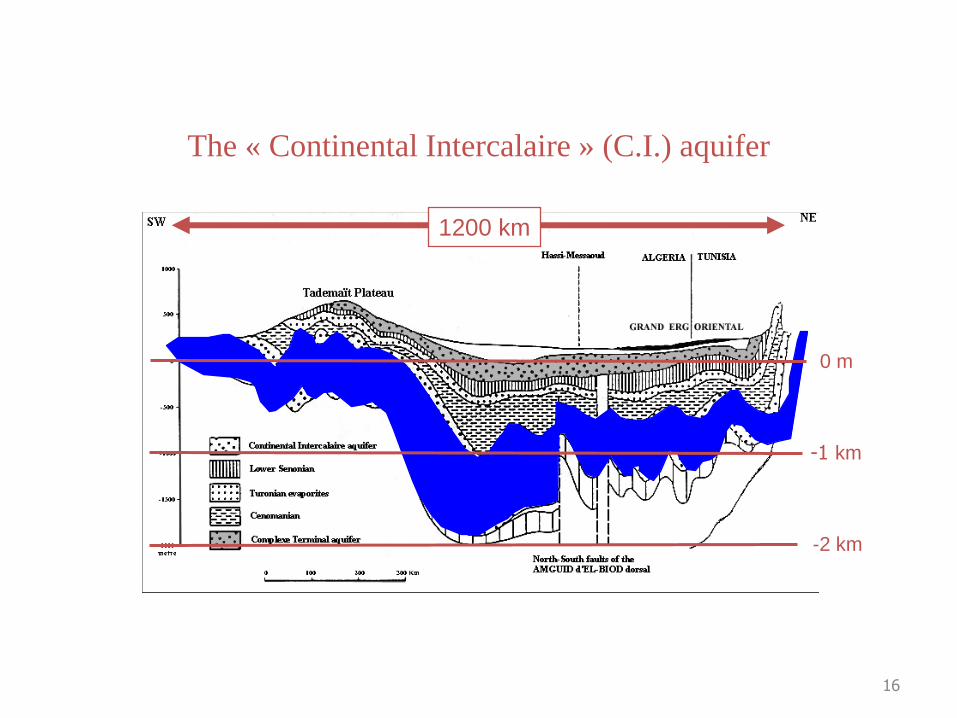
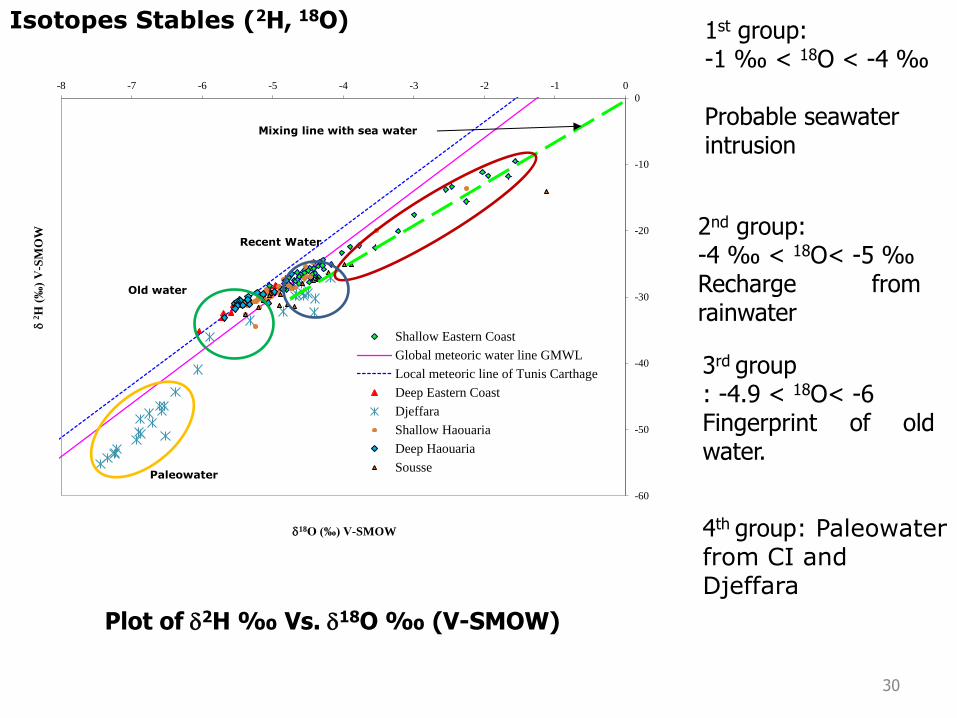
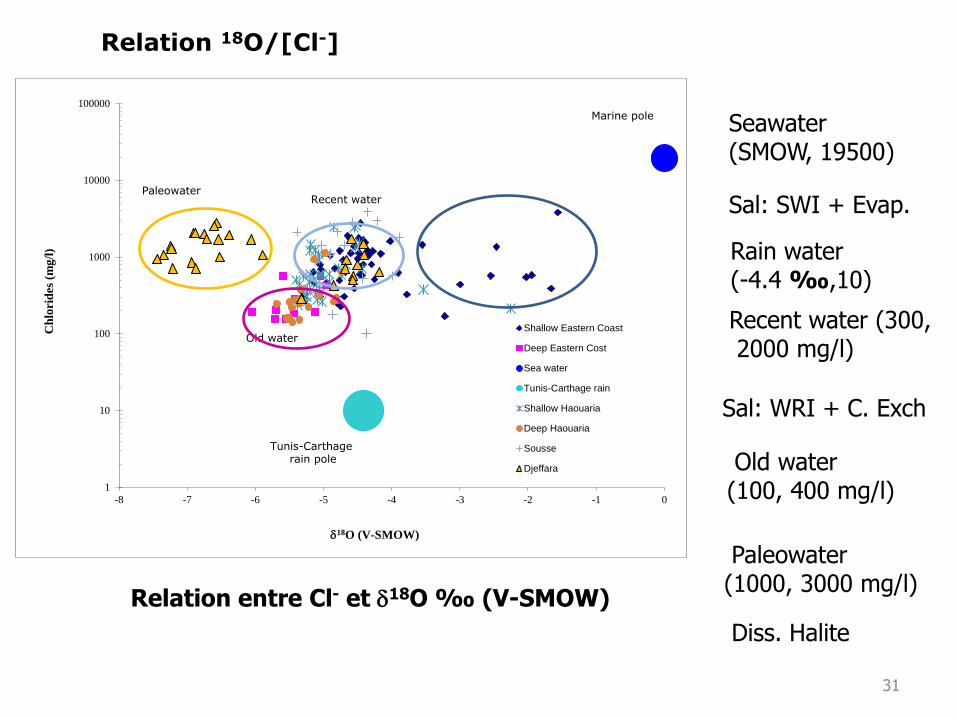
3rd group : -4.9 < 18O< -6 Fingerprint of old water.
4th group: Paleowater from CI and Djeffara
Plot of d2H ‰ Vs. d18O ‰ (V-SMOW)
30
31
Old water (100, 400 mg/l)
Seawater (SMOW, 19500)
Recent water (300, 2000 mg/l)
Sal: SWI + Evap.
Sal: WRI + C. Exch
Relation entre Cl- et d18O ‰ (V-SMOW)
1
10
100
1000
10000
100000
-8 -7 -6 -5 -4 -3 -2 -1 0
Ch
lori
des
(m
g/l
)
d18O (V-SMOW)
Shallow Eastern Coast
Deep Eastern Cost
Sea water
Tunis-Carthage rain
Shallow Haouaria
Deep Haouaria
Sousse
Djeffara
Marine pole
Tunis-Carthage rain pole
Old water
Recent water Paleowater
Relation 18O/[Cl-]
Paleowater (1000, 3000 mg/l)
Diss. Halite
Rain water (-4.4 ‰,10)
32
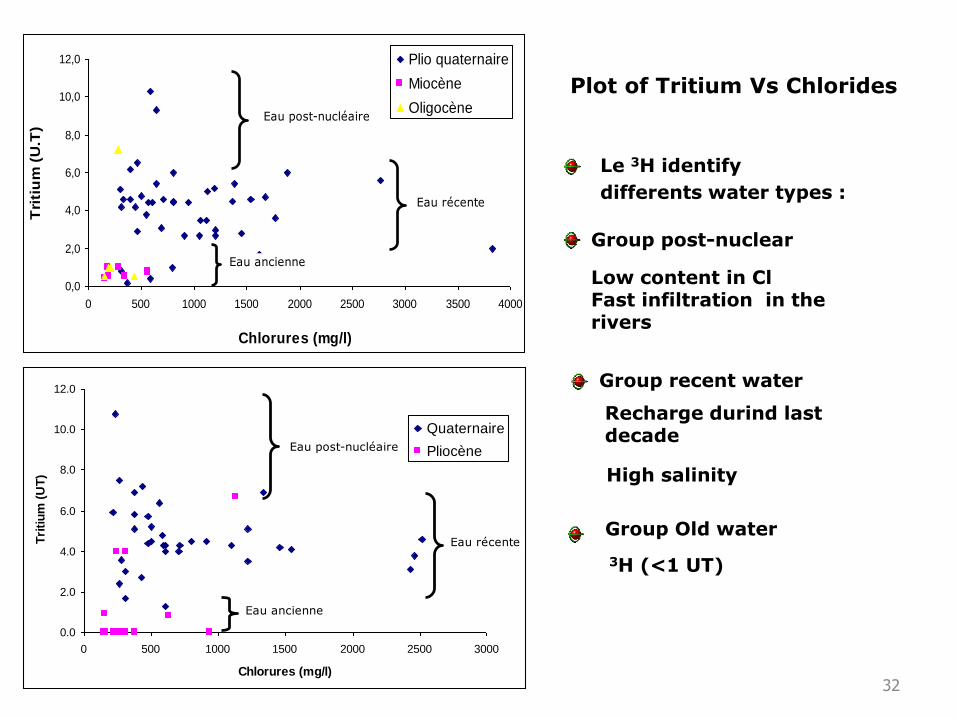
Plot of Tritium Vs Chlorides
0,0
2,0
4,0
6,0
8,0
10,0
12,0
0 500 1000 1500 2000 2500 3000 3500 4000
Chlorures (mg/l)
Tri
tiu
m (
U.T
)
Plio quaternaire
Miocène
Oligocène
Eau ancienne
Eau récente
Eau post-nucléaire
Group post-nuclear
Recharge durind last decade
Group recent water
Group Old water
0.0
2.0
4.0
6.0
8.0
10.0
12.0
0 500 1000 1500 2000 2500 3000
Chlorures (mg/l)
Tri
tiu
m (
UT
)
Quaternaire
Pliocène
Eau ancienne
Eau récente
Eau post-nucléaire
Le 3H identify
differents water types :
Low content in Cl Fast infiltration in the rivers
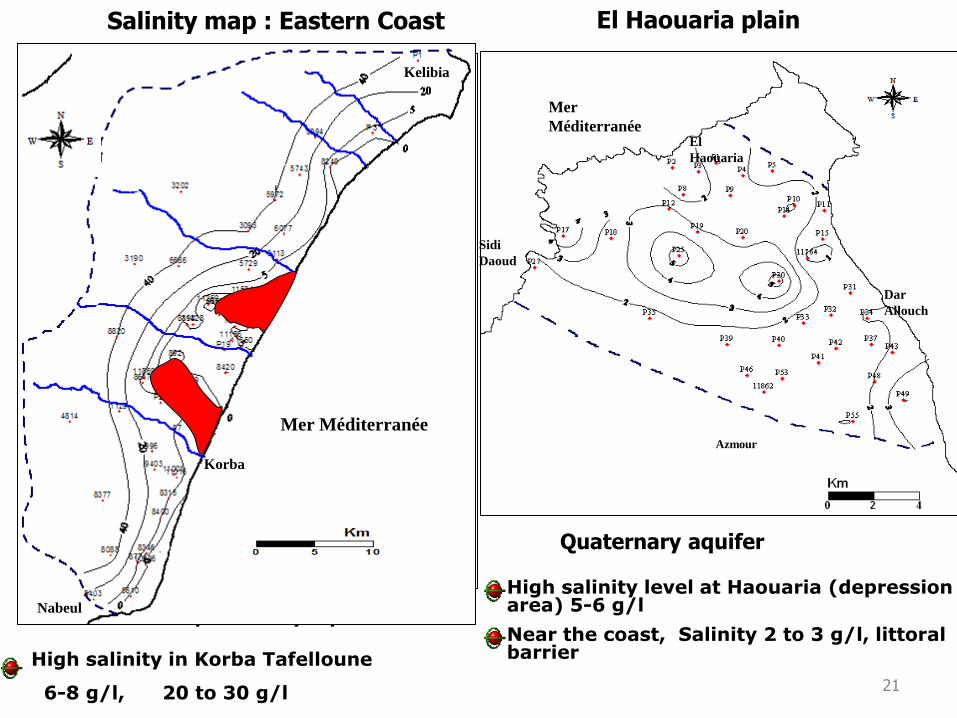
High salinity
3H (<1 UT)
0.0
1.0
2.0
3.0
4.0
5.0
6.0
-8.00 -7.00 -6.00 -5.00 -4.00 -3.00 -2.00
Oxygen-18 )‰(
3H
(T
U)
GAB 4
GAB 10a
GAB 14
GAB 15
GAB 21
all others
10
100
1000
0.1 1 10
Tritium (TU)
MR
T (
years
)
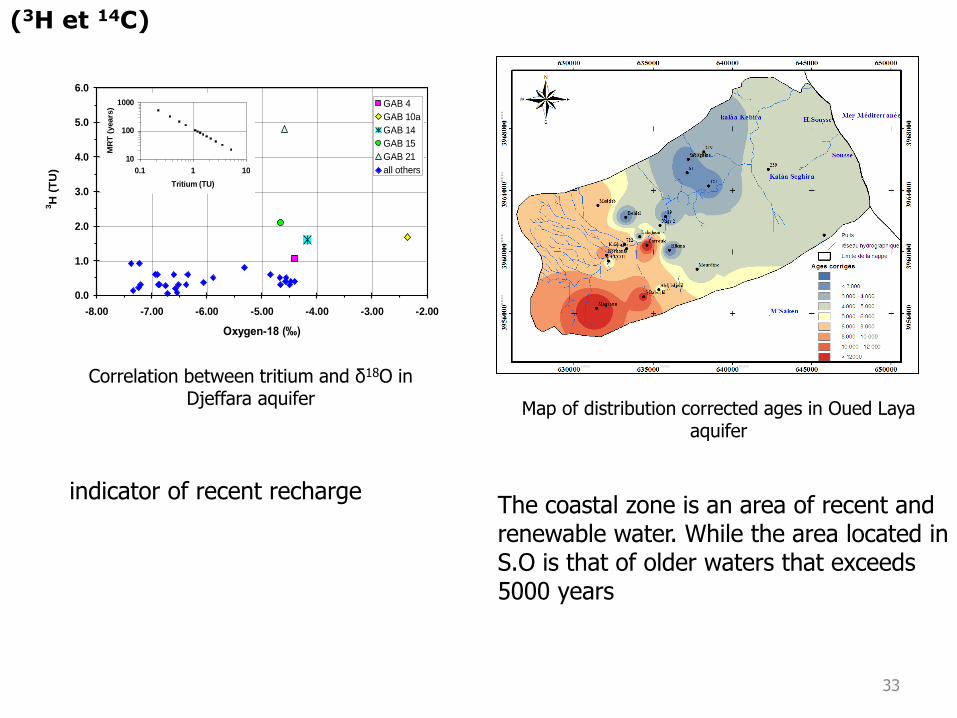
Map of distribution corrected ages in Oued Laya aquifer
(3H et 14C)
indicator of recent recharge
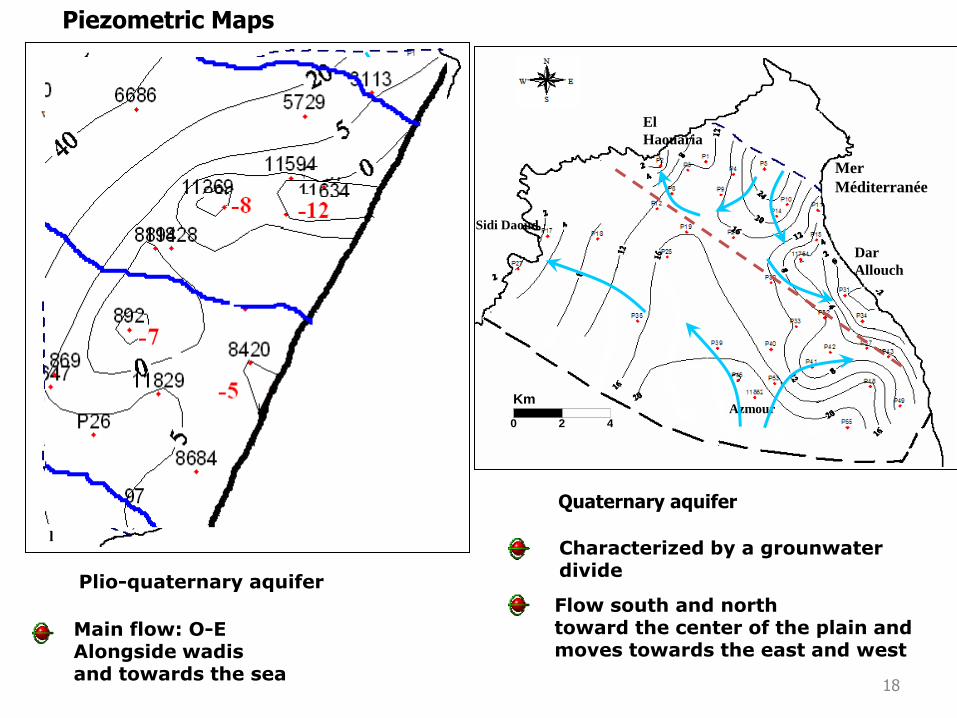
Correlation between tritium and δ18O in Djeffara aquifer
The coastal zone is an area of recent and renewable water. While the area located in S.O is that of older waters that exceeds 5000 years
33
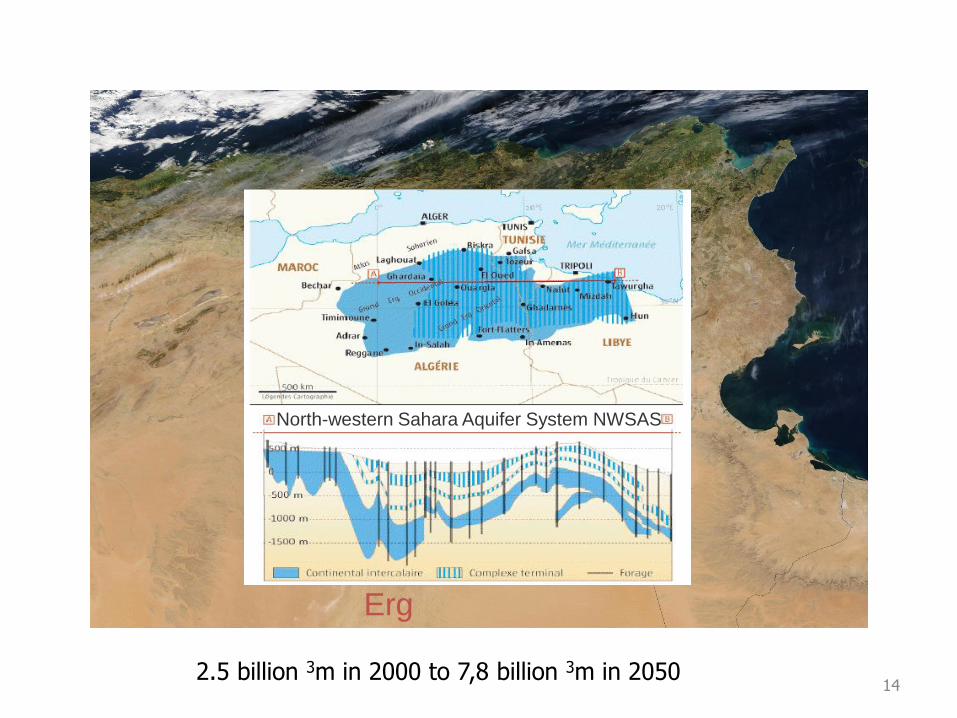
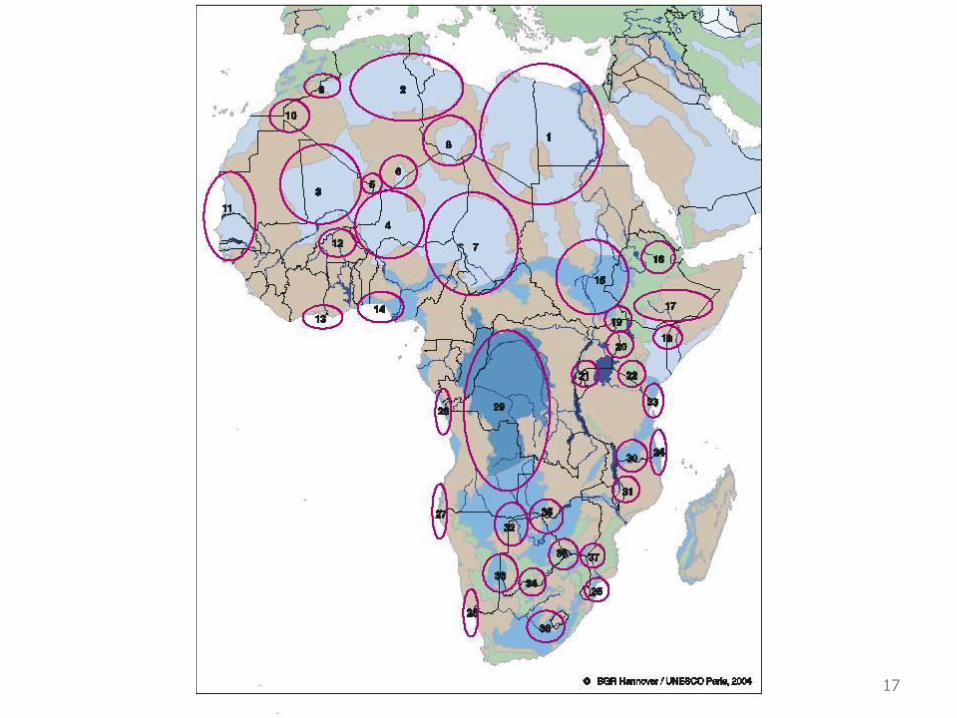
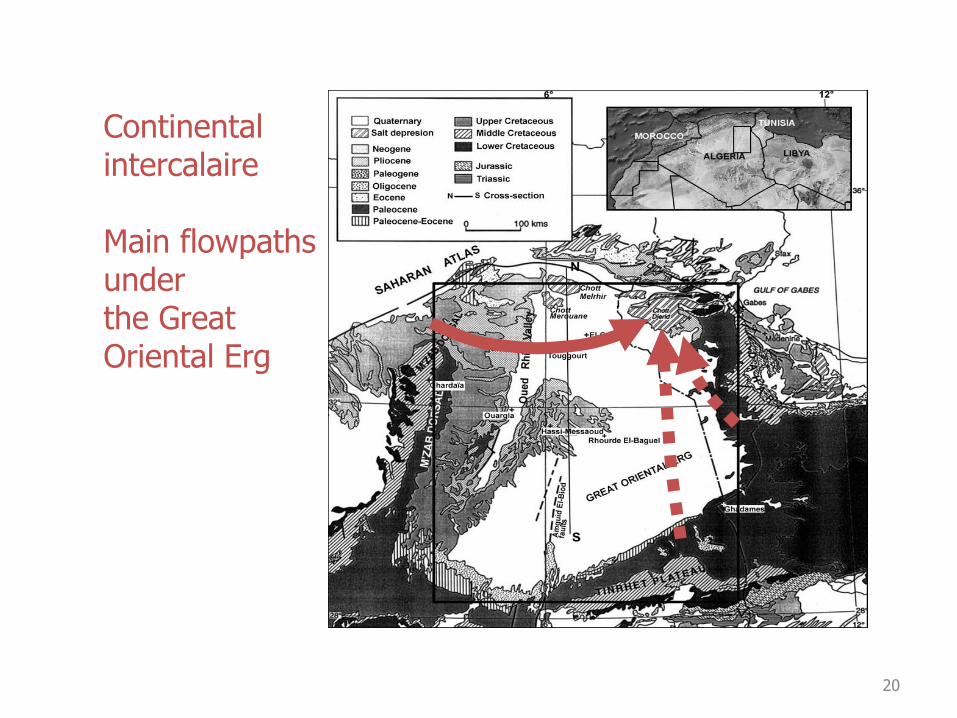
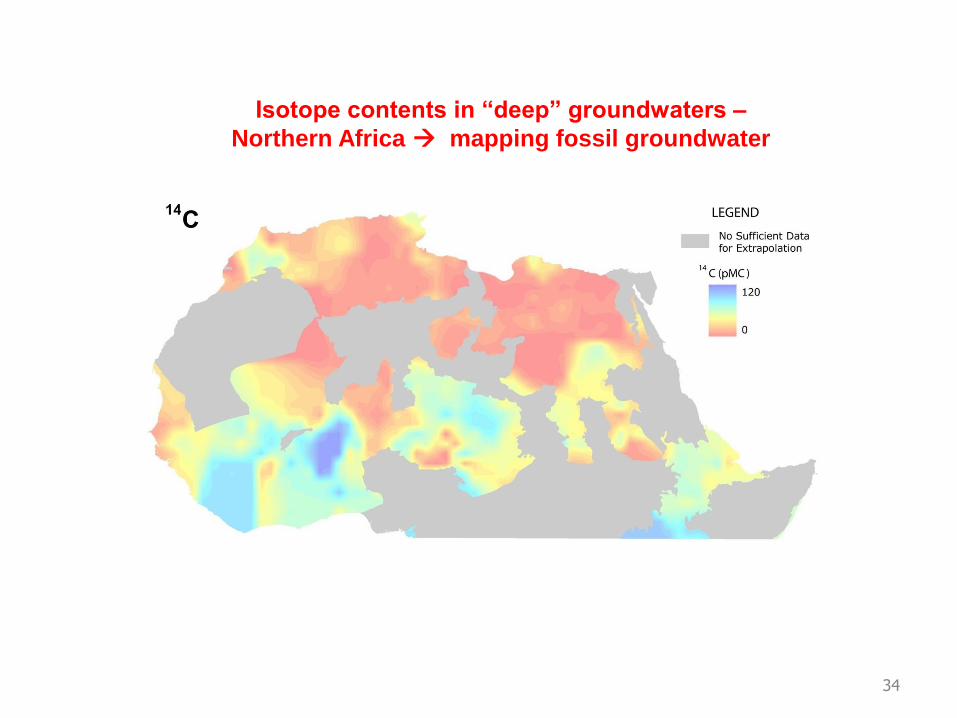
Isotope contents in “deep” groundwaters –
Northern Africa mapping fossil groundwater
34
35
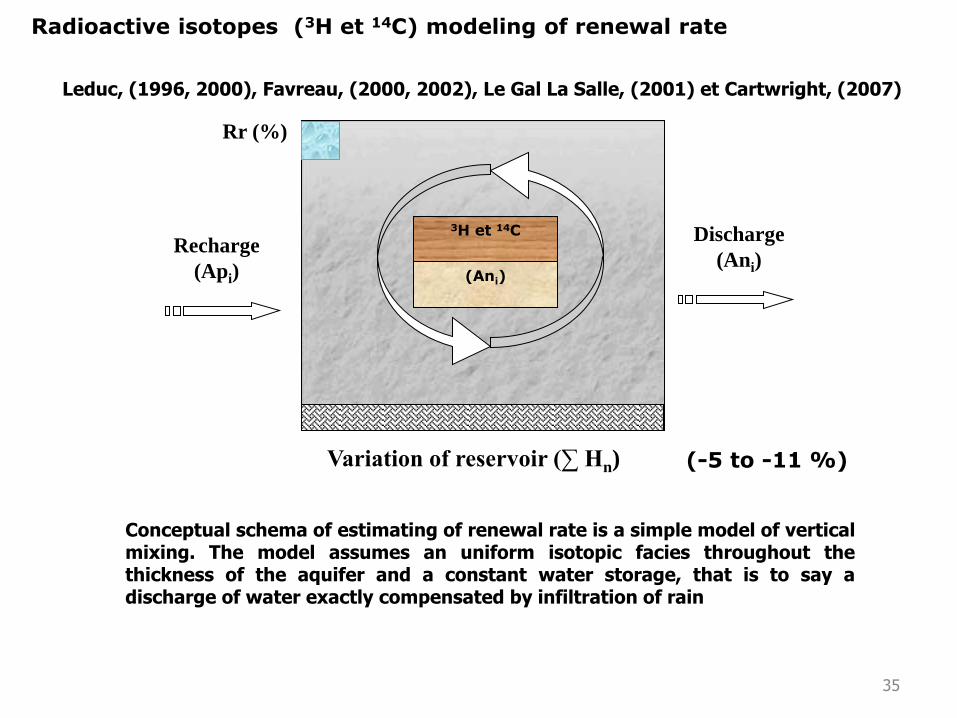
Rr (%)
Recharge
(Api)
Discharge
(Ani)
3H et 14C
(Ani)
Variation of reservoir (∑ Hn) (-5 to -11 %)
Conceptual schema of estimating of renewal rate is a simple model of vertical mixing. The model assumes an uniform isotopic facies throughout the thickness of the aquifer and a constant water storage, that is to say a discharge of water exactly compensated by infiltration of rain
Radioactive isotopes (3H et 14C) modeling of renewal rate
Leduc, (1996, 2000), Favreau, (2000, 2002), Le Gal La Salle, (2001) et Cartwright, (2007)
36
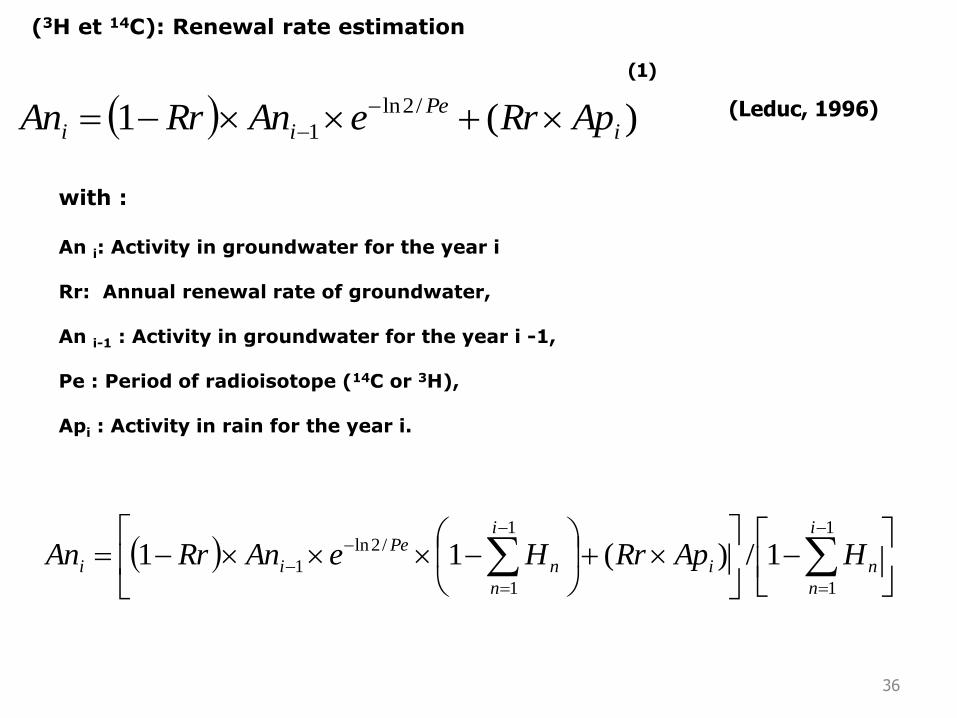
with : An i: Activity in groundwater for the year i Rr: Annual renewal rate of groundwater, An i-1 : Activity in groundwater for the year i -1, Pe : Period of radioisotope (14C or 3H), Api : Activity in rain for the year i.
(1)
(Leduc, 1996) )(1 /2ln
1 i
Pe
ii ApRreAnRrAn
(3H et 14C): Renewal rate estimation
1
1
1
1
/2ln
1 1/)(11i
n
ni
i
n
n
Pe
ii HApRrHeAnRrAn
37
110
100
1000
10000
1950
1960
1970
1980
1990
2000
Tri
tiu
m P
luie
s T
un
is C
art
hage(
UT
)
100
150
200
250
300
14C
Tro
posp
hèr
iqu
e (P
MC
)
Tritium (UT)
Tritium mediane
14C
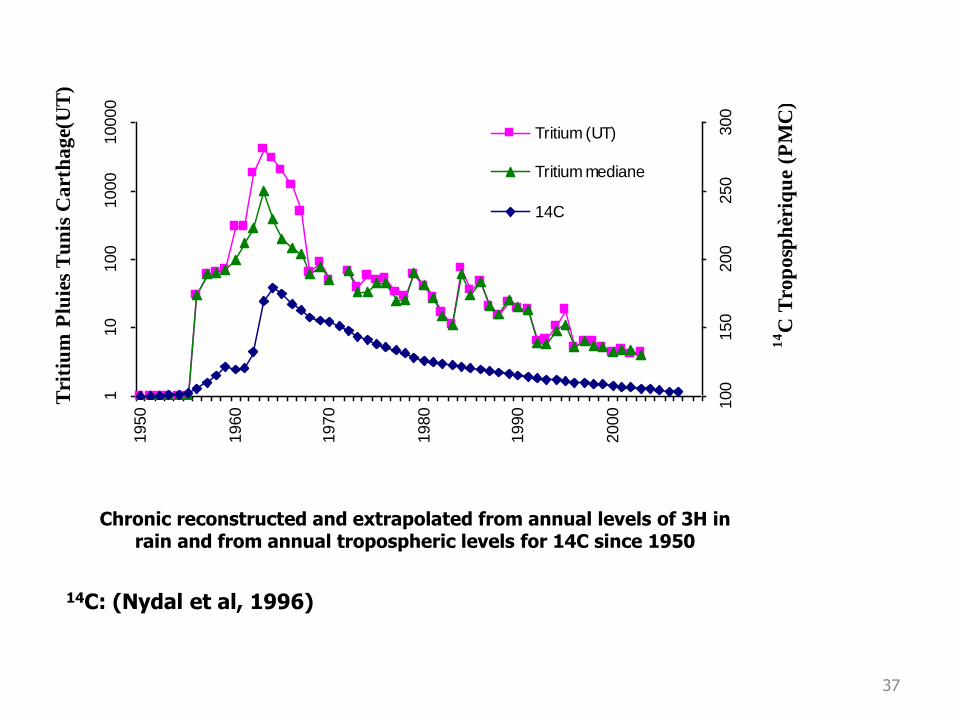
14C: (Nydal et al, 1996)
Chronic reconstructed and extrapolated from annual levels of 3H in rain and from annual tropospheric levels for 14C since 1950
38
0,1
1
10
100
1000
0,01 0,1 1 10 100
Taux de renouvellement annuel Tr (%)
Tri
tiu
m d
an
s la n
ap
pe (
U.T
)
2001
1980
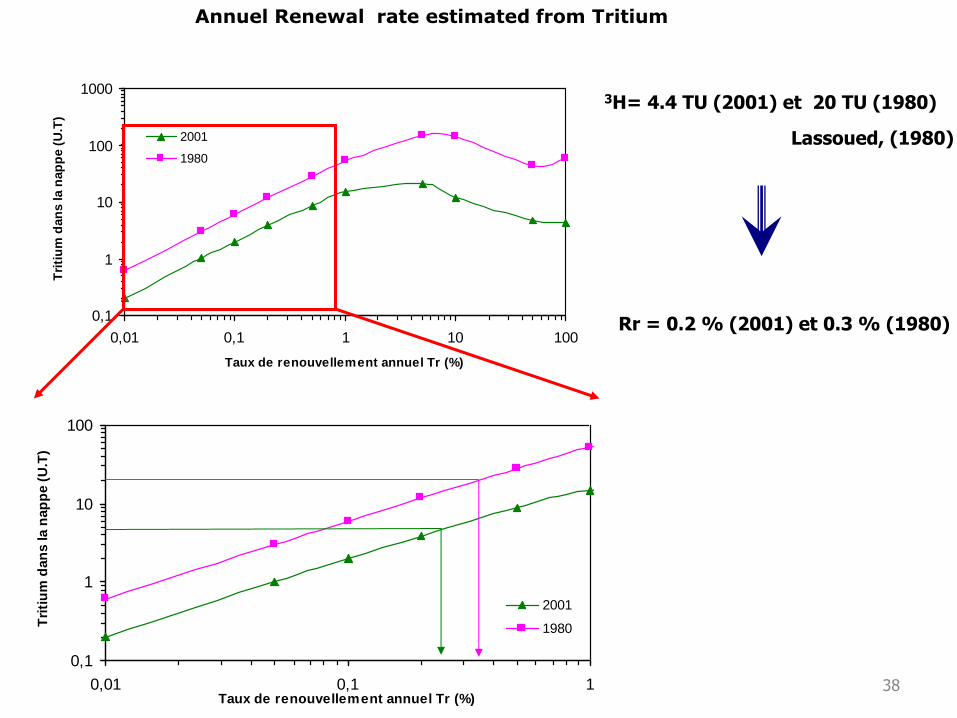
Annuel Renewal rate estimated from Tritium
0,1
1
10
100
0,01 0,1 1Taux de renouvellement annuel Tr (%)
Tri
tiu
m d
an
s la n
ap
pe (
U.T
)
2001
1980
3H= 4.4 TU (2001) et 20 TU (1980)
Rr = 0.2 % (2001) et 0.3 % (1980)
Lassoued, (1980)
39
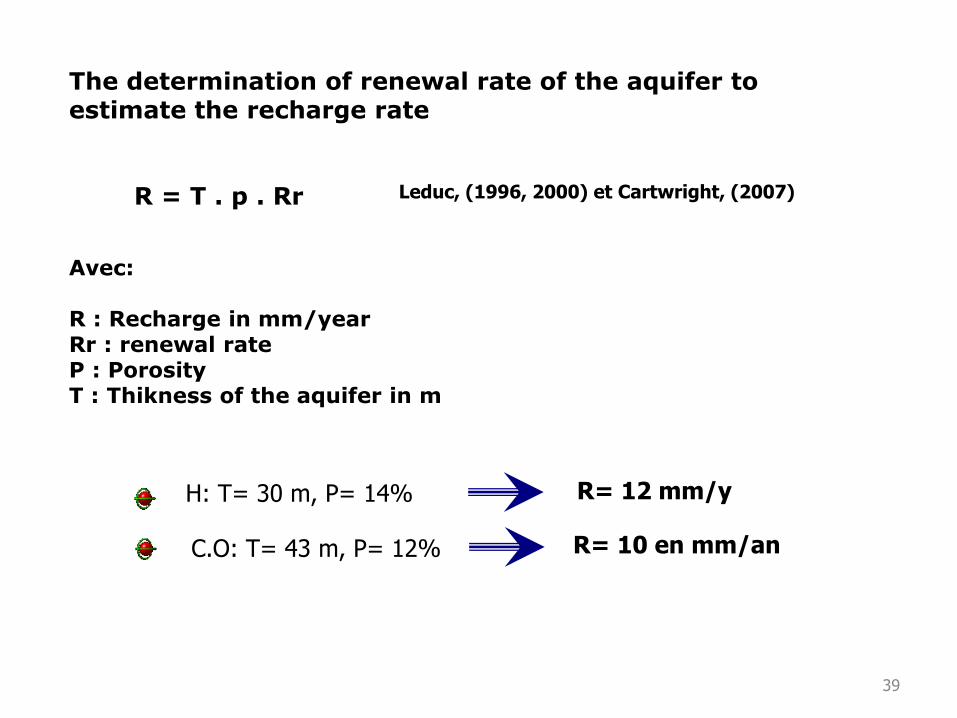
The determination of renewal rate of the aquifer to estimate the recharge rate R = T . p . Rr
Avec: R : Recharge in mm/year Rr : renewal rate P : Porosity T : Thikness of the aquifer in m
H: T= 30 m, P= 14% R= 12 mm/y
Leduc, (1996, 2000) et Cartwright, (2007)
C.O: T= 43 m, P= 12% R= 10 en mm/an
40
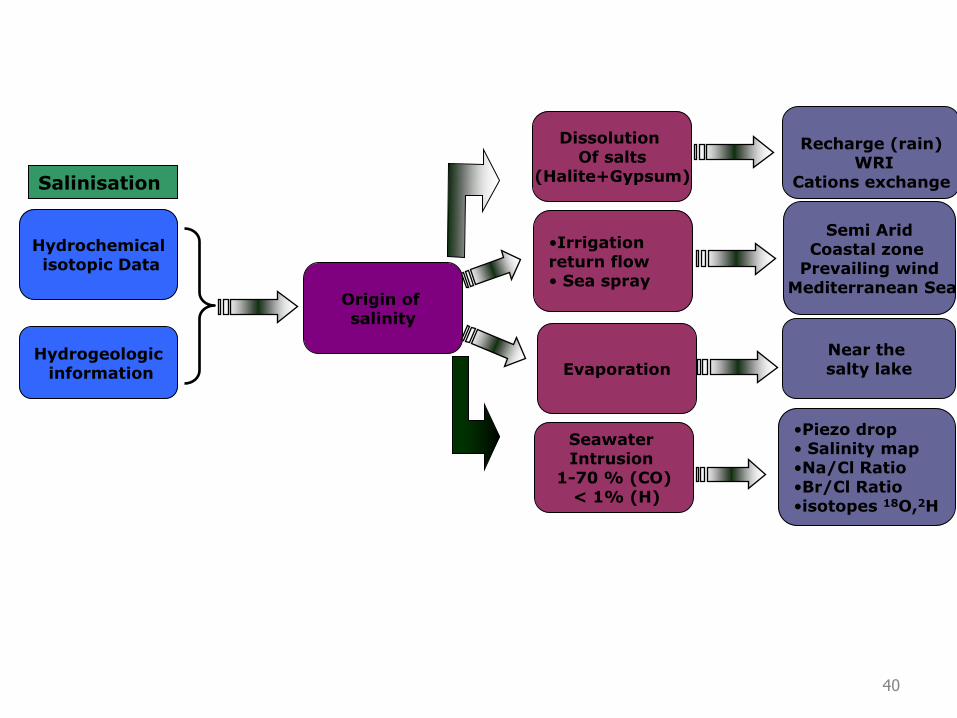
Salinisation
Hydrochemical isotopic Data
Hydrogeologic information
Origin of salinity
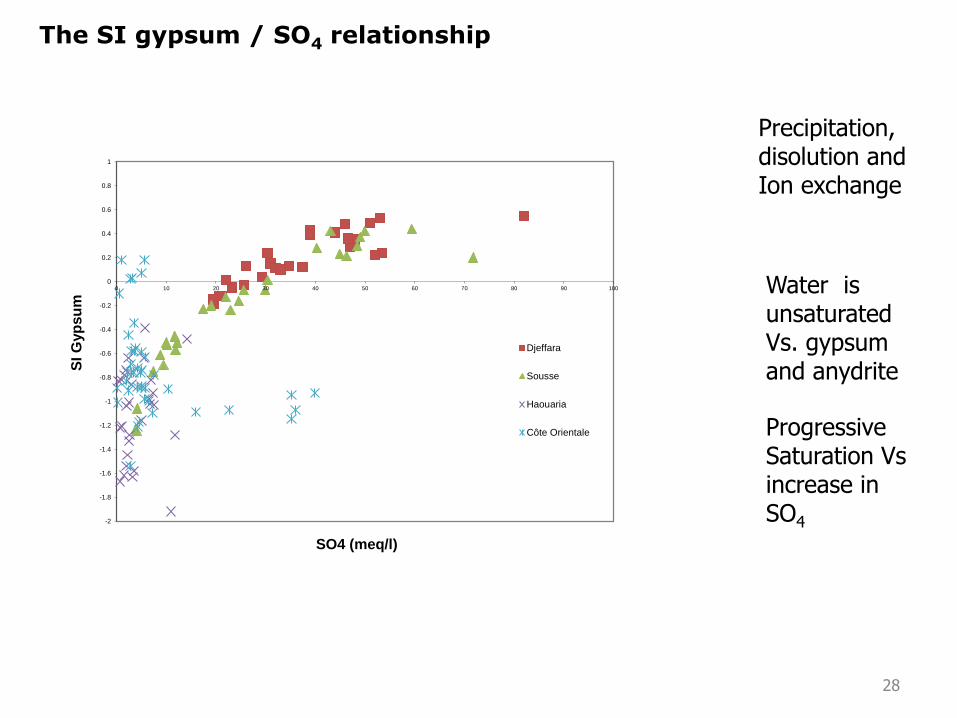
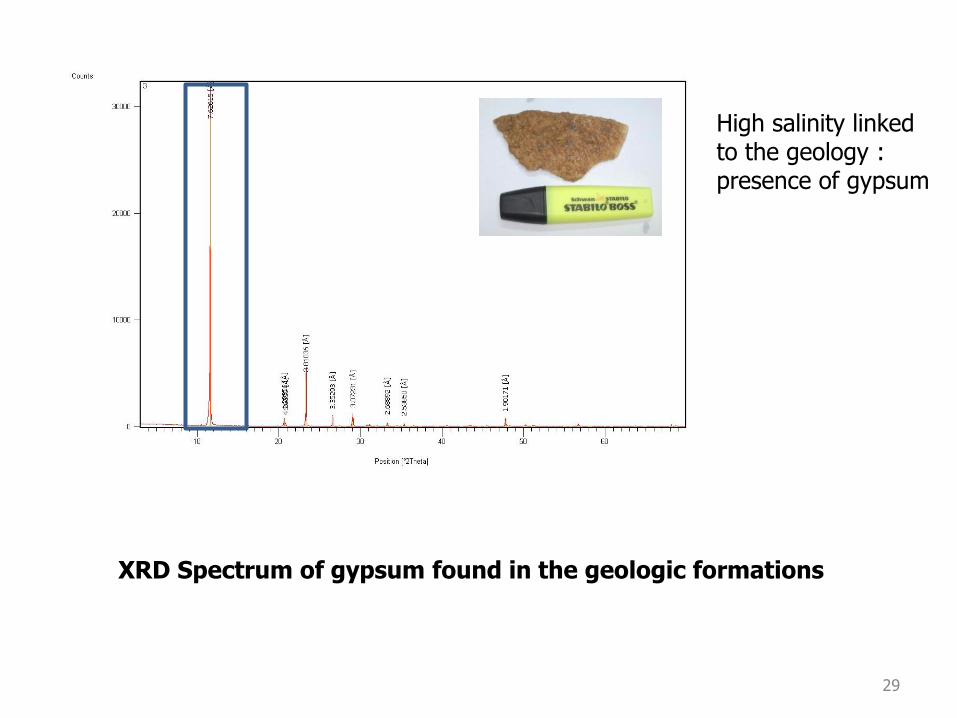
Dissolution Of salts
(Halite+Gypsum)
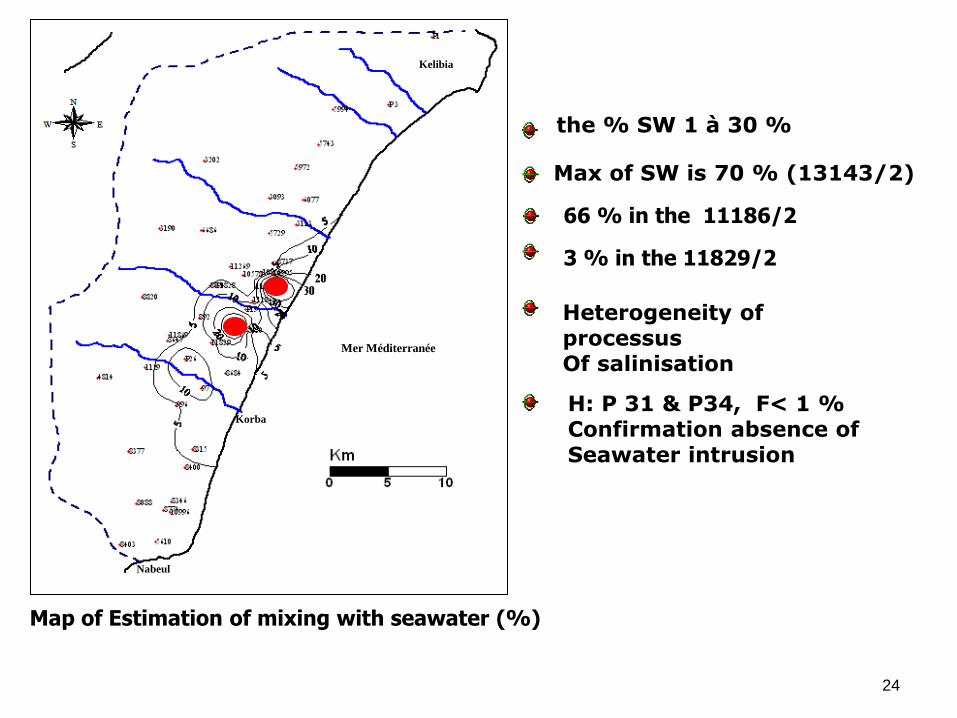
Seawater Intrusion
1-70 % (CO) < 1% (H)
•Irrigation return flow • Sea spray
Semi Arid Coastal zone
Prevailing wind Mediterranean Sea
Recharge (rain) WRI
Cations exchange
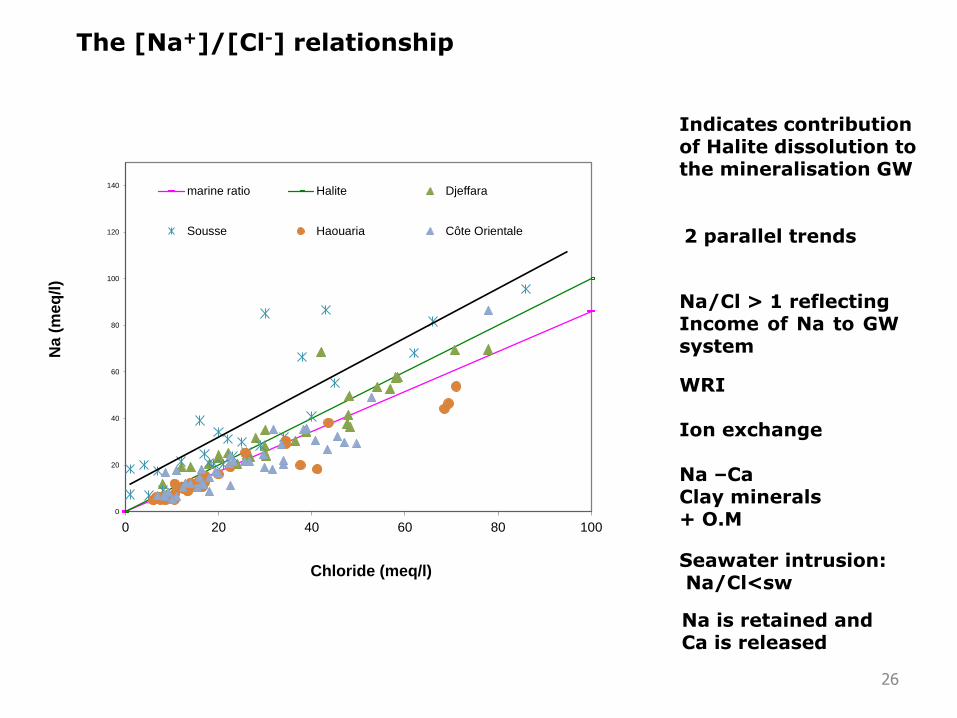
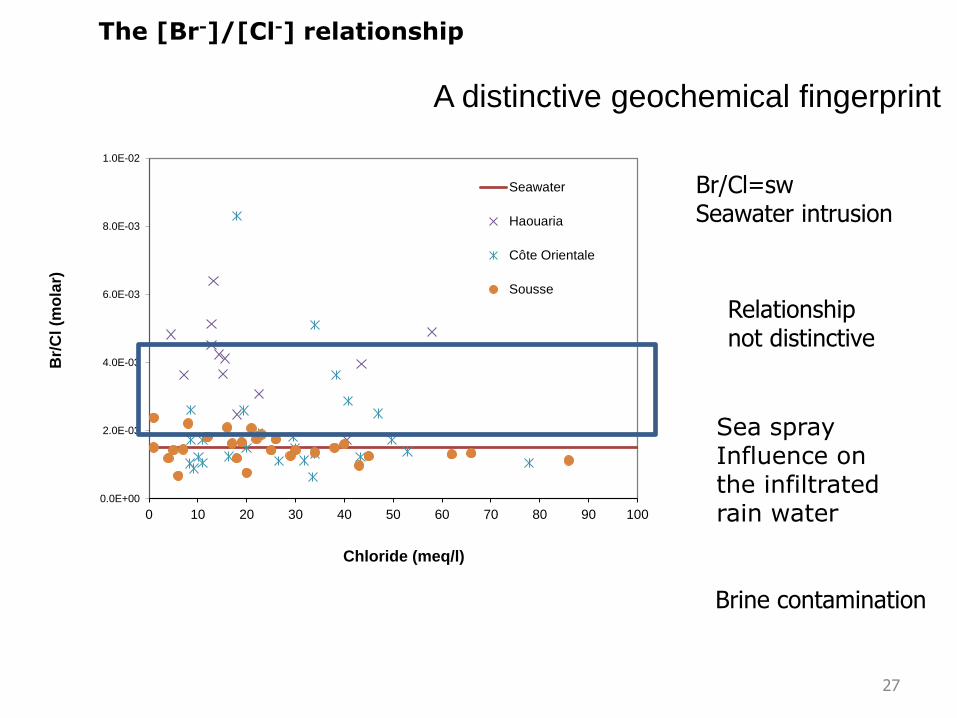
•Piezo drop • Salinity map •Na/Cl Ratio •Br/Cl Ratio •isotopes 18O,2H
Evaporation
Near the salty lake
Thank you !
41
3000
4000
5000
6000
7000
8000
9000
10000
11000
12000
13000195
5196
0196
5197
0197
5198
0198
5199
0199
5200
0200
5201
0201
5202
0202
5203
0203
5204
0204
5205
0205
5206
0206
5
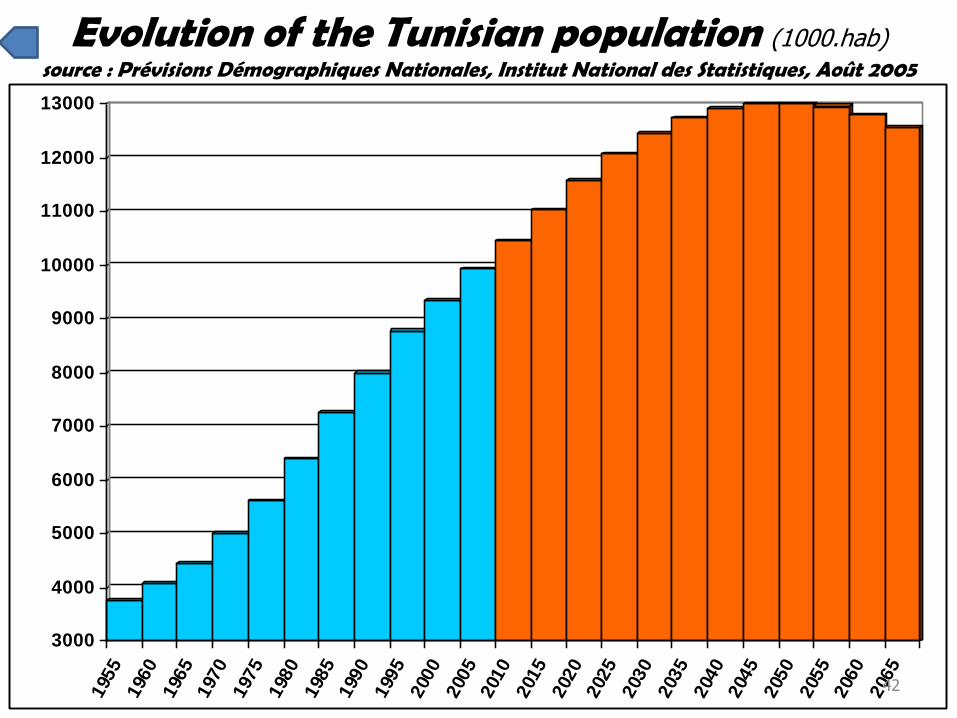
Evolution of the Tunisian population (1000.hab) source : Prévisions Démographiques Nationales, Institut National des Statistiques, Août 2005