25
1 Problematic Materials for Local Government Background paper February 2016

1
Problematic Materials for Local
Government Background paper
February 2016
2
Contents
Executive Summary 3
1 Introductions 5
2 Methodology 5
3 Results of the 2015 Survey 5
Respondents 5
Problematic Wastes 6
Problematic Wastes: metropolitan and non-metropolitan impacts 6
Rationale 7
Mechanisms for address problematic waste 12
Top 3 Priority Products for Product Stewardship 13
Scrap Metal 14
Mattresses 15
Final Comments 16
4 Applying the Criteria from the EPR Policy Statement 16
5 Prioritising materials for action 18
Tyres 18
Asbestos 19
Mattresses 19
E-waste 19
White goods 20
Beverage Containers 20
Household Hazardous Waste 20
Scrap Metal 21
6 Conclusion 23
Appendix A 25

3
Executive Summary
WALGA conducted a survey of Local Government in October 2015 to identify problematic
waste materials, determine why they were problematic and identify areas where action was
needed.
This survey follows on from research conducted in 2012. Some progress has been made,
for some materials, others continue to be an issue for Local Government.
Table 1 summarises the outcomes of the current research.
Problematic product
Suitable for Product Stewardship
Focus of Product Stewardship Scheme
Is a scheme in place?
Actions
Tyres Yes Illegal dumping, disposal/ recycling options
Yes, voluntary scheme in place
Promote Tyre Stewardship Australia and encourage Local Governments to join.
Asbestos No N/A No Continue to advocate for other approaches to managing Asbestos. Including seeking funding to implement the National Strategic Plan for Asbestos Management and Awareness.
Mattresses Maybe Illegal dumping, cost of recycling/disposal and recycling options
No Investigation the current market and product stewardship development for mattresses. Support new operators to enter the market.
Electronic Waste
Yes Cost for recycling, disposal and illegal dumping issues
Yes, co-regulatory scheme in place
Monitor the TV and Computer Scheme implementation and provide input into the review. Continue to advocate for current concerns with the Scheme to government.
White Goods
Maybe Cost for recycling, recycling options, and illegal dumping.
No Continue to monitor market trends for recycling metal components of white goods and provide information to Local Government.

4
Beverage containers
Yes Littering, recycling cost and environmental impact
In other states
Continue to advocate for a Cash for Containers Scheme in WA. Engage with Planet Ark/Greenchip regarding the recyclability labelling system.
Household Hazardous Waste
Yes Environmental impact, costs and contamination of recyclables.
No – but voluntary approach to paint and batteries being worked on
Actively engage with the paint and batteries Product Stewardship schemes. Investigate ways to expand the reach of the Household Hazardous Waste Program.
Scrap metal Maybe Cost for recycling, recycling options and illegal dumping
No Continue to monitor market trends for recycling scrap metal. Investigate market alternatives for recycling, advise Local Governments of options for long term planning and seek support for Local Governments to manage the current situation.
Table 1: Summary of recommendations

5
1 Introduction This Report has been developed by MWAC to identify problematic materials that Local
Government is managing, and identify what actions are needed to address the issues with
those materials. To identify what materials the sector is finding problematic to manage,
MWAC conducted a survey of Local Government in October 2015.
In 2012, MWAC undertook a similar survey to identify priority products for EPR. The top
three problematic waste materials identified were tyres, electronic goods and asbestos. Also
identified were other waste materials where Local Governments required assistance, but
where EPR may not necessarily be the most appropriate approach.
The original survey was modified to reflect current concerns with additional waste materials,
including scrap metal and used oil containers. The outcomes of the current research will be
used to track progress relating to problematic materials and inform advocacy.
2 Methodology In October 2015 MWAC undertook a survey of Local Government to determine problematic
waste materials and mechanisms that could support Local Government to better address
these materials. The survey was distributed to Local Government Officers working in waste
management. Individual comments were also invited.
3 Results of the 2015 Survey Where appropriate, feedback from the 2012 online survey results have been compared to
the 2015 survey to show any changes in priority.
Respondents
91 participants from 76 WA Local Governments and Regional Councils completed the
survey. 4 additional responses were provided via email or phone from 4 Local Governments.
Including the additional response, the survey had a response rate of 80 out of 139 (57%)
Local Governments.
Of the total 95 responses, 34 (35.7%) responses were received from metropolitan Local
Governments and Regional Councils and 61 (64.2%) responses from non-metropolitan
Local Governments and Regional Councils.
Note: multiple responses from same Local Governments have been included in overall
statistics where appropriate.
2012 2015
Total respondents (%) 47% of total Local Governments
57% of total Local Governments
Metropolitan 41.5% 35.7%
Non-metropolitan 58.5% 64.2% Table 2: Number of survey respondents
Problematic Wastes
Survey respondents were asked to identify waste materials that are problematic to manage
in their Local Government area from a list and they could also add in other materials. Table

6
3 shows the number of responses for each waste material, from most responses to least,
compared to the 2012 survey.
Product 2012 2015
Tyres 82.80% 72.5%
Asbestos 65.10% 56%
Mattresses 54.70% 54.9%
Electronic wastes 65.60% 45%
White goods 40.60% 43.9%
Household Hazardous Waste 51.60% 42.8%
Scrap metal - 39.6%
Beverage containers 60.90% 38.5%
Motor vehicle bodies 18.80% 29.7%
Household goods 26.60% 27.5%
Other materials 28.10% 24.2%
Used oil containers - 20.9%
Used oil 35.90% 18.7%
Paper and cardboard 26.60% 17.6%
Batteries (car) 17.20% 15.4% Table 3: Problematic waste in Local Government area
The top 5 products identified as problematic are:
1. Tyres (72.5% of respondents) 2. Asbestos (56%) 3. Mattresses (54.9%) 4. Electronic wastes (45%) 5. White goods (43.9%)
While e-waste was identified within the top 5 products, there were less responses than the
2012 survey. This may reflect the impact of the National Television and Computers Product
Stewardship Scheme.
Beverage containers were in the top 5 most frequently identified waste materials in the 2012
survey (60.9% respondents) but not in the current research. This may be due to the
significant advocacy undertaken in 2012 to bring beverage containers to the forefront.
Other problematic waste materials named by survey respondents include construction and
demolition waste (including rubble, sand and timber), green waste, gas bottles, glass and
mixed plastics.
Problematic Wastes: Metropolitan and Non-metropolitan impacts
The top 5 problematic materials identified in the survey (tyres, asbestos, mattresses, e-
waste and white goods) may not be equally problematic for metropolitan and non-
metropolitan Local Governments. To determine the top 5 problematic materials for each
location, the number of responses to each material by metropolitan or non-metropolitan
Local Governments was compared to the total number of metropolitan and non-metropolitan
Local Governments that took part in the survey.
34 responses were received from metropolitan Local Government and 61 responses were
received from non-metropolitan Local Governments. Table 4 shows a comparison of the

7
problematic materials in the metropolitan and non-metropolitan areas. The top 5 problematic
materials identified by metropolitan Local Governments are:
1. Asbestos (23 responses or 67.6% of metropolitan Local Government respondents) 2. Tyres (67.6%) 3. Mattresses (65%) 4. White goods (56%) 5. Household Hazardous Waste (52%)
The top 5 problematic materials identified by non-metropolitan Local Governments are:
1. Tyres (43 responses or 70.5% of non-metropolitan Local Governments) 2. Asbestos (46%%) 3. Mattresses (46%) 4. Scrap metal (46%) 5. Electronic wastes (41%)
Due to the low number responses by metropolitan Local Governments identifying scrap
metal as a problematic material, it is missing from the overall top 5 list. However, scrap metal
was identified as a problematic material by a large number of non-metropolitan Local
Governments and so needs to be prioritised.
Product Metropolitan Non-metropolitan
Tyres 23 43
Asbestos 33 28
Mattresses 22 28
Electronic wastes 16 25
White goods 19 21
Household Hazardous Waste 18 21
Scrap metal 8 28
Beverage containers 11 24
Motor vehicle bodies 5 22
Household goods 14 11
Other materials 8 14
Used oil containers 5 14
Used oil 7 10
Paper and cardboard 4 12
Batteries (car) 6 8 Table 4: Problematic waste by metropoltain and non-metropolitan Local Governments
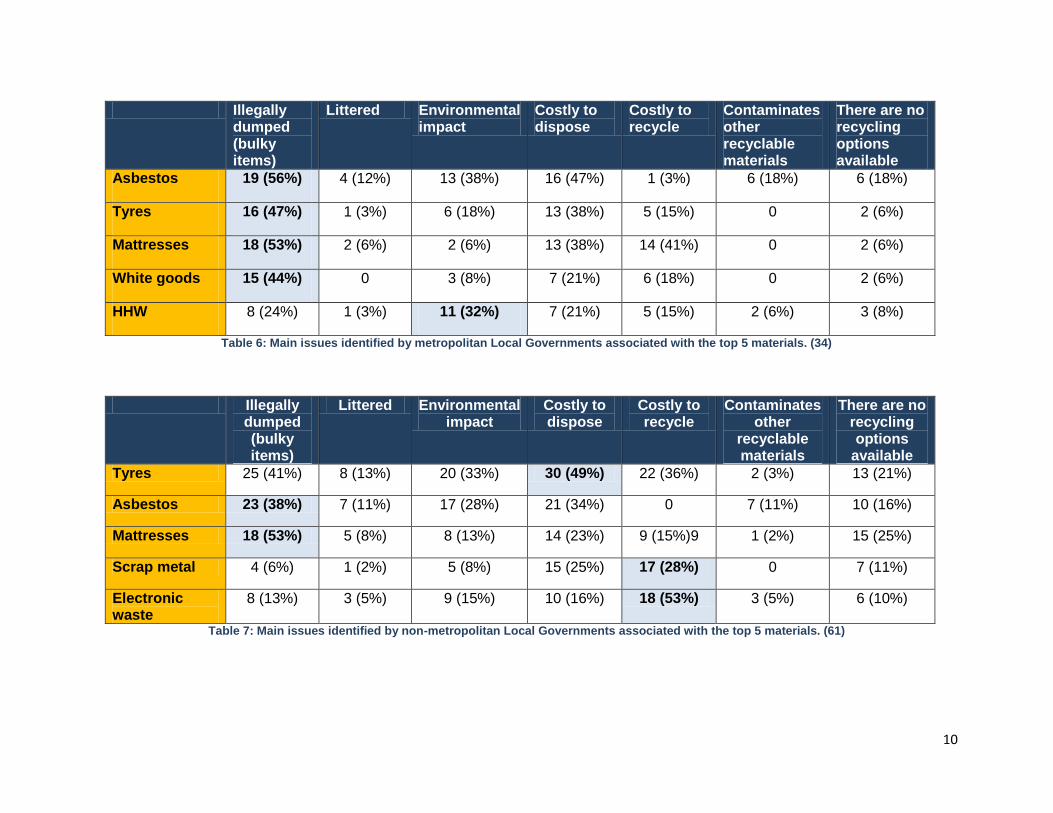
Rationale
Survey respondents were asked to identify the issues associated with these waste products
from a list of choices. Table 5 presents the range of potential issues and number of
corresponding responses. The issue with the most responses is highlighted for each waste
material.
To identify whether the issues associated with these waste products differ between
metropolitan and non-metropolitan Local Governments, the range of potential issues and
number of corresponding responses is highlighted for metropolitan and non-metropolitan
Local Governments in Tables 6 and 7. Only the top 5 products identified by each
metropolitan and non-metropolitan Local Governments have been included.

8
The issues associated with the 3 products present in both the top 5 products identified by
each metropolitan and non-metropolitan Local Governments (tyres, asbestos and
mattresses) are similar for the two areas. Illegal dumping of tyres present a slightly higher
concern for metropolitan Local Governments, while cost to dispose of tyres was identified
as a concern by more non-metropolitan Local Governments.
Table 8 shows the top three issues with each waste product, compared to the 2012 survey.

9
Illegally dumped (bulky items)
Littered Environmental impact
Costly to dispose
Costly to recycle
Contaminates other
recyclable materials
There are no recycling options
available
Tyres 41 (45.1%) 9 (9.9%) 26 (28.6%) 43 (47.3%) 27 (29.7%) 2 (2.2%) 15 (16.5%)
Asbestos 42 (46.2%) 11 (12.1%) 30 (32.9%) 37 (40.6%) 1 (1.1%) 13 (14.3%) 16 (17.6%)
Mattresses 36 (39.6%) 7 (7.7%) 10(11%) 27 (29.7%) 23 (25.3%) 1 (1.1%) 17 (18.7%)
Electronic waste
21 (23.1%) 4 (4.4%) 16 (17.6%) 19 (20.9%) 24 (26.4%) 4 (4.4%) 7 (7.7%)
White goods 24 (26.4%) 2 (2.2%) 11 (12.1%) 18 (19.8%) 17 (18.7%) 1 (1.1%) 11 (12.1%)
HHW 16 (17.6%) 3 (3.3%) 27 (29.7%) 22 (24.2%) 13 (14.3%) 9 (9.9%) 13 (14.3%)
Scrap metal 9 (9.9%) 1 (1.1%) 6 (6.6%) 18 (19.8%) 21 (23.1%) 0 9 (9.9%)
Beverage containers
3 (3.3%) 32 (35.2%) 8 (8.8%) 6 (6.6%) 8 (8.8%) 2 (2.2%) 5 (5.5%)
Motor vehicle bodies
15 (16.5%) 3 (3.3%) 10 (11%) 14 (15.4%) 10 (11%) 2 (2.2%) 5 (5.5%)
Household goods
26 (28.6%) 5 (5.5%) 5 (5.5%) 18 (19.8%) 5 (5.5%) 1 (1.1%) 6 (6.6%)
Used oil containers
7 (7.7%) 4 (4.4%) 13 (14.3%) 11 (12.1%) 10 (11%) 8 (8.8%) 6 (6.6%)
Used oil 9 (9.9%) 3 (3.3%) 13 (14.3%) 9 (9.9%) 8 (8.8%) 6 (6.6%) 3 (3.3%)
Paper and Cardboard
5 (5.5%) 11 (12.1%) 3 (3.3%) 3 (3.3%) 7 (7.7%) 1 (1.1%) 3 (3.3%)
Batteries (car) 11 (12.1%) 5 (5.5%) 8 (8.8%) 5 (5.5%) 5 (5.5%) 3 (3.3%) 3 (3.3%)
Table 5: Issues related to identified materials?
10
Illegally dumped (bulky items)
Littered Environmental impact
Costly to dispose
Costly to recycle
Contaminates other recyclable materials
There are no recycling options available
Asbestos 19 (56%) 4 (12%) 13 (38%) 16 (47%) 1 (3%) 6 (18%) 6 (18%)
Tyres 16 (47%) 1 (3%) 6 (18%) 13 (38%) 5 (15%) 0 2 (6%)
Mattresses 18 (53%) 2 (6%) 2 (6%) 13 (38%) 14 (41%) 0 2 (6%)
White goods 15 (44%) 0 3 (8%) 7 (21%) 6 (18%) 0 2 (6%)
HHW 8 (24%) 1 (3%) 11 (32%) 7 (21%) 5 (15%) 2 (6%) 3 (8%)
Table 6: Main issues identified by metropolitan Local Governments associated with the top 5 materials. (34)
Illegally dumped (bulky items)
Littered Environmental impact
Costly to dispose
Costly to recycle
Contaminates other
recyclable materials
There are no recycling options
available
Tyres 25 (41%) 8 (13%) 20 (33%) 30 (49%) 22 (36%) 2 (3%) 13 (21%)
Asbestos 23 (38%) 7 (11%) 17 (28%) 21 (34%) 0 7 (11%) 10 (16%)
Mattresses 18 (53%) 5 (8%) 8 (13%) 14 (23%) 9 (15%)9 1 (2%) 15 (25%)
Scrap metal 4 (6%) 1 (2%) 5 (8%) 15 (25%) 17 (28%) 0 7 (11%)
Electronic waste
8 (13%) 3 (5%) 9 (15%) 10 (16%) 18 (53%) 3 (5%) 6 (10%)
Table 7: Main issues identified by non-metropolitan Local Governments associated with the top 5 materials. (61)

Product 2012 2015
Tyres Illegally dumped/ Costly to dispose
69.2% Costly to dispose 47.3%
Environmental impact 59.6% Illegally dumped 45.1%
Costly to recycle 48.1% Costly to recycle 29.7%
Asbestos Illegally dumped 88.6% Illegally dumped 46.2%
Costly to dispose 84.1% Costly to dispose 40.6%
Environmental impact 70.5% Environmental impact 32.9%
Mattresses Illegally dumped 72.5% Illegally dumped 39.6%
Costly to dispose 55% Costly to dispose 29.7%
Costly to recycle/ no recycling options
30% Costly to recycle 25.3%
Electronic wastes
Costly to recycle 60% Costly to recycle 26.4%
Costly to dispose 48.9% Illegally dumped 23.1%
Illegally dumped 46.7% Costly to dispose 20.9%
White goods Illegally dumped 73.3% Illegally dumped 26.4%
Environmental impact/ Costly to dispose
43.3% Costly to dispose 19.8%
Costly to recycle/ no recycling options
23.3% Costly to recycle 18.7%
HHW Environmental impact 81.8% Environmental impact 29.7%
Costly to dispose 75.8% Costly to dispose 24.2%
Contaminate recyclables
42.4% Illegally dumped 17.6%
Scrap Metal - Costly to recycle 23.1
- Costly to dispose 19.8%
- Illegally Dumped/ no recycling options
9.9%
Beverage containers
Littered 79.5% Littered 35.2%
Costly to recycle 36.4% Environmental impact/ Costly to recycle
8.8%
Environmental impact 27.3% Costly to dispose 6.6%
Motor vehicle bodies
Illegally dumped 77.8% Illegally dumped 16.5%
Costly to dispose 44.4% Costly to dispose 15.4%
Environmental impact 38.9% Environmental impact/ Costly to recycle 11%
Household goods
Illegally dumped 77.8% Illegally dumped 28.6%
Costly to dispose 40.7% Costly to dispose 19.8%
No recycling options 25.9% No recycling options 6.6%
Used Oil Containers
- Environmental impact 14.3%
- Costly to dispose 12.1%
- Costly to recycle 11%
Used Oil Environmental impact 86.2% Environmental impact 14.3%
Costly to dispose 44.8% Illegally dumped/ costly to dispose 9.9%
Illegally dumped 41.4% Costly to recycle 8.8%
Paper and cardboard
Littered 73.7% Littered 12.1%
Costly to recycle 36.8% Costly to recycle 7.7%
Costly to dispose 26.3% Illegally dumped 5.5%
Batteries Illegally dumped/ Environmental impact
58.8% Illegally dumped 12.1%
Costly to dispose 29.4% Environmental impact 8.8%
Contaminate recyclables
17.6% Littered/ Costly to dispose/ Costly to recycle 5.5%
Table 8: Problematic wastes and top three issues

www.walga.asn.au
The most frequently mentioned reason for the materials being considered problematic was
that they were illegally dumped/littered and they had a significant environmental impact. Green
waste was also reported as problematic due to illegal dumping and that it was costly to recycle.
Similarly, construction and demolition waste was frequently highlighted due to illegal dumping
and then costly to recycle or dispose of. There are no recycling options for polystyrene and
litter, environmental impacts and contamination of other recyclables were raised and ongoing
issues for this material.
Mechanisms for addressing problematic waste
Survey respondents were asked to select potential mechanisms to address problematic
wastes from a list of choices. Table 9 presents the range of mechanisms and the number of
responses in support for each and Table 10 splits this data by metropolitan and non-
metropolitan Local Governments.
Mechanism 2012 2015
Implementation of Product Stewardship schemes
73.8% 62.6%
Funding for transport costs of recycled materials
61.5% 61.5%
Funding for waste management infrastructure
66.2% 59.3%
Strategic planning for infrastructure at a State level
43.1% 51.6%
Other 13.8% 17.6%
Table 9: Mechanisms supported for addressing problematic wastes
Mechanism Metropolitan Non-metropolitan
Implementation of Product Stewardship schemes
43.90% 56.10%
Funding for transport costs of recycled materials
26.80% 73.20%
Funding for waste management infrastructure
38.90% 61.10%
Strategic planning for infrastructure at a State level
40.40% 59.60%
Other 43.70% 56.30%
Table 10: Mechanisms supported for addressing problematic wastes (metropolitan and non-metropolitan)
Responses to the 2012 survey showed a preference for implementation of Product
Stewardship scheme over other mechanisms. In contrast, responses to the 2015 survey show
only a slight preference for Product Stewardship schemes, with similar numbers of responses
in favour of funding for transport costs of recycled materials and waste management

www.walga.asn.au
infrastructure. As shown in Table 10 this is likely to be due to the high number of responses
from the non-metropolitan area.
As with the previous survey, strategic planning for infrastructure at a State level was not rated
as highly.
Other mechanisms to address problematic wastes included the introduction of Container
Deposit Legislation and funding for permanent household hazardous waste collected sites.
Respondents also requested distribution of the Landfill Levy to fund the development of waste
infrastructure and to reimburse Local Governments sending illegally dumped material to
landfill.
Respondents highlighted that any new Product Stewardship scheme requires a long term
commitment from Federal and State Governments. Additionally, there is a need for a
mandatory commitment by industry for a number of Schemes to be viable. Respondents also
identified the need for support by State and Federal government in the development of
markets for recycled materials.
Top 3 Priority Products for Product Stewardship
Survey respondents were asked to identify their top three wastes to be prioritised for EPR.
The three most common materials listed for numbers 1, 2 and 3 priority are presented in Table
11.
Number 1 Priority
Tyres 16 responses (17.8%)
E-waste 9 responses (9.9%)
Beverage containers 8 responses (8.8%)
Number 2 Priority
Tyres 10 responses (10.9%)
E-waste 8 responses (8.8%)
White goods 7 responses (7.7%)
Number 3 Priority
Tyres/ mattresses 8 responses (8.8%)
Beverage containers 6 responses (6.6%)
Used oil and containers 5 responses (5.5%) Table 11: Top 3 products identified for Product Stewardship Schemes
Tyres were identified as the top material for Product Stewardship. E-waste and beverage
containers were also prominently supported, as well as mattresses, used oil and used oil
containers.
www.walga.asn.au
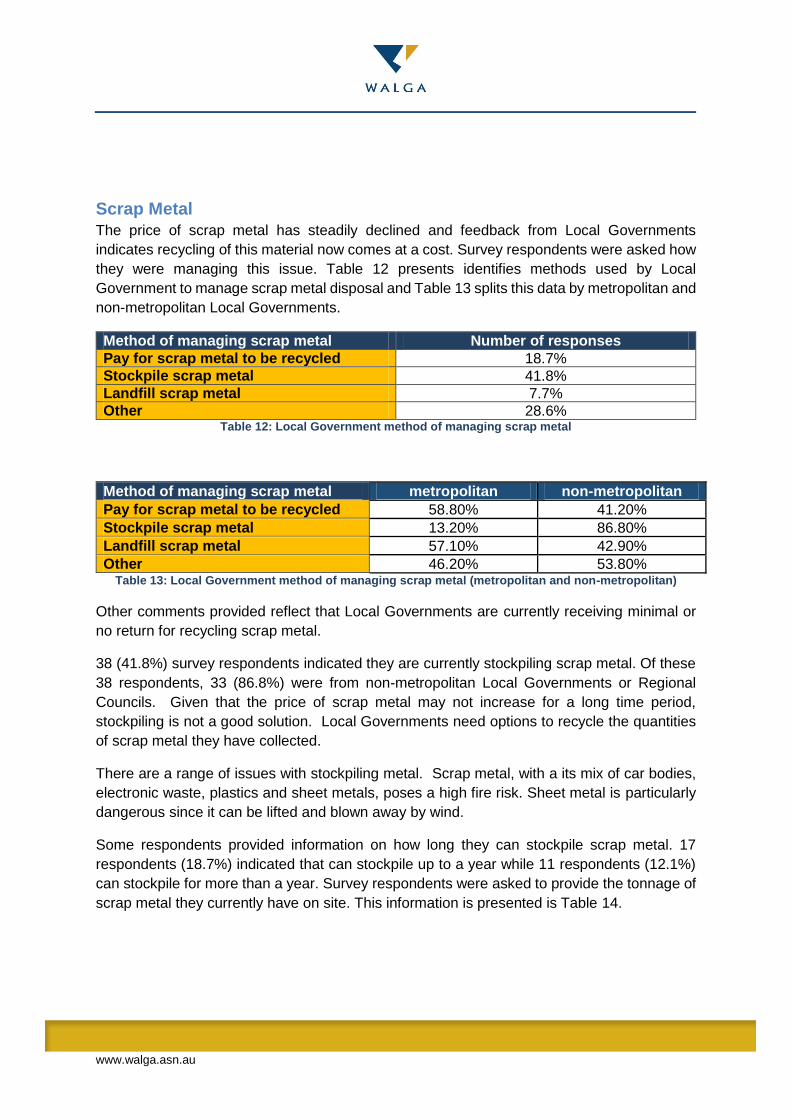
Scrap Metal
The price of scrap metal has steadily declined and feedback from Local Governments
indicates recycling of this material now comes at a cost. Survey respondents were asked how
they were managing this issue. Table 12 presents identifies methods used by Local
Government to manage scrap metal disposal and Table 13 splits this data by metropolitan and
non-metropolitan Local Governments.
Method of managing scrap metal Number of responses
Pay for scrap metal to be recycled 18.7%
Stockpile scrap metal 41.8%
Landfill scrap metal 7.7%
Other 28.6% Table 12: Local Government method of managing scrap metal
Method of managing scrap metal metropolitan non-metropolitan
Pay for scrap metal to be recycled 58.80% 41.20%
Stockpile scrap metal 13.20% 86.80%
Landfill scrap metal 57.10% 42.90%
Other 46.20% 53.80% Table 13: Local Government method of managing scrap metal (metropolitan and non-metropolitan)
Other comments provided reflect that Local Governments are currently receiving minimal or
no return for recycling scrap metal.
38 (41.8%) survey respondents indicated they are currently stockpiling scrap metal. Of these
38 respondents, 33 (86.8%) were from non-metropolitan Local Governments or Regional
Councils. Given that the price of scrap metal may not increase for a long time period,
stockpiling is not a good solution. Local Governments need options to recycle the quantities
of scrap metal they have collected.
There are a range of issues with stockpiling metal. Scrap metal, with a its mix of car bodies,
electronic waste, plastics and sheet metals, poses a high fire risk. Sheet metal is particularly
dangerous since it can be lifted and blown away by wind.
Some respondents provided information on how long they can stockpile scrap metal. 17
respondents (18.7%) indicated that can stockpile up to a year while 11 respondents (12.1%)
can stockpile for more than a year. Survey respondents were asked to provide the tonnage of
scrap metal they currently have on site. This information is presented is Table 14.

www.walga.asn.au
Scrap metal stockpiled (tonnes) Number of responses
Less than 50 10
50 – 100 4
100 – 200 6
200 – 400 2
400 – 999 1
1000– 9,999 3
10 000+ 2 Table 14: Amount of scrap metal on site (tonnes)
The majority of respondents have 200 tonnes or less of scrap metal currently stockpiled. Half
of these have 50 tonnes or less. Some responses may reflect respondents’ capacity to
stockpile rather than current tonnes.
Mattresses
Mattresses have been identified as another problematic material for many Local
Governments. Survey respondents were asked to indicate how they were managing this issue.
Table 15 presents the range of methods used by Local Government to manage mattress
disposal and Table 16 splits this by metropolitan and non-metropolitan Local Government
responses.
Method of managing scrap metal Number of responses
Landfill with general waste 57.1%
Shredded then landfilled 3.3%
Recycled 25.3%
Other 13.2% Table 15: Local Government method of managing mattresses
Method of managing scrap metal Metropolitan Non-metropolitan
Landfill with general waste 9.60% 90.10%
Shredded then landfilled 66.70% 33.30%
Recycled 87% 13%
Other 50% 50% Table 16: Local Government method of managing mattresses (metropolitan and non-metropolitan)
57.1% survey respondents are currently disposing of mattresses to landfill without shredding.
Of these, 90% respondents were from non-metropolitan Local Governments or Regional
Councils, with the remaining 10% from the metropolitan.
Some Local Governments commented that they had plans to shred mattresses rather than
dispose of them whole to landfill.

www.walga.asn.au
Local Governments that collect mattresses for recycling were asked to approximate how many
mattresses were being collected annually. Survey respondents could specify number of
mattresses or tonnes collected as shown in Table 17.
Mattresses collected per annum (tonnes) Responses
Up to 10 tonne 1
10 – 50 tonne -
50 – 100 tonne 2
100 – 500 tonne 3
500 + tonne 1
Mattresses collected per annum responses
Less than 50 1
50 – 100 2
100 – 500 2
500 – 1000 2
1000 – 5000 7
5000+ 2 Table 17: Number of (or tonnage) mattresses collected annually
Final comments
Respondents were provided with the opportunity to include additional comments. The
responses are shown in Appendix A and a short summary of key concerns is below.
Household Hazardous Waste: Local Governments expressed that funding for
infrastructure and drop-off days was needed. Non-metropolitan Local Governments do
not have local infrastructure and have to redirect their communities to permanent sites
some distances away.
Transport concerns: Non-metropolitan Local Governments have significant concerns
relating to diverting items from landfill when the alternative is to transport them
significant distances to metropolitan sites. Due to the time and expense required,
recycling problematic materials, such as mattresses and e-waste are prohibitive.
Asbestos: illegal dumping of asbestos was raised as a significant concern. This poses
significant environmental and health risks and the costs to clean up and dispose
asbestos to landfill is high.
Illegal dumping: Many Local Governments raised concerns regarding significant
amounts of illegal dumping and the associated costs and environmental impacts this
causes. Local Governments need effective ways to reduce illegal dumping and be
reimbursed for the costs of sending illegally dumped wastes to landfill.
4 Applying the Criteria from the EPR Policy Statement In order to assess whether the problematic materials identified by Local Government would
be appropriate for an EPR scheme, the criteria in the WALGA EPR Policy Statement were
applied to the products. This criteria are:

www.walga.asn.au
1. Does the waste or product cause significant environmental or social impacts? 2. Does the waste or product cause significant costs for waste processors? 3. Does the waste or product have unrealised potential for recycling / resource
recovery? 4. Is the waste or product likely to be disposed of illegally? 5. Does the waste or product cause significant community concern? 6. Is the producer well placed to reduce the impacts of their products?
Table 18 presents the results of this assessment.
Material Enviro/ Social impact
Costs Potential recycling
Illegal disposal
Community Concern
Producer available
Tyres Yes Yes for
recycling and disposal
Yes Yes Yes Yes
Asbestos Yes Yes No Yes Yes No
Mattresses Yes Yes for
recycling and disposal
Yes Yes Yes Yes
Electronic wastes
Yes Yes for recycling and disposal
Yes Yes Yes Yes
White goods
Yes Yes for recycling and disposal
Yes Yes Some Some
Household Hazardous Waste
Yes Yes for recycling and disposal
Yes Yes Yes Yes
Scrap metal
Yes Yes for recycling
Yes Yes Yes Yes
Beverage containers
Yes Yes for recycling
Yes Yes Yes Yes
Motor vehicle bodies
Yes Yes for recycling and disposal
Yes Yes Yes No
Household goods
Yes Yes for recycling and disposal
No Yes Some Yes
Used oil containers
Yes Yes No Yes Yes Yes
Table 18: Use of EPR Policy Statement Criteria.

www.walga.asn.au
5 Prioritising materials for action To prioritise products for action, the top 5 products identified as problematic by each
metropolitan and non-metropolitan Local Governments have been highlighted. These are:
1. Asbestos (97% of metropolitan Local Government respondents)
2. Tyres (67.6%) 3. Mattresses (65%) 4. White goods (56%) 5. Household Hazardous Waste (52%)
1. Tyres (70.5% of non-metropolitan Local Government respondents)
2. Asbestos (46%) 3. Mattresses (46%) 4. Scrap metal (46%) 5. Electronic wastes (41%)
In relation to the priority for materials to be addressed through EPR, tyres and e-waste were
identified most frequently, followed by beverage containers, white goods and mattresses (as
shown in Table 11 above). Previously when this survey was done, in 2012, beverage
containers and e-waste were identified by respondents as the priority for EPR.
Among the problematic products identified, an assessment has been undertaken to determine
whether an EPR Scheme would be the appropriate approach, what the focus of a Scheme
should be, whether a Scheme is already in place and what the recommendation for action is.
Beverage containers are also included since these materials were also frequently identified
as suitable for EPR. This is summarised in Table 19.
Looking at prioritising products for EPR schemes, other considerations include whether a
Product Stewardship Scheme is currently in place and the efficacy of that scheme.
Tyres
A voluntary product stewardship scheme has been introduced, however it is yet to be seen if
the Scheme will resolve the issues of importance for Local Government. Local Governments
identified the issues with tyres as:
Illegal dumping
Costly to dispose
Costly to recycle (including transporting to metropolitan areas to recycling)
No recycling options
The voluntary scheme does not include any direct intervention in relation to illegal dumping or
putting in place cost effective recycling/disposal options. MWAC has endorsed the motion to
join Tyre Stewardship Australia and encourage Local Governments to also join. MWAC will
actively engage with WALGA Preferred Suppliers to ensure they are members of TSA.
Actions: Promote Tyre Stewardship Australia and encourage Local Governments to
join.

www.walga.asn.au
Asbestos
Of these problematic products, Asbestos is the least suitable material for a product
stewardship scheme given that there is limited recycling potential and as the material is not
being currently sold, revenue to fund a scheme is not present. For this material it is suggested
that other approaches be utilised. Local Government identified the issues with asbestos as:
Illegal dumping
Costly to dispose
Action: Continue to advocate for other approaches to managing Asbestos. Including
seeking funding to implement the National Strategic Plan for Asbestos Management
and Awareness.
Mattresses
Mattresses do not represent a large environmental impact, however there are the potential
social impacts of illegal dumping and they are costly materials to recycle/dispose of. Further
investigation of this product is necessary to determine options. Local Government identified
the issues with mattresses as:
Costly to recycle, including transporting to metropolitan areas
Difficult to dispose of when Local Governments cannot access shredders
Illegal dumping
Action: Investigation the current market and product stewardship development for
mattresses. Support new operators to enter the market.
E-waste
Through the Televisions and Computer Product Stewardship Scheme a large proportion of e-
waste has been recycled. The Federal Government recently reviewed the Scheme and
increased the targets and identified the need for better communication between the Co-
Regulatory Arrangements, State and Local Government. The WALGA submission on the
review of the Scheme is available via the WasteNet website. Local Governments identified
with issues with e-waste as:
Costly to recycle and lack of recycling options, including no local receive points
Illegal dumping
Environmental impacts
Action: Monitor the TV and Computer Scheme implementation and provide input into
the review. Continue to advocate for current concerns with the Scheme to government.

www.walga.asn.au
White goods
MWAC has not been particularly active on white goods except following metal recycling price
projections. Local Government identified issues with white goods as:
bulky to dispose of
limited recycling options available
Environmental concerns arising from disposed of white goods that have not been correctly de-gassed.
Recycling of white goods and scrap metal is currently affected Australia wide by global
markets and long-term trends in these markets are projected to continue to decline. Due to
limited capacity to influence these markets, MWAC can continue to monitor this issue and
provide updates to Local Government while focusing on other problematic waste materials.
Action: Continue to monitor market trends for recycling metal components of white
goods and provide information to Local Government.
Beverage Containers
Due to concerns relating to the effectiveness of the Australian Packaging Covenant, MWAC
resigned from the Covenant in 2015. Since the previous research, Container Deposit Schemes
have continued in South Australia and implemented Northern Territory. There are current
plans for Schemes in New South Wales and Queensland.
MWAC recently noted the development of a recyclability labelling system by Planet Ark.
MWAC has endorsed plans to engage with Planet Ark to ensure the system is appropriate for
WA and promote the use of a consistent label to identify packaging recyclability.
Local Government identified issues with beverage containers as:
Littering
Lack of recycling options
Action: Continue to advocate for a Cash for Containers Scheme in WA. Engage with
Planet Ark/Greenchip regarding the recyclability labelling system.
Household Hazardous Waste
This is by far the most difficult selection of materials to address. Local Government identified
issues with HHW as:
Lack of disposal and recycling options, including access to infrastructure and funding for collection
Significant environmental impact
Illegal dumping
www.walga.asn.au
The priorities for EPR focus on environment impact, costs and contamination. The highest
volume material collected, paint, has limited environmental impact but a high cost for disposal.
Lower volume products, like pesticides, are more environmentally damaging – however not
as costly to dispose of. Some products, such as Schedule X pesticides, are no longer
manufactured to establishing producer responsibility may be difficult.
An overall scheme for HHW may be difficult given the diverse range of materials covered, so
an approach which selects the highest cost, most hazardous material has been chosen. A
voluntary Product Stewardship Schemes are currently being developed for batteries. This
scheme will over cover rechargeable and hazardous batteries. A voluntary Scheme is also
currently being developed for paint
Action: Actively engage with the paint and batteries Product Stewardship schemes.
Investigate ways to expand the reach of the Household Hazardous Waste Program.
Scrap Metal
The price of scrap metal has steadily declined and feedback from Local Governments
indicates this means that recycling this material now comes at a cost. MWAC has not been
particularly active on scrap metal except following recycling price projections. Recycling of
scrap metal is currently affected Australia wide by global markets and long-term trends in
these markets are projected to continue to decline. Due to limited capacity to influence these
markets, MWAC can continue to monitor this issue and provide updates to Local Government
while focusing on other problematic waste materials. Local Government identified issues with
scrap metal as:
Costs to recycle
There is some concern regarding Local Governments stockpiling scrap metal in preparation
for market recovery. To respond to this, MWAC can investigate market alternatives for
recycling scrap metal and advise Local Government of options for long-term planning.
Action: Continue to monitor market trends for recycling scrap metal. Investigate market
alternatives for recycling, advise Local Governments of options for long term planning
and seek support for Local Governments to manage the current situation.

www.walga.asn.au
Problematic product
Suitable for Product Stewardship
Focus of Product Stewardship Scheme
Is a scheme in place?
Actions
Tyres Yes Illegal dumping, disposal/ recycling options
Yes, voluntary scheme in place
Promote Tyre Stewardship Australia and encourage Local Governments to join.
Asbestos No N/A No Continue to advocate for other approaches to managing Asbestos. Including seeking funding to implement the National Strategic Plan for Asbestos Management and Awareness.
Mattresses Maybe Illegal dumping, cost of recycling/disposal and recycling options
No Investigation the current market and product stewardship development for mattresses. Support new operators to enter the market.
Electronic Waste
Yes Cost for recycling, disposal and illegal dumping issues
Yes, co-regulatory scheme in place
Monitor the TV and Computer Scheme implementation and provide input into the review. Continue to advocate for current concerns with the Scheme to government.
White Goods
Maybe Cost for recycling, recycling options, and illegal dumping.
No Continue to monitor market trends for recycling metal components of white goods and provide information to Local Government.
Beverage containers
Yes Littering, recycling cost and environmental impact
In other states
Continue to advocate for a Cash for Containers Scheme in WA. Engage with Planet

www.walga.asn.au
Ark/Greenchip regarding the recyclability labelling system.
Household Hazardous Waste
Yes Environmental impact, costs and contamination of recyclables.
No – but voluntary approach to paint and batteries being worked on
Actively engage with the paint and batteries Product Stewardship schemes. Investigate ways to expand the reach of the Household Hazardous Waste Program.
Scrap metal Maybe Cost for recycling, recycling options and illegal dumping
No Continue to monitor market trends for recycling scrap metal. Investigate market alternatives for recycling, advise Local Governments of options for long term planning and seek support for Local Governments to manage the current situation.
Table 19: Summary of recommendations
6 Conclusion This survey received a significant response rate and Local Government provided detailed
information on current concerns. Local Government identified a variety of problematic
materials and issues associated with them. As identified by the sector, the top problematic
materials to be prioritised for action by MWAC are:
1. Tyres
2. Asbestos
3. Mattresses
4. Electronic waste
5. White goods
6. Household Hazardous waste
7. Scrap metal
8. Beverage containers.

www.walga.asn.au
The issues associated with these materials vary but predominantly illegal dumping and
environmental concerns were raised by Local Governments as significant issues. Large items,
including tyres, mattresses and white goods seem more likely to be illegally dumped. Illegal
dumping was also highlighted as the biggest issue associated with asbestos. Local
Governments need resources to combat illegal dumping, including ways to engage their
communities to discourage the behaviour and simplify disposal. Local Governments also need
resources to respond to illegal dumping, including hotspot monitoring and issuing
infringements.
Fluctuations in the cost of recycling materials is likely to have an impact on Local Government
concerns, especially for scrap metal and electronic waste. Local Governments identified these
materials as costly to recycle and that reflects current market trends.
It is not surprising that non-metropolitan Local Governments also highlighted these materials
as costly to dispose of. Transporting materials over large distances remains a significant issue
for non-metropolitan Local Governments
Local Government identified a variety of potential mechanisms to respond to problematic
materials. Metropolitan Local Governments showed a preference for implementation of
Product Stewardship Schemes. This mechanism was the least popular option for non-
metropolitan Local Governments, who have struggled to access infrastructure and drop off
points to take advantage of current schemes.
Since the previous survey conducted in 2012, MWAC has had considerable involvement in
reviewing and monitoring Product Stewardship Schemes, such as the National Television and
Computer Scheme. MWAC has identified limitations in current schemes and will continue to
engage with State and Federal Governments to improve their processes. While schemes may
be appropriate for some of the problematic materials identified for priority, such as tyres,
mattresses and specific HHW, other options to respond to problematic materials should also
be considered. Non-metropolitan Local Governments identified funding for both transport
costs of recycled materials and waste management infrastructure as alternatives to EPR.

www.walga.asn.au
Appendix A
Comments
More money needs to be spent on recycling infrastructure and facilities to accommodate the recyclables in this state to reduce costs on local government. More Hazardous Waste days for the community to drop off their items. These were very successful when they were run regularly and placed into our waste guide every year.
[The City is] constantly asked for drop-off days for Household Hazardous Goods (HHW). Permanent sites too far to travel for some residents and too expensive for the City to fully fund.
Funding for HHW infrastructure at non metro landfills
Residents ring us needing to dispose of garden chemicals, acids, etc. and we have no solution for them, other than tell them to take it to Bunbury, over 50km away. Not a good solution.
Although recycling programs are offered for some problematic waste, e.g. mattresses, the cost to divert them from landfill to the facilities located in Metro area capable of handling higher volumes, becomes prohibitive for the City.
Everything is so much more difficult and expensive in the country
E-Waste is our most significant issue due to there being no receivable points in our area.
Recycling for a small Local Authority is costly due prices and the tyranny of distance to markets. Metal has dropped significantly in price adding to another issue.
Transport costs are the biggest killer of recycling efforts in non-metro areas, we do not have a shredder for tyres and mattresses
Asbestos is the most commonly illegally dumped waste in the Shire
Contractors dumping quantities of asbestos sheeting and green waste to avoid disposal fees is escalating. Significant clean-up cost particularly for asbestos to the local government which is further compounded by the landfill tax which adds $55.00 per tonne (2015/16 FY) to disposal cost and escalates to $70.00 per tonne in 2018/18 FY.
Green Waste. There's only so much mulch a small community can use. We must burn a significant volume but the prescriptive requirements of the Rural Landfill Regulations are nonsensical make it very difficult/almost impossible to manage a compliant burn. They require a burn to occur between the hours of 8am to 12 noon and fully extinguished by 12 noon. We often have strong winds in the mornings and light to no wind in the afternoon.
Illegally dumped building waste is now a major problem costing the city $$$ to dispose of
Illegal dumping is the major problem and ideas to reduce/eliminate this problem would be great.


