1 PROBLEMS AND PROSPECTS OF AGRICULTURAL SECTOR IN ASSAM- A CASE STUDY OF SONITPUR DISTRICT THESIS SUBMITTTED FOR THE DEGREE OF DOCTOR OF PHILOSOPHY Supervisor Research Scholar Dr. Parag Kr. Deka Mr. Dinesh Sarmah DEPARTMENT OF COMMERCE NAGALAND UNIVERSITY CAMPUS: KOHIMA NAGALAND 2012
Transcript
1
PROBLEMS AND PROSPECTS OF AGRICULTURAL SECTOR IN ASSAM- A CASE
STUDY OF SONITPUR DISTRICT
THESIS SUBMITTTED FOR THE DEGREE
OF DOCTOR OF PHILOSOPHY
Supervisor Research Scholar Dr. Parag Kr. Deka Mr. Dinesh Sarmah
DEPARTMENT OF COMMERCE
NAGALAND UNIVERSITY
CAMPUS: KOHIMA
NAGALAND
2012
2
NAGALAND UNIVERSITY (A Central University Estd by the Act of Parliament No. 35 of 1989)
Kohima Campus, Meriema-797001
Ref. No……………………… Date…………………………
Dr. Parag Kr. Deka, M.Com. Ph.D. Associate Professor, Department of Commerce, Nagaland University, Kohima 797001(Meriema).
This is to certify that the work recorded in the thesis titled “PROBLEMS AND PROSPECTS OF AGRICULTURAL SECTOR IN ASSAM- A CASE STUDY OF SONITPUR DISTRICT” is submitted by Mr. Dinesh Sarmah M.A. (Eco), Research Scholar, Department of Commerce, Nagaland University for the degree of Doctor of Philosophy is faithful and bonafide research work carried out under my personal supervision and guidance.
I certify that this thesis is a record of work done by the candidate himself and that to the best of my knowledge and the contents of the thesis did not form a basis of award of any previous degree to anybody else.
(Dr. Parag Kr. Deka)
Supervisor
3
ACKNOWLEDGEMENT
The work is the first attempt to its kind in regard to a complete analysis
covering all aspects of the agriculture of the state in general and Sonitpur
district in particular. I have tried to make the work quite comprehensive
considering the necessity of the study because agriculture is the largest
productive sector in the state as well as in the district and it provides
livelihood to large mass of population directly and indirectly. The study
covers all the different aspects and opportunities of the agricultural sector and
focus on the recent trends in productivity with a comparative analysis with the
agriculturally competitive districts of Assam, developed states like Punjab
and Haryana and the national average, major challenges faced by the sector
and suggest some remedial measures that would help to meet the basic
objectives and aspiration of farmers of the state in general and the district in
particular.
The study has its own limitations. The present study is an attempt to
provide more comprehensive analysis of the agricultural growth with selected
crops and problems in the state and in the district by interfacing a macro
picture describe by secondary data with the realities at the grass root, observe
through a field survey in which farms and households are the units of
observation. Since the agricultural sector is the unorganized sector of our
economy, no records of year-wise production is maintained by farmers even
by large farmers also. The primary analysis of the year-wise productivity of
the sector is mostly depended on official or departmental data provided by the
agricultural department of the government. Again there are inherent
limitations in deriving macro policy recommendation from micro studies on
4
the basis of existing socio- economic conditions of the people and the
importance of the agricultural sector on the livelihood of the farmers.
I express my high sense of gratitude to my Supervisor Dr. Parag Kumar
Deka, Sr. Associate Professor and former Head, Department of Commerce,
Nagaland University, Kohima at the very outset. Without his guidance and
scholarly supervision and advice the present work is not possible to complete
on due course of time and schedule. During the entire period of the work he
had given me his immensely valuable time in discussion of various issues
relating to my work. I also express my sincere thanks to his family members
for their indirect support and sacrifice of family time.
I sincerely express my thanks to the Mr. T.C. Saikia, Librarian,
K.K.Handique Library, Gauhati University for his help and co-operation. I
also express my thanks to Librarian, OKD Institute of Social Changes,
Librarian Tezpur University, R.G. University Itanagar, Librarian, NEDFI,
PIB, Govt. of India, GIRI Institute of Development Studies, Sector ‘O’
Aliganj Housing Scheme, Lucknow-226024, Institute of Public Enterprise,
Osmania University Campus, Hyderabad-500007, G.B. Pant Social Science
Institute, Jhusi, Allahabad UP, Directorate of Statistics and Economics, Govt.
of Assam, Dispur, Assam Agriculture University, Jorhat, Director of
agriculture (farm information) Office of the Joint Director of Agriculture
Tezpur, Office of the Executive Engineer, Department of Irrigation, Tezpur
Assam, Circle Office Tezpur, Ministry of Agriculture, Secretariat, Govt. of
Assam Dispur and District Information Cell of Office of the Deputy
Commissioner, Sonitpur Assam. Block Development Offices of the Sonitpur
District and Agricultural Extension Officers of the District.
5
I also express my special thanks to Mr. Rana Goswami, Assistant
Director, Directorate of Agriculture, Khanapara, Assam and Mr. M.P.
Rownier, Assistant. Director of Agriculture (Farm Information) Office of the
Joint Director of Agriculture Tezpur, Assam for their help in collection of
secondary data relating to my research work. I am also thankful to Dr.
Baijayanta Keot, Principal, Missamari College for his help in collection of
primary data relating to my research work.
I am thankful to my colleague and friends for their valuable time during
the various discussions and their analytical views and logical reasoning.
I am also grateful to my parents and other family members for their
continuous support in the entire research work.
Date:
Place: (Dinesh Sarmah)
6
CONTENTS
Pages ACKNOWLEDGEMENT i-iii LIST OD TABLES vii-xii LIST OF FIGURES xii-xiii ABBREVIATIONS
xiv-xv
CHAPTER I 1-38 Introduction 2 Needs and Significance of the Study 11 Objectives of the Study 15 Hypothesis for the Study 15 Research Methodology 15 Plan of Study 17 Periodicity of the Study 19 Review of Literature 19 Limitations of the Study
37
CHAPTER II: EXISTING SCENARIO OF AGRICULTURE AND LAND USE PATTERN IN ASSAM AS WELL AS SONITPUR DISTRICT
39-85
Location 41 Physiography 43 Climate and rainfall 48 Demographic Structure of the State and the District 51 Income and Agriculture 54 Soil 59 The Land Use Pattern in Assam and Sonitpur District 60 Cropping pattern 63 Cropping Intensity 67 Agricultural Inputs: 68 Seeds 68 Fertilizer 71 Irrigation 73 Credit 76
7
Agricultural Implements and Machinery 78 Infrastructure facilities and their impact on Agriculture of Assam 79 Crop Insurance 82 Productivity in Agriculture
83
CHAPTER III: CROPPING PATTERN AND TRENDS IN PRODUCTIVITY OF SELECTED CROPS DURING POST REFORM PERIOD IN THE DISTRICT
86-120
Cropping pattern in Assam (1951 – 52 to 2010-11) 88 Cropping Intensity 103 Trend analysis of the productivity of major crops 104 Food production 106 Trend in production of major crops in Sonitpur District in 1999-2000 to 2009-10
110
CHAPTER IV: INTER-DISTRICT VARIATION IN PRODUCTIVITY OF SELECTED CROPS IN ASSAM (A comparative study with a developed state like Haryana)
121-157
Analytical study on: Variation in Area, Production and Yield of main food grains
123
Analysis of variation in Area, Production and Yield of major non-food grains
134
Inter-district variation in Area, Production and Yield rate of major crops
145
Inter-State Variation in Yield Rate of major crops
151
CHAPTER V: ECONOMIC REFORMS AND ITS IMPACT ON AGRICULTURAL SECTOR IN ASSAM AS WELL AS SONITPUR DISTRICT
158-187
Growth rates in Area, Production and Productivity of major food grain and non-food grains
162
Productivity gain through technical efficiency and input growth during the period
172
Sectoral Contribution to GSDP
185
CHAPTER VI: CONSTRAINTS AND PROSPECTS OF AGRICULTURAL SECTOR IN ASSAM AS WELL AS SONITPUR DISTRICT
188-226
Institutional Factors: 191 Land Tenure System 191 Size of Land Holdings and Sub- Division of Land 192
8
Physical Factors: 195 Rainfall 195 Flood and Drought 197 Techno-Economic Factors: 203 Irrigation 203 Use of Fertilizer 207 Use of HYV Seeds 210 Plant Protection Measure 212 Mechanization 213 Rural Electrification 214 Agricultural Credit 215 Agricultural Marketing 217 Transport and Communication 221 Agricultural Research, Education and Extension Services
224
CHAPTER VII: SUMMARY OF FINDINGS, RECOMMENDATIONS AND CONCLUSIONS
227-262
Analysis of Primary Data and Testing of Hypothesis 231 Testing of Hypothesis: 243 Testing of hypothesis I 243 Testing of hypothesis II 245 Testing of hypothesis III 246 Major Findings of the Study 247 Recommendations and Suggestions: 248 Land Reform Measures 249 Development of Agricultural Research, Education, Training and Extension Services
250
Use of HYV seeds 252 Pest Management 253 Use of Fertilizer 255 Irrigation and Water Management 255 Farm Mechanization 257 Agricultural Marketing 258 Agricultural Credit 258 Natural Hazards 259 Liberalization and Market Economy 260 Conclusions 261 BIBLIOGRAPHY I-X SCHEDULE XI-XV
9
LIST OF TABLES:
Page No.
2.1 Season wise Rainfall in the District since 2004-05 (in mm) 50
2.2 Sectoral Contributions to GSDP at constant (2004-05) prices 54
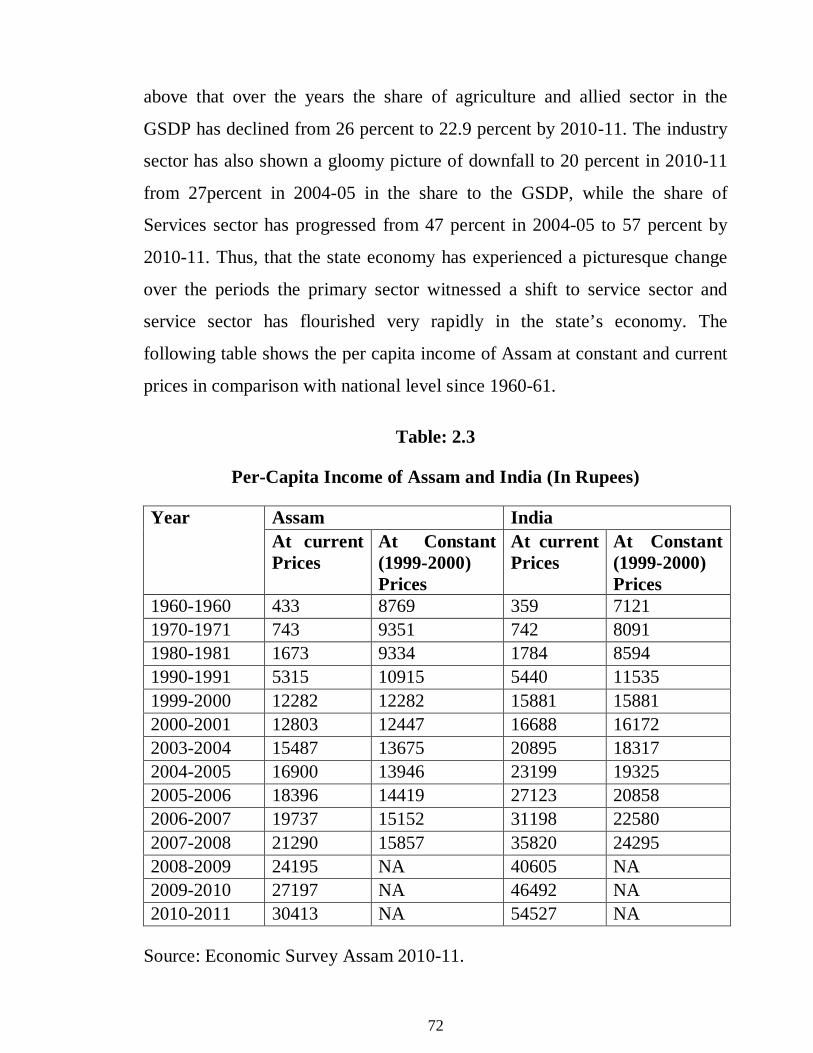
2.3 Per-Capita Income of Assam and India. (In Rupees) 55
2.4 District Income at Current and Constant Price (in lakh) 56
2.5 Land use pattern in Assam and in Sonitpur district (in thousand hectares)
61
2.6 Area under principal crops in Assam (area in ‘000hectares) 64
2.7 Crop statistics of Sonitpur District (cropping pattern and yield rate) 2008-09
66
2.8 Area and yield of HYV of rice in Assam (area: hectare; Yield: kg/ hectare)
69
2.9 Area and yield of HYV of rice in Sonitpur district (area: hectare; Yield: kg/ hectare)
70
2.10 Season wise Consumption of Fertilizers (in‘000MT) 71
2.11 Consumption of fertilizers and chemicals in Sonitpur district (in MT)
72
2.12 Irrigation Schemes in Assam 74
2.13 Crop-Season-Wise and Year-wise area irrigated in Sonitpur District (area in hectare)
75
2.14 Credit flow to agriculture and allied activities under Annual Credit Plan
77
2.15 Area, production and average yield of major crops in Assam (area in ‘000 hectares, production in ‘000 tones and average
83
10
yield in kg/hectares)
2.16 Crops productivity during last 4 years in Sonitpur district (kg/hec)
84
3.1 Percentage area under different crops in total cropped area of Assam
88
3.2 Percentage area of major food grains in total food grains in Assam during 1959-60 to 2009-10
92
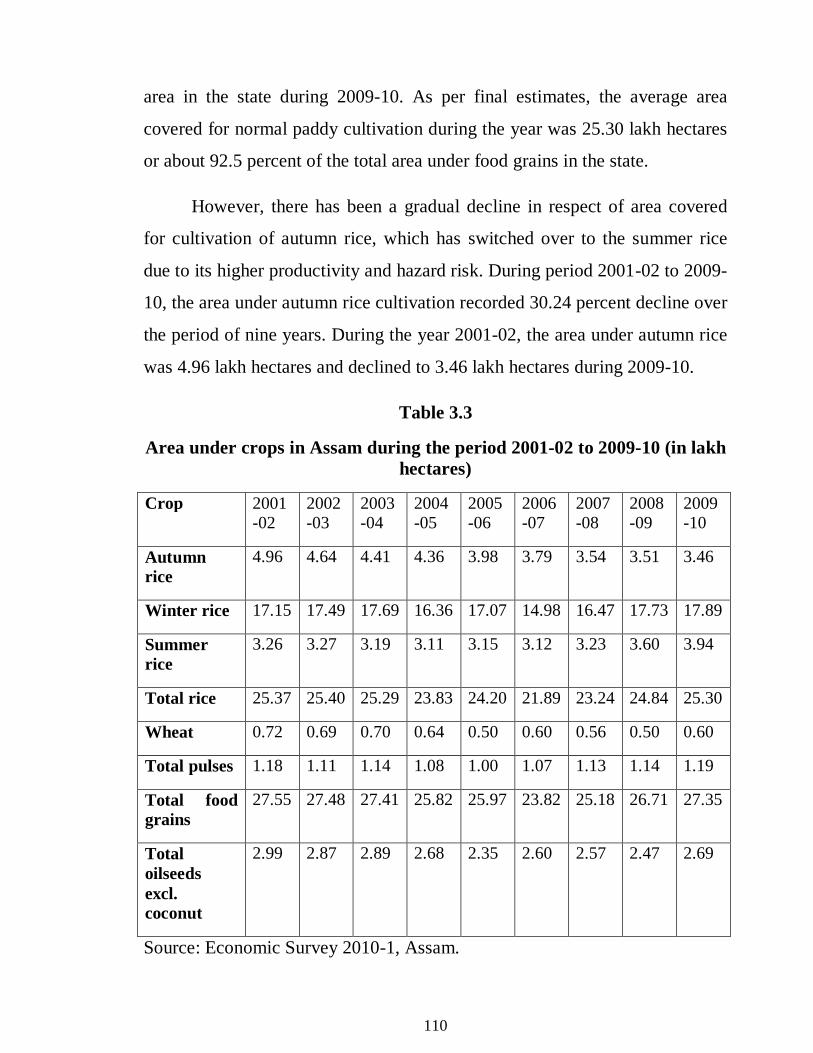
3.3 Area under crops in Assam during the period 2001-02 to 2009-10 (in lakh hectares)
93
3.4 Crop statistics of Sonitpur district (cropping pattern and yield rate) 2008-09 and 2010-11
95
3.5 Percentage of area under major crops to gross cropped area of the district in 2010-11
96
3.6 Index of agricultural production in Assam and India (base- triennium ending 1881-82=100)
105
3.7 Trends in total production of food grains in Assam (in lakh tonnes)
107
3.8 Area and yield of HYV of Rice in Assam (area: hectare; Yield: kg/ hectare)
109
3.9 Trends in production of major food grains in the District during 1999-2000 to2009-10 (P: production in ‘000tonnes, Y: yield rate in tonne/hectare)
111
3.10 Trends in production of major non-food grains in the district during 1999-2000 to2009-10 (P: production in ‘000tonnes, Y: yield rate in tonne/hectare, jute: production in ‘000bales and yield in bales/hectare)
114
3.11 Area and yield of HYV of rice in Sonitpur district (area: hectare; Yield: kg/ hectare)
118
4.1 Production of major food grains in the Sonitpur District during 1999-2000 to2009-10 (A: Area in ‘000hectare P: production in ‘000tonnes, Y: yield rate in tonne/hectare, C.V: Co-efficient of variance in percentage)
124
4.2 Production of major food grains in the Darrang District during 1999-2000 to2009-10 (A: Area in ‘000hectare P: production in‘000tonnes, Y: yield rate in tonne/hectare, C.V: Co-efficient of variance in percentage)
125
11
4.3 Production of major food grains in the BARPETA District during 1999-2000 to2009-10 (A: Area in ‘000hectare P: production in ‘000tonnes, Y: yield rate in tonne/hectare, C.V: Co-efficient of variance in percentage)
126
4.4 Production of major food grains in the NAGAON District during 1999-2000 to2009-10 (A: Area in ‘000hectare P: production in ‘000tonnes, Y: yield rate in tonne/hectare, C.V: Co-efficient of variance in percentage)
127
4.5 Production of major food grains in the DHUBRI District during 1999-2000 to2009-10 (A: Area in ‘000hectare P: production in ‘000tonnes, Y: yield rate in tonne/hectare, C.V: Co-efficient of variance in percentage)
128
4.6 Production of major food grains in the JORHAT District during 1999-2000 to2009-10 (A: Area in ‘000hectare P: production in ‘000tonnes, Y: yield rate in tonne/hectare, C.V: Co-efficient of variance in percentage)
129
4.7 Production of major food grains in the KARBI ANGLONG District during 1999-2000 to2009-10 (A: Area in ‘000hectare P: production in ‘000tonnes, Y: yield rate in tonne/hectare, C.V: Co-efficient of variance in percentage)
130
4.8 Production of major FOOD GRAINS in Assam during 1999-2000 to 2009-10 (A: area in lakh hectare, P: production in ‘000tonnes, Y: yield rate in tonne/hectare, C.V: Co-efficient of variance in percentage)
133
4.9 Production of major non-food grains in the SONITPUR District during 1999-2000 to2009-10 (A: Area in ‘000hectare, P: production in ‘000tonnes, Y: yield rate in tonne/hectare, jute: production in ‘000bales and yield in bales/hectare, C.V:Co-efficient of variance in percentage).
135
4.10 Production of major non-food grains in the DARRANG District during 1999-2000 to2009-10 (A: Area in ‘000hectare, P: production in ‘000tonnes, Y: yield rate in tonne/hectare, jute: production in ‘000bales and yield in bales/hectare, C.V:Co-efficient of variance in percentage).
136
4.11 Production of major non-food grains in the BARPETA District during 1999-2000 to2009-10 (A: Area in ‘000hectare, P: production in ‘000tonnes, Y: yield rate in tonne/hectare, jute: production in ‘000bales and yield in bales/hectare, C.V:Co-efficient of variance in percentage).
137
12
4.12 Production of major non-food grains in the NAGAON District during 1999-2000 to2009-10 (A: Area in ‘000hectare, P: production in ‘000tonnes, Y: yield rate in tonne/hectare, jute: production in ‘000bales and yield in bales/hectare, C.V:Co-efficient of variance in percentage).
138
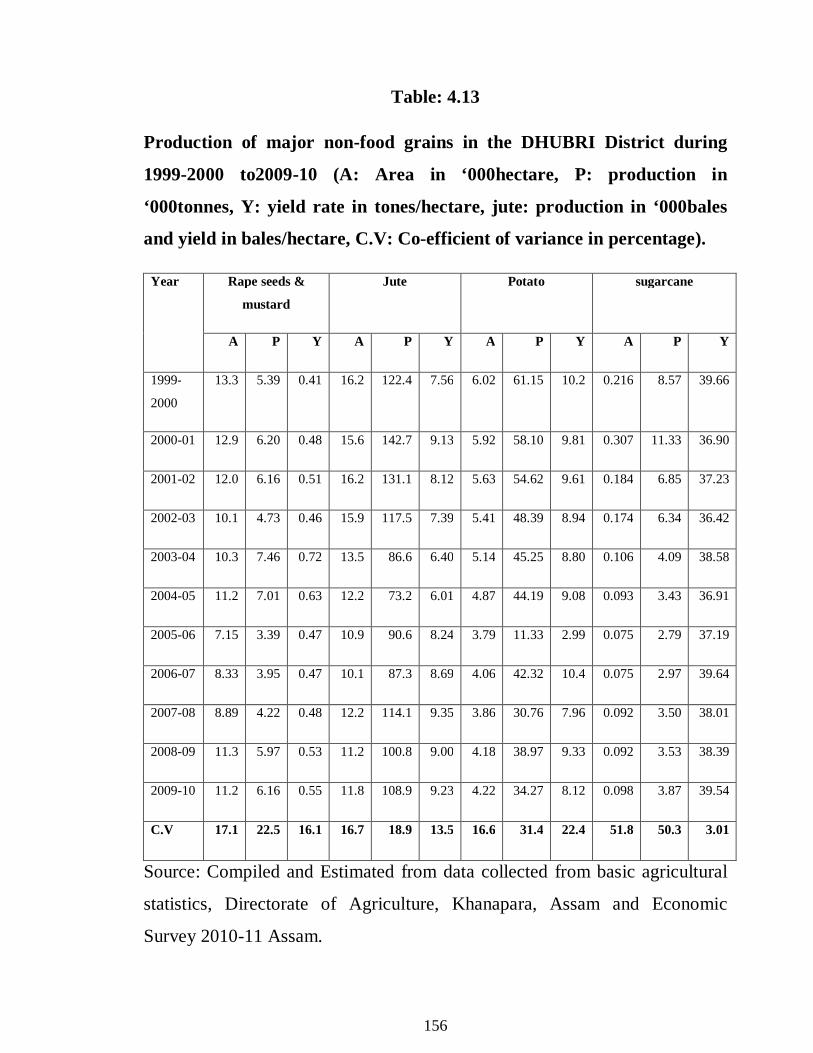
4.13 Production of major non-food grains in the DHUBRI District during 1999-2000 to2009-10 (A: Area in ‘000hectare, P: production in ‘000tonnes, Y: yield rate in tonne/hectare, jute: production in ‘000bales and yield in bales/hectare, C.V:Co-efficient of variance in percentage).
139
4.14 Production of major non-food grains in the JORHAT District during 1999-2000 to2009-10 (A: Area in ‘000hectare, P: production in ‘000tonnes, Y: yield rate in tonne/hectare, jute: production in ‘000bales and yield in bales/hectare, C.V: Co-efficient of variance in percentage).
140
4.15 Production of major non-food grains in the KARBI ANGLONG District during 1999-2000 to2009-10 (A: Area in ‘000hectare, P: production in ‘000tonnes, Y: yield rate in tonne/hectare, jute: production in ‘000bales and yield in bales/hectare, C.V: Co-efficient of variance in percentage).
141
4.16 Production of major NON-FOOD GARINS in ASSAM during 1999-2000 to 2009-10 (A: area in lakh hectare, P: production in ‘000tonnes, Y: yield rate in tonne/hectare, jute: production in ‘000bales and yield in bales/hectare, C.V: Co-efficient of variance in percentage)
144
4.17 Inter-district variation in AREA, PRODUCTION AND YIELD RATE major food gains during the period 1999-2000 to 2009-10 of selected districts of Assam, (Co-efficient of variance in percentage)
146
4.18 Inter-district variation in AREA, PRODUCTION AND YIELD RATE major non-food gains during the period 1999-2000 to 2009-10 of selected districts of Assam, (Co-efficient of variance in percentage)
149
4.19 Inter-state variation in YIELD RATE of major food gains during the period 1999-2000 to 2009-10 of selected districts of Assam, (yield rate in tonne/hectare, C.V: Co-efficient of variance in percentage)
152
4.20 Inter-state variation in YIELD RATE of major non-food gains during the period 1999-2000 to 2009-10 of selected districts of Assam, (yield rate in tonne/hectare, for jute yield rate: bales/hectare, C.V: Co-efficient of variance in percentage)
154
13
5.1 Compound Growth Rate in area, production and productivity of selected crops in Assam and Sonitpur district (in percentage) during 1999-2000 to 2009-10
163
5.2 Gross area irrigated under govt. irrigation facilities in Assam (area in hectare)
173
5.3 List of operating Minor Irrigation Schemes (FIS/LIS/DTW) under Tezpur Division (FIS: Flow Irrigation Scheme, LIS: Lift Irrigation Schemes, DTW: Deep Tube Well Scheme, STWS: Shallow Tube Well Scheme, NIA: Net Irrigated Area, AIA: Aggregate Irrigated Area)
174
5.4 Completed Schemes under Biswanath Chariali Division (Irrigation)
175
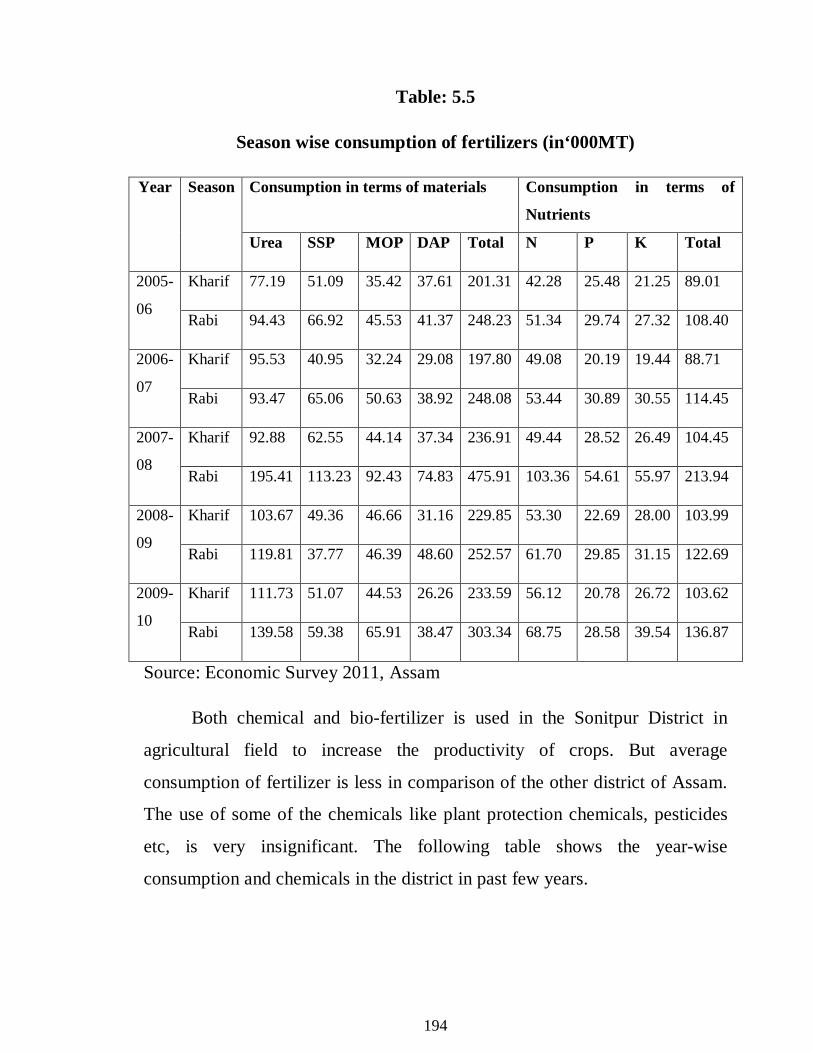
5.5 Season wise consumption of fertilizers (in‘000MT) 177
5.6 Consumption of fertilizers and chemicals in Sonitpur district (in MT)
178
5.7 Credit flow to agriculture and allied activities under Annual Credit Plan
179
5.8 Sectoral Contribution in percentage to Gross State Domestic Product at constant (2004-05) prices
185
6.1 Agricultural Holdings According to Agricultural Censuses of Assam 2000-01 and 2005-06
193
6.2 Operational land holdings in Sonitpur District 194
6.3 Season-wise Rainfall Pattern in Assam and Sonitpur District (in mm)
196
6.4 Crop-wise Area Affected Due to Flood in Assam 2010 (area in hectare)
198
6.5 District-wise Agricultural & Horticultural Crop Area of Small & Marginal Farmers (SMF) Affected due to Flood in Assam, 2010
200
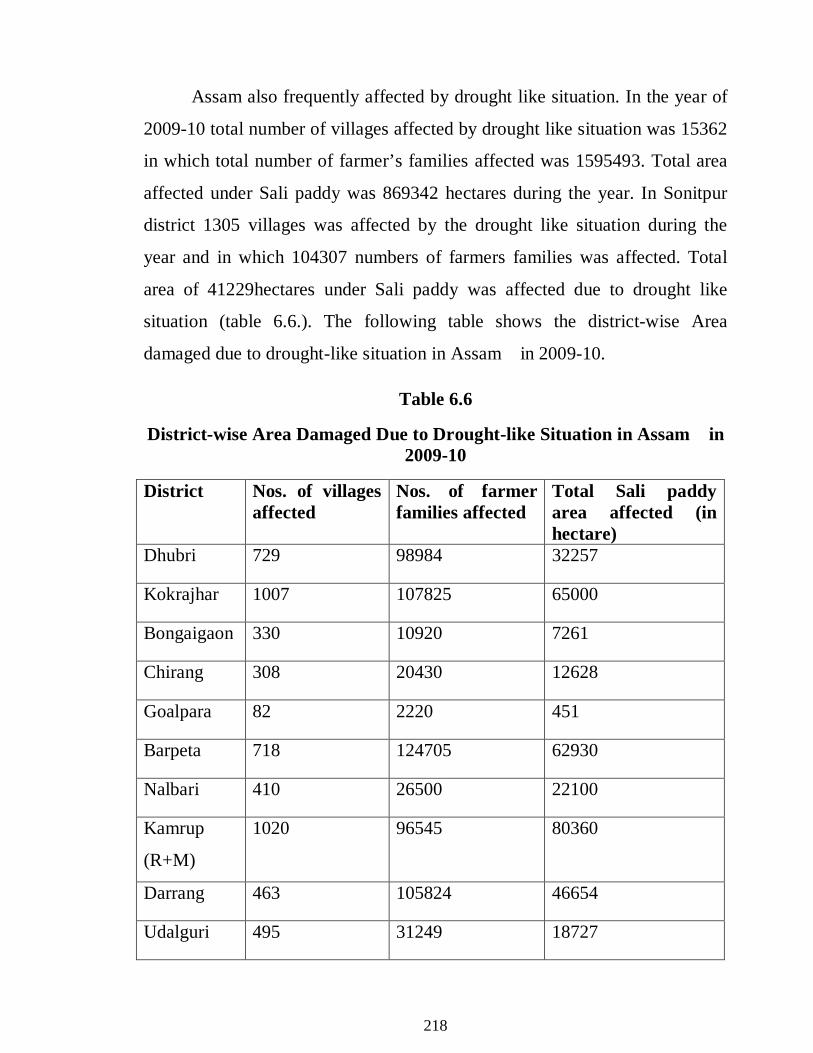
6.6 District-wise Area Damaged Due to Drought-like Situation in Assam in 2009-10
201
6.7 Crop Season-wise Area Irrigated during the year 2009-10 (provisional) (in hectares)
205
6.8 Consumption of Fertilizer per hectare (kg/hectare) 209
14
6.9 Market Infrastructure and Processing Units Developed in Assam
220
6.10 Road Network in Assam (in km) 223
7.1 Demographic Characteristics of the Sample Respondents (Age & Sex Composition of the Sample Respondent) (figure in bracket is in % term)
232
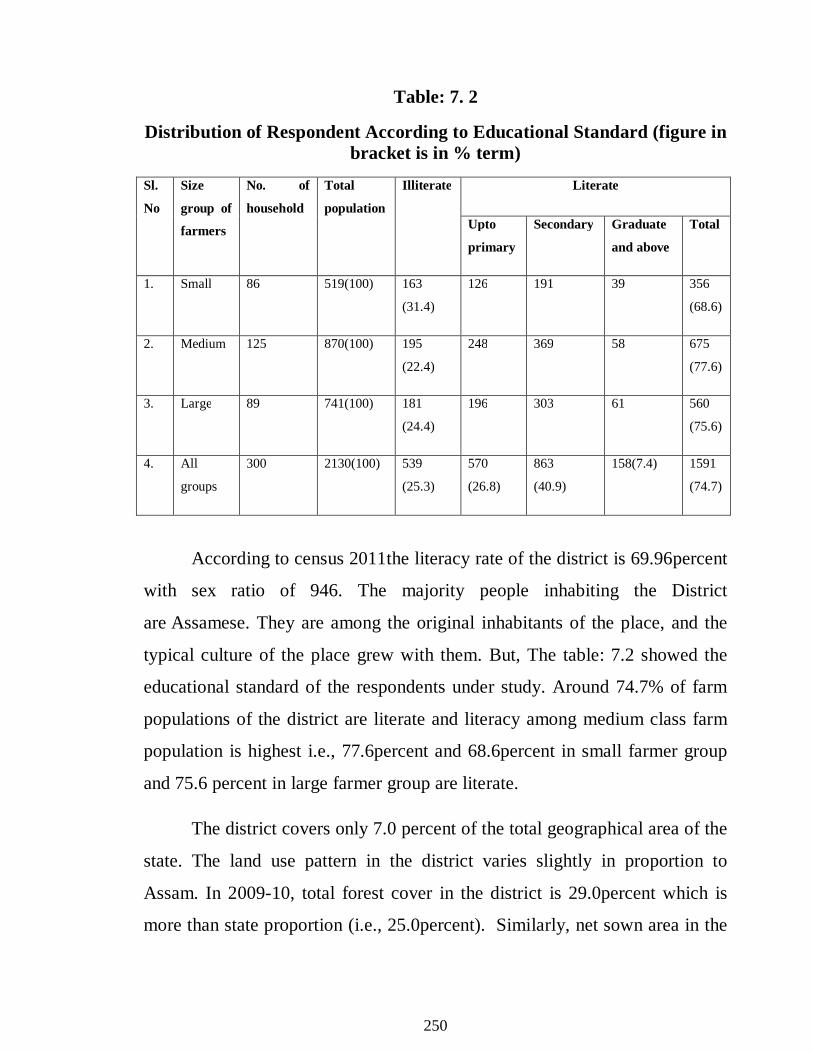
7.2 Distribution of Respondent According to Educational Standard (figure in bracket is in % term)
233
7.3 Farm Structure with Respect to different Size Group (land in hectare) (figure in brackets are in percentage)
234
7.4 Distribution of Livestock among the different size group of farm (in bracket av. no. per household)
235
7.5 Distribution of farm implements (in bracket av. no. per household)
236
7.6 Cropping Pattern and Cropping Intensity with respect to different size groups during 2010-11(area in hectare)
237
7.7 Utilization of different Farm Inputs used in Production of Rice 239
7.8 Farmer’s Response to different Production Problems according to different size group (response in percentage)
241
7.9 Farmer’s Response to different Post Harvesting and Marketing Problems (response in percentage)
242
LIST OF FIGURES:
Page No.
3.1 Area under different crops in total cropped area of Assam (2009-10)
90
3.2 Area of different rice in total rice area of Assam (2009-10) 91
3.3 Area of major crops to the gross cropped area in 2010-11 of the district (in percentage)
97
3.4 Area under different rice crop to total area under rice in 2010-11 (in percentage)
98
3.5 Trends in production of food-grains in Assam (in lakh tonnes) during last 10years
108
14
6.9 Market Infrastructure and Processing Units Developed in Assam
220
6.10 Road Network in Assam (in km) 223
7.1 Demographic Characteristics of the Sample Respondents (Age & Sex Composition of the Sample Respondent) (figure in bracket is in % term)
232
7.2 Distribution of Respondent According to Educational Standard (figure in bracket is in % term)
233
7.3 Farm Structure with Respect to different Size Group (land in hectare) (figure in brackets are in percentage)
234
7.4 Distribution of Livestock among the different size group of farm (in bracket av. no. per household)
235
7.5 Distribution of farm implements (in bracket av. no. per household)
236
7.6 Cropping Pattern and Cropping Intensity with respect to different size groups during 2010-11(area in hectare)
237
7.7 Utilization of different Farm Inputs used in Production of Rice 239
7.8 Farmer’s Response to different Production Problems according to different size group (response in percentage)
241
7.9 Farmer’s Response to different Post Harvesting and Marketing Problems (response in percentage)
242
LIST OF FIGURES:
Page No.
3.1 Area under different crops in total cropped area of Assam (2009-10)
90
3.2 Area of different rice in total rice area of Assam (2009-10) 91
3.3 Area of major crops to the gross cropped area in 2010-11 of the district (in percentage)
97
3.4 Area under different rice crop to total area under rice in 2010-11 (in percentage)
98
3.5 Trends in production of food-grains in Assam (in lakh tonnes) during last 10years
108
15
3.6 Trends in production of RICE and WHEAT in SONITPUR DISTRICT (in ‘000 tonnes) during last 10years
113
3.7 Trends in production of PULSES and MAIZE in SONITPUR DISTRICT (in ‘000 tonnes) during last 10years
113
3.8 Trends in production of OILSEEDS (in ‘000 tonnes) and JUTE (in ‘000 bales) in SONITPUR DISTRICT during last 10years
116
3.9 Trends in production of POTATO and SUGARCANE in SONITPUR DISTRICT (in ‘000 tonnes) during last 10years
117
5.1 Growth in area, production and productivity of RICE in Sonitpur district and Assam (in percentage) during 1999-2000 to 2009-10
164
5.2 Growth in area, production and productivity of WHEAT in Sonitpur district and Assam (in percentage) during 1999-2000 to 2009-10
164
5.3 Growth in area, production and productivity of MAIZE in Sonitpur district and Assam (in percentage) during 1999-2000 to 2009-10
165
5.4 Growth in area, production and productivity of PULSES in Sonitpur district and Assam (in percentage) during 1999-2000 to 2009-10
165
5.5 Growth in Area, Production and Productivity of RAPE SEEDS AND MUSTARD in Sonitpur district and Assam (in percentage) during 1999-2000 to 2009-10
169
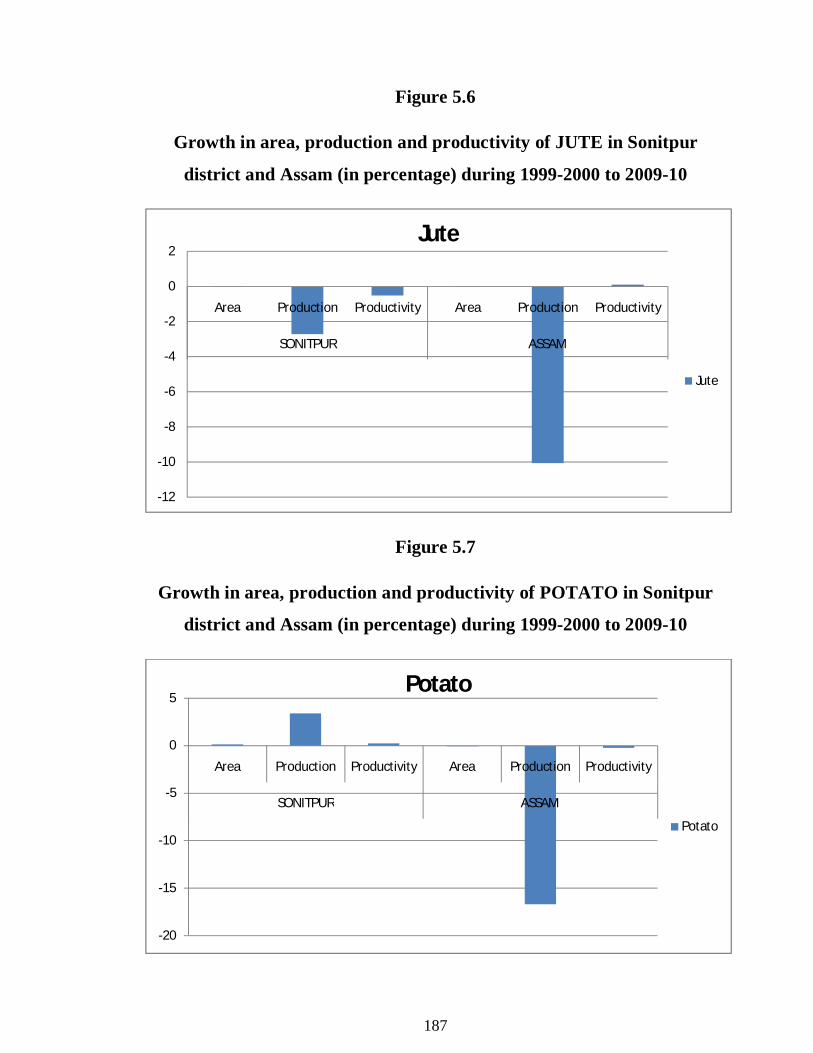
5.6 Growth in area, production and productivity of JUTE in Sonitpur district and Assam (in percentage) during 1999-2000 to 2009-10
170
5.7 Growth in area, production and productivity of POTATO in Sonitpur district and Assam (in percentage) during 1999-2000 to 2009-10
170
5.8 Growth in area, production and productivity of SUGARCANE in Sonitpur district and Assam (in percentage) during 1999-2000 to 2009-10.
171
5.9 Sectoral Composition of GSDP (in percentage) 186
16
ABBREVIATIONS
AACP : Assam Agricultural Competitiveness Project AAU : Assam Agriculture University AC : Agricultural Census ACCP : Assam Agricultural Competitive Project ADO : Agricultural Development Officer AGMARKNET : Agricultural Marketing Network AIA : Aggregate Irrigated Area ARDC : Agricultural Refinance and Development Corporation ASAMB : Assam State Agricultural Marketing Board ASC : Assam Seeds Corporation ASMIDC : Assam State Minor Irrigation Development Corporation ASMIDC : Assan State Minor Irrigation Development Corporation
Limited ASRTC : Assam State Road Transport Corporation BAO : Block Agricultural Officer BC : Before Christ BCA : Bio-Control Agent BDO : Block Development Officer BNCA : Biswanath College of Agriculture CDB : Community Development Block CL : Crop Loans CMIE : Centre for Monitoring Indian Economy CV : Co-efficient of Variation DTW : Deep Tube Well Scheme FFS : Farmers Field School FIS : Flow Irrigation Scheme FMC : Field Management Committee FYP : Five-Year Plan GDDP : Gross District Domestic Product GDP : Gross Domestic Product GPCS : Gaon Panchayat Level Co-operative Societies GR : Green Revolution
17
GSDP : Gross State Domestic Product HP : Horse Power HTM : Horticulture Technology Mission HYV : High Yielding Varieties ICAR : Indian Council of Agricultural Research IPM : Integrated Pest Management KCC : Kishan Credit Card LIS : Lift Irrigation Schemes MAR : Mean Annual Rainfall MAT : Mean Annual Temperature MT : Million Tonnes NA : Not Available NABARD : National Bank for Agricultural and Rural Development NAIS : National Agricultural Insurance Scheme NCAER : National Council of Applied Economic Research NDDP : Net District Domestic Product NEDFI : North East Development Finance Corporation Ltd NIA : Net Irrigated Area NPK : Nitrogen-Phosphorous-Potassium(Kelium) RMC : Regulated Market Committees RPM : Rural Primary Markets RRB : Regional Rural Banks SBCL : State Bio-Control Laboratory SHG : Self Help Groups SLBC : State Level Bankers’ Committee SMY : Sub-Market Yards SRR : Seed Replacement Rate SSCA : State Seed Certification Agency STW : Shallow Tube Well STWS : Shallow Tube Well Scheme WTO : World Trade Organization
19
CHAPTER 1
1.1. INTRODUCTION
Agriculture constitutes an indispensable contributing sector towards the
national income and employment, mainly in third world countries or in
developing countries. The word agriculture is the English adaptation of Latin
agricultura, from ager, "a field" and cultura, "cultivation" in the strict sense of
"tillage of the soil". Thus, a literal reading of the word yields "tillage of a field
/ of fields". Agriculture refers to the production of food and fiber and other
goods through farming and forestry. Agriculture was a key development that
led to the rise in civilization rising of domesticated animals. It was developed
at least 10,000 years ago, and it has undergone significant developments since
the time of the earliest cultivation. Evidences point out to the Fertile Crescent
of the Middle East as the site of the earliest planned sowing and harvesting of
plants that had previously been gathered in the wild. Independent
development of agriculture is also believed to have occurred in Northern and
Southern China, Africa's Sahel, New Guinea and several regions of the
America.
The Neolithic founder crops of agriculture appear first ever was wheat
and einkorn wheat, then hulled barley, peas, lentils, bitter vetch, chick peas
and flax. Bitter vetch and lentils along with almonds and pistachios appear in
Franchthi Cave Greece simultaneously, about 9,000 BC. Neither is native to
Greece, and they appear 2,000 years prior to domesticated wheat in the same
location. This suggests that the cultivation of legumes and nuts preceded that
of grain in some Neolithic cultures.
20
By 7000 BC, small-scale agriculture reached Egypt. From at least 7000
BC the Indian subcontinent saw farming of wheat and barley, as attested by
archaeological excavation at Mehrgarh in Balochistan. By 6000 BC, mid-
scale farming was entrenched on the banks of the Nile. About this time,
agriculture was developed independently in the Far East, with rice, rather than
wheat, as the primary crop. Chinese and Indonesian farmers went on to
domesticate taro and beans including Mung, Soya and Azuki. To complement
these new sources of carbohydrates, highly organized net fishing of rivers,
lakes and ocean shores in these areas brought in great volumes of essential
protein. Collectively, these new methods of farming and fishing are
inaugurated a human population boom dwarfing all previous expansions, and
is one that continues today. By 5000 BC, the Sumerians had developed core
agricultural techniques including large-scale intensive cultivation of land,
mono-cropping, organized irrigation, and use of a specialized labour force,
particularly along the waterway now known as the Shatt al-Arab, from its
Persian Gulf delta to the confluence of the Tigris and Euphrates.
Domestication of wild aurochs and mouflon into cattle and sheep,
respectively, ushered in the large-scale use of animals for food/fiber and as
beasts of burden. The shepherd joined the farmer as an essential provider for
sedentary and semi-nomadic societies. Maize, manioc, and arrowroot were
first domesticated in America as far back as 5200 BC.
The potato, tomato, pepper, squash, several varieties of bean, tobacco,
and several other plants were also developed in the New World, as was
extensive terracing of steep hillsides in much of Andean South America. The
Greeks and Romans built on techniques pioneered by the Sumerians but made
few fundamentally new advances. Southern Greeks struggled with very poor
21
soils, yet managed to become a dominant society for years. The Romans were
noted for an emphasis on the cultivation of crops for trade.
During the Middle Ages, Muslim farmers in North Africa and the Near
East developed and disseminated agricultural technologies including
irrigation systems based on hydraulic and hydrostatic principles, the use of
machines such as norias, and the use of water raising machines, dams, and
reservoirs. They also used location-specific farming manuals, and were
instrumental in the wider adoption of crops including sugar cane, rice, citrus
fruit, apricots, cotton, artichokes and saffron. Muslims also brought lemons,
oranges, cotton, almonds, figs and sub-tropical crops such as bananas to
Spain. The invention of a three-field system of crop rotation during the
Middle Ages, and the importation of the Chinese-invented moldboard plow,
vastly improved agricultural efficiency. Another important development
towards the end of this period was the discovery and subsequent cultivation of
fodder crops that allowed over-wintering of livestock. By the early 1800s,
agricultural techniques, implements, seed stocks and cultivated plants selected
and given a unique name because of its decorative or useful characteristics
had so improved that yield per land unit was many times that seen in the
Middle Ages. With the rapid rise of mechanization in the late 19th and 20th
centuries, particularly in the form of the tractor, farming tasks could be done
with a speed and on a scale previously impossible. These advances have led
to efficiencies enabling certain modern farms in the United States, Argentina,
Israel, Germany, and a few other nations to output volumes of high quality
produce per land unit at what may be the practical limit.
Indian agriculture began by 9000 BC through adoption of early
cultivation of plants and domestication of crops and animals. Settled life soon
22
followed with implementation and techniques being developed for
agriculture. The middle age saw irrigation channels reach a new level of
sophistication in India. Indian crops were affecting the economies of other
region of the world under Islamic Patronage. Land and water management
system were developed with an aim of providing uniform growth in the
economy. At present, agriculture is considered as the backbone of the Indian
economy. More than 60percent of our total population earn their livelihood
from agriculture. Besides, the growth of Indian economy requires a high
degree of agricultural development to sustain a desirable rate of economic
growth. Agricultural development would generally lead to more employment
opportunities in the construction of small irrigation works, drainage system,
contour bounding, terracing etc. It is well recognized fact that, the agriculture
is the largest sector of economic activity and plays a crucial role in India’s
economic development by providing food and raw materials and employment
to a large proportion of the population. Food grains play a major role in
agricultural production, which constitutes 65 percent (CMIE, Dec 2008) of
the gross cropped area of the country. Rice and Wheat among the cereals and
Maize among the millets take a large share in the country’s agricultural
economy. Pulses are also grown in different quantities in different regions of
the country.
However, the importance of development of agriculture in India is to
strengthen the rural economy of the country has been emphasized by scholars,
administrators since the beginning of the twentieth century. Indian agriculture
in the pre-independence period was usually described as a gamble of
monsoons. There had been a great deal of uncertainty about crop prospects, as
monsoons played a decisive role in determining agricultural output and their
failures resulted in widespread famine and misery. At the time of our
23
independence, the country had to depend on imports to meet the domestic
demand for food.
After independence, particularly since 1951, the Planning Commission
has initiated various programmes for development of agriculture and the
sector was given highest priority so that the country can produce enough food
to meet the growing requirement of its burgeoning population. In spite of the
fact that agriculture was given the topmost priority on almost every Five Year
Plan, the first two decades after independence witnessed a slow pace in the
growth of agricultural production. From the base of 50 million tonnes in
1950-51, the food grain production had risen only to 75 million tonnes by mid
sixties (Mander & Sharma, 1995) and till then the country had to depend on
imports of food, which led to crisis of foreign exchange reserves and balance
of payments. The introduction of new technology during the Fourth plan has
changed the shape of Indian agriculture. The New Agricultural Strategies
(popularly known as Green Revolution) had emerged as a big hope from the
cropping session of 1966-67 and consequently India’s production of food
grains especially that of wheat and rice increased sharply. The total food
grains production in 1950-51 was 51 million tonnes, which increased to 82.0
million tonnes in 1960-61, 108.4 million tonnes in 1970-71, 129.6 million
tonnes in 1980-81,176.4 million tonnes in 1990-91,196.8 million tonnes in
2000-01, 233.9 million tonnes in 2008-09. This shows that the country has
definitely achieved considerable improvement in agricultural production.
However, the new technology did not bring about a breakthrough
uniformly in agricultural production in all the states of the country. Progress
made by some states in this field has been better as compared to others. Such
variations in production are also found in different districts of a particular
24
state. However, in a vast country like India with marked regional diversities
in agro-climatic environment, resource endowment and population density is
likely to be characterized by uneven development among regions. The
performance of agricultural sector of eastern India, which is characterized by
rain fed agriculture, had remained somewhat dismal. Uttar Pradesh and west
Bengal have shown a strong growth particularly in rice and wheat since early
1980s. In Assam, the yield rates of some principal crops such as rice, wheat,
jute, sugarcane, rape and mustard etc have increased slightly from 1960-61 to
2007-08. However, the productivity of major crops in Assam is far less than
the national average.
North-Eastern region of India has got its definite identity due to its
peculiar physical, economic and socio-cultural characteristics. The economy
of North-Eastern India is also full of potentialities as different valuable
natural resources are within the possession of this region. The region
comprises of eight states namely, Arunachal Pradesh, Assam, Manipur,
Meghalaya, Mizoram, Nagaland, Sikkim and Tripura having foreign
boundary with Bangladesh in the west, Myanmar in the east and Tibet region
of China and Bhutan in the north. The region may be safely divided into two
broad division—Plain region which comprise of 27 percent (i.e.68.96 lakh
hectares) of the total geographical area of NER and Hill region which
comprise of the states like Arunachal Pradesh Meghalaya, Mizoram, Manipur,
Sikkim, Nagaland and Karbi Anglong and North Cachar hills of Assam. In
the region the monsoons usually start in June and last until the end of
October. Rainfall in the region is usually heavy due to its peculiar
geographical position. The annual rainfall ranges from 70 inches in plains to
250 inches or more in the hills. The soil of NER is normally acidic in nature.
There is much acidity on the soil of the hills whereas new alluvial soils
25
representing the lands on the river banks are less acidic. The phosphoric
content of the upper Brahmaputra valley where tea is grown is good but it is
low in the lower valley. There is high proportion of nitrogen and organic
matters in the soil of hill areas in the region. In the hill states of the region,
fruit trees respond quickly as its soil contain heavy clays with a high
percentage of organic matter. The development of secondary and tertiary
sector in the region is comparatively poor; more than 60 percent of the total
population in the region depends on agriculture for its livelihood.
Assam is the North-Easternmost state of the Indian union and is located
between 24˚08' and 27˚58'N latitudes and 89˚42'E and 96˚01'E longitudes.
Geographically, Assam is surrounded by Bhutan and Arunachal Pradesh on
the North, Nagaland and Manipur on the East, Meghalaya and Mizoram on
the South and Bangladesh, Tripura and West Bengal on the West. Since
independence, many changes have taken place in Assam geographically and
in many other respects. At present, total land area of it is 78, 523 sq. kms. It
accounts 2.4% of the total geographical area of the country. Demographically,
Assam is the most populous state in the North East India. Economically, out
of the eight North East States, Assam is comparatively more developed than
the others. But compared to other states like Maharashtra, Tamil Nadu,
Gujarat, Assam lags far behind in almost all economic spheres. The economy
of the state is predominantly agricultural with a total cultivable area of 38.39
lakh hectare (2007-08) which constitutes 48.9percent of the total geographical
area. Net shown area (more than once) is about 10.86 lakh hectares, which is
about 28.3 percent of the cultivable area. The cropping intensity of the state is
139.4percent (2007-08) (Directorate of Agriculture, Govt. of Assam 2011).
The average operational holding is 1.15 hectare only and more than 83 per
cent of the farmer family is small and marginal farmers. The contribution of
26
the agriculture sector to the GSDP (at constant prices; 1999-2000 prices) was
pegged at 22.85 per cent in 2007-08(Quick estimate) after steady decline from
32.24 per cent in 1999-2000. However, this sector continues to support more
than 75 per cent population of the State directly or indirectly providing
employment of more than 53 per cent of the workforce. The state is producing
both food and cash crops. The main food crops in Assam include rice, wheat,
pulses, potato, maize and the cash crops of the state are tea, jute, oil seeds,
and sugarcane. The area under food crops in Assam increased up to 26.70
lakh hectare in 2008-09(NEDFI Databank), which accounts for nearly 65.6
percent of the total cultivable area of the state. Among various important
crops in the state, the area under rice dominated the position, sharing about
92.2 of total food cropped area in 2007-08.1
Geographically, Assam is divided into two valley ---- Brahmaputra
valley and Barak valley. Sonitpur district is situated in the North bank of
Brahmaputra valley. It is an important district from both economic and
historical point of view. Sonitpur district lies between 92°16' to 93°43' East
longitudes and 26°30' to 27°01' North latitudes. It covers an area of 5324 sq.
km. Total geographical area covered by the district was only 6.8% of total
geographical area of Assam. The border of the district attach with Arunachal
Pradesh in the north, lifeline of Assam river Brahmaputra in the south,
Lakhimpur district in the east and Darrang district in the west. The district has
3 Sub-divisions, 14 Development Blocks and 3 Agricultural Sub-division and
1693 villages. Agriculture is the main source of livelihood of the population
of the district. More than 60% of population engaged in Agriculture. The
main crops of the district are rice, tea, pulses, oil seeds (mustered), jute, and
sugarcane. The economy of the district is predominantly agrarian and village 1 Economic Survey, Assam 2008-09
27
centric. The total cropped area in the district is 146128 hectare, which is only
3.66% of total cropped area of the state. As per 2011 census total numbers of
farmer families was 157118, out of which 37% is small farmers, 35%
marginal farmers and 16% landless farmers and 12% big farmers. Tea is the
important Cash Crops in the district. There are 88 tea gardens in the district
covering 30.6% of total cultivable area under ADO Circle. The main crops
cultivated in the district are rice wheat, jute, tea, sugarcane, maize, oilseeds,
etc. There is the variation in yearly production of the main crops in the
district. The yield rate of some of the crops in the district similar to the state
average, but it is quite low in comparison to the leading states in India. For
example, the yield rate of wheat in the state is quite low in comparison to the
national average i.e. 2762 kg/hec. in 2001-02 and 2700 kg/hec in 2008-09 and
in Punjub it was 4179 kg/hec. Similarly productivity of oil seeds is also low
(750kg/hec) to national average of 925 kg/hec in 2008-09.
The agriculture, which is the main source of livelihood in the State as
well as in the District are suffering from low productivity. The agricultural
sector in the district has not developed significantly. Agriculture in Assam
solely depends on vagaries of monsoons, which creates unexpected havoc on
the agricultural production in the district as well as in the state. Except tea
plantation, the annual crop cultivation, the small peasant families who are
living in rural societies carry out especially food crops. But it is disappointing
to note that they have been facing varieties of problems over which they have
little control because of extreme lack of capital, technical know how and other
resources. The important problems constraining agricultural development and
innovation in the district may be summarized in four categories as --- natural,
biological, techno-economic and socio-cultural. The natural problems include
flood, drought, soil erosion, etc. The biological problems are pests and
28
diseases, unhealthy peasants and draught animals; while the problems such as
surplus manpower, insignificant use of inputs like improved seeds, fertilizers,
pesticides and insecticides, modern implements, irrigation, finance,
inadequate market facilities and price incentives, adverse land policy and
legislation, lack of agricultural research and inefficient extension services are
included in techno-economic problems. Among the multitude of socio-
cultural problems, conservative outlook of the farmers, ill fatalism, ignorance,
illiteracy and antiquated organization of agriculture are found to be of great
importance.
1.2. NEEDS AND SIGNIFICANCE OF THE STUDY
Agriculture is considered as the mainstay of the economy of Assam and
thereby it stands as the backbone of the economy of the state. From the very
early period agriculture and its allied activities like animal husbandry, forestry
fishing etc. has been contributing the major portion to our state income. In
1950-51, agriculture and allied occupations contributed about 52.2% of the
total state income. Although the share of agriculture to the state income has
been declining gradually due to the growth of other sectors in the economy
but the share remain still high in comparison to the comparatively developed
states of the country. As for example, the share of agriculture to the state
income has declined to 32.1% in 1970-71 and then increased to 44.2% in
1980-81 and then declined to 22.89% in 2008-09(quick estimate) as compared
to that of 18% for all India.
In Assam more than two- third of our working population are engaged
in agriculture directly and thereby depends for their livelihood. As per 2011
census, about 56% of the total working force is engaged in agriculture and
allied activities. In 2001, cultivators alone constitute 52.4% of the total main
29
workers of the state and taking together the agricultural labourers, they
constitute about 70.2% of the total main workers of the state. In an
industrially developed states like Maharashtra, Gujarat, Tamil Nadu and West
Bengal, the proportion of people depending on agriculture for earning their
livelihood is much less in comparison to industrially backward state like
Assam.
Another important role of agricultural sector in the state’s economy is
that it is the only major source of food supply and thereby providing regular
supply of food materials to the increasingly growing population of the state.
In the pre-independence period, Assam was a food surplus state. But in the
post-independence period, the state is turned into a food deficit state due to
high rate of population and a comparatively slower growth rate in the
production of food grains. Total production of food grains in Assam has
increased from 16.79 lakh tonnes in 1960-61 to 35.04 lakh tonnes in 2007-08
(Directorate of Economics and Statistics). Besides agriculture in Assam has
been the major source of supply of raw materials to various important agro-
based industries of the state. Tea plantation is the source of raw materials for
the famous age old tea industry of Assam. Moreover, sugar industry,
vanaspati mills, oil crushing mills, rice husking mills, sericulture etc. are also
getting their necessary raw materials from the agricultural sector of the state.
Besides agriculture can provide a market for industrial products as increase in
the level of agricultural income may lead to expansion of market for various
industrial production of the state.
The prospect of planning in Assam also depends very much on
agricultural sector. A good crop always provides impetus towards a planned
economic development of the country by creating a better business climate for
30
the transport system, manufacturing industries, internal trade etc. A good crop
also brings a good amount of finance to the state government for meeting its
planned expenditure. Similarly, a bad crop leads to a total depression in the
business condition of the state, which ultimately leads to a failure of
economic planning. Thus the agricultural sector is playing an important role
in the state like Assam. Moreover, the backwardness of the economy of the
state has also resulted from poor condition of the state’s agriculture and
similarly the prosperity of the state’s economy still largely depends on
agricultural sector.
Similarly, agricultural sector is also playing an important role in the
Sonitpur District of Assam. Agriculture is the largest productive sector in the
district and it provides livelihood of more than 60% of total population, but
are suffering from low productivity. According to District wise physical target
of rice under 20 point programme for the year 2007-08, the yield rate of rice
is around 1500 kg/hec., whereas national average for year 2006-07 was 2125
kg/hec. The yield rate of wheat in the district is 1600 kg/hec whereas in
Punjub it was 4179 kg/hac in 2006-07 and national average is 2700 kg/hec.
for the same year. Similarly, the yield rate of rapeseeds and mustard was 750
kg./hec. whereas in national average was 925 kg/hec. in 2006-07. So,
productivity of the major crops is quite low in comparison to other states and
national average. There are different factors responsible for the low
productivity of agriculture sector in the district. The average size of
operational holdings is 1.27 hectares. Of the total operational holding 60% are
of size less than 1 hectare. This small holding along with growing
fragmentation of land stands in the way for modernization of agricultural
productivity in the state. Agricultural productivity in the district is also
affected by inadequate irrigation facility. Only 11.7% of total cropped area
31
was under irrigation facility whereas the state average was 17.17%, in Punjub
92.9%, in UP 68.7%, and in Bihar 49.4%. The farmers in the district are still
following the orthodox method of cultivation. They are still relying on
centuries old wood-plough and other traditional equipments, whereas some
other states like Punjub, Haryana, Andra-Pradesh, they replace their
technology with modern technology. The scanty use of HYV seeds and
fertilizer also affects the productivity of the district. The seeds replacement
rate was below 5% in the district whereas 10% is the state average. In other
states this rate is quite high. Similarly, consumption of fertilizer in the district
was only 20.55 kg/hec. Consumption of fertilizer in national average, it was
104.5 kg/hec. in 2004-05 and 113.3 kg/hec. in 2006-07. Besides, inadequate
credit facility to poor farmers in rural areas of the district also causes low
productivity in agricultural sector. The percentage share of rural sector to total
credit was only 10.6% in 2000-01. In contrast, the share of agricultural sector
in total bank credit was 18.9% in Punjab, 23.2% in Rajasthan, 17.7% in
Haryana and 17.9% in Andra-Pradesh in 2000-01. Due to all these reasons the
productivity of the agricultural sector in the district is quite low in respect to
other region. So, it is an urgent need to develop agricultural infrastructure in
the district so that the constraints regarding low productivity can be
minimized.
From the above short analysis it becomes necessary to study the
different aspects of constraints and prospects of agricultural development of
the district. The study becomes quite significant because, no research work
from the agricultural and economic perspective has been carried out in the
district so far. Besides, the study is considered to be of great significance not
only to the academicians but also to the planners for formulating agricultural
development strategy for the district. It is our endeavor to study the
32
“Problems and Prospects of Agricultural Sector in Assam- A case study of
Sonitpur District”. So it is hoped that this study will be of immense
importance for all concerns.
1.3. OBJECTIVES OF THE STUDY:
The main objectives of the study are-
1. To study the existing scenario of agricultural sector of Assam as
well as Sonitpur district.
2. To examine the productivity of the major crops of Assam in general
and Sonitpur district in particular since 1991 (Post reform period).
3. To identify the factors affecting in adoption of modern and
improved practices by farmers in the district of Sonitpur.
4. To evaluate the constraints and prospects of agricultural growth in
the state as well as Sonitpur district.
5. To suggest how Agricultural development can be expedited.
1.4. HYPOTHESIS FOR THE STUDY:
The proposed hypotheses for the study are as follows-
1. Agricultural productivity can be increased by providing adequate
infrastructure and input facility.
2. Agricultural Development in the District has been very much
insignificant.
3. The size of land holding and their fragmentation retards
efficiency of cultivation in the district.
1.5. RESEARCH METHODOLOGY:
The study attempts to examine the constraints and prospects of
agriculture in the District at both micro and macro level. Hence, the study
uses both primary and secondary data.
33
The macro level analysis is mainly based on secondary data. The
relevant secondary data will be collected mainly from the Directorate of
Economics and Statistics, Department of Irrigation, Directorate of Land
Records, Block Development Offices and other Govt. Departments and
agencies involved in agriculture and rural development. Land used and
cropped data will be collected from the Revenue Circle and District
Agriculture Offices. Besides, secondary data will be collected from Five Year
Plan documents, journals and periodicals, publications of research articles and
nongovernmental publications. On the other hand, population data can be
collected from census reports of India.
The micro level analysis is mainly based on Primary data collected by
carrying out field survey, interviewing on sampling basis. Data and
information from sample villages are collected through questionnaire.
Growth rates are expressed in two forms “linear” and “compound”. In
the study, compound growth rates have been estimated for area, production
and productivity by fitting a semi logarithmic trend function of the form:
푌 = 푒
Where, Y= Area/Production/Yield
a= Constant
b= Growth Rate
t= Time.
34
In order to measure variability, co-efficient of variation and standard
deviation have been estimated for different period using the following
formula:
(i) C.V= Standard Deviation/Mean
(푖푖) 푆.퐷 = ∑( ) /
Where, N=Total Number of Observation
Xi=Area/Production or Productivity
X=Mean of the Distribution
Further, variance of production is decomposed into its constituent
sources viz. area variance, yield variance, area-yield co-variance and higher
order interaction between area and yield to examine the source of instability.
In order to study inter-district variation in cropping pattern, percentages
of area under principal crops across the state’s district at different points of
time are calculated. To minimize the influence of seasonal factors triennial
averages of the area of principal crop/crop categories are calculated.
Percentage change of area under different crops has been worked out.
1.6. PLAN OF STUDY:
The plan of study is based on the following tentative chapters.
Chapter 1: Introduction. This chapter has been exclusively devoted for the
introduction of agriculture in the state and the district in particular, its
background, needs and objectives etc. the discussion in the chapter is done on
the following sub-heads:
35
a. The background of the study.
b. Needs and significant of the study
c. Objectives of the study.
d. Hypothesis of the study.
e. Research methodology.
f. Chapterisation.
g. Periodicity of the study.
h. Review of literature.
i. Limitations of the study.
Chapter 2: Existing Scenario of Agriculture and Land Use Pattern in
Assam as well as Sonitpur District. The present state of agricultural
economy of Assam and district has been highlighted in this chapter. The
climate, rainfall, quality of soil in the different agro-climatic zones, nature of
cropping pattern, land holding system, land use pattern have been examined
in this chapter.
Chapter 3: Cropping Pattern and Trends in Productivity of Selected
Crops during Post Reform Period in the District. In this chapter variation
of cropping pattern under the principal crops in the district and across the
state’s district has been discussed by using appropriate statistical technique.
Trends in productivity of some selected crops also discussed in this chapter.
Chapter 4: Inter-District Variation in Productivity of Selected Crops in
Assam. In this chapter variation in productivity of selected crops across the
state’s districts has been discussed. A comparative study with agriculturally
developed state has been done in this chapter.
36
Chapter 5: Economic Reforms and its Impact on Agricultural Sector in
Assam as well as Sonitpur District. This chapter has been exclusively
devoted for the study of impacts of economic reforms adopted by Indian
government under New Economic Policy 1991, on the agricultural sector of
Assam and the district in particular. A comparative study of agricultural
production of the state with that of some of the major agricultural state of the
country has also been made in this chapter.
Chapter 6: Constraints and Prospects of Agricultural Sector in Assam as
well as Sonitpur District. This chapter deals with the factors affecting
agricultural productivity in the district and the state as well. It examines the
degree of impact of these factors on agriculture and also analyzes the future
prospects of the sector.
Chapter 7: Summary of Findings, Recommendations and Conclusions.
This is the concluding chapter summarizes the findings of the study. A
discussion on policy measure for stepping up agricultural productivity in the
district and in the state has been discussed in this chapter.
1.7. PERIODICITY OF THE STUDY:
The study of constraints and prospects of agricultural sector in Assam
is mainly concentrated on the agricultural productivity of Sonitpur District.
The main emphasis of the study is given on the agricultural productivity and
factors affecting the performance of main crops in the district during 2000-
2010.
1.8. REVIEW OF LITERATURE:
Although agriculture is an important sector of an economy, importance
of formal study on this sector attracted the attention of researchers as early as
in the time of Adam Smith. All the classical economists were interested in
37
studying the growth behaviour of agriculture for explaining the growth of the
economy. First attempt of agricultural study was made by Baker (1926),
Johnson (1925-26), Jones (1928-30) and Taylor (1930). Their study devoted
mainly to agricultural regionalization in order to establish the broad spatial
pattern. In Indian agriculture, also many experts have made studies in this
field and come out with findings of their own. The findings of these studies
are summarized in the following few paragraphs.
Rao (1962) made a study on agricultural production and productivity in
India and observed that during the period 1949-50 to 1960-61, agricultural
production in India had increased by 36.4%, whereas increase in the average
yield per acre was only 18.6%, the rest of the increase in production being
accounted by an increase in the area under cultivation. The study revealed that
during the period 1949-50 to 1960-61, acreage contribution was more than the
agricultural productivity to the total agricultural production of the country. He
further pointed out that increase in production by increase in acreage would
not be available after the 2nd plan, so the yield per acre had to be increased as
this would be the only solid and enduring base for the required progress in our
agricultural production in the coming decade. He mentioned that one of the
factors contributing to increased productivity during the period had been for
the change in the cropping pattern, as the share of the higher yielding crops
had increased with one significant exception, namely rice (1.12%).
Sen (1967) in his study on growth and instability in Indian agriculture
concluded that certain amount of fluctuation was unavoidable in food grain
production because of weather hazards. A study of the data of food grains
production during the first twenty-four years of the twentieth century showed
that with the rise in food grains production, the instability was also on the
38
increase. In the next twenty-four years food grain production showed a
declining trend but less unstable. An analysis of the data for 30 years period,
1936-37 to 1965-66 also revealed that instability tended to increase with the
rate of growth. Sen. suggested that the increased growth after independence
up to 1965-66 was primarily based on the expansion of area under cultivation.
He hypothesized that the new area being brought under cultivation was land
of poorer quality and hence more susceptible to weather fluctuation. In the
mid sixties, there had been no significant change in the output growth rate.
The main source of growth had been the increase in land productivity, rather
that continuing expansion in cultivated area.
Khan (1969) in his study on the growth in the production of food grains
crops in Bihar during the period 1950-51to 1965-66 concluded that the
increase in production was due to increased productivity rather due to
expansion in acreage. The productivity per acre of all crops had increased
during the period. He also revealed that during the period 1950-51 to 1965-
66, the net area sown had been reduced by 3% but there had been an
expansion of acreage under food grains crops mainly through increased
intensity of cropping as well as shift in acreage from non- food grains to food
grains crops.
Srinivasan (1979) studies the trends in agriculture in India for the
period 1949-50 to 1977-78, showed that there had been a decline in the rate of
growth of gross sown area in particular under non-food crops in the decade
starting from 1967-76 compared to the fifteen years ending in 1964-65.
However, the output of food crops and all crops grew more or less uniformly
over the entire period with no evidence of either acceleration or deceleration
since 1967-68. As wheat showed a faster growth in output and yield per unit
39
area in the later decade, it was concluded that there was no green revolution
but it was wheat revolution.
Alagh and Sharma (1980) studied the growth of crop production for the
period 1960-61 to 1978-79 by dividing the period into two equal sub period
,1960-61 to 1969-70 (period I) and 1969-70 to1978-79 (period II). The study
concluded that Green Revolution had an appreciable effect on the Indian
economy since 1969-70 as the period II showed a higher growth rates for all
crops at all India level as compared to period I. The study also revealed that
growth in period II was more evenly spread than period I, but the variation
around the growth was as large as the first period. Thus, the problem of
fluctuations of agricultural output was an extremely serious one for the Indian
economy.
Hazell (1982) made a study on instability in India’s food grain
production for the period 1952-53 to1977-78(omitting the drought year 1965-
66 and 1966-67). By using variance decomposition method, he found that the
lion’s share (82%) of increase in production variance was due to increase in
the co-variances of production between crops grown in the same and in
different states. Furthermore, increase in inter-crop and inter-state yield co-
variances was the dominant source of the increase in these production co-
variances. He concluded that aggregate production instability was an
inevitable consequence of rapid agricultural growth. So, policies such as
storage and trade policies should be attempted to stabilize consumption.
Chakrabarti (1982) studied the growth pattern of food grain production
in India from 1949-50 to 1975-76 by using cycle- adjusted time series data.
He found that with the elimination of cycle, the series had three distinct
Segment I from 1949-50 to 1960-61, Segment II: 1958-59 to 1966-67 and
40
Segment III: 1964-65 to 1975-76. The study revealed that the food grain
production was stagnant during the second period. With the introduction of
high yielding varieties with associated improved critical inputs, the growth
rate in food grains showed a vertical jump from stagnancy at the beginning of
the segment III. Subsequently it showed the same behavior as in segment I.
thus, the study concluded that through technological breakthrough in the field
of food grain production, the country had regained the growth pattern that was
prevailing prior to the stagnancy period (segment II) i.e. prior to 1958-59.
Ray (1983) emphasized that for investigation of growth and instability,
a model incorporating controllable man-made factors and uncontrollable
weather factors in the specification was more illuminating and useful for
policy purposes. He concluded that major causes for changes in the pattern of
growth and instability in production were (I) an increase in the variability of
rainfall and price and (II) an increase in the sensitivity of production to
variation in rainfall and price.
Parthasarathy (1984) examined inter-district variation in the growth
rates and fluctuation of agricultural production in Andhra Pradesh for the
period 1955-56 to 1978-79. He found that the degree of instability in
agricultural production was high in all the districts. It was higher for food-
grains than for “all crops”. The post Green Revolution period showed a higher
degree of instability. The district, which achieved higher growth rates were
also subject to greater instability.
Johl (1984) was of the opinion that with reasonable effort and
concerned, food grain production and for that matter, agricultural production
can be considerably increased through an improvement in productivity. He
opined that with the available production technology and the given cropping
41
pattern in different agro climatic zones of the country, there was tremendous
potential for increasing productivity through the application of additional
inputs and better management of resource use. Even if no improvement in
production technology is assumed, there is an easy possibility of enhancing
production by expanding by expanding the horizontal and vertical expansion
of crop area. Further he mentioned five set of determinants for growth and
development of agriculture- adequate and growing research capacity,
extension education through matching delivery and recipient systems,
adequate rural infrastructure to interact with socio-economic super structure,
conducive agricultural policy environment and responsive and dynamic
farming community, in addition, to the independent effects of these
determination, have a high degree of interaction effect. Such a framework is
pre-requisite for achieving rapid agricultural growth and development of any
area, region and state of the country.
Dev (1885) made an analysis to study whether the new strategy of
agricultural development, which was identified with HYV technology, had
widened regional disparities in agricultural performance. He examined change
in regional disparities for all crops in terms of output per area and output per
capita (to take account of demographic pressures) and the interconnections
between the two measures across agro-climatic region in late 1970s as
compared to early seventies and sixties. He concluded that at the level of
agro-climatic regions, rich regions are becoming relatively richer in terms of
output per unit area. Though poor regions had not become poorer, they had
remained relatively poor in terms of output per area. But they had become
poorer in terms of output per capita.
42
Chattopadhyay and Bhattacharya (1986) in their study found that
breakthrough in production condition through the evolution of HYV
technology around 1965 had taken place in such a scattered and fragmentary
way that they had little impact on the country as a whole. The analysis also
mentioned that except for some commercial crops like, potato, sugarcane, the
new technology in agriculture had no impact on inferior cereals and had little
impact on superior food crops. By making a comparative study of growth rate
of agricultural production for two states – Punjab and West Bengal, the study
concluded that the effects of new technology on agricultural output of
different varieties of crops were different in the different regions.
Ranade (1986) made a study on growth of productivity in Indian
agriculture by extending late Dharm Narain’s article on the sources of
agricultural productivity during 1952-53 to 1972-73 in India. Dharm Narain
had shown that in the period prior to the Green Revolution, the locational
shift of crops had significantly contributed to growth along with the cropping
pattern effect, while in the later period; it was the pure yield effects which
was mainly responsible for growth. Ranade discovered certain anomalies in
the data used by Dharm Narain. By correcting the data for those anomalies
and extending the analysis for the period 1972-73 to 1982-83 and examining
the locational shift effect to the growth of production of rice, he found that
pure yield effect made substantially lower contribution in the post Green
Revolution periods as compared to that in the previous period. The locational
shift, in fact became important in the Post Green Revolution period as area
under short duration rice varieties expanded in Punjab and Haryana.
Dantwala, (1987) remarked that agricultural performance during the
period from 1949-50 to 1985-86 had been particularly impressive, especially
43
in food grains. In fact, the annual compound growth rate of major food grains
had registered an increasing trend from 2.16 per cent during 1950-51 to 1967-
68 to 2.62% during 1967-68 to 1983-84 and thereafter to 3.00% during 1973-
74 to 1983-84.
Pal and Sirohi (1988) studied the sources of growth and instability in
the production of commercial crops and changes in their pattern in India. Two
time period viz. 1950-51 to 1964-65 and 1967-68 to 1983-84 were considered
for the analysis. The study concluded that growth and stability in production
of commercial crops were complementary rather than competitive processes
in intensively irrigated regions. Instability was more prominent in
disaggregate production at the state level and might be much higher at the
farm level. As far as sources of variance are concerned, area variability
contributed more than 60 percent to the variance of production in sugarcane
and jute in both the periods. Conversely, yield variability accounted for nearly
75 percent and 54 percent of the variance of production in groundnut and
cotton respectively. They laid emphasis on adopting yield stabilizing policies
in groundnut and cotton and area stabilizing policies in sugarcane, jute and
potatoes to stabilize production.
Bandopadhyay (1989) in his study found that during the period 1950-
51 to 1984-85, the increase in growth rate in the districts in West Bengal was
generally associated with instability in the production of rice. Such instability
was significantly higher in the post Green Revolution period. In the same
study, he found that for Punjab-Haryana, growth rate in production of wheat
was higher in the pre Green Revolution as compared to the post Green
Revolution period. However, there were definite signs of diminishing year-to-
44
year fluctuation in the wheat production with adequate irrigation facilities
particularly in the districts Punjab.
Mitra (1990) examined the growth and variation of agricultural
production in Maharastra for the period 1956-57 through 1984-85 found that
crop production at the state level as well as different regional level’s
particularly in case of food grains, remained more stagnant till around early
70’s. It then picked up and continued showing an increasing trend until the
beginning of 80’s and, thereafter it again showed a decreasing trend till mid
80’s. The study also showed that higher growth rates are associated with
higher levels of instability in crop production. The study concluded that
development of irrigation and associated new technology had not been
effective in reducing the overall instability in the agricultural of the state and
in the different regions of the state, especially in the case of food grains.
Kaushik (1993) examined the pattern of growth and variation of crop
output in India in general and oilseeds in particular for the period 1968-69 to
1991-92. The study revealed that growth in food grains output was due to
increase in productivity. However, for oilseeds the growth was due to the
growth in area for the period 1968-69 to 1979-80. However, after 1980, its
growth was also due to improvement in productivity. The study also
concluded that fluctuations in yield would have to be controlled to bring
about stability in output, as it was the major cause for the fluctuation in the
output.
Mander and sharma (1995) made a comparative study of the
performance of cereal crops in different states of India in the Post-Green
Revolution period 1966-67 to 1988-89. The study revealed that during this
period the production of major cereal crops namely wheat, rice and maize
45
increased significantly registering a growth rate of 5.96% for wheat, 2.85%
for rice and 1.09% for maize. The major portion of increased production had
come from the increased productivity. However, the progress showed by
different crops in different states had not been uniform. Uttar Pradesh,
Punjab, Haryana, Madhya Pradesh, Rajasthan, Bihar, Gujarat and Maharastra
were the major producers of wheat crops, producing nearly 97% of country’s
total production and constituting 95% of the country’s area under the crop. In
Assam production of wheat increased at the rate of 16.99% during the period,
which was very small as compared to the county’s production. However, in
case of rice, Assam was one of the major rice producing states, where
production of rice increased the rate of 1.47%.
Sawant and Achuthan (1995) in a study analyzed agricultural growth
across crops and regions of India and came to the conclusion that during the
period from 1967-68 to 1992-93(post Green Revolution period), there had
been a significant acceleration in the agricultural production which could not
be attributed merely to a favorable weather. The role played by yield
improvement in including higher output growth had been for more than that
of expansion in area, indicating that process of growth had been
technologically more dynamic too. It was also noticed that there had been an
increasing shift of land from food grains to non-food grains in the latter part
of the green revolution. Yet another distinguishing feature of agricultural
scenario in the 1980s is that, with the wider dispersal of growth across crops
and regions, agricultural growth has become more board-based in recent
years.
Raghavan (1995), analyzed the trend rate of growth of crop since
independence and concluded that wheat crop in India had exhibited a robust
46
growth for a considerably long period from the 1950’s through two decades
of the green revolution. This miraculous performance could be sustained
because of an enclave based growth strategy that was pursued since the mid
60’s, the main thrust of which included making available to the farmers in
these enclaves of subsidized input-cum technology package, free access to
marketing and storage of output and a tax free ‘cost plus’ price. It was noticed
that after 1984-85, the production of wheat had started too declined.
Therefore, if the wheat crop has to regain its earlier trend, the existing
strategy has to be remodeled and targeted towards the weaker farm
households, preferably outside the already saturated enclaves.
Singh, Baghel and Gupta (1997) examined the variability of food grains
production and its growth rate change in India for the period 1949-50 to 1994-
95. They found that during this period area under food grains had increased
by 25 percent. Among the years, Kharif crops dominated the cropping
scenario, which covered more than 60 percent. However, the productivity of
Rabi crops was found higher than that of Kharif crops. The study also
revealed that fluctuation in production was due to variation in yield
performance. The same scenario of agricultural output for the state of Madhya
Pradesh had been observed in the studies of et al (1996) and Pendse et al
(1996)
Bhalla and Hazell (1997) attempted to project feed and food demand
for India to 2020 under alternative income growth scenario. With the rise in
per capita income, direct demand for food grains may not increase as rapidly
as earlier, but the derived demand for food grains for feed increases and
therefore the total pulses during the period under study. Since the climatic
conditions of Assam were quite congenial for the cultivation of pulses, there
47
was an urgent need to increase productivity of pulses through adoption of
modern technology, changing cropping pattern and improved crop
management practices.
Rawal and Swaminathan (1998) studied the agricultural growth in West
Bengal for 45 years (1950-1996) came to the conclusion that from a path of
low growth during the first three decades of this period, in the 1980’s
agriculture moved to a path of high growth. They viewed that that such
acceleration in growth occurred during and after major changes in agrarian
institutions and land relations. This indicates the importance of changes in
agrarian structure and agrarian reform for economic growth in a backward
agrarian economy.
Kurosaki (1999) made a comparative study of the performance of
agriculture in India and Pakistan, during the 20th century (1900-1995), on the
basis of data that corresponds to the current border. He showed that the
growth performance of agriculture in India and Pakistan was a stagnant one in
the colonial period. After 1947 sustained improvement occurred in both
countries although the performance was better in India than in Pakistan in per
capita food production. However, the absolute level of this achievement in
terms of per acre productivity and per capita production is not high compared
with the international standard.
Ahmed (1999) reviewed the progress of food grains production and
productivity in India during the post independence period and found that food
grain production had gone up from 52 million tonnes in 1947 to about 192
million tonnes in 1995-96. Though since independence, growth and
development of Indian agriculture was remarkable and its production and
productivity increased sufficiently, it was far behind when we compare
48
country’s productivity with that of developed countries of the world.
Therefore, a lot of efforts are needed for raising the production and
productivity of Indian agriculture.
In Assam little works have been done so far on agricultural
sector. Mr. Goswami (1963) first attempted to study various aspects of
agriculture in Assam. Mahanta and Neog (1968) analyzed the different
aspects of agriculture and animal husbandry in Assam.
Das (1978) examined the growth rates and nature and extends of
instability both for food grains and total agricultural production in state of
Assam, Bihar, Orissa and West Bengal for the period 1950-51 to 1973-74. He
found that during the period, the growth rate of agricultural production was
falling over time in Bihar, while the growth rate in Assam, Orissa and West
Bengal remained constant. The study also revealed that there was increasing
instability in the production of food grains in the state of Assam, Bihar and
Orissa. While food grains production remain stable in West Bengal, despite
the fact that all these states had experienced positive growth rates of 1.75 %,
3.33%, 2.37% and 2.93% respectively during the period.
A.R.M Rehman (1978) made a study on agricultural marketing in
Assam with special reference to autumn paddy and jute. S.K.Choudhury
(1984) analyzed the agricultural development of Karbi Anlong district since
independence. Nath (1984) also made a micro level study on agricultural
development in Darrang district of Assam. Bhagabati (1984) analysed the
agricultural development of Brahmaputra Valley in Assam. In 1985
K.K.Barman has made a critical study of agricultural productivity in Assam.
M.P. Bezbaruah (1989) has analyzed the impact of technological
transformation on agriculture in Assam.
49
Ahmed and Bhowmick (1991), in a study examined the nature of price,
productivity and acreage response of some important crops in Assam for the
period 1971-72 through 1986-87. The study concluded that acreage under
principal crops in Assam is influenced mainly by the yield of crop, lag
acreage and area under irrigation. Productivity was noted to be lower than the
all India average. Moreover, farmers in this region were not price responsive.
Therefore they laid emphasis on the use of improved seeds and post harvest
technology in the cultivation of all the crops in the state.
Kalita and Baruah (1991) studied the growth and instability of three
types of rice namely autumn rice, winter rice and summer rice for the state of
Assam for the period 1951-52 to 1988-89. The study concluded that only in
case summer rice, the growth rate was sizeable but instability had been found
to the largest. Winter rice was found to be the most stable crop in the case of
productivity. The growth rate in area and production of autumn and winter
rice were found to be negligible due to slow development of irrigation
facilities, gradual degradation of the nutrients status of the soil in state and
increasing damage of standing crops by flood.
Barthakur and Bhattacharya (1999) had done a similar type of study for
rice in Assam. The study concluded that there had been an increasing trend of
production of rice in the state. But the growth rate of production had
significantly declined during the post-green revolution period, indicating that
Green Revolution was lacking in the state of Assam. To increase productivity,
the study suggested adoption of improved technology, intensive use of
existing resources and better extension services.
The discussion on agricultural development is not complete unless we
throw light on the factors that influence the growth and stability of
50
agricultural production. Very few empirical studies were undertaken in the
past to identify the factors explaining for slow growth and inter-temporal and
inter-regional variation in agricultural growth. We now turn to make a
summary of the factors responsible for slow growth and instability in Indian
agriculture in view of the past studies.
Sharma (1964) was of the opinion that the agricultural development
should be assessed not only by the trends in the agricultural production and
productivity but also on various physical inputs like labour (human and
animal), irrigation, fertilizer, improved seeds, extent of cultivated area etc.
Narain (1977) had analyzed that there are two types of explanatory
variables contributing towards increase in productivity in Indian agriculture.
According to him, the non price factors particularly, the growth of irrigation
facilities, increased use of fertilizer and high yielding varieties of seeds had
contributed towards the increase in yields of individual crop in different
states.
Das (1978) in his study concluded that increasing instability in
agricultural production particularly food grains production may be on
precarious rainfall, extension of area under cultivation of inferior crops, use of
fertilizer, inadequacy of irrigation facilities, absence of better farming
methods etc.
Joshi and Haque (1980) estimated the relative role of technological,
institutional and climatic factors in the determination of temporal growth and
interregional disparities in India. They concluded that fertilizer consumption
and area under HYV seeds were the important determinants of agricultural
growth in a majority of Indian states. Next in order were time (indicating
technical change) irrigation, rainfall and credit.
51
Bhatia (1980) showed that more investment on irrigation and greater
extension efforts would have to be made for higher use of fertilizer and HYV
seeds in backward states for balanced growth of agriculture in different states.
More research efforts would also have to be made for accelerating the growth
of productivity of pulse and making the sectoral balances in food grains.
Mehra (1981) highlighted the association between increase in yield
variability and the use of high yielding varieties (HYV) and larger application
of fertilizer per unit of land. Obviously, the area and yield variability result in
the variability in agricultural production. The magnitude of variability had
grown with the growth in agricultural production.
Barman (1985) mentioned that the backwardness of Indian agriculture
is primarily due to institutional, technological and organizational constraints
and the intensity of each of the constraints varies from region to region
depending on localities, geographical environment, fertility of soil, rainfall,
climate, weather, rural infrastructure etc.
Tamhane(1987) believed that the principal cause for low productivity
in Indian agriculture was the deterioration of soil fertility owing to erosion
and other natural calamities like flood hazards in some areas and drought
conditions in other.
Prasad (1998) mentioned that for accelerating growth of food grains
production in the coming decade, a multi pronged strategy would be needed
with a focus on augmentation of water resources and evolution of improved
varieties of seeds for rain fed as well as flood prone areas. This would need to
be supplementation by adequate availability of fertilizer, pest management
and a regime of incentive prices and timely supply of credit etc.
52
Singh & Singh (1999) made a comparative study of agricultural
development performance of the state of Punjab and Bihar to analyze the
factors responsible for imbalances in agricultural development. They
concluded that poor land resource distribution, low irrigation potential, low
application of fertilizer, low coverage of HYV seeds, and lack of proper
infrastructural facilities contributed low agricultural progress in the state of
Bihar as compared to Punjab. The analysis suggested that for the development
of Bihar there was urgent need to concentrate on the use of fertilizer, high
coverage under high yielding varieties, more use of electricity per hectare and
increasing the area under irrigation and increase the credit availability.
Bhatia (1999) examined the relationship between infrastructure
development and growth in agriculture concluded that there was significant
scope for increasing the yield of food grains and agricultural income by
improving the rural infrastructure.
From the above overview of literature, the following broad
observations can be made on the constraints and prospects of agricultural
production and productivity in Assam.
The agricultural production mainly depends on two factors:
(i) Availability of arable land and,
(ii) Productivity per unit of land.
As the supply of land is fixed, productivity of land has to be improved
in order to increase agricultural production. Thus, productivity of land
has to be increased in order augment agricultural output in the country
for the coming decades.
53
Productivity per unit of land can be increased with the best and
efficient utilization of inputs like labour, water, fertilizer etc. applied to
it.
Agricultural productivity can also be increased by changing the pattern
of production towards more intensive system of cultivation or by
progressively changing cropping pattern from low value crops to high
value crops.
The Green Revolution had an appreciable effect on the agricultural
production in India since 1969-70. But the effects of new technology
on agricultural output of different varieties of crops are different in
different regions.
For balanced growth of agriculture in different states of the country,
there is urgent need to concentrate on the use of fertilizer, high
coverage under high yielding varieties, more investment on irrigation
and greater extension efforts and increase the credit availability in the
agriculturally backward states.
Production variability is an inevitable consequence of rapid agricultural
growth. For India, the post Green Revolution period showed a higher
degree of production variability in a number of states. Further,
variability was higher for food grains than other crops.
Increased variability in agricultural production particularly food grains
productions may be explained by factors such as dependence of
agriculture on precarious rainfall, extension of area under cultivation of
inferior crops , inadequacy of irrigation facilities, absence of better
farming methods etc.
Although since independence, growth and development of Indian
agriculture were remarkable and its production and productivity
54
increased sufficiently, it was far behind when we compare country’s
productivity with that of develop countries of the world. Therefore the
country will have to make extra ordinary efforts by way of investment
in irrigation, rural electrification, scientific research and extension and
other rural infrastructure for raising its production and productivity in
agriculture in general and food grains in particular, in order to meet the
demand of its fast growing population.
1.9. LIMITATIONS OF THE STUDY
As mentioned above, a few studies which are available on agricultural
sector in the north-eastern region of India based on macro and micro level. In
order to get adequate insight to the performance and problems of agricultural
sector in the region, it would be necessary to go beyond the overall macro
picture presented by aggregate statistics to carry out investigation at the micro
level. The present study is an attempt to provide more comprehensive analysis
of the agricultural growth and problems in the region by interfacing a macro
picture describe by secondary data with the realities at the grass root, observe
through a field survey in which farms and households are the units of
observation. Since the agricultural sector is the unorganized sector of our
economy, no records of year-wise production is maintained by farmers even
by large farmers also. The primary analysis of the year-wise productivity of
the sector is mostly depended on official or departmental data provided by the
agricultural department of the government.
Thus to conclude, agricultural development is the basic precondition of
sectoral diversification and development of the states’ economy. An
increasing marketable surplus of agricultural output is much essential in a
poor state like Assam for increasing supply of food and raw materials at
non-inflationary prices, widening domestic market for industrial products
55
through higher purchasing capacities in the rural sector, facilitating inter-
sectoral transfers of capital needed for industrial development along with
infrastructural development and increasing foreign exchange earnings through
increasing volume of agricultural exports. Besides, agriculture in Assam is
frequently affected by natural factors like flood, drought etc. It is necessary to
develop different agricultural strategies for flood affected and unaffected
areas. The study is very much important in this regard to achieve sustainable
development in the sector.
******
56
CHAPTER II:
EXISTING SCENARIO OF AGRICULTURE AND LAND USE
PATTERN IN ASSAM AS WELL AS SONITPUR DISTRICT
Location
Physiography
Climate and rainfall
Demographic Structure of the State and the District
Income and Agriculture
Soil
The Land Use Pattern in Assam and Sonitpur District
Cropping pattern
Cropping Intensity
Agricultural Inputs:
Seeds
Fertilizer
Irrigation
Credit
Agricultural Implements and Machinery
Infrastructure facilities and their impact on Agriculture of Assam
Crop Insurance
Productivity in Agriculture
57
CHAPTER II
Existing Scenario of Agriculture and Land Use Pattern in Assam as well
as Sonitpur District
The economy of Assam is predominantly agrarian. About 99 per cent
area of total land mass of the State is rural and almost about 50.0 per cent of
the total land area is used for cultivation. The net cultivated area of the State
is 28.10 lakh hectares (2008-09) of which 23 per cent area is either flood or
draught prone and the per capita availability of net sown area comes to around
0.1 hectare. The average operational holding is 1.15 hectare only and more
than 83 per cent of the farmer family is small and marginal farmers (2005-06;
Agricultural Census). The contribution of the agriculture sector to the GSDP
(at constant prices; 2004-05 prices) was pegged at 22.85 per cent in 2009-
10(Quick estimate) after steady decline from 32.24 per cent in 1999-2000.
However, this sector continues to support more than 75 per cent population of
the State directly or indirectly providing employment of more than 53 per
cent of the workforce.2
In view of such a crucial importance of this sector in the state economy,
various agricultural programmes have always been assigned a high priority in
each successive five year plan. In spite of this importance, agriculture in
Assam has recorded tardy progress. Compared with other states of the
country, the pace of development of this sector has not been up to the
expectations. However, due to strategies adopted by the state government for
attaining self-sufficiency in food grains, a positive indication can be seen in
the form of growing awareness on the part of the state’s cultivators for the use
of improved seeds, manures etc.
2 Economic Survey, Assam 2010-11
58
The economy of the Sonitpur District is also based on Agriculture. It
has its own pace, trend, tradition and development process. Sonitpur is the
trade center for Bomdilla, Tawang, Seppa and Itanagar of Arunachal Pradesh.
Tezpur, Dhekiajuli, Rangapara, Biswanath Chariali and Gohpur are important
trading centers in the district. Approximately 80 percent of the population
depends on agriculture and its allied (primary sector) activities for their
livelihood. Rain fed cultivation of single paddy crop still continues in most of
areas of the district. However with the help of irrigation facilities like shallow
tube wells, high yielding variety of seeds and tractors have made multiple
cropping possible. Both Rabi and Kharif cropping is done in the district.
Paddy, jute, sugarcane, tea, pulses and mustard are the major crops and
tobacco, potato, vegetables and fruits like coconuts, banana, pineapples,
oranges, and mangoes are subsidiary crops of the district. Rice is the staple
food. The farmers mainly depend upon cultivation of wet paddy.
Among the cash crops jute is grown on the low lying areas of the bank of the
Brahmaputra.
The following paragraphs highlight the existing scenario from various
aspects relating to agriculture of the state and the district economy.
2.1. LOCATION
Assam is situated in the North- Eastern region of India. It is located
between the latitudes of 24˚08'N and 27˚58'N and the longitudes of 89˚42'E
and 96˚01'(Govt. of Assam). The state has a strategic position with more than
400 kilometers of international boundary with Bangladesh and with important
roads leading to the areas bordering Burma and China. To the north of the
Assam are Arunachal Pradesh and Bhutan, to the east lie Manipur , Nagaland
and a part of Arunachal Pradesh again and , to the south, are a number of
59
states, Viz., Mizoram Tripura and Meghalaya together with the international
border of Bangladesh, ant western part is bordered by west Bengal and also
Meghalaya, Bangladesh and Tripura. The state covers a territory of 78438
sq.kms (Govt. of Assam 2011) of which roughly a fourth of it comprising
rugged hills and the rest fertile plains.
After the reorganization of the North-Eastern Region in 1971, the state
of Assam was constituted of eight plain districts, namely, Goalpara. Kamrup,
Darrang, Lakhimpur, Dibrugarh, Sibsagar, Nagaon and Cachar and, in
addition two hill district of Karbi Anglong and North Cachar Hills. This
makes a total of ten districts. However, during the years, several new districts
have been carved out from time to time of the old district to make a total of 27
districts at present. These districts are Dhubri, Kokrajhar, Bongaigaon,
As per estimates for 2007-08 the per capita income at constant (1999-
2000) prices is Rs. 15857 as against Rs. 15152 in 2006-07 and Rs. 14419 in
2005-06. In terms of growth rate, it increased by 4.65 per cent in 2007-08 and
5.08 per cent in 2006-07. At current prices per capita State Income is worked
out at Rs. 30413 during 2010-11 as against Rs. 27197 in 2009-10 and Rs.
21290 in 2007-08 and registered a growth of 11.82 per cent in 2010-11 and
12.41 in 2009-10.
Sonitpur is the trade center for Bomdilla, Tawang, Seppa and Itanagar
of Arunachal Pradesh. Tezpur, Dhekiajuli, Rangapara, Biswanath Chariali
and Gohpur are important trading centers in the district. Agriculture and its
allied activities is the main source of the income and employment in the
district. Secondary or manufacturing sector is not so developed in the district
and whatever units are present, they are mostly located in the urban areas.
Therefore, the contribution of agriculture and its allied activities i.e., primary
sector is more in proportion in comparison to manufacturing sector. The
contribution of service sector or tertiary sector is highest in the district in
recent years in both current prices as well as constant prices. The following
table gives the clear picture of the contribution of different sector towards
GDDP and NDDP at current as well as constant prices.
Table: 2.4
District Income at Current and Constant Price (in lakh)
Gross District Domestic Product at Factor Cost 2008-09 (in lakh) Sectors At Current Prices At Constant (1999-00)
prices Primary 126384 86405 Secondary 52210 34927
74
Tertiary 147599 124231 Total 326193 245563 Per Capita GDDP (in Rs)
19435 14631
Net District Domestic Product at Factor Cost 2008-09 (in lakh) Primary 117882 83553 Secondary 44049 27504 Tertiary 134847 115376 Total 296778 226433 Per Capita NDDP (in Rs)
17683 13491
Source: Economic Survey of Assam 2008-09.
In the District, traditional economy provides a big source of income to
the people for their livelihood. People rich in traditional activities, like and
prefer their traditional job. Tribals and other weaker sections of the society
are traditionally involved in pig rearing in the district. Pig is one of the most
efficient feed converting animals having the shortest generation intervals high
prolificacy and faster growth rate; all these traits are directly and positively
correlated with the overall economy in production. The poultry production
in district is mainly Desi bird oriented and is mainly in the hands of the rural
people who rear mostly the desi or non desi type of poultry. Fishing in the
district is a tradition rather than commerce, as 90.0 percent of fish products
are imported. In the district fishery is quite popular commercial activity but it
is also not developed to the desired level. River Brahmaputra and about 1000
number of ponds provide huge scope of fish production.
Handloom weaving is an important cottage industry that has been
flourishing in Assam from ancient times. It still occupies a place of pride in
every Assamese household which invariably maintains a handloom besides
75
other articles for spinning and weaving. It is universally practised cottage
industry by rich and poor alike and has no stigma of caste or creed attached to
it. Most of its products are of utility value. Muga Mekhala and Riha,
decorated blouse piece, Eri chadar etc. are of some of the best specimen of
handloom products which show the creative genius of the weavers in Assam
that is called “Fabrics of delicate textures and designs”. Sericulture is the
most important cottage industry not only of the district but also of the state of
Assam. Extensively practiced during the agricultural off season as a
subsidiary occupation, it occupies an important place in the rural economy of
the district. Sonitpur has tremendous scope to develop sericulture.
Gold and silver smithy industry is very traditional one. The industry is
mainly concentrated in the urban areas. The artisans are from families
who have been traditionally associated with the industry. The indigenous
jewelers exhibit considerable amount of skill and artistic refinement in
making golden ornaments such as Dugdugi, Galpata, Jonbiri, Keru, Thuria,
Gamkharu etc. Carpentry in the rural areas is more or less a subsidiary
occupation. Village carpenters do all types of works like furniture making,
house building, wooden agricultural equipments like plough, harrow, yoke
etc. Among the traditional crafts the making of bamboo and cane products is
perhaps most universally practiced by all sections of the people throughout
the state. Its products have wide range of uses and as such commonly found in
every household. This craft has been mainly a household industry and
occupied an important place among the handicrafts of the district. It provides
a subsidiary occupation of the cultivators and full time occupation to these
highly skilled artisans who produce only fine decorative baskets, furniture and
mats etc on commercial scale. Mainly it has been a rural industry that is
commonly pursued by the agriculturists in their spare time as a subsidiary
76
occupation; but now a great professional and commercial approach can be
seen in this business.
In Sonitpur a lot of small scale industries are established that engage a
huge employment and make good attribute to the economy. The district is rich
in forest resources and offers ample opportunity for the development of the
timber industry like saw mills, plywood factories and manufacture of
furniture fixtures. The other small scale industries are Rice mills, Flour mills,
Source: Directorate of Agriculture, Khanapara, Assam, Economic Survey 2010-11 Assam.
132
Analysis of co-efficient of variance in production and yield rate of non food grains during the 1999-2000 to 2009-10
Co-efficient of variance of rape and mustard production= 22.24
Co-efficient of variance of yield rate of rape and mustard = 15.79
Co-efficient of variance of jute production= 42.00
Co-efficient of variance of yield rate of jute = 21.82
Co-efficient of variance of potato production= 34.97
Co-efficient of variance of yield rate of potato= 31.01
Co-efficient of variance of sugarcane production= 26.56
Co-efficient of variance of yield rate of sugarcane = 7.44
From the above statistical analysis it is clear that during the last decade
the production of rape and mustard is more consistent in comparison to other
products followed by production of sugarcane and potato. The production of
jute is highly inconsistent during the last decade. In case of yield rate,
sugarcane registered highly consistent yield rate during the period followed
by rape and mustard and jute. The yield rate of potato is highly inconsistent
in the district.
It is observed from the analysis of variance of both food crops and non
food crops in the district during the last decade that the production and yield
rate of the food crops is more consistent than non food crops.
Similarly the production of potato decreased from 72.9 thousand tonnes
(yield rate 11.43 tonne/hectare) in 1999-2000 to 48.9 thousand tonnes in
2005-06 and then to increase to 115.8 thousand tonnes which was decade
maximum in 2008-09 with highest yield rate i.e., 16.0 tonne/hectare. But the
production of sugarcane registered an increasing trend with some variation
133
during the last decade. Total production of sugarcane was 72.8 thousand
tonnes with the highest yield rate of 45.38 tonne per hectare in 1999-2000 has
increased to 110.0 thousand tonnes with yield rate 44.0 tonne per hectare in
2009-10. The figure 3.8 and3.9 shows the year-wise variation in production of
major non-food grains i.e., oilseeds, jute, potato and sugarcane during the last
decade.
Figure 3.8
Trends in production of OILSEEDS (in ‘000 tonnes) and JUTE (in ‘000
bales) in SONITPUR DISTRICT during last 10years
13.4
15.2
16.9
11.9811.4 11.1
8.179.33 9.78
15.5915.7
29.4
22.8
20.7
18.819.8
16.918.1
9.83
12.8
5.02
6.96
0
5
10
15
20
25
30
35
PRODUCTION OF OILSEEDS IN '000tonnes
PRODUCTION OF JUTE IN '000bales
134
Figure 3.9
Trends in production of POTATO and SUGARCANE in SONITPUR
DISTRICT (in ‘000 tonnes) during last 10years
The productivity of HYV seeds of rice and other cereals is
comparatively high in comparison to traditional seeds. Total area under HYV
of rice in 2008-09 was 103546 hectares out of which High Yielding Varieties
(HYV) of Autumn, Winter and Summer Rice cover 21135, 68068 and 14343
hectares respectively (table 3.11). The area under HYV of rice increases year
after year but productivity fluctuates due different reasons in the district. The
following table shows the area and yield rate of HYV of rice season wise in
the district.
72.9
58.350.2
45.341.4
53.948.9
53.9854.4
115.8
94.6
72.864.7
60.8 62.2 63.6
81.3
96.4 98.5
86.4
135
110
0
20
40
60
80
100
120
140
160
PRODUCTION OF POTATO IN '000tonnes
PRODUCTION OF SUGARCANE IN '000tonnes
135
Table: 3.11
Area and yield of HYV of rice in Sonitpur district (area: hectare; Yield: kg/ hectare)
Year Autumn Winter Summer
Area Yield Area Yield Area Yield
2003-04 15140 1825 66450 2258 8500 2371
2006-07 16465 1435 51350 1823 11810 2216
2008-09 21135 1850 68068 2280 14343 2380
Source: Compiled from Statistical Handbook of Assam.
The productivity of Summer rice is highest in the district in comparison
to Autumn rice and Winter rice. In 2008-09, the productivity of Autumn,
Winter and Summer Rice was 1850, 2280 and 2380 kg per hectare in the
district. The productivity of some other crops except rice i.e., wheat, pulses
etc in the district is not so significant in comparison to national level. The
productivity of wheat (HYV) in the district in 2008-09 was only 1603
kg/hectare but national average was much higher (i.e., 2891kg/hectare).
From the forgoing analysis, relating to the cropping pattern and trends
in productivity of major crops in Assam and the district, the following
observations can be made:
There has been no change of cropping pattern in the state as well as the
district even after the technological change taking place in the country.
136
The cropping pattern of the state and the district is dominated by food
grains particularly the cereal crops. Among the cereal crops rice
occupies the largest area of the cultivated area.
The share of rice in gross cropped area has decreased marginally in the
last few decades due to increase in the share of gross cropped area
under other crops. Hence the share of rice in the total cropped area has
declined, but the absolute rice area in the state and the district remained
unchanged by and large.
Among rice, winter rice occupied the major area. But the share of
winter rice in the gross cropped area has shown a declining trend in
recent years due to switching over to the summer rice. During last
decade the production of total Rice increases in the district with some
yearly variation.
Area under wheat has recorded an increase especially during 1980-90
and their after started declining in the state. But in the district the area
under wheat registered an increasing trend during the post reform
period. The production of wheat and its yield rate fluctuates during the
last decade in the district.
Pulses are an important food grain crop. But its share in the total
cropped area has remained more or less unchanged during the entire
period under study. Production of total pulses has registered an
increasing trend with some yearly fluctuation in the district as well as
in the state.
Oilseeds crops are, no doubt, important crops with respect to area but
its share, particularly rape and mustard has increased, while the share of
fibre crops particularly jute and mesta decreased due to decline in area
and productivity. Production of oilseeds increases during the last few
137
decades but the production of jute registered continuous falling in
production and yield rate.
Non food crops occupy a small segment of the total cropped area but its
share is found to have increased marginally both in the state and the
district.
Among other crops, sugarcane and vegetables like potato have
improved their position in the total cropped area and production.
Production and yield rate of food crops in the district is more consistent
in comparison to the production and yield rate of non food crops.
Cropping intensity in the state in recent years decreases in comparison
to 1999-2000, but in the district it was much higher than state average.
_____________________________________
Cropping intensity= (Gross cropped area/Net area sown) x 100
Co-efficient of variance= (standard deviation/ mean) x 100
******
138
CHAPTER IV:
INTER-DISTRICT VARIATION IN PRODUCTIVITY OF SELECTED
CROPS IN ASSAM (A comparative study with a developed state like
Haryana)
Analytical study on: Variation in Area, Production and Yield of main food grains
Analysis of variation in Area, Production and Yield of major non-food grains
Inter-district variation in Area, Production and Yield rate of major crops
Inter-State Variation in Yield Rate of major crops
139
CHAPTER IV
Inter-District Variation in Productivity of Selected Crops in Assam
(A comparative study with a developed state like Haryana)
Fluctuation in crop output may cause price instability, which in turn
may adversely affect further growth in crop output, employment and income
distributions. Johnson and Mellor (1978) opined that since food grains, as
wage-goods, have high income elasticity of demand and total food grains
constitute bulk of total agriculture production in less developed regions, the
relative shift in food grains prices may critically affect the real income of low
wage earners which has serious welfare consequences. It is, therefore
necessary to take appropriate measures to stabilize agriculture prices and
agricultural prices and agricultural production. Fluctuations in crop output
particularly in the food grains production happens to be a regular feature in
agriculture of Assam. The main reason for this is the dependence on nature
i.e. rainfall for the cultivation crops in the State. Natural hazards like flood
and drought are also responsible for such fluctuation. Inadequate irrigation
facilities and lack of permanent measure to control flood and erosion have
further compounded the problem in the state. Therefore, an attempt has been
made in this chapter to measure the fluctuation in area, production and
productivity of four principal food crops and four non food crops. An attempt
has also been made to analyze the extent variability in the production of food
grains and non food grains in the state as well as for selected districts for the
period of 1999-2000 to 2009-10.
To study the Inter-district variation in productivity of selected crops in
Assam, six agriculturally competent districts i.e., Darrang, Nagaon, Barpeta,
Dhubri and Golaghat was selected along with Sonitpur district and Assam as
140
a whole. For measuring fluctuation, co-efficient of variance of area,
production and yield rate have been calculated for the four main food crops
i.e., rice, wheat, maize and pulses and four major non-food crops i.e.,
oilseeds, jute, potato and sugarcane for the period of study i.e., 1999-2000 to
2009-2010. Tables 4.1 to table 4.8 depict the district wise variation (C.V) of
area, production and productivity of food crop and table 4.9 to table 4.16
depict the district wise co-efficient of variation (C.V) of area, production and
productivity of non-food crop respectively. A comparative analysis of inter
district variation of major food grains and non-food grains of selected districts
have been made with comparison with state average. To study the inter-state
variation in productivity of major crops two agriculturally developed state
Haryana and Punjab was selected and analysis is done on the basis of co-
efficient of variance in productivity during the period of 1999-2000 to 2009-
10 with country and district average.
4.1. ANALYTICAL STUDY ON:
VARIATION IN AREA, PRODUCTION AND YIELD OF MAIN FOOD GRAINS
Fluctuations in area, production and yield of major food grains during
the period in the selected district are not uniform. In Sonitpur district,
variation in area of rice was comparatively more consistent than its yield rate
and production. The co-efficient of variation of total production of rice was
very high i.e., 22.5 (table: 4.1) percent during the period. It was due to
variation of yield rate (i.e., 14.3), natural factor and shifting of crop land for
other use. Wheat production in the state fluctuates more in comparison to rice.
The co-efficient of production of wheat was 28.2 percent with variation of
21.1 percent in yield rate. Production of maize, area and yield shows
comparatively more consistent in terms of other crops. Though it occupies
141
less than one percent of total cropped area of the district, the variation in area,
production and yield of maize is 9.00, 10.7 and 2.2 percent respectively.
Pulses in the district was now a day’s getting importance but variation in area
production and yield during the period was very high i.e., 25.5, 26.7 and 13.7
percent respectively. The following tables show the year-wise variation in
area, production and productivity of major food-grains of the selected districts
of Assam.
Table: 4.1
Production of major food grains in the Sonitpur District during 1999-2000 to2009-10 (A: Area in ‘000hectare P: production in ‘000tonnes, Y: yield rate in tonne/hectare, C.V: Co-efficient of variance in percentage)
Source: Compiled and Estimated from data collected from basic agricultural
statistics, Directorate of Agriculture, Khanapara, Assam and Economic
Survey 2010-11 Assam.
148
It can be observed from table 4.2 that, production of rice is highly
fluctuated i.e., 39.0 percent due to 44.24 and 16.4 percent variation in area
under rice crop and yield rate in Darrang district during the period. This high
fluctuation was also due to shifting of land of food crops to the production of
vegetables and other cash crops in the district which were getting more
importance in recent years. Fluctuation in area, production and yield rate of
wheat, maize and pulses were also very high in the district. But the co-
efficient of variation of pulses was the highest among food crops i.e., 45.9
percent followed by wheat 42.3 percent, rice 39.0 percent and maize38.8
percent. Lowest variation in yield of food crops registered by maize i.e., 3.5
percent followed by pulses 10.5, wheat 14.1 and rice 16.4 percent
respectively.
From the table 4.3, it can be observed that variation in production in of
pulses in Barpeta district was maximum i.e., 27.4 percent followed by rice
26.8 percent, wheat 23.35 and maize 7.86 percent respectively. Variation in
yield rate was highest in rice i.e., 13.04 percent followed by wheat, pulses and
maize i.e., 8.96, 7.90 and 2.34 percent respectively. Maize though it was not
so significant in food product in the district but it registered as most consistent
food crops in terms of area under maize, production and yield rate during the
period. The main cause of the variation is natural, technological and use of
land for other purpose.
Nagaon district is one of the agriculturally competent districts in
Assam. From the table 4.4, it is clear that variation of production of pulses is
highest i.e., 32.1 percent followed by wheat 22.7 percent, rice 16.6 percent
and maize 11.1 percent. Lowest variation yield rate was observed in maize
i.e., 1.8 percent followed by rice 5.0 percent, wheat 11.8 percent and pulses
149
14.9 percent respectively. In case of variation of area, rice registered lowest
percentage i.e., 12.35 followed by maize, wheat and pulses respectively.
Natural factors are the main cause of variation in the district.
In Dhubri district, lowest variation can be observed in production of
rice i.e., 13.4 (table 4.5) percent followed by wheat 33.9 percent, pulses 42.3
and maize 46.2. Rice registered lowest variability in area i.e., 19.36 followed
by wheat, pulses and maize. Highest variation in area and production is
registered by maize in the district i.e., 46.2 percent each but has lowest
variation in yield rate i.e., 0.95 percent. The co-efficient of variation of yield
rate of pulses is 5.31 percent followed by rice and wheat i.e., 7.3 and 16.5
percent respectively.
Jorhat district of Assam registered lowest variation in production, area
and yield i.e., 19.1, 10.4 and 1.02 (table 4.6) percent respectively during the
period. But in case of production of maize, pulses and wheat has very high
variation i.e., 45.7, 46.9 and 58.4 respectively. The area and production of
maize has very high variation during the period, but the variation of yield rate
was low i.e., 2.26 percent. In Jorhat district yield rate, area and production of
rice was more consistent than the other food product is due to favourable
natural and technical factors and inputs.
It can be observed from table 4.7, that Karbi Anglong was one of the
districts of Assam which showed very less variation in production of food
crops in terms of production, area and yield rate. The variation of production
of maize registered lowest i.e., 2.21 percent followed by rice 4.58, wheat 11.0
and 26.6 percent of pulses respectively. Lowest variation in yield rate was
observed in maize i.e., 2.10 percent followed by 3.03, 8.24 and 9.87 percent
of pulses, wheat and rice respectively. Variation in area was lowest in maize
150
crop i.e., 1.49 percent and highest in pulses i.e., and 26.1 percent. From the
above analysis, it is clear that variation in area under major crops and their
production and productivity is more or less inconsistent in the selected
districts in Assam. The following table (table: 4.8) shows the variation in area
under major food-grains and their production and productivity in Assam as a
whole.
Table: 4.8
Production of major FOOD GRAINS in Assam during 1999-2000 to 2009-10 (A: area in lakh hectare, P: production in ‘000tonnes, Y: yield rate in tonne/hectare, C.V: Co-efficient of variance in percentage)
Source: Compiled and Estimated from data collected from basic agricultural
statistics, Directorate of Agriculture, Khanapara, Assam and Economic
Survey 2010-11 Assam.
151
Assam as a whole more consistent in production of maize (i.e., low
C.V: 2.35 percent) though it was not produced in large scale. Variation of
production was lowest in maize followed by pulses, rice and wheat i.e., 4.5,
10.2 and 15.4 (table4.8) percent respectively. Variation in yield rate was
lowest in maize i.e., 1.53 percent followed by 2.16, 6.67 and 7.02 percent of
pulses, rice and wheat respectively. Lowest variation of area also registered
by maize i.e., 3.26 percent then 4.55 percent of pulses, 5.02 percent of rice
and 12.1 percent of wheat. Variation of production of wheat was highest in
Assam among the food crops during the period followed by rice. These
variations are mainly due to natural, technological and socio-economic
factors.
4.2. ANALYSIS OF VARIATION IN AREA, PRODUCTION AND
YIELD OF MAJOR NON-FOOD GRAINS
Like food-crops the fluctuation of area production and yield rate of the
selected districts were not also uniform. Some districts showed very high
variation in area, production and yield rate than the other. In Sonitpur district
among the selected non food grains rape seeds and mustard has low
variability in production i.e., 22.2 (table 4.9) percent during the period
followed by sugarcane 26.6 percent, potato 34.9 percent and 42.0 percent in
jute. Lowest variation in yield rate was registered by sugarcane i.e., 7.44
percent followed by 15.8 percent in rape seeds and mustard, 21.8 percent in
jute and 31.0 percent in potato respectively. In case of area under the non-
food crop, potato has lowest variability (8.45 percent) followed by rape seeds
and mustard (12.2 percent), jute (14.9 percent) and sugarcane (24.77 percent
respectively). In the district highest variation in production was observed in
jute whose production continuously falling during the period. The following
152
tables show the trends and variation in area under major non food-grains and
their production and productivity in Sonitpur district along with selected
districts of Assam.
Table: 4.9
Production of major non-food grains in the SONITPUR District during 1999-2000 to2009-10 (A: Area in ‘000hectare, P: production in ‘000tonnes, Y: yield rate in tonne/hectare, jute: production in ‘000bales and yield in bales/hectare, C.V:Co-efficient of variance in percentage).
Source: Compiled and Estimated from data collected from basic agricultural
statistics, Directorate of Agriculture, Khanapara, Assam and Economic
Survey 2010-11 Assam.
158
Table: 4.15
Production of major non-food grains in the KARBI ANGLONG District during 1999-2000 to2009-10 (A: Area in ‘000hectare, P: production in ‘000tonnes, Y: yield rate in tones/hectare, jute: production in ‘000bales and yield in bales/hectare, C.V: Co-efficient of variance in percentage).
Source: Compiled and Estimated from data collected from basic agricultural
statistics, Directorate of Agriculture, Khanapara, Assam and Economic
Survey 2010-11, Assam.
From the data represented in table 4.10, it is observed that in Darrang
district the variation in production, area and yield rate of non food crops is
159
very high. The highest 69.0 percent variation was seen in production of jute
during the period followed by 54.9 percent in potato, 47.1 percent in
sugarcane and 41.0 percent in rape seeds and mustard. The variation in yield
rate was highest in jute i.e., 30.6 percent and lowest 10.2 percent in
sugarcane. Jute also registered highest variability i.e., 48.3 percent in area
followed by 45.4 percent in sugarcane, 42.4 percent in potato and 40.4
percent in rape seeds and mustard. From the table 4.10 it was observed that
jute has highest variability in production, yield and area in the district during
the period. In recent years the cropping pattern of the district has changed due
to getting more importance in the production of vegetables and other
horticultural crops. On the other hand in Barpeta district, the variation in
production of potato is highest i.e., 39.4 (table 4.11) percent followed by 35.3
percent in rape seeds and mustard, 23.17 percent in sugarcane and 22.0
percent in jute during the period. The yield rate of sugarcane was
comparatively more consistent (i.e., 2.79 percent) than jute (14.8 percent),
rape seeds and mustard (20.2) and potato (27.9 percent). The variability of
area in the district was highest in rape seeds and mustard i.e., 24.7 percent
followed by sugarcane, potato and jute i.e. 22.01, 20.4 and 19.8 percent. In
the district jute was more consistent in production and area in terms of other
crops.
However, from the table 4.12 it is observed that in Nagaon district the
highest variation in production is seen in potato i.e., 36.02 percent and lowest
variation in jute i.e., 13.9 percent. Rape seeds and mustard has variation of
28.4 percent and sugarcane 16.9 percent during the period. The yield rate of
sugarcane shows more consistency (i.e., lowest C.V. 3.13 percent) than rape
seeds and mustard (7.75 percent), jute (8.79 percent) and potato (26.3
percent). The variation in area was highest in rape seeds and mustard i.e., 28.4
160
percent during the period followed by 15.2 percent in sugarcane, 12.8 percent
in potato and 10.4 percent in jute respectively. In the district jute was more
consistent in production and area under jute than the other crops. But, Dhubri
district showed highest variability in production and area of jute ie 50.3 and
51.8 (table 4.13) percent but lowest in yield rate i.e., 3.01 percent during the
period in comparison to other crops. In case of rape seeds and mustard the
variability in area production and yield rate during the period were 17.1, 22.5
and 16.1percent respectively. Similarly, 16.7, 18.9, 13.5 percent and 16.6,
31.4, 22.4 percent were the co-efficient of variation area production and yield
rate of jute and potato in the district respectively. It was observed from the
table that in Dhubri district production of jute was more consistent during the
period in comparison to other non-food crops.
It is observed from the table 4.14 that in Jorhat district production of
jute registered lowest variability i.e., 19.5 percent during the period and
potato registered highest variability i.e., 69.2 percent. Lowest variation in
yield rate during the period observed in sugarcane i.e., 5.38 percent followed
by 10.1 percent in jute, 22.3 percent in rape and mustard and 26.3 percent in
potato. Variation in area was highest in jute i.e., 56.4 percent followed by
40.5 percent in potato, 35.5 percent in sugarcane and 31.3 percent in rape and
mustard. So during the period sugarcane was more consistent in yield rate and
jute was more consistent in production in comparison to other crops.
However, Karbi Anglong district was comparatively more consistent in
production of rape and mustard (lowest C.V. 15.5 percent, table 4.15) and in
area (lowest C.V. 1.18 percent) than the other crops. But the lowest variation
in yield rate was registered by sugarcane as 6.27 percent followed by 13.4
percent in jute, 14.3 percent in potato and 15.1 percent in rape seeds and
mustard. Highest variation in area was observed in sugarcane as 23.4 percent
161
then in 15.0 percent in jute in the district. In comparison to the selected
districts, Assam as a whole during the period showed more consistency in
production and productivity of some of non food-grains. The following table
shows the trends and variability in the area under non-food-grains and their
production and productivity in Assam as a whole.
Table: 4.16
Production of major NON-FOOD GARINS in ASSAM during 1999-2000 to 2009-10 (A: area in lakh hectare, P: production in ‘000tonnes, Y: yield rate in tonne/hectare, jute: production in ‘000bales and yield in bales/hectare, C.V: Co-efficient of variance in percentage)
and Barpeta (2.34 percent). The highest variation in area was observed in
Jorhat district (51.6 percent) followed by 46.2 percent in Dhubri, 37.3 percent
in Darrang district. Lowest variation in area was in Karbi Anglong (1.49
percent), followed by Barpeta (8.20) and Sonitpur (9.0 percent) during the
period. However, in production pulses, most consistent district was Karbi
Anglong with lowest variation of 26.6 percent followed by Sonitpur district
165
(26.7 percent) and Barpeta (27.4 percent). The highest variation was observed
in Jorhat with variation 46.9 percent whereas state level variation was only
4.5 percent. In yield rate Karbi Anglong was the most consistent district with
lowest variation of 3.03 percent followed by Dhubri (5.31 percent) and
Barpeta (7.90 percent). The co-efficient of variation in yield rate in Sonitpur
district was 13.7 percent which was much higher than state level variation
(2.16 percent). In area the highest variation was observed in Darrang district
(51.4 percent) and lowest in Sonitpur district as 25.5 percent which was much
higher than state level (4.55 percent).
On the other hand, in case of non-food grains inter district variation
in area, production and yield rate can be analyzed on the basis of the table
4.18. It can be observed from the table that Karbi Anglong districts was most
consistent in production of rape seeds and mustard with lowest variation of
15.5 percent during the period followed by Sonitpur district with 22.2 percent
variation. The highest variation was observed in Darrang (41.0percent) then
to Jorhat (38.2 percent) and Barpeta (35.3 percent). In yield rate lowest
variation was in Nagaon (7.75 percent) followed by Karbi Anglong (15.1
percent) and Darrang (15.2 percent). In Sonitpur district it was 15.8 percent
which was much higher than state level (5.88 percent). In case of area
Darrang district has highest variation (40.4 percent) and Karbi Anglong has
lowest (1.18 percent). The variation in Sonitpur district was 12.2 percent
which was the second lowest during the period. In jute production highest
variation was observed in Darrang district (69.0 percent) and lowest was in
Nagaon (13.9 percent). The variation in Sonitpur district was 42.0 percent
which was much higher than many districts and the state level (20.0 percent)
during the period. In yield rate lowest variation was observed in Nagaon (8.79
percent) followed by Jorhat (10.1 percent) and Karbi Anglong (13.4 percent).
166
In Sonitpur district it was 21.8 percent which higher than state level (10.2
percent). In area most consistent district was Nagaon with lowest variation of
10.4 percent during the period followed by Sonitpur with variation 14.9
percent whereas state level variation was only 7.13 percent. In case of non
food-grains also the variation in area, production and productivity in between
the districts are not uniform. The following table shows the inter-district
variation of non-food-grains over the period 1999-2000 to 2009-10.
Table: 4.18
Inter-district variation in AREA, PRODUCTION AND YIELD RATE major non-food gains during the period 1999-2000 to 2009-10 of selected districts of Assam, (Co-efficient of variance in percentage)
Source: Estimated from data collected from basic agricultural statistics,
Directorate of Agriculture, Khanapara, Assam and Economic Survey 2010-
11, Assam.
167
It is observed that in production of potato, highest variation was shown
by Jorhat district (69.2 percent) followed by Darrang (54.9 percent) and
lowest in Karbi Anglong (16.5 percent) during the period. The variation in
Sonitpur district was 34.9 percent during the period which was much higher
than state level (14.69 percent). In yield rate, lowest variation was observed in
Karbi Anglong (14.3 percent) followed by Dhubri (22.4 percent). The
variation in yield rate was highest in Sonitpur district (31.0 percent) during
the period whereas in state level it was only 12.8 percent. In case of area
highest variation was observed in Darrang district (42.4 percent) followed by
Jorhat (40.5 percent). The variation in Sonitpur district was 8.45 percent
which was second lowest among districts but higher than state level (3.94
percent).
However, in case of sugarcane, highest variation in production was
observed during the period in Dhubri (50.3 percent) then in Darrang district
(47.1 percent). Nagaon was most consistent district in production of
sugarcane with lowest variation 16.9 percent followed by 23.17 percent in
Barpeta, 26.6 percent in Sonitpur district. In yield rate lowest variation was in
Barpeta (2.79 percent) followed by Dhubri (3.01 percent) and Nagaon (3.13
percent). The variation in Sonitpur was 7.44 percent which was less than state
level. The variation in area during the period was highest in Dhubri (51.8
percent) followed by Darrang (45.4 percent) and Jorhat (35.5 percent). The
variation was lowest in Nagaon district as 15.2 percent and in Sonitpur district
it was 24.77 percent which was much higher than state level (6.12). In case of
sugarcane most consistent district in yield rate was Barpeta and in area was
Nagaon.
168
4.4. INTER-STATE VARIATION IN YIELD RATE OF MAJOR
CROPS
To study the inter-state variation in yield rate of major crops, a
comparative study of co-efficient of variance was done with country and
district average. From the table 4.19, it was observed that most consistent
state in production of rice was Haryana with co-efficient of 0.12 percent. It is
due to better inputs and agricultural infrastructure and modern implement.
The country’s co- efficient of variance in yield rate was 6.29 percent whereas
in Sonitpur district it was 14.3 percent for the period. The rate of variation of
Assam (6.67 percent) was more than Punjab (6.19 percent) and country’s
variation level. In case of yield rate of wheat, Haryana was the most
consistent state with lowest variation of 3.73 percent followed by Punjab with
variation 3.98 percent. The level of variation in the country as a whole was
3.41 percent whereas the variation in Assam was quite high 7.02 percent. The
co-efficient of variation in yield rate of Sonitpur district was 21.1 which were
unexpectedly high in comparison to the states and the country. If we compare
year-wise productivity of wheat in Assam as well as the district, it was quite
low in comparison to Punjab and Haryana. Low productivity and Variation in
Assam as well as in the district was high because of inadequate inputs and
insufficient infrastructure. The data represented in the following table gives us
a clear picture about inter-state variations in yield rate of major crops during
the period of 1999-2000 to 2009-10.
169
Table: 4.19
Inter-state variation in YIELD RATE of major food gains during the period 1999-2000 to 2009-10 of selected districts of Assam, (yield rate in tonne/hectare, C.V: Co-efficient of variance in percentage)
Source: Compiled and Estimated from data collected from basic agricultural
statistics, Directorate of economics and statistics and Department of
Agriculture, Govt. of India.
170
From the above data represented in the table 4.19; it is observed that
Assam is the most consistent producer of maize in the country with lowest
variation of 1.53 percent in comparison to Haryana and Punjab and the
country as a whole. In Sonitpur district the variation level was only 2.2
percent for the period. But if we compare the year-wise yield rate the
productivity of maize in the state and in the district is quite low in comparison
with Haryana and Punjab. It was so because maize was not cultivated in large
scale in the state. Less than one percent of total cropped area of the state was
used for production of maize during the period. The co-efficient of variation
of Haryana (9.74 percent) was less than country’s variation (10.56 percent),
but the variation in Punjab (13.79 percent) was more than the country’s level.
In case of productivity of pulses Assam was becoming as a more
consistent state with 2.16 percent variation during the period in comparison to
Haryana (16.2 percent), Punjab (9.01 percent) and the country as a whole
(6.23 percent). But the variation of the district is quite high i.e., 13.7 percent.
But year-wise yield rate of the state and the district was less than Punjab and
Haryana but almost equal to country’s average. Low variation in pulse
productivity in Assam was due to low percentage of land and traditional
technique for production was used for the production of pulses during the
period. Only 3 percent of total cropped land was used for production of pulses
in the state during the period.
In case productivity of rape seeds and mustard Assam became a more
consistent producer with lower variation of 5.88 (table 4.20) percent in
comparison with Haryana with variation of 14.7 percent and Punjab 8.68
percent during the period. But the variation in the district was quite high in
comparison to states and the national variations. But the year-wise
171
productivity of Assam and the district was quite low in comparison to
Haryana and Punjab as well as national average. Lowest variation in
productivity in Assam was due to low percentage of land used for production
and traditional inputs and techniques of production. During the period only
around 7.0 percent of total crop land in Assam was used for production of
rape seeds and mustard. In case of non-food-grains, inter-state variation in
productivity of major crops in Assam is quite high than the other
agriculturally competent states in India. The following table shows the clear
picture about inter-state variations in yield rate of major non-food grains
during the period of 1999-2000 to 2009-10.
Table: 4.20
Inter-state variation in YIELD RATE of major non-food gains during the period 1999-2000 to 2009-10 of selected districts of Assam, (yield rate in tonne/hectare, for jute yield rate: bales/hectare, C.V: Co-efficient of variance in percentage)
Source: Compiled and Estimated from data collected from basic agricultural
statistics, Directorate of economics and statistics and Department of
Agriculture, Govt. of India.
From the above table it can be observed that, in case of productivity of
sugarcane, the yield rate of national level is quite high in comparison with the
year-wise productivity of Assam and the district. The yield rate of nation is
quite consistent (C.V:4.6 percent) in comparison to Assam with level of
variation 15.8 percent and the district 7.44 percent during the period.
Similarly, the productivity of jute (bales per hectare) in national level is quite
high in comparison to Assam and the district during the period. The co-
efficient of variation in yield rate in national level was 5.50 percent which
was quite low in terms of Assam (10.2 percent) and the district (21.8 percent).
From the forgoing analysis, relating to Inter-District and inter-state
Variations in Productivity of Selected Crops in Assam and in the district, the
following observations can be made:
The variation of yield rate of rice in the district was quite high during
the period in comparison with the state level as well as the districts like
173
Karbi Anglong, Dhubri, Nagaon, Barpeta and Jorhat. But variation area
was comparatively low.
The variation in production, yield rate and area of wheat crop was
comparatively high in the district during the period.
In case of maize productivity the co-efficient of variation of yield, area
and production of the district was low in comparison to other district
except Karbi Anglong.
The variation of area and production of pulse production of the district
was high but low in comparison to other district but yield rate is not so
consistent like Karbi Anglong and state level.
In case of production of selected non food grains in the district, the
coefficient of variation of area, production and yield rate was higher
than the variation in state level except yield of sugarcane.
In terms of inter-state variation, the productivity of rice in Assam and
the district was quite low in comparison with Haryana and Punjab and
the national level.
In productivity of maize and pulses Assam seemed to be more
consistent than Haryana and Punjab because lower percentage of land
and traditional inputs and techniques used for production of these crops
during the period.
In production of oilseeds, year-wise productivity of Assam and the
district was quite low in comparison with Haryana and Punjab but
showed more consistency in yield rate during the period.
Productivity of sugarcane and jute in Assam and the district was quite
low with higher variability in yield rate in comparison with national
average during the period.
174
It was observed that, the year-wise production and productivity of main
crops in Assam and in the district was not consistent. This is due to natural,
technical and socio- economic factors which are responsible for dismal
growth in the sector. But since the sector provides livelihood to major portion
of population in Assam it is very necessary to attain a sustainable growth in
productivity. The inconsistency in production and productivity of food grain
creates economic instability among the farmers because large proportions of
farmers are marginal and subsistence level farmers. Besides, it also creates
insecurity among the farmers in the maintenance of their family since farming
is only the source of livelihood in rural Assam. These variations are mainly
due to natural, technological and socio-economic factors. The economic
development of the state can sustain a reasonable growth rate of development
if the productions of main crops attain a consistent return over the years.
Co-efficient of variance= (standard deviation/ mean) x 100
******
175
CHAPTER V:
ECONOMIC REFORMS AND ITS IMPACT ON AGRICULTURAL
SECTOR IN ASSAM AS WELL AS SONITPUR DISTRICT
Growth rates in Area, Production and Productivity of major food grain and non-food grains Productivity gain through technical efficiency and input growth during the period Sectoral Contribution to GSDP
176
CHAPTER V
Economic Reforms and its Impact on Agricultural Sector in Assam as
well as Sonitpur District
The economic (both micro and macro) reforms was introduced in India
since the middle of 1991 have received wide attention globally. Specifically,
structural reforms were introduced in industrial, trade and financial sectors to
increase productivity by improving efficiency and to increase the
competitiveness of the Indian manufacturing sector. Though these reforms are
welcome but they have attracted some criticism. One such criticism is that
agriculture and allied sectors which provide livelihood for the majority of the
population, were largely left untouched by reform measures. When
agriculture is given a wider and stronger commercial orientation through
diversification and value addition, this would encourage both public and
private investment in the sector. The profitability in agriculture would induce
further technological progress and rising productivity. Such improvement in
output, productivity and income would further fuel manufacturing sector
growth through increased demand for inputs and consumer goods. It is also
argued that improvements in agricultural productivity would induce resource
flows from agriculture to the manufacturing sector, thereby stimulating its
growth. These arguments are based on the assumption that a two-way
relationship exists between agriculture and manufacturing sectors in India,
and that the initial stimulus for accelerated growth should be initiated within
the agricultural sector. If these assumptions are valid, then the government's
approach of concentrating on the industrial sector is not wrongly focused, as
suggested by some critics, but rather should be balanced with a higher priority
for agriculture.
177
India, which is one of the largest agricultural-based economies,
remained closed until the early 1990s. By 1991, there was growing awareness
that the inward-looking import substitution and overvalued exchange rate
policy coupled with various domestic policies pursued during the past four
decades, limited entrepreneurial decision making in many areas and resulted
in a high cost domestic industrial structure that was out of line with world
prices. Hence the new economic policy of 1991 stressed both external sector
reforms in the exchange rate, trade and foreign investment policies, and
internal reforms in areas such as industrial policy, price and distribution
controls, and fiscal restructuring in the financial and public sectors. In
addition, India’s membership and commitment to World Trade Organization
(WTO) in 1995 was a clear sign of India’s intention to take advantage of
globalization and face the challenge of accelerating its economic growth.
The initiation of economic reforms in India in 1991 brought about major
changes in the macroeconomic policy frame-work of the planned economy
that existed in India during 1950-51 to 1990-91. Although no direct reference
was made to agriculture, it was argued that the new macroeconomic policy
framework, in particular, changes in exchange and trade policy, devaluation
of the currency, gradual dismantling of the industrial licensing system and
reduction in industrial protection would benefits tradable agriculture by
ending discrimination against it and by turning the terms of trade in its favour.
This, in turn, was supposed to promote exports leading to rapid agricultural
growth
It is worth mentioning that Agricultural sector occupies a very
important place in the economy of the state of Assam and the district because
large proportion of the population engaged them in agriculture and allied
activities. To a large extent, agriculture in Assam and the district means the
178
growing of paddy, which occupies about 70 percent of the gross cropped area
and more than 90 percent of the total area under food grains. The other
important food grain crops are maize, wheat and other millets, pulses etc. The
agriculture in mainly dependent on monsoon rains that cause severe flooding
and submergence. The climatic risk is a major factor constraining the
adoption of improved technology, the state is lagging behind in the
production and productivity of both food grains and non-food grain crops as
compared to agriculturally developed states of the country. Though
agriculture sector was not directly referred in economic reform adopted by
India in 1991, but its cumulative effects can be seen on the sector in recent
years. It is in the light of the impact of economic reform on agriculture, the
present chapter is an attempt to analyze the sectoral contribution of the sector
and growth performance of selected food grains and non-food grains for the
period of 1999-2000 to 2009-10. Compound growth rates of area, production
and productivity of four major food grains namely rice, wheat, maize and
pulses and four major non-food grains namely rape seeds and mustard, jute,
potato and sugarcane were calculated for the aforesaid period. Besides this, it
was tried to analyze the productivity gain through technical efficiency, input
growth and technological progress and infrastructural development index.
To evaluate the impact of reforms whether it was positive or negative
on the agriculture in Assam in general and Sonitpur district in particular, it is
necessary to analyze growth of area, production and productivity during the
study period. Different experts have used different methodology to measure
the agricultural growth rates. In the study, compound growth rates have been
estimated for area, production and productivity by fitting a semi logarithmic
trend function of the form:
풀 = 풆퐚 퐛퐭
179
Where, Y= Area/Production/Yield
By taking logarithms of both sides of the equation, it takes the following
form:
Log y= a+bt
Where,
Y= Area/Production/Yield
a= Constant
b= Growth Rate
t= Time.
A brief analysis have also done on productivity gain due to technical
efficiency and input growth on the basis of available information and data
regarding the district and the state as a whole.
To analyze the impact of economic reform on state domestic product,
sectoral contributions of different sectors in percentage have been done on the
basis of secondary data published by government.
5.1. GROWTH RATES IN AREA, PRODUCTION AND
PRODUCTIVITY OF MAJOR FOOD GRAIN AND NON-FOOD
GRAINS
Rice is the most important food grain crop occupying more than 70.0
percent of total food grains area in the district and the state. But due to
various constraints deep rooted in the process of agricultural production, the
production and productivity of rice could not be raised to the highest possible
180
extent. The following table gives detail picture about compound growth rate
in production and productivity of Assam as well as Sonitpur district.
Table: 5.1
Compound Growth Rate in area, production and productivity of selected crops in Assam and Sonitpur district (in percentage) during 1999-2000 to
2009-10
crops ASSAM SONITPUR
Area Production Productivity Area Production Productivity
Autumn Rice
-0.19
-17.43
0.0038
-0.39 -0.18
0.01
Winter Rice
-0.06
8.51
0.01
0.06
4.44
0.02
Summer Rice
0.04
18.48
0.03
0.79
2.66
0.09
Total Rice
-0.21 -2.81 0.01 0.54 6.37 0.02
Wheat -0.02 -2.9 -0.01 0.03 -0.00145 -0.002
Maize -0.0013 -0.06 0.0026 -0.0152 -0.007 -0.002
Pulses 0.0018 -0.02 0.00045 -0.09 -0.02 0.01
Rape and mustard
-0.06 -1.56 0.0037 -0.26 -0.06 -0.00045
Jute -0.01 -10.05 0.11 0.02 -2.7 -0.51
Potato -0.0008 -16.66 -0.21 0.15 3.42 0.26
Sugarcane 0.00073 0.55 0.10 0.15 5.90 -0.06
Source: Estimated from data collected from basic agricultural statistics,
Directorate of Agriculture, Khanapara, Assam and Economic Survey 2010-
11 Assam.
181
Figure 5.1
Growth in area, production and productivity of RICE in Sonitpur district and Assam (in percentage) during 1999-2000 to 2009-10
Figure 5.2
Growth in area, production and productivity of WHEAT in Sonitpur district and Assam (in percentage) during 1999-2000 to 2009-10
-4
-2
0
2
4
6
8
Area Production Productivity Area Production Productivity
SONITPUR ASSAM
Rice
Rice
-3
-2.5
-2
-1.5
-1
-0.5
0
0.5
Area
Prod
uctio
n
Prod
uctiv
ity
Area
Prod
uctio
n
Prod
uctiv
ity
SONITPUR ASSAM
Wheat
Wheat
182
Figure 5.3
Growth in area, production and productivity of MAIZE in Sonitpur district and Assam (in percentage) during 1999-2000 to 2009-10
Figure 5.4
Growth in area, production and productivity of PULSES in Sonitpur district and Assam (in percentage) during 1999-2000 to 2009-10
-0.07
-0.06
-0.05
-0.04
-0.03
-0.02
-0.01
0
0.01
Area Production Productivity Area Production Productivity
SONITPUR ASSAM
Maize
Maize
-0.1
-0.08
-0.06
-0.04
-0.02
0
0.02
Area Production Productivity Area Production Productivity
SONITPUR ASSAM
Pulses
Pulses
183
From the table 5.1, it is evident that the growth rate of rice in terms of
area, production and productivity in Sonitpur district was positive during the
period. During the period the growth rate of area under rice and productivity
was 0.54 and 0.02 percent but the production growth rate was very
significant. The growth rate of production of rice recorded as 6.37 percent
which was the highest growth rate among the crops in the district during the
period. But the picture of growth of production, productivity and area in state
level is not satisfactory. The growth rate of area and production was negative
(-0.21 and -2.18 percent) but growth rate of productivity of rice was positive
(0.01 percent). This is because some districts of the state chronically affected
by flood and other natural hazards during the period. The productivity of
Autumn rice registered negative growth rate in the district as well as in the
state. But the growth rate of production in the state was highly significant
because it decreases at the rate of -17.43 percent during the period. The area
expansion under the Autumn rice also has negative growth both in the district
and the state but yield rate showed positive growth during the period. The
growth rate of area, production and productivity of Winter rice in the district
registered positive growth during the period. Production of rice during the
period in the district increases at the rate of 4.44 percent with 0.06 and 0.02
percent increase in area and productivity respectively. The production and
productivity of the winter rice in the state showed positive growth rate except
the area. Increase in production (8.51 percent) was highly significant in the
state. The Summer rice in the district and in the state as a whole registered
positive growth in area, production and productivity during the period. The
growth rate of production of Summer rice was highly significant for the
district and for the state as a whole because in the district it was increases at
184
the rate of 2.66 percent and in the state its growth rate was 18.48 percent
during the period. The growth rate of area was 0.79 percent for the district
and 0.04 percent for the state. The productivity of the Summer rice during the
period increases at the rate of 0.09 percent in the district and 0.03 percent for
the state as a whole. The increase in growth rate the area, production and
productivity of Summer rice during the period in Assam and in the district
was due to its higher productivity and low risk of natural hazards, pest attack
etc.
Although Wheat is not the main food crops of the district and the state,
but the growth rate of area in the district was positive during the period.
Growth rate of area in the district was 0.03 percent for the period but
production and productivity registered negative growth rate (-0.00145 and -
0.02 percent). In the state as a whole the performance of wheat was not
satisfactory. It registered negative growth rate in expansion of area,
production and productivity. The growth rate of area of wheat during the
period was -0.02 percent and production and productivity was -2.9 percent
and -0.01 percent. Maize is also one of the main food crops of Assam as well
as of the district. But the performance of maize was also not satisfactory in
Assam and the district. In the state as a whole the growth rate of area and
production during the period was negative only productivity growth rate was
positive. The growth rate of area and production in Assam was -0.0013 and -
0.06 percent and growth rate of productivity was 0.0026 percent. The
performance of maize in the district during the period was not at all
satisfactory. The area, production and productivity of maize in the district
registered negative growth rate as -0.015, -0.007 and 0.002 percent
respectively during the period. This is because of giving more importance in
rice and its production in the district.
185
The growth performance of pulses in the state was comparatively better
than wheat and maize during the period. Though growth rate of pulses was
negative (-0.02 percent) in the state but growth rate of area and productivity
was positive. The growth rate of area and the productivity in the state was
0.0018 and 0.00045 percent in the state. But in the performance of pulses in
the district was not like performance of rice. Only the growth rate of
productivity of pulses was positive (0.01 percent) in the district and growth
rate of area and production (-0.09 and -0.02 percent) was negative during the
period. The main cause of negative growth of area and production of pulses
was dominancy of rice in crop field of the district.
NON-FOOD GRAINS
According to table 5.1, the growth rate of productivity of rape seeds
and mustard in the state as a whole was positive (0.0037 percent) but the
growth rate of area and production in the state was negative during the period.
The performance of rape seeds and mustard in the district was not satisfactory
during the period. The growth rate of area was -0.26 percent, productions -
0.06 percent and productivity 0.00045 percent during the period. Although
Jute is one of the main non-food crops in Assam and the district but it was
observed that the area and production of jute continuously decreases in the
state during the last few decades. In the period of 1999-2000-2009-10, no
doubt this trend was maintained but the growth rate of productivity of jute
become positive as 0.11 percent. The growth rate of area and production of
the jute in Assam was -0.01 and -10.05 percent during the period. The growth
rate of production of jute was highly significant because it decreased sharply
during the period. In the district jute registered positive growth rate (0.02
percent) in area expansion but negative growth in production and
186
productivity. The production of jute in the district also declined sharply at the
rate of -2.7 percent during the period.
Figure 5.5
Growth in Area, Production and Productivity of RAPE SEEDS AND
MUSTARD in Sonitpur district and Assam (in percentage) during 1999-
2000 to 2009-10
-1.8
-1.6
-1.4
-1.2
-1
-0.8
-0.6
-0.4
-0.2
0
0.2
Area Production Productivity Area Production Productivity
SONITPUR ASSAM
Rape and mustard
Rape and mustard
187
Figure 5.6
Growth in area, production and productivity of JUTE in Sonitpur
district and Assam (in percentage) during 1999-2000 to 2009-10
Figure 5.7
Growth in area, production and productivity of POTATO in Sonitpur
district and Assam (in percentage) during 1999-2000 to 2009-10
-12
-10
-8
-6
-4
-2
0
2
Area Production Productivity Area Production Productivity
SONITPUR ASSAM
Jute
Jute
-20
-15
-10
-5
0
5
Area Production Productivity Area Production Productivity
SONITPUR ASSAM
Potato
Potato
188
Figure 5.8
Growth in area, production and productivity of SUGARCANE in Sonitpur district and Assam (in percentage) during 1999-2000 to 2009-10
On the other hand, the performance of potato in the state was not also
satisfactory. The decrease in area during the period was not so significant but
decrease in production at rate of -16.66 percent was highly significant. The
productivity of potato in Assam was also negative (-0.21 percent) during the
period. But in the district, performance of potato was comparatively
satisfactory during the period. The production of potato increased at 3.42
percent during the period in the district. The growth rate of area and
-1
0
1
2
3
4
5
6
7
Area Production Productivity Area Production Productivity
SONITPUR ASSAM
Sugarcane
Sugarcane
189
productivity was also positive. The area under potato increased at the rate of
0.15percent and the productivity at the rate of 0.26 percent. The growth
performance of sugarcane in Assam as a whole was comparatively
satisfactory during the period. The production of sugarcane in the state was
increased at the rate of 0.55 percent during the period with increase in
productivity at the rate of 0.10percent. The area under sugarcane in the state
also increased marginally in the state during the period. In the district the
production of sugarcane increased at rate of 5.90 percent during the period,
which was highly significant for district agriculture. The area under sugarcane
also increased at the rate of 0.15 percent but the growth rate of productivity of
sugarcane registered negative (-0.06 percent) rate during the period.
5.2. PRODUCTIVITY GAIN THROUGH TECHNICAL EFFICIENCY
AND INPUT GROWTH DURING THE PERIOD
Agricultural development of any state depends a great deal on the
availability of adequate and assured irrigation facilities. Assured irrigation
especially during winter months is an imperative need for the optimum
utilization of chemical fertilizers and HYV seeds. Irrigation also enables
diversification of crop. Unfortunately agriculture in Assam has continued to
be determined by rainfall, which is unequally distributed through the seasons.
Sometimes, heavy rainfall during monsoon causes floods, sometimes, long
dry spell occurs even during the monsoon. Hence expansion of irrigation
facilities to bring more areas under assured and controlled water supply has
been the main element of strategy for development of agriculture in the state.
This is also necessary to induce the farmers to change their existing cropping
pattern and to go for a second crop in dry winter.
190
The state agriculture department has prioritized improvement of
irrigation facilities in the state and accordingly created irrigation potential of
4.57 lakh hectares through distribution of Sallow tube wells and low lift
pumps etc., with support from/state sponsored schemes. However, there exists
gap between irrigation potential created and actual utilization. It was evident
from the table 5.2 that the irrigation facilities in the state was highly fluctuates
during the period. According to provisional report total area under irrigation
facilities provided through canals and tube wells in 2009-10 was 168853.56
hectares. The irrigation facility in Assam over the period of 2001-02 to 2009-
10 is represented in the following table.
Table: 5.2
Gross area irrigated under govt. irrigation facilities in Assam (area in hectare)
Year Irrigation facilities Canals Tube wells Total
Agricultural activity in the Sonitpur district is mainly rain fed. In recent
years the irrigation department of state government takes some steps to create
191
some irrigation facilities in the district. Irrigation potential created through
government irrigation schemes cover 61533 hectares in total, out of which
28878 hectares under minor irrigation scheme and 32655 hectares under in
major and medium irrigation in 2009-10. From the table 5.4.2 and 5.4.3, it
was evident that crop area of operating Minor Irrigation Schemes
(FIS/LIS/DTW/STWS) under Tezpur Division and Biswanath Chariali
Division which were completed during the period in different block was not
sufficient for targeted development of agriculture. The following tables show
the minor irrigation schemes of Tezpur sub-division and Biswanath Chariali
Division in Sonitpur district.
Table: 5.3
List of operating Minor Irrigation Schemes (FIS/LIS/DTW) under Tezpur Division (FIS: Flow Irrigation Scheme, LIS: Lift Irrigation Schemes, DTW: Deep Tube Well Scheme, STWS: Shallow Tube Well Scheme, NIA: Net Irrigated Area, AIA: Aggregate Irrigated Area)
Name of scheme Name of
Block
Estimated potential (in hectare)
NIA Rabi Kharif AIA
Panbari FIS Dhekiajuli 784 Nil 784 784
Koloney FIS Balipara 500 Nil 500 500
Dherai FIS Dhekiajuli 1004 Nil 1004 1004
Benganajuli FIS Dhekiajuli 350 100 350 450
Borsola FIS Borsola 800 Nil 800 800
Panchnoi FIS Dhekiajuli 548 Nil 548 548
Monai FIS Naduar 300 200 200 400
Chataichapori LIS Gabharu 120 72 120 192
Ulubari Naharbari
DTW,I/S
Dhekiajuli 80 48 80 128
192
Dekargaon
DTW.I/S
Balipara 80 48 80 128
Bindukuri DTW.I/S Balipara 80 48 80 128
Bihaguri DTW.I/S Bihaguri 80 48 80 128
New Tarajan
DTW.I/S
Dhekiajuli 120 72 120 192
Morabharali
DTW.I/S
Gabharu 40 24 40 64
Source: Office of the Superintending Engineer, Tezpur Circle (Irrigation).
Table: 5.4
Completed Schemes under Biswanath Chariali Division (Irrigation)
Name of the scheme
Block Potential in hectare
Kharif Rabi AIA
Moujuli FIS Sakomatha 1950 780 2730
Dirring FIS Sakomatha 1200 -- 1200
Pavi FIS Baghmara/ Sakomatha
800 -- 800
Sakomatha FIS Sakomatha 1100 -- 1100
Sadharu FIS Sakomatha 1000 -- 1000
Burigong FIS Baghmara/Biswanath 1000 -- 1000
Gelapukhuri FIS Baghmara 1000 -- 1000
Jingia FIS Baghmara 400 -- 400
Behali FIS Behali 880 -- 880
Mornoi FIS Sootea 300 -- 300
193
Panibharai LIS Biswanath 520 234 754
Sootea LIS Sootea 160 40 200
Dhanibeel LIS Pud-Chayduar 300 126 426
Petulibari DTWS
Sakomatha 80 14 94
Areamola DTWS
Sootea 40 10 50
Buroi Helem DTWS
Chayduar 80 10 90
Kathonobari STWS
Baghmara 21 5 26
Japoriguri STWS
Baghmara 22 8 30
Botiamari STWS Behali 12 4 16
Sialmari STWS Behali 30 2 32
Brahmajan STWS
Chayduar 12 2 14
Thalipukhuri STWS
Chayduar 18 2 20
Source: Office of the Executive Engineer, Biswanath Chariali Division
(Irrigation).
However, fertilizer is considered as one of the most essential inputs for
increasing the agricultural production. However, consumption of fertilizer in
the state is still low. Although an increasing trend is observed as regards
consumption of fertilizer in absolute terms in Assam, its consumption in NPK
is far below the level achieved by other states as well as national level.
According to the data available from the state Agricultural Department, the
total consumption of NPK fertilizer in the state was 213.94 thousand MT in
2007-08. The following table shows the season wise consumption of
fertilizers (in‘000MT) in Assam.
194
Table: 5.5
Season wise consumption of fertilizers (in‘000MT)
Year Season Consumption in terms of materials Consumption in terms of
Shifting Cultivation in India, Anthropological Survey of India, Calcutta.
1990
17. Chonicle Publication
Indian Economy Reference Manual, Chronicle New Delhi.
2008
18. Chopra, J.K. An Overview of Indian Economy. Unique publisher
2008
19. Choudhary,S.K Planning and Employment Trends in India; Deep & Deep New Delhi
1987
20. Das & Bhagat Economics of Privatization: Issues and Options; Deep & Deep New Delhi
1994
21. Das, H.P. Geography of Assam, National Book Trust, India, New Delhi.
1970
22. Dash and Parmanik
Economic Value Added; Deep & Deep New Delhi
2009
23. Deka,P.K & Longkumar, S.R
Socio- Economic Development of Rural India: A Case Study; Adhyayan Publisher & Distributors, New Delhi
2009
24. Desai, V. Rural Development of India; Himalaya Publishing House
2010
25. Desai,R.G. Agricultural Economics; Himalaya Publishing House
2010
26. Dey, U.K. Economics of Crop Diversification, Akansha 2003
282
Publishing House, New Delhi.
27. Dhar,P.K Indian Economy- Its Growing Dimensions. Kalyani Publishers; New Delhi.
2009
28. Dhar,P.K Regional Economics of Assam, Kalyani Publisher
2007
29. Dhingra, I.C. Indian Economy, Environmental and Policy 2005, S Chand, New Delhi.
2007
30. Dutta,P.S India’s North-East:A Study in Transition, Har-Anand Publication
1992
31. Ghosh, S.P. Horticulture in NE India, Indian J. Hill Farming.
1985
32. Gopalkrisnan,R
North-East India: Land, Economy and People; Har-Anand Publication
1991
33. Jat,S.L. Research Methodology 2006
34. Kumar,B.B Reorganization of North East India: Facts and Documents; Omsons Publications New Delhi
1996
35. Kumar, B.B Trends of British Annexation of North East India; Omsons Publication
1994
36. Kumar,S Productivity and Factor Substitution; Deep & Deep New Delhi
2001
37. Machenzie, A The Northeast Frontier of India 2004
38. Maheswari,N Economic Policy of Jawaharlal Nehru; Deep & Deep, New Delhi.
2007
39. Manoharan & Arunachalan
Agricultural Extension; Himalaya Publishing House
2003
40. Mishra & Puri Indian Economics 2010
41. Mishra Economis of Development and Planning 1985
283
&Mishra
42. Mishra,U North-East India: Quest for Identity Omsons Publication
1988
43. Nibedon,N North-East India: The Ethnic Explosion; Lancers New Delhi
1981
44. Nurkse, Ragner.
Problems of Capital Formation in Underdeveloped Countries,Oxford
1953
45. Purkaystha, G. Indian Economy & North- East Economy, Bani Mandir, Guwahati
2007
46. Raghuram Infrastructure Development and Financing.
2007
47. Sadhu & Singh Fundamentals of Agricultural Economics; Himalaya Publishing House
2010
48. Sahoo and Dash
Agriculture and Rural Economy; Deep & Deep New Delhi
2009
49. Samanta,P.K. Rural Development in NE India Perspectives Issues & Experiences.
1991
50. Sarkar, A.N. Resource Potential and Bio-Diversity of NER
1994
51. Sarma.B.K. Industrial Landscape of NE, Mittal New Delhi
2000
52. Satya Sundaram,I
Rural Development; Himalaya Publishing House
2009
53. Sen, R. K & Chatterjee B
Indian Economics (Agenda for the 21st century)
2003
54. Sen,R.P Development Theory and Growth Model; S Chand
2006
55. Sharma,S.K Documents on Northeast India , An Exclusive Survey
2006
56.
Sharma,S.K Documents on North-East India, An Exclusive Survey
2006
284
57. Sharma,V.K Greening Wasteland: Management and Technique; Deep & Deep New Delhi
2000
58. Singh,B.P Problems of Change: A Case study of North East India; Oxford University Press.
1987
59. Sundaram & Dutt
Indian Economy. S. Chand; New Delhi. 2008
60. Taha Operations Research-An Introduction, Pearson Education
2000
61.
Thakur,D
Research Methodology in Social Science; Deep & Deep New Delhi
2008
62. Tyson,G Forgotten Frontier 1992
63. Venkata Reddy,K
Agriculture and Rural Development; Himalaya Publishing House
2011
64. Verma, and Bhatt.
Steps Towards Modernization of Agriculture in NEH Region, Venus Printers and Publishers.
2001
65. Wickramasinghe,J.W
Economics of the Buddha, Adam Smith & Lionel Robins; S.Chand.
2006
B. Thesis (unpublished)
1. Barman J. (2005): growth and instability in food grains production in Assam during the plan period. Ph. D. Thesis, Gauhati University.
2. Barman. K. K. (1985): A Critical Study of Agricultural Productivity in Assam. Ph. D. Thesis Gauhati University.
3. Bezbaruah. M. P. (1989): Technological Transformation of Agriculture – A Study in Assam. Ph. D. Thesis Gauhati University.
285
4. Bhagabati A. K. (1990): Spatial Analysis of Small Scale Agriculture in Assam. (A case study of Nalbari District). Ph. D. Thesis Gauhati University.
5. Das. S. (1991): Problems of Agricultural Development in South Bank Region of Kamrup District, Assam. Ph. D. Thesis. Gauhati University.
6. Deka N. (2000): Determinant of Instability and Efficiency in Rice Production under Rainfed Agriculture in Assam. Ph.D. Thesis, AAU, Jorhat.
7. Ray. N. (1999): Problems and Prospects of Agricultural Growth in the Barak Valley Region of Assam. Ph. D. Thesis, Gauhati University.
C. Reports and Allied Publications:
1. Basic Statistics, NER 2006.
2. Census of India 2001& 2011
3. Economic Survey, Assam. (up to 2010-11)
4. Economic Survey, India. (up to 2010-11)
5. Statistical Hand Book. Assam. (up to 2010-11)
D. Articles and Papers
Sl. No Author/Editors Name of the Book/Publisher Edition
1. Agnihotri, S.K Agricultural Production Constraints in North East India; published in Agricultural development in north east India: constraints and prospects (edited).
1993
2. Ahluwalia. M.S India’s Economic Reforms: An Appraisal --
3. Ahmed Rais Growth of Agriculture in Last Fifty Years. (ASI) Vol. LVI, No.1, April.
1999
286
4. Banker,T.C., Borse,G.R. and Lohar,N.S.
Constraints faced by the Farmers in availing credit facilities extended by the nationalized bank in Pune district, Vol-4(2) issue-2 (October) IJCBM
2011
5. Barman, K.K The Production Behavior of Pulses in Assam; Its Growth and Instability (ASI) January
1997
6. Barthakur and Bhattacharya
Trends Analysis of Area Production and Productivity of Rice in Assam; 1951-1993, (ASI) Vol. LVI, No.4 July.
1999
7. Bhalla and Hazell
Food Grains Demand in India to 2020- A preliminary exercise. (EPW) No.52, Dec.
1997
8. Bhatia, M.S Rural Infrastructure and Growth in Agriculture. (EPW) VOL. XXXIV, No. 13, March-April.
1999
9. Bhatnagar and Saxena
An Estimate of Area and Production of Wheat in Haryana by 2002(ASI).
2002
10. Bhowmick, B.C Growth of Rice Production System in Assam: A Research Perspective Proceeding on Prioritization of Strategies for Agricultural Development in North-East India, NCAP, New Delhi.
2001
11. Borthakur and Krisnamoorty
Sources of Growth and Instability in the Production of Rape and Mustard in Assam, (ASI), vol. LVI, No. 1 April.
1997
12. Chand, R Remival of import restrictions and India’s agriculture, the challenge and strategy (EPW) vol. XXXIII, no.15
1998
13. Deka and Sharma
Shifting cultivation and its effects in regarding of perspective in Northern India, Vol-3(2) issue-2 (October) IJCBM.
2010
14. Ghosal, P.K. Problems of Agricultural Finance in India, by, IJH, Vol-01, Issue-04
2010
15. Ghoshal, P.K. Problems of agricultural finance in India, IJH, Vol-01, Issue-04.
2010
287
16. Gogoi and Rajkhowa
Wetlands and Sustainable Economic Development with Reference to Kaziranga National Park, vol-7; DGCCS
2010
17. Goswami P.C Agricultural Development in Northeast India: with special Reference to Settled Agriculture; Published in Agricultural development in north east India: constraints and prospects (edited).
1993
18. Goswami P.C Land Systems and Land Reforms of Assam, Journal Of University of Gauhati vol-XI.No.1A196
1994
19. Goswami P.C. Land Systems and Land Reforms of Assam, Journal Of University of Gauhati vol-XI.No.1A196
1994
20. Hitesh D Vyas Problems of Agricultural Marketing: An Empirical Analysis, Vol-3 issue-2 IJCBM.
2010
21. Joshi, P.V. Agro-Tourism: A form of Rural Entrepreneurship for Sustainable Rural Development”, by. IJH,Vol-01, Issue-04.
2010
22. Kalita and baruah
Growth of rice in Assam (ASI) vol.XLVII< No.4 July,
1992
23. Kurosaki, T Agriculture in India and Pakistan, 1900-95, productivity and crop mix (EPW) Vol. XXII, no.39 September.
1999
24. Mander and Sharma
Production performance of cereal crops in India: state-wise analysis (ASL) Vol. XLXII, No. 2 (May)
1995
25. Mendhe & Degaonkar
Export of Performance of Indian Chilli, Vol-3 issue-2 IJCBM.
2010
26. Ninam & Chandrashekar
Green revolution, dryland agriculture and sustainability: insight from India. (EPW) Vol. XXVIII, No. 12 &13,march
1999
27. Pandurang and Kataraki
The growth rates in production of major food grains in different districts of Karnataka, Vol-4(2) issue-2 October IJCBM.
2011
288
28. Parikh, Kirit Who gets how much from PDS; how effectively does it reach the poor”, vol-17 No-3
1994
29. Patel, P The Business Model to Provide Sustainable Development of Farmer in Agriculture Sector: Contract Farming, Vol-3 issue-2 IJCBM.
2010
30. Shukla, R Agriculture marketing information services: an analysis of crosscutting issues, Vol-3(2) issue-2 (October) IJCBM.
2010
E. Official Reports journals and Publications: 1. Annual Report 2010, Ministry of Development of North
Eastern Region. 2. Approach Paper of Eleventh Plan; Department of Planning and
Development, Assam. 3. Asian Economic Review (monthly journal) Indian Institute of
Economics ICSSR Hyderabad. 4. Asian Journal of human Development and Livelihood
(AJHDL) A Peer-Review Quarterly Research Journal. ISSN: 2250-3161.
7. Basic Statistics Relating to Assam’s Economy, Department of
Economics and Statistics, Assam.
8. Census of India 2001,2011
9. Draft of 10th Five year plan (2002-2007), Govt. of Assam.
10. Draft of 11th Five year plan (2007-2012), Govt. of Assam.
11. Draft Report of the Task Force on Development Initiatives for
the NER, September 2005 & IIE, Guwahati.
12. Draft Report on 20-Point Programme for Agricultural
Development in Assam, Ministry of Agriculture Assam.
13. Economic and Political Weekly
289
14. Economic Survey of Assam, Govt. of Assam 2010-11
15. Economic Survey of India, Govt. of India 2009-10, 2010-11.
16. Economics and Political Weekly, Economics and Political
weekly Research Foundation Mumbai.
17. Finance Commission Reports, Finance Commission of India.
18. Genesis, Annual Research Journal KCDC College, Guwahati.
19. ICSSR Research Journal, Shillong (different issues).
20. IJCBM(research journal) Hind Agricultural Society,
Muzaffarnagar(UP)
21. India 2008, 2009, Govt. of India, New Delhi.
22. Indian Agricultural Statistic (annual report), Ministry of Food and Agriculture.
23. Indian agricultural statistics, ministry of agriculture, Govt of India, New Delhi.
24. Indian Economic and Social History Review, Sage Publication, New Delhi.
25. Indian Economic Journal, Indian Economic Association, Mumbai.
26. Indian Journal of Humanities-- A Multidisciplinary Quarterly Refereed Research Journal. ISSN: 2248-9541 Vol-01 Issue-04 (October-December) 2011.
27. Journal of Commerce, Diphu Govt. College Commerce
Society.
28. Journal of Rural Development, NIRD, Hyderabad.
29. NE Vision 2020 Document prepared by National Institute of
Public Finance & Policy.
30. NEDFI annual reports.
31. NEDFI Databank Quarterly.
32. NER Basic Information, NEC.
33. Newspapers different National and Local.
290
34. Rainfall Bulletin, Assam 2010, Directorate of Agriculture,
Govt. of Assam.
35. Rainfall bulletin, Assam, Directorate of agriculture, Govt. of
Assam, Khanapara.
36. Reserve Bank of India-bulletin, RBI Mumbai.
37. Statistical Abstracts Assam,2007-08
38. Statistical Handbook of Assam 2001 to2011.
39. The Asian Journal of Horticulture, Asharam-418/4, Numaish
Camp, MuzaffarNagar-251001 (U.P.) India.
40. Yojona(monthly journal), Govt. of India
xxxx
291
SCHEDULE
Schedule for inventory of data of the sample Respondents
1. General Information of the Sample Respondents: a) Sample No: b) Household No: c) Gaon/Village: d) Gaon Panchayat: e) Block: f) Name of the Respondent:
2. Principal Livelihood/Occupation: 3. Demographic Characteristics of the Household:
Sl. No Name of the member Age M/F Education level
Full time/ part time/ non worker
1. 2. 3. 4. 5.
4. Land Holding Status of the Sample Respondent Sl. No. Types of land holding Area in hectare 1. Own land 2. Lease in land 3. Lease out land 4. Fallow land 5. Land under homestead 6. Land for kitchen garden 7. Land for fishery 8. Land for grazing land 9. Land under forest 10. Land for horticulture 11. Land for plantation 12. Land for others 13. TOTAL
5. Major Food-Crops grown by the Sample Respondent Sl. No Name of crop Area in
hectare Production in tonnes
Yield rate (tonne/hectare)
1. Autumn rice 2. Winter rice
292
3. Summer rice 4. Wheat 5. Maize 6. Pulses
6. Major Non-Food crops grown by Sample Respondent Sl. No.
Name of crop Area in hectare
Production in tonnes
Yield rate (tonne/hectare
1. Rape seed and mustard
2. Jute 3. Potato 4. Sugarcane
7. Other Crops grown by Respondent Sl. No.
Name of crop Area in hectare
Production in tonnes
Yield rate (tonne/hectare
1. 2. 3. 4. 5.
8. Loss of Crops due to Natural Hazards Sl. No.
Natural hazards
Area affected (in hectare)
Estimated loss of crops (in tonne)
Estimated loss of crops (in Rs.)
1. Flood 2. Drought 3. Pest attack 4. Other
9. Farm Resource used by the Sample Respondent in Major Food Crops Sl. No
12. Animals and Birds with the Respondents Sl. No. Name of the animals/bird Nos. 1. Bullock 2. Milk cow 3. Buffalo 4. Piggery 5. Goat 6. Duckery 7. Poultry 8. Other birds
294
13. Farm Implements used by the Respondents Sl. No. Name of farm assets Nos. 1. Tractor 2. Power tiller 3. Power pump 4. Plough 5. Leveler 6. Sprayer and dusters 7. Weeder 8. Speed driller 9. Other farm implements
14. Irrigation facility available to the Respondent Sl. No. Types of facility Area in hectare 1. Rain fed 2. Flow irrigation (FIS) 3. Lift irrigation (LIS) 4. Deep tube well (DTWS) 5. Shallow tube well (STWS) 6. Others
15. Availability of Agro- Infrastructural facility: Sl. No.
16. Production and disposal of Food and Non-Food Crops by the Respondent Sl. No. Particulars Quantity (quintals)
Food crops Non-food crops 1. Total production 2. For seed purpose 3. For family needs 4. Presented to relatives 5. Paid for labour 6. Paid to function/festivals
295
7. Loss during handling 8. For sale 9. others
17. Difficulties faced by the Respondent in Production of Crops a) b) c) d) e)
18. Difficulties faced by the Respondent after Harvesting of Crops a) b) c) d)
e)
19. Chronic problems faced by the Respondents in entire activity a) b) c) d) e)
20. Opinions/suggestions of the Respondents in handling of the problems a) b) c) d)