Page 1
8/20/2019 Problems of Stability
http://slidepdf.com/reader/full/problems-of-stability 1/12
Experimental determination of crack softening
characteristics of normalweight and lightweight
concrete
H. A. W.
CORNELISSEN, D.
A.
HORDIJK
and
H. W. REINH RDT
Summary
Delft University
of
Technology
Department
of
Civil Engineering
For modelling fracture behaviour of concrete various types of deformation controlled
uniaxial tests were performed on normal weight and on lightweight concrete. These two
types
of
concrete were compared with respect to their envelope curves, material stiff
ness and degradation during post-peak cycles, and residual compressive deformation
on
crack closure. Differences in behaviour were expla ined on the basis of the properties
of
the
aggregates which result in specific fracture surfaces.
Based on narrow specimens with uniform stress distribution, unique stress deforma
tion curves were determined
and
the descending branches were modelled. These
models were applied
to
calculate
the
stress distribution in wide specimens with a saw
cut. The total force was in good agreement with the experiment. Probable reasons for
the different behaviour of lightweight and normalweight concrete are discussed.
1 Introduction
The tensile properties of concrete are receiving an increasing amount
of
attention
because of several facts such as the interest in punching shear and bending, in the effect
of thermal stresses, in durability, but also in fracture mechanics and the application of
numerical methods which
need
a comprehensive description
of
concrete behaviour.
In the present study,
the
tensile behaviour of concrete is determined and modelled
according to demands from numerical design approaches.
Because of its specific cracking behaviour a normalweight and a lightweight concrete
are tested and compared.
2 Theoretical background
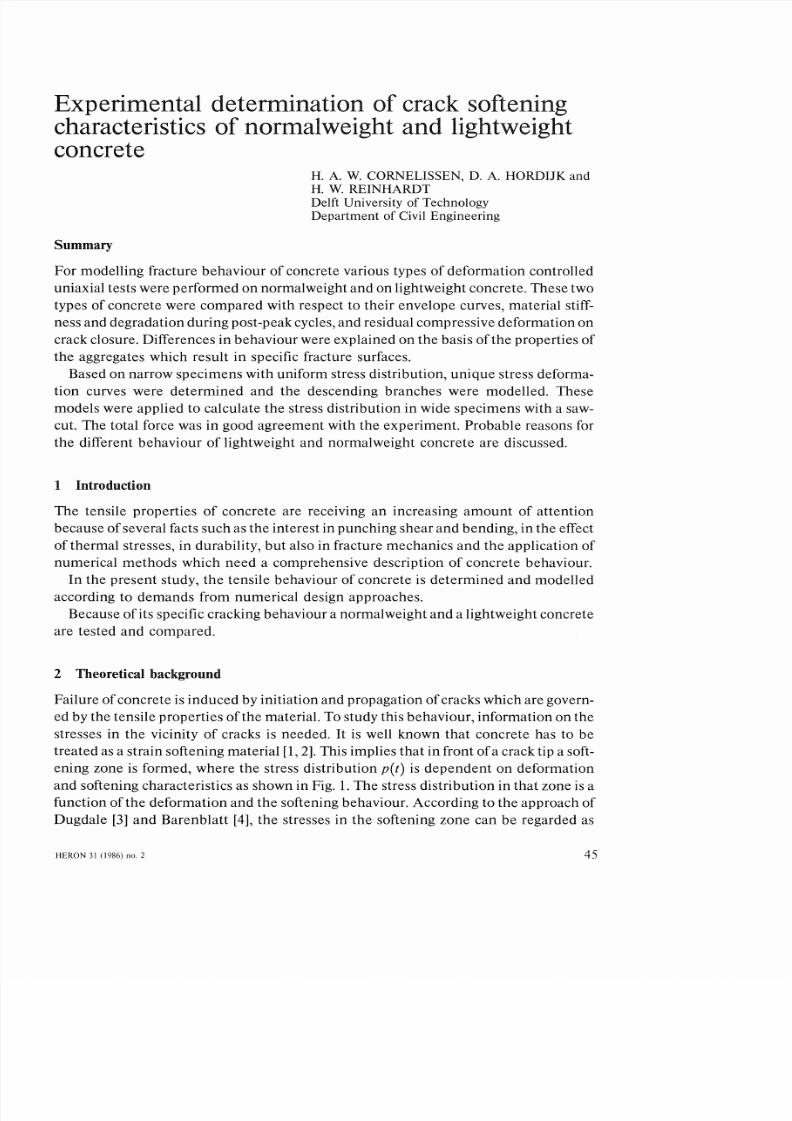
Failure
of
concrete is
induced
by initiation
and
propagation
of
cracks which are govern
ed by
the
tensile properties of
the
material. To study this behaviour, information on
the
stresses in the vicinity of cracks is needed.
t
is well known
that
concrete has to be
trea ted as a strain softening material [1,2]. This implies
that
in front ofa crack tip a soft
ening zone is formed, where
the
stress distribution
p t)
is dependent on deformation
and softening characteristics as shown in Fig.
1.
The stress distribution in that zone
is
a
function of the deformation and the softening behaviour. According to the approach of
Dugdale [3]
and
Barenblatt [4] the stresses in the softening zone can be regarded as
HERON
31
1986)
no.
2
45
Page 2
8/20/2019 Problems of Stability
http://slidepdf.com/reader/full/problems-of-stability 2/12
t
t
t
t ,
t
t
0
r ~ r ~ .
_ 2
\ softeni';;g-f
~ : = _ : c . ~ ; - - - :
I
z?ne
I
a a •
I I
1
i c .. c
I---J
+
-l- 0
Fig.
1
Crack geometry and stresses in the softening zone.
closing stresses, while in the remaining part of
the
crack, the crack faces are traction
free.
The stress distribution p t) depends on the stress-crack opening relation and
the
crack geometry. Ifboth quantities are known, a fracture criterion for a cracked plate can
be established by analytical or numerical means.
In
order to provide the necessary in
formation which applies to
both
approaches, stress-crack opening relations should be
determined in deformation controlled tensile tests. Moreover, in
the
case of cyclic
loadings the effect
of
unloading on crack opening has to be determined. Therefore, the
experimental programme comprises static
and
also repeated and alternating loading in
the
post-peak region of the stress-deformation relation. The tests were carried out on
narrow specimens with almost uniform stress distribution.
To check
the
validity
of
the theoretical assumption wide specimens were loaded uni
axially. The deformation distribution around saw-cuts, together with the previously
determined stress-crack opening relation, should enable the stress-elongation relation
of these wide specimens to be predicted.
3 Experiments
3 1 Types
o
concrete and specimens
The experimental programme consisted
of
ests on a normalweight and on a lightweight
concrete (abbreviated as NC and LC respectively). For NC river gravel with maximum
grain size of8 mmwas used, and a sintered expanded clay (4-8) for LC. The lightweight
aggregate was manufactured by Compagnie des Ciments Belges and specified asISOL S
4-8, with bulk density of 1260
kg/m
3
. Details of mix composition and mechanical
properties are listed in Table
1
The cubes (150 mm for the standard compressive and splitting tests were stored in
water until testing
at
an age of28 days.
The
direct tensile strength
and
Young's modulus,
however, were determined in deformation controlled tests on specimens (see further),
which were first cured in water for 14 days and subsequently in the laboratory (20°C,
60 RH) until testing at 45-55 days after casting. The relatively low direct tensile
strength
of
LC is probably due to
the
effect of shrinkage stresses which are more pro
nounced in the case
of
LC. This feature has also been reported in [5]
46
Page 3
8/20/2019 Problems of Stability
http://slidepdf.com/reader/full/problems-of-stability 3/12
Page 4
8/20/2019 Problems of Stability
http://slidepdf.com/reader/full/problems-of-stability 4/12
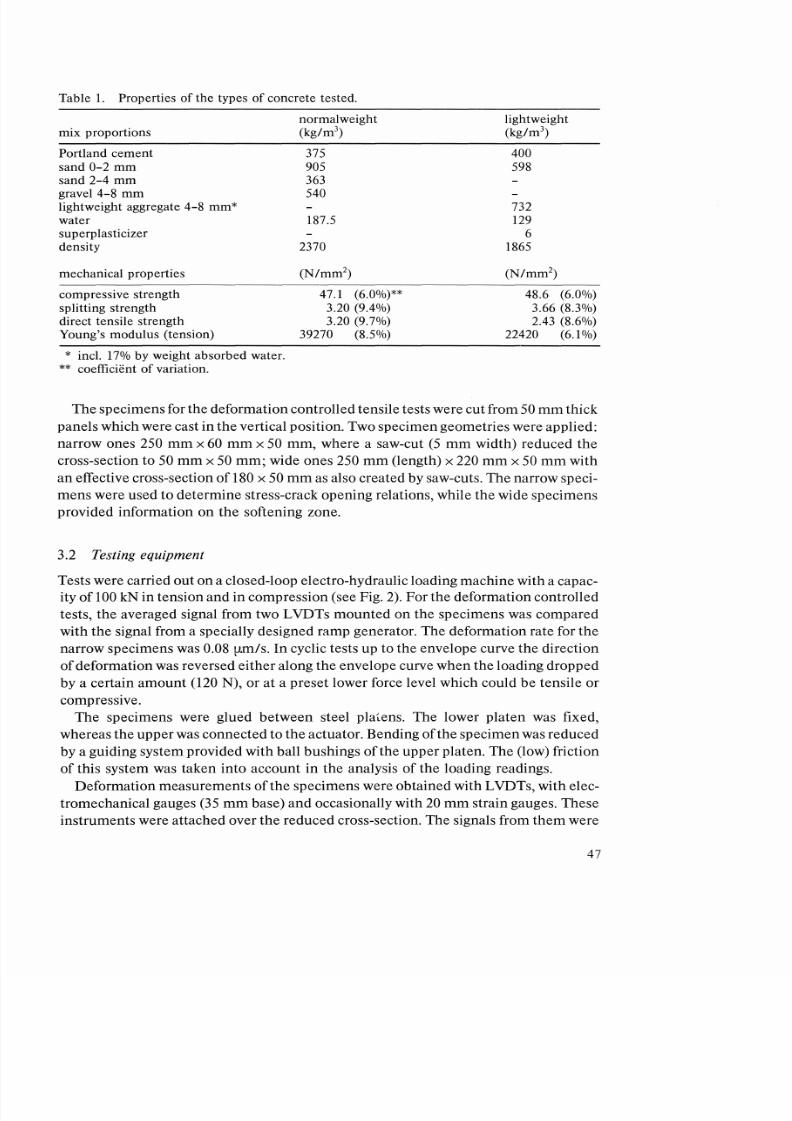
-actuator
~ ~ ~ ~ s p i r a l washer
,? grip cooling
-h-+-t------ Ioad cell
w b a l l
bushing
--gauge
--displacement
transducer
~ specimen
--I-----+--glue F8 8)
f - - - - - - b ~ ' _ _ _ 1
Fig. 2. View of the testing equipment.
transmitted to a microcomputer which also controlled the sampling rate namely six
per second after adjustable time intervals. The results were punched on paper tape and
processed with the main laboratory computer.
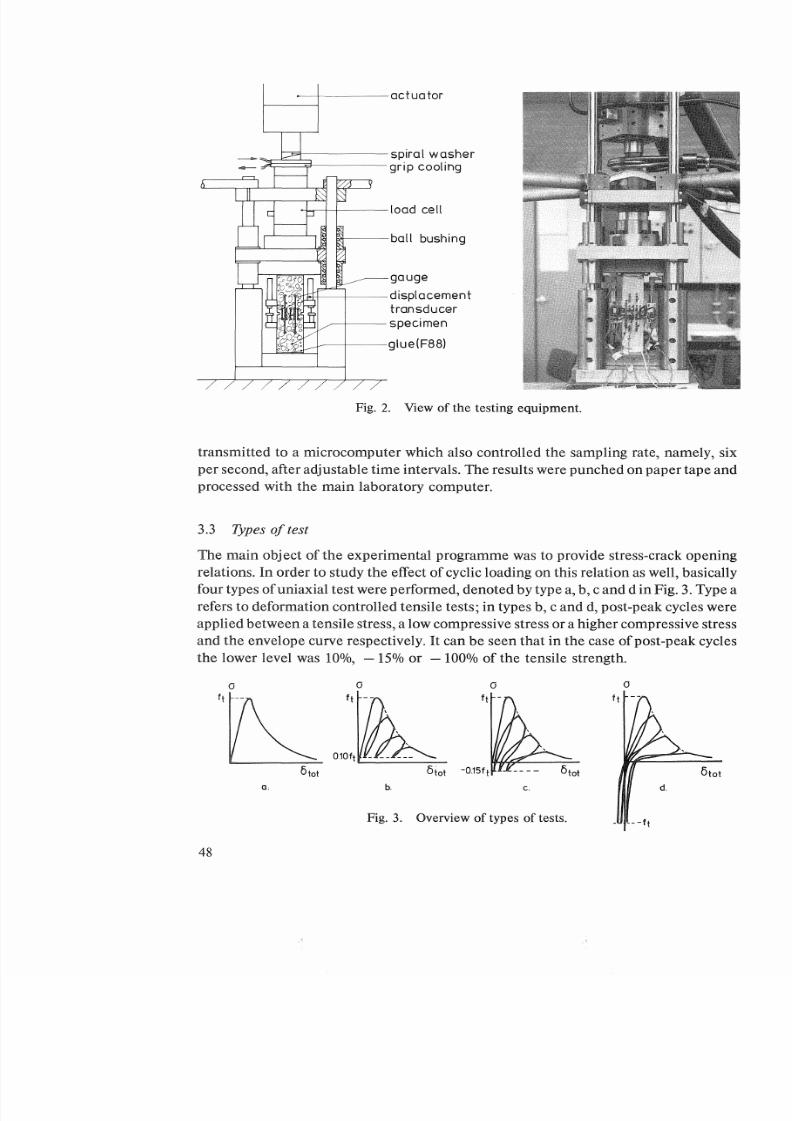
3 3
ypes o test
The main obj ect of the experimental programme was to provide stress-crack opening
relations. In order to study the effect
of
cyclic loading on this relation as well basically
four types
of
uniaxial test were performed denoted by type a b c and d in Fig. 3. Type a
refers to deformation controlled tensile tests; in types b c and
d,
post-peak cycles were
applied between a tensile stress a low compressive stress or a higher compressive stress
and the envelope curve respectively.
I t
can be seen that
in
the case
of
post-peak cycles
the lower level was 10 , - 15 or - 100 of the tensile strength.
~ , , ~ : , ~
o
o
6 tot 6iot -
0151
t
610t
Q.
c.
d
Fig.
3.
Overview of types of tests.
- -- It
48
Page 5
8/20/2019 Problems of Stability
http://slidepdf.com/reader/full/problems-of-stability 5/12
Page 6
8/20/2019 Problems of Stability
http://slidepdf.com/reader/full/problems-of-stability 6/12
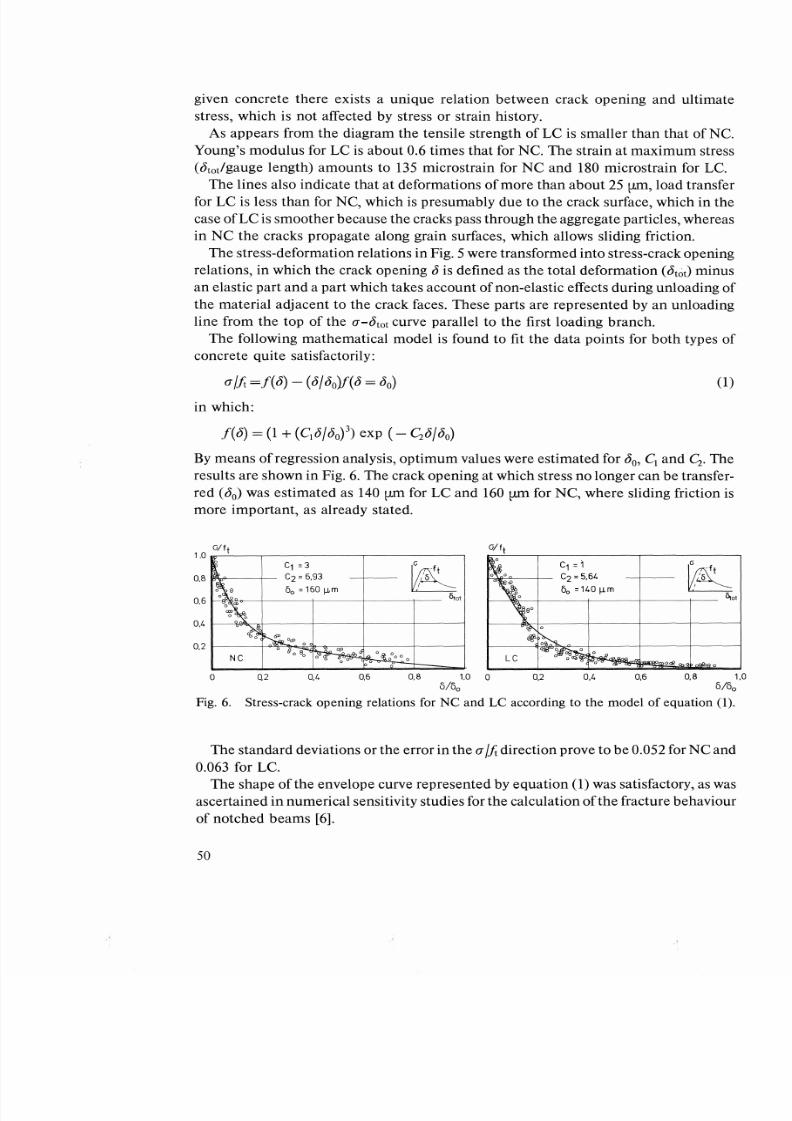
given concrete there exists a unique relation between crack opening and ultimate
stress, which is not affected by stress or strain history.
As
appears from the diagram the tensile strength of LC
is
smaller than that of NC.
Young s modulus for LC
is
about 0.6 times that for NC. The strain at maximum stress
(btot/gauge length) amounts to
135
microstrain for NC and
180
microstrain for
LC.
The lines also indicate that at deformations of more than about 25 [.Lill load transfer
for LC is less than for NC, which is presumably due to the crack surface, which in the
case ofLC is smoother because the cracks pass through the aggregate particles, whereas
in NC the cracks propagate along grain surfaces, which allows sliding friction.
The stress-deformation relations in Fig. 5 were transformed into stress-crack opening
relations, in which the crack opening 15 is defined as the total deformation (b
tot
) minus
an elastic part and a part which takes account of non-elastic effects during unloading of
the material adjacent to the crack faces. These parts are represented by an unloading
line from the top of the
a-b
tot
curve parallel to the first loading branch.
The following mathematical model is found to fit the data points for both types of
concrete quite satisfactorily:
(1)
in which:
By means of regression analysis, optimum values were estimated for
o
, C
1
and C;. The
results are shown in Fig. 6. The crack opening at which stress no longer can be transfer
red
5
o
was estimated as
140 [.Lill
for LC and 160
[.Lill
for NC, where sliding friction is
more important, as already stated.
ift
1 . 0 . - - - - - - - - - - - - - - - - -
C = 3
0,8 I \ \ ~ - t -
C2 =6,93
160
m
0.6
0 . 4 I - - . . . . q g o ~ -
C =1
t a l j ~ . - t - C2 = 5,64
L
od
G . f t
6
o ot
o 2
0 4 0.6
0.8 1.0 0
0 2
0,4 0,6 0,8 1,0
6/6
0
6/6
0
Fig.
6.
Stress-crack opening relations for NC and LC according to the model
of
equation
(1).
The standard deviations or the error in the ii direction prove to be 0.052 for NC and
0.063 for LC.
The shape of the envelope curve represented by equation (1) was satisfactory, as was
ascertained in numerical sensitivity studies for the calculation of the fracture behaviour
of notched beams
[6].
50
Page 7
8/20/2019 Problems of Stability
http://slidepdf.com/reader/full/problems-of-stability 7/12
The area under the stress-crack opening relation
is
a measure for the fracture energy,
usually called
Gr.
Based on equation
1)
with mean values forft, G
r
= 100 N m
for NC
and
61
N m
for Le The characteristic length according to Petersson [7]:
lch
= rJft2 is
380 mm for NC and 230 mm for LC respectively.
5 Post-peak cyclic
beh viour
For modelling the post-peak behaviour it
is
necessary also to have information on the
relations between stress and deformation during unloading and reloading. For this
reason test results obtained from narrow specimens were evaluated. Characteristics
will be discussed with reference to the decline in stiffness, the increase in damage due to
load cycles which is indicated by the stress drop on the envelope curve), and the resi
dual strain at the maximum
of
the applied compressive stress.
5 1
tiffness degradation
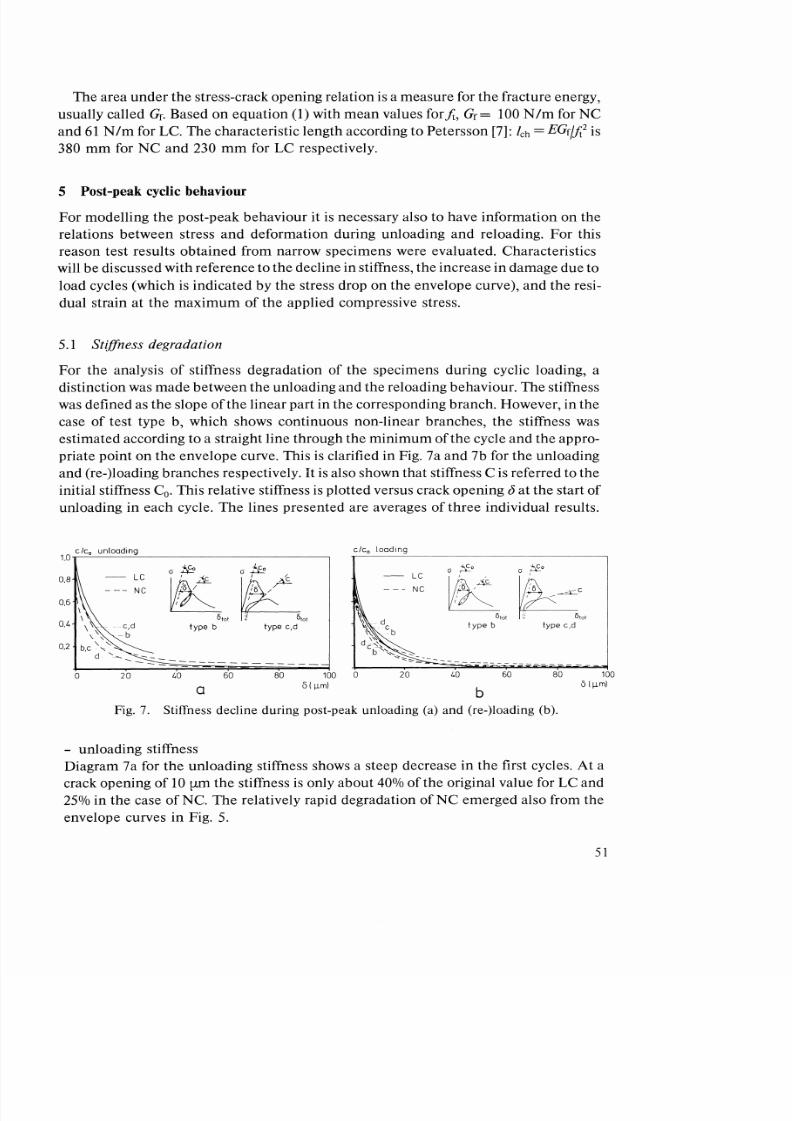
For the analysis of stiffness degradation of the specimens during cyclic loading, a
distinction was made between the unloading and the reloading behaviour. The stiffness
was
defined as the slope ofthe linear part in the corresponding branch. However, in the
case of test type b, which shows continuous non-linear branches, the stiffness
was
estimated according to a straight line through the minimum
of
the cycle and the appro
priate point on the envelope curve. This
is
clarified in Fig. 7a and 7b for the unloading
and re-)loading branches respectively. t is also shown that stiffness C is referred to the
initial stiffness Co. This relative stiffness is plotted versus crack opening i at the start of
unloading in each cycle. The lines presented are averages
of
three individual results.
1.0-i-C-.:: C,,-,
- u n - - , - l o , - a - , , , d i - , n g ~
-
0.8
0.4
0.2
o
LC
- --
NC
c d
b
20
GiB
Otot
type b
40 60
80 100
a
BI>L
m
cleo
loading
LC
- - - NC
6
to
t
type b
40 60
b
80 100
B1>L
m
)
Fig.
7.
Stiffness decline during post-peak unloading a) and re-)Ioading b).
- unloading stiffness
Diagram 7a for the unloading stiffness shows a steep decrease in the first cycles. At a
crack opening
of
10 [l11l the stiffness is only about
40 of
the original value for LC and
25
in the case
ofNe
The relatively rapid degradation ofNC emerged also from the
envelope curves in Fig. 5.
5
Page 8
8/20/2019 Problems of Stability
http://slidepdf.com/reader/full/problems-of-stability 8/12
For both types of concrete there is no significant effect of the type of test, which is in
agreement with the assumption that the relation between stress and crack opening
is
not affected by preceding behaviour.
- reloading stiffness
The development of the relative stiffness of the re-)loading path is expressed by
Fig. 7b. Here the decrease in stiffness is even more pronounced than for the unloading
path, as follows from the comparison of CIC
o
at a crack opening of
10
[J.ITl for both paths.
For reloading, the corresponding values are 30 for LC and
20
for NC. This marked
decrease is probably due to additional crack propagation in the preceding unloading
parts of the cycles.
For NC as well as for LC a slower decrease in reloading stiffness can be observed in
the case of type b tests, indicating that preceding unloading in tension is less detrimen
tal than in compression. However, more experimental data
is
needed to support these
findings.
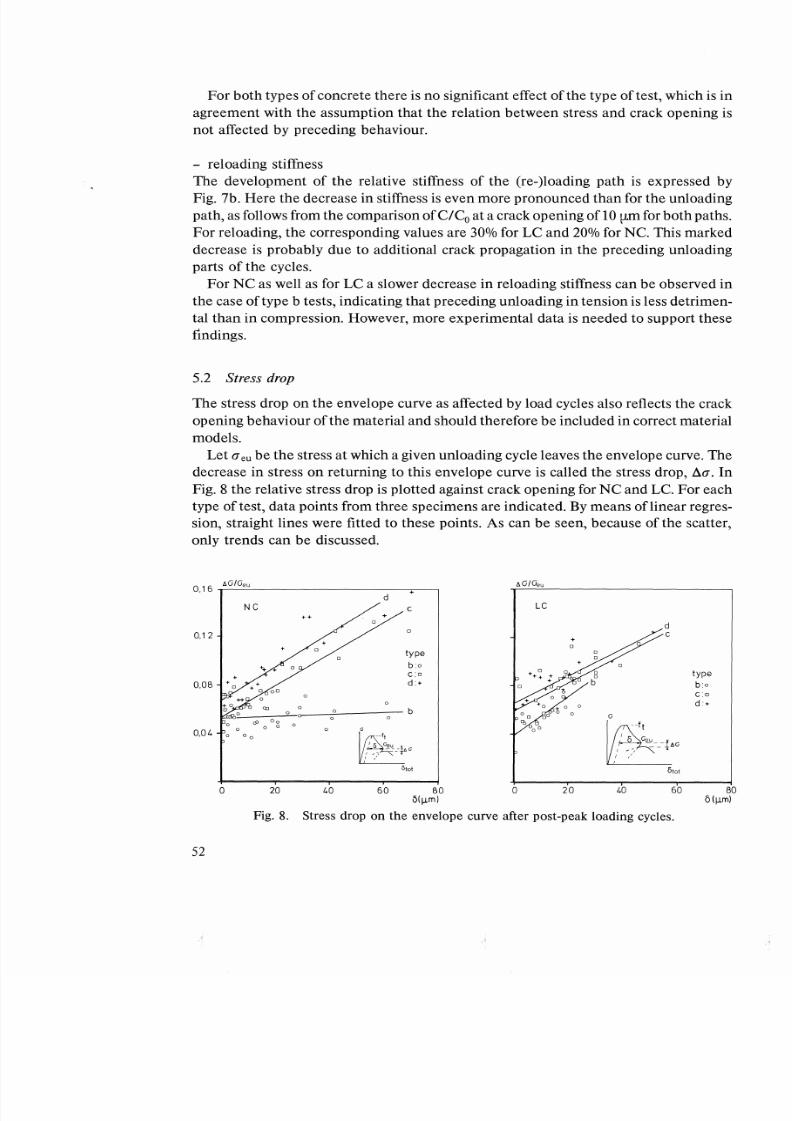
5 2 Stress drop
The stress drop on the envelope curve
as
affected by load cycles also reflects the crack
opening behaviour of the material and should therefore be included in correct material
models.
Let
a
eu be the stress at which a given unloading cycle leaves the envelope curve. The
decrease in stress on returning to this envelope curve
is
called the stress drop, fla In
Fig. 8 the relative stress drop is plotted against crack opening for NC and LC.
For each
type of test, data points from three specimens are indicated. By means oflinear regres
sion, straight lines were fitted to these points. As can be seen, because of the scatter,
only trends can be discussed.
0 16
0,12
O,OB
0,04
52
:..O/0
eu
NC
+
0
0
0
0
0
d
c
type
b o
C
D
:
b
0
6
Ci
eu
, - ~ - - f o
,
O\ot
LC
type
b :0
C
D
d
:+
o
20 40
60 BO
0
20
40
60
BO
61iJ.ml 61iJ.ml
Fig. 8, Stress drop on the envelope curve after post-peak loading cycles,
Page 9
8/20/2019 Problems of Stability
http://slidepdf.com/reader/full/problems-of-stability 9/12
For
N
as well as for LC the development
of
stress drop
is
approximately similar for
types c and d see Fig. 3 for explanation), showing an increase in relative stress drop
from about 6 up to about 14 at a crack opening of 60
[ Lill
In the case of test type b
however, the relative stress drop for LC also increases, while N shows
an
almost con
stant value, indicating a decreasing absolute
l(J.
This can be explained by the fact that
during a small amount of unloading
in
tension the crack surfaces may fit rather well for
NC, resulting in minor damage, whereas in the case ofL because
of
its smooth crack
surfaces, small transverse displacements are possible, which prevent crack closure on
unloading and consequently give rise to extra damage.
The relative stress drop is more for types d and c than for type b for NC, and to a lesser
extent for LC. This again shows the detrimental effect
of
compressive unloading types
c,
d) on the tensile properties.
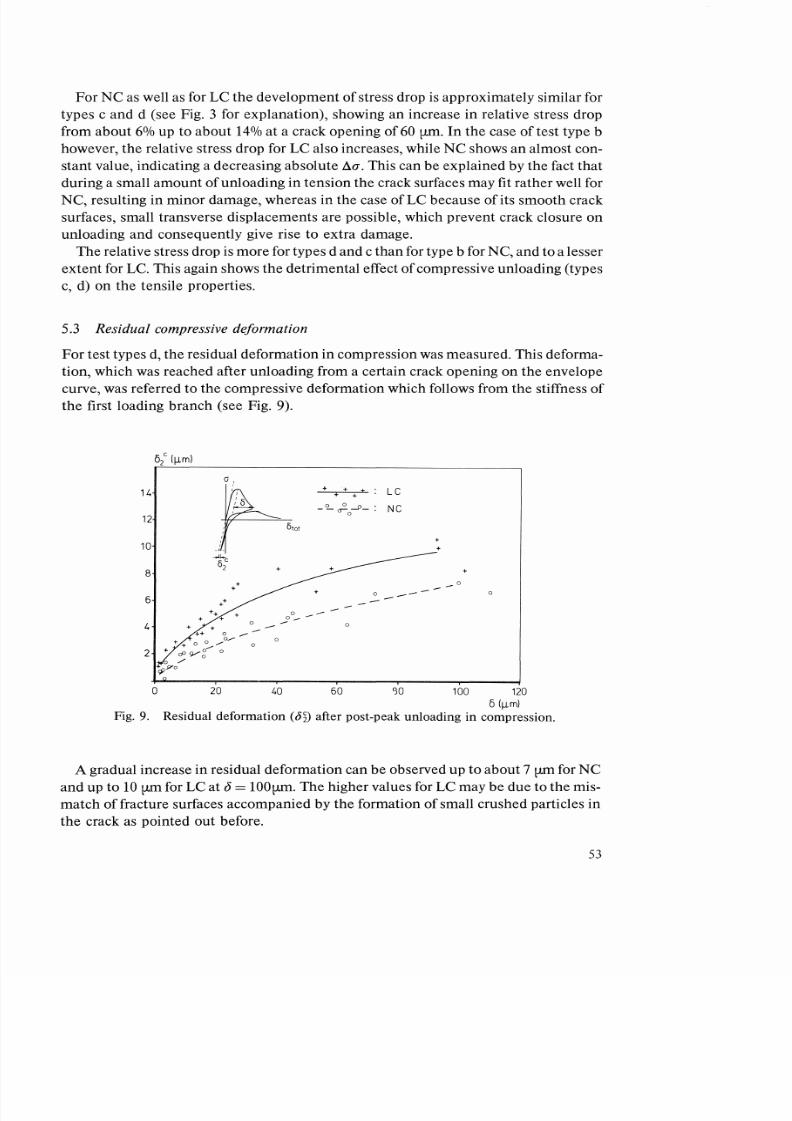
5 3 Residual compressive deformation
For test types d, the residual deformation in compression was measured. This deforma
tion, which was reached after unloading from a certain crack opening on the envelope
curve, was referred to the compressive deformation which follows from the stiffness
of
the first loading branch see Fig. 9).
14
12
10
: LC
: 0
~ ~ o P : N
5to
t
8
6
4
4oIl..-
c
++ 0
0
0 ........
2 cP ¥
0
o /
cp9 O
o
20
40
60 100 120
6
11m)
Fig.
9.
Residual deformation
5
2
)
after post-peak unloading in compression.
A gradual increase in residual deformation can be observed up to about 7
[ Lill
for
N
and up to 10 [ Lill for LC at 0 = 100[.Lill. The higher values for LC may be due to the mis
match of fracture surfaces accompanied by the formation
of
small crushed particles in
the crack as pointed out before.
53
Page 10
8/20/2019 Problems of Stability
http://slidepdf.com/reader/full/problems-of-stability 10/12
6 Stress distribution in a wide cracked plate
In
deformation controlled tests on wide specimens the deformation distribution over
the cross-section between the saw-cuts was measured in various stages of the experi
ment (see Fig. 10).
to
df L
m
tot
lf Lml
50 50
40
40
7
6
30
30
20
NC
LC
20
~
0
180
180
Fig. 10. Deformation distribution of wide NC and LC specimens.
Because bending could not
,be
excluded completely, both diagrams show symmetric
deformation distributions during the first loading steps, but eccentric deformation
occurs later on. This, however, does not affect the aim of these tests, which was to pre
dict the overall stress-deformation behaviour
of
a wide cracked plate by making use of
local deformation and general stress-crack opening relations.
In order to minimize the error, most data should be taken from the actual specimen,
i.e. Young s modulus and tensile strength. If taken from average values of other test
series, scatter would already enter the calculation. Therefore, Young s modulus was
determined from the strain distribution in the pre-peak state
and
the condition ofequili
brium, i.e.
i
dx=
total external force. Using this Young s modulus, the total external
load at subsequent loading stages was calculated. At a certain load, predicted and
measured total force were not in agreement. By iteration and use of eq. (1) for the
descending branch the tensile strength could
then
be calculated. Both quantities (Eand
it fell within the scatter band of the results for narrow specimens.
Based on the relations obtained, stress distributions were deduced from the experi
mentally determined deformation distribution in Fig.
10.
Some typical examples are
presented
in
Fig.
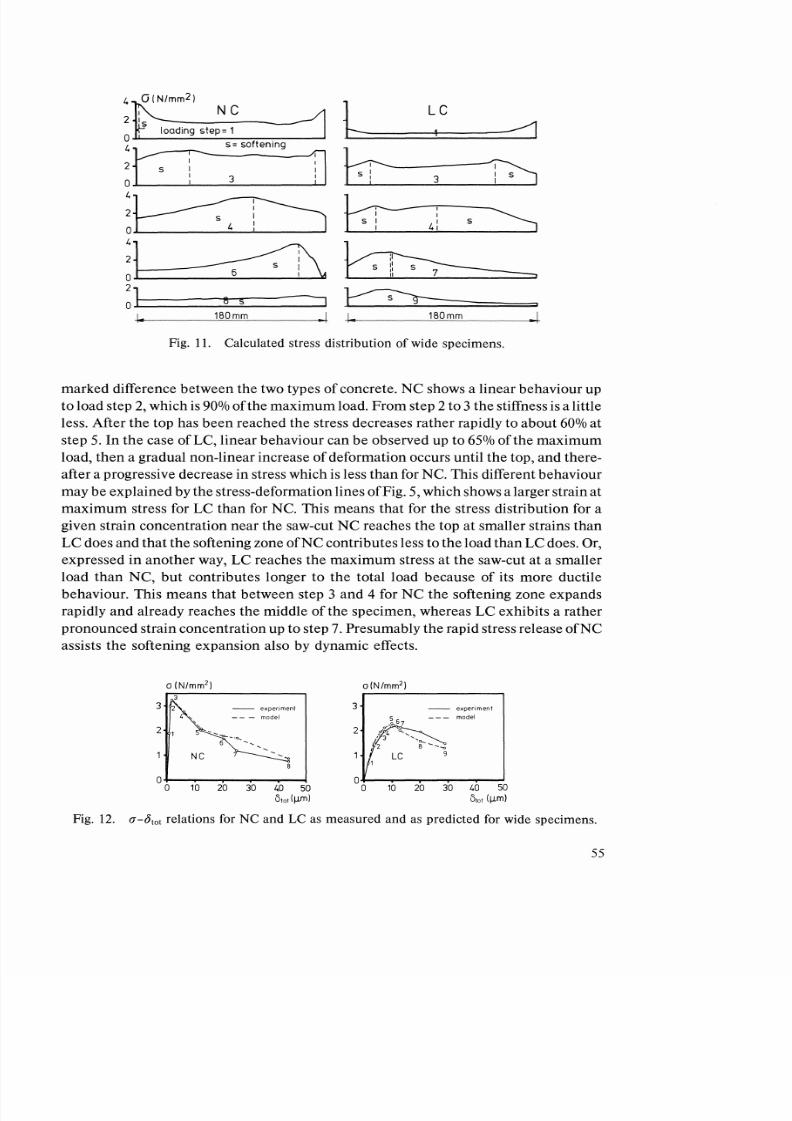
11. t
is clearly demonstrated that the softening zone spreads from the
edge over the whole cross-section for increasing deformations.
The total force calculated from the stress distribution curves was divided by the origi
nal cross-sectional area and plotted against the mean deformation 35 mm base)
in
Fig.
12. The measured force divided by the original cross-sectional area is also represented
in these diagrams, which show good agreement, confirming the applicability of he pro
posed method.
On comparing the loading branches of the a Otot curves in Fig. 12 there is seen to be
54
Page 11
8/20/2019 Problems of Stability
http://slidepdf.com/reader/full/problems-of-stability 11/12
4 O N/mm
2
)
t;rng ~ ==:1 l.c:::=======L =:C======----:1::::::.-.J
:rr
: ~ f I . , o g
j ]
b---3---b
: ~
k--.1._s
.. --__ .......:4 i
__
_ ~_
_
2
0
41
_
1
~ l ~ ~ e ~ s ~ ~
180mm .1
I
180mm
Fig.
11.
Calculated stress distribution
of
wide specimens.
marked difference between the two types of concrete. NC shows a linear behaviour up
to load step
2,
which
is
90
ofthe
maximum load. From step 2 to 3 the stiffness
is
a little
less. After the top has been reached the stress decreases rather rapidly to about 60 at
step 5. In the case ofLC linear behaviour can be observed up to
65
of the maximum
load,
then
a gradual non-linear increase
of
deformation occurs until the top, and there
after a progressive decrease in stress which is less than for NC. This different behaviour
may be explained by the stress-deformation lines ofFig.
5,
which shows a larger strain at
maximum
stress for LC than for NC. This means that for the stress distribution for a
given strain concentration near the saw-cut NC reaches the top at smaller strains than
LC does and that the softening zone ofNC contributes less to the load than LC does. Or,
expressed in another way, LC reaches the maximum stress at the saw-cut at a smaller
load than NC, but contributes longer to the total load because of its more ductile
behaviour. This means that between step 3 and 4 for NC the softening zone expands
rapidly and already reaches the middle
of
the specimen, whereas LC exhibits a rather
pronounced strain concentration up to step
7.
Presumably the rapid stress release
ofNC
assists the softening expansion also by dynamic effects.
o IN/mm')
3
2
- experiment
3
- xp rim nt
- - model
2
5
-
:-0--.0...
6
NC
5 - - - model
,0.67
2 ~
II : : : - - . ~
1
II
LC
B 9
0 o ~ ~ ~ ~ - - ~ - - ~ - -
0
10 20
30 40
50
o 10
20
30 40 50
O o , l ~ m )
0'0'
I ~ m )
Fig. 12.
(J -Otot
relations for NC and
LC
as measured and as predicted for wide specimens.
55
Page 12
8/20/2019 Problems of Stability
http://slidepdf.com/reader/full/problems-of-stability 12/12
7 Conclusions
1. The tensile envelope curves for normal as well as for lighweight concrete are not sig
nificantly affected by cyclic loading.
2. Because of the uniform stress distribution in the narrow specimens, the models for
the descending branch based on these specimens can be regarded as material proper
ties.
3. Damage in the unloading branch probably affects the stiffness decline in the subse
quent loading branch. For crack openings smaller than about 25 [-UTI LC shows less
decline
than
NC
as
indicated by reloading and unloading post-peak stiffness.
4. Damage indicated by relative stress drop along the envelope curve is affected by the
lower level of the loading cycle. Because of extra damage induced by mismatch of
fracture surfaces, the effect is less pronounced for LC.
5. Based on models derived from narrow specimens, stress distribution in wide speci
mens could be calculated.
6.
The softening zone in
the
vicinity
ofa
crack spreads faster in normal weight concrete
than in lightweight concrete, once the tensile strength is reached.
8 Acknowledgements
These investigations were partly supported by the Netherlands Foundation for the
Technical Sciences (STW), future Technical Science Branch Division
of
the Nether
lands Organization for the Advancement of Pure Research (ZWO).
The authors wish to express their grati tude to Mr. G. Timmers for his valuable assist
ance.
9 References
1. H. W.
REINHARDT
Fracture mechanics of
an
elastic softening material like concrete, Heron,
Vol. 29, No.2 1984, 42 pp.
2.
A. HILLERBORG Analysis
of
fracture
by
means
of the
fictitious crack model particularly for
fibre reinforced concrete, Int. Journal of
Cement
Composites, 2, 1980, pp. 177-184.
3. D. S. DUGDALE Yielding of steel sheets containing slits, Journal
of
Mechanics
and
Physics of
Solids, 8 1960, pp. 100-104.
4.
G. 1. BARENBLATT
The
mathematical theory of equilibrium cracks in brittle fracture, Advances
in Applied Mechanics, 7, 1962, pp. 55-129.
5. B. FouRE, Note sure la chute de resistance a la traction
du betonleger
consecutive a arret de la
cure humide.
Ann.
de l Inst. Techn. du Biltiment et des Travaux Publics, No. 432, 1985,
pp.I-15.
6. J. G.
ROTS
Strain-softening analysis of concrete fracture specimens. Preprints Rilem Int. Conf.
on Fracture Mechanics of Concrete, Lausanne, Vol. 1 1985, pp. 115-126.
7. P.
E. PETERSSON
Fracture
energy of concrete:
Method of
determination,
Cement and
Concrete
Research, Vol. 10, 1980, pp. 79-89.
56