33
by Lambert Tall December 1971 Negussie Tebedge European 'Colum'n Studies PROCEDURE FOR TESTING CENT ALL -LOADED COLUMNS Frits Engineering 'Laboratory Report No. 351.6

by
Lambert Tall
December 1971
Negussie Tebedge
European 'Colum'n Studies
PROCEDURE FOR TESTINGCENT ALL -LOADED COLUMNS
Frits Engineering 'Laboratory Report No. 351.6

European Column Studies
PROCEDURE FOR TESTING
CENTRALLY LOADED COLUMNS
by
Negussie Tebedge
Lambert Tall
This study has been carried out as part of an investigation jointlysponsored by the European Convention of Constructional Steelwork,National Science Foundation, and the Welding Research Council. Technical guidance was provided by the Task Group 11 of the Column Research Council.
Fritz Engineering LaboratoryLehigh University
Bethlehem, Pennsylvania
December 1971
Fritz Engineering Laboratory Report No. 351.6

TABLE OF CONTENTS
Page
ABSTRACT i
1. INTRODUCTION 1
2. THE CENTRALLY LOADED COLUMN' 3
2.1 Application 3
2.2 Experiments on Columns 3
2.3 End Fixtures 4
3. COLUMN TEST PROCEDURE 6
3.1 Preparation of Specimens 6
3.2 Initial Measurements 6
3.3 Alignment ~ 7
3.4 Instrumentation 8
3.5 Testing Procedure 10
4. TEST RESULTS 12
4.1 Preparation of the Data 12
4.2 Eva}uation of Test Results 13
5 . ACKNOWLEDGMENTS 14.- .
6. FIGURES 15
7. REFERENCES 29

i
ABSTRACT
This report describes a procedure for the testing of centrally
loaded steel columns. A detailed description is presented on the pre
paration of specimen, initial measurements, alignment, instrumentation,
and the testing procedure. Also, a procedure for data analysis and
evaluation of the results is presented.
The scope of this procedure is applicable to light and heavy
columns of rolled shapes as well as built-up shapes. The column speci"
mens may have pinned or flat end conditions.

-1
1. INTRODUCTION
A column may be defined as a member subjected to compressive
loads at the ends and whose length is considerably greater than its
cross-sectional dimensions. Even though an extensive analytical and
experimental study on column behavior has been conducted for more than
two centuries, many factors make indispensable the experimental approach.
Experimental column strengths generally form a wide scatterband
when strength is plotted against slenderness ratio. The scatter is due
to initial out-of-straightness, eccentricities of load, residual stresses,
and nonhomogeniety of the material. To understand column behavior, there
is a need to isolate the effects of these factors.
In column tests, as in other stability tests, the response of
a column is influenced by the loading device used. The common types of
loadings are the gravity, deformation and pressure types. The load
deflection characteristics of each loading system are different. The
oldest form of testing device used for columns was the gravity type.
For such a system, the load-deflection characteristics are simple and can
be represented by a series of straight lines parallel to the deflection
axis. Later, the screw-type testing machine came into use. Such a
loading device has the advantage of providing an accurately defined load
deflection characteristic, where the slope of this characteristic depends
on the elastic response of the loading system. As higher capacities of
loading machines became needed, the hydraulic-type testing machines were
developed. Hydraulic machines in their present form are a recent devel
opment, but the use of hydraulic power in testing machines goes back to

-2
1829(1). Such loading devices, however, do not have easily defined
load-deflection characteristics and depend on the properties of the
hydraulic system, leakage, temperature and other factors. For all
types of testing machines the experimental results are influenced by
the rate of loading used, as well as by the characteristics of the
machine.
It is common practice to plot deflections of the column as
a function of the axially applied load. For the perfect column there
would be no lateral deflection up to the critical load, but the experi
mental column will begin to deflect at the beginning of loading owing
to various kinds of imperfections.
Measurements of the more important deflections and deformations
are used to check theoretical predictions. The instrumentation for
column tests has changed markedly in the past few years due to progress ,',
made on measuring techniques and data acquisition systems, and it is
now possible to obtain automatic recordings and plotting of the measure
ments. Such recordings are to be more convenient than·manual readings.

-3
2 • THE CENTRALLY LOADED COLUMN
2.1 Application
Pinned-end conditions are frequently used in column tests,
in which case the critical stress is at the mid-height section, remote
from the boundary and, therefore, not influenced by any end effects.
For the same effective slenderness ratio, the pinned-end condition
requires the use of only half-the column length used for the fixed end
condition. When using the pinned-end condition, however, it is necessary
to provide special end fixtures. This may introduce some difficulties
and considerable expense when testing columns of heavy shapes.
The pinned-end column is regarded as the basic column,
although it does not exist in actual structures. It is the member
to which the strength of all other columns is referred. Until methods
for the design of structures as a whole come into use, the design of
columns will continue to be based on the strength of the simple pinned-
end column.
2.2 Experiments on Columns
The experimental study of column behavior is conducted by
treating separately the factors that cause the wide scatter band in
test results. With regard to the effect of end condition of centrally
loaded columns, the choice may be reduced to the two limiting conditions
of end restraint. In testing columns under the fixed-end condition,
there may be a problem of determining the degree of end fixity since
complete fixity cannot be attained in reality. Also, the amount of end
fixity and, thus, the effective length of the column may not be a constant
-4
but a function of the applied load. This may be due partly to the fact
that the rigidity of the testing machine varies with the applied load
and partly to the indeterminate nature of the stress distribution at
the end, particularly at the range of loads where the material starts
to yield. The initial out-af-straightness may also be another factor
to cause variation in the effective length. These problems are not
usually as severe if pinned-end conditions are used, since the critical
stress exists at about the mid-height section.
With regard to the other factors causing wide scatter of the
experimental results, further discussion is given in later sections.
2.3 End Fixtures
For pinned-end conditions it is essential that friction
virtually be eliminated since a small amount of end constraint will cause
an appreciable increase in the column strength. Several schemes have
been used to provide the required pin condition. Some of the different
basic types of end fixtures used by column strength investigators are
shown in Fig. 1(2). The end fixtures differ from each other in that
they are either "position-fixed" or "direction-fixed" at the ends (3).
The other basic differences are with respect to their maximum carrying
capacity and effective length. Detailed descriptions on the historical
accounts and characteristic features of the basic types of end fixtures
(Fig. 1) are given in Refs. 2 and 3.
Probably the best way to reduce friction, for end fixtures
of high capacity, is by the use of a relatively large hardened cylindrical

-5
surface bearing on a flat hardened surface. Even if an identation
should occur under heavy load, rotation will be virtually frictionless.
Another interesting feature about the cylindrical fixtures is that the
effective column length can be made equal to the actual length of the
column by designing the fixtures so that the center of the cylinder is
located on the center line at the end of the column(4). When using a
cylindrical fixture, the column acts pinned-end about one axis (usually
the minor axis) and is essentially fixed-end about the other.
A schematic diagram of the end fixtures used at Fritz Engin
eering Laboratory is shown in Fig. 2. The fixtures have a maximum
capacity of 2.5 million pounds. Description of the fixture and its
performances as a "pin" is given in Ref. 4.
Another type of end fixture, used in testing columns with
round-end conditions at the Aluminium Research Laboratories, is shown
in Fig. ld. The fixture is spherically seated and has a capacity of
300,000 pounds (5) • The essential features of these fixtures are the
supporting block in which a recess has been provided to allow oil under
pressure to seep through the spherical bearing surface of the platen.
Provision is made for collecting oil after passing between the spherical
surfaces, and for returning it to the reservoir of -the pump.
-6
3. COLUMN TEST PROCEDURE
3.1 'Preparation of Specimens
The column specimen is cut from a straight portion of the
fabricated column length in order to minimize the initial out-of
straightness o~ the specimen. Both ends of the specimen are milled and
base plates are then welded by matching the geometric center ,of the
specimen to the center of the base plate. For columns initially not
straight, the milled surfaces may not be parallel to each other, but
will be perpendicular to the centerline at the ends since milling is
usually performed with reference to the end portions of the columns.
Such deviations are difficult to measure or check, but would be ex
pected to significantly influence the column strength. For small
deviations the leveling plates at the sensitive cross-head of the
testing machine may be adjusted to improve the alignment. The toler
ance in deviation must not exceed the range of adjustments of the level
ing plates of the particular testing machine.
3.2 Initial Measurements
The variation in cross-sectional area and shape and the ini
tial out-of-straightness will affect the column strength. Thus, initial
meaSUTIement of the geometric characteristics of a column is an important
step in column testing.
Cross-sectional measurements are obtained to determine the
variation between the actual dimensions of the section and the specified
nominal dimensions. Measurements of cross-sectional dimensions for wide
flange type shapes shown in Fig. 3 are taken at different points (the

-7
quarter points of the column length are recommended). In the final
evaluation the actual cross-sectional area is used as calculated from
the actual measured dimensions. A check on the calculated area may
be made by weighing the column.
The initial out-of-straightness of each specimen is measured
at nine levels, each spaced at one-eighth of the column length. Measure-
ments are taken in the two principal axes.
Figure 4 shows a method of measuring initial out-of-straightness
about both the minor and major axes of a column. Readings are taken
from a theodolite (stationed in line with the column and near one of
the ends) on a strip scale mounted to a movable carpenters frame square.
The out-of-straightness about the minor axis is obtained from four read-
ings - one with reference to each tip surface of the flange, the average
of the four readings is the final value to be used. The out-af-straight-
ness about the major axis is obtained from two readings - one with ref-
erence ta each flange surface. These values are used later in the eval-
uation of the test results.
3.3 Alignment
The alignment of a column is the most important step to be
carried out before testing the column. Basically, there are two systems
for aligning centrally loaded columns. The first method is to align
the column carefully such that the absolute maximum load which the column
can carry can be attained. The alignment is performed under load until
a certain stress criterion is satisfied.

-8
In the second method, no special attention is given to the
stress condition, except for a careful geometric alignment. Geometric
alignment is performed with respect to some defined reference point
on the cross section. The specific reference point will be defined
later. The method of geometric alignment is recommended since it is,
in general, simple and time saving. The end plates can easily be
centered with reference to the centerline of the testing machine(6):
The reference point on the cross section depends on the form
of the shape. For wide flange type shapes the best centering point is
with respect to the center of flanges, since the web has little effect
on buckling about the minor axis. This reference point may be located
at the mid-point of the line connecting the two centers of the flanges (6) ,
3.4 Instrumentation
The most important records needed in column testing are the
applied load and the corresponding lateral displacements about the
minor and major axes, strains at characteristic points, end rotations,
angles of twist, and over-all shortening. A typical column test set-up
and the required instrumentation are shown in Fig. 5.
Lateral deflections about both axes are automatically recorded
using potentiometers attached at, quarter points of the column (more points
may be used for longer columns). Lateral deflections about the minor
axis may also be measured from strip scales attached to the column and
read with a theodolite.

-9
Strains are measured using electric resistance strain gages.
For ordinary pinned-end column tests it is sufficient to mount four
strain gages at each end and eight at mid-height level. For long col
umns, it may be necessary to mount four more strain gages each at the
quarter- and three quarter points. In the fixed-end test condition
more strain gages are mounted below and above the quarter- and three
quarter levels. This is to determine the actual effective-length of
the column by locating the inflection points using the measurements
taken from the strain gages.
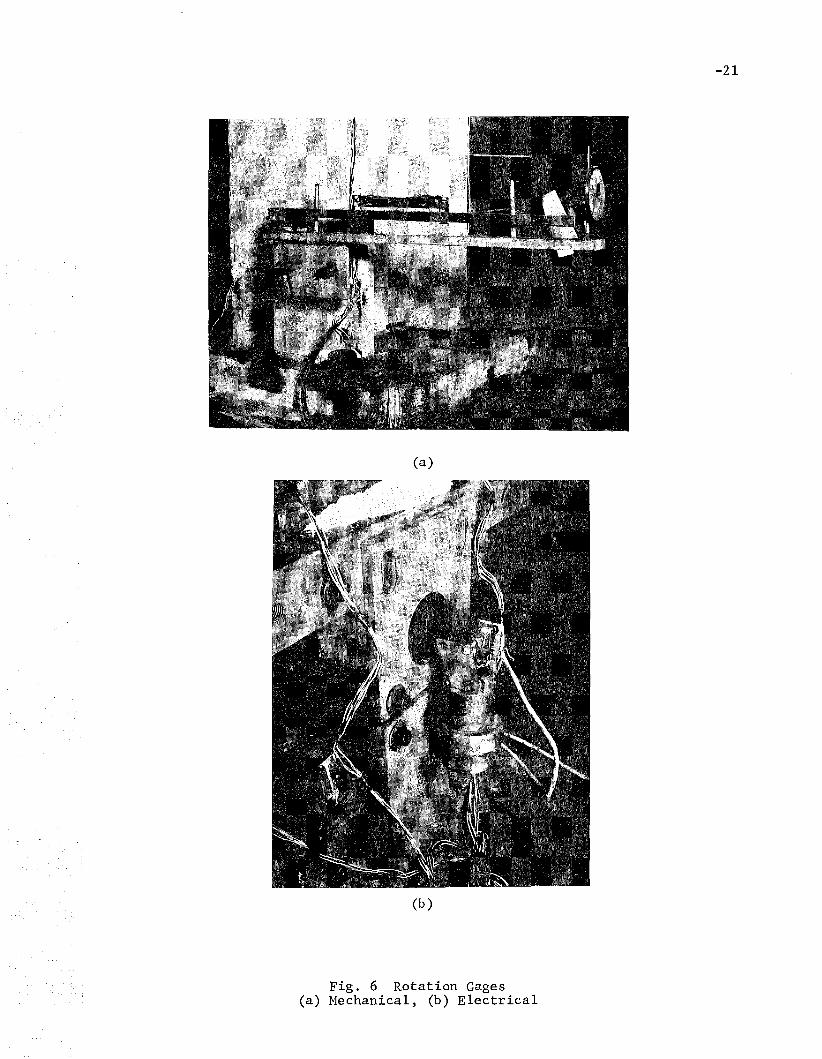
End rotations are measured using either mechanical or electri
cal rotation gages, Mechanical rotation gages(7) are used by mounting
the level bars on support brackets fastened to the base plate and the
top plate of the column (Fig. 6). Angle changes are measured by center
ing the level bubble by adjusting the micrometer screw. A vertical dial
gage attached to the end of the level bar gives an indication of the
rotation of the bar over a gage length of 20 inches. In the electrical
rotation gage, rotations are measured in the form of bending strains
induced in a thin strip from which a heavy pendulum is suspended (Fig.
6). It has been shown(8) that the strain at any location of the strip
is proportional to the end rotation.
The angles of twist are determined at mid-height and at the
two ends by measuring at each level the differences in lateral deflec
tions. For better accuracy, measurements may be taken at points located
at a further distance from the column such as the ends of two rods
attached transversely on the adjacent sides of the column.

-10
The overall shortening is determined by measuring the
movement of the sensitive crosshead using a dial gage or potentiometer.
Hot-rolled steel column specimens with original mill scale
are whitewashed with hydrated lime. During testing, the whitewash
cracking pattern caused by the flaking of the mill scale gives an
indication of the progression of yielding.
3.5 Testing Procedure
After the alignment is completed, the test is started with an
initial load of 1/20 to 1/15 of the estimated ultimate load capacity
of the column. This is done to preserve the alignment established at
the ~eginning of the test. At this load all measuring devices are ad
justed for initial readings.
The load is applied at a rate of 1 kip per square inch per
, minute and the corresponding deflections are recorded instantly. This
rate is established when the column is still elastic. The dynamic curve
is plotted until the u'ltimate load is reached inunediately after which
the "static" load is recorded. After the static load is recorded the
test is resumed using the valve setting established originally (using
the same "strain rate") until the desired configuration has been attained.
A sketch of the ,complete load-deflection curve resulting from such a test
will be similar to that shown in Fig. 7.
The IIstatic" point is obtained by maintaining the "cross-head
movement until~the applied load is stabilized. The criterion for load
stabilization is dependent on the type of testing machine being used.

-11
Basically, there are two types of testing machines: the mechanical
and the hydraulic type. For a mechanical testing machine the criterion
can easily be satisfied since the cross-head can be fixed in position.
For the hydraulic type, however, it is rather difficult to maintain
the position of the crosshead since factors such as leakage of oil and
change in oil temperature are always inherent during normal working
conditions. In such cases, the criterion is a simulation of that used
for a mechanical testing machine; that is, for no movement of the cross-
head as controlled by the loading valve, the load is allowed to stabilize
until there is no further decrease in load.
The criterion is best checked by plotting the load change
(or the crosshead movement) versus the time of stabilization. Under
normal conditions an asymptotic load (Fig. 8) may not be observed,
nevertheless, a fair estimate of the asymptotic load can be made with
out much loss in accuracy_ This load is known as the "static" load
since it is determined at "zero ll rate of loading. Usually, a time
interval of 10 to 15 minutes is satisfactory(6).

-12
4. TEST RESULTS
4.1 Presentation of the Data
The behavior of test columns under load is determined with
the assistance of measurements of lateral deflections at various levels
along the two principal directions, rotations at the ends, strains at
characteristic points, angles of twist, and the column shortening.
These measurements are used to check theoretical predictions. The
results of the test are best presented in diagrammatic form. Such
plots are shown in Figs. 9 through 14.
In Fig. 9 a typical plot of the deformed shape of the
column is shown where the deflection components are measured along the
minor and the major axes. These data are used to determine the reduc
tion in column strength due to initial out-af-straightness.
Figure lO(a) shows the mid-height load-deflection curve of
the column along the minor axis, and Fig. lO(b) along the major axis.
The load-deflection curves give the most significant data of the
column test.
A plot of the strains at mid-height of the column measured
with the strain gages is shown in Fig. 11. This plot may be compared
with the stub column test result to detect any unusual behavior of the
column.
End rotations of the column as measured by both mechanical
and electrical rotation gages are shown in Fig. 12. The results may
be checked by comparing with the lateral measurements along the length

-13
of the column (Fig. 10).
The angles of twist at mid-height and at the two ends are
shown in Fig. 13. The values are determined by using the differences
in lateral deflections of the flanges about the weak axis.
Figure 14 shows a typical plot of the load and the corres
ponding overall shortening of the column.
The progression of yielding of the cross section is detected
from the cracking of the whitewash. The subsequent development of the
whitewash cracks may be recorded in order to indicate the yielding
pattern during loading. Whenever local buckling or any other phenomena
occurs during the test it should be recorded.
4.2 Evaluation of Test Results
Evaluation of the test results may be performed by comparing
the experimental load-deflection behavior and the theoretical predic
tion. A preliminary theoretical prediction can be made based on simpli
fied assumptions of material properties, residual stresses and measured
initial out-of-straightness. The prediction may be improved if the
actual residual stresses and the variation in material properties are
used in the analysis.

-14
5. ACKNOWLEDGMENTS
This investigation was conducted at Fritz Engineering Lab
oratory, Lehigh University, Bethlehem, Pennsylvania. The European
Convention of Constructional Steelwork, the National Science Founda
tion, and the Welding Research Council jointly sponsor the study.
The guidance of Task Group 11 of the Column Research Council,
under the chairmanship of Duiliu Sfintesco, is gratefully acknowledged.
Acknowledgment is also due to members of Task Group 6 of the Column
Research Council for their suggestions in many parts of this investi
gation.
Thanks are due to Mrs. Sharon Balogh for the preparation of
the drawings and to Ms. Shirley Matlock for her care in typing the
manuscript.

.., '
6. FIGURES
-15

yv .......
Free Warping End
Fig. 1 Basic Types of End Fixtures
I........0'\

Scale: 1'= 10"
Wedges
(Side Plates not Shown)
Bearing Block
Machine Base
Adjusting Assembly
Column Specimen( Welded to Base- Plate)
Cylindrical Bearings
o
~II Column Base Plate
311
Fixture PlatenI~..&...'---L' --..L...'---.L'---III
Main Cylindrical Bearing
SidePlates
Fig. 2 Standard Column End Fixture at FritzEngineering Laboratory (Capacity=2.5 Million Pounds)
Ir-a-..J

I....
-18
h~
tHI [ _,_~ _______.___&.__
~,__~b,........:..-f __.... 1
Fig. 3 Required Measurements of Cross-SectionalDimensions to Determine Actual Shape and
Area

Adjustable
Pointer
-19
Carpenter's
Frame
Measurements made
with Reference I, 2, 3, 4
(a) Measurement about Minor Axis
® - y
(b) Measure'ment about Major Axis
Fig. -,4 A Method for Measuring Initial outof-Straightness of Columns

Potentiometer
Strip Scale
Piano Wire
Electrical
Rotation Gage
II ~I AII ---lI)
III( II ~_.
IIIIIII(
UJI. ~ ~
A
L
Strain Gages
Tapered - I
Plates
EndFixture
Bose Plate
Cyl indrical
Bearing
ISection A-A
Fig. 5 Set-up for Column Testing
INo
(a)
(b)
Fig. 6 Rotation Gages(a) Mechanical, (b) Electrical
-21

PSM =Maximum Static Load
POM =Maximum Dynamic Load
POM t-----__ ... _____
PSM
APPLIEDLOAD
P
Dynamic Curve
-22
MID - HEIGHT DEFLECTION, ~
Fig. 7 Typical Load-Deflection Curve of Column

LOAD
DEFLECTION
p
Actual------£
Curve
-23
Hypothetica I
Curve
o 5 10 15 20
TIME (MINUTES)
Fig. 8 Actual Load-Relaxation Curves
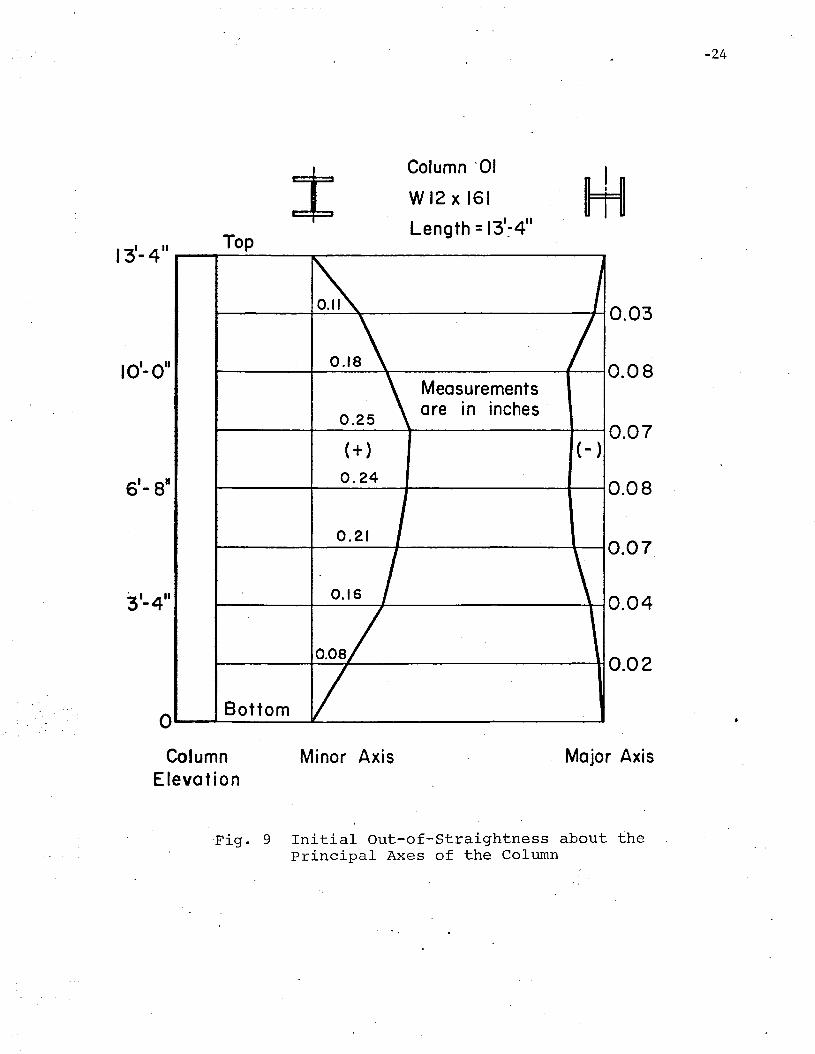
-24
1------+---#------------1-10.02
Bottom
0.03
10'-0" 0.18 0.08Measurements
0.25are in inches
0.07(+) (- )
6'- 8· 0.240.08
0.210.07
3'-4" 0.16 0.04
Column '01
WI2 xl61
Length =131~4"
13'- 4" ............._T_o_p -------------
ColumnElevation
Minor Axis . Major Axis
·Fig. 9 Initial Out-af-Straightness about thePrinci"pal Axes of the Column

Column 01
Shape: WI2x 161
Steel: A36
1000
LOADp
( kips)
500
LMaximumStatic
p
It
~~ l-- j:
L/r =50
POM =1154 k
PSM =IOS4k
1000
8
p
IHI .
eminor =0.2511
e major =O.OS"
MAJOR AXIS DEFLECTION,
(b)
o 1.0 2.0 3.0
. MINOR AXIS· DEFLECTION, ~ (in.)
(0 )
o 0.1 0.2 0.3
8 (in.)
Fig. 10 Load-Deflection Curves INlJ1 .-

-10 o
Level 3• a ,6.
Icol.ollI
; -; i
-26
Fig. 11 Strain Measurements at Mid-HeightSection Using Strain Gages
1000
PLOAD
(KIPS)
o 10
~ Mechanical Rotation Gage at Bottom End--+- Electrical Rotation Gage at Bottom End
--0-- Electrical Rotation Gage at Top End
20 30
8, END ROTATION x IO~3 (RADIANS)
Fig. 12 End Rotations Using Mechanicaland Electrical Rotation Gages

1000
6'-8U
~potentiom.t.r
6. FI'"
Angle of Twist I ep ~
Curves for Angle of Twist
Top •Middle ..Bottom a
-27
-5 a 10 20 30
ep J ANGLE OF TWIST x 10-3 (RADIAN)
Fig. 13 Angles of Twist at Three Levels

1000
900 -
800
700
600P
LOAD 500(K IPS)
400
300
200
100
p
-28
o 0.1 0.2 0.3
8,CROSSHEAD MOVEME NT (I N.)
Fig. 14 Load Versus Overall Shortening Curve

-29
7. REFERENCES
1. Gibbons, C. H.MATERIAL TESTING MACHINES, Pittsburgh, 1935.
2. Estuar, F. R. and Tall, L.TESTING PINNED-END STEEL COLUMNS, Test Methods for Compression Members, ASTM STP419, Am. Soc. Testing Mats., 1967.
3. Salmon, E. S.MATERIALS AND STRUCTURES, Longmans, Green and Co., London,1931.
4. Huber, A. W.FIXTURES FOR TESTING PIN-ENDED COLUMNS, ASTM Bulletin, No.234, December 1958.
5. Templin, R. L.HYDRAULICALLY SUPPORTED SPHERICALLY SEATED COMPRESSION TESTINGMACHINES PLATENS, Proceedings, American Society for Testingand Materials, Vol. 42, 1942.
6. Tebedge, N., Marek, P. and Tall, L.ON TESTING METHODS FOR HEAVY COLUMNS, Fritz Engineering Lab.Report No. 351.5, March 1971.
7. Johnston, B. G. and Mount, E. H.DESIGNING WELDED FRAMES FOR CONTINUITY, Welding Journal,18, pp. 253-s, 1939.
8. Yarimci, E., Yura, J. A. and Lu, L. W.ROTATION GAGES FOR STRUCTURAL RESEARCH, Experimental Mechanics, Vol. 8, No. 11, Nov. 1968.


