353


Proceedings of the 2006 Naxos International Conference on Sustainable
Management and Development of Mountainous and Island Areas
Editor: Dr Evangelos I. Manolas, Assistant Professor, Department of Forestry and Management of the Environment and Natural Resources, Democritus University of Thrace Printed by:
University of Crete
ISBN: 960-89345-0-8 Volume I: 960-89345-1-6 First printing: Heraklion-Crete, Greece, September 2006 Copyright © 2006
Department of Forestry and Management of the Environment and Natural
Resources, Democritus University of Thrace
All rights reserved.

P r e f a c e
The papers in these Proceedings were presented at the 2006 Naxos International Conference on Sustainable Management and Development of Mountainous and Island Areas, organized by the Department of Forestry and Management of the Environment and Natural Resources, Democritus University of Thrace, and co-organized by the Geotechnical Chamber of Greece, the Municipality of Naxos, the Municipality of Drimalia and the Cultural Organization of Koronos.
The conference sought to bring together an international and interdisciplinary audience, and in particular, researchers, government officials, company representatives or environmental activists. The aims of the conference were to tackle many of the issues connected with the sustainable management and development of mountainous and island areas, share experiences and work towards solutions.
The three-day meeting included presentations from 10 different countries, in particular, Bangladesh, France, Germany, Greece, Hungary, India, Malta, Slovenia, The Netherlands and United Kingdom. Key note speakers were Prof. Eugenia Bezirtzoglou, Democritus University of Thrace, Prof. Ioannis Hatzopoulos, University of the Aegean, Prof. Anastassios Papastavrou, Aristotle University of Thessaloniki, Prof. Michael Scoullos, National and Kapodistrian University of Athens, Prof. Alexandros Sideridis, Agricultural University of Athens as well as Dr Michael Littledyke, Research Director, Faculty of Education, Humanities and Science, University of Gloucestershire and Dr Paul Pace, Director, Centre for Environmental Education and Research, Faculty of Education, University of Malta.
These Proceedings present the eighty nine papers that were seen as the most useful and valuable within the context of the conference. All contributions have been reviewed for publication, and not all papers submitted could be included in the final Proceedings volumes.
I hope that the expert knowledge presented in these Proceedings will not only offer a valuable source of information on the subject of sustainable management and development of mountainous and island areas but it will also be looked back on in the future as a milestone in the development of this important field of human endeavor.
Dr Evangelos I. Manolas
President of the Organizing Committee

International Conference “Sustainable Management and Development of Mountainous and Island Areas”
29th September - 1st October 2006, Island of Naxos, Greece
THE ORGANIZING COMMITTEE President: Manolas E., Democritus University of Thrace Members: Papavasiliou G., Geotechnical Chamber of Greece Bessis C., Geotechnical Chamber of Greece Kokkotas V., Municipality of Naxos Karamanis G., Municipality of Naxos Posantzis I., Municipality of Naxos Tzouannis I., Municipality of Drimalia Manolas E., Municipality of Drimalia Houzouris N., Municipality of Drimalia Arabatzis G., Democritus University of Thrace Drossos V., Democritus University of Thrace Iliadis L., Democritus University of Thrace Karanikola P., Democritus University of Thrace Maris F., Democritus University of Thrace Milios E., Democritus University of Thrace Papageorgiou A., Democritus University of Thrace Tampakis S., Democritus University of Thrace Tsachalidis E., Democritus University of Thrace Tsantopoulos G., Democritus University of Thrace Tsatiris M., Democritus University of Thrace THE SCIENTIFIC COMMITTEE Anagnos N., Aristotle University of Thessaloniki, Greece Arabatzis G., Democritus University of Thrace, Greece Athanasakis A., University of Athens, Greece Batzios C., Aristotle University of Thessaloniki, Greece Bezirtzoglou E., Democritus University of Thrace, Greece Rojas Briales E., Universidad Politechnica de Valencia, Spain Daoutopoulos G., Aristotle University of Thessaloniki, Greece David T., Estcao Florestal Nacional, Portugal Dermisis B., Aristotle University of Thessaloniki, Greece Doukas C., Aristotle University of Thessaloniki, Greece Drossos V., Democritus University of Thrace, Greece Efthimiou P., Aristotle University of Thessaloniki, Greece Georv G., Bulgarian Academy of Sciences, Bulgaria Goulas C., Aristotle University of Thessaloniki, Greece Iliadis L., Democritus University of Thrace, Greece Kampas A., Agricultural University of Athens, Greece Karameris A., Aristotle University of Thessaloniki, Greece Karanikola P., Democritus University of Thrace, Greece

Kotsovinos N., Democritus University of Thrace, Greece Koukoura Z., Aristotle University of Thessaloniki, Greece Kousis M., University of Crete, Greece Labrianidis T., University of Macedonia, Greece Leal Filho W., TuTech, Germany Littledyke M., University of Gloucestershire, England Manolas E., Democritus University of Thrace, Greece Manos B., Aristotle University of Thessaloniki, Greece Manthou V, University of Macedonia, Greece Mavrikaki E., University of Western Macedonia, Greece Maris F., Democritus University of Thrace, Greece Matis C., Aristotle University of Thessaloniki, Greece Michailides P., University of Crete, Greece Milios E., Democritus University of Thrace, Greece Noitsakis V., Aristotle University of Thessaloniki, Greece Oliver Jose-Vicente, AIDIMA, Valencia, Spain Papageorgiou A., Democritus University of Thrace, Greece Papastavrou A., Aristotle University of Thessaloniki, Greece Pavlidis T., Aristotle University of Thessaloniki, Greece Poimenides E., University of East London, England Rafailova E., University of Forestry, Bulgaria Sakelariou-Markantonaki M., University of Thessaly, Greece Scott W., University of Bath, England Skanavis K., University of Aegean, Greece Skourtos M., University of Aegean, Greece Smiris P., Aristotle University of Thessaloniki, Greece Spartalis S., Democritus University of Thrace, Greece Tampakis S., Democritus University of Thrace, Greece Tavares M., National Forest Research Station, Oeiras, Portugal Tsachalidis E., Democritus University of Thrace, Greece Tsantopoulos G., Democritus University of Thrace, Greece Tsatiris M., Democritus University of Thrace, Greece Vlachopoulou M., University of Macedonia, Greece Zioganas C., Aristotle University of Thessaloniki, Greece

TT aa bb ll ee oo ff CC oo nn tt ee nn tt ss Oral Presentations
Adamopoulos S.: Fiber analysis techniques for sustainable manufacturing of corrugated board and packaging 1
Alexopoulos A., Voidarou C., Tsiotsias A., Stefanis C., Papadopoulos I., Vavias S., Charvalos E., Kalkani E., Bezirtzoglou E.: Evaluation of the polution level of the Ardas-Evros river ecosystem 10
Alexopoulos A., Bezirtzoglou E., Sazakli E., Tzavellas N., Leotsinidis M.: Quality Assessment of Harvested Rainwater in a Greek Island 18
Amanatidou D., Reif A., Galatsidas S.: Ecological Evaluation and Conservation Management of a Traditional Cultural Landscape in North-Western Greece 25
Anagnostou P.: Teaching English to Forestry Students: Present Situation, Future Expectations 34
Andreopoulou Z., Vassiliadou S.: The Future of Networks and Communication Technologies within Environmental Studies in Higher Education 43
Arabatzis G., Polyzos S., Tsiantikoudis S.: Resurgence of traditional activities and local development: The mulbery plantation and sericulture in the prefecture of Evros 48
Arsenis K.- I.: Triggering Collecttive Self-awareness in Local Societies: A new Approach to Push for the Protection of Greece's Landscape, Environment and Cultural Heritage 59
Borec A., Neve N.: Natural characteristics of parcels facing land abandonment and forest expansion on Pohorje Mountain (Slovenia) 72
Chatziefstathiou M., Spilanis I., Vayanni H.: Developing a Method to Evaluate the Contribution of Different Human Activities to the Sustainable Development of Islands: A case study on Marine Aquaculture 78
Christopoulou O., Polyzos S., Minetos D. : Peri-urban and urban forests in Greece: Obstacle or advantage to urban development? 88
Economou S., Karassavidis P., Kalkopoulou K.: A Development Proposal for Therapeutic Tourism Exploitation of the Area of Loutraki Arideas in the Prefecture of Pella 97
Leal Filho W., Pace P.: The UN Decade of Education for Sustainable Development: Meeting the Challenges or Another Missed Opportunity? 105
Gkotsis I., Gata S., Skondras N., Manolas E.: Lobbying for the environment: The case of Greenpeace 114
Gowda K., Sridhara M.V.: Conservation of Tanks/Lakes in the Bangalore Metropolitan Area 122
Hasanagas N., Birtsas P., Sokos C.: Code of hunters’ ethics and identity building: From state law to custom and ethos 131
Hatzopoulos I.: New technologies in geoinformation science and technology for sustainable management and development in the mountainous area of Naxos 139

Hudek C.: Sustainable Use of Peatlands 148 Iliadis L., Maris F., Spartalis S. : A Fuzzy Information System
estimating the Torrential Risk for the “Erythropotamos” river 155 Islam K.K., Rahman G.M.M.: The Effect of Eucalyptus-Rice Based
Agroforestry System on the Prevalence of Major Rice Diseases 162 Kaloudis S., Glezakos T., Ferentinos K., Tsiligiridis T.,Yialouris C.:
Feedforward Neural Network Modeling of Fir Taper in Natural Forests of Greece 166
Kantartzis A.,Varras G., Koukladas S., Kakouri P., Koutsikou M., Papadopoulou A. : Greenway Planning: Historic, Sociocultural, and Economic Issues. Prospects for a new land use strategy in Greece. 173
Karameris A., Ragkou P., Papanikolaou A.: Study of Primary and Secondary School Environmental Educators’ Understandings of Sustainable Development, Education for Sustainable Development and its relation with Environmental Education 181
Karanikola P., Manolas E., Tampakis S., Tsantopoulos G.: Assessing Global Environmental Problems: The Case of Forestry Students in a Greek University 189
Karanikola P., Tampakis S., Tampakis Β., Karantoni M.: Forest fires in the islands of Northern Sporades during the years 1965 - 2004 196
Karmiris I.: Releasing Captive Brown Hare (Lepus europaeus) to the Wild – The Role of Predators 205
Kirkenidis I., Andreopoulou Z., Fragopoulos T., Lefakis P. : Wireless Local Area Network (WLAN) among four organizations in the area of Thessaloniki 209
Korres G., Marmaras E., Kokkinou A.: Regional Planning and Sustainable Development: A Case Stusy For Greek Islands-Naxos 217
Koulouri M., Spilanis I., Kizos T., Gatsis I.: A Method for Selecting Sustainability State Environmental Indicators for Insular Areas 230
Kousis M., Psarikidou K.: Sustainability Narratives on Caretta-Caretta: Evidence from Zakynthos and Crete 240
Koutroumanidis T., Tampakis S., Manolas E., Giannoukos D., Stoupas C. : The involvement of farmers in multiple business activities in the context of sustainable management and development of island areas: The case of the prefecture of Corfu 245
Kyriazopoulos A., Arabatzis G.: Ecological and Socio-economic Approaches of Traditional Silvoarable Systems: The Case of Andros Island, Greece 250
Littledyke M.: Science education for environmental awareness: approaches to integrating cognitive and affective domains 254
Mamali H. - F.: Forest Visualisation Systems 269 Mandilara G., Smeti E., Mavridou A., Lambiri M., Vatopoulos A.,
Rigas F. : Wastewaters and Indicators of Microbiological Quality 284 Manolas E.: Designing a sustainable society: An Application of
the Richard E. Gross Problem-Solving Model 292 Marinos D., Maris F.: Estimation of Cyclades islands water
balance and the problem of sustainable water utilization 297 Maris F., Karagiorgos K., Anastasiadis S., Vassiliou A., 302

Karagiannis I.: Soil loss evaluation in the Polifitou lake basin using GIS
Mavrokordopoulou O., Aslanidou M., Smiris P. : The Island of Ikaria: Terrestrial ecosystems and restoration prospects 314
Mertzanis G., Korakis G., Kallimanis A., Sgardelis S., Aravidis I.: Bear Habitat Suitability in Relation to Habitat Types of European Interest in NE Pindos Mountain Range, Greece 321
Milios E., Petrou P., Pipinis E.: Silvicultural Treatments Aiming at the Preservation and Increase of Juniperus excelsa Bieb. Presence in Stands Located in the Slopes in the Central Part of Nestos Valley 327
Nikopoulos D., Nikopoulou D., Papadopoulou K., Alexopoulos A. : Pancratium maritimum Ecosystems in Greece 333


OO RR AA LL PP RR EE SS EE NN TT AA TT II OO NN SS


Fiber analysis techniques for sustainable manufacturing of corrugated board and packaging
Stergios Adamopoulos Technological Educational Institute of Larissa
Branch of Karditsa Department of Forestry and Management of Natural Environment
43100 Karditsa, Greece E-mail: [email protected]
Abstract. Environmental – economic pressure and associated regulations have led to a significant increase of recycled paper as the main fibrous component of corrugated board the last years. Corrugating packaging industry is facing the challenge to enhance products derived from recycled pulp and to ensure a satisfactory strength of packages. Advanced techniques are highly needed for the evaluation of packaging fiber supply sources as well as for the utilization of the available resources in an optimal manner. As industrial packaging is based on the characteristics of its constituent fibers, information on the fiber composition of the recycled raw materials is of primary importance for a continual control of fiber sources. This paper reports on the usefulness of fiber analysis techniques as diagnostic methods for assessing the potential quality distribution of fibers for sustainable packaging manufacturing.
Keywords. Fiber composition, recycled fibers, corrugated board, packaging, sustainability.
1. Introduction
Paper products form part of an integrated carbon cycle based on the photosynthesis, conversion of water, carbon dioxide, nutrients and solar energy into renewable wood-based biomass. Once consumed, paper may be recovered and used again either as a source of secondary fibers, to produce recycled paper or as bio-fuel. Hence, virgin and recycled fibers are complementary and their use has to be optimized according to the characteristics required by the final product and use.
Recycling, as part of the paper cycle, plays an important role in the sustainable development of the paper sector. In Europe, recovered paper has become a major raw material representing 46% of the total volume of the raw materials used by
the paper industry and representing a recycling rate of 51.6% in 2003 [8]. The packaging sector is the biggest consumer of recovered paper, among the different paper and board sectors, as it consumes almost two thirds of the recovered paper (30 million tons). Among the several targets of EU policies one is to promote recycling. EU Packaging and Packaging Waste Directive 94/62/EC [12], which entered into force in 1994, harmonizes national measures covering the management of packaging waste to ensure that Member State restrictions on packaging do not have the effect of creating barriers to trade, and to reduce the overall impact of packaging and packaging waste on the environment. In particular, the measure sets targets for both the recovery and recycling of waste and stipulates that Member States should take the necessary steps to set up systems capable of handling the return, collection, reuse or recovery of waste. There is a commitment [8] to ensure that 60% of paper and board products in Europe will be recycled by 2008 (Figure 1).
Figure 1. Increase of recycling rates of paper and paper products according to EU policies
The fiber sources for paperboard production have shifted from roundwood to mill residues, agro-residues and recycled paper while the share of recycled paper is projected to increase significantly over the next years due to
51.6%
56.0%
60.0%
40.0% 45.0% 50.0% 55.0% 60.0%
2003
2005
2008
1
“Sustainable Management and Development of Mountainous and Island Areas”

environmental and economic pressure [36, 28, 33, 13].
A direct consequence of the move towards higher recycling rates is the change to more heterogeneous, numerous and smaller sources for the packaging sector. Globalization and international trade of wood, pulp, paper and recovery has also resulted in continuously increasing heterogeneous composition and qualities of packaging the recent years.
According to the above there is a necessity of putting more emphasis on better characterization and classification of recovered paper quality. In summary, the actual problem is the optimization of packaging along the wood-based fiber supply chain. Improved organizational systems would increase the efficiency of all actors and, the quality of the final products, whilst improving the environmental performance of the supply chain.
The present work summarizes on the potential of fiber analysis techniques to address a very common technical problem for the corrugated board industry, the variability in raw materials (packaging grade papers) with increasing percentages of recycled fibers.
2. Recycled materials for packaging
Fiber packages, being the most prominent structural application of paper, have increased significantly their production during the last years. They are used in many packaging applications starting from simple transportation containers and ending with multicolor printed display containers for stores. Around 58 million tons of packaging is consumed annually within the European Union and there is an increasing need for packaging materials [8].
The corrugated board structural panels comprising such packaging are formed from a pair of flat faces called liners which are separated by a periodic fluted core referred to as the corrugating medium [29]. Liners are available in three basic forms (common names):
Kraft (mainly virgin kraft fibers) Test (virgin kraft fibers and recycled fibers) Recycled based (recycled fibers)
The role of the medium material is to maintain separation between the two liners. There are two types:
Semi-Chemical (mainly virgin semi-chemical fibers)
Recycled based (heavily recycled fibers)
Packaging grade papers (liners and medium) are characterized according to their component fibers (virgin or recycled), their production methodology and their weight (grammage). Concerning the board construction, besides the grade and weight of the basic materials, the formation pattern of the flutes and a number of liner/flute/liner layers (number of walls) can also be varied. By using combinations of liner paper, fluting medium and flute forms it is possible to produce boards suitable for most packaging applications.
Corrugated boards are typically lightweight and inexpensive, and have both high stiffness-to-weight and strength-to-weight ratios. Strength characteristics of packages are crucial for establishing different product qualities. Manufacturers want their packages to be more resistant, even if there are bad handling conditions, and this resistance must be fulfilled by optimizing the product, not by increasing its width or grammage. Corrugated board producers must always ensure a satisfactory strength of corrugated board and packages despite the increase of recycled paper as the main fibrous component (corrugated board contains 60-100% recycled fiber) and the continuous reduction of paperboards grammage.
Pulps from recycled waste paper consist of a mixture of papers grades. Mixed waste paper varies in composition from source to source and from day to day from a single source. Nowadays, mixed waste is the most abundant grade of waste paper available. The difficulty of predicting the properties of paper products produced from heterogeneous sources puts several limitations and a step forward would be the development of new methods for the reliable characterization of those sources. The effective utilization of such an alternative raw material by the corrugated board industry is of great environmental and economical importance.
3. Corrugating packaging sector and need for innovation
The corrugated board and packaging manufacturing industries are mostly small and medium enterprises (SMEs). In 2002, there were 735 corrugated companies in Europe, employing 89,345 people (production personnel and others) and with total shipments of 20,263,000 tons [14]. They buy their raw material on the local or
2
“Sustainable Management and Development of Mountainous and Island Areas”
regional market and try to compete with their products on the European or even global market. This leads to serious economic problems because these markets require products with defined quality characteristics and homogenous properties.
Nowadays, the paper industry and especially the corrugated cardboard manufacturing SMEs in Europe are facing the sustainability challenge at the same time that customer demands for product performance are increasing. This can only be achieved through a continuous integration of strong financial performance with an equal commitment to social and environmental responsibility, all along the fiber/paper chain. Many companies have already taken effective actions on a range of environmental and social issues, and have achievements that have open new market opportunities. However, this is a very difficult task for SMEs [26]. On the other hand, it is important to consider that at the moment mills are also facing globalization, which makes the competitiveness of SMEs to be in danger. To maintain competitiveness, the corrugated board manufacturing SMEs need to optimize all the production stages, from grade papers to final products. Therefore, there is a need for cost reduction of corrugated board production based on the optimization of both use of raw materials and process performance.
The optimization of packaging production is especially problematic for SMEs because of the lack of both research capabilities and accessibility to use advance technologies for data treatment. Therefore, innovation is needed to face the problem of the lack of wide historical databases, considering different raw materials, different operating conditions and, consequently, different properties of the products.
Corrugated industries are not only located in those countries where virgin raw material is available in big quantities, but also in all the other countries which have significant imports of paper and paper products. This is mainly the case in the southern European countries. The biggest part of these producers is SMEs. Consequently, rural areas and SMEs have the greatest advantage by improved competitiveness of the sector. By improving the existing techniques dealing with the complex problem of characterization and utilization of recycled paper of today and to diminish the formation of the value–reducing property variability in the future the
competitiveness of corrugated industry is increased.
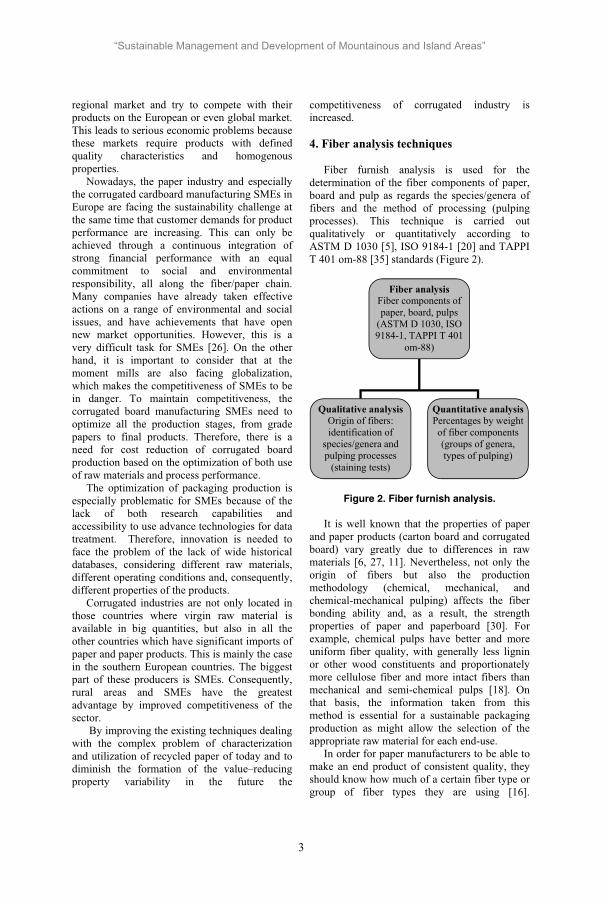
4. Fiber analysis techniques
Fiber furnish analysis is used for the determination of the fiber components of paper, board and pulp as regards the species/genera of fibers and the method of processing (pulping processes). This technique is carried out qualitatively or quantitatively according to ASTM D 1030 [5], ISO 9184-1 [20] and TAPPI T 401 om-88 [35] standards (Figure 2).
Figure 2. Fiber furnish analysis.
It is well known that the properties of paper and paper products (carton board and corrugated board) vary greatly due to differences in raw materials [6, 27, 11]. Nevertheless, not only the origin of fibers but also the production methodology (chemical, mechanical, and chemical-mechanical pulping) affects the fiber bonding ability and, as a result, the strength properties of paper and paperboard [30]. For example, chemical pulps have better and more uniform fiber quality, with generally less lignin or other wood constituents and proportionately more cellulose fiber and more intact fibers than mechanical and semi-chemical pulps [18]. On that basis, the information taken from this method is essential for a sustainable packaging production as might allow the selection of the appropriate raw material for each end-use.
In order for paper manufacturers to be able to make an end product of consistent quality, they should know how much of a certain fiber type or group of fiber types they are using [16].
Fiber analysis Fiber components of paper, board, pulps
(ASTM D 1030, ISO 9184-1, TAPPI T 401
om-88)
Qualitative analysisOrigin of fibers: identification of
species/genera and pulping processes
(staining tests)
Quantitative analysis Percentages by weight of fiber components (groups of genera, types of pulping)
3
“Sustainable Management and Development of Mountainous and Island Areas”

However, in the case of packaging grade papers such knowledge cannot be attained easily as most grades of linerboard and corrugating medium are manufactured entirely from recycled fibers.
Compositional analysis of packaging is infrequently requested from consulting microscopists and its usefulness has not been explored sufficiently in the industry until now. Fiber analysis techniques are currently used mainly to assure the purchasers that the composition of a given paper product is in accordance with the specifications [15].
4.1. Qualitative analysis
4.1.1. On the basis of the morphological characteristics of fibers
In identifying the components of wood pulps many of the positive morphological features employed in solid wood identification no longer exist. Consequently, attention is focused on the structural characteristics of one or two cell types. Practical limitations on microscopical identification also arise from degradation (cutting and shortening, tearing, fibrillation, etc.) of fibers due to processing as well as from the presence of similar species (e.g. species of the same genus that are closely related in anatomical structure) in the pulp mix. These constraints severely limit the identification of individual species, which in general is made to genera or subgroups of genera [17].
Microscope slides are prepared with fibers according to a standard methodology [5, 20, 35]. The microslides are then observed under a light microscope to a magnification range of 40 X to 800 X. As has been already mentioned, attention is focused on the structural characteristics of one or two cell types with the combined assistance of various keys and textbooks with illustrations [7, 34, 9, 31, 32, 17]. The identification of softwoods is mainly performed on the basis of the anatomical characteristics of the thin-walled earlywood tracheids (cross-field pitting, height of cross-field areas, pits to ray tracheids, intertracheid pitting, spiral thickenings and width). Differentiation of hardwoods is based on the features of vessels elements (size and shape, type of perforations, presence of spiral or reticulate thickenings, type of intervessel pitting, size, shape and arrangement of pits to ray parenchyma and presence of pits to vascular or
vasicentric tracheids). Information on non-wood components can be obtained from the presence of parenchyma cells, epidermal cells, vessel elements and rings from annular vessels, from the general shape of fibers including width and length and by the shape of fiber ends.
In a recent work [1], the origin of virgin and recycled fibers was identified employing standard fiber analysis techniques in fifteen packaging grade papers representative of the Spanish market (Figure 3). The waste-based papers (Waste based-liners and Fluting), Kraft-liners and Test-liner were highly variable containing 9-18 different wood and nonwood components. Semi-chemical, with 5-13 components, was the less variable grade.
Figure 3. Examples of softwood (A, Pinussylvestris) and hardwood (B, Betula)
identification in packaging grade papers taken from [1]. Scale bars 50 m for A and 25
m for B.
Fibers of Pinus sylvestris, Pinus pinaster,Pinus radiata and of genera Larix or Picea were found in abundance in almost all packaging grade papers. Pinus nigra as well as southern pines were present in small amounts in some papers. Genera with minor importance were Abies and Pseudotsuga. All papers contained Betula, Eucalyptus and Populus in their hardwood mix. Fagus sylvatica and Tilia were also frequently observed in the papers. The rare presence of Alnus, Castanea sativa, Quercus,Liquidambar styraciflua, Lyriodendrontulipifera, Nyssa sylvatica, Magnolia acuminataand Magnolia grandiflora was attributed to the recycling process. Nonwood fibers, mainly grasses, were found in all packaging grades (less frequently than softwoods and hardwoods) as a
A
B
4
“Sustainable Management and Development of Mountainous and Island Areas”

result of the recycling process. In most of the papers more than one grass was present but identification of individual species was not possible. In all papers a very small number of bast and leaf fibers was found. Finally, in some papers cotton linters were located but in insignificant numbers.
Similar results were taken by others [3] who examined a larger set of papers (fifty seven of which thirty nine linerboards and eighteen corrugating medium) available in Spain. Packaging grade papers were found to be highly variable containing a large number of different types of softwood, hardwood and non-wood fibers. Besides these two studies in Spain, no other published data on the variety of fiber types used in the production of packaging grade papers could be located.
4.1.2. On the basis of stain reactions of fibers
Qualitative determination of the fiber components of paper as regards the method of processing (pulping methods) is carried out under the microscope on the basis of color reactions of fibers stained by various stains [19]. There several staining tests [5, 21-24, 35], which are used to distinguish the various pulping processes of fibers by color change:
Alexander’s DuPont (General, V-stain, W-stain, Y-Iodine stain, X-stain) Graff “C” Green-Yorston Herzberg Kantrowitz-Simmons Lofton-Merritt NCR Selleger’s Wilson’s
The Graff “C” staining test is suggested for general analysis while the other stains are used for specific purposes or to confirm results obtained with the “C” stain [34]. Fresh stains can be prepared according to the above standards or purchased ready by the market. Before using, stains should be checked with a reference sample of pulp with known composition. Microscope slides are then prepared as for usual fiber analysis and fibers are stained usually by adding 2 or 3 drops of the stain on the slide (except for
some stains that a different procedure is recommended). The stained microslides are systematically examined under a light microscope. The identification of pulping processes of fibers is based on the colors developed by the stain, which are accessible in the relevant ISO, ASTM and TAPPI standards. Table 1 shows an example of such a color chart for Herzberg stain. The fibers should be also classed into softwood, hardwood and nonwood fibers categories according to their morphology.
Table 1.Color chart for Herzberg stain. Taken from ISO 9184-3 [22].
Type of pulp Color Chemical pulp Blue, bluish-violet Mechanical pulp Yellow Rag pulp Wine-red Semi-chemical and chemi-mechanical pulp
Dull blue, dull yellow, mottled blue and yellow
Regenerated cellulose fibers
Dark-bluish violet
Cellulose acetate fibers Yellow Synthetic fibers Colorless to brownish-
yellow
It should be noted that distinguishing the pulping processes is a difficult task due to the many shades obtained by the stains on all kinds of softwood, hardwood and nonwood fibers. That could easily lead to erroneous conclusions. It is not unusual slight alterations in the colors given in the standards, phenomenon that can be attributed not only to the inhomogeneity of the processes but also to the chemical additives in the papers. Therefore, for a more accurate interpretation of colors, previous experience acquired by testing of a wide variety of pulp types as well as knowledge of fiber morphology should be applied.
The capabilities of staining as a method of sorting recycled materials have not been explored sufficiently. It is worthwhile to mention that only one publication referring to this type of analysis was located in literature. In this study [4] a qualitative analysis of the fiber components of fifteen representative papers that are used for the production of corrugated board in Spain was carried out by the Graff “C” staining test. Due to the use of recycled pulp raw materials, all papers incorporated in their furnish fibers that have been produced with a variety of pulping processes: chemical, mechanical and semi-chemical. As a
5
“Sustainable Management and Development of Mountainous and Island Areas”

result of this variability, packaging grade papers were found to contain 6-15 different fiber components. The recycled based papers (Recycled-liner and Recycled-medium) were proved to be the most variable comprising 12-15 different fiber components while in some of the Semi-chemicals only up to 7 components were identified.
4.2. Quantitative analysis
The quantitative analysis of a wood pulp consists of assigning weight percentages to different types of fibers. Weight percentages of pulp constituents are calculated after conversion of microscopical data (fiber counts taken on microslides) through the use of weight factors according to standard procedures [5, 20, 35].
The weight factor of a fiber is a dimensionless number derived by the ratio of its fiber coarseness (average weight per unit length) to that of a reference fiber, typically rag having a fiber coarseness of 0.180 mg/m [10]. The calculation of weight factors for each fiber type in a given pulp can be extremely difficult [25], even for the simplest mixes, as it is essentially impossible to unequivocally identify every fibre on the slide. Consequently, in practical quantification analysis predetermined values are almost always used [32]. There is already a fair amount of published data for pulps factored with standard rag fiber, which are used in routine quantitative fiber analysis of wood pulps. Literature values of weight factors calculated for most of the common pulpwoods can be found in [2]. On the occasion that a weight factor of a particular species or genus is not available, the fiber width can be used as a guide in adopting the correct weight factor [10]. In the case of hardwoods, an average weight factor should be assigned for representing the combination of all hardwood species present in the pulp mix. This can be done by a visual estimation of the amounts of different hardwood species or genera based on the identification of vessel elements [32].
Recently, the percentages by weight of the fiber components in selected papers that are commonly used for corrugating packaging in Spain were determined by means of standard quantitative fiber analysis techniques [2-3] as well as by the Graff “C” staining test [4]. Tables 2-3 summarize the results of those studies.
Table 2. Weight percentages (minimum and maximum values) of fiber components in
linerboards. Taken from [2-4].
Weight (%) Linerboards Fiber category Kraft-
liner Test-liner Recycled-liner
Softwoods Hard or Soft pines Plantation pines N.A. southern pines Pinus nigraAbiesLarix or PiceaDouglas-fir
34….69
4….10
30….44
4….74….10 2….42….4< 2
39….44
20
17
2< 2 -2
< 2
25….37
8….11
3….9
< 2….3 < 2….4 0….2
4….11 < 2
Hardwoods 29….58 51….58 58….66 Non-woodfibers 2….8 2….5 2….9
Table 3. Weight percentages (minimum and maximum values) of fiber components in
corrugating medium. Taken from [2-4].
Weight (%) Corrugating medium Fiber category
Semi-chemical Recycled-medium
Softwoods Hard or Soft pines Plantation pines N.A. southern pines Pinus nigraAbiesLarix or PiceaDouglas-fir
6….35
< 2….5
2….12
-< 2….16
-3….8
-
25….40
12….25
5….6
< 2 < 2….6 0….3 7….9 < 2
Hardwoods 56….94 53….70 Non-woodfibers <2….9 4….7
Adamopoulos and Oliver [3] examined fifty seven linerboards and corrugating medium and found that in almost all papers hardwoods was the main fiber component (up to 94% per weight in the Semi-chemicals). Non-wood fibers entering the manufacturing process through recycling comprised a significant fiber component in most of the grades and their weight percentage varied between 2-9%. The results on the quantitative fiber composition reflected the differences in quality between the paper grades. For example, the Recycled-liners contained
6
“Sustainable Management and Development of Mountainous and Island Areas”

generally lower softwood content (25-37%) than the stiffer Kraft-liners and Test-liners represent better qualities of linerboard. Also, in the corrugating medium grades the Recycled-medium were more variable than the Semi-chemicals due to the use of higher proportions of recycled fibers in their production.
The above are in general consistent with the results taken by Adamopoulos [2] in a smaller set of papers (7 linerboards and 8 corrugating medium). This is a more comprehensive study where softwood fibers are further classed although quantification of softwood species, genera or groups of genera is not usually attempted [32]. Hardwoods were also identified as the major fiber component in all papers, except kraft-liners, varying from 51% to 92% per weight. Kraft-liners had greater softwood content (49-69%) than hardwood, and the most plentiful softwood classes were Hard or Soft pines and Plantation pines. Pinus nigra was a major component only in some papers, while Larix or Picea fibers were found in small amounts (2-11%) in all papers. Softwood classes with minor importance were North American southern pines and Abies. Douglas-fir was a contaminating fiber component (weight percentage less than 2%) almost in every paper.
Finally, Adamopoulos and Oliver [4] using the Graff “C” staining test found that the most important fiber component from a quantitative standpoint was hardwood unbleached kraft followed by softwood unbleached kraft almost in all packaging grade papers examined. Besides hardwood unbleached semi-chemical pulp and mechanical softwood pulp that were also plentiful in the papers, there was a smaller number of other components which sum, however, accounted for a significant fraction in the total furnish weight. Results from the Graff “C” staining test referred not only to the pulping method of fibers but also to the total softwood, hardwood and nonwood fibers content confirming the findings taken by others [2-3] for the same grades.
5. Conclusions
Packaging paper manufacturing integrates a continuously increasing variety of raw materials, a phenomenon which besides the recycling process is due to globalization and international trade of pulp, paper and wood. A first step towards a more economical and effective utilization of paper and paper products in
packaging should be the reliable characterization of raw pulp materials. Qualitative and quantitative data on the different fiber types as well as diagnostics assessing the potential quality distribution of fibers from different sources are highly needed for:
the evaluation of packaging fiber supply sources to select the appropriate raw material for each end-use
Comprehensive characterization (qualitative and quantitative classification as to source) of the pulp produced by the waste paper is not a common practice and its potential on paper products quality control has not been fully explored yet. However, recent studies have shown that fiber composition tests are adequate to analyze both the structure and quality of packaging grade papers. In this line, fiber analysis techniques might be very helpful in practical industrial testing:
as a complementary test (besides the physical-mechanical characterization of paper and corrugated board) to evaluate the packaging behavior in dependence to the grade papers composition for a continual control of packaging fiber sources to utilize the available resources in an optimal manner by predicting the most efficient blend of fibers in order to achieve a desired end product as an important step in achieving reliable automated rating systems for recycled fiber streams, with tailored processing for each stream
Nevertheless, the combined qualitative and quantitative fiber analysis provides fundamental knowledge of the recycled raw materials, which is essential for a sustainable packaging industry.
6. References
[1] Adamopoulos, S. 2006a. Identification of fiber components in packaging grade papers. IAWA J. 27 (2): 153-172.
[2] Adamopoulos, S. 2006b. Quantification of softwood, hardwood and nonwood fibres in packaging grade papers. TAPPI J. 5(3): 27-32.
7
“Sustainable Management and Development of Mountainous and Island Areas”

[3] Adamopoulos, S. and J-V. Oliver. 2006a. Qualitative and quantitative fiber analysis in recycled raw materials for packaging. Forest Products Journal 56(2): 58-60.
[4] Adamopoulos, S. and J-V. Oliver. 2006b. Fiber composition of packaging grade papers as determined by the Graff “C” staining test. Wood and Fiber Science (in press).
[5] ASTM 1990. ASTM D 1030: Fiber analysis of paper and paperboard. The ASTM Book of Standards, Philadelphia, PA.
[6] Britt, K.W. 1971. Handbook of pulp and paper technology. Van Nostrand Reinhold, New York.
[7] Carpenter, C.H. and L. Leney. 1952. 91 papermaking fibres. SUNY College of Forestry, Syracuse, NY.
[8] CEPI. 2003. CEPI Annual Report. Confederation of European Paper Industries, Brussels, Belgium.
[9] Côté, W.A. 1980. Papermaking fibres. A photomicrographic atlas. Syracuse University Press, Syracuse, New York.
[10] Clark, J.d’A. 1951. Notes on weight factors for fiber microscopy. TAPPI J. 34(7): 317-318.
[11] Drost, C., Ni, Y. and D. Shewchuk. 2004. Effect of increased jack pine content on kraft pulp properties. TAPPI J. 3(1): 23-25.
[12] European Commission. 1994. European Parliament and Council Directive 94/62/EC of 20 December 1994 on packaging and packaging waste. Official Journal, L365, 31 December 1994. pp. 10-23.
[13] FAO. 2001. Global forest resources assessment 2000 main report. FAO Forestry Paper 140. Rome.
[14] FEFCO. 2002. European Federation of Corrugated Board Manufacturers: Annual Statistics 2002. Brussels, Belgium.
[15] García, J.A. 1988. Constituentes fibrosos de pastas y papeles. Universitat Politécnica de Cataluna, Terrassa, España.
[16] Hunt, J.F. 1998. Know your fibers: process and properties. Proc. of IMPEPA “New Developments in Molded Pulp Process & Packaging II”, June 15. Chicago, Illinois, USA.
[17] Ilvessalo-Pfäffli, M-S. 1995. Fiber atlas: Identification of papermaking fibres. Springer-Verlag, Berlin.
[18] Ince, P.J. 2004. Fiber resources. In: Encyclopedia of forest sciences. Vol. 2. Eds.
Burley, J., Evans, J., Youngquist J.A. Elsevier Academic Press. pp. 877-883.
[19] Isenberg, I.H. 1958. Pulp and paper microscopy. Third edition, Institute of Paper Chemistry, Appleton, Wisconsin.
[20] ISO. 1990. ISO Standard 9184-1. Paper, board and pulps. Fibre furnish analysis. Part 1: General method.
[21] ISO. 1990. ISO Standard 9184-2. Paper, board and pulps. Fibre furnish analysis. Part 2: Staining guide.
[22] ISO. 1990. ISO Standard 9184-3. Paper, board and pulps. Fibre furnish analysis. Part 3: Herzberg staining test.
[23] ISO. 1990. ISO Standard 9184-4. Paper, board and pulps. Fibre furnish analysis. Part 4: Graff “C” staining test.
[24] ISO. 1990. ISO Standard 9184-5. Paper, board and pulps. Fibre furnish analysis. Part 5: Lofton-Merritt staining test.
[25] ISO. 1990. ISO Standard 9184-7. Paper, board and pulps. Fibre furnish analysis. Part 7: Determination of weight factor.
[26] Jorling, T. 2000. The Forest Products Industry: A Sustainable Enterprise. TAPPI J. 83(12): 32-35.
[27] Law, K.N., Valade, J.L. and J. Quan. 1996. Effects of recycling on papermaking properties of mechanical and high yield pulps. Part I: Hardwood pulps. TAPPI J. 79(3): 167-174.
[28] Mabee, W. 1998. The importance of recovered fibers in global fiber supply. Unasylva 49(193): 31-36.
[29] Maltenfort, G.G. 1996. Corrugated Shipping Containers. An Engineering approach. Jelmar Publishing Co., Inc., Plainview, New York.
[30] Mohlin, U.B. 1989. Fiber bonding ability – a key pulp quality parameter for mechanical pulps to be used in printing papers. In: Proceedings of International Mechanical Pulping Conference. Hellsinki, Finland. pp. 49-57.
[31] Panshin, A.J. and C. de Zeeuw. 1980. Textbook of wood technology. 4th Ed. McGraw-Hill, New York, NY.
[32] Parham, R.A and R.L. Gray. 1990. The practical identification of wood pulp fibres. Ed.2. Tappi Press, Atlanta, GA.
[33] Skog, K.E., Ince, P.J. and R.W. Haynes. 1998. Wood fiber supply and demand in the United States. In: Proceedings of Forest Products Society Annual Meeting. Merida, Yucatan, Mexico.
8
“Sustainable Management and Development of Mountainous and Island Areas”

[34] Strelis, I. and R.W. Kennedy. 1967. Identification of North American commercial pulpwoods and pulp fibers. University of Toronto Press, Toronto, Canada.
[35] TAPPI. 2003. TAPPI T 401 om-88: Fiber analysis of paper and paperboard. TAPPI PRESS, Atlanta, GA.
[36] Young, R.A. 1997. Processing of agro-based resources into pulp and paper. In: Paper and composites from agro-based resources. Eds. Rowell, R.M, Young, R.A., Rowell, J.K. CRC Lewis Publishers, Boca Raton, FL. pp. 137-245.
9

Evaluation of the pollution level of the Ardas-Evros river ecosystem.
Alexopoulos Athanasios Democritus University of Thrace, Faculty of Agricultural Development,
Pandazidou 193, Orestiada, 28200, Greece [email protected]
Voidarou Chrysa Democritus University of Thrace, Faculty of Agricultural Development,
Pandazidou 193, Orestiada, 28200, Greece [email protected]
Tsiotsias Arsenis Democritus University of Thrace, Faculty of Agricultural Development,
Pandazidou 193, Orestiada, 28200, Greece
Stefanis Christos Democritus University of Thrace, Faculty of Agricultural Development,
Pandazidou 193, Orestiada, 28200, Greece [email protected]
Papadopoulos Ioannis Democritus University of Thrace, Faculty of Agricultural Development,
Pandazidou 193, Orestiada, 28200, Greece [email protected]
Vavias Stavros Democritus University of Thrace, Faculty of Agricultural Development,
Pandazidou 193, Orestiada, 28200, Greece [email protected]
Charvalos Ekaterina Technological Educational Institute of Athens,
Ag.Spyridona 17, 12210 Athens Greece
Kalkani Eleni Technological Educational Institute of Athens,
Ag.Spyridona 17, 12210 Athens Greece
and Bezirtzoglou Eugenia Democritus University of Thrace, Faculty of Agricultural Development,
Pandazidou 193, Orestiada, 28200, Greece [email protected]
Abstract. Knowledge of both microbial diversity and chemical parameters in environmental watery ecosystems is important in understanding the potential role that
microorganisms may play in the biosphere and in the trophic state of the ecosystem. Over a period of one year, in the frame of a project (PYTHAGORAS II) concerning the
10
“Sustainable Management and Development of Mountainous and Island Areas”
evaluation of the pollution level of Evros river, water analysis for bacteriological monitoring was carried out on nine different sampling stations of the Evros river. Chemical parameters as temperature (air and water), pH, conductivity and heavy metals concentrations (Fe, Zn and Cu) were measured in all sites. Standard methods were applied for the detection and enumeration of indicator bacteria in our watery ecosystem. Total coliform (TC), E. coli, Staphylococcus, Streptococcus and C. perfringens were found in all water samples from the 9 stations of the Ardas-Evros ecosystem. Our ecosystem consists of two units. The first section of the ecosystem called Ardas river, is entering Greece from Bulgaria and after a short stay in this North part of Greece, it is oriented to Turkey (Edirne area) where it receives inputs of water from other ecosystems. Then, the second unit of our ecosystem called Evros river approaches again Greece and makes the physical border between the 2 countries. The Ardas river ecosystem coming from Bulgaria keeps low levels of all above bacteria. The new originated river ecosystem called Evros after its stay in Turkey seems to collect important bacteriological load as higher numbers of E. coli (5·103 cfu/100 ml), Staphylococcus (7.5·103 cfu/100 ml ), Streptococcus (4·103 cfu/100 ml) and total coliforms (5·103 cfu/100 ml) are present at the first Greek station. These numbers showed a decreasing profile following the flow of the Evros river to the sea.Considering the chemical parameters, Zn levels were shown always negative and Cu levels were found positive only twice and in very low concentrations. Iron levels varies from 6 to 14.5
g/l following the studied station. The Ardas ecosystem seems to substain more higher levels of Fe (12-14.5 g/l) than the Evros ecosystem (6-9.5 g/l) and this is in accordance with the conductivity levels which are shown relatively higher in the Ardas ecosystem. It seems to be an association between the presence of iron and the oligotrophic ecosystem of Ardas river, which could be explained by the formation of siderophores in limiting oligotrophic environments. It is conceivable that systematic bacteriological and chemical indices must be monitored in order to evaluate the ecosystem and to protect public health.
Keywords. River pollution, Water quality, Microbiological contamination.
1. Introduction
The aquatic environments contain autochthonous microbial populations. These bacterial populations are able to grow at low nutrient concentrations. Rivers are belonging to the fresh water body of the hydrosphere and are characterized by flowing waters. However, many allochthonous terrestrial bacteria are carried by the riverside, from the adjacent plants or from sewage into the water body [2]. The main object of the present investigation was to study the behavior and the survival of the different bacteria emerging from the Ardas- Evros river ecosystem in Greece, with the goal of understanding the roles of these aquatic microorganisms. Although, measurement of the above parameters have their own virtue as they are strictly correlated with the pollution level of the watery ecosystem. Physicochemical analysis and detection of heavy metal concentrations (Fe, Zn, Cu) were considered in order to have a gloomy picture of the river ecosystem.
2. Materials and Methods
2.1. Geographical area
Nine stations of the Ardas-Evros ecosystem situated in the North-East part of Greece were entering our study. Our ecosystem consists of two units. The first section of the ecosystem called Ardas river, is entering Greece from Bulgaria and after a short stay in this North part of Greece, it is oriented to Turkey (Edirne area) where it receives inputs of water from other ecosystems. Then, the second unit of our ecosystem called Evros river approaches again Greece and makes the physical border between the 2 countries.
2.2. Sampling stations
Nine different water locations were entered in the present study. One litre of chilling water was collected in a sterilized bottle from each location. The water samples were placed in portable refrigerators and transported in the Microbiology Laboratory on ice within two hours of collection. A total of
11
“Sustainable Management and Development of Mountainous and Island Areas”
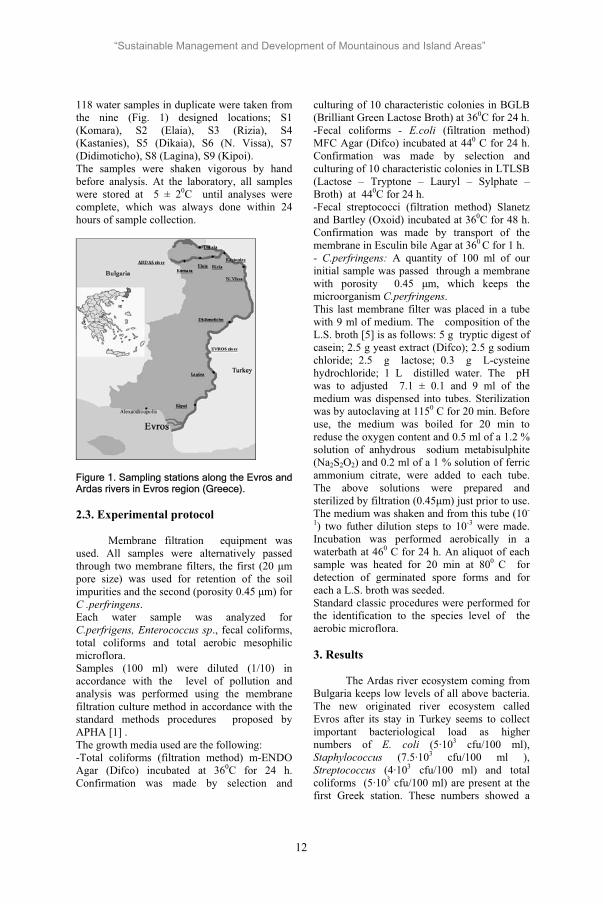
118 water samples in duplicate were taken from the nine (Fig. 1) designed locations; S1 (Komara), S2 (Elaia), S3 (Rizia), S4 (Kastanies), S5 (Dikaia), S6 (N. Vissa), S7 (Didimoticho), S8 (Lagina), S9 (Kipoi). The samples were shaken vigorous by hand before analysis. At the laboratory, all samples were stored at 5 ± 20C until analyses were complete, which was always done within 24 hours of sample collection.
Figure 1. Sampling stations along the Evros and Ardas rivers in Evros region (Greece).
2.3. Experimental protocol
Membrane filtration equipment was used. All samples were alternatively passed through two membrane filters, the first (20 mpore size) was used for retention of the soil impurities and the second (porosity 0.45 m) for C .perfringens.Each water sample was analyzed for C.perfrigens, Enterococcus sp., fecal coliforms, total coliforms and total aerobic mesophilic microflora. Samples (100 ml) were diluted (1/10) in accordance with the level of pollution and analysis was performed using the membrane filtration culture method in accordance with the standard methods procedures proposed by APHA [1] . The growth media used are the following: -Total coliforms (filtration method) m-ENDO Agar (Difco) incubated at 360C for 24 h. Confirmation was made by selection and
culturing of 10 characteristic colonies in BGLB (Brilliant Green Lactose Broth) at 360C for 24 h. -Fecal coliforms - E.coli (filtration method) MFC Agar (Difco) incubated at 440 C for 24 h. Confirmation was made by selection and culturing of 10 characteristic colonies in LTLSB (Lactose – Tryptone – Lauryl – Sylphate – Broth) at 440C for 24 h. -Fecal streptococci (filtration method) Slanetz and Bartley (Oxoid) incubated at 360C for 48 h. Confirmation was made by transport of the membrane in Esculin bile Agar at 360 C for 1 h. - C.perfringens: A quantity of 100 ml of our initial sample was passed through a membrane with porosity 0.45 m, which keeps the microorganism C.perfringens.This last membrane filter was placed in a tube with 9 ml of medium. The composition of the L.S. broth [5] is as follows: 5 g tryptic digest of casein; 2.5 g yeast extract (Difco); 2.5 g sodium chloride; 2.5 g lactose; 0.3 g L-cysteine hydrochloride; 1 L distilled water. The pH was to adjusted 7.1 ± 0.1 and 9 ml of the medium was dispensed into tubes. Sterilization was by autoclaving at 1150 C for 20 min. Before use, the medium was boiled for 20 min to reduse the oxygen content and 0.5 ml of a 1.2 % solution of anhydrous sodium metabisulphite (Na2S2O2) and 0.2 ml of a 1 % solution of ferric ammonium citrate, were added to each tube. The above solutions were prepared and sterilized by filtration (0.45 m) just prior to use. The medium was shaken and from this tube (10-
1) two futher dilution steps to 10-3 were made. Incubation was performed aerobically in a waterbath at 460 C for 24 h. An aliquot of each sample was heated for 20 min at 800 C for detection of germinated spore forms and for each a L.S. broth was seeded. Standard classic procedures were performed for the identification to the species level of the aerobic microflora.
3. Results
The Ardas river ecosystem coming from Bulgaria keeps low levels of all above bacteria. The new originated river ecosystem called Evros after its stay in Turkey seems to collect important bacteriological load as higher numbers of E. coli (5·103 cfu/100 ml), Staphylococcus (7.5·103 cfu/100 ml ), Streptococcus (4·103 cfu/100 ml) and total coliforms (5·103 cfu/100 ml) are present at the first Greek station. These numbers showed a
12
“Sustainable Management and Development of Mountainous and Island Areas”

decreasing profile following the flow of the Evros river to the sea (Table 1).
KomaraElaia
Riziakastanies
DikaiaN. Vissa
DidimotichoLagina
Kipoi
Sampling location
1000
2000
3000
4000
5000
Tota
l col
iform
s cf
u/10
0ml
KomaraElaia
Riziakastanies
DikaiaN. Vissa
DidimotichoLagina
Kipoi
Sampling location
0
200
400
600
800
1000
E.co
li cf
u/10
0ml
KomaraElaia
Riziakastanies
DikaiaN. Vissa
DidimotichoLagina
Kipoi
Sampling location
0
1000
2000
3000
Stap
hylo
cocc
i sp.
cfu
/100
ml
KomaraElaia
Riziakastanies
DikaiaN. Vissa
DidimotichoLagina
Kipoi
Sampling location
0
500
1000
1500
2000
2500
Stre
ptoc
occi
sp.
cfu
/100
ml
Figure 2: Mean plots of bacteria indices for all sampling stations.
Considering the chemical parameters, Zn levels were shown always negative and Cu levels were found positive only twice and in very low concentrations. Iron levels varies from 6 to 14.5
g/l following the studied station. The Ardas ecosystem seems to substain more higher levels of Fe (12-14.5 g/l) than the Evros ecosystem (6-9.5 g/l) and this is in accordance with the conductivity levels which are shown relatively higher in the Ardas ecosystem.
4. Discussion
Aquatic bacteria are characterized by relatively low and uniform standing stock abundances and by small mean cell size [6], as bacterivorous protozoa and micro flagellate cohabiting as well in waters, and consuming the large bacterial cells. E. coli has been designed as the classical indicator microorganism to detect faecal origin pollution in watery ecosystems.
13
“Sustainable Management and Development of Mountainous and Island Areas”

Faecal pollution constitutes a danger for health from intestinal infections caused by excreted pathogenic bacteria. Albeit the fact that E. coli is used as the classic faecal indicator ,other bacterial indicators as
faecal coliforms and faecal streptococci are accepted also as indicators of faecal pollution in aquatic ecosystems. Total coliform, E. coli, Staphylococcus and Streptococcus were present in all nine stations
KomaraElaia
Riziakastanies
DikaiaN. Vissa
DidimotichoLagina
Kipoi
Sampling location
0
2000
4000
6000
8000
10000
12000
Tota
l col
iform
s cf
u/10
0 m
l
KomaraElaia
Riziakastanies
DikaiaN. Vissa
DidimotichoLagina
Kipoi
Sampling location
0
1000
2000
3000
4000
E.co
li c
fu/1
00m
l
KomaraElaia
Riziakastanies
DikaiaN. Vissa
DidimotichoLagina
Kipoi
Sampling location
0
2000
4000
6000
8000
10000
12000
Stap
hylo
cocc
i sp.
cfu
/100
ml
KomaraElaia
Riziakastanies
DikaiaN. Vissa
DidimotichoLagina
Kipoi
Sampling location
0
2000
4000
6000
8000
Stre
ptoc
occi
sp.
cfu
/100
ml
Figure 3: Box plots of bacteria indices for all sampling stations ( , * represents outliers and extreme values).
Table 1: Descriptive statistics of the microbiological results. Total coliform
cfu/100 ml E.coli
cfu/100 ml Staphylococcus sp.
cfu/100 ml Streptococcus sp
cfu /100 ml C. perfringens MPN/100 ml
N 117 117 117 117 117 Mean 2349,44 408,56 1147,83 876,96 1,51 Median 1800,00 110,00 350,00 300,00 0,00 Minimum 6 1 12 5 0 Maximum 12000 4000 11400 7500 55
14
“Sustainable Management and Development of Mountainous and Island Areas”
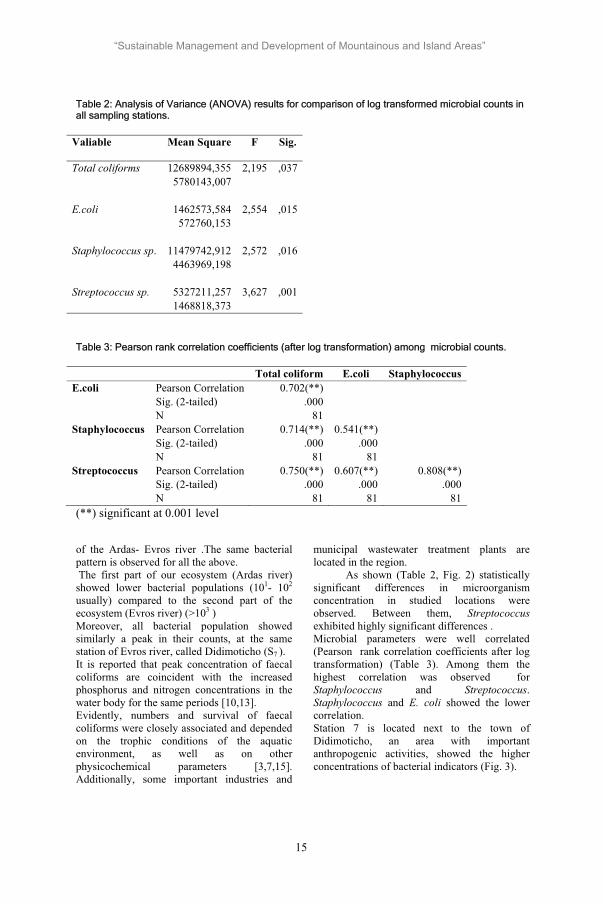
Table 2: Analysis of Variance (ANOVA) results for comparison of log transformed microbial counts in all sampling stations.
Valiable Mean Square F Sig.
Total coliforms 12689894,355 2,195 ,037 5780143,007 E.coli 1462573,584 2,554 ,015 572760,153 Staphylococcus sp. 11479742,912 2,572 ,016 4463969,198 Streptococcus sp. 5327211,257 3,627 ,001 1468818,373
Table 3: Pearson rank correlation coefficients (after log transformation) among microbial counts.
Total coliform E.coli StaphylococcusE.coli Pearson Correlation 0.702(**)
Sig. (2-tailed) .000 N 81
Staphylococcus Pearson Correlation 0.714(**) 0.541(**)Sig. (2-tailed) .000 .000N 81 81
Streptococcus Pearson Correlation 0.750(**) 0.607(**) 0.808(**) Sig. (2-tailed) .000 .000 .000 N 81 81 81(**) significant at 0.001 level
of the Ardas- Evros river .The same bacterial pattern is observed for all the above. The first part of our ecosystem (Ardas river) showed lower bacterial populations (101- 102
usually) compared to the second part of the ecosystem (Evros river) (>103 ) Moreover, all bacterial population showed similarly a peak in their counts, at the same station of Evros river, called Didimoticho (S7 ).It is reported that peak concentration of faecal coliforms are coincident with the increased phosphorus and nitrogen concentrations in the water body for the same periods [10,13]. Evidently, numbers and survival of faecal coliforms were closely associated and depended on the trophic conditions of the aquatic environment, as well as on other physicochemical parameters [3,7,15]. Additionally, some important industries and
municipal wastewater treatment plants are located in the region.
As shown (Table 2, Fig. 2) statistically significant differences in microorganism concentration in studied locations were observed. Between them, Streptococcus exhibited highly significant differences . Microbial parameters were well correlated (Pearson rank correlation coefficients after log transformation) (Table 3). Among them the highest correlation was observed for Staphylococcus and Streptococcus.Staphylococcus and E. coli showed the lower correlation. Station 7 is located next to the town of Didimoticho, an area with important anthropogenic activities, showed the higher concentrations of bacterial indicators (Fig. 3).
15
“Sustainable Management and Development of Mountainous and Island Areas”
Moreover, the presence of important levels of human origin Staphylococcus, contribute to this argument.This same station is characterized by shallow depth and because of this fact, bacterial populations were more concentrated. Organic pollution of this river is mainly associated with pesticides, herbicides and fertilizers used in this agricultural area [8]. Fluctuations of the bacterial population seems to be associated to the level of the organic population, to the water nutrient content and to the proximity with human activities. The extended length of rivers, the heterogeneity of sampling stations (e.g. source, downstream), the influence of stress and other environmental factors do not easily permit the survival of vegetative forms. Spore forms being more tolerant to these effects are found generally in rivers [4]. In this way, our interest was focused also in C.perfringens, which was found present in all locations with a peak concentration in station S7. C. perfrigens, is a spore-forming anaerobic bacterium accepted as a reliable indicator of fecal pollution in stressed heterogeneous ecosystems [14]. C. perfringens is also used to detect fecal pollution of remote origin [4,12]. Chemical parameters indicative of fecal and organic pollution were determined. The Ardas ecosystem seems to substain more higher levels of Fe (12-14,5 g/l) than the Evros ecosystem (6-9, 5 g/l) and this agree with the conductivity levels shown higher in the Ardas river. It seems then to be an association with the presence of iron and the oligotrophic ecosystem of Ardas river, which could be explained by the formation of siderophores in limiting oligotrophic environments.
As water supply and sanitation procedures are directly associated with ingestion of pathogenic microorganisms, so systematic monitoring of environmental waters is necessary in order to limit spreading of pathogens, drug resistant-associated bacteria or important bacterial load which could be an hazard for public health.
5. Acknowledgments
This study was financed by the General Secretariat for Research and Technology under the frame of PYTHAGORAS II project.
6. References
[1] APHA, AWWA, WFA. Standard Methods for the Examination of Water and Wastewater. 20th Ed. Washington. 1998.
[2] Bezirtzoglou E, Dimitriou D, Panagiou A. Occurrence of Clostridium perfringens in river water by using a new procedure. Anaerobe. 1996; 2:169-173.
[3] Bezirtzoglou E, Dimitriou D, Panagiou A, Karalou I, Demoliates Y. distribution of C. perfringens in different aquatic environments in Greece. Microbial Res. 1994; 149:129-134.
[4] Bezirtzoglou E, Panagiou A, Savvaidis I, Maipa V. distribution of C. perfringens in polluted lake environments. Anaerobe. 1997; 3:169-172.
[5] Bezirtzoglou E., Romond C. : Rapid identification and enumeration of C.perfringens in the human faecal flora. MEHD. 1990; 3:159-163.
[6] Gonzalez JM, Sherr EB, Sher BF. Size-selective grading on bacteria by natural assemblages of estuarine flagellates and ciliates. Appl. Environ, Microbiol.1990; 56(3): 583-589.
[7] Hirn J, Viljamaa H, Raevuori M. The effect of physicochemical phytoplacton and seasonal factors on faecal indication bacteria in northern brackish water. Water Res.1996, 285(3):25-29
[8] Kagalou I, Tsimarakis, Bezirtzoglou E. Inter-relationships between bacteriological and chemical variations in Lake Pamvotis-Greece. Micro. Ecol. Health Dis. 2002: 14:37-41.
[9] Lee S, Fuhruman JA, DNA hybridization to compare species, compositions of natural phytoplacton assemblages. Appl. Environ Microbiol.1990; 56(3):739-746.
[10] Morozzi G, Cenci G, Scarabattoli P. Bacteriological and chemical variations and their inter-relationships in a slightly polluted water-body. Intern. J. Environ. Studies. 1984; 23: 121-129.
[11] Oragui J.L, Mara DD. Investigation of the survival characteristics of Rhodococcus coprophilus and certain faecal indicators bacteria. Appl. Environ, Microbiol.1983; 46(2):356-360.
[12] Pinfold JV. Faecal contamination of water and fingertip-rinses as a method for evaluating the effect of low cost water supply and sanitation activities on faecal-
16
“Sustainable Management and Development of Mountainous and Island Areas”

oral disease transmission - . A hygiene intervention study in rural north-east Thailand. Epidemiol. Infect. 1990; 105: 363-389.
[13] Romero JR, Imberger J. Lake Pamvotis Project, Final Report. Western Australia: CWR, 1999.
[14] Savvaidis I, Kegos Th, Papagianis C, Voidarou C, Evagelou A, Bezirtzoglou E. Bacterial indicators and metal ions in high mountains lake environments. Microb. Ecol. Health Dis. 2001; 13:147-152.
[15] Sorensen DL, Eberl SG, Dicksa RA. C. perfringens as a point source polluted streams. Water Res. 1989; 23(2):191-197.
17
“Sustainable Management and Development of Mountainous and Island Areas”

Quality Assessment of Harvested Rainwater in a Greek Island.
Alexopoulos Athanasios Laboratory of Food Microbiology, Biotechnology and Hygiene. Faculty of Agricultural
Development. Democritus University of Thrace. Pantazidou 193 Orestiada, Greece, 68200 [email protected]
Bezirtzoglou Eugenia Laboratory of Food Microbiology, Biotechnology and Hygiene. Faculty of Agricultural
Development. Democritus University of Thrace.Pantazidou 193 Orestiada, Greece, 68200 [email protected]
Sazakli Eleni Laboratory of Public Health, Medical School, University of Patras.
Patras University Campus 26500, Patras. Greece [email protected]
Tzavellas Nektarios Laboratory of Public Health, Medical School, University of Patras.
Patras University Campus 26500, Patras. Greece [email protected]
and Leotsinidis Michalis Laboratory of Public Health, Medical School, University of Patras.
Patras University Campus 26500, Patras. Greece [email protected]
Abstract. The quality of rainwater being harvested and stored in large tanks for drinking purposes, due to lack of other drinking water sources, was assessed through a two-year monitoring study. Pathogens and/or chemicals from the atmosphere and the catchment areas can be transferred into the collected water and become risk factors for public health. For this study, 104 water samples were collected from 23 rainwater ferroconcrete tanks located in Northern Kefalonia Island (SW Greece). The tanks capacities vary from 500 to 800 cubic meters, while the water catchment areas range from 500 to 3000 square meters. During the year, about half of the tanks receive both rainwater and groundwater while only rainwater is stored into the rest of them. Analysis included assessment of various physicochemical parameters and the recovery of pathogens or potential pathogens and microbial indices.
All of the rainwater (and the majority of the mixed samples) were within the guidelines of chemical parameters established by the 98/93/EU directive. Concerning the
microbiological quality, a seasonal variation was observed. In winter and spring, small numbers of pathogens were detected. On the contrary, a significant increase to the bacterial population was observed during the hot summer months. E. coli and enterococcus sp. were detected in 65% and 60% of the summer samples. Potential pathogens, such as total coliforms and Pseudomonas aeruginosa, were found in 85% and 71% of the summer samples respectively. All analyses concerning Salmonella sp. were negative and C. perfringens vegetative/spore forms were detected in only two samples of mixed water.
Storage of rainwater can be a solution in areas with scarcity of other water recourses. Special attention should be paid to the harvesting and storage conditions, in order to safeguard water quality and to the disinfection practices as to avoid the formation of by-products.
Keywords. Harvested rainwater, Microbial contamination, Water tanks, Water analysis.
18
“Sustainable Management and Development of Mountainous and Island Areas”

1. Introduction
Rainwater harvesting has been a common practice in many nations all over the world for thousands of years often as an exclusive method for people living in arid environments to cover their drinking or domestic water needs [17,21,26,27]. The ongoing drought, the increasing demand of growing populations or urban development the last decades and in some cases the pollution of underground sources has led this practice to become an attractive and economic alternative to mains water, even, for the modern industrialized countries where the quantity of water is not an issue of concern [25]. Also, drew the attention of the scientific community on subjects like those of proper systems design, water quality and health related risks.
Although not extensively, the corresponding literature deals with the rainwater harvesting and use, but the conclusions so far appear contradictious. Earlier studies have reported that the water stored in rainwater tanks was of acceptable quality [6] and that domestic activities related to the preparation and consumption may have a more important health bearing [17], but in more recent ones, the presence of various pathogens has been identified [1,13,21] and considered as cause which lead to an increased risk of gastro-intestinal illness on consumption when compared with chlorinated and filtered water from the public network supplies [9]. What it is evident is that the quality of the water harvested and stored depends highly on the proximity to various pollution sources [19,24], the harvesting nature [4,27], the storage conditions [8], the topography [12] and also on the local weather patterns [7].
In Greece, most of the needs for potable water are covered by underground sources. In major urban and some of the industrial areas, surface water is also utilized. In the islands, due to the harsh topographic conditions and geological structure (mainly of limestone) sources of water are limited and the construction of treatment and conveyance systems is extremely difficult and cost unfeasible. Therefore, rainwater harvesting (practical only if there is sufficient volume and frequency of rainfall) for domestic and irrigation use, especially during the summer, serves as an alternative solution.
The aim of this study was to investigate the quality of rainwater harvested and stored for
long periods of time in order to identify any possible public health hazards arising from such a practice.
2. Materials and Methods
2.1. Study area
Our study focused on the Northern mountainous region of Kefalonia Island called Erisos (Fig.1) consisting of 27 small communities with a permanent population of 5000 inhabitants increasing to 15000 during the summer months.
Figure 1. Map of Kefalonia Island indicating the study area (Erisos region).
Rainwater is collected from concrete paved areas (called harvesting or catchment areas with a range of 500 to 3000 square meters) directly into 13 tanks and distributed for storage in 10 more tanks. The volumes of the water tanks range from 500 to 800 cubic meters and they are all made of reinforced concrete. According to the recent rainfall data, this area has a mean winter rainfall height of 105.4 mm per month and 16.5 mm in summer (or 95.5 rainy days per year), a quantity that is not sufficient and as a result additional water (of underground origin) is being brought there by ship tankers. Therefore, at any time it is possible that either mixed or pure rainwater is being stored and distributed. In this study, we focused on pure rainwater samples.
2.2. Sampling
Sampling was performed four times a year from 2003 until 2004. Samples from each tank were collected, by means of a hand pump,
19
“Sustainable Management and Development of Mountainous and Island Areas”
in glass sterilized bottles for microbiological analysis and in plastic bottles for chemical analysis. The bottles were placed in portable refrigerators, transferred to the laboratory and stored at 5 ± 2oC until analyses were completed which was always done within 24 hours from sample collection.
2.3. Chemical analysis
All chemical analyses were performed according to the Standard Methods for the Examination of Water and Wastewater [2] and included: nitrates, nitrites, ammonia, sulphates, phosphates, chlorides, fluoride, calcium, magnesium, sodium, potassium, hardness and alkalinity. Physicochemical parameters, such as pH, conductivity, temperature and dissolved oxygen were estimated on site. Atomic absorption spectrophotometer techniques were applied for the determination of heavy metals concentration (iron, manganese, copper, zinc, nickel, cadmium, lead and chromium).
2.4. Microbiological analysis
For the microbiological analyses membrane filtration techniques were used. Each water sample was examined for the presence of total coliforms, faecal coliforms (E. coli),Enterococcus sp., Pseudomonas aeruginosa,Clostridium perfringens and Salmonella sp. Total Viable Counts (TVC) incubated at 22 C and 37 C were also assessed. The culture media used were the following: Total coliforms (filtration method) in m-ENDO Agar (Oxoid) incubated at 360C for 24h. Confirmation was made by selection and culture of characteristic colonies in BGLB (Brilliant Green Lactose Broth) at 360C for 24 h. Fecal coliforms - E.coli (filtration method) in TBX chromogenic Agar (Oxoid) incubated at 440 C for 24 h. Confirmation was made by selection and culture of characteristic colonies in MacConkey Agar (Oxoid) at 440C for 24 h. Fecal streptococci (filtration method) in Slanetz and Bartley agar (Oxoid) incubated at 360C for 48 h. Confirmation was made by transport of the membrane in Esculin bile Agar at 440 C for 1 h. C. perfringens (filtration method) in m-CP Agar (Oxoid) supplemented accordingly and anaerobically incubated at 44 ± 1°C for 21 ± 3 hours. The plates were examined for presumptive positive opaque yellow colonies that turned pink or red after exposure to ammonium hydroxide
vapours for 20-30 seconds. P. aeruginosa(filtration method) in Pseudomonas agar base (Oxoid) supplemented accordingly (C-N supplement, Oxoid) incubated at 30 ± 1°C for 24h. Confirmation was made after examination of the colonies for the presence of blue-green or brown pigmentation and fluorescence. For TVCs 2ml (pour plate method) of water were incubated in Water Plate Count Agar (Oxoid) at 36°C ± 2°C for 44 ± 4 hours and a duplicate at 22°C ± 2°C for 68 ± 4 hours. After the incubation all colonies were enumerated and expressed as cfu/ml. For Salmonella sp. (filtration) Salmonella Chromogenic Agar Base (Oxoid) supplemented accordingly and incubated for 18-24 hours at 37° C. Confirmation was made after examination of the colonies for characteristic color (magenta or purple) and morphology.
3. Results
All chemical parameters and heavy metal concentrations tested on the rainwater samples were below the Maximum Allowable Concentrations (MACs) established by the 98/83/EU Directive [28] (Table 1 and 2). Microbial pathogens i.e. Salmonella sp. and C. perfringens or potentially pathogens, i.e. P.aeruginosa, were detected only in summer samples while other microbial indices were recovered in various numbers (Table 3) following a seasonal variation with the higher loads being recorded during the summer months. In 16 samples out of 104 (15.4%) there were zero values recorded concerning microbial indices (except TVCs). As shown (Table 3), total coliforms were present in densities of 0 to 590 cfu/100 ml, E. coli from 0 to 250 cfu/100 ml and Enterococcus sp. from 0 to 32 cfu/ 100 ml. TVCs were also found, ranging from 0 to 120 cfu/ml.
4. Discussion
Rainwater harvesting is an ancient technique enjoying a revival in popularity mostly due to the inherent quality of the water. As estimated, 100000 residential rainwater harvesting systems are in use in the United States and its territories [13]. Rainwater has a nearly neutral pH, and is free from disinfection by-products, salts, minerals, and other natural and man-made contaminants. In the northern part of
20
“Sustainable Management and Development of Mountainous and Island Areas”

Table 1. Descriptive statistics of chemical parameters in rainwater samplesChemical Parameter
N Min Max Mean St. Dev.
pH 104 7.48 9.12 8.35 0.37 Conductivity ( S/cm)
104 50 220 109 29
Nitrates (mg/l)
104 5.3 13.0 7.30 1.53
Nitrites (mg/l)
104 0.004 0.040 0.014 0.007
Ammonia (mg/l)
104 0.01 0.05 0.01 0.01
Phosphates (mg/l)
104 0.01 0.7 0.10 0.09
Sulphates (mg/l)
104 1 15 8 4
Sodium (mg/l)
104 1 10 7 2
Potassium (mg/l)
104 0.5 3.5 2.2 0.9
Chlorides (mg/l)
104 5 15 8 4
Hardness (mg/l CaCO3)
104 20 110 45 22
Alkalinity (mg/l CaCO3)
26 5 50 35 17
Fluorides (mg/l)
26 <0.01 <0.01 <0.01 -
Calcium (mg/l)
104 10 20 15.20 1.95
Magnesium (mg/l)
104 0.30 2.50 0.70 0.47
Table 2. Descriptive statistics of trace elements in rainwater samples. Percentiles Element ( g/l) N Median 25 50 75
Iron 104 11 10 11 20 Manganese 104 1 1 1 1 Cadmium 75 <0.10 <0.10 0.16 0.19 Lead 75 <2.0 <2.0 <2.0 2.8 Copper 75 <2.5 <2.5 <2.5 3.40 Chromium 75 <1.3 <1.3 <1.3 1.3 Nickel 75 <10 <10 <10 <10 Zinc 75 10 <10 10 26
Kefalonia Island (Greece) rainwater augments limited groundwater supplies so as to satisfy the summer demand peak. But along with the independence of rainwater harvesting systems comes the inherent responsibility of operation and maintenance to ensure the public health *MAC: Maximum Allowable Concentration safety. In our 2 years study, the analytical results that are listed in Table 1 indicated that the concentrations of ordinary ions in rainwater harvested, met the requirements of inorganic
Table 3. Results of microbiological analysis in rainwater samples.
Microbial Species N Min
Value Max
Value
(%) above
MAC* Total coliform (CFU/100ml) 104 0 590 69.7
E. coli(CFU/100ml) 104 0 250 36.6
Enterococcus sp.(CFU/100ml) 104 0 32 40.0
Total Viable Count 22ºC (CFU/ml)
104 0 120 -
Total Viable Count 37ºC (CFU/ml)
104 0 100 -
Pseudomonas aeruginosa(CFU/100ml)
104 0 18 0
Clostridium perfringens(CFU/100ml)
50 0 2 0
compounds compared to the 98/83/EC Directive for the quality of drinking water. The absence of increased values in the measured variables is considered to be the outcome of two main factors: the quality of rainwater itself and the collection and storage conditions. As recent studies have shown [24] the first factor depends on the location, the weather conditions, the industrial, urban and agricultural activities and to the proximity of the catchment area to the sea. All but the last one seem to favour the quality of rainwater in Kefalonia Island because neither industrial or urban nor even tense agricultural activities exist in the area. The chemical parameters studied are considered as substantial indices of the water quality and their concentrations could depict various characteristics of the water like the origin, the pollution sources and of course water’s hygienic status (potable or other domestic uses). pH values observed were in a range of 7.48 to 9.12 with a mean value of 8.35. The relative higher pH values compared to those of pure unpolluted rainwater (~6.00) could be attributed to the storage in a concrete tank that imparts a slight alkalinity and/or to the proximity to the sea [19]. Conductivity of stored water was rather low (mean 109 S/cm) compared to that of other samples of surface or underground origin from Greece [20] as a result of the low concentration of various ions. Nitrogen ions are also important variables and their presence in various forms could be an
21
“Sustainable Management and Development of Mountainous and Island Areas”
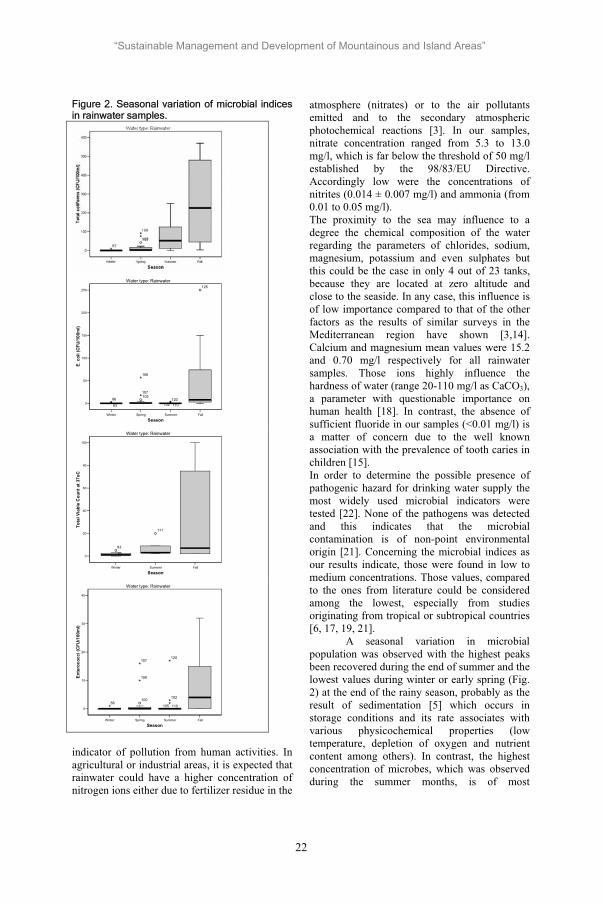
Figure 2. Seasonal variation of microbial indices in rainwater samples.
Winter Spring Summer Fall
Season
0
50
100
150
200
250
E. c
oli (
CFU
/100
ml)
103
125
107
108
83
86 120110102
Water type: Rainwater
Winter Summer Fall
Season
0
20
40
60
80
100
Tota
l Via
ble
Cou
nt a
t 37o
C
111
92
83
Water type: Rainwater
Winter Spring Summer Fall
Season
0
10
20
30
40
Ente
roco
cci (
CFU
/100
ml)
100
108
107
86110105
102
120
Water type: Rainwater
indicator of pollution from human activities. In agricultural or industrial areas, it is expected that rainwater could have a higher concentration of nitrogen ions either due to fertilizer residue in the
atmosphere (nitrates) or to the air pollutants emitted and to the secondary atmospheric photochemical reactions [3]. In our samples, nitrate concentration ranged from 5.3 to 13.0 mg/l, which is far below the threshold of 50 mg/l established by the 98/83/EU Directive. Accordingly low were the concentrations of nitrites (0.014 ± 0.007 mg/l) and ammonia (from 0.01 to 0.05 mg/l). The proximity to the sea may influence to a degree the chemical composition of the water regarding the parameters of chlorides, sodium, magnesium, potassium and even sulphates but this could be the case in only 4 out of 23 tanks, because they are located at zero altitude and close to the seaside. In any case, this influence is of low importance compared to that of the other factors as the results of similar surveys in the Mediterranean region have shown [3,14]. Calcium and magnesium mean values were 15.2 and 0.70 mg/l respectively for all rainwater samples. Those ions highly influence the hardness of water (range 20-110 mg/l as CaCO3), a parameter with questionable importance on human health [18]. In contrast, the absence of sufficient fluoride in our samples (<0.01 mg/l) is a matter of concern due to the well known association with the prevalence of tooth caries in children [15]. In order to determine the possible presence of pathogenic hazard for drinking water supply the most widely used microbial indicators were tested [22]. None of the pathogens was detected and this indicates that the microbial contamination is of non-point environmental origin [21]. Concerning the microbial indices as our results indicate, those were found in low to medium concentrations. Those values, compared to the ones from literature could be considered among the lowest, especially from studies originating from tropical or subtropical countries [6, 17, 19, 21].
A seasonal variation in microbial population was observed with the highest peaks been recovered during the end of summer and the lowest values during winter or early spring (Fig. 2) at the end of the rainy season, probably as the result of sedimentation [5] which occurs in storage conditions and its rate associates with various physicochemical properties (low temperature, depletion of oxygen and nutrient content among others). In contrast, the highest concentration of microbes, which was observed during the summer months, is of most
22
“Sustainable Management and Development of Mountainous and Island Areas”

importance due to the higher public health risk involvement. In total, out of 104 pure rainwater samples, 44% were above the 98/83/EC Directive MAC’s in respect to microbial contamination and characterizes the water as non-potable. In summer samples, the percent of positive samples was 65% for E. coli and 60%, 85% and 71% for Enterococcus sp., total coliforms and P.aeruginosa respectively. As a result, measures were taken with disinfection (chlorination) being one of them. The lack of infrastructure for proper on-site treatment and monitoring and the risk of possible formation of chlorination by-products (trihalomethanes) along with the altering of the organoleptic properties of water (taste, odor) in case of unattended process has led to a different treatment approach which was the chlorination of water into the “tanker trucks” during the transport from the tanks to the consumers. Concentration of chlorine and contact time were considered for an effective process. This approach however is complementary to the sum of measures that should be taken for the protection of rainwater harvested as previous studies have also proven [11]. In brief, those measures are: a) the protection and frequent cleaning of the catchment area, b) adopting of the first-flush practise, c) the annual cleaning of the tanks interior and the removal of the accumulated debris d) the protection of the water during storage (mesh filters and traps in openings) and e) frequent monitoring of the microbial quality and chemical composition of the water.
5. Conclusions
Rainwater harvesting and storage can be a solution in areas with scarcity of other water recourses. Special attention should be paid to the harvesting and storage conditions, in order to safeguard water quality and to the disinfection practices as to avoid the formation of by-products. Those measures accompanied by a water quality monitoring program could protect the public health and characterize rainwater harvesting as a sustainable and valuable practice.
6. References
[1] Abo-Shehada MN., Hindyia M., Saiah A. 2004. Prevalence of Cryptosporidium parvum in private drinking water cisterns
in Bani-Kenanah district, northern Jordan. Int J Environ Health Res 14(5), 351-358.
[2] APHA, AWWA, WEF. Standard Methods for the Examination of Water and Wastewater. 19th Ed. Washington DC, 1995.
[3] Carratala A., Gomez A., Bellot J., 1998. Mapping rain composition in the East of Spain by applying kriging. Water Air Soil Poll. 104;9-27.
[4] Chang M., McBroom WM., Beasley R.S. 2004. Roofing as a source of nonpoint water pollution. J Environ Management 73;307-315.
[5] Characklis GW., Dilts MJ., Simmons III OD., Likirdopoulos CA., Krometis L-A.H., Sobsey M.D., 2005. Microbial partitioning to settleable particles in stormwater. Water Res 39; 1773-1782.
[6] Dillala TA., and Zolan WJ., 1985. Rainwater catchment water quality in Micronesia. Water Res., 19(6); 741-746.
[7] Evans CA., Coombes PJ., Dunstan RH. 2006. Wind, rain and bacteria: The effect of weather on the microbial composition of roof-harvested rainwater. Water Res. 40(1);37-44.
[8] Evison L., Sunna N. 2001., Microbial re-growth in household water storage tanks. J Am. Water. Works Assos. 93;85-94.
[9] Heyworth J., 2001. A diary study of gastroenteritis and tank rainwater consumption in young children in South Australia. In: Proceedings of the 10th International Rainwater Catchment Systems Conference, pp. 141-148.
[10] Krishna H. 2003. An overview of rainwater harvesting systems and guidelines in the United States. Proceedings of the First American Rainwater Harvesting Conference. 2003 Aug 21-23; Austin (TX).
[11] Lehtola MJ., Nissinen TK., Miettinen IT., Martikainen PJ., Vartiainen T., 2004. Removal of soft deposits from the distribution system improves the drinking water quality. Water Res 38; 601-610.
[12] Loye-Pilot M.D., Morelli J. 1988. Fluctuations of ionic composition of precipitations collected in Corsica related to changes in the origins of incoming aerosols. J. Aerosol Sci 19;577-585.
23
“Sustainable Management and Development of Mountainous and Island Areas”
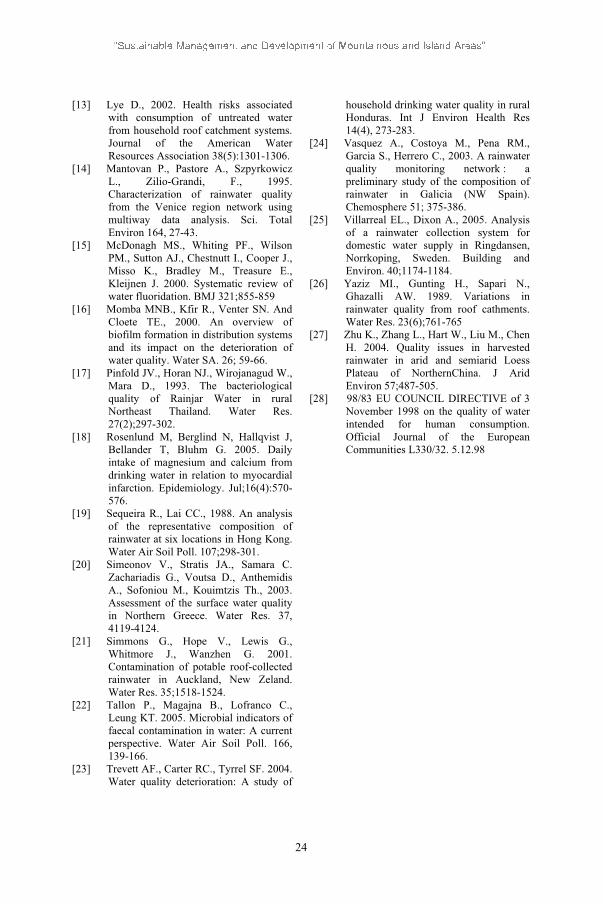
[13] Lye D., 2002. Health risks associated with consumption of untreated water from household roof catchment systems. Journal of the American Water Resources Association 38(5):1301-1306.
[14] Mantovan P., Pastore A., Szpyrkowicz L., Zilio-Grandi, F., 1995. Characterization of rainwater quality from the Venice region network using multiway data analysis. Sci. Total Environ 164, 27-43.
[15] McDonagh MS., Whiting PF., Wilson PM., Sutton AJ., Chestnutt I., Cooper J., Misso K., Bradley M., Treasure E., Kleijnen J. 2000. Systematic review of water fluoridation. BMJ 321;855-859
[16] Momba MNB., Kfir R., Venter SN. And Cloete TE., 2000. An overview of biofilm formation in distribution systems and its impact on the deterioration of water quality. Water SA. 26; 59-66.
[17] Pinfold JV., Horan NJ., Wirojanagud W., Mara D., 1993. The bacteriological quality of Rainjar Water in rural Northeast Thailand. Water Res. 27(2);297-302.
[18] Rosenlund M, Berglind N, Hallqvist J, Bellander T, Bluhm G. 2005. Daily intake of magnesium and calcium from drinking water in relation to myocardial infarction. Epidemiology. Jul;16(4):570-576.
[19] Sequeira R., Lai CC., 1988. An analysis of the representative composition of rainwater at six locations in Hong Kong. Water Air Soil Poll. 107;298-301.
[20] Simeonov V., Stratis JA., Samara C. Zachariadis G., Voutsa D., Anthemidis A., Sofoniou M., Kouimtzis Th., 2003. Assessment of the surface water quality in Northern Greece. Water Res. 37, 4119-4124.
[21] Simmons G., Hope V., Lewis G., Whitmore J., Wanzhen G. 2001. Contamination of potable roof-collected rainwater in Auckland, New Zeland. Water Res. 35;1518-1524.
[22] Tallon P., Magajna B., Lofranco C., Leung KT. 2005. Microbial indicators of faecal contamination in water: A current perspective. Water Air Soil Poll. 166, 139-166.
[23] Trevett AF., Carter RC., Tyrrel SF. 2004. Water quality deterioration: A study of
household drinking water quality in rural Honduras. Int J Environ Health Res 14(4), 273-283.
[24] Vasquez A., Costoya M., Pena RM., Garcia S., Herrero C., 2003. A rainwater quality monitoring network : a preliminary study of the composition of rainwater in Galicia (NW Spain). Chemosphere 51; 375-386.
[25] Villarreal EL., Dixon A., 2005. Analysis of a rainwater collection system for domestic water supply in Ringdansen, Norrkoping, Sweden. Building and Environ. 40;1174-1184.
[26] Yaziz MI., Gunting H., Sapari N., Ghazalli AW. 1989. Variations in rainwater quality from roof cathments. Water Res. 23(6);761-765
[27] Zhu K., Zhang L., Hart W., Liu M., Chen H. 2004. Quality issues in harvested rainwater in arid and semiarid Loess Plateau of NorthernChina. J Arid Environ 57;487-505.
[28] 98/83 EU COUNCIL DIRECTIVE of 3 November 1998 on the quality of water intended for human consumption. Official Journal of the European Communities L330/32. 5.12.98
24

Ecological Evaluation and Conservation Management of a Traditional Cultural Landscape in North-Western Greece
Despina Amanatidou Albert-Ludwigs Universität Freiburg, Fakultät für Forst- und Umweltwissenschaften,
Waldbau Institut, Vegetationskunde, Tennenbacherstr.4, Freiburg, D-79085 [email protected]
Albert Reif Albert-Ludwigs Universität Freiburg, Fakultät für Forst- und Umweltwissenschaften,
Waldbau Institut, Vegetationskunde, Tennenbacherstr.4, Freiburg, D-79085 [email protected]
Spyros Galatsidas Albert-Ludwigs Universität Freiburg, Fakultät für Forst- und Umweltwissenschaften,
Abteilung für Forstliche Biometrie, Tennenbacherstr.4, Freiburg, D-79085 [email protected]
Abstract. The ecological value of the traditional cultural landscape in the area of Vikos-Aoos National Park is investigated by means of four important in nature conservation criteria, i.e. diversity, rarity, naturalness and restorability. A vegetation inventory of the landscape elements provided the necessary information. The evaluation started for each criterion separately. Vascular plant species diversity and rarity were estimated with specific indices. Naturalness and restorability were assessed using qualitative classification schemes. A hierarchical classification with variables the four criteria aggregated the vegetation types in groups of specific ecological characteristics that provided the basis for a respective zoning system. It is concluded that a rational management scheme should combine both strict protection and active management by integrating compatible traditional land uses.
Keywords. Cultural landscape, ecological assessment, plant species diversity, rarity, Vikos-Aoos National Park.
1. Introduction
There is a common assumption that human activities deplete natural resources. This is mainly attributed to the biodiversity loss resulted from the intensification of the human activities [14, 20]. There are however cases, such as traditional land use systems of moderate intensity, where the long interaction of man with
nature has created ecosystems of special ecological value as wildlife habitats of rare or endangered species, or areas of high biodiversity that deserve conservation. Such areas known as traditional or historical cultural landscapes [9, 27, 32, 4] are usually land mosaics of various ecosystems and are often associated also with specific traditional, cultural, aesthetic and economic values [20, 35, 4, 8].
The last half century traditional cultural landscapes in Europe have been restricted at mountainous or remote marginal areas, while changes in the land uses and particularly land abandonment are considered the main causes of the deterioration of the landscape and their associated ecological and other values especially in the Mediterranean region [42, 31, 33, 37, 10, 29, 28, 16, 30].
The worldwide concern on biodiversity loss and the resulted actions to hinder it, along with the recognition of the values, the multi-lateral role of the cultural landscapes and the changes taking place on them, set off the need for their protection and where possible their restoration [20, 7, 30].
In order to achieve an efficient landscape protection and management, it is necessary to identify and describe the main components and elements of the landscape; analyze their functions and changes along with all influencing factors; and assess them taking into account the particular values assigned to them [5].
There is a variety of methods dealing with the ecological evaluation of an area or biotic community and a number of criteria applied to
25
“Sustainable Management and Development of Mountainous and Island Areas”

them. No specific criteria are used in all cases, although some of them such as biodiversity, naturalness, rarity and endangerment are among the most often used [23, 41]. There is also a great variability in the ways that these criteria are incorporated in an evaluation procedure and this has to do with the choice of the necessary variables and their inventory and assessment scheme. In each case the choice of the appropriate method, criteria and variables depends largely on the objectives of the evaluation [39, 23].
In this study the conservation value of the present cultural landscape in the area of Vikos-Aoos National Park, NW Greece is assessed with specific ecological criteria and forms the basis for a future management scheme.
The landscape around permanent villages at the hilly and mountainous zone of the National Park has been influenced for long by traditional agro-silvo-pastoral land uses and is a mosaic of various ecosystems.
The remote and mountainous character of the area, the marginal land productivity along with the socioeconomic changes of the previous century led to the gradual abandonment of the traditional rural economy and the depopulation of the area, with consequences on the ecosystems and the landscape. Vegetation succession and invasion of woody species has been accelerated in the area, affecting the mosaic structure of the landscape, which has started to lose some of the open -not forest)-landscape elements [21].
2. Materials and Methods
2.1. Study area
The traditional cultural landscape within Vikos community land (Fig. 1) was considered representative for the area of the National Park and was chosen for the study. It is incorporated, to its major part, in the core of the National Park. The area is of great aesthetic value due to the impressive and diverse geomorphology; it is characterized by an outstanding traditional architecture, rich history and culture (“Zagorochoria”) and is known for its medicinal flora and the famous practical doctors (“Viko-giatroi”).
2.1.1. The traditional cultural landscape
The landscape in the study area is depicted by the presence of Vikos gorge. The relief is very
diverse with abrupt altitudinal changes, steep slopes with precipitous rock cliffs, numerous gullies with extended screes and a narrow valley. Hard limestone of various geological age dominate in the parent material. Flysch is of limited extend, located mainly near the village, where agricultural terraces have been established in the past. A series of soil types characterize the land; from swallow rocky red soils to moderately deep rendzina and occasionally also deep brown forest soil. The climate is Mediterranean transitional to the continental, with mean annual temperature and precipitation 11,9o C and 1.100,9 mm respectively (meteorological station of Papigo, period 1971-1990) [38].
Figure 1. Study area: a) Vikos village with the agricultural terraces and the tree hedges, b) Vikos gorge.
Sub-mediterranean mixed broadleaved woodlands and forests (Quercetea pubescentis)are extended between 500 m and 1000m a.s.l. These are composed primarily of Carpinusorientalis, Ostrya carpinifolia, Quercus pubescens and Q. coccifera, and are rich in tree and shrub species. At highly inclined, unstable, air-humid sites of the gorge up to about 1000 m the forest is enriched with species such as Aesculus hippocastanum, Tilia cordata, T. tomentosa, T. platyphyllos, Corylus colurna, Carpinus betulus and Acer pseudoplatanus. At
Vikos
Voidomatis river
V i k o s g o r g e
1600
19
1500
1800
1700
1300
1700
Episkopou
Evagelistria
Ag. Ioannis
700
N
500 0 500 Meters
#
#
#
Thessaloniki
Athens
Ioannina
#Vikos-Aoos National Park
a)
b)
26
“Sustainable Management and Development of Mountainous and Island Areas”
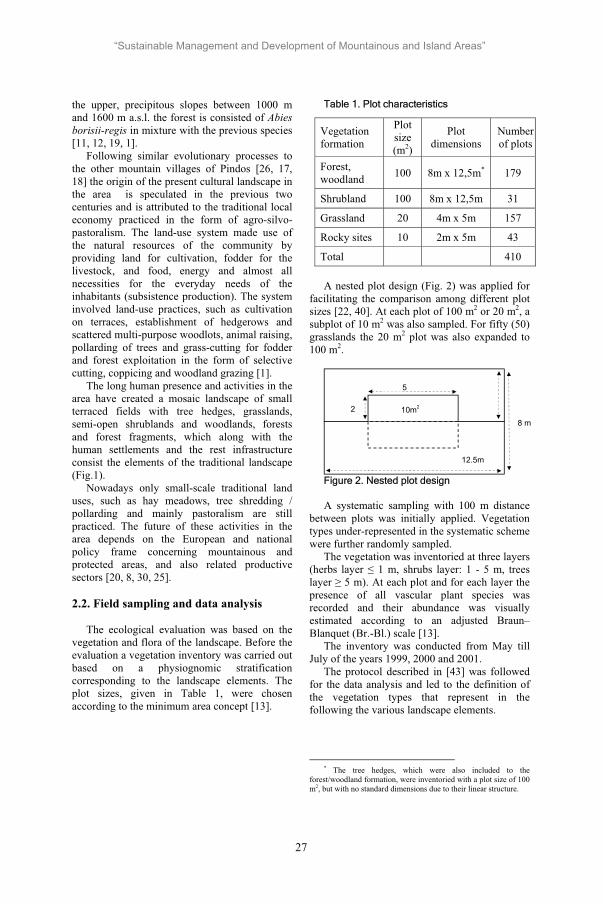
the upper, precipitous slopes between 1000 m and 1600 m a.s.l. the forest is consisted of Abies borisii-regis in mixture with the previous species [11, 12, 19, 1].
Following similar evolutionary processes to the other mountain villages of Pindos [26, 17, 18] the origin of the present cultural landscape in the area is speculated in the previous two centuries and is attributed to the traditional local economy practiced in the form of agro-silvo-pastoralism. The land-use system made use of the natural resources of the community by providing land for cultivation, fodder for the livestock, and food, energy and almost all necessities for the everyday needs of the inhabitants (subsistence production). The system involved land-use practices, such as cultivation on terraces, establishment of hedgerows and scattered multi-purpose woodlots, animal raising, pollarding of trees and grass-cutting for fodder and forest exploitation in the form of selective cutting, coppicing and woodland grazing [1].
The long human presence and activities in the area have created a mosaic landscape of small terraced fields with tree hedges, grasslands, semi-open shrublands and woodlands, forests and forest fragments, which along with the human settlements and the rest infrastructure consist the elements of the traditional landscape (Fig.1).
Nowadays only small-scale traditional land uses, such as hay meadows, tree shredding / pollarding and mainly pastoralism are still practiced. The future of these activities in the area depends on the European and national policy frame concerning mountainous and protected areas, and also related productive sectors [20, 8, 30, 25].
2.2. Field sampling and data analysis
The ecological evaluation was based on the vegetation and flora of the landscape. Before the evaluation a vegetation inventory was carried out based on a physiognomic stratification corresponding to the landscape elements. The plot sizes, given in Table 1, were chosen according to the minimum area concept [13].
Table 1. Plot characteristics
A nested plot design (Fig. 2) was applied for facilitating the comparison among different plot sizes [22, 40]. At each plot of 100 m2 or 20 m2, a subplot of 10 m2 was also sampled. For fifty (50) grasslands the 20 m2 plot was also expanded to 100 m2.
Figure 2. Nested plot design
A systematic sampling with 100 m distance between plots was initially applied. Vegetation types under-represented in the systematic scheme were further randomly sampled.
The vegetation was inventoried at three layers (herbs layer 1 m, shrubs layer: 1 - 5 m, trees layer 5 m). At each plot and for each layer the presence of all vascular plant species was recorded and their abundance was visually estimated according to an adjusted Braun–Blanquet (Br.-Bl.) scale [13].
The inventory was conducted from May till July of the years 1999, 2000 and 2001.
The protocol described in [43] was followed for the data analysis and led to the definition of the vegetation types that represent in the following the various landscape elements.
* The tree hedges, which were also included to the forest/woodland formation, were inventoried with a plot size of 100 m2, but with no standard dimensions due to their linear structure.
Vegetation formation
Plotsize(m2)
Plotdimensions
Number of plots
Forest, woodland 100 8m x 12,5m* 179
Shrubland 100 8m x 12,5m 31
Grassland 20 4m x 5m 157
Rocky sites 10 2m x 5m 43
Total 410
10m2
5
2
12.5m
8 m
27
“Sustainable Management and Development of Mountainous and Island Areas”

2.3. Ecological evaluation
Four important in nature conservation criteria were applied for the evaluation, namely plant species diversity, rarity, naturalness and restorability [23, 41]. The vegetation types were initially evaluated for each criterion separately and then for all criteria together.
2.3.1. Diversity
Species richness, Shannon diversity, Simpson diversity and Evenness [22, 24] are the four indices applied for the quantification of the plant species diversity. For each sampling plot the indices were estimated after the replacement of the Br-Bl. codes with the respective cover values. For each vegetation type a mean index value was estimated from 10 m2 and 100 m2 plots respectively. These eight diversity indices for each vegetation type were used as variables for a cluster analysis (Ward algorithm, square Euclidean distance, z-standardization) that aggregated them in groups of different diversity pattern and they were consecutively ascribed with a certain value (high, medium or low).
2.3.2. Plant species rarity
In the study the criterion of rarity refers to the presence of rare plant species and it was quantified with the following indices: numbers of “Greek endemics”, “Threatened taxa”, “Wide endemics” and “Total rare plant taxa” based on the National List of the important plant taxa in Greece [6]. Similarly to diversity, the rarity pattern of the vegetation types was investigated by means of a hierarchical classification with variables the four rarity indices.
2.3.3. Naturalness
For the criterion of naturalness the plant communities were qualitatively assessed taking into account the type and intensity of the human influence. Reference point to the evaluation was the potential natural vegetation (pnV), which is the vegetation that would develop under the current site conditions if man no longer intervened [15, 36].
The pnV was defined for the various sites of the study area and then compared to the present vegetation. Depending on the closeness or similarity to the respective pnV the various
vegetation types were classified into three naturalness classes (semi-natural, moderately altered and altered) and were assigned with a conservation value (high, moderate and low respectively) based on the classification scheme presented in [15] adjusted to the study conditions.
2.3.4. Restorability
The necessary time for the restoration of an ecosystem after a disturbance, e.g. land use, is of great importance in nature conservation since it is associated with its sensitivity against disturbances and thus can guide the management of the ecosystem. The restoration of an ecosystem after its destruction / disturbance is a successional process and includes both the restoration to the initial site conditions and the re-appearance of the typical for the site plant and animal communities [34, 2, 36].
Similarly to naturalness, the evaluation of the vegetation types with the criterion of restorability is qualitative and it is based on an approximation of the restoration (succession) time a plant community needs to recover after a distraction.
Facilitated by the classification scheme presented in [34] and adjusted to the study conditions, all vegetation types were classified in three restorability classes (short < 20 yrs, medium: 20-50 yrs and relatively long >50 years) assigned with low, medium and high value respectively.
2.3.5. Overall evaluation scheme
The matrix of the four criteria values was hierarchically clustered after replacing the high, medium and low values of each criterion with numbers (3, 2 and 1 respectively). Ward algorithm and Squared Euclidean distance were the applied settings. The vegetation types were thus aggregated in groups exhibiting specific patterns with respect to the four criteria. These patterns were ecologically explained means of a Principal Components Analysis (PCA) [3].
3. Results
3.1. Diversity
The plant species diversity of the traditional cultural landscape can be summarized to the following:
28

700 plant taxa or 11% of the Greek plant species are concentrated in an area of 8 Km2.Most of the plant species have a distribution optimum in open vegetation types of anthropogenous origin related to the local land use system. 24 vegetation types (including plant communities and subunits) describe the vegetation of the various landscape elements. Although a range of diversity indices
characterizes the various vegetation types, a general diversity pattern is observed. Plant species diversity increases from vegetation types representing early succession stages, such as specific grasslands to intermediate succession stages, such as the open shrublands (phrygana and garigue) and specific grazed grasslands (Dianthus viscidus community) and decreases again to advanced succession stages such as the woodlands of Carpinus orientalis and the forests of Acer obtusatum.
High diversity values are associated with equitable species distribution, low species dominance values, which are related to controlling factors such as the traditional grazing system and site conditions.
3.2. Rarity
The study area has high density of rare plant taxa. 72 rare plant species or 4% of the Greek rare plant taxa have been registered. These include 14 Greek endemics, 40 wide endemics and 28 threatened taxa. Most of these taxa have a distribution optimum in open habitats.
Although the numbers of rare taxa varied among the vegetation types, these exhibited in general a similar pattern to that of diversity. Thus, the open vegetation types characterized with high plant species diversity, such as the phrygana and garigue presented also high numbers of rare plant taxa. Woodlands and forests of low diversity exhibited low to moderate numbers of rare taxa.
3.3. Naturalness and Restorability
In the study area the forests and the chasmophytic vegetation of the rockcliffs represent the most natural landscape elements of relatively long restoration time, properties that assign to them high conservation value.
3.4. Overall evaluation
The classification with variables the four conservation criteria identified three ecological groups (Table 2, Fig. 3).
The 1st group is characterized by high naturalness and restorability value, medium to low diversity and rarity value, and included the forests. The main ecological value of the group is related to the high naturalness and restorability, attributes which should be safeguarded and thus direct the future management.
The 3rd group aggregated the regularly grazed open shrublands and specific grasslands that presented high diversity, medium to high rarity, medium restorability and medium to low naturalness. The nature conservation value of these landscape elements is attributed to their high plant species diversity and rarity, characteristics that can be preserved only through an active management regime, e.g. extensive grazing.
The 2nd group incorporated vegetation types with low to medium criteria values, such as woodlands, wood pasture, tree hedges, forest fringes and meadows. These plant communities can be subject to a flexible land management scheme and can either provide for traditional land uses, or be set aside for nature conservation or future use.
PCA axis1: increasing Naturalness & Restorability
2,52,01,51,0,50,0-,5-1,0-1,5-2,0
PCA
axis
2: In
crea
sing
Div
ersi
ty&
Rar
ity
2,0
1,5
1,0
,5
0,0
-,5
-1,0
-1,5
-2,0
Ecologicalgroup
3
2
1
Di_vis2Jas_fr7
Phl_fr8
Sal_of9
Ju_ox10Qpub12
Poa_bu5Be_per1
Hel_nu6
Car_or21
Q_coc11
Ru_Qpu18Ju_Qpu13
Qp_Car22
Ac_Ost24
Par_of16
Pte_aq19Mar_pe4Tri_ni3
Co_Qpu14
J_Aobt23
Figure 3. Scatter plot of the factor scores of the vegetation types resulted from PCA of the matrix with the four conservation criteria values.
29
“Sustainable Management and Development of Mountainous and Island Areas”

Table 2. Overall ecological evaluation
Vegetation type
Landscape element
Naturalnessvalue
Restorability value
Diversity value
Rarity value
Ecological group
Qpub12 F High High Medium High Qp_Car22 F High High Medium Medium Co_Qpu14 F High High Medium Low Ac_Ost24 F High High Low Medium J_Aobt23 F High High Low Low
1
Ju_Qpu13 F Medium Medium Medium Medium Ru_Qpu18 F Medium Medium Medium Medium
Q_coc11 W Medium Medium Medium Medium Car_or21 W Medium Medium Low Medium Pte_aq19 G Medium Medium Medium Low Par_of16 G Medium Low Medium Low
Tri_ni3 G Low Low Medium Low
Mar_pe4 G Low Low Medium Low
2
Ju_ox10 S Medium Medium High High
Sal_of9 S Medium Medium High High
Phl_fr8 S Low Medium High High
Di_vis2 G Low Medium High High
Jas_fr7 G Low Medium High High
Be_per1 G Low Medium High Medium
Poa_bu5 G Low Medium High Medium
Hel_nu6 G Low Medium High Medium
3
The bold characters indicate the criterion(-ria) that should direct the management of the respective vegetation types. F: forest, W: woodlald, G:grassland, S:shrubland. Bel_pe1 Bellis perennis grassland Ju_Qpu13 Quercus pubescens pasture Di_vis2 Dianthus viscidus grassland Co_Qpu14 Quercus pubescens - Cornus mas forest Tri_ni3 Trifolium nigrescens meadows Pla_or15 Platanus orientalis forest Mar_pe4 Marrubium peregrinum community Par_of16 Parietaria officinalis community Poa_bu5 Poa bulbosa rocky grassland Asp_ch17 Asperula chlorantha community Hel_nu6 Trifolium dalmaticum rocky grassland Ru_Qpu18 Quercus pubescens tree hedges Jas_fr7 Jasminum fruticans rocky grassland Pte_aq19 Pteridium aquilinum forest fringe Phl_fr8 Phlomis fruticosa phrygana Br_syl20 Brachypodium sylvaticum forest fringe Sal_of9 Salvia officinalis garigue Car_or21 Carpinus orientalis woodland Ju_ox10 Juniperus oxycedrus garigue Qp_Car22 Quercus pubescens – Carpinus orientalis forest Q_coc11 Quercus coccifera woodland J_Aobt23 Juglans regia – Acer obtusatum forest Qpub12 Quercus pubescens forest Ac_Ost24 Acer obtusatum – Ostrya carpinifolia forest
4. Discussion
4.1. Nature conservation value of the traditional cultural landscape
In an area influenced for long by traditional agro-silvo-pastoral land uses 24 different
vegetation types have been traced with 700 plant species, including 72 rare taxa.
Part of the landscape demonstrates high plant species diversity and rarity. These have been detected in open landscape elements representing intermediate and early successional stages (low shrublands and specific grassland communities) and are of anthropogenous origin related to the traditional land use system.
30
“Sustainable Management and Development of Mountainous and Island Areas”

In order to conserve the high biodiversity of the cultural landscape the open landscape elements should be maintained and this can be achieved only by means of an active management scheme that integrates traditional land uses.
From the other side, there is another part of the landscape, namely specific landscape elements that are characterized with high naturalness and restorability values. These are the various forests and the chasmophytic vegetation of the exposed rockcliffs. The ecological value of the ecosystems is related not only to the conservation of their biodiversity, but also in the cases of the forests and woodlands, to the high structural complexity and the enhanced ecosystem functions. These characteristics, along with the long restoration time that these ecosystems require in case of destruction, make obvious the need to protect them from any use that can harm their high naturalness and restorability value.
4.2. Management of the traditional cultural landscape
In order to preserve the ecological values of the traditional cultural landscape in Vikos area amanagement scheme that combines both strict protection in specific elements of the landscape and integrates also traditional land uses in the management of other landscape elements based on a respective zoning system is required.
The advantages of this scheme in reference to the present strict protection status of the area (as core of the National Park) are the following:
All ecosystems types and species (including rare taxa) are favoured. Both forest and non-forest diversity components are conserved (biodiversity conservation). The naturalness and the related ecosystem processes & functions are maintained and enhanced (nature protection). The mosaic character of the landscape is conserved, along with the associated traditional / cultural, aesthetic and economic values, creating optimal conditions for the sustainable development of the local communities.
5. Acknowledgements
The first author would like to thank the Greek Scholarships Foundation (IKY) for the financial support of the study.
6. References
[1] Amanatidou D. Analysis and evaluation of a traditional cultural landscape as a basis for its conservation management. A case study in Vikos-Aoos National Park, Greece. Dissertation: University of Freiburg; 2005.
[2] Bastian O. Schreiber K-F. Analyse und ökologische Bewertung der Landschaft. Stuttgart: G-Fischer; 1994.
[3] Bühl A. SPSS - Vers. 10. Einführung in die moderne Datenanalyse unter Windows. München: Addison-Wesley; 2001.
[4] Burggraff P, Kleefeld KD. Historische Kulturlandschaft und Kulturlandschafts-elemente. Angew. Landschaftsökologie 1998; 20.
[5] Council of Europe. European Landscape Convention. Florence. European Treaty Series 2000; 176.
[6] Dafis S, Papastergiadou E, Georghiou K, Babalonas D, Georgiadis Th, Papageorgiou M, Lazaridou Th, Tsiaoussi V, editors. Directive 92/43/EEC. The Greek Habitat Project Nature 2000 (in Greek). Thessaloniki; EKBY; 1996.
[7] European Commission. Understanding biodiversity: An agenda for research into biodiversity prepared by the European working group on research and biodiveristy. Brussels: DG for Environment; 1997.
[8] European Commission. Europe’s environment: the second assessment.Brussels: DG for Environment; 1998.
[9] Ewald KC. Traditionelle Kulturland-schaften. Der Bürger im Staat 1994; 44 (1): 37-42.
[10] Farina A. Bird diversity in a changing landscape (Tuscany, Italy). In: Runder PW, Montenegro G, Jaksic FM, editors. Landscape disturbance and biodiversity in Mediterranean type ecosystems. Stuttgart; Springer. Ecological Studies 1998; 136: 349-368.
31
“Sustainable Management and Development of Mountainous and Island Areas”

[11] Ganiatsas K. Botanical research in Vikos Gorge (in Greek). Epirotiki Estia 1971; 228: 1-28.
[12] Georgiadis T, Dimopoulos D. Dimitrellos G. Vegetation and flora of Vikos-Aoos National Park. In: Kasioumis , Gatzojannis S. Management plan of Vikos-Aoos National Park (in Greek). Thessaloniki: IDE; 1996. Part A: p.18-41.
[13] Glavac V. Vegetationsökologie: Grundfragen, Aufgaben, Methoden. Jena; G-Fischer. 1996.
[14] Glowka L, Burhenne-Guilmin F, Synge H. A guide to the Convention on Biological Diversity. Gland: IUCN; 1994.
[15] Grabherr G, Koch G, Kirchmeir H. Naturnähe Österreichischer Wälder. Bildatlas. Sonderdruck Österr. Forstz. 1998; 1/97.
[16] Grove AT, Rackham O. Threatened landscapes in the Mediterranean: examples from Crete. Landscape and Urban Planning 1993; 24: 279-292.
[17] Halstead P. Mediterranean mountain economy in Pindus (in Greek). In: Municipality of Konitsa, edition. Proceedings of conference on The county of Konitsa in space and time; 1996 May 12-14; Konitsa: Municipality of Konitsa; 1996. p. 63-73.
[18] Halstead P. Ask the fellows who lop the hay: Leaf-fodder in the mountains of Northwest Greece. Rural History 1998; 9(2): 211-234.
[19] Hanlidou E, Kokkini S. On the flora of Vikos-Aoos National Park (NW Greece). Willdenowia 1997; 27: 81-100.
[20] IUCN, editon. Parks for Life: Action for Protected Areas in Europe. Gland: IUCN; 1994.
[21] Kasioumis K, Gatzojannis S. Management plan of Vikos-Aoos National Park (in Greek). Thessaloniki: IDE; 1996.
[22] Kent M, Coker P. Vegetation description and analysis. London: Belhaven; 1992.
[23] Kirby K. Die Bewertung von Wäldern und Gehölzbeständen. In: Usher MB, Erz W, editors. Erfassen und Bewerten im Naturschutz: Heidelberg – Wiesbaden: Quelle & Meyer; 1994. p.167-186.
[24] Magurran AE. Ecological diversity and its measurement. London: Chapman & Hall; 1995.
[25] Maragou P. Evaluation of the National protected areas system in Greece (in Greek). Athens: WWF; 2004.
[26] McNeill JR. The mountains of the Mediterranean world. An environmental history. Cambridge: University Press; 1992. Studies in Environmental History 8.
[27] Meeus JHA. Pan-European Landscapes. Landscape and Urban Planning 1995; 31: 57-79.
[28] Mitchley J, Ispikoudis J. Grassland and shrubland in Europe: biodiversity and conservation. In: Papanastasis V, Frame J, Nastis AS, editors. Proceedings on Grasslands and Woody Plants in Europe; 1999 May 27-29; Thessaloniki, Greece. Thessaloniki: University of Thessaloniki; 1999. p.239-251.
[29] Naveh Z. From biodiversity to ecodiversity: Holistic conservation of the biological and cultural diversity of Mediterranean landscapes. In: Runder PW, Montenegro G, Jaksic FM, editors. Landscape disturbance and biodiversity in Mediterranean-type ecosystems. Ecological studies 1998; 136: 23-53.
[30] NCESD, editor. A contribution of NCESD to COP6 on Biodiversity. Athens: NCESD; 2002. Research Paper 18.
[31] Papanastasis VP. Legal status of land tenure and use and its implication for open landscapes of western Crete. Landscape and Urban Planning 1993; 24: 273-277.
[32] Phillips A. Cultural Landscapes: an IUCN Perspective. In: von Droste B, Plachter H, Rössler M, editors. Cultural landscapes of universal value: Components of a Global Strategy. Jena: G-Fischer; 1995: p.380-392.
[33] Pineda FD, Montalvo J. Biological diversity in traditional land use systems. In: Halladay P, editor. Conserving biodiversity outside protected areas. IUCN; 1995. p.107-122.
[34] Plachter H. Naturschutz. Stuttgart: G-Fischer; 1991.
[35] Plachter H. Functional criteria for the assessment of cultural landscapes. In: von Droste B, Plachter H, Rössler M,
32
“Sustainable Management and Development of Mountainous and Island Areas”

editors. Cultural landscapes of universal value: components of a global strategy. Jena: G-Fischer; 1995. p. 393-404.
[36] Reif A, Coch T, Knoerzer D, Suchant R. Landschaftspflege in Wald. In: Konold W, Böcker R, Hampicke U, editors. Handbuch Naturschutz und Landschaftspflege: Kompendium zu Schutz und Entwicklung von Lebensräumen und Landschaften. Landsberg am Lech: Ecomed; 2001.
[37] Rundel PW. Landscape disturbance in Mediterranean-type ecosystems: an overview. In: Runder PW, Montenegro G, Jaksic FM, editors. Landscape disturbance and biodiversity in Mediterranean-type ecosystems. Ecological studies 1998; 136: 3-22.
[38] Soulis N. The climate of Epirus. Ioannina; 1994.
[39] Spellerberg FI. Evaluation and assessment for conservation. London: Chapman & Hall; 1992.
[40] Stohlgren T, Coughenour MB, Chong GW, Binkley D, Kalkhan MA, Schell LD, Buckley DJ, Berry JK. Landscape analysis of plant diversity. Landscape Ecology 1997; 12: 155-170.
[41] Usher MB. Erfassen und Bewerten von Lebensräumen: Merkmale, Kriterien, Werte. In: Usher MB, Erz W, editors. Erfassen und Bewerten im Naturschutz. Heidelberg – Wiesbaden: Quelle & Meyer; 1994. p. 17-47.
[42] Vos W, Stortelder A. Vanishing Tuscan landscapes: landscape ecology of a submediterranean montane area (Solano Basin, Tuscany, Italy). Wageningen: Pudoc; 1992.
[43] Wildi O. A new numerical solution to traditional phytosociological tabular Classification. Vegetatio 1989; 81: 95-106.
33
“Sustainable Management and Development of Mountainous and Island Areas”

Teaching English to Forestry Students: Present Situation, Future Expectations
Polyxeni Anagnostou Department of Forestry and Management of the Environment and Natural Resources
Democritus University of Thrace 193 Pantazidou st. 68200 Orestiada, Greece
Home address: 18 D. Ralli st. 15342 Athens, Greece Tel.: 210-6391833
E-mail: [email protected]
Abstract. The English language course taught at the Forestry department of the Democritus University of Thrace has been designed to suit the needs of first and second year students. The selection of the material taught has been made bearing in mind that most of the students study scientific texts for the first time, so they will need to learn basic forestry terminology, and that the number of hours of English lessons throughout the year is limited. The aim of the course is to help students acquire a basic knowledge of forestry topics, to show them how language is used as a medium of communication while dealing with such topics and to provide them with strategies for exploiting similar or more difficult material. The purpose is to help students develop techniques for reading effectively, to provide them with a guide for their own writing and to enable them improve the accuracy of their spoken English.
Key words: teaching English, forestry students
Main part. This paper is intended to give an account of the English language courses taught to first and second year students of the Forestry department at the Democritus University of Thrace. The design of the courses was based on the following factors: the students’ needs, their age, their interests and / or motivation, their confidence, which proved related to their previous learning experiences and the length of the course itself i.e. the fact that the number of hours of English lessons throughout the year is very limited. First year students are taught general English of a post intermediate level as they are expected to be competent users of the written and the spoken language by the end of the year. They get practice mainly in grammar and syntax through general English texts which are exploited and analysed at sentence level, paragraph level and text level. All
four skills – reading, writing, listening, speaking – are incorporated in the lessons when possible. Second year students study scientific texts through which they learn basic forestry terminology but mainly they develop an ability to handle the kind of written English they will be concerned with while studying specialist subjects. The material used in the second year of studies consists of a main textbook called English through Forestry and supplementary texts on Forestry which students contribute to the course having found them either in newspapers, magazines, scientific journals or the internet. Most of the textbook material is authentic texts, simplified where necessary, followed by a number of exercises. The texts came from the library of the Foreign Languages Department of the Aristotle University of Thessaloniki but their writer is unknown. The exercises were written by the English language teacher at the Forestry Department in Thesalloniki, who did the collection of the texts. There is a total of fifteen units in the book each of which deals with a specific topic in very much the same way and layout as every other unit. Examples of topics are: the tree, the root, the trunk, the leaf, the soil, land resources, classification and naming of plants, forests of the world, deserts of the world, ecology, the climate etc. Examples of students’ contributions are texts on: paper and wood pulp from tropical rain forest areas, Scotland’s mountain forests, California’s tallest living tree etc. The way each unit in the book is dealt with depends on the dynamics of the class each year and a number of factors that come into play when teaching methodology is concerned. These factors are:1. The material taught • is the material in the book challenging? • is the material interesting in itself or is it only a pretext for language work? • is the material recycled? 2. The layout of the material • is the layout appealing?
34
“Sustainable Management and Development of Mountainous and Island Areas”

• does every unit look the same? • are there any visuals? If so, are they clear? 3. The grading of the material • what is the basis for grading the material?
a. the frequency of an item, its usefulness, its coverage etc.
b. the difficulty of an item i.e. from easy to difficult.
4. The structural element • is the grammar taught appropriately, i.e. teaching the structure in view of its function? • are there summaries of verb forms and / or other framed paradigms in the book? 5. The lexical element • how is the new vocabulary presented? • is there just enough vocabulary presented or too much? • is it reinforced throughout the course Book? 6. The presentation of new material • is the presentation of new items always done in the same way or does it vary? 7. The practice of the material • What activities are there for practice? • are there enough exercises, too many or too few? • are the exercises mechanical, meaningful or some of both? • do they move from easy to difficult? • are they varied or not? 8. The four skills • are all four skills taught, receptive and productive ones? • are the skills integrated with each other? For example is reading integrated with writing? • is the proportion of each skill appropriate for the objectives of the course?
a. Reading • is there a progressive teaching of reading skills?
• is there a variety of reading exercises? b. Writing
• is there a progressive teaching of writing skills? • are the writing activities communicative i.e. letters, reports or are they mechanical ones i.e. isolated sentences?
c. Listening • are there any listening extracts, authentic and / or simulated? • are there any listening exercises?
d. Speaking • are there any activities for language production? • are the activities equally proportioned throughout the book? • are the subjects of the activities modivating and interesting for the students?
9. The overall opinion • what is the overall evaluation of the
strengths and weaknesses of a book?
It is clear from all the above considerations that there is no perfect textbook in the market. All books have strengths and weaknesses. Quite a few concentrate on teaching the language system and fail to show how this system is used in communication. Likewise the text book I am using has its strengths and weaknesses. It meets some of the above mentioned requirements but it also lacks a few. Therefore there are quite a lot of supplementary activities and changes to the existing ones I have to make to meet the needs of the students I have each year. In line with these modifications I have chosen to borrow some of the material found in the book I use with the students of the Agriculture Department seeing that there is a big overlap between the two books regarding the subject matter. The format of the exercises of the agriculture textbook is much more varied and more helpful in that it meets the following considerations. • it presents the language as an aspect of the subject students are studying and not just as a linguistic tool. • it shows students how to use the grammar they already know and helps them relate previously acquired linguistic knowledge to meaningful realizations of the language system in a given passage. • it does not teach either language in isolation or subject matter in isolation but the manner in which both combine in meaningful communication – the aim being to help students understand how the subject matter is expressed through English. • it uses exercises which avoid mechanical work but direct people’s minds towards rational thought and problem solving, hoping that the students will see the relationship between expression and content and will thus be persuaded of the relevance of English learning to their own specialities.
35
“Sustainable Management and Development of Mountainous and Island Areas”

The overall purpose of the exercises done is to help students understand the way English is used as a medium of communication, since language learning is not mearly getting to know various linguistic forms but how these forms are put together to produce meaningful pieces of discourse. At the same time care must be taken not to overload the students with new material and complex structures which are often necessary in maintaining a natural use of the language. The overload of complex structures is avoided in the second year by my having taught grammar and syntax systematically and in detail in the first year when students are less loaded with having to study specialized language. The task of having to cope with learning specialized terminology and using the English language correctly is aided by the approach taken when dealing with the reading passages and the type of exercises used to exploit these passages.
Rationale behind the type of exercise used Each unit of the textbooks used begins with a
reading passage which is followed by a number of exercises. Some of them are grammar exercises, some are vocabulary and some test comprehension. For students to be able to do these exercises successfully they have to be effective readers to understand the texts in full. What is READING? It involves interpretation of marks on paper. When we read we go directly for meaning; for something that makes sense to us as readers. Effective reading depends on, among other things, our world knowledge and experience of the subject concerned. In other words, the more we know about a topic the easier it is for us to comprehend it. What is COMPREHENSION? Nature of comprehension Comprehension includes the ability to: • retain information and recall it when required. • select important points. • interpret information and ideas. •make deductions from what has been read. • relate knowledge to experience. • arrive at general conclusions/judgements. Factors which affect comprehension • speed of perception. • accuracy of perception. • memory and the ability to recall information. • motivation or purpose.
• concentration • level of difficulty of the material • ability to anticipate; directly related to knowledge of the world. • vocabulary. • general background of knowledge and experience – sophistication. • ability to read critically. How comprehension can be improved
• try to improve each of the factors which affect it. • test the quality of comprehension regularly and in a variety of ways. • read critically. • use study techniques where appropriately. • discuss reading materials as often as possible. • make students aware of the differences between readers:
Inefficient reader 1. narrow eye span 2. regresses habitually 3. subvocalises 4. restricted vocabulary 5. irregular eye movements 6. lacks purpose in reading 7. limited background of general knowledge and experience Efficient reader 1. wide eye span * 2. reduces regressions ** 3. tends not to subvocalise 4. wide vocabulary 5. rhythmic eye movements 6. purposeful in reading 7. broad background of general knowledge and experience
Activities that aid comprehension of a text • comprehension questions. • vocabulary exercises. • silent reading – reading aloud. • note taking. • listening comprehension. • Intensive/extensive reading. • discussion: exposure to parallel texts of similar or more difficult level. • input to writing: summary writing, cloze texts, or rewriting.
Reading skills to be developed 1. Previewing: That is, finding out where the important part of what is being read is to be found.
36
“Sustainable Management and Development of Mountainous and Island Areas”

This can be done through the use of table of contents, appendix, chapter headings, paragraph headings etc. 2. Skimming: That is, running the eye quickly over a particular passage to find out where the main facts are; these can be read with more care afterwards. 3. Scanning: That is, running the eye forwards or backwards over a passage looking for particular details, as we do when ‘reading’ a dictionary for a word or a telephone directory for a specific number. 4. Sensitivity to context: That is, developing the skill of extracting the meaning of words/idioms from the context in which they are placed. 5. Thematic anticipation: That is, reminding the student that the skilful reader develops a sort of dialogue with what he reads. Before staring a passage, on the basis o previewing, the reader asks himself what he knows about the subject already, what it is likely to be about and, as he reads, he tries to relate it to what he has read elsewhere. In this way he is often able to anticipate the direction in which the argument/text is moving. 6. Linguistic/structural anticipation: Thisinvolves the ability to discern the core meaning in complex sentences. It is the skill which enables the reader to predict the way in which a half finished sentence will be continued when he turns over the page. 7. Structuring: There is normally an underlying thematic organisation to whatever is written. This organisation operates at paragraph level, section/chapter level and the whole (article, book etc). Many paragraphs usually begin with a topic sentence which summarises the content of the paragraph. The rest of the paragraph is made up of support, refutation, or additional detail. In longer pieces of writing there are a number of fairly readily recognisable thematic patterns. For example: a. Statement of problem – discussion of problem – suggested solution. b. Thesis – points for – points against – deduction – conclusion. c. Event – argument – opinion 1 – opinion 2 – evaluation – possible outcome. d. Introduction to the scene/action – event 1 – event 2 – result/outcome. The efficient reader eases his task by picking out the underlying structure from the often irrelevant supporting detail.
Exercises to develop the reading skills
1. Word-attack skills. Training in vocabulary These exercises are designed principally to deal with lexical/idiomatic difficulties.a. Training in the recognition of prefixes, suffixes. • use the correct prefix to make the negative forms of the following words: passable necessary honest • add the right suffix to the following words to form nouns: dark relation bound • turn the following verbs into nouns by adding the right suffix: degrade decompose discolour • underline the prefix in each of the following words and then write other words that contain the same prefix: retrace, extend, undergo, overestimate.
• underline the suffix in each of the following words and then write other words that contain the same suffix: biology, density, representative, helpful b. Training in word formation. • give the appropriate form of the following words as in the example: art artists science geology economics • complete the following table where possible: verb noun adjectiveirrigate ………….. ……………. …………. ………….. dry …………. drainage ……………. degrade ………….. ……………. …………. ………….. exploitable …………. erosion …………….. c. Training in word derivation. • underline the root in these words and then write other words which have the same root: autonomy telescope gravity d. Training in synonymy/antonymy.
• find words in the passage which mean the same as those given bellow: arable: arid: detrimental: • find words in the passage which mean the opposite of those given bellow: mature: upward: temporary: • give a word for each of the following sentences: 1. the process of becoming discoloured……… 2. plant or scatter seeds on a piece of ground... 3. young plant that has grown from a seed…... • match the words in column A with their definitions in column B 1. mychorriza a. a group of trees,
37
“Sustainable Management and Development of Mountainous and Island Areas”

small wood 2. pulp b. tube-like cells which make up wood
3. tracheids c. soft mass of wood fibre used for making paper 4. grove d. combination of root and fungi • rewrite the following sentences replacing the words in italics with word/expressions from the text which have the same meaning. 1. The single cells near the tip of each root increase their surface area by extending outwards from the root. 2. The seed starts growing when there is enough air or water and the temperature is high. 3. Sunlight provides the energy for the process of converting water from the soil and carbon dioxide from the air into sugars and other carbohydrates.2. Exercises designed to deal with structural problems. Training in Grammar Despite an enormous diversity of methodology over the years most textbooks have as their basis a grammatical syllabus. This is based on the principle that knowing the grammatical structure of a language is absolutely necessary for accurate communication in that language. We can not interpret sentences we can not structure but we could structure sentences we can not interpret eg. ‘The nome raths outgrabe’. Therefore the teaching of grammar cannot be avoided. In designing the exercises an attempt has been made to present grammar in the context of discourse. In the second year of study, the student who has already acquired / revised / practised basic grammatical structures and forms, is expected to consolidate this knowledge by experiencing how grammatical forms are used in meaningful contexts. Here is an example: Write the passive version of the following active sentences. Then combine the sentences you have written following the clues given. Check your answers with those of your partner to see if you agree. active: We can use a unit called soil profile to describe soils. passive: A unit called ………………………... active: When we wish to compare two soils, we examine their profiles. passive: ……………………………………… active: We can define a soil as having an individual profile. passive: A soil ………………………………..
Final sentence: A unit called soil profile….....to describe soils. So when we wish to compare two soils, their profiles………..; thus each soil………..as having an individual profile. This activity is basically a conversion exercise familiar to most teachers. However, by setting the forms to be converted in connected sentences, some of which have to be joined by conjunctions such as so and thus, and then asking students to talk about the outcome we avoid the lack of communicative purpose in conventional types of exercises. The same approach characterises the rest of the exercises. Some more examples: a. Identification of link words or lexical connectors. Words like therefore, however, consequently, moreover etc indicate what function a sentence is meant to fulfil ie. the word therefore is used at the beginning of a statement which follows logically from a previous statement. It is crucial for the students to understand which statements are meant to be illustrations, conclusions, enumerations etc and how such statements are related to each other. Types of exercises: • students are given a passage. The link words have been deleted but are given in a group at the end of the passage. Students have to place them in their correct positions. Alternatively, the words may not be given at all; students will have to fill in the blanks themselves. • students are asked to join sentences from a given passage by inserting the right connector; they are allowed various possibilities. eg. Such damage is only temporary. The plant will continue to grow. Since/as such damage is only temporary the plant will continue to grow. Such damage is only temporary. Therefore / consequently / thus the plant will continue to grow. As a follow up activity students are asked to provide their own examples – free choice of statement and link words. • students are given a partly filled table and have to fill the rest of the information. b. Cloze text procedure. Omission of certain words from a given passage. Students have to fill in the blanks of a text with the right word. The deletion of words may be systematic where all verbs or all adjectives from a text are deleted, or random where certain function words are deleted.. The deleted words may / may not be given to students depending on the level of
38
“Sustainable Management and Development of Mountainous and Island Areas”

the class, the difficulty of the material and the purpose of the exercise ie. if it is used as a teaching or a testing device. eg. The forests of the world are broadly classified as: 1……………or softwoods 2……………... hardwoods 3……………hardwoods 4………. conifers and hardwoods. One of the most striking types of……………..is the tropical rain forest. It has almost daily………….., the air is…………and the temperature high. The tropical rain forest is……………and consists of…………….species. c. Identifying like core or base sentence in a dense structure. Since density/complexity of sentences is achieved in different ways, students have to be made aware of the structural clues which will help them unravel it. Chunks of language are given where students will have to: • look for the relative pronouns who, which, what, that and say whether they are part of defining or non-defining relative clauses; the use of commas is the signifier here. • separate the main sentences from the subordinate ones. • try to locate the subject and main verb of the base sentence and then describe the modifiers. eg. Fungi, which attack the aerial parts of a crop such as the leaves, stems etc can be controlled by means of chemical substances which are known as fungicides. d. Exercises in understanding (ana)phoric reference. Students are given a text and the following questions where they have to circle the correct answer. 1. In sentence 5, such damage refers to:
a. cutting flowers off the plant. b. pruning the roots of the plant. c. both cutting the flowers and pruning the roots.
2. In sentence 8, it refers to a. the shoot system. b. the root of a plant.
3. In sentence 11, they refers to: a. the roots of plants b. plants such as sugar beet and carrots A more demanding task would be not to give the choices to the students but ask them to identify the references themselves. This type of exercise draws the students’ attention to the way pronouns, demonstratives and other
expressions like the one, the former, the latter etc are used to refer to something already mentioned in the text. It obliges them to scrutinize a passage carefully to assign the correct reference to anaphoric language items. These exercises may sometimes seem obvious but they are not always so. They are useful in that they show the learners how anaphoric devices work and so prepare them for other cases where identification of the reference is not so easy.
3. Exercises to prepare students for efficient overall comprehension. a. Previewing exercises. • the use of a table of contents or index to locate information with a time limit imposed. b. Skimming exercises. • by setting two or three pre-questions before a passage is read. e.g 1. Which are the various forms of soil erosion? 2. What are their causes? 3. Which techniques combat soil erosion? This is an extremely fruitful way of guiding students to look for the important points in a passage. • by asking students to pick out the key sentence(s) in a paragraph or passage.c. Scanning exercises – always set a time limit. • by asking students to run the eye quickly over a passage/text and find : 1. the three main organs of a tree. 2. the parts of a tree trunk. 3. the four ways in which land is degraded 4. the three types of tropical forests. d. Context exercises. • what is the meaning of the word ‘built up’ in the passage? Suggest a synonym. • write out one or two sentences containing the word ‘impassable’ to show that you understand what it means in this passage. • which of these words best fits the meaning of ‘light’ in line ten?
a. not dark b. a lamp c. to switch on
d. not heavy e. Anticipation exercises. • give students the title and the paragraph headings of a text they are going to read on ‘Glaciers as a water resource’ and ask them to write down: 1. what they know about the subject already. 2. what they think the text will say about it.
39
“Sustainable Management and Development of Mountainous and Island Areas”

• give students the title of a text, let us say ‘The Climate’ and ask them to give you the headings of paragraphs the text will probably include. Then they can compare their suggestions with the ones they see in the text. • give the topic sentence of a paragraph and ask students to give you the supporting details. f. Structuring exercises: Ask students to: • pick out the topic sentence in each paragraph of a text. Tell them that the topic sentence may be at the beginning, in the middle or even at the end of a paragraph. • give students sentences in the wrong order and ask them to arrange them in the correct order which corresponds to the stages of a process. They also have to add link words where necessary. e.g The sunlight provides the energy to bind CO2 and H2O together to form sugars and other carbohydrates. Photosynthesis is the process whereby the plant manufactures food for itself. Carbohydrates go to the growing points in the plant, enlarging tissues. Oxygen is given off as a gas. We may summarize this chemical process as follows:6CO2+6H2O C6H12O6+6O2This is combined with water from the soil in the presence of sunlight. Carbon dioxide is taken in through the leaf cells. • exercises in a diagrammatic form. Students are asked to: 1. Complete a diagram or a statistical table. 2. Make a flow-chart of the ideas presented in a passage. 3. Make tables from descriptions and vice versa. 4. Compose short paragraphs conveying the information presented in tabular form. Here the students’ attention is drawn to the various uses of language in communication in their field of discourse, since they are asked to define, make statements of process, classify, draw conclusions from observations, write descriptions etc. These exercises are intended to extend comprehension into productive written word. They usually involve points of grammar which may present continuing problems for students but they offer practice in performing acts of communication which are of particular importance in writing on scientific topics. In interpreting the data presented in tables both comprehension and composition skills are brought to use. g. Summary and note-taking exercises. • Give students a passage and ask them to reduce it to note form i.e.
Ask them to read it and find the topic sentences. Note them down. Read the passage a second time for supporting details. Note these down if they are important. Without looking at the passage again write a summary using the notes. A translation of the summary might be asked for to ensure a better understanding of the text. h. Comprehension questions There are two major considerations here: the form of the questions and their aim. Form of questions: Multiple choice, True/False, Yes/No, or Open Ended questions. Multiple choice questions are preferred by many for various purposes but mainly because they save time in answering and marking. However, they only test students’ recognition skills not production ones. The other types of questions encourage the student to think carefully about what he reads and pay close attention to what is actually expressed in the passage before he gives his answers. The students should always be required to justify their answers by providing evidence in the text that has led them to decide what is right/wrong. Thus, they get trained in recognizing what they must notice in a given passage and how they must reason in order to arrive at the correct answer. This technique has proved very effective because it increases correctness of answers and so it boosts their morale. It is also helpful in that, once students realize that their understanding is going to be systematically checked in this way they tend to read more attentively for meaning and treat their reading not just as a language exercise for the English class but as a technique for acquiring information that will be useful in their field of study.Examples of questions: True/False: 1. Dead material found on the forest floor is called humus . Yes/No 2. Is the soil a non renewable resource? why? Open-ended: 3. What do you know about pines? Aim of questions: Four categories of comprehension questions are distinguised: direct reference, inference, supposition and evaluation. Direct reference are the most commonly used questions and the easiest to answer because the required evidence is readily available to the students, as it is explicitly in the text.
40
“Sustainable Management and Development of Mountainous and Island Areas”

Inference questions are a little more demanding in that they require the student to recover information which is implied rather than explicitly stated in the text, and to trace the way in which what is expressed in one sentence is related to what is expressed or implied in another. In other words, the relationship between sentences has to be taken account of before an answer is given. Evaluation questions involve the opinion of the student and his judgement of what is contained in the text. Supposition questions tend to direct the student outside the confines of the immediate text by asking his free comment(s) on a given situation. It is important that all these types of questions be used if we want to develop truly efficient reading. Obviously the type of question will vary with the level of the class, but there is a place for inference questions quite early on. Without them the students will overlook the inter-relatedness, the total coherence of a text, which is the one of the chief characteristics of the written as opposed to the spoken language. Evaluation and supposition questions, closely related to one another are equally important to the students as they help them develop an ability for critical reading. i. Speed reading. Whenever speed reading exercises are carried through systematically speed can at least be doubled without a loss of comprehension. The fact that a student keeps a record of his own progress is enormously motivating. I use two basic techniques:
a. Read this passage as quickly as you can. Note down your time and then go on to answer the questions. Do not look back at the passage.
b. You have five minutes to read this passage. When you finish, answer the questions without reference to the passage.
In both cases the passage would normally be followed by multiple choice questions. j. Intensive vs extensive reading. In intensive reading a text/passage is exploited in detail by doing a number of the above mentioned exercises on grammar, vocabulary, syntax and comprehension. In extensive reading the students are exposed to more texts/passages of similar or slightly more difficult material and are asked to read for general information. Exercises that facilitate practice in speaking, such as problem solving activities, are given to students to discuss their suggestions. In small groups they discuss their outcome, compare each others’ answers, comment on the various
solutions and come to the best proposal. They may be asked to give the teacher a written feedback of their discussion.
4. General considerations. While involving the students in the above mentioned activities I have found the following very useful. • Recycling of material: repetition of items already taught helps students retain information. • Use of mother tongue: it breaks the barrier of stress and helps their understanding of special terms. • Move away from a Teacher-centred towards a Student-centred approach by asking students to: 1. work in pairs/groups in class and at home to produce a small project on taught material. 2. correct each other’s written work, the mistakes of which have only been underlined by the teacher; then compare corrections. 3. do their own research on a topic they prefer; bring it to class and do their own presentation on it. The rest of the class are asked to comment on/correct the presented work. Pair/group work has proved particularly useful as it:1. reduces teacher talking time and increases student talking time.2. weans students away from the teacher; they learn to expect help from each other. The teacher should not be the only source of reference. 3. takes the pressure away from students who work at their own pace and do not suffer from fear of making mistakes. 4. facilitates a more natural, closer to reality interaction between students who are likely to have great support from their peers. 5. leaves space for individual differences. • negotiating with students the kind of work I want to do in class and the amount of work they have to do at home. • working in a friendly, relaxed atmosphere.
5. What is accomplished at the end of the course.Students have acquired quite a lot of basic knowledge on Forestry topics. Most importantly they have learned to work on a task quickly and productively by relying on themselves and on the group dynamics of the class. They have become more self confident and more active participants in the lesson knowing how and when to employ the learned techniques to their own benefit. In other words, they have become more efficient learners.
41
“Sustainable Management and Development of Mountainous and Island Areas”
6. Future expectations A continual improvement in all directions is always desirable. Enrichment of the facilities of the department would be very welcome. The use of videos, OHPs, recorded material and visual illustrations would certainly help students assimilate and retain new knowledge better. Small excursions to nearby forests to see in reality what is read in books would also be an asset to the work done. However, the lessons themselves would be aided by a better and more active participation of students. Greater involvement of students in the presentation of new material in class would make the lessons more varied and challenging, but above all it would make them more responsible towards the learning process and their future careers.
7.Notes* The eye, we know, does not move smoothly over a line of print, but progresses in a series of jerky movements, called saccadic movements, alternating with pauses or fixations – from three to five per second– during which the printed material is seen clearly. While the eyes are in movement clear vision is not possible. Movement is from left to right, except for regressions – right to left movements to permit re-reading – and for the return sweep which carries the eye to the next line. Eye-span is what can effectively be seen during a fixation. It is stated that the average reader is capable of seeing in one fixation four related words totalling approximately twenty-four characters of type, but, in fact, identifies less than ten characters. All eye movement studies agree that the more efficient the reader the wider is his eye-span, the fewer and shorter his fixations, the fewer also his regressions, and the more regular his eye movements.
** To help students avoid regressions I advise them to refuse to regress for any reason at all by using a sheet of paper, a postcard or their hand as a physical barrier against regressions.
8.References
[1] Anagnostou P. Useful notes and exercises on the most commonly used chapters of the English Grammar. Thessaloniki: Yahoudis Publications; 2003. [2] Grellet F. Developing Reading Skills. Cambridge University Press; 1988
[3] Hutchinson T., Waters A. English for Specific Purposes. Cambridge University Press; 1989 [4] Johnson K., Morrow K. Communication in the Classroom. Longman; 1981 [5] Macmillan V. Efficiency in Reading. ETIC Occassional Paper no.6 [6] McDonough S. Psychology in Foreign Language Teaching. Allen & Andwin London; 1986 [7] Mountford A. English in Agriculture. Oxford University press; 1994. [8] Tsaluhidu-Lioliu R.I. English through Forestry. Thessaloniki: University Studio Press; 1994. [9] Widdowson H.G. Teaching Language as Communication. Oxford University Press; 1979 [10] Yalden J. The Communicative Syllabus. Prentice-Hall International; 1987
42
“Sustainable Management and Development of Mountainous and Island Areas”

Networks and Communication Technologies within Environmental Studies in Higher Education
Zacharoula S. Andreopoulou1, Sophia E. Vassiliadou2
1Lecturer, Lab. of Forest Informatics, School of Forestry and Natural Environment, Aristotle University of Thessaloniki, P.O. Box 247, 54124, Thessaloniki, Greece
2Forest Engineer MSc, PhD Candidate, Lab. of Forest Informatics, School of Forestry and Natural Environment, Aristotle University of Thessaloniki, P.O. Box 247, 54124,
Thessaloniki, Greece [email protected], [email protected]
Abstract. Terms like, Forest Informatics or Eco-informatics refer to the application of the subject of informatics to environmental sciences. Educational and training aspects in environmental studies should emphasize the use of modern information tools such as networks and communication technologies. The purpose of this paper is to determine the current and projected needs for education in these sectors in environmental studies and suggest recommendations for review processes in syllabus contents. The results show that the interest of the students is tremendous, and an effortless approach in e-services is requested. Furthermore they believe that computer literacy is necessary for being effective in their future work.
Keywords. Communication technology, Environmental studies, Higher education, networks
1. Introduction
Information technologies contribute a great deal to environmental disciplines via the integration of information and making data and knowledge available to a broad audience. It is widely accepted that ICT (Information and Communication Technologies) is transforming all aspects of society from education to civic involvement, employment to leisure [10, 11]. The future is undisputedly ‘‘digital’’ and concern has been expressed on the effects of digital restructuring in deepening economic, political and social inequalities [5]. The term communication technologies is used to describe the development of the necessary technology for the distribution of information over a network [12].
A computer network is established when different computers are connected and communicate with each other [2], [6]. New technologies have a massive power and potential to impact on the lives of the average citizen, and e-services can dramatically change their lives on a daily basis. The impact of e-services on education and training is merely beginning to be acknowledged. Internet and web based applications are considered to be a major force for the improvement of education and particularly as a way to extend the reach of education beyond the physical classroom setting.
Computer literacy has become a necessity in our society and computer software systems lie at the heart of all aspects in our modern society and specifically as a powerful tool available to enhance and accelerate various administration tasks [4, 7]. In Greece, the GuNet-Greek Universities Network is a running project for the design, implementation and function of nodes for the connection over a network of all the academic units of higher education in Greece. It comprises both Higher Educational Institutes and Technological Educational Institutes, in order to enable their direct multimedia international communication via Internet [8].
1.1. Forest informatics and ICTs effectiveness
Forest Informatics is a sector of the Informatics discipline that is engaged in the application of the subject of informatics to forestry and natural environment sciences and practice. Forest and environmental science, due to its multidisciplinary nature, requires the adoption of powerful technological tools, such as network services and tools, in order to facilitate the communication flow and promote the exploitation and diffusion of information
43
“Sustainable Management and Development of Mountainous and Island Areas”

concerning natural resources and ecosystems. Educational and training aspects of forestry and environmental science programs should emphasize the use of modern information tools such as networks and communication technologies [1].
Students in the first year of their studies are adequately informed as it concerns new technology courses offered along their studies. During the five years of study, three obligatory modules concerning informatics are being taught and there are three more optional in the departmental curriculum. The obligatory courses include theoretical information technology, networks and programming languages. Furthermore, students can choose among optional courses about forest applications, computer networks and web applications and multimedia development. Networks and their applications provide the means to cover the instructional gap whilst the tutor and the trainee are in different locations and support their effort providing an environment for new educational settings [9, 3]. New technologies cannot replace the classroom, but they allow instructors and trainees to have access to vast information and knowledge resources.
The purpose of this paper is to determine the current and projected needs for education in courses on networks and communication technologies in environmental studies in higher education in Greece and suggest recommendations for review processes in syllabus contents.
2. Methods and Materials
The research for the collection of the data was performed in March 2005. The method used for this paper was the completion of questionnaires. Questionnaires were given to the first-year students of the Department of Forestry and Natural Environment. The research takes place every year in the spring semester of the school year.
A questionnaire with questions of close and open type was completed by each of the students. The students completed the questionnaires during the course entitled “Introduction in Forest Informatics”, available in the first year of their studies. The questionnaires were delivered and collected by hand, at the time of the collection, ensuring the maximum response level. These students will be the future professionals in the environmental private and public sector.
Quantitative analysis was performed for the gathered data through the statistical package of Microsoft Excel 2003™ in order to identify, exploit and evaluate the available information.
3. Results
The questionnaires included 24 questions, divided in three groups. The first group aims at retrieving information from students about computer usage in general, the next set of questions focuses in web exploitation, and the last group of questions targets in ICT’s use within their education in the current curriculum and the prospects of education in network and communication technologies, concerning their projected needs and preferences.
3.1. General computer usage
The findings of the research showed that 68% of the students in the first year of their studies already have purchased a personal computer for their needs. However, an additional 3% indicates that has access to a computer which they do not own, which makes a total of 71% of the students in the first year of their studies in forestry with access to a computer. Hence, a remaining 29% of the students have no access to computers which is almost three out of ten students -without computer access except of that at the University laboratories.
The students had to select among several reasons they use their computer for and finally; to indicate the first and foremost use. The findings show that as it concerns the main use of their computer, the greater percentage, 29% of the students, mainly use the personal computer they have access to, for entertainment purposes, playing pc games, watching DVDs, which is almost three out of ten students in the first year. The second rated dominating use of the computer is for listening to music in mp3 type, as 27% of the students selected that use. The third selected option with 23% is the use for assignments. In particular, they mainly use a word processor software to compose their essays or a spreadsheet to process numerical data. Finally, their fourth selection, 21% use the computer mainly to have access to the web and for browsing on the internet.
44
“Sustainable Management and Development of Mountainous and Island Areas”
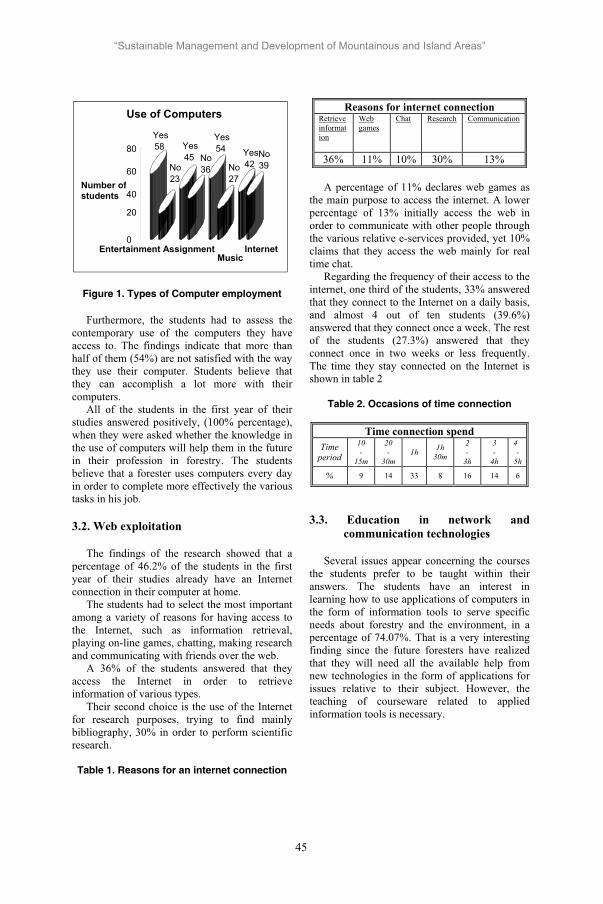
Figure 1. Types of Computer employment
Furthermore, the students had to assess the contemporary use of the computers they have access to. The findings indicate that more than half of them (54%) are not satisfied with the way they use their computer. Students believe that they can accomplish a lot more with their computers.
All of the students in the first year of their studies answered positively, (100% percentage), when they were asked whether the knowledge in the use of computers will help them in the future in their profession in forestry. The students believe that a forester uses computers every day in order to complete more effectively the various tasks in his job.
3.2. Web exploitation
The findings of the research showed that a percentage of 46.2% of the students in the first year of their studies already have an Internet connection in their computer at home.
The students had to select the most important among a variety of reasons for having access to the Internet, such as information retrieval, playing on-line games, chatting, making research and communicating with friends over the web.
A 36% of the students answered that they access the Internet in order to retrieve information of various types.
Their second choice is the use of the Internet for research purposes, trying to find mainly bibliography, 30% in order to perform scientific research.
Table 1. Reasons for an internet connection
Reasons for internet connection Retrieveinformation
Web games
Chat Research Communication
36% 11% 10% 30% 13%
A percentage of 11% declares web games as the main purpose to access the internet. A lower percentage of 13% initially access the web in order to communicate with other people through the various relative e-services provided, yet 10% claims that they access the web mainly for real time chat.
Regarding the frequency of their access to the internet, one third of the students, 33% answered that they connect to the Internet on a daily basis, and almost 4 out of ten students (39.6%) answered that they connect once a week. The rest of the students (27.3%) answered that they connect once in two weeks or less frequently. The time they stay connected on the Internet is shown in table 2
Table 2. Occasions of time connection
Time connection spend Time
period10-
15m
20-
30m1h 1h
30m
2-
3h
3-
4h
4-
5h
% 9 14 33 8 16 14 6
3.3. Education in network and communication technologies
Several issues appear concerning the courses the students prefer to be taught within their answers. The students have an interest in learning how to use applications of computers in the form of information tools to serve specific needs about forestry and the environment, in a percentage of 74.07%. That is a very interesting finding since the future foresters have realized that they will need all the available help from new technologies in the form of applications for issues relative to their subject. However, the teaching of courseware related to applied information tools is necessary.
Yes58
No23
Yes45 No
36
Yes54
No27
Yes42
No39
0
20
40
60
80
Number ofstudents
Entertainment AssignmentMusic
Internet
Use of Computers
45
“Sustainable Management and Development of Mountainous and Island Areas”

Figure 2. Students’ interest in courses
Another issue with special interest for the students is to learn about network services (39.51%) and mainly to learn how to properly use multimedia applications (55.56%). The findings above indicated that a significant percentage of students are already familiar with network services and the use of the Internet. Then again, their preference has to do with the demand for updated courseware.
On the other hand, they are also interested in learning to operate a text processor, a statistical package (45.68%) as a tool in order to enhance data analysis or a data base software package (49.58%) in order to properly organize and maintain their data.
A significant percentage of students (44.44%) indicate their interest in learning more about operational systems. It is an issue concerning computer technology in a theoretical aspect although this is already provided in the corresponding course. Programming with new computer languages, such as C++, Java or Visual Basic, in order to enhance their capability to successfully create applications is another interesting issue for the students (39.51%).
Among students’ preferences appear issues such as project management (29.63%), which is an interesting and useful issue for the materialization of projects.
Lower percentages among the preferences of the students share the course for telematic services (20.99%), such as distance learning issues or tele-working. In Greece, distant education is in its primary steps and students in the first year of their studies in the university do
not cope with the idea of distant learning, since they have just entered their student life. However, in subsequent semesters they get more interested in such issues because they can clearly understand the advantages in practice.
4. Conclusions
Although this study was limited to the first year students, the participants represent a dynamic part of the future professionals. This is made even clearer by their demand to be taught more applications/programs concerning their future employment. Findings in this research indicate their preference in the provided obligatory and optional courses in their current curriculum that allow the students to obtain extended knowledge in new technologies within the issues of networks, network services and applications and communication issues. Furthermore, students make indications for the introduction of new more contemporary thematic units and they believe that they should acquire the most appropriate knowledge in computers since computer literacy is a pre-requisite to their future work in the area of the environment.
First year students are familiar with the on going changes in technology and they use network services mainly for the retrieval of information, both for personal and scientific purposes and also for communication purposes, but in lower percentages. The interest of the students for the Web is tremendous, and the need for an effortless approach in the cyber net is requested. E-Mail via the internet is faster, cheaper and quicker to conventional postal mail and compared to retrieve information from books or other sources of information, the World Wide Web is a more convenient means of searching for information [10].
It is, however, very important to invest on the proper education of the future professionals in the teaching of networks and communication technologies within higher education in environmental studies. For some people non-use of ICT is primarily bound up with structural circumstances that prevent them from otherwise making use of ICT’s, which are relevant and useful to their lives [11].
ICT is transforming all aspects of society while e-services are available in all sectors. In the sensitive area of the environment, the use of innovations and the advantages of ICT can provide in daily basis a more stable background for the confrontation of the ever arising
0,0010,0020,0030,0040,0050,0060,0070,0080,0090,00
100,00
Students Interest (%)
Intro
duct
ion
in F
ores
tTh
eore
tical
Info
rmat
ics
Ope
ratin
g Sy
stem
sPr
ogra
mm
ing
in C
++D
atab
ases
Com
pute
r Net
wor
ksPr
ojec
t man
agem
ent
Tele
mat
ic S
ervi
ces
Exce
llAc
cess
Mul
timed
ia a
pplic
atio
nsFo
rest
y In
form
atic
s
Courses
Interest in Courses
46
“Sustainable Management and Development of Mountainous and Island Areas”
problems. E-Services models have been recently the focus of research given the huge impact of ICTs. Governments around the world are increasingly interested in the potential for delivering government services on the World Wide Web. Introduction of E-government in the public sector comprises infrastructure, hardware, local intranets, and computer literate personnel.
Additionally there is also a necessity for learning programming languages such as C++ or even Java, Visual Basic in support of developing applications within environmental issues.
All the above provide evidence to suggest new courses on ICT’s within environmental studies in higher education level and propose recommendations for review processes in syllabus contents.
However, the criteria for such an adjustment should be based on the curriculum of each institution, the available infrastructure and the quality of educational interaction among the faculty and the students, along with the dynamic evolution of the profession, in order to help in the building of knowledge in compound ways.
5. References
[1] Andreopoulou Z, Iliadis L, Lefakis P, Papastavrou A. Computer analysis and Clustering Graduate Students of the Department of Forestry and Natural Environment According to Computer Literacy. Proceedings of the International conference of NAGREF, on Forest Research: a challenge for an Integrated European approach; Thessaloniki; 2001. p. 755-758
[2] Balston, D.M. The pan-European System: GSM. Artech House Boston; 1993.
[3] Baron G.L, Bruillard, E. Information and communication technology: models of evaluation in France. Evaluation and program planning, 2003; (26): 177-184.
[4] Capron H. L. Computers Tools for an Information Age. Addison Welsey; 2000.
[5] Hull, B. ICT and social exclusion: The role of libraries. Telematics and informatics, 2003; (20):131-142
[6] Laudon K, Laudon J. Management Information Systems. Prentice-Hall International; 2002.
[7] McLeod R. Jr. Management Information Systems. Prentice-Hall International; 1999
[8] Papachristofis K. Contemporary Telecommunications Networks. New technology editions. Athens; 2001
[9] Porter L. R. Creating the Virtual Classroom: Distance Learning with the Internet. Wiley Computer Publishing. John Wiley and Sons, Inc; 1997.
[10] Sealy W.U. Empowering Development through E-Governance: Creating Smart Communities in Small Island States. Intl. Inform. & Libr. Rev; 2003; (35): 335-358
[11] Selwyn N. Apart from technology: understanding people’s non-use of information and communication technologies in everyday life. Technology in Society; 2003; (25): 99–116
[12] Walrand J. Communication networks. Papasotiriou Editions, Athens; 1997
47
“Sustainable Management and Development of Mountainous and Island Areas”

Resurgence of traditional activities and local development: The mulberry plantations and sericulture in the prefecture of Evros
Garyfallos Arabatzis1, Serafeim Polyzos2 and Stavros Tsiantikoudis1
1. Democritus University of Thrace, Department of Forestry and Management of the Environment and Natural Resources, 68200, Orestiada, email: [email protected]
2. University of Thessaly, Department of Planning and Regional Development, 38334, Volos, email: [email protected]
Abstract. In the last years, the future of sericulture appears to be promising since both the Greek governments and the European Union have put in place certain policies of financial support for establishing mulberry plantations as well as for silkworms rearing and improvement of processing. In the context of these policies, this research investigates the resurgence of sericulture, a traditional economic activity, in the area of Soufli in the Greek prefecture of Evros. The study also investigates the individual and social characteristics of mulberry investors/cultivators. The above aims are pursuit by using a questionnaire survey. The data are analyzed by using the SPSS V.11.0 program. The research concludes that the majority of mulberry investors/cultivators believe that they make a good investment in planting mulberry trees, while at the same time they connect the particular agricultural activity with the development of the sericulture.
1. Introduction
The last two decades in the European Union (EU), despite the fact of high subsidies directed to farmers as well as wider programs for assisting countryside development, the less developed areas continue to face significant problems such as low incomes, the demographic ageing, the immigration and relative isolation from the major centers of economic activities [19], [22], [28].
Up to recently, the production of agricultural goods was considered to be the basic economic activity of these areas, because agriculture constituted the "motive lever" of their development. The need for reacting to the total crisis of the agricultural productive system, combined with the new "environment" that was progressively shaped in the European rural space, led to the formulation and establishment of new policies. These policies aim at contributing to the formation of a new perception
for the development of rural space [2], [16]. Thus, during the last years in rural areas we observe several activities concerning new products and services that are often based on or revive traditional know-how and practices. This is attempted within the context of the EU policies for the differentiation and reinforcement of local economies. In addition, the importance of activities that are not directly related to the production of food-products has increased [4]. Examples of such activities include: (a) the development of special and alternative forms of tourism (b) the exploitation of forest products (c) the agricultural products of special quality, as they are of protected denomination of origin and protected geographical indication and (d) the discrete product of women cooperatives. All these constitute only a few examples of the new emerging dynamics in the rural space [2], [7], [15], [27].
In the United Kingdom farmers develop activities parallel to the agriculture, participate in enterprises not relevant to the agricultural sector and rent properties and buildings to other not agricultural enterprises [4]. Moreover, the reductions in agricultural subsidies, combined with changed trends in the demand of rural products, have intensified pressures on the farmers to extend their activities in order to survive. Agrotourism constitutes a very frequent choice of women-farmers in the mountainous areas of North England. In Germany, the differentiation of rural activities, especially those related to agrotourism and to the direct promotion of products, appears to have led to an increase in the employment of women [20].
The exploitation of local know-how appears to be a structural element of strategies for the promotion of local products and services and for the reinforcement of competitiveness of local economies particularly in the less developed areas, like the prefecture of Evros and specifically the area of Soufli [1].
In the beginning of the 20th century, sericulture was one of the most productive
48
“Sustainable Management and Development of Mountainous and Island Areas”
sectors for the prefecture of Evros and, in particular, the area of Soufli. Shortly after the Greek-Turkey war of 1918-1922, the determination of new borders had as a result an important part of agricultural land, mainly planted with mulberry trees, to pass to Turkish administration. In addition, the international economic crisis that followed, the World War II and the appearance of synthetic fibers in the '60s, led the particular activity to decline. In the '70s, the land redistribution in the area Soufli led to land use changes, through the establishment of new, more profitable cultivations than the mulberry plantations. Thus, the production continued decreasing until the late '80 [8], [18].
During the last years an increase in visitors’ numbers in the area of Soufli was observed as well as an increase in demand for silk clothes. The municipality of Soufli and the local Municipal Sericulture and Silk Processing Corporation try to promote and advertise the city of Soufli as the "city of silk", while the local businessmen are constantly encouraged to continue their silk-related activities. At the same time, an important effort for resurging and developing mulberry plantations and sericulture is observed, as most of the farmers consider these activities to be additional to their primary preoccupations. However, yielding continues to offer a satisfactory income. The absolute number of sericulturists decreases from 89 individuals in 1990 (with 669 silkworm boxes) to 50 individuals in 1995 (but with 970 boxes) and then to 15 individuals in 2000 (with 380 boxes). In 2001 the number of sericulturists increases to reach 54 individuals (1208 boxes) and in 2002 the number is further expanded to 61 individuals (1616 boxes). These late increasing trends are related to the involvement in sericulture of the repatriated Greek-Pont's inhabitants from the former Soviet Union and the implementation of the European Union regulations (2080/92 and 1257/99) concerning the afforestation of agricultural land [2].
The EU regulation 1257/99 for the rural development, which was introduced after the 1999 revision of CAP, represents an effort to co-ordinate and to integrate the individual policies for the rural areas. In particular, it includes and integrates nine different policy axes that in the past were spread in different regulations: (a) Investments in the farms, (b) young farmers, (c) training (d) early retirement, (e) less favored
areas, (f) agro-environmental measures (g) improvement of sale of rural products (h) afforestation of agricultural land and (i) promotion of adaptation and development of rural areas [5].
In particular, article 31 of the above regulation makes certain provisions for subsidies for the afforestation of agricultural land. In the context of this article, there are arrangements for financial support covering part of the expenses for afforesting agricultural land as well as maintaining the established forests. Financial support is also provided for as a compensation for income losses associated with opportunity costs [5]. Mulberry tree is one of the eligible species for the establishment of forest plantations in agricultural land.
The mulberry species (Morus alba .nigra) have been extensively cultivated (Southern Europe, India) mainly for using their leaves in silkworms rearing [3] and for feeding rural animals [21]. It is a native floral species of China and in the East Asia. In Greece it was imported in the 12th century for silkworm rearing use and for its edible fruit [24]. In particular, in the prefecture of Evros the main use of mulberry has been the production of leaves for silkworm rearing, in order to produce silk for cloth and textile manufacturing.
This paper aims at investigating the contribution of mulberry plantations to the sericulture development in the prefecture of Evros, in the light of the regulation 1257/99, article 31 of the European Union Council. This article refers to the "afforestation of agricultural land and to the direction of economic development for the less favored areas". We also investigate the individual and social characteristics of mulberry investors/cultivators.
2. Research area - Methodology of research
The prefecture of Evros constitutes the northeastern prefecture of Greece (Figure 1). It covers an area of some 4.242 Km2 and it has a population of 144.023 residents according to the National Census of the year 2001. The plain areas cover 60.7% of the total land while the agricultural crops cover 35.45% of the plain areas [23].
49
“Sustainable Management and Development of Mountainous and Island Areas”

Figure 1. The position of the prefecture Evros
In the prefecture of Evros, the primary sector of the economy is relatively developed and stands for 33% of the prefecture’s total economy (graph 1). Compared to the national average as well as to the regional one of the Thrace region, the above percentage seems particularly high. This has a two-fold interpretation. On the one hand, it constitutes a clear indication of the importance of the primary sector to the
development of the local economy mainly due to the existence of important agricultural areas, and on the other hand, it indicates the high dependence of Evros economy from the primary sector. The prefecture accounts for 1.09% of the country’s GDP and with regard to prosperity levels it is classified in the 20th position amongst the 51 prefectures of the country [25].
Graph 1. The composition of the GDP in Greece, Region of E. Macedonia and Thrace and the prefecture Evros for the years 1995-2000
0
20
40
60
80
Primary % 33 25 12
Secondary % 24 30 26
Tertiary % 43 45 62
EvrosRegion of E.
Macedonia and Greece
50
“Sustainable Management and Development of Mountainous and Island Areas”

The reason, for choosing the prefecture of Evros as the case study of this research, is because of the extensive areas of mulberry cultivation, particularly in the area of Soufli. The production of silk in the area represents almost 2/3 of the total production in Greece [23].
The necessary data were collected by using questionnaires. The survey questionnaire was planned and constructed specifically for gathering data concerning the above mentioned main aim of the research and included closed-type questions and questions with a number of limited predetermined answers [26], [6]. More specifically, the questions that we included in the questionnaire were focused on individual and social characteristics of the investors/cultivators, the structural characteristics of their farm and their attitude with regards to the forest plantations and the role of mulberry plantations in the development of sericulture.
The research was carried out between January and March 2004. The methodology of personal interviews by the researchers was employed for filling in the questionnaires. The interview were held either at the place of residence or at the place of work of investors/cultivators. The sample that was taken covered the already approved cases for subsidiary aid from the regulation 1257/99 article 31. These individuals were traced by using the official records from the department of Forest Services of Alexandroupoli, Soufli and Didymoteicho. As it was tracked down by using the records, overall 107 individuals were approved to get a subsidy for establishing mulberry plantations in the research area.
On the whole, some 94 valid questionnaires were collected from (a) farmers and (b) other landowners whose principal preoccupation lay outside of the agricultural sector. The valid questionnaires represent 87.8% of the total number of individuals approved for getting a subsidy by the regulation for establishing mulberry plantations. The remainder percentage includes individuals, for whom it was difficult to find the place of their location. Data processing was carried out by using the statistical program SPSS v. 11.0, and in particular the methodologies of descriptive statistics.
3. The implementation of regulation 1257/99 article 31 in the prefecture of Evros
As it derives from the investigation of investors’ relative files held by the Forest Services of Alexandroupoli, Soufli and Didymoteicho, up to the year 2004, the mulberry investors/cultivators summed up to a number 107 individuals out of a total of 905 investors of the EU regulation (11.8%) These investors/cultivators planted about 355.5 ha on a total of 2,225.8 ha (16 %). 52 individual out of 107 have their mulberry plantations in the area under the responsibility of Soufli Forest Service of, 50 in the area under the responsibility of Didymoteicho Forest Service and 5 out of 107 have their plantations in the area under the responsibility of Alexandroupoli Forest Service. The black locust (Robinia pseudoacacia L)plantations cover the great majority (about 75%) of the areas that were planted in the prefecture of Evros under the provisions of the above EU regulation. It is worth mentioning that during the implementation period (namely from 1994 to 2002) of the previous EU afforestation regulation, 2080/92, the mulberry investors/cultivators were hardly 10 (about 2% of the investors in reforestation) in the whole of the prefecture of Evros (being 7 in Didymoteicho accounting 18.1 ha, 3 in Soufli accounting for 15.85 ha and none in Alexandroupoli). Their planted area was of some 33.95 ha accounting almost 1.2 % of the total planted area in Evros. In the same period the figures for the afforestation program as a whole included 526 investors who planted some 2,228.8 ha [10], [12], [14].
In conclusion, under the provisions of the new regulation the investors appear to have increased at about 50% in relation to the number of investors under the previous regulation 2080/92 regime, and the number of mulberry investors/cultivators have increased 12 times in comparison to the number of the previous afforestation period. This fact shows the intense interest of an increasing number of farmers – as well as residents, that are not farmers - to planting the particular species. The above developments have been taking place for some time in the prefecture of Evros that has a strong tradition in sericulture (silkworm rearing which is exclusively nourished with mulberry leave) an
51
“Sustainable Management and Development of Mountainous and Island Areas”

activity that in the past used to be the most dynamic sector of the prefecture’s economy.
4. Results
The results of the statistical analysis of the data show that men constitute the majority of investors. In a total of 94 mulberry investors/cultivators the men are 50 or 53.2%, while the women are 44 or 46.8%. The average investor's age is 48 years old. The classification of investors in age-groups at the span of the decade, results in 9.6% of individuals being below the age of 35, 28.7% being between 36 and 45 years old, and precisely the same percentage being in the age-group of 46 to 55 years old. The remaining 33% represents the individuals that are above of the age 55 (Table
1). The youngest investor/cultivator is at the age of 25 and it is a woman, while the oldest investor is at the age of 67 and it is also a woman. Each investor/cultivator has an average of 2 children. They usually are 1 boy and 1 girl. Every family has an average of 3.3 members. 18.7 years is the average period of involvement in agricultural activities as a main profession. The average annual gross agricultural income is about 13,350€. 26 individuals (27.6%) declare incomes that exceed the mean, while the remainder 72.4% has lower income. 13.8% of investors/cultivators consider their involvement in agricultural activities as a secondary profession. They earn about 3,250€ annually from their agricultural preoccupations and about 7,680 € from non agricultural activities.
Table 1. Distribution of investors/cultivators in age-groups Age-groups (years) Number of investors/cultivators Percentage (%)
25 – 35 9 9.6 36 – 45 27 28.7 46 – 55 27 28.7
> 55 31 33 Total 94 100
The overwhelming majority of investors/cultivators, e.g. 81 out of 94 individuals or 86.2 %, declared as their main profession the agriculture. This fact shows the strong rural character of the prefecture of Evros, as well as how much important role agriculture plays in the configuration of its principal financial and social elements. Only 3 individuals stated that they are civil servants (3.2 %), 5 private employees (5.3 %) and the remaining 5 freelance professionals–namely tradesmen, plumbers, electricians- (5.3%). It is remarkable that in the mulberry investors/cultivators included in the regulation there were not any freelance professional scientists, such as doctors, lawyers, engineers and geotechnicals (Table 2).
With regard to the investors/cultivators educational level, the educational level rather follows the general tendencies of the educational level of farmers. Thus, 51 out of 94 individuals are primary school graduates (54.3 %). Among them an individual that has not finished the primary school is also included. The graduates of lyceum are 20.2 % and those who have completed obligatory education i.e. the graduates of high school are 13.8 %. The graduates of technical education are 4.3 % and the University graduates are also 4.3 %, while the graduates of Technological Higher Education Institutes are 4 in absolute number or 3.2% (Table 3).
Table 2: Distribution of investors /cultivators depending on their profession Profession Number of investors/cultivators Percentage (%) Farmers 81 86.2
Civil servants 3 3.2 Private Employees 5 5.3
Freelance Professionals (tradesmen, craftsmen) 5 5.3
Freelance Professionals - Scientists 0 0
Total 94 100
52
“Sustainable Management and Development of Mountainous and Island Areas”

Table 3: Distribution of investors/cultivators basing on their educational level Educational level Number of investors of/cultivators Percentage (%)
They have not finished primary school 1 1.1
Primary school 50 53.2 Technical school 4 4.3
High school 13 13.8 Lyceum 19 20.2
Technological Higher Education Institute 3 3.2
University 4 4.3 Total 94 100
Thus, we observe that almost half of the investors/cultivators are primary school graduates. In general such educational composition is to a large extent close to the average educational level of farmers on a country level. However, despite the low educational level of the majority of investors/cultivators, 49% of them have participated in training seminars of a rural content.
With regard to the question of how often they listen to or watch (radio or television) programs of rural content, 24.5% stated very often, 28.7% stated often, 37.2% answered sometimes, while the remaining 9.6% stated “from seldom to never”. Despite the fact that the nature of rural activity requires that the farmers are most of the time in the countryside, 53.2% answered that they watched very often programs of rural content. This shows that the educational level does not play a particular role in the ability of the interviewees to watch and understand such radio or television programs.
On the contrary, from the answers on the question about how often the investors/cultivators read articles of rural content, we see that 1 every 4 individuals (26.6%) seldom dedicates time for reading such articles, 22.3% read occasionally, 14.9% read often, 19.1% very often, while the remaining 17.0% have never read such articles.
53.2% of the investors/cultivators do not see their children to get involved in the agriculture either as a main or as a secondary profession. The decision not to get involved in agriculture, taken by the children is also strongly supported by their parents, because of the difficulties that the later face in contacting this profession. 23.4% of the individuals hold the view that at least one of their children will take over and get involved with agriculture, either as primary or as secondary employment. 14.9% of the individuals answered that they did not still know whether
their children would get involved with agriculture, because their children were very young (under the age of 15), while the rest 8.5% were individuals of young age, who were either single or, if they were married, had not yet acquired children.
The overwhelming majority of investors/cultivators (roughly 80%) originate from a rural family, while the rest 20% declared that their parents were not farmers. About half of the mulberry investors/cultivators (51.1%), had bought land for agricultural-productive aims, while 48.9% did not have.
We frequently observe that a lot of investors/cultivators, apart from the land that they possess, they also hire additional land. Thus, 65% of the individuals hired in the past and continue hiring agricultural land, for the purpose of dealing with the culture of forest trees and in particular with mulberry plantations while 35% of the individuals prefer to deal exclusively with their own agricultural land.
With regard to the question about the value of their land 55.4% of the mulberry investors/cultivators answer that in the last 5 years the value of irrigated agricultural areas has been decreased, and that the prospects are to decrease further. 10.6% answer that the value of irrigated agricultural areas has increased referring mainly in agricultural areas in the lowlands, while 34% declare that in the last 5 years the value of irrigated agricultural areas remains constant.
In semi-mountainous and mountainous areas crops are considered as xeric because farmland is not irrigated. In these areas, 34% of the investors/cultivators believe that their land values have increased in the last 5 years, because there has been an intense interest for the afforestation of agricultural land in these areas. 43.6% of the investors consider that the values of
53
“Sustainable Management and Development of Mountainous and Island Areas”

non-irrigated areas have dropped and the rest 22.3% believe that land values remain constant.
The size of the privately-owned farms starts from 0.4 ha (the smallest size) and reaches up to 45 ha. On average the farm size is about 7.8 ha. From them, 3.4 ha of land is irrigated and 4.4 ha of land is not irrigated. On average the single farm is divided in 8.2 plots. The area that is in fallow land is 0.52 ha/farm.
In general, the reduction in the value of agricultural land is also reflected in the degree of satisfaction that most investors take from their farm. This is particularly true for those investors who state that the agriculture is their main profession. 48.9% of the interviewees can easily find markets for the products that they produce but almost 51.1%, encounter certain difficulties in doing so (Table 4).
Only 21.3% of the investors/cultivators are satisfied with the prices they get for their agricultural products, while the majority of them (78.7%) are, by no means satisfied from the profits generated in their farms. Mulberry investors/cultivators (67%) consider cotton culture as the most profitable one in their region. They follow maize culture with (6.4%), forest
plantations with 6%, hard wheat with 4.3% and last it is sugar beets with 0.6%.
As regards the reason for the investors/cultivators preferring to devote a part of their farm to planting forest trees and not devoting to an alternative use, 38.3% state that in this way, they upgrade their farms, because they consider that planting forest trees is more profitable compared to other choices. 24.5% of investors prefer this activity, because they believe that it requires low labor inputs. 23.4% of the individuals declare that forest plantations involve increased subsidy levels. 6.4% of the interviewees declare as the main reason for choosing forest plantation and in particular mulberry plantations, the fact that they posses enough knowledge to deal with this agricultural activity. 5.3% of the people asked appear to be influenced by other investors/cultivators’ views. Finally, the remaining 2.1% state as the main reason for being involved in mulberry plantations the fact that one can easily find a market for mulberry products, determining the leafage that can be sold to sericulture as well as the timber when the forest plantation reaches the age of 20 which the period that the plantation is subsidised by the regulation (Table 5).
Table 4. Problems of sale of agricultural products Problems of sale Number of investors/cultivators Percentage
Many 18 19.1 Few 30 31.9
By no means 46 48.9 Total 94 100
Table 5. Reasons of preference of mulberry plantation
Reasons of preference Number of investors/cultivators
Percentage (%)
I know its crop 6 6.4 For facility in the disposal of product 2 2.1
Have installed also other farmers 5 5.3 It has more subsidy 22 23.4
It does not want a lot work 23 24.5 It is more lucrative 36 38.3
Total 94 100
Only 6.4% of the investors/cultivators hired agricultural land for the establishment of forest plantations, another 14.9% bought agricultural land, while the overwhelming majority of investors/cultivators (78.7%) did not make any changes in the extent of their land.
When investors/cultivators were asked where they learned about forest plantations from, and in particular, about the regulation 1257/99 article
31, half of them (50%) answered that they had heard from other farmers. The Forest Service played a role mainly to the notification and briefing as regards mulberry plantations (25.5% of the individuals), while 13.8% of the people appear to have been informed by freelance professional foresters. 5.3% of the interviewees learned for the first time for this type of culture by the local rural cooperative while 4.3% from
54
“Sustainable Management and Development of Mountainous and Island Areas”
the Agricultural Development Service. Finally, only 1.1% get informed about forest plantations from their family.
The family, on the other hand, is the main factor (26.6%) that influences (26.6%) the attitude of investors/cultivators in order to apply to the plantation program. Only 24.5% of the cultivators answered that they took this initiative by themselves. Other farmers follow with
percentage 19.1%. The freelance professional foresters and the Forest Service had the same influence (13.8%) to the formation of cultivators’ final decision. In sum, however, it could be said that the above agents played the most important role (27.6). Finally, only 2.1% of the investors/cultivators were convinced by the local rural cooperatives (Table 6).
Table 6: Distribution of investors/cultivators depending on who them convinced Number of investors/cultivators Percentage (%)
Other farmers 18 19.1 Family 25 26.6
Freelance professional foresters 13 13.8 Nursery owners 0 0.0 State foresters 13 13.8
Rural cooperative 2 2.1 No one 23 24.5 Total 94 100
36.2% of the investors/cultivators in answering the question of how other farmers reacted in their decision of establishing a forest plantation in their farms stated that other farmers simply agreed. 35.1% said that they remained neutral, 19.1% said that they disagreed because of the potential consequences the change of crop would have in their farm, while the remaining 9.6% declared that other farmers absolutely agreed and supported them. 55.3% said that their families agreed to mulberry plantation and in particular 36.2% answered that their families absolutely agreed. The family attitude was neutral for 5.3%, while for 2.1% and for 1.1% the family disagreed and absolutely disagreed respectively.
The majority of investors/cultivators consider that the forest plantation does not include any risk, for them and for their farms. This appears from the fact that 51.1% declared that they did not undertake any risk in installing a forest plantation. 24.5% declared that the risk was small and the 17% moderate. The opposite opinion expressed by 6.4% of the interviewees considers that they had undertaken a high risk. The rest 1.1% believed that the risk was very high.
73.4% of the investors/cultivators do not have any fear of the forest legislation, because they consider that they are in line with all the obligations deriving from the regulation about forest plantations. 16% feels some fear of forest legislation, while the rest 10.6% do not know if
there is any reason to feel fear of the legislation. 38.3% notices an increase in the time their family spends in dealing with agricultural activities because of the new agricultural activity, i.e. forest plantation and more specifically mulberry plantation. 18.1% notices a reduction in time spent to the fields and 43.6% say that there is not any change in the time their family spends in the farm.
Only 25.5% of the investors appear to have used new equipment for cultivating forest trees and in particular for the mulberry cultivation. This percentage has mainly invested money for the purchase of subsoil cultivators and water reservoirs, while to a large extent they have installed water supply networks in the farm (droplets). Most of the investors that used new tools, they also bought drills for the placement of seedlings. 74.5% did not use any new equipment and this is mainly due to the fact that they already had the necessary tools.
The interest of mulberry investors/cultivators for training in this particular type of culture is intense, because 81% of them are interested to get informed and to learn more for the particular crop expecting that in this way they would improve the output of their plantation. Only 18 individuals (19%) gave a negative answer, mainly because most of them had been involved in the past in this type of culture for the production of leafage as raw material for sericulture.
55
“Sustainable Management and Development of Mountainous and Island Areas”

By investigating the problems that the mulberry investors/cultivators face in regard to the farming manipulations of this species, it becomes apparent that 51% of the investors consider that irrigation of the plantation is quite difficult, because of the fact that the majority of these plantations both in absolute numbers and in area covered, are located in mountainous and semi-mountainous areas, where there is not any organized network of water supply. Quite high appears to be the percentage (33%) of those that consider most difficult the issue of plant protection, (the protection of seedlings during the initial years from weeds and other damaging plant as well as and animals). 16% of the interviewees express their concerns about the ability of the mulberry seedlings to adapt in the climate conditions and the territorial environment. The rate of seedlings survival is of particular concern to most of the farmers. The
issue of fertilization does not appear to be a serious concern, because farmers quite easily apply the required fertilizers.
The main aim of the great majority of investors/cultivators (70.3%) is their direct or indirect involvement in sericulture. In the last years, in the prefecture of Evros and particularly in the area of Soufli, there exists an intense interest coming from municipal enterprises to regenerate sericulture activity by using modern methods of processing and rearing. There already exist a lot of producers that raise silkworms feed exclusively on mulberry leaves. Thus the sell of leaves to these producers could be an additional income for the investors/cultivators. Only 7.4% of he interviewees answered that would exploit the mulberry timber. Finally, 22.3% of the cultivators had not decided yet about how to exploit their plantation.
Table 7: Aim for which they selected to establish mulberry plantations Aim Number of investors/cultivators Percentage (%)
Sericulture 66 70.3 Timber production 7 7.4
They have not decided for the future exploitation 21 22.3
Total 94 100
After 3 years from the establishment of the first forest plantation in the frame of new regulation 1257/99 the majority of investors /cultivators (52.1%) are not in a position to clearly express their satisfaction or not about the output of their plantation, as plants are yet very small. 45.7% of the investors/cultivators state that they are satisfied up to day, while 2.1% do not feel any satisfaction of this culture. 52.2% do not regret for making the choice to get involved in planting and maintaining forest trees and in particular in cultivating mulberry trees. Only 1.1% of the interviewees have regretted for making such a choice. Finally, 11.7% of investors/cultivators remain undecided.
For both full-time and part-time farmers, the high level of the initial aid for establishing a plantation deriving from the regulation has played an extremely important role in deciding to get involved in forest plantation. Moreover, the annual financial aid that follows the initial aid for establishing a plantation is also important, as only 2.1% of the investors/cultivators stated willing to make such an investment without any economic incentives. 34% of interviewees have contracted medium-term loans in the last decade of an average level of about 16.235€. Finally 66% of the farmers have invested by using solely their own savings.
Conclusions–proposals
The Common Agricultural Policy reforms in 1992 and in 1999 were aimed at providing financial aids for the maintenance of natural resources and the “set-aside” of part of agricultural land. Regulation 1257/99 gave an important impulse to the application of afforestation programs of agricultural land,
especially with mulberry plantations in the prefecture of Evros. In the last years, an important effort was made for the resurgence and development of mulberry plantations as well as sericulture in the whole prefecture and in particular in the area of Soufli.
This research has shown that the future of mulberry plantations as well as sericulture development in the prefecture is quite promising,
56
“Sustainable Management and Development of Mountainous and Island Areas”

because of the fact that farmers consider these activities as being “a good investment”. They usually connect mulberry plantations with the development of the sericulture. This economic activity may have the potential of becoming "the lever of development" for the whole area, while in generally the resurgence of traditional economic activities is possible to create comparative advantages for the less favored areas and influences regional development.
In their majority the investors/cultivators are farmers. Therefore, they have experience in the agricultural work. Over half of the investors/cultivators are primary school graduates. Most of them are involved in cultivating intensive crops but they gradually tend to replace them with forest species due to realizing that the productivity of the land has fallen considerably and the profits that they enjoy decrease constantly.
Specifically, it has been shown that most of the investors/cultivators are over the age of 45 (61.7%), while 33% of the individuals are over the age of 55. Only 9.6% are young individuals, under the age of 25. Roughly speaking, half of them have participated in seminars of a rural content, while the majority of investors/cultivators watch frequently programs of agricultural interest. Freelance professional
foresters and the local Forest Service have an important role in their informing and training farmers with regard to afforestation issues. Some of the investors/cultivators make on her/his own the decision for applying to the afforestation program. Most of them prefer the particular crop (mulberry) because they know quite well the farming method and they believe that such a cultivation is more profitable. However, only a small number of them would deal with forest plantations if there was not any financial aid.
The sector’s perspective is promising and its contribution to the economic development of the prefecture of Evros could be important. However, to realise this, additional necessary measures need to be introduced. One such measure could be the financing of individuals in order of priority according to regulation 1257/99. The individuals could be either farmers or not as regards their primary profession. They however, must be willing to get involved directly with sericulture or indirectly by providing the leaves of mulberry to future producers.
Finally, the maintenance and possibly the increase in financial aid will give the opportunity to a larger part of the rural population to replace the surplus crops with forest plantations using species such as mulberry.
References
[1] Andreopoulou, Z., Arabatzis, G. and Soutsas, K (2005). A structured distance learning project for the sericulture training as a perspective in development policy for Less Favored Areas. New Medit, Mediterranean Journal of Economics, Agriculture and Environment, 1:57-63.
[2] Anthopoulou, Th. (2003). Local know-how and countryside development. The oil industry in Lesvos and the silk processing in Soufli. In Proceedings of Conference «Less Favored Areas and Development Strategies: Economic, Social and Environmental Dimensions and Support Mechanism», 21-23 November 2003, Mytilini, J. Spilanis, Th. Iosifidis and A. Kizos (eds). p:417-438. (in Greek).
[3] Arabatzis, Th. (1998). Bushes and Trees in Greece. Vol 1. Technological Educational Institute of Kavala. Drama. (in Greek).
[4] Carter, S. (1998). Portfolio entrepreneurship in the farm sector: indigenous growth in
rural areas? Entrepreneurship and Regional Development, Vol 10:17-32.
[5] CEC, (1999). Council Regulation (EEC) no 1257/99. Official Journal of European Communities. L 160/80. 26.6.99. Commission of European Communities. Brussels.
[6] Daoutopoulos, G. 2002, Social Research Methodology. 3rd edition. Zygos. Thessaloniki. (in Greek).
[7] Dimara, E. and Skouras, D. (1998). Adoption of new tobacco varieties in Greece: Impacts of empirical findings on policy design. Agricultural Economics, Vol 19:297-307.
[8] Doulias, . (1995). Sericulture. Silk Worm Rearing-Mulberry Cultivation, Gartaganis. Thessaloniki. (in Greek).
[9] Forest Service of Alexandroupoli, (2004). List of Investors of Regulation 2080/92. (in Greek).
[10] Forest Service of Alexandroupoli, (2004). List of Investors of Regulation 1257/99. (in Greek).
57
“Sustainable Management and Development of Mountainous and Island Areas”

[11] Forest Service of Didymoteicho, (2004). List of Investors of Regulation 2080/92. (in Greek).
[12] Forest Service of Didymoteicho, (2004). List of Investors of Regulation 1257/92. (in Greek).
[13] Forest Service of Soufli, (2004). List of Investors of Regulation 2080/92. (in Greek).
[14] Forest Service of Soufli, (2004). List of Investors of Regulation 1257/92. (in Greek).
[15] Ilbery, B. (1998). The Geography of Rural Change. Longman:Harlow.
[16] Kalantaridis, C. (1997). Between the community and the world market: garment entrepreneurs in rural Greece. Entrepreneurship and Regional Development, Vol 9:25-44.
[17] Karameris, A., (1996). Sociology. Aristotle University of Thessaloniki Thessaloniki. (in Greek).
[18] Kypriotis, . yriakou D., (1999). Sericulture in Soufli – Recent Situation–Prospects. Geotechnical Scientific Issues . Vol 10. Issue I.(3): 328-336. (in Greek).
[19] Labrianidis, L. (ed) 2004a. The Future of Europe’s Rural Periphery. Ashgate. London.
[20] Labrianidis, L (ed). 2004b. The Business Dexterity in the European Countryside, Paratiritis. Thessaloniki. (in Greek).
[21] Mandal, L. (1997). Nutritive value of tree leaves of some tropical species for goats. Small Ruminant Research, Vol 25: 95-105.
[22] Midmore, P. (1998). Rural policy reform and local development programmes: Appropriate evaluation programmes, Journal of Agricultural Economics, Vol. 49(3): 409-426.
[23] Ministry of Environment, Planning and Public Works, General Secretariat of Environment. (2002). Regional Context of Land-Use Planning and Sustainable Development of Region of Eastern Macedonia and Thrace. (in Greek).
[24] Parisi, . (2001). Effect of Intensity and Frequency of Cutting in the Production and Quality of Matter of Wooden Types Fit for Fodder. Ph.D. Aristotle University of Thessaloniki. Thessaloniki. (in Greek).
[25] Petrakos G., Polyzos S. (2005). Regional inequalities: Theories review and estimation of inequalities in Greece. In Kollias C, Naxakis C. Chletsos M. (eds). Modern approaches of Greek economy, Patakis. Athens. (in Greek).
[26] Siardos, G., (1997). Methodology of Rural Sociological Research. Ziti. Thessaloniki. (in Greek).
[27] Slee, B., Wiersum, K.F. (2001). New opportunities for forest-related rural development. Forestry Policy and Economics 3:1-4.
[28] Smallbone, D., North, D and Kalantaridis, C. (1999). Adapting to peripherality: a study of small rural manufacturing firms in northern England. Entrepreneurship and Regional Development, Vol 11:109-127.
58
“Sustainable Management and Development of Mountainous and Island Areas”

Triggering Collective Self-awareness in Local Societies: A New Approach to Push for the Protection of Greece’s Landscape, Environment and
Cultural Heritage
Kriton Ilias Arsenis ELLINIKI ETAIRIA
28 Tripodon st., 10558 Athens, Greece
Panteion University Department of Sociology 130 Syggroy st., 11741
Athens, Greece [email protected]
Abstract. Over-construction is destroying the environmental and cultural resources of the Aegean islands that are their comparative advantages in the global and national tourist market. This paper examines the local societies’ level of understanding of the economic threats of destroying their environment and cultural heritage. Research on the views of school students, based on questionnaires and an innovative approach through photo contests, shows that young members of the local societies in the Aegean have a level of understanding of the complexity of their development matrix. Nevertheless, the link between development and the protection of the environment is not clear to the majority of citizens.
Keywords. Sustainable development, sustainable tourism, civil participation, environmental education
1. Introduction
The Aegean islands’ present and future is vastly depended on tourism. Existing research has focused on examining local societies’ and economic actors’ attitudes to tourism. This paper studies the perception of young members of the local societies in two Aegean islands of the dependence of tourism (and thus of the development prospects) on the quality of their environmental and cultural resources. Its purpose is to contribute to the ongoing academic dialogue a) on sustainable tourism and development and b) on the importance of the local population’s views and the capacity of local societies to form the development model of their community. At
the same time it opts in contributing to the dialogue among environmental NGOs on the most effective methods for promoting the protection of the environment and cultural heritage as it describes new ways they could approach local societies effectively, stimulating a dialogue where the property rights of the arguments belong to the societies themselves. The paper is based on the first results of an ongoing study, part of the Sustainable Development in the Aegean Program of ELLINIKI ETAIREIA, he Hellenic Society for the protection of the Environment and Cultural Heritage of Greece. The study was designed by the author. It represents a section of his PhD dissertation on “Social Participation in the promotion of sustainable development in the Aegean”.
2. Origins and description of the over- construction phenomenon in the Aegean islands
2.1 The continuous shift from prosperity to decay in the Aegean history
The Aegean islands have experienced periods of prosperity and then decay many times in their long history. Due to the ancient navigation technologies that did not allow for safe journeys far from the coast, this archipelago of small and dry islands became the center of a main commercial sea way in the Mediterranean. Being at the centre of trade routes, the islands attracted more settlers, and their culture and economies flourished. In order to survive in these often unfriendly places, humans constructed terraces to
59
“Sustainable Management and Development of Mountainous and Island Areas”

increase agricultural land to the maximum, cisterns to collect the rain water, footpaths to connect the settlements, agricultural houses and much more. In all probability there is not a single square kilometer on the Aegean islands without traces of human activity. In a way, the Aegean islands are “handcraft”.
Of course, the islands have not always been prosperous. Medieval piracy and general insecurity led to the sharp decreases in the islands’ population. Between the 17th and 20th
century the islands again became major trading centers. Consecutive wars, the division of major imperial economic areas and the invention of steam ships deprived the islands of the strategic significance they once had and led once more to poverty and mass emigration. This time the downturn was however short lived. Already in the 1960s some islands had transformed themselves into world tourist destinations.
2.2 The predominance of tourism and the over-construction phenomenon
For the first time in their history, the islands are important not as trade centers but due to their past. Their cultural landscapes that make these islands “handcraft” are what differentiates them from other tourist destinations and makes them attractive to tourists from all around the world.
“Spiti oso horis kai horafi oso thoris”“A house that can barely fit you and fields as far as the eyes can see!” This proverb sums up the collective wisdom on the Aegean islands. In order to make a living in these small, arid outposts one has to employ every available resource. Produce as much as possible, and trade the surplus with products from other places. This created the unique cultural landscapes that in turn made the Aegean famous in the 60s and 70s. Tourism increased sharply the demand for accommodation. The islanders rented rooms in their small houses, their stables, whatever was available to satisfy the explosively increasing demand for accommodation. Having a stunning cultural landscape unaltered over the centuries, the only thing the tourist needed was accommodation. The more space you could rent the more money you could earn. Thus the cleverest way to make money was to build new houses to accommodate tourists. In the beginning the new houses were built near the island ports. As new roads connected the ports to most of the settlements and beaches, the building spread throughout the islands. Today, new houses are
being built wherever a new road is opened. Compared to tourism, there are only very small gains from agriculture. The terraces, the footpaths, the agricultural houses, the cisterns and all the monuments of the created by human hands as a means to ensure survival are being abandoned. Their place is quickly been taken up by housing plots.
“Spiti oso boreis kai xorafi oso horeis”. “A house that is as large as possible and a field you can hardly fit in!” This is without doubt the new worldly wisdom on the islands. Only some islands have planning schemes. Many of these schemes were designed under severe pro-construction pressure from economic and political interests and are very inefficient in regulating construction and protecting the eco-cultural resources of the islands. In any case, high corruption in many planning agencies and local authorities in the Aegean leads to the cancellation of many regulatory provisions included in the planning schemes.
3. The dependence of tourism development on the protection and promotion of environmental and cultural resources
The existing development model for the Aegean which is based on a monoculture of new constructions to facilitate the accommodation and entertainment needs of tourists has led to the development of the Aegean area in its current form. It is true that most islands enjoy greater economic development levels than Greece on average [12]. But does this mean that this development model effectively guarantees the economic prosperity of these islands in the near future?
Due to over-construction the Aegean islands are gradually losing their historic landscape, and their environment is being constantly degraded at a moment where, as Lim and McAleer [21] remark, “the world’s population becomes increasingly urbanized, the demand for tourist attractions which are environmentally friendly, serene and offer amenities of a unique nature, will be growing rapidly”.
Thus a highly important question is since there is excess availability of accommodation on the islands, why do we continue building at the expense of the cultural landscape that is the source of the demand for accommodation? Is the stagnation stage of the tourism development
60
“Sustainable Management and Development of Mountainous and Island Areas”

cycle model of Butler [7] inevitable in the Aegean islands? The question has become even more critical the last decade and especially after Greece’s entry into EMU, since the sharp rise in the cost of living has turned Greece into a rather expensive destination, while as [1], [4], [5] point out numerous new quite cheaper but similar tourist destinations are now competing in the world market.
Based on the author’s personal experience in the environmental movement, up till now environmental NGOs in Greece have mostly focused on ethical arguments for the protection of the environment and cultural heritage. Taking for granted that local societies are unable to understand the value of their environmental richness, Greek NGOs are often trying to push the central government in pro-environment regulations and support their implementation irrespectively of public views and beliefs. Alternative development always represented part of their rhetoric, but economic developmental issues still elicit skepticism among many supporters of the ecological movement. Consequently, in the Aegean islands, the term ‘environmentalist’ is usually a form of abuse hurled at political opponents. An ‘environmentalist’ is perceived as a person trying to stop development. This seems to me to be a major impediment in the protection of the environment in Greece. It allows people that destroy the development potential of places like the Aegean islands through the destruction of their tourist capital – which is largely based on their environmental and cultural uniqueness – to be considered ‘pro-development’ and people that are trying to protect this very basis of future prosperity to be perceived as acting against the islands’ interests. Especially in countries with a weak state, it is impossible to protect environmental and cultural resource if the local communities do not see that this protection is in their own interest and thus support such a protection.
Summing up, there are three questions that seem to be very important regarding the continuing degradation of environmental and cultural resources in the Aegean islands
1. Is it due to lack of understanding of the opportunity cost of not preserving and marketing environmental and cultural goods?
2. Is it due to lack of understanding of the economic dangers of continuing to
destroy the environmental and cultural resources of the islands?
3. What is the most appropriate approach to protecting the islands from depletion of their main tourist resources, those that allow them to attract tourists at the given national price levels, which are no other than their environmental and cultural uniqueness?
4. Residents’ perception of the relation between development and the protection of the environment and cultural heritage
4.1 Literature review
There is an increasing bibliography [2], [4], [10], [11], [19], [31] on the dependency of tourism development in Greece on the protection of environmental and cultural resources. Buhalisand Diamantis [6], Coccossis and Parpairis [9], [16], Nijkamp and Verdonkschot [25], [26], Prinianaki-Tzorakoleftheraki [27] and especially Loukissas and Skayannis [24] emphasize promotion of natural, cultural, and historical resources, as well as development of alternative types of tourism as basic determinants of the future of Greek tourism.
At the same time there is a relatively rich bibliography on local actors’ perception on tourism in the Aegean islands. Haralampopoulos and Pizam [14], examine whether the residents of Pithagorio, Samos support tourism as a major industry. Bastakis, Buhakis and Butler [3] examine the perceptions of small and medium sized tourism accommodation providers on the impacts of the tour operators’ power in Corfu. Both studies have no findings related to the environment and cultural heritage, nor do they check for the determinants of tourist development. There is another study though by Tsartas [32] that describes how the discussion on the future of tourism and its relation to the protection of the environment existed already in the ‘70s in the local societies of the islands of Ios and Serifos. Jacobsen [13] and Selanniemi [30] examine the perceptions categories and preferences of Norwegian and Finish tourists respectively, visiting Greece. Jacobsen compares Greece to Egypt, Turkey and Italy and finds that the uniqueness (being virgin, the local foods) of the Greek islands is an important driving force of Norwegian tourism in Greece. As he concludes “significant numbers of these vacationers to, for
61
“Sustainable Management and Development of Mountainous and Island Areas”
instance, the smaller Greek islands, are interested in an experience of place, while at the same time wanting a holiday on a beach.” The same conclusions could be drawn by a study on the perceptions of tourists visiting Kos and Rhodes undertaken by the Chamber and the Development Agency of Dodecanese in 2004 [22], [23]. These two islands are major destinations of international mass tourism in Greece. Nevertheless, even visitors to these islands when asked why they chose to visit the specific tourist destinations answered that eco-cultural richness was even more important motive than cost, destination popularity or night life.
Nevertheless, there is a lack of studies that assess the residents’ perception of the economic threats of the destruction of the environmental and cultural resources of Greek islands. This is a highly important field of research because if we cannot evaluate the perceptions of the local societies in the Aegean islands, on the effects of their everyday development choices on each islands attractiveness as a tourist destination, if we cannot assess the level of local societies understanding of the interlinkages of development and environmental protection, we cannot promote these islands’ economic future and the protection of their environment, cultural heritage and landscape.
4.2 Methodology
There is an open debate on the homogeneity of local societies’ perceptions of tourism. Andriotis [2] examines whether there are differences in the residents’ perceptions of tourism in Crete among three groups; residents relying on tourism employment, residents not relying on tourism, and tourism business people. He concludes that there is a significant level of consensus among the three groups. Similar findings are displayed in a quite earlier study of Tyrrell and Spaulding [33] in the island of Rhodes where three different groups were examined: business people, residents and the public sector. On the opposite side of the debate, Haralambopoulos and Pizam [14], find differences in the perceptions of those who were and those who were not economically dependent on the tourist industry. Based on the author’s personal experience, in small Aegean islands most people are somehow related to tourism, or feel as they were since they expect to be in the near future. Consequently, although it seems
theoretically possible, it is in practice very difficult to divide these small societies in different groups according to their relation to tourism.
Therefore, this paper chose not to divide the residents into different groups. Instead it investigates the local societies’ level of understanding of the dependency of development on environmental protection by studying the perceptions of school students of Sifnos and Serifos. By asking the school students their opinion on developmental issues, issues that they have not confronted up till this point, the study tries to understand how the local society thinks on these issues. The school students often hear their parents talking about these issues during family lunches and dinners, conversations that frame their understanding of this aspect of life that they do not yet deal with directly. Education can play a role in the formation of children’s views, especially if there are environmental educational activities included in the school curriculum, which in the case of these two islands have been very limited. TV is also expected to play a role, but there is very little information on islands’ everyday life in the Greek media.
Asking adults the same questions might have given me very different answers especially because the author was representing an environmental NGO.
4.3 Questionnaire
In Sifnos a questionnaire was distributed on 20th and 21st October 2005 to all secondary education students (ages 12 to 18). Out of the various questions included in the questionnaire the study will analyze the results of three questions that were more directly related to our present discussion.
1) “What brings development to the island?” With this question the author tried to investigate which activities the students perceive as the driving forces of development on the island. The results are shown in Table 1.
2) “What attracts tourists to the island?” With this question the author tried to learn which island characteristics the students perceive as the driving forces of tourism. The results are shown in Table 2.
3) “Is there something tourists don’t like in Sifnos?” With this question the author tried to
62
“Sustainable Management and Development of Mountainous and Island Areas”

find what the students perceive as possible threats to tourism. The results are shown in Table 3.
What brings development to the island?
106/120 replied factor %
tourism 80.2locally produced ceramics 5.7traditional restaurants & local tastes 5.7clean beaches 4.7agriculture 3.8entertainment 2.8transportation 2.8monuments 2.8rooms to let 2.8tourist infrastructure 1.9youth 1.9culture 1.9landscape 1.9tourist promotion 0.9shops 0.9hospitality 0.9tradition 0.9climate 0.9
Table 1. What brings development to the island?
The school students know very well that the single most important determinant of development in the island is tourism.
Which are the driving forces of tourism on the island of Sifnos?
What attracts tourists in the island?
replied 104/120 factor %
beaches 41.3sightseeing - chapels in the countryside - museums 29.8to rest - vacations 20.2beautiful island 16.3quietness 15.4
landscape & nature 14.8 clean environment 13.5 customs 3.8 ceramics 1.9 traditional houses 1.9 restaurants 1.9
Table 2. What attracts tourists to the island?
The school students of Sifnos understand that:
1. The sun and the sea are not the only reasons that one would choose to visit their island. Their cultural richness is understood as a very important factor in attracting tourists.
2. The ability of the island to provide recreation through different living conditions than in Athens (with quietness and clean environment) is an important factor of tourist development.
3. The overall image of the island is an important driving force for tourism.
4. Preserving the landscape and nature of the island is important for the protection of the economic future of the island.
Is there something tourists don't like in Sifnos?
replied 35/120 prices 35.3 garbage 26.5 not enough shops and bars 17.6 bad customer service 17.6 lack of frequent transportation 8.8 noise 2.9 bars 2.9 racism 2.9
Table 3. Is there something tourists don't like in Sifnos?
Although only one out of four expresses opinions about threats to tourism on their island, it is evident that school students perceive the change in tourism due to high prices, and a need to make a swift toward higher quality in environment (garbage, is the most propagated and widely understood environmental issue) and services. It is interesting that transportation that
63
“Sustainable Management and Development of Mountainous and Island Areas”

is proclaimed to be the main obstacle for tourist development in Sifnos, is but fifth in the list!
4.3.1 Conclusions
It is clear that although there is some awareness of how complicated the development issues facing the island are, school students are far from developing a clear view of what is best for their island’s economic future. No one seems to believe that construction is playing a positive role for the tourist development of the island, but it is not clear from the answers in the questionnaire that overconstruction and lack of protection of the environmental and cultural resources can be bad for development. We could say that there is a perceived major threat for the island’s future, located in the damage high prices do to tourism. It seems though that there is no understanding of the fact that most probably prices will keep increasing, and thus there has to be a change in many other factors in order to prolong development in the island.
What is very important is that the questionnaire allows a glimpse into the fact that:
1. If nothing is done, local society might be too late in fully understanding the complexity of the development issue that will determine its future.
2. There is a level of understanding on certain elements of the development matrix of the Aegean islands.
The over-cunstruction phenomenon should by no means be a great surprise to us. A society that until a generation ago was significantly poor with an economy based on agriculture, fishing and cattle breeding [12], [17], [23] is today, through the increase of economic activity and of the value of land, relatively rich. The local societies in the Aegean were unprepared for an exit from poverty to relative wealth and the cultural aspects of such a huge change that took place in just one generation. Despite this, islanders still have a great love for their home lands and traditions and, as Andriotis [2] found, have the willingness to participate and the ability to develop rational and practical opinions toward tourism development. There therefore needs to be a triggering event to kick off discussion about future development in these societies, allowing them to build a new collective consciousness and helping them chart the direction in which they would want their societies to develop. A
consistent awareness program that will provide a series of sincere economic arguments could make a difference in the way local society understands its development problems. This will especially be the case if a participatory approach is followed so that the property rights of any arguments or ideas belong to the local society and do not arrive seemingly prepackaged by outsiders. We thus have to use the knowledge that already exists in small segments of each local society to open up the discussion so that these views can be heard by everyone in that society. Our main input in the process could be to broaden this knowledge through presentations of success stories and failures from development practices in similar areas, preferably in Greece, vis a vis other islands.
Thus opening and keeping alive a dialogue on the islands’ development choices and future is essential. But why would an islander be interested in a third party (an outside NGO) opening the dialogue on his island’s future?
Most probably it will be difficult to open a dialogue before establishing very strong ties with the local society. For this reason the author chose to start working with school students. School students are open to knowledge and are free to express themselves sincerely since they do not have direct economic interests.
4.4 Photo Contest. Opening the development dialogue through the school students
Students from 10 to 18 years old from the 5th
and 6th grade of the Primary Schools in Amorgos, 5th grade in Sifnos and all secondary education schools in Serifos, Sifnos and Amorgos took part in three photo contests, one for each island. The subject of the photo contest was “what do you like in your island and would like to be preserved there, and what would you like to change”. The contest was part of the Program for the Sustainable Development in the Aegean, of ELLINIKI ETAIRIA, The Hellenic Society for the Protection of the Environment and Cultural Heritage of Greece.
The students were given free films and were asked to return them within a deadline that varied from 4 weeks to 6 weeks depending on the season and the weather conditions. The films were then developed and the photos returned to the students for a one on one discussion on exactly what they want to preserve or change in each of their photographs. In Serifos, the
64
“Sustainable Management and Development of Mountainous and Island Areas”

discussion took place through the telephone. In Sifnos and Amorgos in personal meetings.
In order to increase participation there were 2-3 digital cameras awarded to the best photographers, but also various smaller awards to all participants.
Before announcing the contest and distributing the films in most schools I made a power point presentation on sustainable development issues and showed the award-winning film by L. Carras, “Voice of the Aegean”.
Approaches to the issue in the power point presentation:
1. The Aegean is changing. 2. Why is it such a unique place? 3. How are other islands destroying this
uniqueness? 4. What can this mean for tourism and thus
for the next generations? 5. Why do tourists come to the island? (this
is based on dialogue with the audience) 6. Which are the trends in national and
global tourist market that make these characteristics so important for the economic development in the islands (bird watching, footpaths, local products, monuments)?
7. Why is this important for the expansion of the tourist season, permitting better living conditions during the winter?
8. We have to protect these unique characteristics that bring tourism and allow for a better future for the island!
How the film approaches the issue:
1. The islands are changing! 2. These changes represent a common
phenomenon. 3. Some islands are already loosing their
landscape, cultural and natural resources due to over-construction.
4. There is a threat of complete urbanization of the Aegean islands’ landscape.
5. This might lead to the abandonment of the Aegean islands as a world tourist destination, as has occurred elsewhere in the world.
6. The state and the local communities share responsibility for this.
7. If we create an environment that is appropriate for our children this will be all that is needed for the tourists also.
8. There are some good development initiatives in Aegean islands that provide an alternative to the monoculture of mass tourism.
No significant differences were noted when comparing the comments of students that had seen the film and the presentation and students that had not. Does this mean that the film and the presentation were not adding something to the effectiveness of the awareness program?
All students watched the film and the presentation and often took part in the discussion. At the same time the teachers watched the film. Very often, after the film, there were discussions or even essays written on the topic during the following day’s classes. Thus, although not proven, the film and the presentation must have an enhancing effect on the targets of the program. In any case, it is a good way to start dialogue in class and a good starting point for other spontaneous or designed sustainable development awareness activities in cooperation with the teachers.
There was a 10 day exhibition of the photos and comments of the students that participated in the contest in a central location on each island. Finally a big public event was organized where prizes (digital cameras) were given to the best participations, but also, various smaller prizes to all participants. This way key representatives of the local authorities, parents, relatives, friends and other members of the local society came and listened to what the students had to say regarding the islands’ present and future. At the same time, press releases were issued and several articles were written in the local and national press quoting phrases from children’s comments.
4.4.1 What would we like to say to these local societies?
Priority A
Protect things that if destroyed cannot be restored: landscape, beaches and their immediate surroundings, monuments and their landscape, traditional settlements and their landscape and agricultural land. Prove the economic value of protecting these.
Priority B
65
“Sustainable Management and Development of Mountainous and Island Areas”
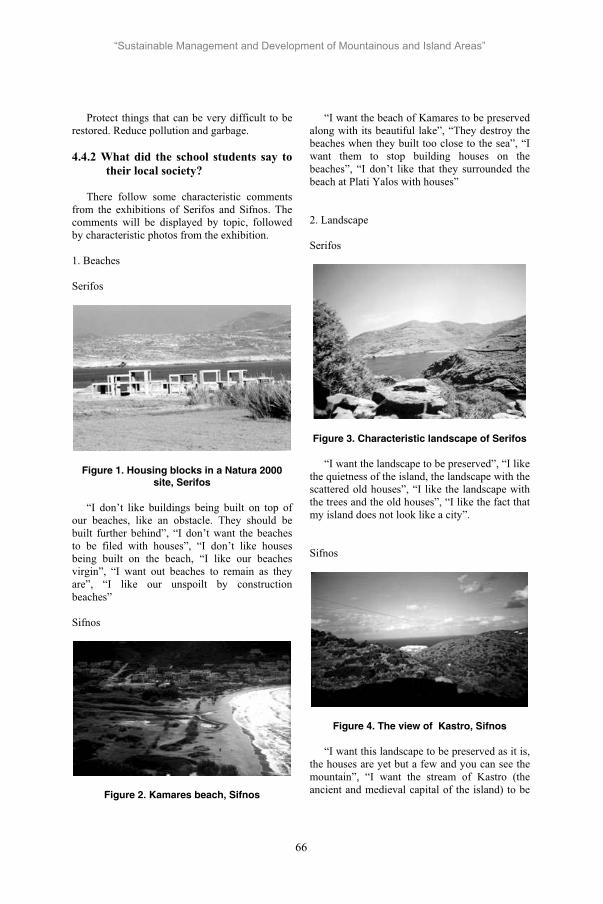
Protect things that can be very difficult to be restored. Reduce pollution and garbage.
4.4.2 What did the school students say to their local society?
There follow some characteristic comments from the exhibitions of Serifos and Sifnos. The comments will be displayed by topic, followed by characteristic photos from the exhibition.
1. Beaches
Serifos
Figure 1. Housing blocks in a Natura 2000 site, Serifos
“I don’t like buildings being built on top of our beaches, like an obstacle. They should be built further behind”, “I don’t want the beaches to be filed with houses”, “I don’t like houses being built on the beach, “I like our beaches virgin”, “I want out beaches to remain as they are”, “I like our unspoilt by construction beaches”
Sifnos
Figure 2. Kamares beach, Sifnos
“I want the beach of Kamares to be preserved along with its beautiful lake”, “They destroy the beaches when they built too close to the sea”, “I want them to stop building houses on the beaches”, “I don’t like that they surrounded the beach at Plati Yalos with houses”
2. Landscape
Serifos
Figure 3. Characteristic landscape of Serifos
“I want the landscape to be preserved”, “I like the quietness of the island, the landscape with the scattered old houses”, “I like the landscape with the trees and the old houses”, “I like the fact that my island does not look like a city”.
Sifnos
Figure 4. The view of Kastro, Sifnos
“I want this landscape to be preserved as it is, the houses are yet but a few and you can see the mountain”, “I want the stream of Kastro (the ancient and medieval capital of the island) to be
66
“Sustainable Management and Development of Mountainous and Island Areas”

preserved. If the building of new houses continues it will lose its beauty”, “I want this landscape with only a few houses to be preserved. People can still cultivate land here”, “I want this small green mountain to be preserved. You get inspired when you look at it”, “Artemonas, has become huge. New buildings are being constantly built and the natural landscape is being lost”, “The respect for the island is being lost. It is turning gradually into a city. New buildings are being constantly built and no one is thinking of the environment. Only a specified amount of houses should be allowed to be built and some places should remain intact.”
Garbage
Serifos
Figure 5. Garbage inside the village of Livadi, Serifos
“I don’t like the dumping of construction material and garbage in the streams”, “I don’t like garbage in the footpaths and old buildings”
Sifnos
Figure 6. Garbage in public view, Sifnos
“In the garbage burial area they burn the garbage and they even throw batteries”, “I want them to stop abandoning cars on the road to Kamares”
New roads
Serifos
Figure 7. Kalo Ampeli beach, Serifos
“I like the fact that you can still go to some beaches using a footpath”
Cultural heritage
Serifos
Figure 8. Abandoned Neoclassical building in Serifos
“I like the fact that this old windmill is restored”, “I don’t like the fact that the old windmills are collapsing”, “I don’t like the fact that our mining history is being abandoned”, “I don’t like the fact that the old houses are being abandoned”
67
“Sustainable Management and Development of Mountainous and Island Areas”
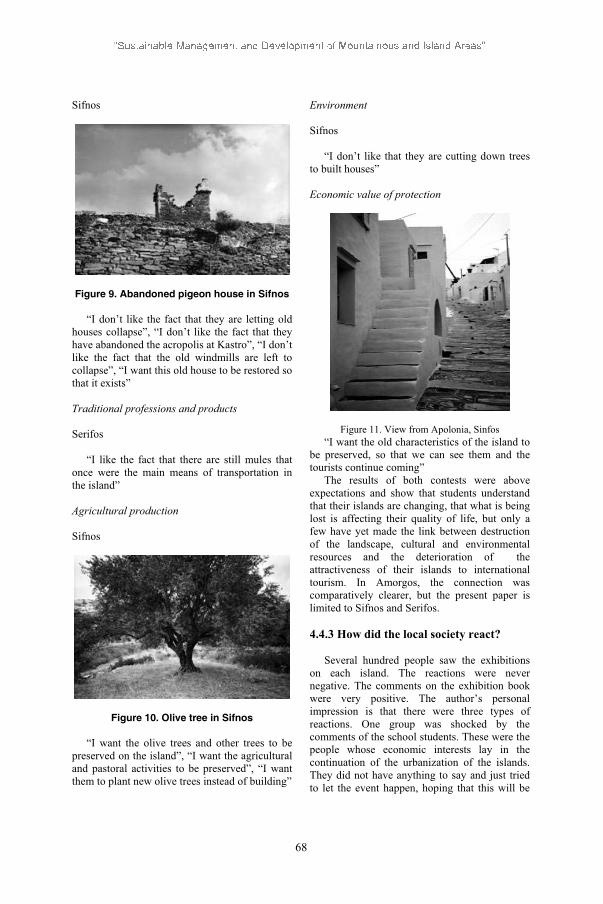
Sifnos
Figure 9. Abandoned pigeon house in Sifnos
“I don’t like the fact that they are letting old houses collapse”, “I don’t like the fact that they have abandoned the acropolis at Kastro”, “I don’t like the fact that the old windmills are left to collapse”, “I want this old house to be restored so that it exists”
Traditional professions and products
Serifos
“I like the fact that there are still mules that once were the main means of transportation in the island”
Agricultural production
Sifnos
Figure 10. Olive tree in Sifnos
“I want the olive trees and other trees to be preserved on the island”, “I want the agricultural and pastoral activities to be preserved”, “I want them to plant new olive trees instead of building”
Environment
Sifnos
“I don’t like that they are cutting down trees to built houses”
Economic value of protection
Figure 11. View from Apolonia, Sinfos“I want the old characteristics of the island to
be preserved, so that we can see them and the tourists continue coming”
The results of both contests were above expectations and show that students understand that their islands are changing, that what is being lost is affecting their quality of life, but only a few have yet made the link between destruction of the landscape, cultural and environmental resources and the deterioration of the attractiveness of their islands to international tourism. In Amorgos, the connection was comparatively clearer, but the present paper is limited to Sifnos and Serifos.
4.4.3 How did the local society react?
Several hundred people saw the exhibitions on each island. The reactions were never negative. The comments on the exhibition book were very positive. The author’s personal impression is that there were three types of reactions. One group was shocked by the comments of the school students. These were the people whose economic interests lay in the continuation of the urbanization of the islands. They did not have anything to say and just tried to let the event happen, hoping that this will be
68

the end of it and everything will return to normal again with the local society silently supporting continued over-construction. The other group was representative of most of local society. These people were very interested in the comments of the children and they were often heard mumbling, “They are right”. The final group was made up of the environmentally aware, and they were enthusiastic. Both schools, local associations and in some cases local authorities would like to see the project repeated or continued with new activities.
4.4.4 The gains from this procedure
This procedure has proven very effective in:
1. Making the youth of the island more aware of the complexity of their island’s development matrix, their island’s comparative advantages and the threats to its development
2. Initiating an integrated development dialogue from within the society with the property rights of the arguments belonging to members of the society.
3. Implementing maybe the first environmentalist activity on these islands that was not accused of threatening the islands’ economic present and future and as such having local support for its continuation.
4.4.5 What is next?
I believe that now it is time to work with the adult population on these islands. It is clear that building is not good for the environment, but it is not at all clear that it is no good for their future development, or more cynically, for islanders’ pockets. Any effort to protect these resources is condemned to find the opposition of the local community, unless the local community is convinced that it is in its economic interest to protect them. And this is truly hard! Here lies a great opportunity and also a considerable opportunity cost for the Greek and international environmental NGOs. To make the obvious two way “bridge” between environmental protection and economic development obvious.
5. Conclusions
In the Aegean islands, as with most places that depend on tourism, the protection of the region’s environment and cultural heritage is synonymous
to the protection of its development potentials. There is an ongoing academic dialogue on sustainable tourism, the importance of local population’s views and the capacity of local societies to form the development model of their community. The contribution of this study is that it extends the existing literature by examining the perception of young members of the local societies in two Aegean islands of the dependence of tourism (and thus of the development prospects) on the quality of their environmental and cultural resources. It concludes that local societies in the Aegean have a level of understanding of the complexity of their development matrix. This is often not reflected on the way an island chooses its development pattern. It is important to enact the development dialogue in local societies to allow for the self-awareness process to take place and lead to a more consolidated approach to the island’s development.
At the same time there is an open debate among environmental NGO’s on the most effective methods for promoting the protection of the environment and cultural heritage. The paper suggests that when an outside institution aims to make a change in the value a local society assigns to its environment and cultural heritage, this should be through a participatory process of communal dialogue. Working with school students can be an effective way to start. Young people are free in conveying what they see as right and what they see as wrong. Asking the youth to state their preferences regarding their island’s present and future through self-taken self-commented images can have an educative effect on the next generation of adults and be the first step towards opening the development dialogue.
6. Acknowledgements
I would like to thank: Prof. Theodoros Sakelaropoulos for his methodological and theoretical insights on my overall research, Yianni Carras for his review and comments on an earlier draft of the paper, the headmasters and teachers of all the schools of Serifos, Sifnos and Amorgos for their active collaboration in the realization of the awareness project, Ifigeneia Kokkalis and Leonora MacEwen for their idea to use a questionnaire for school students and for Ifigeneia’s insights on the paper’s structure, Kosta Karras for the numerous discussions we had and his valuable thoughts and knowledge on
69
“Sustainable Management and Development of Mountainous and Island Areas”

the past, present and prospects of the Aegean Islands, Lydia Carras for her wonderful film “Voice of the Aegean” that has been a source of knowledge and inspiration for my work in the islands.
7. References
[1] Apostolopoulos, Y., and S. Sonmez. Greek Tourism on the Brink: Restructuring or Stagnation and Decline? In Mediterranean Tourism: Facets of Socioeconomic Development and Cultural Change, Y. Apostolopoulos, P. Loukissas and L. Leontidou, eds., London: Routledge. 2001, pp. 72–88
[2] Andriotis K. Community Groups’ Perceptions of and Preferences for Tourism Development: Evidence from Crete, Journal of Hospitality & Tourism Research, Vol. 29, No. 1, February 2005, 67-90
[3] Bastakis, C., Buhalis, D., Butler, R. The perception of small and medium sized tourism accommodation providers on the impacts of the tour operators ’power in Eastern Mediterranean Tourism Management 25 (2004)151 .170, School of Management, University of Surrey, Guildford, Surrey, UK
[4] Briassoulis, H. Tourism in Greece. In tourism in Europe: Structures and Developments, W. Pompl and L. Lavery, editors, Wellington: CAB International. 1993, pp. 285–301.
[5] Buhalis, D. Relationships in the Distribution Channel of Tourism: Conflicts between Hoteliers and Tour Operators in the Mediterranean Region. International Journal of Hospitality & Tourism Administration. 2000, 1:113–139.
[6] Buhalis, D., and D. Diamantis. Tourism Development and Sustainability in the Greek Archipelagos. In D. Ioannides, Y. Apostolopoulos and S. Sonmez editors. Mediterranean Islands and Sustainable Tourism Development: Practices, Management and Policies, London: Compendium, 2001, pp. 142–170.
[7] Butler, R.W., ‘The concept of a tourist area cycle of evolution. Implications for management of resources’, Canadian Geographer, Vol 24. 1980, pp 512
[8] Butler, R., and E. Stiakaki. Tourism and Sustainability in the Mediterranean: Issues and Implications from Hydra. In D.
Ioannides, Y. Apostolopoulos and S. Sonmez, editors. Mediterranean Islands and Sustainable Tourism Development: Practices, Management and Policies, London, Compendium, 2001 pp. 282–299
[9] Coccossis, H., and A. Parpairis. Assessing the Interaction between Heritage, Environment and Tourism: Mykonos. In H. Coccossis and P. Nijkamp, editors. Sustainable Tourism Development, Brookfield, VT: Ashgate. 1995, pp. 107–125
[10] Coccossis, H., and A. Parpairis. Tourism and Carrying Capacity in Coastal Areas: Mykonos, Greece. In G. Priestley, J. Edwards and H.Coccossis, editors. Sustainable Tourism? European Experience, Wellingford: CAB International. 1996, pp. 153–175.
[11] Diamantis, D. Ecotourism and Sustainability in Mediterranean In H. Briassoulis and J. Van der Straaten, editors Tourism and the Environment: Regional, Economic, Cultural and Policy Issues, Dordrecht: Kluwer Academic Publishers. 2000, pp. 319–329
[12] Eurostat, 2006 Regional GDP per inhabitant in the EU25., Newsrelease, 63/2006 – 18 May, http://epp.eurostat.ec.europa.eu/pls/ portal/docs/page/pgp_prd_cat_prerel/pge_cat_prerel_year_2006/pge_cat_prerel_year_2006_month_05/1-18052006-en-ap.pdf
[13] Jacobsen, J. Anti-Tourist Attitudes: Mediterranean Charter Tourism. Annals of Tourism Research 2000, 27:284–300.
[14] Haralambopoulos, N., Pizam, A. Perceived Impacts of Tourism, The Case of Samos, Annal of Tourism Research, 1996, Vol. 23, No. 3, pp. 503-526,
[15] Hoffman, S. M. Ethnography of the Island of Thira: Regional Variation in Modern Greece and Cyprus. Annals of New York Academy of Science, 1976
[16] Konsolas, N., and G. Zacharatos, Diamantis, D. 2000 Regionalisation of Tourism Activity in Greece: Problems and Policies. In H. Briassoulis and J. Van der Straaten, editors, Tourism and the Environment: Regional, Economic, Cultural and Policy Issues, Dordrecht: Kluwer Academic Publishers, 2000, pp. 319–329
[17] Kousis, M. Tourism and the Family in a Rural Cretan Community. Annals of Tourism Research 1989, 16;318–332.
70
“Sustainable Management and Development of Mountainous and Island Areas”

[18] Kousis, M. Tourism and the Environment: Local Social Protest on Crete. In P. Tsartas, editor. Tourism Development: Multidisciplinary Approaches (in Greek), Athens: Exandas, 2000, pp. 99–122
[19] Kousis, M. Tourism and the Environment in Corsica, Sardinia, Sicily and Crete. In D. Ioannides, Y. Apostolopoulos and S. Sonmez, editors, Mediterranean Islands and Sustainable Tourism Development: Practices, Management and Policies, London, 2001, pp. 214–233
[20] Lambiri-Dimaki, I. Mvkonos-Dilos-Rinia: Develooment Plan (in Greek). Ministrv of Governmental Policy, Athens, 1972
[21]Lim C., McAleer M. Ecologically sustainable tourism management, Environmental Modelling and Software 2005, Vol 20, Iss 11, pp 1431-1438
[22] Loukaras, H, Research on tourists and visitors of Rodos, Chamber of Dodecanese, Scientific Team on Tourism, 2004
[23] Loukaras, H, Research on tourists and visitors of Kos, Chamber of Dodecanese, Scientific Team on Tourism, 2004
[24] Loukissas, P., Skayannis P. Tourism, Sustainable Development, and the Environment. In Y. Apostolopoulos, P. Loukissas and L. Leontidou, editors. Mediterranean Tourism: Facets of Socioeconomic Development and Cultural Change, London, 2001, pp. 239–256.
[25] Nijkamp, P., and S. Verdonkschot Sustainable Tourism Development: A Case Study of Lesvos. In H. Coccossis and P. Nijkamp, editors, Sustainable Tourism Development, Brookfield, Vermont, 1995, pp. 127–140
[26] Nijkamp, P., and S. Verdonkschot. Tourism Policy and Sustainability in Italy, Spain and Greece: A Compara-tive Politics
Perspective. In K. Eder and M. Kousis, editors., Environmental Politics in Southern Europe: Actors, Institutions and Discourses in a Europeanizing Society, Amsterdam: Kluwer Academic Publishers, 2001, pp. 55–85.
[27] Prinianaki-Tzorakoleftheraki, E. Local Environmental Protection Initiatives in Crete. In M. Stabler, editor. Tourism and Sustainability: Principles to Practice, Wellingford: CAB International, 1997, pp. 335–345.
[28] Pritchard, A., and J. Morgan. Tourism Development and the Need for Community Action in Mykonos, Greece. In L. Briguglio, R. Butler, D. Harrison and W. Filho, editors. Sustainable Tourism in Islands and Small States: Case Studies, New York: Pinter, 1996, pp. 281–305
[29] Stott, M. Economic Transition and the Family in Mykonos. The Greek Review of Social Research, Athens, 1973, 17;122-133.
[30] Selanniemi, T. Touristic Reflections on a Marine Venus: An Anthropological Interpretation of Finnish Tourism to Rhodes. Ethnologica Fennica, 1994, 22;35–42.
[31] Tsartas, P. Different Types of Tourism Development in Different Groups of Islands in the Cyclades: Causes and Consequences. Sociologia urbana e rurale, 1988, 26;167–180.
[32] Tsartas, P. Social and Economic Impacts of Tourism Development in the Prefecture of the Cyclades and Particularly on the Islands of Ios and Serifos during the 1950–1980 Period (in Greek). Athens, 1989
[33] Tyrrell, T., & Spaulding, I. A. (1984). A survey of attitudes toward tourism growth in Rhode island. Hospitality Education and Research Journal, 8, 22-23.
71
“Sustainable Management and Development of Mountainous and Island Areas”
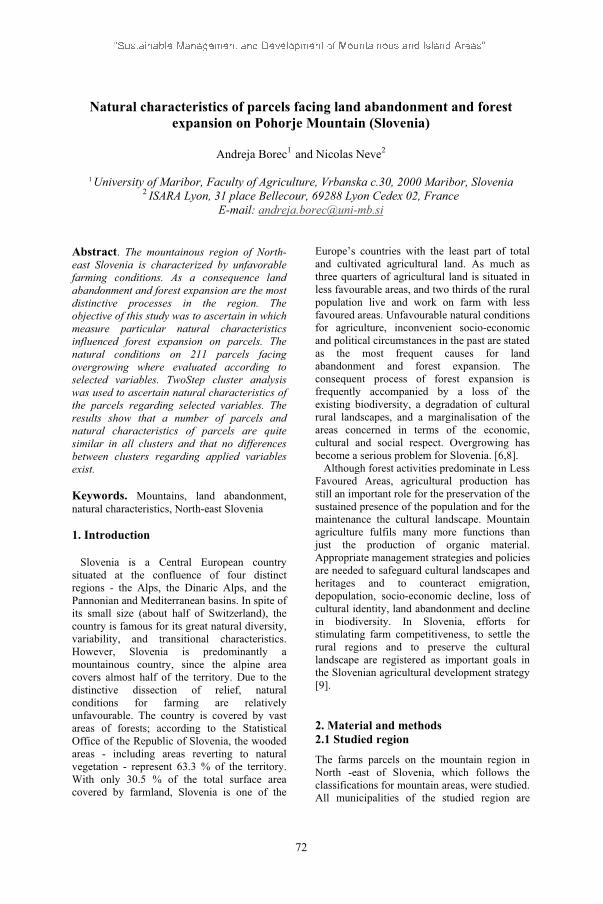
Natural characteristics of parcels facing land abandonment and forest expansion on Pohorje Mountain (Slovenia)
Andreja Borec1 and Nicolas Neve2
1 University of Maribor, Faculty of Agriculture, Vrbanska c.30, 2000 Maribor, Slovenia 2 ISARA Lyon, 31 place Bellecour, 69288 Lyon Cedex 02, France
E-mail: [email protected]
Abstract. The mountainous region of North-east Slovenia is characterized by unfavorable farming conditions. As a consequence land abandonment and forest expansion are the most distinctive processes in the region. The objective of this study was to ascertain in which measure particular natural characteristics influenced forest expansion on parcels. The natural conditions on 211 parcels facing overgrowing where evaluated according to selected variables. TwoStep cluster analysis was used to ascertain natural characteristics of the parcels regarding selected variables. The results show that a number of parcels and natural characteristics of parcels are quite similar in all clusters and that no differences between clusters regarding applied variables exist.
Keywords. Mountains, land abandonment, natural characteristics, North-east Slovenia
1. Introduction
Slovenia is a Central European country situated at the confluence of four distinct regions - the Alps, the Dinaric Alps, and the Pannonian and Mediterranean basins. In spite of its small size (about half of Switzerland), the country is famous for its great natural diversity, variability, and transitional characteristics. However, Slovenia is predominantly a mountainous country, since the alpine area covers almost half of the territory. Due to the distinctive dissection of relief, natural conditions for farming are relatively unfavourable. The country is covered by vast areas of forests; according to the Statistical Office of the Republic of Slovenia, the wooded areas - including areas reverting to natural vegetation - represent 63.3 % of the territory. With only 30.5 % of the total surface area covered by farmland, Slovenia is one of the
Europe’s countries with the least part of total and cultivated agricultural land. As much as three quarters of agricultural land is situated in less favourable areas, and two thirds of the rural population live and work on farm with less favoured areas. Unfavourable natural conditions for agriculture, inconvenient socio-economic and political circumstances in the past are stated as the most frequent causes for land abandonment and forest expansion. The consequent process of forest expansion is frequently accompanied by a loss of the existing biodiversity, a degradation of cultural rural landscapes, and a marginalisation of the areas concerned in terms of the economic, cultural and social respect. Overgrowing has become a serious problem for Slovenia. [6,8]. Although forest activities predominate in Less Favoured Areas, agricultural production has still an important role for the preservation of the sustained presence of the population and for the maintenance the cultural landscape. Mountain agriculture fulfils many more functions than just the production of organic material. Appropriate management strategies and policies are needed to safeguard cultural landscapes and heritages and to counteract emigration, depopulation, socio-economic decline, loss of cultural identity, land abandonment and decline in biodiversity. In Slovenia, efforts for stimulating farm competitiveness, to settle the rural regions and to preserve the cultural landscape are registered as important goals in the Slovenian agricultural development strategy [9].
2. Material and methods 2.1 Studied region The farms parcels on the mountain region in North -east of Slovenia, which follows the classifications for mountain areas, were studied. All municipalities of the studied region are
72
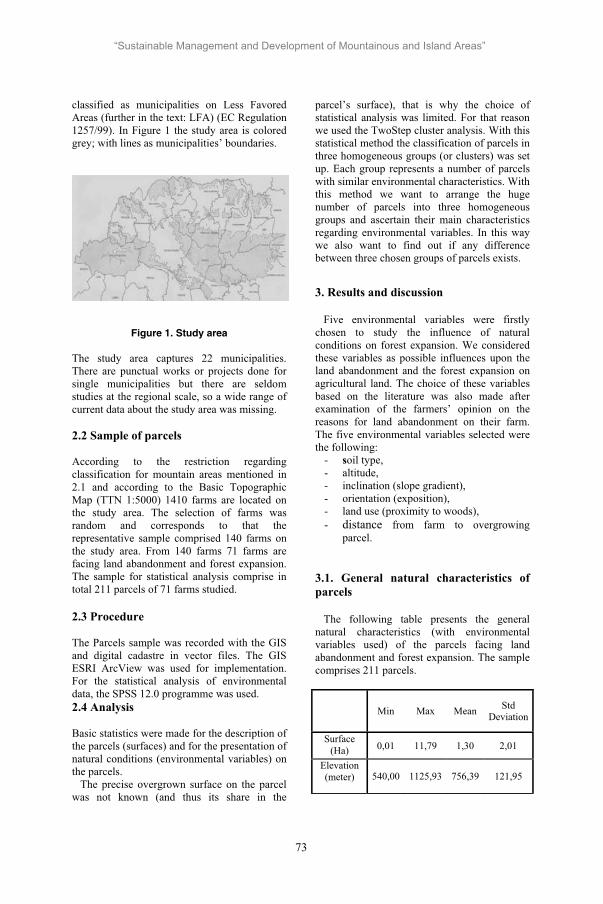
classified as municipalities on Less Favored Areas (further in the text: LFA) (EC Regulation 1257/99). In Figure 1 the study area is colored grey; with lines as municipalities’ boundaries.
Figure 1. Study area
The study area captures 22 municipalities. There are punctual works or projects done for single municipalities but there are seldom studies at the regional scale, so a wide range of current data about the study area was missing.
2.2 Sample of parcels
According to the restriction regarding classification for mountain areas mentioned in 2.1 and according to the Basic Topographic Map (TTN 1:5000) 1410 farms are located on the study area. The selection of farms was random and corresponds to that the representative sample comprised 140 farms on the study area. From 140 farms 71 farms are facing land abandonment and forest expansion. The sample for statistical analysis comprise in total 211 parcels of 71 farms studied.
2.3 Procedure
The Parcels sample was recorded with the GIS and digital cadastre in vector files. The GIS ESRI ArcView was used for implementation. For the statistical analysis of environmental data, the SPSS 12.0 programme was used. 2.4 Analysis
Basic statistics were made for the description of the parcels (surfaces) and for the presentation of natural conditions (environmental variables) on the parcels. The precise overgrown surface on the parcel was not known (and thus its share in the
parcel’s surface), that is why the choice of statistical analysis was limited. For that reason we used the TwoStep cluster analysis. With this statistical method the classification of parcels in three homogeneous groups (or clusters) was set up. Each group represents a number of parcels with similar environmental characteristics. With this method we want to arrange the huge number of parcels into three homogeneous groups and ascertain their main characteristics regarding environmental variables. In this way we also want to find out if any difference between three chosen groups of parcels exists.
3. Results and discussion
Five environmental variables were firstly chosen to study the influence of natural conditions on forest expansion. We considered these variables as possible influences upon the land abandonment and the forest expansion on agricultural land. The choice of these variables based on the literature was also made after examination of the farmers’ opinion on the reasons for land abandonment on their farm. The five environmental variables selected were the following:
- soil type, - altitude, - inclination (slope gradient), - orientation (exposition), - land use (proximity to woods), - distance from farm to overgrowing
parcel.
3.1. General natural characteristics of parcels
The following table presents the general natural characteristics (with environmental variables used) of the parcels facing land abandonment and forest expansion. The sample comprises 211 parcels.
Min Max Mean StdDeviation
Surface (Ha) 0,01 11,79 1,30 2,01
Elevation (meter) 540,00 1125,93 756,39 121,95
73
“Sustainable Management and Development of Mountainous and Island Areas”
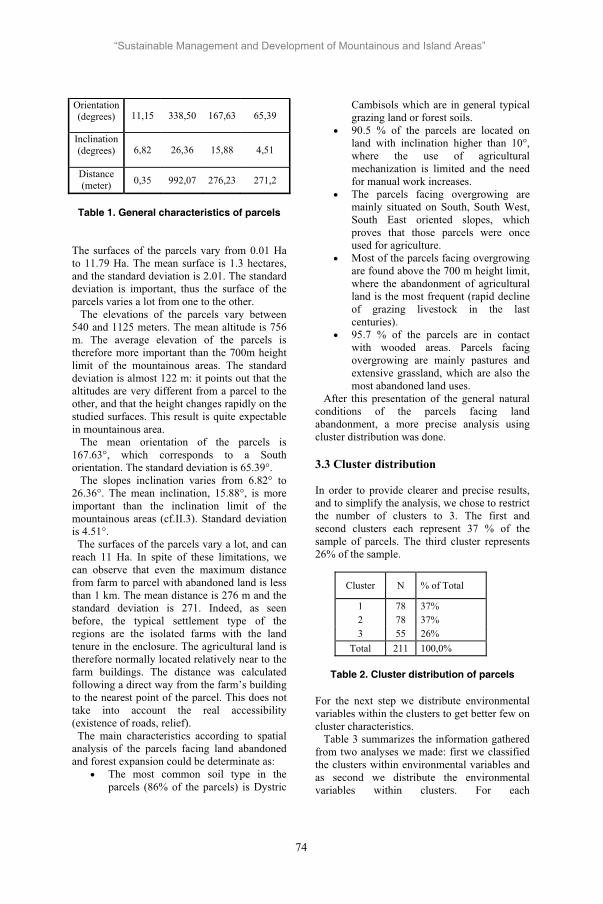
Orientation (degrees) 11,15 338,50 167,63 65,39
Inclination (degrees) 6,82 26,36 15,88 4,51
Distance(meter) 0,35 992,07 276,23 271,2
Table 1. General characteristics of parcels
The surfaces of the parcels vary from 0.01 Ha to 11.79 Ha. The mean surface is 1.3 hectares, and the standard deviation is 2.01. The standard deviation is important, thus the surface of the parcels varies a lot from one to the other. The elevations of the parcels vary between 540 and 1125 meters. The mean altitude is 756 m. The average elevation of the parcels is therefore more important than the 700m height limit of the mountainous areas. The standard deviation is almost 122 m: it points out that the altitudes are very different from a parcel to the other, and that the height changes rapidly on the studied surfaces. This result is quite expectable in mountainous area. The mean orientation of the parcels is 167.63°, which corresponds to a South orientation. The standard deviation is 65.39°. The slopes inclination varies from 6.82° to 26.36°. The mean inclination, 15.88°, is more important than the inclination limit of the mountainous areas (cf.II.3). Standard deviation is 4.51°. The surfaces of the parcels vary a lot, and can reach 11 Ha. In spite of these limitations, we can observe that even the maximum distance from farm to parcel with abandoned land is less than 1 km. The mean distance is 276 m and the standard deviation is 271. Indeed, as seen before, the typical settlement type of the regions are the isolated farms with the land tenure in the enclosure. The agricultural land is therefore normally located relatively near to the farm buildings. The distance was calculated following a direct way from the farm’s building to the nearest point of the parcel. This does not take into account the real accessibility (existence of roads, relief). The main characteristics according to spatial analysis of the parcels facing land abandoned and forest expansion could be determinate as:
The most common soil type in the parcels (86% of the parcels) is Dystric
Cambisols which are in general typical grazing land or forest soils. 90.5 % of the parcels are located on land with inclination higher than 10°, where the use of agricultural mechanization is limited and the need for manual work increases. The parcels facing overgrowing are mainly situated on South, South West, South East oriented slopes, which proves that those parcels were once used for agriculture. Most of the parcels facing overgrowing are found above the 700 m height limit, where the abandonment of agricultural land is the most frequent (rapid decline of grazing livestock in the last centuries).95.7 % of the parcels are in contact with wooded areas. Parcels facing overgrowing are mainly pastures and extensive grassland, which are also the most abandoned land uses.
After this presentation of the general natural conditions of the parcels facing land abandonment, a more precise analysis using cluster distribution was done.
3.3 Cluster distribution
In order to provide clearer and precise results, and to simplify the analysis, we chose to restrict the number of clusters to 3. The first and second clusters each represent 37 % of the sample of parcels. The third cluster represents 26% of the sample.
Table 2. Cluster distribution of parcels
For the next step we distribute environmental variables within the clusters to get better few on cluster characteristics. Table 3 summarizes the information gathered from two analyses we made: first we classified the clusters within environmental variables and as second we distribute the environmental variables within clusters. For each
Cluster N % of Total
1 78 37% 2 78 37% 3 55 26%
Total 211 100,0%
74
“Sustainable Management and Development of Mountainous and Island Areas”

environmental variable we use different classes (values). For soils we use eight different soil types accruing in the area, for the elevation we use four elevation classes, for elevation eight classes, and four classes for orientation. The classification and distribution results can help us gather the main characteristics of the parcels for each cluster. The first important information is that the number of parcels facing forest expansion is quite equal in each cluster. It could be explained by the fact that environmental variables chosen in this analysis do not influence the size of overgrowing areas to a great extend.
Among the different parcel types estimated with the TwoStep cluster analysis, the quality of soil does not seem to vary much. In fact, the soil composition of the region is quite homogeneous. The main differences appear in the altitude, inclination and orientation. The parcels from the first cluster are characterised by a quite favourable orientation for agricultural use, lower altitudes which can mean a milder climate. However, their location on steeper slopes can be an obstacle to the work and to the mechanization for instance. The parcels from the second cluster, compared to those from other clusters, seem to have the relatively most “favourable” agricultural conditions regarding threatening variables. Inclination mostly between 10° and 20°, but also less than 10°, situation on the sunny sides with altitudes under 800 meters express quite suitable conditions . Parcels from the third cluster are in general less oriented to the south, and are located on intermediary and steep slopes. Moreover, they are mostly found at high altitudes (above 800 meters). Agricultural conditions seem to be less
favourable on these parcels. In this cluster the number of parcels facing overgrowing is smaller. This is reasonable because on those areas, the least agricultural land use is found. These parcels (once classified as agricultural land) are already mostly covered with forest and were abandoned more then 20 years ago. In that case overgrowing process already finished [7]. In general, unfavourable natural conditions are causes of land abandonment. In our case, the abandoned parcels with at least beginning of forest expansion are indeed mainly located on steep slopes, or/and at high altitudes above 700 meters. However, for the parcels characterised by relatively more “favourable” natural conditions- for instance lower altitudes - forest expansion is expected to be faster [1]. Moreover, almost every parcel studied is in contact with wooded area. We can thus suppose that the struggle against forest expansion is for these reasons also intense at lower altitudes. But the natural conditions, alone, cannot explain the whole phenomenon of land abandonment and, consequently, overgrowing. Indeed, as illustrated by Cunder [4] the abandoning of agricultural land can be defined as a reflection of a disturbed balance between the socioeconomic situation of agricultural population and the natural disposition for agricultural production.
Environmental variables
Cluster 1 (parcel type 1)
Cluster 2 (parcel type 2)
Cluster 3 (parcel type 3)
Soil type Mainly Dystric Cambisols
Mainly Dystric Cambisols. Small part of Dystric Leptosols
MainlyDystric Cambisols but more diverse composition. Small part of Rendzic Leptosols
Altitude Lower altitudes Altitudes in the low and middle classes
Higher altitudes
Inclination Mostly steeper slopes
Mostly intermediary and gentler slopes
Intermediary and steeper slopes
Orientation Only E,SE,S and W
Mostly E, S, SW and W, few to the North
Less oriented to the S, orientation less favourable
Table 3. Environmental characteristics of parcels
75
“Sustainable Management and Development of Mountainous and Island Areas”

4. Conclusion
Adding the research results from previous works [2], [3], [5] allow us to draw up a more precise profile for the farms with land abandonment and forest expansion areas. These ones are:
- relatively wide - with relatively large forest and pasture
areas- with relatively low livestock pressure on - pastures - much diversified, with various crops and - livestock combined production
orientation - with relatively less working people (per
ha and- per live stock unit) - part-time farms for more than half of
them- mostly not requesting subsidies
In these farms, the overgrowing occurs on parcels:
- at high altitudes, mostly upper than 700 m
- mainly East and South oriented - situated on steep slopes, with inclinations
upper than 10° - bordering on wooded areas - which mostly used to be pastures, in a
smaller amount meadows From these results, some propositions can be made to limit or stop the land abandonment and the consequent overgrowing:
- since farms facing overgrowing are much diversified, more specialised farms would be more efficient against overgrowing.
- Pastures, on which overgrowing mostly occurs, could be maintained with a higher herbivore pressure (especially cattle or small ruminants as once in the past).
- Efforts to maintain clear agricultural land should be concentrated on the bordering areas of the farms, at the edge of the woods, where parcels with overgrowing areas are mostly located.
- Large agricultural population must stay and work on the farms for a better management and maintaining of the agricultural land.
- The purchase of specialised machinery adapted to the work on steep slopes could be a solution to go on with the exploitation of all the parcels.
- More information could be sent to the farmers about the subsidies they have the right to get.
With the integration of the future studies on social and economic aspects of the farms, a better comprehension of the forest expansion will be allowed. In addition to a political approach, all the results of the project could lead to the formulation of relevant proposals to stop the unwished processes in the region.
5. References
[1] Baur P., Bebi P., Boesch R., 2002. Forest Expansion in the Swiss Alps: A Quantitative Analysis of Bio-Physical and Socio-economic Causes, Austrian Journal of Forest Science, 3/4, p. 217-230.
[2] Borec A., Flambard A., Pažek K., 2004. Relationships between production system of Slovenian mountain farms and dynamics of overgrowing areas, Agricultura, Vol.3 – No.1, p. 32-36.
[3]Borec A., Pažek K., Flambard A., 2004. Relations between land-use and socio-economic structure on farms with and without agricultural land abandonment, Annales, Series historia naturalis, Letn. 15, No. 1.
[4] Cunder T, 1998. Zaraš anje kmetijskih zemljiš v slovenskem alpskem svetu [Abandoning of agricultural land in the Slovenian Alps]. Sonaravni razvoj v slovenskih Alpah in sosedstvu - 1. Melikovi geografski dnevi, Kranjska Gora, 5. - 7. November. Ljubljana: Filozofska fakulteta,
[5] Flambard A., 2004. Situation of the mountain farms facing overgrowing in North-East Slovenia. Mémoire de Fin d’Etudes: ENSAR 151: Génie de l’Environnement.95 p.
[6] Ministrry of Agriculture, Forestry and Food, 2001. Slovene agri-environmental programme: 2001-2006. Ljubljana : Ministry of Agriculture, Forestry and Food. 72 p.
[7] Ministry of Agriculture, Forestry and food, 2004. Informatic file. RABA – Interpretacijski klju za zajem dejanske rabe kmetijskih zemljiš . [Landuse interpretation key]. URL: http://rkg.gov.si/GERK/docs/RABA_IntKljuc.pdf
76
“Sustainable Management and Development of Mountainous and Island Areas”

[8] Perko F., 2004. Gozd in gozdarstvo Slovenije [Forêts et foresterie en Slovénie].Ljubljana: Ministry of Agriculture, Forestry and Food. 39 p.
[9] Volk T, Rednak M, Senega nik L, 1992. Strategija razvoja slovenskega kmetijstva [Development Strategy of Slovenian Agriculture]. Ljubljana: Ministry of Agriculture and Forestry.
77

Developing a Method to Evaluate the Contribution of Different Human Activities to the Sustainable Development of Islands:
A case Study on Marine Aquaculture
Chatziefstathiou Michael President, Panhellenic Society of Technologists Ichthyologists (PA.S.T.I.), Piraeus, Hellas.
PhD Candidate, University of the Aegean, Department of Environment, Laboratory for Local & Insular Development, University Hill, GR-81100, Mitilini, Hellas (GR).
E-mail: [email protected]
Spilanis Ioannis Assistant Professor, University of Aegean, Department of Environment, Laboratory for Local
& Insular Development, University Hill, GR-81100, Mitilini, Hellas (GR).
Vayanni Helen PhD Candidate, University of Aegean, Department of Business Administration, Chios, Hellas
Abstract. In modern societies, sustainability rather than the economic development seems to be an overall goal. Nonetheless, although measurement of economic development through GDP is effective, sustainability evaluation and comparisons have limited applications. Our Laboratory has elaborated a method to estimate the economic, social and environmental status of the islands and the driving forces that underpin them. For the purposes of the evaluation of the role of different human activities, variables and indicators have been utilised in order to measure their impact on the area, the factors affecting these impacts, and also their contribution to sustainable development. Hereon the application of the above-mentioned method concerns marine aquaculture and its role to the sustainable development of islands.
Keywords. Aquaculture, conflicts, islands, sustainable development.
1. Introduction
All the islands of the European Union have been facing to a greater or lesser extent similar problems: isolation, remoteness, limited natural and human resources, problems in economic development and fragile environments [11]. According to EuroStat, and for planning reasons, an island is a area surrounded by water, inhabited at least by 50 people, not linked to mainland by a permanent device (bridge etc), no less than 1 Km from mainland, with no capital of Member State.
Following that rule, e.g. Cyprus, even if it is the third largest island in the Mediterranean Sea, it is not an island. The need for such a rule is that we must be able to apply specific island policies to the regions that really need them, such as small islands or an archipelago, and not to the Island States of Europe or some islands that have minimised the “Island Phenomenon” (a point to which we shall return later in more detail).
However, saying that does not mean that the latter have resolved their problems, but that other development policies need to be initiated.
At the same time, as world population is growing and the levels of wild capture fisheries decrease, with an increasing recognition of seafood as part of a healthy diet and a growing affluence among the populations of some key export markets, an enormous opportunity for islands is reflected in further development of the marine aquaculture industry, mainly towards the production of premium species [15]. This presentation constitutes part of a larger scale research, which aims at examining the problems raised in relation to the efforts made for marine aquaculture to be established in islands [25], and also further examines whether marine aquaculture as an activity contributes to the sustainable development of island regions.
The accomplishment of sustainability goals remains crucial for their future [11], as well as the development of aquaculture [14], and in this paper we will attempt to examine the major issues arising today, based on the hypothesis that islands need further economic development [13].
78
“Sustainable Management and Development of Mountainous and Island Areas”

2. Sustainable Development and Island Regions
Data concerning the exact situation of the island regions and in particular regarding the nature, extent and evolution of their problems, are often incomplete, out of date or insufficient. Problems of size, remoteness, status and isolation need to be analysed using conceptual tools [12].
Apart from the different existing definitions of what constitutes an “island”, it seems more suitable to refer to the more holistic notion of insularity. The concept of insularity extends beyond the simple geographic boundaries and includes biogeographical, sociological and economic concepts. Insularity can be defined, in the field of social sciences, as “being the result of a conjunction between a geographical condition and the reactions of political, social, economic and cultural peripheralisation” [19].
According to many researchers [2] [1], the sea is just one of a series of media which act as frontiers or barriers to transfers. In other words, literal islands, surrounded by water, are only one sort of insular situation in the physical world. Horden and Purcell [20] refer to virtual islands and quasi-insular regions, while Braudel [2] refers to islands not surrounded by sea, while they emphasise the notion of pen-insula.
Islands and mountains have more things in common than we can observe in first instance. As an example, mountain societies and the way they communicate with other mountain areas and plains form an analogue with the sea. Points where the mountains reach the coastlands can parallel the significance of great ports [20].
This analogy of mountain and island regions can also be traced at the policy level. The EC has recognized the existence of regions whose permanent natural handicaps limit their potential for development in specific ways. The three types of regions thus defined are mountain areas, territories with a low population density and island territories. It should also be recognized that many mountain areas occur on islands. Moreover, the EC proposes similar measures of policy for both mountain and island territories.
Conceptually, diagnosis is known: scarce resources leading to rarity and lack of diversification; small local market leading to exposure to outside; single-production exports; natural risks; lack of economies of scale and economies of agglomeration for both the private sector and the public infrastructures; reduced competition and disadvantage of dispersion.
It is very difficult to measure the island specificities linked to the rarity of their natural resources, their ecological fragility, transport overcasts, and degree of dependence on market economy. Certain comparative advantages have enabled islands to develop certain social or economic mechanisms favourable to their populations. The specific characteristics of the islands arise from the above set of factors, and the "island phenomenon" is defined by a combination of these factors. Insularity may not in itself be the determining factor in explaining the economic development [12].
However, all these characteristics affect the economic development of islands. Combined effects of size, dependence and distance implied different consequences (e.g. turn of priority from island’s self-sufficiency on food, to mass agricultural production) in combination with the different economic systems determine the type of development of each island. Undoubtedly, the ruling economic system of 20th century based on the mass and homogeneous production has marginalized the islands.
One fact which always holds true is that the islands are smaller than the mainland areas. While this seems to be stating the obvious, it nevertheless leads to a very simple first level of reasoning. Because of its endemism to islands, smallness implies rarity. Rarity and openness to the outside are factors that lead to a high degree of dependence, due to a single-product export activity and a high level of imports.
The term “sustainable development” together with the socio-economic development imply the informed and conscientious management of natural resources, which have been exploited or utilized by humans, so that these resources may be capable of exploitation over time.
Whatever the various definitions may be [8], they are all translated into “development that respects environment, enabling harmonious economic and social progress”. Sustainable development of islands calls for sustainable management that implies both the consideration of environmental content in activities, such as industry, tourism and leisure, fishery, agriculture, aquaculture, as well as management of coastal resources, ecosystems, water quality etc [32]. Small islands, especially, required an agro-ecological approach in the pursuit of sustainable development [3]. Human activities like fisheries, agriculture, forestry, have provided for centuries the main source of livelihood for the population of the many problematic nowadays islands.
79
“Sustainable Management and Development of Mountainous and Island Areas”

Their sustainable management is fundamental for the future. Work in small islands involves the consideration of a series of constraints and potentials in various aspects of development:
Economic issues: narrow resources, isolation from markets, vulnerability to international markets, erosion of trade arrangements, high level of external aid, net food importers, dominance of tourism and public sector. Environmental issues: vulnerability to natural hazards, degradation and over-exploitation of natural resources, rich biodiversity, loss of traditional agricultural systems. Social issues: limited variety of dietary intakes and nutritional problems, institutional "brain drain", scarcity of skilled manpower and weak institutional capacities. Due to increasing human population pressure,
changing socio-economic structures, exploitation of natural resources and variable environmental conditions, islands need an interdisciplinary, integrated management strategy founded on values that will enable long-term sustainability.
Technical solutions to most problems in the environment do exist [6]. Unfortunately science and technology often pushed aside from short-term social or economic considerations, having a few good examples (e.g., ecotourism is an area with a harmony of social, economic, scientific and technical considerations).
In the Mediterranean region, tourism is the largest industry. Uncontrolled development and thoughtless use of nature has disturbed this region’s resources. In this area degraded coastal zone has been the focus of many international organizations trying to find solutions to the problems created by mass tourism.
The disenchanted tourist is moving toward pristine islands to capture what used to be on the main land. It is only a matter of time until tourism will also ruin the pristine islands [17]. Tourism and its development in Greek islands during recent decades have stopped their economic and demographic decline. However the conventional tourist model, based on sun, sea and sand (3S) seems to have failed to promote their sustainability due to the decreasing economic benefits for host communities and the continuous growth of environmental pressures.
The latest trend in Greece and elsewhere is a shift from mass tourism to environmentally friendly and sustainable forms of tourism, and also an interest for promotion of human activities related to the primary sector of economy (rural development) [29] [9].
Sustainability strategies should be established and supported within the context of natural resources limitations and of socio-cultural constraints. The management objective is to develop "limits on acceptable change" to assess stress in the natural, social, and economic environment [17].
3. Measuring Sustainable Development of Island Regions
The sustainability analysis calls for the consensual setting of a "band of equilibrium" for a list of key indicators making it possible to evaluate the sustainability of the present situation in the region in question, and to determine what is desirable and what is unacceptable.
The projection of these indicators, based on the prospective of the hereon-studied system, also makes it possible to evaluate the region's sustainable development levels and thus its future sustainability.
As part of our research, we will attempt to develop suitable indicators as a tool to estimate the contribution of aquaculture, and compare different islands and level of development that can be applied to each one. In achieving this, we will take into account the economic, social and environmental aspects of aquaculture and the limitations derived from the island status. After that a case study will be followed, based on this method and series of indicators [7]. Our research aim is to define the main factors that maximise the benefits and minimise the cost, helping us to create a simple method that can promote the eligible activity for each area, and followed by the proper policy may contribute to the sustainable development of each specific island.
Although many times it is common practice to develop a single indicator of sustainable development, this logic has not been adopted here. Reasons for this are that the adopted definition of sustainable development indicates that we must have a clear picture of the progress in each one of the three dimensions separately.
Moreover, when a single index is developed, the policy makers cannot make clear suggestions. In order to do this the overall number of factors must be taken into consideration. This does not mean that the different factors of each one of the three dimensions of sustainability (economy, environment and society) must be appointed the same weight factor.
80
“Sustainable Management and Development of Mountainous and Island Areas”

For example, in the case of tourism, it can be assumed in general that every action plan for a region, which seeks to move away from the model of conventional tourism and apply new forms of tourism, is welcome, since it contributes to the selected area’s sustainability.
On the other hand, it is considered as too utopian to believe that the development of economically sustainable tourism activities will have absolutely no environmental impact [29].
Changing the conventional tourism model - or any model of an already established intensive human activity with no consideration of social and environmental impact - is not an easy task because it is based on strong market mechanisms.
The evaluation of each human activity can be based on two criteria: first, the performance per productive unit, which relates to the added value and the employment created per unit, as well as the consumption of water and energy and the production of wastes per unit; and, secondly, the scale of the activity compared to the carrying capacity of the host area for all the human activities happening there.
Even if the performance per unit is improved, every area has its own environmental, social and economic limits that cannot be surpassed [29].
In this work, following the method developed by the Laboratory of Local and Insular Development [30], sustainable development is not envisaged as an ‘end in itself’ target, but as a continuous process of development, which leads simultaneously to the improvement of economic, social and environmental goals adopted by each society. This approach is shown in Fig. 1.
Figure 1: Sustainable development as a continuous process of development
For the purposes of the method that we develop, following the UNEP’s DPSR analysis (Driving force, Pressure, State, Response) (Fig. 2), the evaluation of any activity (like tourism or aquaculture) has been based on two criteria.
First, the activity performance per production unit, which relates to the added value and the employment created at the area per production unit (overnight staying for tourism, kg for cheese, tonne for farmed fish), as well as the consumption of water and energy and the production of wastes per unit; and second, the scale of the examined activity compared to the carrying capacity of the host area.
The horizontal axe represents the socio-economic development while the vertical axe the environmental protection. The curves S1, S2, Sn are indifference curves that represent different levels of sustainability.
The dotted horizontal lines indicate the different levels of environmental protection: Very Weak Sustainability (VWS), Weak Sustainability (WS), Strong Sustainability (SS), and Very Strong Sustainability (VSS).
Examining the sustainability on the curve S1,the movement from point 1 to point 2 indicates a lowering of socio-economic development and an increase of environmental protection.
According to this, we consider as sustainable any form of activity that, in a given region, alters the conventional produced service or product to have more economically profitable and / or more environmentally friendly result.
Figure 2: Framework of analysis
Adoption of the DPSR framework helps us to separate the causes (driving forces, the human activities examined) from the pressures (at the region, from these activities) and parameters that describe the state of an area.
The focus of the DPSR framework was broadened to include not only environmental but also economic and social issues, and led to the classification of factors – used also in the international literature – into the four categories of the DPSR framework.
81
“Sustainable Management and Development of Mountainous and Island Areas”

4. Case study selection: Aquaculture
It would be useful and illustrative to do the following exercise: imagine for a moment that beef and poultry in your home’s refrigerator have not come from ranches and farms, but from the woods and prairies. Also imagine that every pig, chicken, turkey, labelled as “free range”, has been hunted from the wild herds and has also been brought into the market.
What would this then mean to the consumer? In the simplest terms, it would imply that the local supermarket would have higher prices and a less dependable and plentiful supply of meat [23]. On the other side, the pressure on the wild herds in order to find enough food for increasing population would have already caused the extinction of a lot of species. The idea of abandoning our modern practice of raising domestic animals and harvesting all our meat from the wild is irrational and non sustainable with the existing population. And yet that is exactly how we have obtained most of our seafood until quite recently.
Aquaculture, or fish farming, can change how we think about one of our main sources of protein. With many fish stocks shrinking due to over fishing or environmental degradation, aquaculture holds the promise of a more reliable and more sustainable seafood production.
The Food and Agricultural Organisation (FAO) of the United Nations defines aquaculture as “Farming of aquatic organisms including fish, molluscs, crustaceans and plants, with some form of intervention in the rearing process to enhance production, such as regular stocking, feeding, protection from predators etc. Farming also implies individual or corporate ownership of the stock being cultivated”.
It is generally recognised that the most known commercial fish species are at, or near, full exploitation and internationally many have exceeded the maximum sustainable yield and are already at or beyond the point of commercial extinction [8]. The world’s increasing demand for seafood can only be met through aquaculture and it is expected to dominate global fish supplies by 2030, with less than half the fish consumed coming from capture fisheries [18]. The main problem of capture fisheries is that there are too many vessels for the available fish. Result of this imbalance is that for an increasing number of fish stocks, the quantity of mature fish is below the minimum estimated as necessary to
provide high probability of sustainability (based at the precautionary level of stock biomass).
If current trends continue many fish stocks will collapse, damaging the fishing industry as a biological collapse would lead to the economic decline of the fishing fleet. On the contrary, aquaculture is recognised as playing an increasing role in addition of choice of quality fisheries products for the consumers; nevertheless without increasing fishing pressure, together with the provision of an alternative employment in the areas dependent on fisheries.
Aquaculture has an important role to play in coastal (rural) development and in reversing decline in fishing communities. It is also a fact that EU Member States are encouraged by the EU Commission to adapt funding opportunities for aquaculture to underline the role of women and encourage the use of European Social Fund programmes to improve opportunities in aquaculture. Fish farming typically involves the enclosure of fish in a secure system under conditions in which they can grow [24]. Aquaculture is usually dependent on natural ecosystems [25]. It can impact on freshwater supplies, modify coastal habitats, compete with commercial wild catch, or through escape, introduce non-indigenous organisms and diseases to the environment [16].
As a result of its rapid growth in recent years, aquaculture industry is facing a number of challenges in terms of market and environment. Its future will depend on its ability to become economically viable and its capacity to respond to environmental constraints. Increase in its production must come from diversification in new species and from making aquaculture more environmentally friendly [8] [10] [4]. The establishment of fish farms at islands is based – by economic way of speaking – on a comparative advantage: the farms, mainly in floating cages, use two recourses that are in a great abundance at the islands, (clean) sea and easy access from the (remote) beaches.
So, even if today there are some difficulties, i.e. island isolation, distance from the main fish markets and the increased transport cost, the investors will continue to show an interest in establishing fish farms at the island regions [26]. There is, however, a question about whether and how this human activity can contribute to the islands sustainable development. Some aspects regarding the fast aquaculture development require more particular attention. Concerns relate to environment, health and animal welfare issues,
82
“Sustainable Management and Development of Mountainous and Island Areas”

as well as potential conflicts with fisheries and recreational activities.
Even if aquaculture constitutes a dynamic sector of primary production, it also faces significant structural problems. Analysis of profitability ratios [27] has led to findings, which could be the basis for enhanced decision-making.
Statistical analysis of the profitability ratios was performed, placing the farms in order of size, on the basis of financial criteria, such as solvency ratios, etc. Evaluation of estimates has revealed that sea bream and sea bass sector are exceptionally heterogeneous from the aspect of managerial effectiveness. The level of “total assets turnover ratio” consists to a significant criterion of size.
Detailed field study at two Greek islands [22] analysed impacts on employment, income, and area production, and has highlighted the great importance of this form of development to the local economy.
Estimation of regional multipliers indicates that an increase in aquaculture production would increase the income of the prefecture by between 0.28 and 0.68 units.
Although the area has a strong primary sector, this does not result in any significant exports, as the majority of production is consumed locally.
On the contrary, the contribution of marine aquaculture exports to the total exports of the prefecture is greater than the total exports from the rest of its primary sector. Also, the aquaculture sector has inputs amounting to 35% and exports to 95% of the production value.
Increase of production value by l unit leads to increase of regional product by 0.68 units and to an increase in the income generated from aquaculture by 0.65 units.
The specific analysis has demonstrated that the impact of aquaculture farms is significant for the islands, not only due to the localized effects of jobs creation, but also because of their significance for the islands, as the main activity generating income and exports.
There are certain noticeable advantages in local employment and income terms that call for the support of marine aquaculture development in both islands.
Thus, if this angle is considered, it helps to reduce or even avoid social conflicts. Outlining the contributions to the sustainability of local economy can assist in alleviating opposition to aquaculture development by local communities.
The very significant benefit from reducing the pressure to the global fish stocks are not easily and clearly visible to local communities
and as it appears does not concern them at all, even if their economy depends on fisheries. In this point we must notice that the main effect from aquaculture waste is the increase of the concentration of nutrients at natural water column and the potential increase of plankton populations [3] [22].
Also that wastewater from marine aquaculture differs in a very substantially manner from the municipal wastewater (sewage).
Sewage contains high volumes of organic matter and harmful for human microbial load, in contradiction with aquaculture wastewaters that their composition is similar to natural waters. Source of nutrients mainly are fish feeds remains and water-soluble fish excreta, well known to the marine bacteria [5].
Recent results [22] indicate that fish farming zones examined under the present levels of production and at the present scheme of site selection procedures do not impose significant changes on macrofaunal community attributes.
Even if fish farming releases considerable amounts of nutrients in the water column it seems that these do not affect the productivity in a way that could negatively affect the benthic environment beyond the zone at the immediate vicinity of the farms.
These consequences have differential effects, depending on the physical and socio-economic characteristics of each island, having as a result different behaviour and reactions from the local inhabitants and different developing routes for the fish farm companies.
There is also a social and cultural dimension to public acceptance of aquaculture development and people’s perceptions of the environment and the condition of the coastline can account for a large proportion of the problems, according to the study [22] focused on the identification of potential conflicts and the analysis of impacts occurring from aquaculture farms on the islands of Cephallonia and Ithaki, in western Greece. Greek society and especially small isolated communities are faced with numerous cultural and other obstacles when pursuing collective decisions and attitudes to resolve environmental and sustainability problems, such as preference of individualistic methods when solving one’s own problem, short-sightedness, scientific fuzziness, confusion of priorities.
Scientific knowledge and data are not always at hand and experts’ views may be manipulated to serve political or economic interests. It may also happen that non-scientific, biased, interest-
83
“Sustainable Management and Development of Mountainous and Island Areas”

oriented or intuitive views are well disguised as scientific ones [28].
In such a framework, and as the rules of communicative process equate the scientific information with the prejudiced information, stakeholders find it very easy to ignore the scientific aspects of complex environmental and development problems.
Under these circumstances and because each one of the stakeholders usually carries prejudiced knowledge, the scientific information, collective knowledge and consensus become useless.
Sapountzaki and Wassenhoven [28] state that the local societies usually pursue individualized, instinctive solution and practices.
The motive behind this is that the resource constraints introduce a requirement for priority setting, thus selecting policies or projects where the financial resources will be directed, always involves trade-offs due to political, legal, social, cultural, economic and scientific constraints.
Marine aquaculture (or Mariculture) is a new competitor for the same limited resources and this antagonism should be judged on the basis of the efficiency of resource utilize as well as the environmental compatibility.
Common criteria should be employed in the evaluation of all potential users, and thorough economic evaluation, including socio-economic and environmental costs and benefits, is a good way to achieve this.
Many activist environmental groups currently consider marine aquaculture to require extremely tight regulations in comparison with the other human investments in the same regions.
However, such expressed views are not based on realistic estimates of relative costs / benefits (including environmental costs) associated with mariculture and other forms of development [4].
For example, the relation between aquaculture and tourism is controversial. The coexistence of both activities can lead to positive and negative impacts. In terms of negative impacts, marine aquaculture can pose constraints on the use of the shoreline for tourism-related activities, such as bathing, fishing, and boating.
It can also be a source of water pollution due to nutrients released into the water and to noise pollution, decrease a coastal area’s biodiversity or degrade the landscape.
But there are also strong positive effects, such as the increase of fish stocks for fishermen as a result of marine aquaculture, good quality of fish for tourists and restaurants, and occasionally serving as a tourist attraction [22], by including
activities such as visits for fishing included in alternative tourism packages.
5. Discussion
The sustainability level of an area is higher if its development is not dependent on a single activity: the economic risk then is lower and the stress on some of the natural resources of the area is less important [32].
Aquaculture on islands is a great example of how to become sustainable and how not to. The islands represent ‘small globes’ and can show more easily how the process of globalisation and self-sustainability can be implemented.
In this approach aquaculture can contribute by increasing household food supply and improving nutrition, increasing household economy through diversification of income and food sources; to strengthen economies by increasing the employment and reducing the food prices; improving water resource and nutrient management at community level; preserving the aquatic biodiversity through re-stocking and recovering of protected species.
Also, it can help to reduce pressure on fishery resources, improve natural habitats, stimulate in local level to the research and technological development, and, finally, increase education and environmental awareness in small communities.
The main question asked hereon, whether the mariculture can improve the sustainability level of an island region, is only a part of the above actions and refers directly and exclusively to the island ecosystems:
Concerning the economy, there are indirect and co-occurring consequences because of the demand that this human activity will cause (e.g. transportation, house renting, etc), and few clear and easy to describe cases of direct consequences arising from aquaculture in local level, because the specific investments mainly are coming from non-indigenous investors.
With regard to society and especially human resources, the establishment of a number of new working places, often for non-specialised workers, is the major direct consequence; the improvement of skills of the human recourses rarely has to do with the local inhabitants.
In relation to the environment, the conflicts at beach uses and the risk for marine pollution from malpractice and mismanagement of the farms are the negative parameters that impede the further development of fish farming.
84
“Sustainable Management and Development of Mountainous and Island Areas”

Key to achieving a successful sustainable development in the island regions is the choice of appropriate management systems and structures in combination with the deployment of more integrated marine policies [10].
In this case, all the area’s stakeholders must commonly agree upon the weight of the different factors chosen.
Participatory processes constitute appropriate practices for this purpose. Having reached such an agreement, the monitoring and evaluation processes can become more suitable and more effective.
The sustainability goals on islands exist and are predetermined and quantitative. Monitoring practices will ensure that in the course of the programs implemented, activities will not lead to the deviation from the targets.
At the end of the policy period, evaluation practices will determine whether the overall state of an area improved.
This tool can also help to determine the appropriate and inappropriate sites for projects in areas that considered suitable for development, facilitate decision making processes for spatial planning, incorporating socio-economic and environmental assessment elements, to promote sustainable development of the islands.
6. Future steps to conclude the research
The system of measurement has to be simple, relying on published or easily accessible data. Our research will continue with the elaboration of measurement methods for complex indicators (e.g. marine aquaculture inputs and outputs) and completion of data collection (some problems encountered are inadequate local cooperation, dispersion of data sources on different islands and no data in some cases).
Final steps will be the evaluation of existing data quality, the calculation and aggregation of indicators, and the assessment of the different sustainability level.
As far as the assessment is concerned, three indexes, one for each dimension of sustainability, will be formed.
The exact method for aggregation has not been determined yet, but this will be done after the completion of data collection.
7. Acknowledgements
The described method is based on an initial work funded by the Program ISTOS (Innovation for
sustainable tourism and services in the South Aegean), assigned to the Laboratory of Local and Insular Development, aimed at the construction of a practical tool for the maintenance and the improvement of sustainability at a local level. 8. References
[1] Baldacchino G. The coming of age of island studies, Tijdschrift voor economische en sociale geographie 95 (3), 272-283; 2004
[2] Braudel F. The Mediterranean and the Mediterranean world in the age of Phillip II, Vol. I. London and New York; 1972
[3] Brooks KM. Assessing the Risks: A comparison between the environmental impacts of aquaculture and traditional agriculture. Northern Aquaculture, January 2002
[4] Burbridge P, Hendrick V, Roth and E, Rosenthal H. Social and economic policy issues relevant to marine aquaculture. J. Appl. Ichthyol. 17 (2001), 194 - 206
[5] Charalambous A, Chatziefstathiou M and Makris G. Treatment and Disposal of Waste Water from Aquaculture Installation. 1st
International Congress on Aquaculture, Fisheries Technology & Environmental Management. 8 - 10 June 2002, ECEP Expo, Athens, Greece
[6] Chatziefstathiou M and Nerantzis E. Sustainable Development: From Theory to Practice. Use of industrial waste as an alternative raw material: Protein substitution of fish feeds with industrial wine distilleries wastes. 2nd Congress on Protection & Sustainable Development of Amvrakikos Gulf, Arta, Greece, 1997
[7] Chatziefstathiou M and Spilanis I. Aquacultures’ Contribution at Sustainable Development of Island Regions, 2004. AquaMedit 2004. 2nd International Congress on Aquaculture, Fisheries Technology & Environmental Management. 18 - 19 June 2004, Evgenidion Foundation, Athens, Greece, E.U
[8] Chatziefstathiou M, Charalambous A, Makris G and Kargioti I. Sustainable development: Is the use of fish meal in aquaculture compatible with the effort for sustainable management of Marine Biological Resources? 11th Panhellenic Congress of Ichthyologists, Preveza, Greece, April, 2003
[9] Chatziefstathiou M, Spilanis I and Charalambous A. Sustainable Development
85
“Sustainable Management and Development of Mountainous and Island Areas”

of Island Regions and the role of Aquaculture. EcoForum: 1st International Conference for Environmental Management, Policy and Technology. 28 - 30 June 2005, Nicosia, Cyprus, EU (Invited Speakers)
[10] Chatziefstathiou M. Environmental Management Systems (E.M.S.) and Marine Aquaculture. 6th Panhellenic Symposium of Oceanography & Fishery, Chios, 5/2000
[11] Eurisles. Off the coast of Europe. European construction and the problem of the islands. European Islands System of Links and Exchanges (Eurisles). Study undertaken by Eurisles on the Initiative of the Islands Commision of CPMR. 2002
[12] Eurisles. Statistical Indicators of Regional Disparities Caused by Insularity and Ultra-Peripherality. European Islands System of Links and Exchanges (Eurisles). Ed. Eurisles, 10/1997
[13] Eurisles. What Status for Europe Island's?. European Islands System of Links and Exchanges (Eurisles). Edition l'Harmattan. ISBN: 2-7384-9250-9. 05/2000
[14] European Environment Agency. An indicator-based approach to assessing the environmental performance of European marine fisheries and aquaculture. Scoping study. Tech. report 87. Copenhagen, 2002
[15] Frankic A and Hershner C. Seafood recipes: balancing aquaculture development with coastal planning. In: International workshop on ‘Aquaculture and Its Role in Integrated Coastal Zone Management’. European Aquaculture Society, 19–21 April, Oostende, Belgium; 2001
[16] Frankic A and Hershner C. Sustainable aquaculture: developing the promise of aquaculture. Aquaculture International 517–530, 2003
[17] Frankic A and Lynch M. ECOSTAR, A Program For Identifying Ecotourism Activities That Support Sustainable Development In Coastal Regions. World Ecotourism Conference in Honolulu, 6/1996
[18] Friends of Europe. Is fish-farming a long-term answer to the fisheries crisis? FoE, The European Trialogue, Summary of Debates. February 3, 2003
[19] Hache JD. The island question: Problems & prospects, Ekistics, 323/324, 88-92; 1987
[20] Horden P, Purcell N. The corrupting sea: a study of Mediterranean history. Blackwell Publishers, Oxford; 2000
[21] Karakassis I, Papadopoulou KN, Apostolaki E & Koutsoubas D. Mesoscale effects of fish farming zones on macrobenthic communities in the Aegean Sea. The X European Ecological Congress (Eureco '05), 11/2005, Kusadasi, Aydin, Turkey
[22] Katranidis S, Nitsi E and Vakrou A. Social Acceptability of Aquaculture Development in Coastal Areas: The Case of 2 Greek Islands. Coastal Management 31:37-53 2003
[23] Kite-Powell HL. Down on the Farm… Raising Fish. Oceanus 43 no1 2004
[24] Klaoudatos S, Conides A and Chatziefstathiou M. Assessment of the Impact of the floating cage culture systems on the Marine Environment. 3rd Panhellenic Convention on Environmental Protection, August 1996, Chania, Greece
[25] Klaoudatos S, Conides A and Chatziefstathiou M. Environmental Impact Assessment (E.I.A.) studies in floating cage culture systems in Greece. «Littoral ’96» 3rd
International Conference of the European Coastal Association for Science & Technology, Portsmouth, England, 16 - 19 September 1996
[26] Klaoudatos S, Conides A and Chatziefstathiou M. Study of the coastal and marine ecosystem of Kalloni gulf, Lesvos Island, NE Aegean Sea and organisation of a permanent remote sensing system for environmental monitoring. Final Report. Greek National Centre for Marine Research, Institute of Marine Biological Resources, Aquaculture Department; 1997
[27] Pnevmatikatou A, Batzios Ch and Katos A. Comparative investigation of profitability ratios of the sea bream and sea bass Greek aquaculture sector. 1st International Congress on Aquaculture, Fisheries Technology & Environmental Management. 8 - 10 June 2002, ECEP Expo, Athens, Greece
[28] Sapountzaki K and Wassenhoven L. Consensus building and sustainability: Some lessons from an adverse local experience in Greece. Environment, Development and Sustainability, (2005) 7: 433–452
[29] Spilanis I and Vayanni H. Sustainable tourism: utopia or necessity? The role of new forms of tourism in the Aegean Islands – Greece. In Bramwell B. (ed), Costal mass tourism. Diversification and sustainable development in S.Europe, Channel View Publications, p.269-291; 2004
86
“Sustainable Management and Development of Mountainous and Island Areas”

[30] Spilanis I, Kizos T, Kondili J, Koulouri M, Vakoufaris H. Sustainability measurement in islands: The case of South Aegean islands, Greece. International Conference on Biodiversity Conservation and Sustainable Development in Mountain Areas of Europe. 20-24 September, Ioannina, 2005
[31] Spilanis I, Misailidis N and Spyridonidis H. Accesibility in the Aegean Islands: Real and Virtual Distance. 7th Conference of the Greek Society of Cartography, Mytilini, Greece, 23-26 October 2002
[32] UNEP, MAP. Indicators for Sustainable Development in the Mediterranean Coastal Regions. Plan Bleu, Final report. Plan Bleu pour l’Environnement et le Développement en Méditerranée. Regional Activity Centre. Sophia Antipolis, December 2002
87
“Sustainable Management and Development of Mountainous and Island Areas”

Peri-urban and urban forests in Greece: Obstacle or advantage to urban development?
Olga Christopoulou Assistant Professor, University of Thessaly, Department of Planning and Regional
Development, Pedion Areos, Volos, Greece, 38334, tel.:+30-24210-74417. E-mail: [email protected]
Serafeim Polyzos Lecturer, University of Thessaly, Department of Planning and Regional Development, Pedion
Areos, Volos, Greece, 38334, tel.:+30-24210-74446. E-mail: [email protected]
Dionissios Minetos PhD Candidate, University of Thessaly, Department of Planning and Regional Development,
Pedion Areos, Volos, Greece, 38334, tel.:+30-24210-74276. E-mail: [email protected]
Abstract. Rapid urban economic activities’ growth and continuous infrastructure expansion have given rise to significant pressuring processes associated with land use conversion and modification in the periphery of cities. Community perceptions regarding peri-urban forest role have not always been straightforward. On the one hand, forests are perceived as major contributors to urban environmental sustainability but, on the other hand, they are often seen as obstacles to further urban development. Pressures on suburban forests have often resulted in illegal private dwelling construction, wildfire incidents as well as large-scale unplanned land use changes.
Keywords. Peri-urban forests, urban growth, urban development, land uses
1. Introduction Concern is rising about the adverse
consequences of peri-urban deforestation. Several studies concentrate on implications such as: (a) deterioration of multiple environmental forest functions (i.e. microclimate adjustment, atmospheric pollutants removal, clean water resource preservation, soil erosion and flooding protection, biodiversity conservation) (b) decrease in recreation alternatives and (c) indirect damaging implications on current economic activities. At the same time, shortages to the availability of developable space near urban areas cause serious problems to maintaining cities prosperity. Among others, there have been stressed considerable increases
in property prices as well as significant raise in the cost of living.
Suburban areas are transition zones from urban landscape to rural landscape. In these areas lots of different competing land uses (urban, agricultural, forest) exist. Current policy and institutional tools, such as regional and urban planning, have not always paid the necessary attention to the above processes. This paper aims at describing state as well as individual owners’ treatment towards peri-urban forests in Greece. Furthermore, an attempt is made to reveal the potential that peri-urban forests hold in contributing to urban development. Innovative, non-mandatory mechanisms, similar to United Nations’ Clean Development Mechanism (CDM), may hold considerable potential in relaxing suburban land use antagonisms towards forest preservation.
Rapid population growth in urban centres which is usually accompanied by a significant degradation in the quality of life (e.g. air pollution, high density building areas, reduced opportunities for social life etc), has led to an increase in the demand for green spaces within and around urban centres and, therefore, to the development of the urban forestry science.
Urban forestry initially emerged as a working term in North America in 1894 and was further developed to a coherent concept during the 60’s and the 70’s (Konijnendijk et al., 2006). Its focus lies on “green zones” in urban and peri-urban areas (parks, artificial urban tree rows, peri-urban forests), and encompasses the organization, planning, installation and management of trees and forest stands lying within or near urban areas
88
“Sustainable Management and Development of Mountainous and Island Areas”

(COS TE12, 1997, Nilson and Raudrup, 1988, Hatzistathis, 2002).
According to Jorgensen (1986), “urban forestry” is a specialized branch of forestry focused on tree cultivation and management issues, aiming at contributing to urban society’s sociological and economic well being. In essence, this involves an overall improvement to vegetation influence to the environment, as well as an enhancement to the recreational and general amenity values deriving from forest natural resources.
A widely accepted definition about the urban forestry concept has been put forward by Miller (1997) (Miller in Konijnendijk, 2003). In his words urban forestry “is the art, the science and the technology of managing trees and forest resources, within or around urban ecosystems, aiming at the natural, social, economic and aesthetic benefits provided from the trees to the society”. According to the British National Urban Forestry Unit (NUFU, 1999), urban forests encompass all trees and woods found in urban areas being in parks, private gardens, street sides, surrounding factories, offices, hospitals and schools and in clearings and bushy areas.
Zhang et al. (2006) believe that an urban forest is a complex ecosystem, closely related to the urban ecosystem, which incorporates and expresses the natural ecology as well as the artificial, social and economic ecology. The urban forest can be a wooded area within or near an urban area. It is mainly composed by natural or transformed forest vegetation and dimensionally speaking, ranges from 0.50 to hundreds of hectares (Tyrainen et al., 2003).
2. Historical perspective
Europe has a long and rich history regarding the planning and management of green spaces. A great deal of Central European cities, have been involved in managing neighbouring forestlands for centuries. Originally, many of the largest urban parks were created by the nobles, and public access to this land was limited. During the 19th century, when industrialisation led to a population outburst, a large number of urban authorities started to open green spaces to the public in order to contribute to the improvement of working class health issues as well as to safeguard the quality of life (Konijnendijk et al., 2006). During the second half of the 19th century, it took place a major increase in green spaces
through the opening of private gardens and parks to the public.
However, urban forestry as a scientific field of systematic research and academic preoccupation was developed in North America during the 60’s and the 70’s and in Europe mainly during the 80’s. Among European Countries, Great Britain has played a determinative as well as leading role within the field of urban forestry. Non-governmental organizations (NGOs) as well as other interested groups were actively involved in urban tree planting as well as in the creation of management plans, aimed at promoting the concept of urban forestry. In close collaboration with American NGO members, various long-term projects in a number of cities were set up (Johnston, 1997).
As regards Greece, the first urban green space was the royal garden of Athens, established during the reign of Othonas. In 1877, the Department of Forests under the Ministry of Economics carried out the first reforestation programme with Pinus halepensis on Ardettos Hill around Athens Stadium,, whilst near Zappio the first nursery garden was found. Afterwards, numerous reforestation programmes were introduced on most of the mountainous terrain around the Greek capital (Douros, 2001).
Additionally, by the end of the 19th century, a plethora of new forests were planted. However, their management was limited to protection against damages coming from logging, felling, grazing and pollarding. Those forests were initially planted on aesthetic, health or protection grounds or on a combination of the above reasons. Subsequently, they were declared as “protective” forests, an institution that was spread nation-wide to encompass also forests and forestland of villages and small communities (Kassioumis, 1994).
The “Protective” forests institution may be considered as one of the most important provisions delivered by the first Forest Law (N. 4173 / 1929) codification and it is still in operation. These forests were mainly created in high-lying, sloppy areas near urban large concentrations as well as villages in order to protect human communities against soil erosion, land-sliding and flooding. Their management regime is subject to certain restrictions (e.g protection from grazing and logging) in order to better serve the public interest.
During the 30’s, considerable land areas in Greece were planted with trees though they were not always declared as protective forests. In
89
“Sustainable Management and Development of Mountainous and Island Areas”
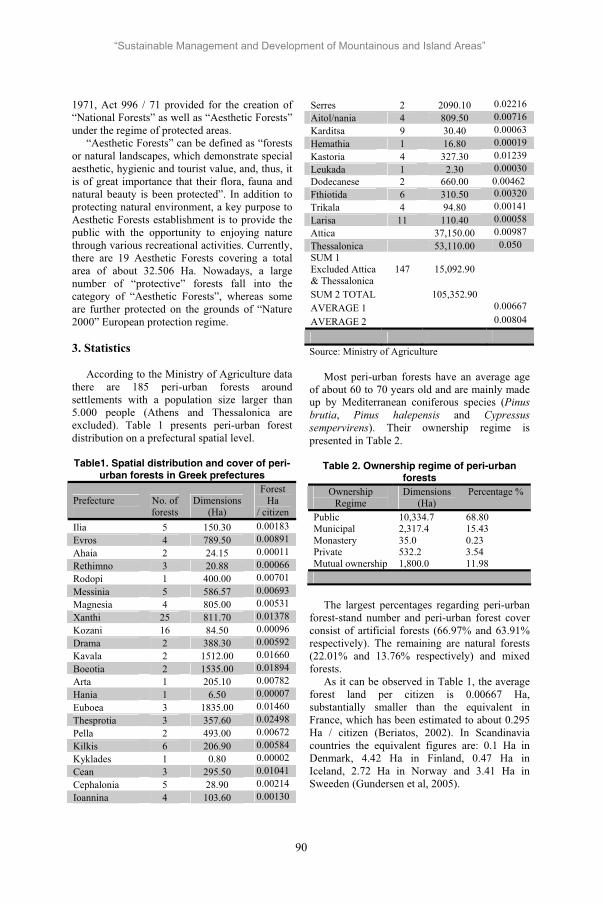
1971, Act 996 / 71 provided for the creation of “National Forests” as well as “Aesthetic Forests” under the regime of protected areas.
“Aesthetic Forests” can be defined as “forests or natural landscapes, which demonstrate special aesthetic, hygienic and tourist value, and, thus, it is of great importance that their flora, fauna and natural beauty is been protected”. In addition to protecting natural environment, a key purpose to Aesthetic Forests establishment is to provide the public with the opportunity to enjoying nature through various recreational activities. Currently, there are 19 Aesthetic Forests covering a total area of about 32.506 Ha. Nowadays, a large number of “protective” forests fall into the category of “Aesthetic Forests”, whereas some are further protected on the grounds of “Nature 2000” European protection regime.
3. Statistics
According to the Ministry of Agriculture data there are 185 peri-urban forests around settlements with a population size larger than 5.000 people (Athens and Thessalonica are excluded). Table 1 presents peri-urban forest distribution on a prefectural spatial level.
Table1. Spatial distribution and cover of peri-urban forests in Greek prefectures
Prefecture No. of forests
Dimensions (Ha)
Forest Ha
/ citizen Ilia 5 150.30 0.00183 Evros 4 789.50 0.00891 Ahaia 2 24.15 0.00011 Rethimno 3 20.88 0.00066 Rodopi 1 400.00 0.00701 Messinia 5 586.57 0.00693 Magnesia 4 805.00 0.00531 Xanthi 25 811.70 0.01378 Kozani 16 84.50 0.00096 Drama 2 388.30 0.00592 Kavala 2 1512.00 0.01660 Boeotia 2 1535.00 0.01894 Arta 1 205.10 0.00782 Hania 1 6.50 0.00007 Euboea 3 1835.00 0.01460 Thesprotia 3 357.60 0.02498 Pella 2 493.00 0.00672 Kilkis 6 206.90 0.00584 Kyklades 1 0.80 0.00002 Cean 3 295.50 0.01041 Cephalonia 5 28.90 0.00214 Ioannina 4 103.60 0.00130
Serres 2 2090.10 0.02216 Aitol/nania 4 809.50 0.00716 Karditsa 9 30.40 0.00063 Hemathia 1 16.80 0.00019 Kastoria 4 327.30 0.01239 Leukada 1 2.30 0.00030 Dodecanese 2 660.00 0.00462 Fthiotida 6 310.50 0.00320 Trikala 4 94.80 0.00141 Larisa 11 110.40 0.00058 Attica 37,150.00 0.00987 Thessalonica 53,110.00 0.050 SUM 1 Excluded Attica & Thessalonica
147 15,092.90
SUM 2 TOTAL 105,352.90 AVERAGE 1 0.00667 AVERAGE 2 0.00804
Source: Ministry of Agriculture
Most peri-urban forests have an average age of about 60 to 70 years old and are mainly made up by Mediterranean coniferous species (Pinusbrutia, Pinus halepensis and Cypressus sempervirens). Their ownership regime is presented in Table 2.
Table 2. Ownership regime of peri-urban forests
Ownership Regime
Dimensions (Ha)
Percentage %
Public 10,334.7 68.80 Municipal 2,317.4 15.43 Monastery 35.0 0.23 Private 532.2 3.54 Mutual ownership 1,800.0 11.98
The largest percentages regarding peri-urban forest-stand number and peri-urban forest cover consist of artificial forests (66.97% and 63.91% respectively). The remaining are natural forests (22.01% and 13.76% respectively) and mixed forests.
As it can be observed in Table 1, the average forest land per citizen is 0.00667 Ha, substantially smaller than the equivalent in France, which has been estimated to about 0.295 Ha / citizen (Beriatos, 2002). In Scandinavia countries the equivalent figures are: 0.1 Ha in Denmark, 4.42 Ha in Finland, 0.47 Ha in Iceland, 2.72 Ha in Norway and 3.41 Ha in Sweeden (Gundersen et al, 2005).
90
“Sustainable Management and Development of Mountainous and Island Areas”

4. Peri-urban forest functions
Urban space is usually characterized by overpopulation, air and noise pollution, frequently occurring floods, litter build up, and increasing demands of transportation, all resulting in negative impacts on the quality of residents lives. Additionally, in large urban concentrations people’s choices for open-space activities, recreation as well as social contact are very limited.
According to Miller et al. (1996), and Diamandi (2002), ozone (O3) is a significant air pollutant demonstrating high concentrations in densely populated areas. Sulphur dioxide (SO2), nitrogen oxides (NOx), carbon dioxide and carbon monoxide (CO2 and CO), volatile organic compounds, methane (CH4), lead (Pb), total suspended particles in air (TSP) and smoke also contribute to urban air pollution (Aslanidou et al., 2002, Viotti et a., 2002).
Noise, which according to Dafis (1998) can be viewed as “an invisible form of pollution”, is considered as a major factor of disturbance (Mavrokordopoulou et al., 2002). Therefore, noise can be a threat to the physical, mental and social welfare (Ouis, 2001). Bearing in mind the constant efforts for creating better living conditions within urban areas, a major human intervention to the build environment is the establishment and management of green spaces.
Urban and peri-urban forests’ contribution to the improvement of build environment quality is undeniable. Trees can absorb various gaseous pollutants such as sulphur dioxide (SO2), nitrogen dioxide (NO2) and ozone, while they also dissolve water soluble pollutants on their wet leaf surface (Young et al., 2005). DeSanto (in Young et al., 2005) studied the removal of 5 major air pollutants (SO2, CO, O3, NOx and total suspended particles – TSP) by street trees. According to Dafis (1995), a hectare of pine forest can remove up to 32 tons of dust from the atmosphere, whilst a hectare of beech forest may withdraw up to 64 tons of dust. Additionally, by slowing down wind velocity, forest trees force solid particles to precipitate. Forest absorption of CO2 as well as the release of O2, through the function of photosynthesis, are also important.
Moreover, a forest of medium productivity can approximately generate 4 tons of oxygen (O2) per year and Ha, retain more than 4 tons of CO2, process 10-12 x 106 m3 of air, and thus, sustaining atmospheric composition in O2 (as a
producer) as well as in CO2 (as a consumer) (Dafis, 1995).
Forest and peri-urban forest contribution to adjusting extreme temperature conditions is of particular importance. This process takes place through the deduction of incoming solar radiation by tree canopy or through the blockage emitted radiation by the earth surface (Dafis, 1995). Trees are also effective in reducing wind velocity as well as acoustic waves (Aslanidou et al., 2003). Peri-urban forests contribute to water resources replenishment, runoff control, flood prevention, water availability and quality, as well as halting erosion.
Forest soil, due to its high porosity and the existence of humus, ground vegetation, and tree root system, slows down water movement, retaining large quantities of water, while at the same time filtering making water of a higher organoleptic, chemical, radioactive and bacterial quality. The hydrological effect of a forest depends on its composition and structure, as well as its management regime (Dafis 1995, Dafis 1998).
Forest ecosystems act as diodiversity reservoirs thus, constituting a natural genetic bank. In addition to environmental and balancing effects, peri-urban forests demonstrate great aesthetic, recreational and health values. As outdoor recreation spaces, free from pollutants and noise, they demonstrate a positive effect on the nervous and the cardiovascular system (Dafis, 1995).
The above mentioned benefits deriving from urban and peri-urban forests are widely recognized by urban populations. For instance, during a study in two Finish cities (Tyrväinen, 2001), 43% and 42% of the respondents stated that benefits deriving from forests are the most significant, 36% and 32% of the respondents placed a higher value to the benefits coming from social activities like recreation and exercise whilst benefits related to climate, wind protection, pollution and noise reduction were appreciated to a lesser degree. In addition, according to Kumar (2006), stakeholders rank the environmental values of forest highest compared to spiritual and recreational values.
Urban and peri-urban forest values are also reflected on land prices for land properties situated near green areas (Rowntree, 1988). In 20, out of 25 relevant studies, the property value increases at about 20% when the land borders are situated close the green area. In the rest of the studies, the absence of a land price increase can
91
“Sustainable Management and Development of Mountainous and Island Areas”

be explained by the fact that the specific are not properly maintained or are not easily visible from nearby streets (Crompton, 2001).
5. Problems - Management
5.1 Problems
Problems faced by Greek urban and peri-urban forests can be caused by anthropogenic as well as natural biotic and abiotic factors (diseases, pollution, insects etc.). As far as urban forests are concerned (the majority of which, are entirely pine forests (Pinus halepensis), the most important biotic as well as abiotic factors of distraction are (a) common infections by pine processionary caterpillar, and (b) ground compression due to the increased number of visitors. An underestimated but yet important problem when selecting floral sprecies for establishing new urban forests, is pollen allergies of certain species that are not always taken into account. Specialists in charge of vegetation species selection should be aware of those species that produce (anemogama species) that produce pollen with strong allergic effects. These plant taxa (Graminae, Oleaceae, Urticaceae, Salicaceae, Polygonaceae, Platanus etc.) may not be the proper ones to use for the creation of urban green spaces (Papageorgiou et al., 2002).
Peri-urban forests also suffer from increased ozone concentrations a chronic effect that makes tree species vulnerable to infection from certain insects. In many cases precipitation reduction combined with secondary attacks by insects has led to the loss of thousands of trees (Diamandis, 2002). Trespassing and illegal building construction in conjunction with, unresolved claims for forest land ownership, failure to complete forest cadastre and forest fires are the most important as well as hardest to resolve problems faced by peri-uban forests. Rapid completion of forest cadastre and effective fire prevention and protection constitute is vital to forest sustainability.
Several peri-urban forests are degraded due to insufficient management, whereas some others suffer from lack or mismanagement of recreational facilities. Overgrazing is another problem, however not only confined to Greece (Dorren, 2004), that leads to erosion and desertification. Furthermore, the introduction of ungulate mammals to peri-urban forests may lead to overgrazing, as it is the case in the only lowland oak forest in Greece the aesthetic forest
‘Kouri’ of Magnesia, in which the introduction of deer and wild-sheep has led to detrimental effects to young plantlets, virtually putting an end to the forest regeneration process.
Finally, a problem concerning both urban and peri-urban forests is alien species introduction. In many cases, alien species selection, without previously considering local ecological conditions has resulted low tree survival rates. It is essential that species selection, for both urban parks and peri-urban forests, should be performed among native species, fitting to the bioclimatic zone of the wider area and to local soil and climate conditions, in order to minimise future damages and losses.
5.2 Management
As it has already been mentioned, urban and especially peri-urban forests offer protection to people, buildings and infrastructure from natural disasters such as soil erosion, flooding, avalanches, land sliding and alluvial sediment deposition etc (Brang, 2001).
In order to maintain peri-urban forests’ protective role as well as to protect and enhance their numerous invaluable functions (biodiversity conservation, air pollution reduction, recreation etc.), we should secure their ecological stability as ecosystems and their ability to evolve. Therefore, it is essential that their management focus on safeguarding : a) species diversity b) adequate natural regeneration retes and c) the best possible forest structure (Borren et al., 2004).
According to Xaffee (1998), the major goal of ecosystem based management can be summed up to “the preservation of ecosystem integrity while satisfying human needs”. The integrity of an ecosystem, according to Leopold (Dorren et al., 2004), can be defined as “one thing is right when it tends to maintain its integrity, stability and beauty of the biotic community. It is wrong when it tends otherwise”.
‘Multiple-use’ forest management practices adopted during the last decades (after the 70’s), have shaped the concept of sustainable forest management. The scope of this concept has been broadened by sustained yield management and nowadays it includes additional features such as forest operations quality, biodiversity and quality of life (Nieuwenhuis and Tiernan, 2005).
92
“Sustainable Management and Development of Mountainous and Island Areas”
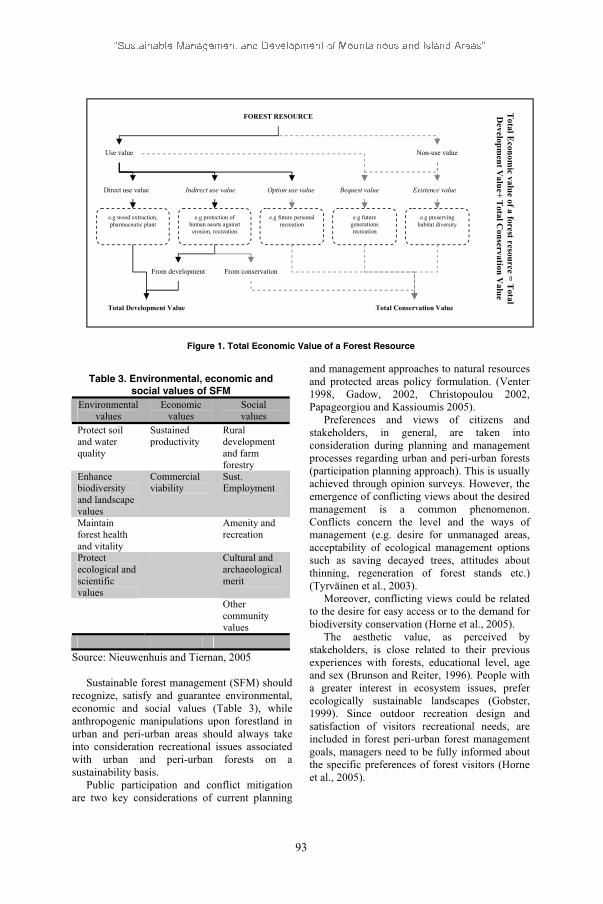
Figure 1. Total Economic Value of a Forest Resource
Table 3. Environmental, economic and social values of SFM
Environmental values
Economic values
Social values
Protect soil and water quality
Sustained productivity
Rural development and farm forestry
Enhance biodiversity and landscape values
Commercial viability
Sust. Employment
Maintain forest health and vitality
Amenity and recreation
Protect ecological and scientific values
Cultural and archaeological merit
Other community values
Source: Nieuwenhuis and Tiernan, 2005
Sustainable forest management (SFM) should recognize, satisfy and guarantee environmental, economic and social values (Table 3), while anthropogenic manipulations upon forestland in urban and peri-urban areas should always take into consideration recreational issues associated with urban and peri-urban forests on a sustainability basis.
Public participation and conflict mitigation are two key considerations of current planning
and management approaches to natural resources and protected areas policy formulation. (Venter 1998, Gadow, 2002, Christopoulou 2002, Papageorgiou and Kassioumis 2005).
Preferences and views of citizens and stakeholders, in general, are taken into consideration during planning and management processes regarding urban and peri-urban forests (participation planning approach). This is usually achieved through opinion surveys. However, the emergence of conflicting views about the desired management is a common phenomenon. Conflicts concern the level and the ways of management (e.g. desire for unmanaged areas, acceptability of ecological management options such as saving decayed trees, attitudes about thinning, regeneration of forest stands etc.) (Tyrväinen et al., 2003).
Moreover, conflicting views could be related to the desire for easy access or to the demand for biodiversity conservation (Horne et al., 2005).
The aesthetic value, as perceived by stakeholders, is close related to their previous experiences with forests, educational level, age and sex (Brunson and Reiter, 1996). People with a greater interest in ecosystem issues, prefer ecologically sustainable landscapes (Gobster, 1999). Since outdoor recreation design and satisfaction of visitors recreational needs, are included in forest peri-urban forest management goals, managers need to be fully informed about the specific preferences of forest visitors (Horne et al., 2005).
FOREST RESOURCE
Use value Non-use value
Direct use value Indirect use value Option use value Bequest value Existence value
e.g wood extraction, pharmaceutic plant
e.g protection of human assets against erosion, recreation
e.g future personal recreation
e.g future generations recreation
e.g preserving habitat diversity
From development From conservation
Total Development Value Total Conservation Value
Total E
conomic value of a forest resource = T
otal D
evelopment V
alue+ Total C
onservation Value
93
Naturally, there is divergence regarding participatory management. According to Hatzistathis (2002), quality improvement of urban and peri-urban green spaces should be the result of research and discussion between experts and not between people.
6. Administrative and Institutional Issues In Greece, the central body for state
administration in the forestry sector is the Forestry Section of the Ministry of Agricultural Development which deals with strategy and policy design, policy implementation issues as well as the forestry legal framework. Strategies designed within the Forestry Section are been foreword to the Greek Parliament for approval and sequentially are pursued through implementation mechanisms at the regional and local levels.
Recently there has been a restructuring of responsibilities regarding forest fire mitigation issues. The responsibility for forest fire suppression operations has been given to the Public Fire Service which at present is under the administration of the Ministry of the Interior. However, forest fires prevention responsibilities are still curried out be the Ministry of Agriculture. Some additional responsibilities concerning important forest management issues (e.g. forest protected areas etc) are held by the Ministry for the Environment, Physical Planning and Public Works under the arrangements of the Environmental Protection Act 1650/86.
Institutionally speaking, forests and forest land areas have a strong degree of protection under the Hellenic Constitutional principal (articles 24 and 117, 1975/86/00) “forest use change only for the public interest and only in cases in which the public interest can not be accommodated for by alternative means that do not include forest land use change”. However, inefficiencies and failures in the administrative and managerial levels have resulted in severe forest degradation mostly in near-urban areas, through the mechanism of forest fires and the subsequent building of burnt areas.
The constitutional prohibition regarding changes in forest land cover, unless in the public interest, does not seem to have been fulfilled despite the various legislative attempts to protect forest land uses. The Greek Forest Act of 1979 (Law 998/79) forms the basis of the national forest policy, maintaining two fundamental principles: increased protection of forests characteristics and sustainable use of forest
resources in that all forest functions must be protected and if possible enhanced including biological diversity, recreation and erosion mitigation function. Provisions are also made about additional significant management issues such as the surveying of forest areas in a cadastral manner, reforestation procedures and national forest research and management funding.
Prior to the 1975 Constitution, forest activities were initially curried out under the provisions of the 1929 Forest Act. Economic exploitation of forest resources was the priority of the state’s efforts reflecting the social, cultural and economic conditions prevailing that period. The first substantial amendment to the above law was made in 1969 with the introduction of the controversial Forest Act numbered 86/1969. It has been argued that under the 1969 act, degradation of forests increased considerably as the act’s provisions accounted for constricting buildings and hotels within forest areas.
After the 1975 Constitution and the 1979 Forest Act, there have been made some attempts to amend the forestry legal framework. Of some importance are two of such efforts. The first refers to the Pastoral Act of 1987 (Act 1734/1987) through its provisions which attempted the establishment of a distinction between tree-forests and other forestland (shrubs, bush-land etc) with the latter been characterised as pastures. This law was inactivated by a judicial verdict. Finally, in 2003 a new forest act was introduced (Act 3208/2003) which raised substantial political pressure coming mostly from environmental institutions and non-governmental organisations. The hot spot this time was the operational definition of the concept “forest” in that the new definition proposed by the act reduced the level of protection of certain floral communities such as Mediterranean shrubs. A judicial process is again under way as to what extent the act is in line with Hellenic constitutional requirements as well as EU legislation.
In sum, it can be said that both the administrative and legislative frameworks remain to a large extent bureaucratic. Registration of forest-land by the Greek cadastral plan is still in its initial stage. Reforestation activities are inadequate and in some cases inappropriate (relevant to the vegetation species planted by the
94
“Sustainable Management and Development of Mountainous and Island Areas”
authorities in charge) and peri-urban forests are subject to forest fires and urban sprawl.
7. Conclusions
Increasing rates of urbanization, accompanied by the plethora of problems mentioned earlier, urge for forest conservation as well as for new forests and green spaces creation within and near urban areas. The peri-urban forest role is of great significance in environmental (pollution reduction, water resources preservation, microclimate adjustment, noise reduction, wind protection, erosion and flooding mitigation to human assets), social (recreational opportunities, mental and physical healthiness), and economic (increased land and property value in areas adjacent to urban or peri-urban forests) grounds. Therefore, the contribution of urban and peri-urban forests to sustaining urban populations quality of life is considerable.
Obviously, that there are various problems concerning forest administrative and management issues. It is essential that administrative and management practices enhance forests’ role and functions. However, the fact that a great deal of forestland is of public and municipal ownership, theoretically makes it easier to find suitable solution to the problems mentioned.
Institutional definition of the terms “peri-urban forests” and “urban forest”, institutionalization of forests management and protection regime, as well as forest integration into the regional and urban land use planning system are vital. All the above presuppose athorough comprehension of forests dynamics as complex open ecosystems with multiple functions. Planning and management should incorporate local societies’ views, since it is people needs urban and peri-urban forests mainly aim to serve. Finally, adoption of effective wildfire protection practices as well as protection against forest land use changes and employment of trained personnel are also necessary.
8. References
[1] Aslanidou M, Smiris P, Mavrokordopoulou O, Pipinis I. Urban Green Spaces and the Most Important Problems of the Thessalonica Conurbation. Proceedings of
the 10th Pan-Hellenic Forestry Conference. 2003; 205-216.
[2] Beriatos H. Peri-Urban Forests, the Green “Walls” of Greek Cities: Protection and Promotion Potential. Research Projects Series 2002; 8(14): 343-354.
[3] Brang P. Resistance and Elasticity: Promising Concepts for the Management of Protection Forests in the European Alps. Ecological Management 2001; 145: 107-117.
[4] Brunson MW, Reiter DK. Effects of Ecological Information on Judgements about Scenic Impacts of Timber Harvest. Journal of Environmental Management 1996; 46: 31-41.
[5] COST E12. Memorandum of Understanding for the Implementation of a European Concerted Research Action Designated as COST Action E12 “Urban Forests and Trees”. European Commission, Brussels, Belgium 1997; 14pp.
[6] Crompton JL. The Impact of Parks on Property Values. A Review of the Empirical Evidence Journal of Leisure Research 2001; 33: 1-31.
[7] Dafis SA. City Forestry. University of Thessalonica; 1998.
[8] Dafis SA. The Role of a Forest in Environmental and Human Protection In: Selected Subjects on Environmental Management, Goulandri Museum of Natural History 1995; 513-530.
[9] Diamandis S. Complete Approach to the Protection of Forests and Forest Ecosystems. Proceedings of the 10th Pan-Hellenic Forestry Conference. Research, Protection and Management of Terrestrial Ecosystems, Peri-Urban Forests and Green Spaces 2002; 41-59.
[10] Dorren LKA, Berger F, Imeson AC. Integrity, Stability and Management of Protection Forests in the European Alps. Forest Ecology and Management 2004; 195: 167-176.
[11] Douros G. Urban – Peri-Urban Green Spaces. Observatory of Free Countries 2001; pp.16.
[12] Gadow K. Adapting Silvicultural Management Systems to Urban Forests. Urban Forestry and Urban Greening 2002; 1: 107-113.
[13] Gobster PH. An Ecological Aesthetic in Forest Landscape Management. Landscape Journal 1999; 18(1): 54-64.
95
“Sustainable Management and Development of Mountainous and Island Areas”

[14] Gundersen V, Frivold LH, Löfström I, Jørgensen BB, Falck J, Øyen BH. Urban Woodland Management – The Case of 13 Major Nordic Cities. Urban Forestry and Urban Greening 2005; 3: 189-202.
[15] Hatzistathis AT. Urban Forestry in Europe. Problems and Prospects. Proceedings of the 10th Pan-Hellenic Forestry Conference: Research, Protection and Management of Terrestrial Ecosystems, Peri-Urban Forests and Urban Green Spaces 2002; 109-114.
[16] Horne P, Boxall PC, Adamowicz WL. Multiple Use Management of Forest Recreation Sites a Spatially Explicit Choice Experiment. Forest Ecology and Management 2005; 207: 189-199.
[17] Johnston M. The Early Development of Urban Forestry in Britain: Part 1. Arboricultural Journal 1997; 21: 107-126.
[18] Kassioumis K. The Protection of Nature in Greece. Institutional Framework, Protected Areas and Protection Jurisdictions. Geotexnika Scientific Subjects 1994; 5(3): 58-74.
[19] Konijuendijk CC, Ricard RM, Kenney A, Randrup TB. Defining Urban Forestry. A Comparative Perspective of North America and Europe. Urban Forestry and Urban Greening 2006; 4: 93-13.
[20] Konijuendijk CC. A Decade of Urban Forestry in Europe. Forest Policy and Economic 2003; 5: 173-186.
[21] Kumar S, Kant S. Exploded Logistic Modelling of Stakeholders Preferences for Multiple Forest Values. Forest Policy and Economics 2006; (article in press).
[22] Mavrokordopoulou O, Smiris P, Aslanidou M, Pipinis I. The Problem of Noise Pollution and its Treatment at the Thessalonica Conurbation. Proceedings of the 10th Pan-Hellenic Forestry Conference. 2003; 217-226.
[23] Miller PR, Stolte KW, Duriswe DM, Pronos J. Evaluating Ozone Air Pollution Effects on Pines in the Western U.S. Gen. Techn. Report PSW – GTR – 155. 1996; 78pp.
[24] Nieuwenhuis M, Tiernan D. The Impact of the Introduction of Sustainable Forest Management Objectives of the Optimisation of PC – Based Forest – Level Harvest Schedules. Forest Policy and Economics 2005; 7: 689-701.
[25] Nilson K, Randrup TB. Coordination of European Research of Urban Forests and Trees. Arboricultural Journal 1998; 22(2).
[26] Nowak DJ, Crane DE. Carbon Storage and Sequestration by Urban Trees in the USA. Environmental Pollution 2002; 116: 381-389.
[27] NUFU. Trees and Woods in Towns and Cities. How to Develop Local Strategies for Urban Forestry. National Urban Forestry Unit, Wolverhampton; 1999.
[28] Papageorgiou K, Kassioumis K. The National Park Policy Context in Greece: Park Users’ Perspectives of Issues in Park Administration. Journal for Nature Conservation 2005; 13: 231-246.
[29] Ques D. Annoyance from Road Traffic Noise: A Review. Journal of Environmental Psychology 2001; 21: 101-120.
[30] Rowntree RA. Ecology of the Urban Forest. Introduction to Part III. Landscape and Urban Planning 1988; 15: 1-10.
[31] Tyrväinen L, Silvennoinen H, Kolehmainen O. Ecological and Aesthetic Values in Urban Forest Management. Urban Forestry and Urban Greening 2003; 1: 135-149.
[32] Tyrväinen L. Economic Valuation of Urban Forest Benefits in Finland. Journal of Environmental Management 2001; 62: 75-92.
[33] Venter AK, Breen CM. Partnership Forum Framework: Participative Framework for Protected Area Outreach. Environmental Management 1998; 22: 803-815.
[34] Vergos S, Eleftheriadis N, Bougoulia S, Aretos B. Recordings of Damages to the Urban Green Spaces due to the Last Cold Winter. Images from the towns of Karditsa, Trikala and Drama. Proceedings of the 10th
Pan-Hellenic Forestry Conference 2002; 125-135.
[35] Yaffee SL. Three Faces of Ecosystem Management. Conservation Biology 1998; 13(4): 713-725.
[36] Yang J, McBride J, Zhon J, Sun Z. The Urban Forest in Beijing and Its Role in Air Pollution Reduction. Urban Forestry and Urban Greening 2005; 3: 65-78.
[37] Zhang W, Zhang X, Li L, Zhang Z. Urban Forest in Jinan City: Distribution, Classification and Ecological Significance. Catena; 2006.
96
“Sustainable Management and Development of Mountainous and Island Areas”

A Development Proposal for Therapeutic Tourism Exploitation of the Area of Loutraki Arideas in the Prefecture of Pella
Dr S. Economou P. Karassavidis & K. Kalkopoulou Faculty of Rural & Surveying Engineering, Department of Transportation & Hydraulic
Engineering 54124 Aristotle University
Campus Thessaloniki [email protected]
Faculty of Rural & Surveying Engineering, Department of Transportation & Hydraulic
Engineering54124 Aristotle University
Campus Thessaloniki
School of Architecture, Department of Planning &
Regional Development 54124 Aristotle University
Campus Thessaloniki [email protected]
Abstract. The development of alternative forms of tourism (sports, religious, ecological, congress and cultural tourism) is a key element of the General Framework for Physical Planning and Sustainable Development of Greece, and it involves the exploitation of mountainous areas in an effort to result in equilibrium of spatial allocation of tourist activities, as well as the promotion of quality in tourist development with respect to natural and social environment.
In this paper we examine the possibilities for Loutropoli of Pozar to become a modern hydrotherapy centre, with respect to the natural and social environment of the area of Aridea in the Prefecture of Pella, and we propose the necessary infrastructure for both tourism development and for the protection of the environment. Financial aspects of the proposed investment have also been taken into consideration, so as to result in a realistic development plan of the area of study.
Keywords. Ecotourism & therapeutic tourism, environmental impacts, sustainable tourism, wastewater treatment.
1. Introduction
Tourism, the second largest industry in the world in terms of turnover, accounting for around 10% of world’s gross national product [1], is changing rapidly as nature, heritage, and recreational destinations become more important, and as conventional tourism is forced to meet tougher environmental requirements. It is believed that successful tourism must benefit local populations both economically and culturally, so as to give them incentives to protect the natural resources which create the attraction and simultaneously, strategies must be
economically feasible if private investors are to support the projects. Although the relationship between tourism and the physical environment should be symbiotic, mass tourism has caused many environmental problems, leading sometimes to self-imposed restrictions on growth and numbers of visitors [2]. As a result of this, alternative forms of tourism, such as sports, religious, ecological, congress, therapeutic and cultural tourism, should be further developed by creating a variety of quality tourism products that are ecologically sustainable, economically viable, and socially and psychologically acceptable. Ecotourism for example, whose key element is to preserve the natural resources while also promoting them and accommodating volumes of tourists, is considered the fastest growing market in the tourism industry, according to the World Tourism Organization, with an annual growth rate of 5% worldwide and representing 6% of the world gross domestic product, 11.4% of all consumer spending [9].
2. Sustainable tourism
Generally, tourism is considered to be the world’s largest industry, generating the 11.7% of world gross domestic product and creating 200 million jobs in the world-wide economy – in retail, construction, manufacturing, telecommunications and directly in travel and tourism companies. The relation between tourism and sustainable development can be defined by the fact that the former may act as a catalyst for conservation, protection, improvement and enhancement of the environment as well as for maintenance of local diversity and culture. The development of tourism also entails necessary infrastructure services in transportation, accommodation, recreation facilities etc, which
97
“Sustainable Management and Development of Mountainous and Island Areas”

are simultaneously responsible for significant environmental impacts.
In order to minimize the environmental impacts of tourism and promote environmental-friendly tourism, the following elements seem to be crucial: governments should integrate tourism policy into broader policies and provide tourism industry with incentives defined by effective regulation; public and private partnership should plan and develop infrastructure with a long-term view, using environmental impact assessment tools to enable effective management and local development; international bodies can provide with guidelines for environmental action undertaken by all sectors at international level; and, companies should introduce sustainable development into their management structure, enhance innovation with the application of new technology, and continue to organize environmental education and training of staff [10].
Consumer behaviour is also a very important parameter for the promotion of sustainable tourism. It can be ameliorated by education programs and campaigns, codes of behaviour involving guidelines and recommendations, eco-labelling schemes that recognise good industry practice and award programs that highlight and promote good practice, and choices in areas as transportation. The tourism industry may also affect positively consumer behaviour, in case it institutes programmes for continuous reductions of negative environmental impacts, by implementing Environmental Management Systems [11].
Apart from the environmental impacts of mass tourism, social impacts are also important, therefore, the tourism industry should promote projects compatible with the cultural identity of local population and it should always respect cultural heritage and integrity of tourism destinations [13]. According to the above, tourism must satisfy the needs and desires of tourists, private and public tourism industry operators, local host communities and the protection of natural, built and cultural environment. Thus, sustainable tourism should be based on a system in balance, where none of the above aspects is allowed to dominate [6].
Sustainable tourism is believed to play a significant role especially for coastal areas, since tourism is much developed in coastal communities. The sustainable development of local communities, serving as tourist destinations, will be a proof of accomplishing the
target of sustainable tourism [12]. However, tourism in coastal areas is responsible for environmental impacts deriving from infrastructure requirements, the production, treatment and disposal of solid waste and wastewater, the excessive consumption of water, sea pollution from water activities and noise from several recreational activities. Consequently, developing and enhancing sustainable tourism through alternative forms in both coastal and mountainous areas, and replacing the “monoculture” type of mass tourism [11], should be a universal and national goal for Greece. To sum up, tourism must be economically viable, environmentally sensitive and culturally appropriate in order to contribute to sustainable development [8] and consequently, alternative forms of tourism are not automatically sustainable.
3. Alternative tourism – ecotourism
The most well-known forms of alternative tourism are sports, religious, ecological, cultural and therapeutic tourism, and among them, ecotourism is the fastest growing market within the larger travel industry. Ecotourism, introduced in the 1980s as a creative strategy for conservation [4], born in France and articulated in Switzerland [2], usually seeks to protect and conserve natural areas, educate visitors about sustainability and benefit local communities, thus, it can be regarded as a useful tool for promoting local sustainability, in contrast to economic globalization that makes local economic control increasingly difficult. It also entails that the planning and development of tourism infrastructure focuses on ecological, social, cultural and economic sustainability criteria.
The planning and management of ecotourism activities require the following aspects: specialized marketing for the advertisement of natural areas and their capability to host such activities; particular management skills to handle visitors in protected ecological sensitive areas; guiding and interpretation services organized and offered by local communities; government policies for the protection of natural areas and the sustainable development of local communities in rural areas; and finally, training of local people that participate in ecotourism development programs.
The basic principles of ecotourism, as proposed by the International Ecotourism
98
“Sustainable Management and Development of Mountainous and Island Areas”
Society, are as follows: the minimization of environmental impacts of tourism; the education of tourists on the importance of conservation; the promotion of responsibility in tourism business for their successful co-operation with local authorities and local people; the economic aid for the protection and conservation of rural and natural areas; the effective regional planning for the development of ecotourism in specific rural areas; the establishment of monitoring programs for the assessment of ecotourism impacts on the rural environment; the effort to maximize economic benefits for local people living in rural areas related to ecotourism activities; and, the construction of the necessary infrastructure for the development of ecotourism in harmony with the natural environment of rural areas. [3]
As a result, in developing countries, community-based ecotourism has grown, implying that a community has substantial control and involvement in ecotourism projects. For this reason, three types of enterprises can be formed: in the first type the community owes and manages the enterprise and all community members get involved with the aim of a rotation system; the second type refers to family or group initiatives within communities; and, the third type is a joint venture between a community or a family and an outside business partner. [5]
Furthermore, the majority of ecotourism consumers come from North America, Europe and Japan, while studies show that eco-tourists are wealthier, better educated, more mature, and more environmentally interested in comparison with other types of tourists. They take longer trips, spend more money per day than other tourists, travel as couples and belong to a group of age between 35 and 54 years old. [4]
To sum up, alternative forms of tourism and especially ecotourism, have potential positive economic impacts: some of them are direct, related to the income of local communities, and others are indirect, associated with the conservation of natural resources. Alternative tourism is also connected to positive impacts: cultural, deriving from the development of local cultural activities; social impacts related to a contribution to the homogenization of rural and urban societies; and certainly, positive environmental impacts, which mostly refer to the conservation of natural and ecologically sensitive areas. [4]
4. Therapeutic tourism in Greece
Therapeutic tourism is one form of alternative tourism developed in Greece, where apart from several landscapes and natural beauties, springs with important therapeutic properties are scattered in many places all over the country. Spas that involve therapeutic properties, already known in ancient times, include water that differs from common water, either due to the high temperature or to the presence of rare drastic components. Mineral springs are categorized to cold and hot springs, with the latter being used in therapeutic treatment. The allocation of the springs in Greek territory is connected either with tectonic events, as is the case for example of the springs of Kaifa, Kyllini and Lagkada, or with volcanic activities, as in the case of the springs of Methana and of the islands of Milos, Lesbos, Samothrace, and Limnos.
Hydrotherapy is particularly important for the treatment of multiple diseases such as arthritis and rheumatic diseases, and involves internal therapy, which includes drinking therapy, inhalation therapy and lavages (oral, nasal and gynaecological), and external therapy, which includes baths, jet showers, hydro-massaging, hydro-kinesotherapy and fangotherapy. For the development of spa tourism, two thalassotherapy centres are operating on Crete under the special operation sign of the Greek National Tourism Organization and two more are under construction. Another 16 hydro-treatment centres in natural mineral springs of tourist importance, offer 1,400,000 therapeutic treatments to approximately 100,000 individuals and hydro-treatment centres at 40 springs of local importance can be found in all over Greece.
5. The area of study
5.1 Therapeutic tourism in North Greece
In North Greece and its three Regions (West Macedonia, Central Macedonia and East Macedonia – Thrace) there are today more than 20 therapeutic tourism locations nearby small communities or larger towns, however, most of them are characterized by poor infrastructure, constructed some decades ago and yet not renovated. There are also not well exploited: most of the locations are found in natural areas, usually mountainous, but there is no development and implementation of proper ecotourism programs, combined with therapeutic tourism activities. It is worth mentioning that the
99
“Sustainable Management and Development of Mountainous and Island Areas”

development of alternative forms of tourism is a strategic target for the General Framework for Physical Planning and Sustainable Development of Greece, while it is also a recommendation of the Regional General Framework for Physical Planning and Sustainable Development of Central Macedonia, as it is underlined that there should be an equilibrium between mass coastal tourism and mountainous tourism, for the benefit of natural resources and socio-economic welfare of rural communities.
5.2 Baseline information
The area of study refers to Loutropoli of Pozar, a complex of hydrotherapy facilities, located nearby the small community of Loutraki (1,187 inhabitants), in the Municipality of Aridea, Prefecture of Pella, Region of Central Macedonia. The hydrotherapy centre (Figure 1), on the slope of Boras Mountain, is open all year and the water temperature, deriving from the mineral springs, reaches a temperature between 30oC and 38oC, thus, it is really fascinating to follow a bath therapy in the middle of winter, while snowing.
Figure 1. The building of the hydrotherapy centre and a restaurant on
the ground floor
The hydrotherapy centre is combined together with magnificent landscapes, including waterfalls within a distance of 4 kilometers (Figure 2), and there is also a natural and cultural museum in the area of the centre (Figure 3). A swimming pool with heated water, is available all year and the cafeteria near the pool is open only in summer (Figure 4).
In the area of Loutropoli of Pozar there are three hotels, one of them abandoned (as seen in Figure 5) and a complex of rooms to let, which are open only in summer (Figure 6). The two
hotels involve only 32 rooms and there are also 52 rooms to let built in the late 1950s. As concluded, accommodation infrastructure in the area is poor and therefore, some visitors prefer to stay in small hotels in nearby villages. It is estimated that 27,135 people spent the night in the area of Loutropoli of Pozar during the year 2003, while 92,134 people spent the night in villages nearby at the same period (they involve approximately 1,000 rooms in small hotels).
Figure 2. Some of the waterfalls in the area
Figure 3. The cultural and natural museum in an extremely small building
Figure 4. The swimming pool in winter
100
“Sustainable Management and Development of Mountainous and Island Areas”

Figure 5. The abandoned hotel “Aura” constructed in the late 1950s
Figure 6. An old complex of rooms to let, without heating facilities open only in
summer
The image of poor accommodation infrastructure is completed with the open-air market, which is not well-organized and the complete absence of parking lots. Cars can be found everywhere inside the forest and certainly create an unsafe environment for people and bicycles. Another aspect related to the absence of parking lots, refers to traffic congestions, which contribute to atmospheric pollution and extra noise in the area.
Figure 7. An open-air market
It is also worth mentioning that there is no sewerage system and no wastewater treatment takes place. Consequently, the rapid tourist development of the area in the last decade has created much environmental burden, deriving from the lack of proper infrastructure, related to pollution control measures. Development is characterized by anarchy and therapeutic tourism in the area has not yet been combined with ecotourism, although there is a possibility to organize several activities in the forest or in the area of the waterfalls. Finally, it is underlined that the management plans of Loutropoli of Pozar are conducted by the Municipality of Aridea.
5.3 The proposed scenario of action
The proposed scenario of action is related to the construction of proper infrastructure, beginning with the renovation of the three hotels and the complex of rooms to let. Therapeutic tourism should be developed all year and so, all necessary facilities, such as heating, should be established within the available rooms in all hotels.
Water management issues are vital: a sewerage system must be designed and constructed as well as a wastewater treatment plant. Therefore, we calculated the maximum number of visitors/tourists per day, assuming that the main reason for their visit is related to the use of bathing facilities, which are open 13 hours daily. We also took for granted that all available current bathing facilities will be fully working. Consequently, if the increase in the number of baths continues with the same rate as in the last decade, still it will reach a maximum level before the year 2020 as shown in Figure 8, taking into account that no more hydrotherapy centres are constructed. This last assumption is necessary because the potential of the natural springs is not well-defined and as a result we do not know if a further growth of hydrotherapy centres is ‘sustainable’.
A maximum number of 1,400 visitors daily generates a load of 300 m3/d as influent in the wastewater treatment plant. The best solutions proposed, involve treatment with either a biological filter or with a biological disk (both are characterized as attached-growth systems). The flow diagrams in either case can be seen in Figures 8 and 9. Such systems can develop high concentrations of biomass in relatively small reactors because relatively little biomass is lost
101
“Sustainable Management and Development of Mountainous and Island Areas”

with the effluent [7]. The most important advantages of the proposed systems are related to simple and cheap operation and maintenance, small sensitivity in load fluctuations, easy implementation in hotels and small communities, and small sensitivity in cold weather. Filters, which are columnar beds or towers packed with synthetic porous media, having a high area to volume ratio, could be a better solution than disks because they demand less energy in operation, since they do not involve any moving parts. Disinfection could be accomplished with typical chlorination. Finally, the cost of the wastewater treatment plant, using a system with a biological filter, is diminished to the cost of implementation – construction – since operation costs are considered to be minor.
Figure 8. Estimation of the future number of baths for the target year 2025
Figure 9. A system using a biological filter for wastewater treatment
Another important issue is better traffic management, with the construction of parking lots, the proposal of traffic calming measures, the construction of pedestrian and cycling roads, and the promotion of the idea of less car use in the area of Loutropoli of Pozar. The results of implementing such a policy will be positive for
the forest ecosystems, the atmospheric pollution, noise and disturbance from car traffic and more security for pedestrians and especially elderly people that visit the area of study.
Figure 10. A system using a biological disk for wastewater treatment
Simultaneously, the cultural museum should be transferred to the building of the abandoned hotel (“Aura”), which could be renovated in order to be able to host cultural events. It is crucial to develop other activities such as cultural and activities related to ecotourism, apart from the typical therapeutic tourism that is already developed in the area of study. Thus, the open-market must be better organized in a specific area and they should promote local art and local products in an effort to stimulate local community participation in the whole project. Another important aspect could be mentioned: if local people interfere with the project then it will gain local support and environmental impact assessments will be regarded as a tool to safeguard the environment and to guide development to environmental friendlier design, construction and activities, and not as a tool against further development in the area of study.
Finally, a kiosk is proposed to be constructed with the aim to provide tourists with information on the physical environment of the area, the environmental impacts of their activities and ways to aid in the protection and conservation of the local environment and natural resources. Thus, it is strongly believed that apart from therapeutic tourism, the area of study could develop an educational role for the visitors and especially for families and children. The location of all buildings and all proposed activities can be found in Figure 10.
To sum up, the proposed scenario involves the renovation of existing hotels and rooms to let, in order to be available all year and
102

ameliorate the built environment of the area, necessary infrastructure for environmental protection and pollution control, the development of ecotourism and cultural activities and traffic management measures.
Figure 11. The location of all elements of the proposed scenario (map without
scale)
6. Environmental impacts of the proposed scenario
In the following paragraphs we try to identify, predict and evaluate the main environmental impacts of the several proposals and we mention the basic mitigation measures that should be implemented. Although, the proposed scenario of action involves measures for pollution control and environmental protection, it still may generate impacts on the environment.
Firstly, the renovation of buildings (hotels, hydrotherapy centre, museum and cultural centre) may create noise pollution, especially if machines for concrete production are used. Consequently, when the details of the architectural and civil engineering works are defined, it will be clearer what kind of machines will be used, how much noise they will produce and whether they are really necessary or they can be replaced by other more traditional construction methods. Apart from the negative impacts on noise pollution that may affect some sensitive ecosystems (birds for example), the construction works will create jobs with positive socio-economic effects if local labor force is exploited.
Secondly, the construction of wastewater infrastructure (sewerage system and wastewater treatment plant) will prevent pollution affecting the natural environment and it should be underlined that proposed systems include
simplicity in design and construction, little costs and little energy demand for operation. As a result, the proposed action will create positive effects on the natural environment.
Thirdly, developing cultural and ecotourism activities may probably create positive socio-economic impacts, depending on the possibility of community – based tourism development. It should be noted that ecotourism is not always an environmental-friendly form of alternative tourism and may harm sensitive ecosystems. So, such activities must be well-organized and impacts on the physical environment must not be neglected.
Traffic management measures and the relocation of the open market will be connected to positive environmental effects. Traffic congestions, creating atmospheric pollution and noise, will be avoided, especially with the construction of parking lots. Simultaneously, such measures will be positive for the security of pedestrians and ‘excluding’ private cars from the area of study may contribute to the idea of the minimization of private car use in favor of other means related to walking, cycling and the use of public transport. Finally, the information kiosk is also expected to create positive environmental impacts by ‘advertising’ the ecological sensitivity of the area of study and by references to the potential environmental impacts of ecotourism activities.
Implementing the above scenario of action may be concluded to create more positive impacts to the environment that the potential negative effects on it. However, it should be underlined that the proposed scenario respects the current capacity of the hydrotherapy centre and does not add to the number of present flows of visitors in the area. It is more than obvious that if infrastructure in the area becomes better, then Loutropoli of Pozar may attract more tourists and visitors, and this augmentation might harm the physical environment. This is the main reason why in the proposed scenario we do not include construction of more accommodation facilities. Thus, visitors may also be able to stay in hotels in small towns nearby, meaning positive economic impacts for many local communities.
However, we need to explain that we have not carried out any carrying capacity assessment so as to result in any physical and environmental thresholds that would limit the volume of tourists and visitors. This would entail much more information on the physical environment of the
103
“Sustainable Management and Development of Mountainous and Island Areas”

area of study and especially on ecosystems and available natural resources.
Finally, as already mentioned, maybe the most important parameter is the contribution of local communities in environmental-friendly tourism development and consequently, if and when the Municipality of Aridea decides to continue with such an investment, it should draw its attention on this specific subject.
7. Costs of implementation
The costs of the implementation of the proposed scenario have been roughly calculated to a total number of 2.5 million €. It should also be mentioned that total gross revenues in year 2004 were estimated to have reached a total amount of about 0.9 million €. In conclusion, the proposed scenario is realistic, economically viable, and environmental-friendly, and it is also in accordance with the recommendations of the General Framework for Physical Planning and Sustainable Development of Greece.
8. Conclusions
The present study shows an example of the potential of therapeutic tourism development in North Greece. Most of the natural springs are located in mountainous areas, full of natural beauties and possibilities for the simultaneous development of other alternative forms of tourism. However, while developing programs of alternative forms of tourism, environmental impact assessments should be carried out and local communities should be participating in all processes of such programs, safeguarding their success: the promotion of sustainable tourism.
9. References
[1] Batra G.S, Kaur N. New Vistas in Reducing the Conflicts between Tourism and the Environment: An Environmental Audit Approach. Managerial Auditing Journal 1996; 11(4): 3-10.
[2] Curry B, Moutinho L. Environmental Issues in Tourism Management: Computer Modelling for Judgemental Decisions. International Journal of Service Industry Management 1992; 3(1): 57-69.
[3] Epler Wood M. Ecotourism: Principle, Practices & Policies for Sustainability
http://www.uneptie.org/tourism/home.html [09/13/2003]
[4] Herbig P, O’Hara B. Ecotourism: A Guide for Marketers. European Business Review 1997; 97: 231-36.
[5] Joppe M. Sustainable Community Tourism Development Revisited. Tourism Management 1996; 17(7): 475-79.
[6] Hunter C. Sustainable tourism as an Adaptive Paradigm. Annals of Tourism Research 1997; 24(4): 850-67.
[7] LaGrega M.D, Buckingham P.L, Evans J.C. Hazardous Waste Management. Singapore: McGraw-Hill; 1994.
[8] Wall G. Is Eco-tourism Sustainable?. Environmental Management; 21(4): 483-91.
[9] World Tourism Organization. Tourism 2020 Vision. Madrid: World Tourism Organization; 1997.
[10] World Travel and Tourism Organization and International Hotel & Restaurant Association. Tourism and Sustainable Development – The Global Importance of Tourism, Background Paper #1 [10/2/2003]
[11] World Travel and Tourism Organization and International Hotel & Restaurant Association. Tourism and Sustainable Development – Workers and Trade Unions in the Web of Tourism, Background Paper #2 [10/2/2003]
[12] World Travel and Tourism Organization and International Hotel & Restaurant Association. Tourism and Sustainable Development – Sustainable Tourism: A Local Authority Perspective, Background Paper #3 [10/2/2003]
[13] World Travel and Tourism Organization and International Hotel & Restaurant Association. Tourism and Sustainable Development – Sustainable Tourism: A Non-Governmental Organization Perspective, Background Paper #4 [10/2/2003]
104
“Sustainable Management and Development of Mountainous and Island Areas”

The UN Decade of Education for Sustainable Development: Meeting the Challenges or Another Missed Opportunity?
Prof Walter Leal Filho Dean of Life Sciences
TuTech, Harburger Schlossstrasse 6-12 D-21079 Hamburg,
Germany [email protected]
Dr Paul Pace Director
Centre for Environmental Education & Research, Faculty of Education, University of Malta,
Abstract. A review of the historical development and a re-examination of environmental education principles provide the rationale for the paper’s claim for the need to rethink, review and re-adapt environmental education to refocus it on the goals of sustainable development – particularly during the UN Decade of Education for Sustainable Development. The lessons learnt from environmental education initiatives in the formal sector are reviewed and applied to other sectors. The impact of change on communities, how to anticipate and address it through training change agents will also be explored as well as the importance of documentation and promotion of experiences.
Keywords environmental education, sustainable development, dealing with change, documentation of good practice
1. The background.
In addition to benchmark documents such as the report “Our Common Future” (WCED, 1987) and Agenda 21 (United Nations, 1992), a number of events have in the past been dedicated to questions related to the usefulness and application of environmental education in the formal, non-formal and informal sectors. The conferences and congresses held in Belgrade, Tbilisi, Moscow, Rio de Janeiro and Thessaloniki, among others, have discussed such
issues at great length. In addition, substantial efforts were made in the past to promote environmental education at the national, regional and international level. One recurring theme was how to address the problems seen in respect of the implementation of environmental education initiatives, in particular:
the lack of materials; the lack of funds; the lack of official recognition; and the lack of training.
This is the backdrop against which the UN launched its Decade of Education for Sustainable Development (DESD) spanning from January 2005 – December 2014. Although promising a revival, a cursory review of the Education for Sustainable Development principles outlined in the relevant documentation (UNESCO, 2005) reveals a close similarity with the same principles outlined at Tbilisi. There is, as expected, a broader emphasis on sustainable development issues (also reported by Stokes et al, 2001 in educational systems throughout the European Union) – a direct result of the significance attributed to this concept since the publication of the Bruntland Report (WCED, 1988) and the Rio Summit (UNCED, 1992) – but the characteristics of the process have remained practically the same. This means that the problems identified earlier are still there and if not properly addressed they can still come back to haunt environmental education implementation. It is imperative that while
105
“Sustainable Management and Development of Mountainous and Island Areas”

seeking alternative approaches we give proper consideration to the legacy that environmental education has gathered along the years, otherwise we could easily waste our energies on reinventing the wheel and forfeit going forward.
Going back to the problems outlined earlier, it was often suggested that ways to address them would have to include the principle of “decisions reached by consensus”. This has posed its own problems in terms of asymmetrical bargaining relationships between developed and developing countries. In the final plenary session of the Thessaloniki Conference, a delegate, reporting back on a work session asked: “Why is it that developing countries are so much behind developed countries in implementing environmental education?” She proposed that one reason might be the natural availability of financial resources that she described as “gentle reminders of wealth” by the major trading powers in comparison of what a particular developing country spends in terms of environmental education and the level of support afforded to it. She said that new ways should be found to “safeguard the balance” between what industrialised and developing countries do in respect of using environmental education as a tool to environmental protection.
This is perhaps precisely the point! As seen in many industrialised nations, environmental education in developing countries should be brought closer to mainstream environmental protection programmes. There is plenty to do. If we take the Global Environment Outlook-3 (GEO-3) of the United Nations Environment Programme (UNEP) for example, it says “the planet is at an important cross-roads with the choices made today critical for the forests, oceans, rivers, mountains, wildlife and other life support systems upon which current and future generations depend” (UNEP, 2002). The report provides a unique look at the policies and environmental impacts of the past 30 years, and outlines four possible policy approaches leading to different outcomes over the next 30 years. Two of the most contrasting scenarios include “Markets First” and “Sustainability First”. One envisions a future driven by market forces; the other by far-reaching changes in values and lifestyles, firm policies and cooperation between all sectors of society. The report compares and contrasts the likely impacts on people and the natural world.
GEO-3 concludes that a great deal of environmental change has already taken place in
the past 30 years since the 1972 Stockholm Conference, which led to the creation of UNEP. The report notes that improvements have occurred in areas such as river and air quality in North America and Europe, but indicates that conditions in developing countries have to a great extent deteriorated. Moreover, the international effort to repair the ozone layer by reducing the production and consumption of chlorofluorocarbons (CFCs) by one tenth of the 1990 levels is another notable success. But, the report also says, overall there has been a steady decline in the environment, especially across large parts of the developing world.
The declining environmental quality of the planet and the apparent increase in strength and frequency of natural hazards such as cyclones, floods and droughts are intensifying peoples’ vulnerability (GEO-3, Chapter 3) to food insecurity, ill health and unsustainable livelihoods. Speaking of the poor, the sick and the disadvantaged, both within societies and in different countries and regions, the report warns of the widening gap between those able and those unable to cope with rising levels of environmental change. This state of affairs is also echoed in the follow-up to this report, i.e. the GEO-4 that is currently still in its first draft, and in the Millenium Development Goals Report (United Nations, 2005). Although significant progress has been registered, the following highlights from this latter report illustrate the urgent need for action:
i. while a low minority of the human population revels in excesses, extreme poverty remains a harsh reality for more than a billion people who have to subsist on less than $1 (less than 1€) a day. Extreme poverty is keeping eight hundred million people hungry or malnourished … with children bearing the greatest load (amounting to a quarter of the total child population – below 5 years – in developing countries). Although the incidence of hunger is declining, progress has slowed down over the past 10 years.
ii. education is a basic human right as it provides people with the opportunities to make choices and plan their future. For more than 115 million children the right to attend AND continue primary education is being denied. This is particularly relevant to children from the poorer families … especially girls.
106
“Sustainable Management and Development of Mountainous and Island Areas”
iii. another human right – gender equality – ensures equal access for education, for work opportunities, control over resource management and decision making. Nevertheless, in most developing countries, access to education for girls tends to lag behind that for boys … especially at higher education. Women get the smaller share of paying jobs than men, and are usually more liable to work in the informal economy where financial security and social benefits are low. Although the level of participation of women in politics has increased since the 90s, women still hold only 16% of parliamentary seats worldwide.
iv. each year 11 million children (about 30,000 daily) die before the age of 5. Most of these children are from developing countries and the inter-related causes of death are malnutrition and diseases most of which could have been easily avoided or treated given the means (such as access to clean water and immunisation)
v. half a million women die each year during pregnancy or during childbirth, while 10 million risk serious injuries because of lack of universal access to reproductive healthcare.
vi. since its appearance AIDS has claimed 20 million lives worldwide. The disease has hit hard developing countries reversing years of progress in development. In sub-Saharan Africa 7 out of 100 adults are living with HIV and in certain Southern African countries more than a quarter of the adult population are HIV positive. Malaria (which can be relatively easily curbed) has a yearly death toll of a million people – mostly young children.
vii. forests are disappearing rapidly in the poorest regions – an estimated 940 thousand km2 of forest (the size of Venezuela) has been destroyed in the last decade. Although some 19 million km2 have been designated as protected areas, biodiversity is still on the decline. While progress has been made in cleaner energy generation technology, there has been little progress made in the transfer of this technology where it is needed most, i.e. in developing countries. Rich countries are still the major contributors of greenhouse gasses.
viii. although access to safe drinking water has improved during the 90s, over a billion people still lack this access. Moreover, half the developing world (about 2.6 million) lack basic sanitation increasing the chances for the proliferation of diseases.
These problems are taking place – and many are getting worse – even though we now have hundreds of declarations, agreements, guidelines and legally binding treaties designed to address environmental problems and the threats they pose to wildlife and human health and well being. Moreover, most of these problems can be effectively addressed by the use of environmental education techniques and processes in conjunction with legal measures and other practical action. Yet, relatively few efforts are seen in this field. What is necessary, along with political courage and innovative financing, is the systematic and strategic engagement of environmental education in the environmental problem-solving process. It is against this background that the need to re-adapt environmental education is seen.
2. The need to review and re-adapt environmental education.
Following up from the Stockholm conference, UNESCO and UNEP founded the International Environmental Education Programme (IEEP) in January 1975. Although IEEP’s original goals were very wide, spanning all sectors of education and targeting all ages, its actions have mostly focused on incorporating environmental education in the formal education systems of UNESCO Member States (Vinke, 1992). Thus it is no wonder that the major successes in environmental education have been registered in the formal sector … although some authors might disagree on this. Therefore, it would be useful to review the lessons learnt and try to apply them to other sectors.
As earlier stated, in order to address issues related to sustainable development, there is a need to bring environmental education more in line with the various issues, perspectives and problems that affect the world. This means that we need to depart from traditional ways of fragmenting environmental concerns and adopting a monodisciplinary analysis. This approach has only served to alienate individuals from the realities that surround them. Now, more
107
“Sustainable Management and Development of Mountainous and Island Areas”
than ever before, due to our concern with sustainable development, we need to view environmental concerns from the interactions of economic, societal and ecological perspectives and needs. Indeed, as stated by Stempleski (2000), environmental education brings learners in contact with the real world, empowering them to make positive changes in their local communities and in the world. Besides serving as a rich and stimulating source of real-world content, environmental education:
provides an effective framework for integrating skills such as calculation, logical analysis and thinking; develops a wide perspective by providing a ‘meeting place’ for many disciplines; develops critical and creative thinking skills; fosters the development of problem-solving skills; provides opportunities for exploring cross-cultural attitudes and values; encourages student interaction.
Another reason, and perhaps one of the most important ones for bringing more environmental education and more practical discussions on environmental issues into the classroom, is the urgency of the state of the environment itself. If students are to participate fully in resolving the environmental problems of today and the future, environmental education that addresses real-life issues is essential. The problems outlined earlier are pressing. All educators have an ethical and personal responsibility to contribute to the students' awareness of environmental issues and to foster in their students the development of skills and the right attitudes that promote sustainable development.
To be able to address its current problem in respect of implementation, environmental education has to be re-oriented with a view to:
becoming more practice-oriented: a lot of discussions and debates over the past 20 years have focused on the theoretical aspects of environmental education, on what it is or on what it should do. Time has come to look at it in a pragmatic way, especially in respect of “how” to integrate it with sustainable development efforts; achieving more visibility: environmental education professionals are not always well versed into the art of promotion. Indeed, few have experience in how to promote their work in an effective way
with a wide audience. Yet, this is an important factor in strengthening the impact of environmental education. There is a perceived need to make it more visible, to communicate more about works in this field and thus extend environmental concern to a wider cohort of individuals. Environmental communication is an ally of environmental education and should be used more often; involving more people: the history of environmental education is characterised by the fact that a selected group of people have influenced its development internationally and at country level. In some countries, one can count on one’s hand the number of people involved with environmental education. This has to be changed. We need more involvement, from more people and from different sectors (e.g. education, academia, industry, the voluntary sector) to spread it more evenly; andrelating closer to sustainable development: environmental education is and will carry on being environmental education. The various attempts to use different nomenclatures (education for sustainability, education for sustainable development, education for a sustainable future and so on) have failed to unite the people working in this field. Rather, they have been the source of unnecessary arguments. There is no doubt that there is a need to bring environmental education closer to efforts to pursue sustainable development. As the lack of progress since Thessaloniki has shown, a change in name has not helped the cause. What is necessary is the undertaking of practical initiatives and projects where, by the use of environmental education techniques, the various environmental problems outlined in the earlier part of this paper may be addressed.
3. Teacher training – developing change agents.
Considering the amount of energy and resources invested in environmental education projects in schools and in teacher education courses and the relative poor impact that they leave on the educational system when compared
108
“Sustainable Management and Development of Mountainous and Island Areas”

to other education approaches, one may erroneously conclude that environmental education has failed in reaching its goals. However, a closer analysis reveals that in most of the cases this apparent lack of success is actually not so: in fact it is mainly due to an inherent incompatibility between the principles of environmental education and the predominant cultures of formal educational institutions (Pace, 2000).
Formed over the years, these cultures define, within an institution, what constitutes good education, the characteristics of a proficient teacher, adequate assessment procedures and the role of the learners. Owing to their deep-rooted nature these strong cultural practices are difficult to eradicate overnight merely as a result of a set of conference recommendations … much more is needed. When faced with the prospects of change, people (and institutions) tend to respond in one of three ways:
(a) embrace the new lifestyle and face up the new challenges: this option is usually adopted when the change is conceived from within (unlike the other options), i.e. the people/institution concerned feel the need for a change, desire the change and are actively involved in implementing the change. The change process is internalised in the lifestyle of the target population and success is guaranteed.
(b) adopt practices that are only a travesty of the new lifestyle: this occurs when the philosophy of the change is deemed desirable, but rather than opting for a radical restructuring of existing structures to cater for environmental education, most educational institutions opt for the easiest way out - re-labelling long established practices as ‘environmental’ (Francis, 1973). Consequently the change is superficial … and although the outward manifestations (i.e. publications, workbooks, school activities) might be impressive in the short-term, their long-term impact is negligible.
(c) renounce the change and keep on living as though nothing happened:this option is adopted when the change is interpreted by the people/institution concerned as a threat to their ‘trial tested’ and ‘seasoned’ routines. The status quo is considered as the safest
alternative and conformity to norms (rather than creativity) is what is expected … and rewarded. These misgivings are further heightened when the change is proposed by a sector that is considered as alienated from the “harsh realities they have to face”.
At face value, the latter two coping strategies can be viewed as buffers that slow down or obstruct any process of change, but at the same time they are an indication that people … particularly if they are not involved in the change process … need time to acclimatise themselves to the impending paradigm shift. Successful developments in education have usually involved a process of evolution rather than revolution with the sustained participation of teachers. Research in and the development of environmental education in formal educational institutions does not seem to have respected this line of development.
As already highlighted, too much energy has been devoted (or SOME MAY EVEN say wasted) on trivial academic issues, that have served nothing more but to pump up personal CVs, at the expense of the development of practical environmental educational programmes. The negative impact this has had on environmental education can be summarised under four interrelated consequences … that directly contrast with the reorientation goals of environmental education outlined earlier:
Confusion: the excessive use of technical terminology by environmental education researches has created a language that excludes, rather than informs, people who are not directly involved in the research. The issues raised and discussed become increasingly complex and the number of people who can actively participate in the debate becomes increasingly less. Establishing an elite group of experts:“control over language at one level becomes power over decision-making, resources and practices at other levels” (Robottom, 1987). Contrary to the goal of shared environmental responsibility that environmental education seeks to develop, this specialised language highlights the divide between the ‘experts’ (who can understand what’s happening and can thus show the way forward) … what Smyth (1995) calls “a priesthood of the environmentally enlightened” and the ‘technicians’ (who are expected to follow
109
“Sustainable Management and Development of Mountainous and Island Areas”

instructions). This dependency of people on authority for direction effectively forfeits their responsibilities towards the environment to those whose “decisions count” or who “know what they’re talking about”. Alienation: in formal education sector, the relegation of teachers to a technician’s role effectively narrows their view of educational issues and systematically excludes them from being actively involved in curriculum development decision-making. Consequently the relationship between environmental education research and classroom realities becomes increasingly hazy and slim. Environmental education initiatives promoted in schools tend to be disjoint activities of dubious long-term benefits rather than core curriculum experiences. Irrelevance: superficial environmental education fails to contribute to the development of an environmental ethic that provides answers to the key questions raised by a conscious decision to adopt a sustainable lifestyle. Even more damaging are the conflicting messages that are picked up by learners, e.g. learning about the need to reduce energy consumption in an institution that has no energy saving policy. Research has shown that children learn to accept incongruencies, i.e. that you can learn about and through the environment without caring enough for it to take an active role in its protection.
Success stories in the implementation of environmental education in formal education have revealed a redefinition of the role of the people ‘at the top’, from that of change agents to that of catalysts of change providing support and training to those ‘at the bottom’ in order to help them become equal partners in the enterprise (Pace, 1996). This form of shared leadership can also be extended to the ‘bottom most’ levels of the hierarchical pyramid: children. More and more schools are discovering the lasting impact of a whole school approach to environmental education (Bezzina & Pace, 2004). On consideration, environmental education initiatives in schools have evolved from the inclusion of environmental topics in curricula (the emphasis being mainly on knowledge) to the development of courses (acknowledging the importance of skills acquisition besides knowledge) to whole school approaches
(involving learning about, designing and living sustainable lifestyles).
The question is therefore not whether teachers are being challenged to take an active role as change agents in their community or not, but when will they take up the challenge. To become effective change agents, teachers need adequate preparation. Teacher education programmes need to prepare teachers for the following changes in the way that they traditionally approached environmental education:
(a) Conceptual changes in the way they understand the environment and role humans have in it as well as what is and how to achieve effective education,
(b)Revaluation of values ensures that teachers are provided with opportunities to appraise their baggage of values. This is very difficult from the traditional role of learning institutions, which were seen as the sites where societal values were uncritically imparted. Research has shown that unchallenged values have very weak foundations that yield to the slightest pressure when questioned.
(c) Changes in methodology to develop learners who can think for themselves, listen and sift what others have to say, express and justify their own values and attitudes and decide on what action they can take to improve specific environmental issues.
As outlined at the beginning of this section, change never comes easy … habits die hard! Effective teacher education needs also to help teachers identify and tackle the following hurdles to change:
(i) Procrastination: Change generates a lot of uncertainty and people tend to postpone change for later. A radical change might be postponed because of the unreal feeling of security generated by initiatives that might give the false impression that environmental education is already occurring in schools hence easing up the pressure for urgent action.
(ii) Threat to authority: With its philosophy of empowerment, a move towards environmental education will lead towards the modification or even the tearing down of traditional power structures and institutions, particularly because of its interdisciplinary nature. This may not go down pleasantly with people who are currently in a position of power (e.g.
110
“Sustainable Management and Development of Mountainous and Island Areas”

academics, education authorities, teachers). Conflicts of interest, squabbles on ‘territorial boundaries’ and a redefinition of roles will have to be resolved if environmental education ever hopes to take off.
(iii) The “better the devil you know” syndrome: Having to teach within the old parameters for quite a number of years helped teachers to develop coping strategies to make up for the system’s deficiencies … and moreover allegations of teacher incompetence or lack of resourcefulness could always be blamed on the repressive nature of the system. Teachers have been caught in a dilemma: whether they should stay within the safe confines of the status quo or whether they should assume more responsibilities and venture into uncharted territory.
4. The need to promote and document experiences.
This paper has so far listed some of the challenges that the UN Decade of Education for Sustainable Development will have to face… rather than bypassed … to ensure that its targets are met. In a nutshell:
the need for a more pragmatic approach; the need to achieve a closer integration to sustainable development; the need to overcome the constraints posed by funds, materials and resources; the need to efficiently provide training that develops change agents; and the need to develop individuals who can anticipate, initiate and deal with change
A further major challenge to environmental education for this Decade and beyond is the documentation and promotion of experiences. Past records offer a sad view: from the hundreds of projects performed in the field of environmental education, only a few of them have been properly documented and promoted. As a result, a valuable body of knowledge, expertise and experience, which could help others and prevent a great deal of duplication, is simply not available.
There are to date, a number of scientific publications and mechanisms to promote and disseminate the results of studies and research in environmental education and sustainability. However, when compared with the better
established field of environment and ecology, environmental education looks much less organised. For one thing, the number of outlets to scientifically disseminate information is still rather limited, thus illustrating the need to address what is now becoming an increasingly perceived problem.
The body of knowledge and information on environmental education and sustainability currently available justifies the existence of suitable means to disseminate such information and experience. As stated in the volume “Communicating Sustainability” (Leal Filho, 2000), “it is reasonable to expect that a broader sense of awareness on sustainability (and the same line of thinking applies to environmental education!) is only to be realistically expected, if it is better communicated”.
Although a significant step ahead in promoting efforts, the existence of academic journals such as the “Journal of Environmental Education” and “Environmental Education Research” is not enough to support the efforts to bring environmental education to a broad audience. The already considerable body of information and knowledge available, is continuously being complemented by new works, new initiatives and new projects, which makes it necessary to identify ways of enhancing the documentation and the dissemination of the relevant information.
Bearing in mind this state of affairs, a decision was made in early 1998, to bring to life a new series of academic publications, under the heading “Environmental Education, Communication and Sustainability”. The chosen partner was Peter Lang Scientific Publishers, a well-established publishing house with offices in Germany, Switzerland and the United States. By means of authored, edited or co-edited works written in German or English (the series´ working languages), the series is meant to:
document experiences (projects, case studies, initiatives) in this area; promote good practices; and foster networking and information exchange
while at the same time maintaining the highest academic standards. The continuous evolution of environmental education and of the sustainability debate and the ever-changing priorities in science and politics, mean that the series needs to be able to adapt itself to such changes and be able to report on the on-going progresses seen in this
111

field. Table 1 outlines the outputs of the series to date.Table 1: Outputs of the series “Environmental Education, Communication and Sustainability”
Volume (Year)
Title
Volume 1 (1998)
Umweltschutz und Nachhaltgkeit an Hochschulen (Environmental Protection and Sustainability at Universities)
Volume 2 (1998)
Distance Education and Environmental Education
Volume 3 (1998)
Environmental Engineering: International Perspectives
Volume 4 (1998)
Environmental Education for Sustainability
Volume 5 (1999)
Sustainability and University Life
Volume 6 (2000)
Integrating Concepts of Sustainability in Education for Agriculture and Rural Development
Volume 7 (2000)
Communicating the Environment – Environmental Communication for Sustainable Development
Volume 8 (2000)
Communicating Sustainability
Volume 9 (2001)
Environmental Engineering and Employment
Volume 10 (2002)
Our Common Illiteracy
Volume 11 (2002)
Teaching Sustainability
Volume 12 (2002)
International Experiences on Sustainability
Volume 13 (2003)
Methoden informeller Umweltbildung (Methods in non-formal environmental education)
Volume 14 (2004)
World Trends in Environmental Education
Volume 15 (2004)
Integrative approaches towards sustainability in the Baltic Sea Region
Volume 16 (2005)
International Perspectives in Environmental Education
Volume 17 (2005)
Beitrag der Medien zum politischen Erfolg Forstwirtschaft und Naturschutz im Politikfeld Wald (Contribution of the Media to the Political Sucess of Forestry and Natural Protection)
Volume 18 (2005)
Umweltmanagement an Hochschulen:
Nachhaltigkeitsperspektiven (Environmental Management at Universities: sustainability perspectives)
Volume 19 (2005)
Perspektiven der Ingenieurökologie in Forschung, Lehre und Praxis (Perspectives of Ecological Enginering in Research, Teaching and in Practice)
Volume 20 (2005)
Handbook of Sustainability Research
The series was well received by readers, especially from universities which bear a prime responsibility for environmental education and sustainability efforts (Romero, 1995). Moreover, the fact that publications from the series are being used in support of teaching programmes, in further education schemes and as part of research projects, means that the series has a sound financial basis. For the future, it is planned to combine the publications deriving from the series, with a stronger marketing component, thus making more people aware of it and hopefully broadening a sense of environmental awareness in schools, higher education institutions and beyond.
5. Conclusions.
Environmental education is not as politically safe and neutral as it was portrayed in the past. Although continuous discussions on its goals and strategies may be useful in modernising it; they have to be complemented by more pragmatic approaches like projects, case studies and fieldwork. However, putting environmental education in the educational agenda requires a radical change: in community structures that provide education; in our perception of what we understand by education; and in how we view participation in decision making .
Helping learners to critically analyse the knowledge on offer, to construct their own baggage of relevant knowledge and to question their framework of values is definitely politically active and necessary. Perhaps one of the major challenges to environmental education, at all levels of education, is to help learners to anticipate, initiate and deal with change … from within the person as well as in their surroundings.
112
“Sustainable Management and Development of Mountainous and Island Areas”
6. References. [1] Bezzina C, Pace P. Promoting School
Development through Environmental Education. Trends: Monograph Series in Education, Faculty of Education, University of Malta; 2004.
[2] Francis G.R. Objectives and approaches to environmental education: some first reflections from a beginning experiment. In Centre for Education Research and Innovation (CERI) Environmental Education at University Level: Trends and Data. Organisation for Economic Co-operation and Development (OECD), Paris, France; 1973.
[3] Leal Filho W, editor. Communicating Sustainability. Peter Lang Scientific Publishers, Frankfurt; 2000.
[4] Pace P. Top-down planning in school-based environmental education. In Geesteranus C.M. (ed). Planning Environmental Education: a Step or a Stride Forward?Gland, Switzerland: European Committee for Environmental Education, IUCN; 1996.
[5] Pace P. Attitudes towards environmental education in the Maltese formal education system. In Leal Filho W (ed) Communicating Sustainability.Environmental Education, Communication and Sustainability Series No. 8. Frankfurt am Main, Peter Lang; 2000.
[6] Robottom I. Towards inquiry-based professional development in environmental education. In Robottom, I. (ed.) Environmental Education: Practice And Possibility. Victoria: Deakin University Press; 1987.
[7] Romero M J R. The Role of the University in Sustainable Development: Challenge and Opportunities. International Association of Universities. Kogan Page, London; 1995.
[8] Smyth J.C. Environment and Education: a view of a changing scene. Environmental Education Research. 1995, 1(1), pp.3-20.
[9] Stokes E, Edge A, West A. Environmental Education in the Educational Systems of the European Union, Brussels: Environment Directorate-General of the European Commission; 2001.
[10] Stempleski S. Environmental education. In Language and Civil Society Series. US Department of State, Washington, D.C.; 2000
[11] UNCED (United Nations Conference on Environment and Development). The United
Nations Conference on Environment and Development: A Guide to Agenda 21.Switzerland: UN Publications Office, Geneva; 1992.
[12] UNEP (United Nations Environment Programme). Global Environment Outlook-3 (GEO-3). UNEP, Nairobi; 2002.
[13] UNESCO. Report by the Director-General on the United Nations Decade of Education for Sustainable Development: International Implementation Scheme and UNESCO’S Contribution to the Implementation of the Decade. Paris: UNESCO; 2005.
[14] United Nations. The UN Conference on Environment and Development: a Guide to Agenda 21. UN Publications Service, Geneva; 1992.
[15] United Nations. The Millenium Development Goals Report. UN Department of Public Information, New York; 2005.
[16] Vinke J. Actors and approaches in environmental education in developing countries. In Schneider H. (ed) Environmental Education: An Approach To Sustainable Development. Organisation for Economic Co-operation and Development (OECD), Paris, France;1992.
[17] WCED (World Commission on Environment and Development). Our Common Future. Oxford University Press, Oxford; 1987.
113
“Sustainable Management and Development of Mountainous and Island Areas”

Lobbying for the environment: The case of Greenpeace
Ippokratis I. Gkotsis Stella M. Gata
Nikolaos A. Skondras Evangelos I. Manolas
Department of Forestry and Management of the Environment and Natural Resources, Democritus University of Thrace,
193 Pantazidou Street, 68200 Orestiada, Greece.
Abstract. This paper is a descriptive, analytical treatment of Greenpeace as an international non – governmental organization dedicated to the protection of the environment. It is descriptive in the sense that it provides information on the birth and evolution of Greenpeace and, in particular, its goals, membership characteristics, sources of income and methods of work. Regarding the issue of evaluation of the organization’s impact there can be no single answer as within the world framework Greenpeace is only one among other actors. The issue of evaluation can only be personal opinion and impression. It is the view of this paper that although the pinnacle may never be reached the world is a better place with Greenpeace than without it.
Keywords: Greenpeace, protection of the environment, environmentalism
1. Introduction
Interest groups – or pressure groups as they are sometimes known – seek to influence the political process so that the interests they represent gain some form of improvement in or retain undiminished their social, political or economic position, or achieve some particular aim or vision of how society ought to be organized [4].
Greenpeace is an independent organization campaigning to ensure a just, peaceful, sustainable environment for future generations. It was conceived in 1971 when the members of “Don’t Make a Wave Committee” in Vancouver, Canada, renamed their organization the better to proclaim their purpose: to create a green and peaceful world. The above committee was founded by Jim Bohlen (an American
composite-materials researcher), Irwing Stowe (a Philadelphian lawyer) and Paul Cote (a young Canadian lawyer) [7]. The main and the only target of this committee was to stop nuclear testing in Amchitka Island [3].
According to Jim Bohlen the name “Don’t Make a Wave Committee” included too many words and had no specific meaning. People would not easily connect that name to nuclear testing, and it would probably be misapprehended. The team began thinking something more essential. The name should give voice to the spirit of the committee. Then, Bill Darnell (a young Canadian worker) suggested an efficient word combination which gave out not only the interest in the planet generally but also the antithesis to nuclear weapons. This was how “Greenpeace” came to life [3].
Greenpeace today adheres to the same principle that led twelve people to sail a small boat into the U.S. atomic zone of Amchitka in Alaska in 1971: that determined individuals can alter the actions and purposes of even the most powerful by “bearing witness” [10] to environmental abuses and taking non-violent direct action to prevent them [1].
Greenpeace is concerned only to protect the environment. It allies itself with no political party and takes no political stands. Greenpeace is independent of the influence – financial or otherwise – of any government, group or individual. Greenpeace embraces the principle of non-violence and rejects attacks on either people or property [10].
2. Aims
Greenpeace organizes public campaigns for:
114
“Sustainable Management and Development of Mountainous and Island Areas”

The protection of oceans and ancient forests – Our planet is facing a growing wave of ocean extinction. Its seas have reached a tipping point, with scores of species, fish, birds and mammals edging toward extinction. Throughout the world, ancient forests are in crisis. Many of the plants and animals that live in these forests face extinction. And many of the people and cultures who depend on these forests for their way of life are also under threat. The phase out of fossil fuels and the promotion of renewable energy to stop climate change – Greenpeace is asking you to take part in an energy revolution. To go from a world powered by nuclear and fossil fuels to one running on renewable energy. The elimination of toxic chemicals – toxic chemicals in our environment threaten our rivers and lakes, our air, land, and oceans, and ultimately ourselves and our future. The prevention of genetically modified organisms being released into nature – GMOs should not be released into the environment as there is not adequate scientific understanding of their impact on the environment and human health. An end to the nuclear threat and nuclear contamination – Greenpeace is against nuclear power because it is an unacceptable risk to the environment and to humanity. The only solution is to halt the expansion of all nuclear power, and for the shutdown of existing plants.Safe and sustainable trade – the World Trade Organisation (WTO) promotes free trade for the gain of private interests, over and above our health and the environment. It is fatally flawed and is moving the world in the wrong direction - away from peace, security and sustainability. By stalling on issues that are crucial to poorer countries, the WTO faces a crisis of legitimacy [12].
Greenpeace has played a pivotal role in, among other things, the adoption of:
A ban on toxic waste exports to less developed countries A moratorium on commercial whaling A United Nations convention providing for better management of fisheries. A Southern Ocean whale Sanctuary
A 50-year moratorium on mineral exploitation in Antarctica. Bans on the dumping at sea of radioactive and industrial waste and disused oil installations. An end to high-sea, large-scale driftnet fishing. A ban on all nuclear weapons testing – Greenpeace’s first ever campaign [12].
3. Structure and decision-making
The Greenpeace organization consists of Greenpeace International (Stichting Greenpeace Council) in Amsterdam and Greenpeace offices around the world. Greenpeace has presence in 41 countries. Greenpeace national or regional offices are licensed to use the name Greenpeace. National and Regional offices contribute financially to Greenpeace International, campaign locally, participate in international campaigns, and help shape the international campaign programme. Each office is governed by a board which appoints a representative (called trustee). Trustees meet once a year to agree on the long-term strategy of the organization, to make necessary changes to governance structure, to set a ceiling on spending for Greenpeace International’s budget and to elect the International Board of four members and a chairperson.
Greenpeace International monitors the organizational development of the offices, overseas the development and maintenance of its fleet, coordinates planning and implementation of its global campaign, and monitors compliance with core policies. The International Board approves the annual budget of Greenpeace International and audited accounts. It also appoints and services the International Executive Director who, together with senior managers, and consulting widely with national office staff, leads the organization [8].
4. Membership
As of January, 2002, 2.8 million had taken out or renewed their financial membership within the last 18 months. Financial supporters are the people who keep the ships on the oceans and the campaigners in the field. As we have already mentioned, there are also millions of people around the world who take action every
115
“Sustainable Management and Development of Mountainous and Island Areas”

day as volunteers [9]. The growing weight of scientific evidence of environmental damage has no doubt contributed to both the growth in membership of environmental groups and greater awareness of the potential for ecological damage [4].
Greenpeace members have risked many times their lives by doing extraordinary and dangerous things such as placing themselves in small boats between whales and the harpoon guns of Icelandic and Soviet whaling ships. They have dangled from a New York bridge, stopping traffic to protest a garbage barge heading to sea; protested the dumping of toxic wastes into rivers by industries and municipalities; skydived from smokestacks of coal power plants to protest acid rain; led countless demonstrations; established a base in Antarctica to monitor environmental disruption and helped to organize local activist organizations [6].
Activities have a high profile around the world, but there is another important side that does not get as much coverage – the supporter networks. There are almost 3 million supporters worldwide, and without them Greenpeace would not exist.
Greenpeace supporters are the biggest secret – they are cyber-activists, volunteers, donors; they are young, old, rich, poor from all walks of life and from all over the world. The Supporter Service teams are at the ready around the world, to support all members with any queries about campaign related information, to send out newsletters and instructions on how to bequeath money. They are also ready to send back corporate or government money – that is the kind of help that Greenpeace would not want or need.
Each team has speciality skills to deal with local issues. They look after 143,000 members in three different languages. Greenpeace International Supporter Services takes care of the membership service for supporters who live in countries where there is no Greenpeace office [8].
5. Finance
Finance is always a major problem for any international organization. Since its formation in Vancouver in 1971, Greenpeace has become one of the world’s most successful non-governmental organisations (NGOs) by doing outlandish things to save the planet, while
bringing the world’s media along for the ride [2]. In its first years Greenpeace faced serious financial problems. The organization had to organise a concert to raise the amount of money which was needed to rent Phyllis Cormack(Greenpeace 1) and to cover the expenditures for the journey to Amchitka [3]. The whole amount (about $25000) seems very small considering the amount of money Greenpeace manages today. Greenpeace is now run like a company, with a worldwide annual budget of over a $100 million. It has a huge media arm and is extremely sensitive about its public image [2].
Greenpeace does not solicit or accept funding from governments, corporations or political parties. It neither seeks nor accepts donations which compromise its independence, aims, objectives or integrity. Greenpeace relies on the voluntary donations of individual supporters and on grand support from foundations [8].
Much of the money is used to finance the smaller Greenpeace offices that are unable to fund their own operations fully; to obtain the highest quality of scientific information; to operate the fleet of ships worldwide, and to use the latest communications technology to get its message to the concerned public as quickly as possible. Greenpeace International also uses part of its funds to publish campaign material and reports highlighting such issues as how developing countries are being exploited by illegal trade in toxic waste from the industrialized world. These reports are used by campaigners worldwide, and are sent to the media, politicians, other NGOs and interested members of the public [10].
6. Activities
The organization currently actively addresses many environmental issues, with primary focus on efforts to stop global warming and to preserve the biodiversity of the world’s oceans and ancient forests. In addition to the more conventional environmental organization methods, such as lobbying politicians and attendance at international conferences, Greenpeace has a stated methodology of engaging in nonviolent direct action.
Greenpeace uses direct action to attract attention to particular environmental causes, whether by placing themselves between the whaler’s harpoon and their prey, or by invading
116
“Sustainable Management and Development of Mountainous and Island Areas”

nuclear facilities dressed as barrels of radioactive waste.
Some of Greenpeace’s most notable successes include the ending of atmospheric testing of nuclear weapons, a (purportedly) permanent moratorium on international commercial whaling, and the declaration by treaty of Antarctica as a global park, forbidding possession by individual nations or commercial interests. To back up this latter point, World Park Base was established in Antarctica, and ran for five years, from 1987 through 1992.
6.1 Anti-nuclear testing
In September 1971, the “Don’t Make A Wave Committee” chartered the Phyllis Cormack, a fishing vessel skippered by John Cormack. They named it the Greenpeace, and set sail for the island of Amchitka with the intention of disrupting the scheduled second nuclear test. The US Coast Guard vessel Confidence intercepted the Phyllis Cormackand forced her to return to port.
Upon their return to Alaska, the crew learned that protests had taken place in all major Canadian cities, and that the United States had postponed the second underground test until November. Although attempts to sail into the test zone using a second chartered vessel also failed, no further nuclear tests took place at Amchitka [5].
6.2 Rainbow Warrior and French bombing
In 1985, Greenpeace was strongly protesting French nuclear testing at Moruroa atoll in the South Pacific Ocean. On the evening of July 10, 1985, French frogmen attached two bombs to the hull of the Rainbow Warrior, the ship on which the Greenpeace group was sailing. The bombs went off in close sequence, sinking the ship and killing the Portuguese photographer and Greenpeace activist Fernando Pereira.
Though at first the French government denied involvement in the bombing, it eventually conceded, after much media attention, that a French secret service agent had posed as a volunteer at Greenpeace to ferret out information concerning the Rainbow Warrior’sactivities, following which the bombing was ordered. A formal apology by the French government was issued in 1987, and, in 2005, an article in Le Monde revealed to the world the
bombing had, in fact, been ordered by then French president Francois Mitterrand [14].
This tragic incident, though unique, shows how some of Greenpeace’s actions, in essence peaceful, can provoke violent responses.
6.3 Saving the Whales
When Paul Spong, a New Zealand neuroscientist hired by the Vancouver Aquarium to study the behaviour of whales in captivity, contacted Robert Hunter, the “Save the Whales” campaign which resulted took place initially under the banner of Project Ahab, due to Irving Stowe’s resistance to broadening Greenpeace’s scope beyond opposition to nuclear weapons.
Stowe’s death in 1974 effectively ended this deadlock, and a re-chartered Phyllis Cormack steamed from Vancouver to meet the Soviet whaling fleet off the Californian coast in the spring of 1975. Thanks to the guidance of a primitive radio direction-finder and some fortuitous navigation by musician Mel Gregory, who steered towards the moon rather than following a compass, the Cormack encountered the whaling fleet on June 26.
The crew used fast Zodiac inflatables to position themselves between the harpoon of the catcher ship “Vlastny” and a fleeing whale. Television broadcasts around the world showed film footage of the “Vlastny” firing a harpoon over the heads of Greenpeace activists, highlighting the plight of the whales to the world’s public in the closing days of the International Whaling Commission’s 1976 conference in London, England.
Greenpeace vessels continue to patrol various areas of the world’s oceans, attempting to interfere with whaling ships. The whaling ships of Japan in the Southern Ocean are a particularly frequent target. The Greenpeace website often releases video footage of their encounters with whaling ships.
6.4 Kleenex and the destruction of ancient forests
In November 2004, Greenpeace launched a campaign against the Kimberly-Clark Corporation because its tissue products, including the popular Kleenex brand, have been linked to the destruction of ancient boreal forests. The environmental organization charges that Kimberly-Clark uses more than 3.1 million
117
“Sustainable Management and Development of Mountainous and Island Areas”
tonnes of virgin pulp from forests to produce its tissue products. The corporation is a purchaser of pulp from clearcutting operations in ancient forests in Ontario and Alberta, Canada. The forests have existed for over 10,000 years, since the last ice age, and are home to threatened wildlife such as woodland caribou and wolverine.
As part of its international “Kleercut” campaign, Greenpeace has been educating consumers about the links between Kleenex tissue products and ancient forests, moving shareholders to put pressure on Kimberly-Clark and motivating customers to switch to more environmental tissue product manufacturers [5].
6.5 Against bottom trawling
In a very recent endeavour, in August 2005, Greenpeace activists attempted to stop the controversial, and in many ways Western countries illegal, practice of bottom trawling – the dragging of massive nets along the ocean floor. They were unable to achieve their goal of painting the word “Legal?” on an Icelandic fishing boat, due to harsh weather conditions and being sprayed with water by the boat’s crew. Greenpeace did, however, manage to attract much media attention on that occasion leading to more pressure placed on governments to put an end to bottom trawling [14].
7. Evaluation
During its history, Greenpeace has weathered criticism from government and industry, and on occasion, from other environmental groups; been bombed by French special forces; and members are often arrested for minor offences such as trespassing. The organization’s system of governance and its use of non-violent direct action (which is considered by some to be illegal acts of civil disobedience) have been particular sources of controversy. On the other hand, there has also been criticism from those who feel the organization is too mainstream. Paul Watson, who parted ways to found Sea Shepherd, once called Greenpeace “the Avon ladies of the environmental movement,” because of their door-to-door fund-raising that relies on the media exposure of deliberately orchestrated and
highly publicized actions to keep the name of Greenpeace on the front pages.
Two of Greenpeace’s most vocal critics are Icelandic filmmaker Magnus Gudmundsson, director of the pro-whaling documentary Survival in the High North, and former Greenpeace International Director Patrick Moore. Gudmundsson’s criticisms have focused largely on the social impacts of anti-whaling and anti-sealing campaigns, while Moore’s main criticisms have been levelled at the campaign to protect the forests of British Columbia. Supporters of Greenpeace counter that, like many of the organization’s most outspoken critics, Gudmundsson and Moore receive considerable funding from the very industries that have been subject to Greenpeace campaigns. Gudmundsson’s documentary was judged libellous by a Norwegian court in 1992 and he was ordered to pay damages to Greenpeace. Similarly, a Danish tribunal held that the allegations against Greenpeace about faking video materials were unfounded. Many media that published Gudmundsson’s allegations have subsequently retracted and apologized, e.g. the Irish Sunday Business Post and TVNZ.
The factual basis of particular campaigns has been criticized, for example over the Brent Spar oil platform affair in 1995, in which Greenpeace mounted a successful campaign (including occupation of the platform and a public boycott) to force the platform’s owners, Royal Dutch/Shell, to dismantle the platform on land instead of scuttling it. A moratorium on the dumping of offshore installations was almost immediately adopted in Europe, and three years later the Environment Ministers of the countries bordering the North East Atlantic agreed with Greenpeace, and adopted a permanent ban on the dumping of offshore installations at sea [13]. After the occupation of the Brent Spar it was argued that Shell had not misled the public as to the amount of toxic wastes on board the installation. Greenpeace admitted that its claims that the Spar contained 5000 tonnes of oil were inaccurate and apologized to Shell on September 5.
However, Greenpeace also argued that the issue was one of wider industrial responsibility, and as the first offshore installation to be dumped in the North East Atlantic, the Brent Spar would have been followed by dozens or hundreds more, thereby setting a dangerous precedent [5].
118
“Sustainable Management and Development of Mountainous and Island Areas”

Greenpeace’s bold protests such as sailing into nuclear testing zones, intercepting whaling vessels, and hanging banners from bridges, skyscrapers, and smokestacks have drawn enormous media attention and Greenpeace has become a model for other organizations by utilizing the mass media to influence public opinion. As a result of its campaign against the killing of harp seals, people around the globe changed their buying habits and stopped purchasing products made out of the seal pelts. In 1985, the sinking by the French government of the organization’s flagship, the RainbowWarrior, and the killing of the Greenpeace photographer Fernando Pereira, sparked worldwide condemnation against France. This incident resulted in a doubling of the group’smembership and a tripling of its revenues. It became the organization of choice for many high-profile celebrities and the pet issue for many Western politicians. The French government eventually paid Greenpeace $8 million in compensation for the destruction of the Rainbow Warrior [11].
During the 1990s Greenpeace has been troubled by internal disagreements over political strategy. Some members want to persist with a militant approach, emphasizing civil disobedience and physical confrontation. Other members, including the organization’s leaders, are convinced that Greenpeace must work cooperatively with the companies and industries that have been its targets in the past.
This approach carries an obvious emotional and intellectual appeal, but it also carries dangers. Greenpeace continues its traditional work of exposing some of the worst instances of environmental degradation, but its new focus on “solutions” can undermine that work. Its activists are often committed and genuinely concerned to save the environment, but are caught in the contradiction between “bearing witness” and the compromises that arise in the process of seeking solutions. The following examples illustrate well the “solutions” orientated actions of the organization:
In 1992 when Paul Gilding was promoted from head of Greenpeace Australia to head of Greenpeace International, he took with him the idea that Greenpeace needed to focus on “solutions”. There he argued for closer cooperation with corporations. “If we had just kept on saying there was a problem, then people would have switched off” he told the Sydney Morning Herald.
When Lynette Thorstensen replaced Gilding as executive director of Greenpeace Australia, she continued his emphasis on “solution strategies” such as the Olympic Games village design and a CFC-free refrigerator. “Greenpeace is now convinced the best path to progress is via the country’s boardrooms,” said the Good Weekend magazine when it interviewed Thorstensen in 1993.
Greenpeace campaigners once criticized green marketing. “Bung a dolphin on the label and we’ll be right” was how Gilding referred to green marketing strategies. Yet this is just what Greenpeace did for the Sydney Olympics. Greenpeace helped sell the concept of the Green Olympics despite the toxic waste landfills on site, the waste plant emitting toxic emissions in its midst, and the use of ozone depletors in Olympic venues.
A June 1999 Greenpeace brochure stated that “Sydney authorities were thorough in their efforts to remediate before construction began. Most of the waste remains on site, in state of the art land fills, covered with clay, vegetated to blend in with the Olympic site”. This raises several problems for Greenpeace credibility. For years it has campaigned against disposing of toxic waste by landfill because it is impossible to prevent toxic material from leaking into underlying groundwater. The major landfills on the Olympic site contain dioxins and organochlorines and heavy metals without even linings underneath to mitigate the flow of leachate through the underlying soil.
Indicative of the changing culture at Greenpeace was the appointment of Bob Wilson, a former government bureaucrat, to chair the Greenpeace board. Wilson presided over the Sydney Water Board in the late 1980s and early 1990s when the Board was using large doses of public relations and outright secrecy to cover up the gross contamination of the ocean that its sewage discharges were creating, because they contained so much toxic waste. Fish studies showing fish caught near the outfalls contaminated with organochlorines hundreds of times the National Health and Medical Research Council (NH&MRC) maximum residue limits were kept secret by Water Board request.
Nor was this shift in direction confined to the Australian branch. Greenpeace International wrote to Olympic sponsors, including BHP, Coca Cola, General Motors-Holden,
119
“Sustainable Management and Development of Mountainous and Island Areas”

McDonalds, and others, offering to help them earn the name of “Green” in the same way as the Sydney Olympics has: “As sponsors, you have the opportunity to play a key role in this success. One of the many benefits of being part of the Green Games is the chance to demonstrate your company’s commitment to the environment and to future generations. The Sydney Olympics offer your staff the opportunity to take part in a long-term global initiative to protect the world's environment... Greenpeace would like to work with you to explore the areas in which you can make an environmental contribution during the Sydney 2000 Games.”
So for example, although BHP was named one of the worst 10 corporations in 1995 by Multinational Monitor for polluting the Ok Tedi River in Papua New Guinea with a “daily dose of more than 80,000 tons of toxic mining waste” and “helping to draft legislation for the PNG parliament that would make it a criminal offense to sue BHP”, Greenpeace offered to help BHP demonstrate its commitment to the environment by conserving energy or using environmentally-safe refrigerants.
Greenpeace Australia did a similar service for Nike, a company much in need of good PR following media coverage of working conditions in factories producing Nike shoes in third world countries. In its 1998 Olympic Report Greenpeace congratulated Nike for “promising” to eliminate the use of PVC in its products, making “PVC free sportswear available to athletes and consumers”. In fact, the only part of most Nike shoes made from PVC is the “swoosh”, according to a Nike representative in Australia.
Gilding’s business-friendly approach was also followed by his successor, Thilo Bode, an economist from industry with World Bank experience and no environmental credentials before being appointed head of Greenpeace Germany in 1989. Bode was hired for his management skills which he demonstrated by making Greenpeace Germany the richest of all Greenpeace operations.
Bode, like Gilding, believed in liaising with industry and allowing the Greenpeace name to be used to endorse “green” products such as CFC-free fridges by Westinghouse. This is despite the fact that Westinghouse was used in The Greenpeace Book of Greenwash as a prime example of corporate greenwashing: “In the US, when people hear the name ‘Westinghouse’
they think of household appliances. Only rarely does the company publicize another side of its business: nuclear weapons and reactors”. No doubt their Greenpeace endorsed CFC-free fridge will perpetuate that.
Bode was keen to promote a more “solutions oriented” approach in Greenpeace. One of his initiatives was to work with car companies to produce a more fuel-efficient car. Greenpeace Germany has invested DM2.5 million in a Renault car to cut its fuel consumption by about half. This investment and the ensuing promotion of the car caused some disquiet within Greenpeace amongst those who were uncomfortable about promoting cars at all as a form of transport, rather than promoting public transport.
Greenpeace still carries on its historic mission of “bearing witness”, but its focus on “solutions” has required Greenpeace to sometimes turn a blind eye to the environmental sins of the companies it works with. The problem is not that everyone in Greenpeace has sold out but that the new emphasis on solutions is leading to compromises that the former Greenpeace would not have considered [1].
Taking into account the positive and negative criticism about Greenpeace what can be said with certainty is that Greenpeace has not proven to be a static organization. It has been shifting and evolving in response to new developments and ways of thinking. It is also certain that Greenpeace has played an important role in raising public awareness of environmental issues, and for making the activities of governments and corporations more transparent and accountable. And although the organization may have a long way to go, up to date, the world is a better place with Greenpeace than without it.
8. References
[1] Beder S. Offering solutions or compromises? Chain Reaction 2002; 87: 14-15, 26-27.
[2] Bond M. A New Environment for Greenpeace. Foreign Policy 2001; 127: 66-67.
[3] Brown M, May J. The Greenpeace Story. Athens: Kastaniotis; 1992.
120
“Sustainable Management and Development of Mountainous and Island Areas”

[4] Browning GK, Huggins R, Rosamond B, Turner J. Politics: An Introduction. London: Routledge; 1997.
[5] Greenpeace. Wikipedia, the free encycloprdia 2006. Available http://en.wikipedia.org/wiki/Greenpeace
[6] Harper CL. Environment and Society: Human Perspectives on Environmental Issues, Upper Saddle River, New Jersey:Prentice Hall;1996.
[7] History of Greenpeace, 2002. Available http://www.chuckiii.com/Reports/HistoryOther/History_of_Greenpeace.shtml
[8] How is Greenpeace organized? Who runs Greenpeace? 2006. Available http://www.greenpeace.org/international/about/faq/questions-about-Greenpeace-in
[9] How many supporters does Greenpeace have? Where does Greenpeace get its funding from? 2006. Available http://www.greenpeace.org/international/about/faq/questions-about-Greenpeace-in
[10] Introduction to Greenpeace. 2002. Available http://archive.greenpeace.org/gpi.html
[11] Kempcke K. Greenpeace. St. James Encyclopedia of Pop Culture 2002.
[12] Our mission. 2006. Available http://www.greenpeace.org/international/about/our-mission
[13] Parmentier R. Greenpeace and the dumping of wastes at sea: A case of non-state actors’ intervention in international affairs. International Negoatiation 1999; 49(3): 435-457.
[14] Rabkin M. Greenpeace’s activism: Too radical or too peaceful? 2006. Available http://www.tolerance.ca/ArticleImpr.aspx?ID=116
121
“Sustainable Management and Development of Mountainous and Island Areas”

CONSERVATION OF TANKS/LAKES IN THE BANGALORE METROPOLITAN AREA
Dr. Krishne GOWDA Professor of Urban and Regional Planning
Institute of Development Studies University of Mysore, Manasagangotri
Mysore – 570 006, INDIA. e-mail: [email protected]
&Professor M. V. Sridhara
# 561, P & T Block, 10th Cross Kuvempu Nagar, Mysore -570 023
INDIA.
Abstract. The city of Bangalore has grown very fast during the last five decades and more with regard to both population and geographical area. Amidst the growing hunger for land and pursuit of urban, non-traditional activities and profits, environment, vis a vis lakes and open spaces, has taken a beating. Forests and agricultural land have been lost and tanks and lakes have given way to brick and mortar. Subsoil water, though fundamental, has lost its potable quality due to sewage, sullage and chemical contamination. Reaching potable water supplies to the growing population has become expensive and extremely difficult bordering on infeasibility. Therefore, conservation and restoration of water bodies within the Bangalore Metropolitan Area have become top priority issues. This paper seeks to build up perspectives in this direction.
Bangalore city is typical of the features of peninsular India in that it is made of ridges, valleys and undulating terrain. Monsoon rainfall is substantial and the tanks and lakes can receive and contain substantial amounts of water from rains. Only thing is to de-clog the natural water flow routes and to restore the bunds of tanks and repair the spillways and put in place legal and administrative measures to preserve the interiors of tanks; free them from construction activities and launch suitable afforestation programs to contain soil erosion, improve the quality of subsoil water and raise if possible medicinal and ornamental trees so that Bangalore gains in its aesthetic appeal.
Keywords: Comprehensive development plan, encroachment, environmental upgradation, lake series, metropolitan area, restoration of tank
beds and bunds, ridge, urban aesthetics, valley, water flow paths.
INTRODUCTION
Man’s close association with nature has been one of the most fundamental features of the development of human society since time immemorial; not only in the sphere of economic needs but also of culture. Nowadays there has been an added growing interest in recreation, conservation, open space, beautification, pollution abatement, and a myriad other ways to improve the quality of environment. As the increasing population depletes the limited resource base through its activities and fulfilling needs, the task of providing a satisfying and stimulating living environment clearly has become a great challenge. Today, increasing leisure, shrinking work weeks, greater mobility and higher incomes are only some of the factors contributing to this environmental challenge. In urban centers, open spaces like parks, zoological gardens, avenue trees, water bodies and quasi forests play a vital role. Normally they are contributing to a better environment and relaxation with an aesthetic content for people. Governments, municipal corporations, private organizations and individuals have to be understanding and cooperating in managing these natural and man made endowments and be eager to prevent any misuse or improper use that may lead to increase in pollution of land, air and water. In these maters the state of affairs in Indian cities is far from satisfactory.
Every city has traditionally grown around sources of water – either natural or man made.
122
“Sustainable Management and Development of Mountainous and Island Areas”

The city of Bangalore belongs to the latter category. Traditionally, water supply to Bangalore was from the various tanks and lakes which dot the landscape of the city. The scenario today, the lakes have become derelict and have lost their relevance as sources of water supply in the face of urbanization. Most of the lakes are turning into an ecological waste.
Lakes are for impounding monsoon rainwater run off in the valleys for use in scarcity seasons. They also help in checking floods, recharging ground water, and maintaining the ground water table. They act as sediment traps and prevent clogging of natural valleys and reduce erosion by regulating run off. Now some of the tanks have been breached and dried up due to unplanned development and blockage of natural inlet slopes.
The lakes serve to drain and absorb rain water thus replenishing ground water resources as well as preventing flooding of low lying areas. They support a wide variety of flora and fauna including several species of migratory birds. They also add aesthetic value to the city of Bangalore. In this paper an attempt has been made to discuss about the protection and conservation of lakes/tanks. A few suggestions also are offered.
BACKGROUND OF THE STUDY AREA
Bangalore, the capital of Karnataka, has a history of over 400 years. The origin of Bangalore city can be traced back to 1537 when it was founded by Late Magadi Kempegowda. He was a great builder of tanks and temples. The eastern portion of the city was however developed by the British early in the 19th
Century. Perhaps, the most spectacular growth of the city started after independence of the country in 1947 (see Fig. 1).
Fig.1 Bangalore Urban Agglomeration in 2001 and stages of its growth from 1537 to 2001.
Bangalore is located at the Centre of the South Indian Peninsula, equidistant from both the eastern and the western coasts with an elevation of about 931 meters above the mean sea level and latitude 120 58’ north and longitude 730 36’
east in the southern corner of the Karnataka State in India. It is well known for its equable and salubrious climate. Bangalore developed not only as a headquarters of administration and an educational center of Karnataka but also had a tremendous growth as a prominent industrial center in the country. Presently, it is the Silicon Valley of India. Topographically, the city has slopes towards east and west with a smooth ridge running north to south. Rainfall over the ridge area gets divided and flows east or west. When it comes to the storing of surface drainage, there are nearly 50 tanks, both small and large, within or just outside the city of Bangalore.
The population of the Bangalore Metropolitan Area (BMA) was 5.69 million, according to the 2001 Census, as against 4.13 million in the 1991 census. As per the 2001 Census, Bangalore ranks 5th among the largest Metropolitan Cities in India. Now it is estimated that the population of the BMA is around 7 million and by the year 2011 it would be 9 million in addition to floating population around 1.5 to 2.00 million daily in the city (seeTable 1). The ever-increasing population would
123
“Sustainable Management and Development of Mountainous and Island Areas”

add to the problems of the already strained infrastructure facilities associated with environmental decay and decline in the quality of life in the city. The intra-city population density has witnessed a rapid increase.
The City is expanding from city center towards BMA and is growing in all directions. Development is in an irregular radial pattern. The Comprehensive Development Plan for 2011 is proposed for an area of 1279 sq. km wherein area for development is 531 sq. km and green belt is 742 sq. km.
Census Year
Pop. in
Mn %
Increase
Area (Sq-Km)
%Increase
Density of Pop /sq. km
1901 1911 1921 1931 1941 1951 1961 1971 1981 1991 2001 2011 (Estd)
0.22 0.26 0.31 0.39 0.51 0.99 1.20 1.65 2.91 4.13 5.69 9.00
-14.5 19.2 27.5 28.9 94.9 21.4 37.0 76.72 39.89 37.77 63.22
144.78 156.43 160.94 174.55 181.24 193.08 255.62 285.95 366.39 466.63 531.00 1279.00
(Proposed)
-8.05 2.88 8.76 3.84 6.53 32.39 11.87 28.13 21.14 19.05 140.00
1517 1666 1925 2228 2817 5130 4688 5760 7950 8843
10704 7031
Table 1. The Population growth and its density and also spatial development of BMA. Source: Census book – 2001 and BDA, Bangalore. (Compiled by Authors)
Bangalore population has been growing rapidly in the last three decades. Today, Bangalore has gained all-round importance as an administrative center and a trading and industrial center, along with large IT & BT industries and also as a center of strategic importance due to a concentration of defense establishments. With the establishment of Indian Space Research Organization (ISRO) and several high technology electronics industries, it has become the seat for scientific and technological advancement. Naturally, Bangalore has become the focus of migration of population from rural areas and other centers, both within and outside the state.
Bangalore city is one of the fastest growing cities of the country. Water is being supplied from a distance of 90 km and is being pumped around 500 meters up spending an enormous amount of energy. In addition to the above, nearly 40 percent of population of Bangalore solely depends on underground water. Ground water recharge depends on the harnessing of rainwater. Therefore, the protection and maintenance of these watersheds and tanks are vital.
DEVELOPMENT OF LAKES/TANKS IN BANGLAORE
In the middle of the last century, there were a number of lakes, ponds, and marshy wetlands in Bangalore. Now there are 81 tanks in Bangalore in the conurbation area. In the green belt proper, which is between the conurbation boundary and the metropolitan areas boundary, there are 262 tanks. The city is situated on a high altitude with a ridge that divides the region into three valleys, wherein rainwater cascades down to form major stream systems. The three valleys being Koramangala-Challagatta Valley,Hebbal Valley and Vrishabavathi Valley (see Fig. 2). The terrain of Bangalore is dome shaped, high at the center and sloping towards east, west and south from apex to periphery. Thus the natural undulating terrain of Bangalore with its hills and valleys, lends itself perfectly to the development of lakes. The lakes form a chain of reservoirs in each of the three valley systems. Each lake harvests rainwater from its catchments and surplus flows downstream spilling into the next lake in the chain. The topography of Bangalore has uniquely supported the creation of a large number of man-made lakes. These lakes form chains, being a series of impoundments across streams. The main source of replenishment of ground water is the rainfall. The slope of the terrain allows most of the rainwater to flow as run-off. With the steep gradients available in the major valleys of Bangalore the rainwater will flow out of the city within 4 to 5 hours. Only a small fraction of the rainwater infiltrates into the soil. With more and more buildings and paved road being constructed in the city the infiltration of water into the subsoil declines.
Fig. 2 Major Valleys and existing Tanks/Lakes in Bangalore Metropolitan Area
N
E
S
W
124
“Sustainable Management and Development of Mountainous and Island Areas”
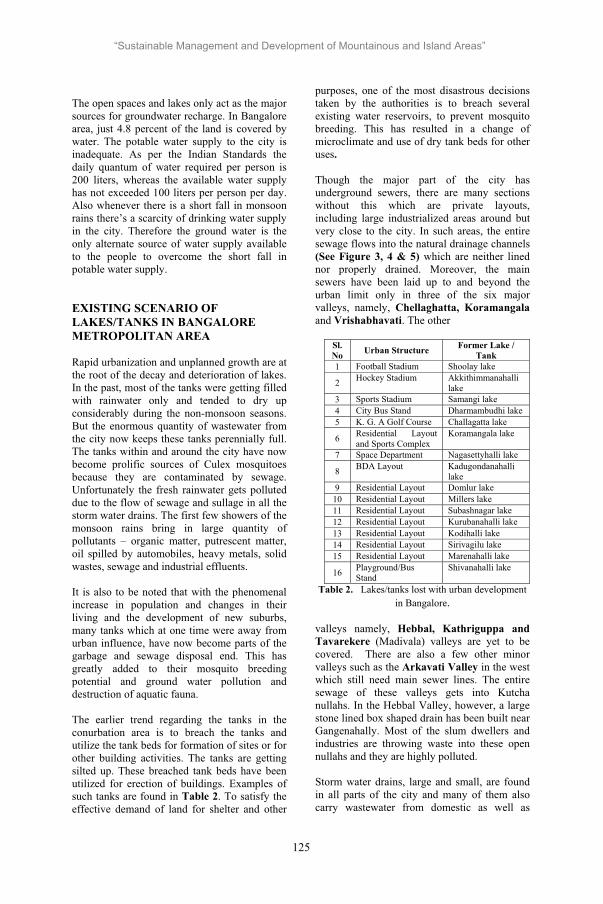
The open spaces and lakes only act as the major sources for groundwater recharge. In Bangalore area, just 4.8 percent of the land is covered by water. The potable water supply to the city is inadequate. As per the Indian Standards the daily quantum of water required per person is 200 liters, whereas the available water supply has not exceeded 100 liters per person per day. Also whenever there is a short fall in monsoon rains there’s a scarcity of drinking water supply in the city. Therefore the ground water is the only alternate source of water supply available to the people to overcome the short fall in potable water supply.
EXISTING SCENARIO OF LAKES/TANKS IN BANGALORE METROPOLITAN AREA
Rapid urbanization and unplanned growth are at the root of the decay and deterioration of lakes. In the past, most of the tanks were getting filled with rainwater only and tended to dry up considerably during the non-monsoon seasons. But the enormous quantity of wastewater from the city now keeps these tanks perennially full. The tanks within and around the city have now become prolific sources of Culex mosquitoes because they are contaminated by sewage. Unfortunately the fresh rainwater gets polluted due to the flow of sewage and sullage in all the storm water drains. The first few showers of the monsoon rains bring in large quantity of pollutants – organic matter, putrescent matter, oil spilled by automobiles, heavy metals, solid wastes, sewage and industrial effluents.
It is also to be noted that with the phenomenal increase in population and changes in their living and the development of new suburbs, many tanks which at one time were away from urban influence, have now become parts of the garbage and sewage disposal end. This has greatly added to their mosquito breeding potential and ground water pollution and destruction of aquatic fauna.
The earlier trend regarding the tanks in the conurbation area is to breach the tanks and utilize the tank beds for formation of sites or for other building activities. The tanks are getting silted up. These breached tank beds have been utilized for erection of buildings. Examples of such tanks are found in Table 2. To satisfy the effective demand of land for shelter and other
purposes, one of the most disastrous decisions taken by the authorities is to breach several existing water reservoirs, to prevent mosquito breeding. This has resulted in a change of microclimate and use of dry tank beds for other uses.
Though the major part of the city has underground sewers, there are many sections without this which are private layouts, including large industrialized areas around but very close to the city. In such areas, the entire sewage flows into the natural drainage channels (See Figure 3, 4 & 5) which are neither lined nor properly drained. Moreover, the main sewers have been laid up to and beyond the urban limit only in three of the six major valleys, namely, Chellaghatta, Koramangalaand Vrishabhavati. The other
Sl. No Urban Structure Former Lake /
Tank 1 Football Stadium Shoolay lake
2 Hockey Stadium Akkithimmanahalli lake
3 Sports Stadium Samangi lake 4 City Bus Stand Dharmambudhi lake 5 K. G. A Golf Course Challagatta lake
6 Residential Layout and Sports Complex
Koramangala lake
7 Space Department Nagasettyhalli lake
8 BDA Layout Kadugondanahalli lake
9 Residential Layout Domlur lake 10 Residential Layout Millers lake 11 Residential Layout Subashnagar lake 12 Residential Layout Kurubanahalli lake 13 Residential Layout Kodihalli lake 14 Residential Layout Sirivagilu lake 15 Residential Layout Marenahalli lake
16 Playground/Bus Stand
Shivanahalli lake
Table 2. Lakes/tanks lost with urban development in Bangalore.
valleys namely, Hebbal, Kathriguppa and Tavarekere (Madivala) valleys are yet to be covered. There are also a few other minor valleys such as the Arkavati Valley in the west which still need main sewer lines. The entire sewage of these valleys gets into Kutcha nullahs. In the Hebbal Valley, however, a large stone lined box shaped drain has been built near Gangenahally. Most of the slum dwellers and industries are throwing waste into these open nullahs and they are highly polluted.
Storm water drains, large and small, are found in all parts of the city and many of them also carry wastewater from domestic as well as
125
“Sustainable Management and Development of Mountainous and Island Areas”

public taps. While these drains were built to drain out the rush of rainwater they are efficient to remove the trickles of waste-water from houses. The gradient in many cases is not enough for smooth flow of water, nor to flush away the debris. This is made worse by the indiscriminate dumping of rubbish in to the drains and the natural accumulation of silt. Water stagnates in many of these drains, and is a common roadside sight.
CONSERVATION OF LAKES/TANKS THROUGH AGENCIES
There are 81 ‘live’ tanks in the Bangalore conurbation area and 262 tanks are situated within the green belt area. Existing tanks should not to be breached because they facilitate maintaining the ground water aquifer at a reasonable level. They have a beneficial effect on the environment and are used for recreational purposes.
Steps are necessary to be taken by all the departments and agencies concerned to prevent encroachment of land in the Green Belt. Large scale tree planting, provision of recreational facilities and other public and semi-public uses are proposed in the Green Belt. This greening
activity is an integral part of the effort towards rejuvenating the Bangalore tanks.
Whether sprawling over a large area or a small belt, these green wedges found in Bangalore play a very important role. Green Belt covers 742 sq. kms of the LPA and is proposed with a view to provide better climatic conditions. Steps are necessary to be taken by all the departments and agencies concerned to prevent encroachments in the Green Belt. Large scale tree planting, provision of recreational facilities and other public and semi-public uses are proposed in the Green Belt (see Fig. 6).
Fig. 6. BMA with Green Belt & its surrounding region: Natural lakes/tanks systems
A well-maintained water body, apart from having an effect on the environs, serves as a focal point for creation of recreational facilities and contributes to maintaining the ground water aquifers at a reasonable level.
Fig.5 Open drain – Vrishabavathi Nala
Fig 4 Open drain – ChennamanakereTank
Fig.3 Open Drain – Mattikere Tank
126
“Sustainable Management and Development of Mountainous and Island Areas”
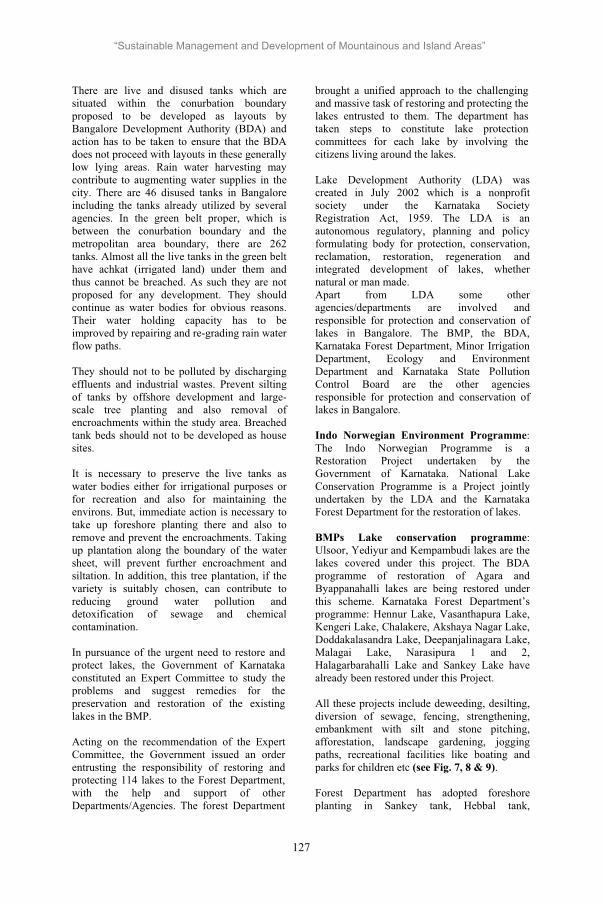
There are live and disused tanks which are situated within the conurbation boundary proposed to be developed as layouts by Bangalore Development Authority (BDA) and action has to be taken to ensure that the BDA does not proceed with layouts in these generally low lying areas. Rain water harvesting may contribute to augmenting water supplies in the city. There are 46 disused tanks in Bangalore including the tanks already utilized by several agencies. In the green belt proper, which is between the conurbation boundary and the metropolitan area boundary, there are 262 tanks. Almost all the live tanks in the green belt have achkat (irrigated land) under them and thus cannot be breached. As such they are not proposed for any development. They should continue as water bodies for obvious reasons. Their water holding capacity has to be improved by repairing and re-grading rain water flow paths.
They should not to be polluted by discharging effluents and industrial wastes. Prevent silting of tanks by offshore development and large-scale tree planting and also removal of encroachments within the study area. Breached tank beds should not to be developed as house sites.
It is necessary to preserve the live tanks as water bodies either for irrigational purposes or for recreation and also for maintaining the environs. But, immediate action is necessary to take up foreshore planting there and also to remove and prevent the encroachments. Taking up plantation along the boundary of the water sheet, will prevent further encroachment and siltation. In addition, this tree plantation, if the variety is suitably chosen, can contribute to reducing ground water pollution and detoxification of sewage and chemical contamination.
In pursuance of the urgent need to restore and protect lakes, the Government of Karnataka constituted an Expert Committee to study the problems and suggest remedies for the preservation and restoration of the existing lakes in the BMP.
Acting on the recommendation of the Expert Committee, the Government issued an order entrusting the responsibility of restoring and protecting 114 lakes to the Forest Department, with the help and support of other Departments/Agencies. The forest Department
brought a unified approach to the challenging and massive task of restoring and protecting the lakes entrusted to them. The department has taken steps to constitute lake protection committees for each lake by involving the citizens living around the lakes.
Lake Development Authority (LDA) was created in July 2002 which is a nonprofit society under the Karnataka Society Registration Act, 1959. The LDA is an autonomous regulatory, planning and policy formulating body for protection, conservation, reclamation, restoration, regeneration and integrated development of lakes, whether natural or man made. Apart from LDA some other agencies/departments are involved and responsible for protection and conservation of lakes in Bangalore. The BMP, the BDA, Karnataka Forest Department, Minor Irrigation Department, Ecology and Environment Department and Karnataka State Pollution Control Board are the other agencies responsible for protection and conservation of lakes in Bangalore.
Indo Norwegian Environment Programme:The Indo Norwegian Programme is a Restoration Project undertaken by the Government of Karnataka. National Lake Conservation Programme is a Project jointly undertaken by the LDA and the Karnataka Forest Department for the restoration of lakes.
BMPs Lake conservation programme:Ulsoor, Yediyur and Kempambudi lakes are the lakes covered under this project. The BDA programme of restoration of Agara and Byappanahalli lakes are being restored under this scheme. Karnataka Forest Department’s programme: Hennur Lake, Vasanthapura Lake, Kengeri Lake, Chalakere, Akshaya Nagar Lake, Doddakalasandra Lake, Deepanjalinagara Lake, Malagai Lake, Narasipura 1 and 2, Halagarbarahalli Lake and Sankey Lake have already been restored under this Project.
All these projects include deweeding, desilting, diversion of sewage, fencing, strengthening, embankment with silt and stone pitching, afforestation, landscape gardening, jogging paths, recreational facilities like boating and parks for children etc (see Fig. 7, 8 & 9).
Forest Department has adopted foreshore planting in Sankey tank, Hebbal tank,
127
“Sustainable Management and Development of Mountainous and Island Areas”

Arasinakunte tank and a scheme has been drawn up to beautify the tanks and surrounding areas so as to attract bird life etc.
The beautification of Ulsoor, Shankey and
A Yediyur lake was successfully taken up during the year 2003-04 for the health and recreation of the citizens of Bangalore. The BMP is also about to complete and dedicate the rejuvenated Kempambudi lake to the citizens.
In the year 2004-05, the development of Byrasandra tank of Jayanagar, Karithimmanahalli tank of Srinagar, Balayyanakere of Govindarajanagar and other remaining minor tanks had been taken up for completion. In order to provide space for recreation facilities on the banks of Ulsoor Lake, a special programme to cover the storm water drain was taken up at a cost of Rs. 500 million during 2004-05 which would help convert Ulsoor Lake into an attractive tourist centre.
For implementing the various components of lake conservation as outlined, expert inputs from the concerned government departments as well as local residents, NGOs and experts will be utilized right from the stage of project formulation. The Forest Department, the nodal agency, will be the fund holding agency from the allocations made by the state center bilateral, multilateral agencies individuals and industrial houses based on the assigned activities to the various department groups. Finances will be made available by close monitoring of the targets progress of the projects, every quarter. The nodal agency, i.e. the Forest Department, will co-ordinate the activities of other agencies involved in the lake management plan and report to the government.
BUDGET FOR CONSERVATION OF LAKES/TANKS
The restoration of tanks/lakes has included beautification with a total expenditure of Rs. 800 millions in 2004 (Times of India, 2004, p. 3). In the first phase of lake restoration in Bangalore, various agencies are involved. They fenced 11 fresh water lakes and planted trees around them under the afforestation programme at a cost of Rs.0.35 million, restored the Vasanthapura and Narasipura lakes at a cost of Rs.0.25 million and with the active support of other departments recovered 32 hectares of land from encroachers. Out of the 81 lakes handed over to the Forest Department during 1992-93, fencing work for 34 lakes was completed during 1993-94 in eight identified lakes: Madivala Lake, Puttenahalli Lake, and Dorekere Lake, Vasanthpura Lake, and Narasipura lake-II, Kundalahalli Lake, Chikka Lake, Chikka Jala Lake and Moggekere Lake.
Around 60 lakes have been selected for conservation within the next five years under the 10th Plan and submitted to the Government
Fig.7 Ulsoor Tank
Fig.8 Aerial - Ulsoor Tank
Fig.9 Yellamallapachetty Tank
128
“Sustainable Management and Development of Mountainous and Island Areas”

for approval. The 60 lakes considered are on within the lake series where the upper lakes are restored in the first instance and the program continued downwards in their order. According to the 10th Five Year Plan few of the lakes in the six cascade series have been identified for development with total lake areas of 2552.85 hectares and have been proposed for restoration at an estimated cost of Rs. 2540 millions.
They are not to be polluted by discharge of effluents and industrial wastes. Prevention of silting of tanks by offshore development and large-scale tree planting and also removal of encroachments within the study area is a priority. Breached tank beds should not to be developed as house sites.
SUGGESTIONS AND CONCLUSIONS
The existence of water sheets or water bodies is an important asset to the environment of Bangalore and has a beneficial effect on the microclimate of the city. The tank beds could also serve as outdoor recreational areas which are very much needed for the urban dwellers. Suggestions made for conservation of water bodies are:
Using Bangalore’s natural radial drainage pattern and permeable soil, water can be collected through rain water harvesting and stored for use along the plateau. This area should not be disturbed by ill conceived artificial structures, and preserved naturally.
The BCC has proposed a project to develop 200 km of secondary storm water drains. The project is divided into six packages costing a total of Rs.180 million to remodel the Koramangala-Challagatta Valley, Hebbal Valley and Vrishabavathi Valley. It is good for developing open spaces with greenery along these valleys. The authorities have identified the low-laying areas in Bangalore and redesigning of storm water drains. The intention is to ensure that sewage and rain water do not mix and inundate open space with greenery.
Bangalore needs more and more picnic spots to serve as recreational areas and serve as lung spaces. Bigger tanks with standing water should be developed as picnic spots with facilities for boating, illumination, ornamental parks and such other recreational facilities. If necessary, adjoining lands may also be acquired for the development of picnic spots and
providing more lung spaces as well as improving ecology to attract migrating birds.
Disused tanks in the proposed conurbation area could be utilized for rainwater harvesting, developing tree parks and recreational forests. Development of forest nurseries could also be taken up in such disused tanks. In Bangalore, it is hardly possible to get large open spaces for conversion into tree parks and it is therefore recommended that at least the breached tank beds are utilized for the purpose of city tree parks or recreational forests. Preservation of tree and plant diversity should be another goal.
The live tanks in the conurbation area and the green belt area provide a vast extent of land for foreshore planting. Such foreshore planting without obstructing the feeder flow channels of the tank will help to prevent silting apart from providing greenery around. In addition, the planting of trees and development of tree parks will help to prevent the encroachment of tank beds. Biological control of water pollution is an associated issue. This very much depends on the commitment and character of authorities.
Water front developments should also be taken up to enhance the urban aesthetics in the surrounding areas.
The existing water bodies act to recharge and upgrade ground water on the down stream. This will help to draft water through dug wells/bore wells meant for domestic or industrial purposes. These existing tanks should not be breached but retained as water bodies. This should receive high priority.
Efforts should be made to ensure that these tanks are not polluted by discharge of effluent and industrial wastes. Existing tanks should be deweeded and aquatic life must be developed.
Those tanks which have already been breached should not be utilized for formation of sites but taken up to create tree parks. The BDA, BCC / Minor Irrigation Department must immediately remove encroachments on the tank areas. Mosquito control measures are to be entrusted to BCC or any other suitable agency.
The tank areas where there is no achkatare to be handed over to the Forest Department for tree planting. The Forest Department will
129
“Sustainable Management and Development of Mountainous and Island Areas”

work out programme for formation of tree parks/ foreshore tree planting and formation of regional parks. It is recommended that Government allocate sufficient finances to the Forest and other Departments for implementing this.
The responsibility for the maintenance of water bodies in clean and safe conditions should be entrusted to Bangalore Water Supply and Sewage Board. By proper maintenance of water bodies, it is possible to improve the ground water table, so that there will be scope for tapping ground water through bore wells. Wherever feasible, treated sewage and sullage water can be used in the maintenance of parks, forests and other green areas.
Regulation should be made so that the use of plastic or plastic bags in and around public parks, open spaces and lakes/tanks will be penalized.
The existing tanks in the periphery of Bangalore city are going dry due to mismanagement of water and bad cropping practice. It has got more to do with excess drawals of water and growing the wrong crop. Also water inflow channels have been destroyed. Precious water is wasted due to seepage and evaporation. Desilting, restoration and management system of tanks has to take place. For this, the government has to make a budgetary provision. Economy in water use by agriculturists and horticulturists has to be promoted through the spread of awareness and techniques.
On adoption of lakes under PPP Scheme have to be handed over to NGOs, residential associations, builders and large corporate of the city. They will raise funds and maintain the lakes by carrying out eco-friendly commercial activities.
The drainage pattern of Bangalore is governed by flows from the central ridge to all lower contours. They are numerous and also radial in their distribution and are connected with various tanks and ponds. If not for the depressions like tanks and ponds, the rainfall received by Bangalore would have drained off from it within four to five hours. Since there is no major river flowing into Bangalore, the existing drainage and lakes are to be conserved, preserved and maintained for sustenance.
REFERENCES
[1] Bhumika. K. “Ulsoor lake breeding ground for insects” Times of India, January 17, 2003.
[2] Jagdeesh, N. Our Bangalore – A journey through time, Bangalore, Sapna Book House, 1999.
[3] Jayapal, Maya. Bangalore: The Story of the City, East West Book (Madras) Pvt. Ltd., Madras, 1997..
[4] Kumar, M. Sunil. “Red alert… Tanks in trouble”, Deccan Herald, July 27, 2004.
[5] Kuasha. S. “Depts plans to sweep of ‘lakeside’ structures”, Times of India, August 28, 2003.
[6] Naarendra, K. V. (ed.). Perspectives on Ecology and Development of Sankey Tank, Bangalore, Centre for Science and Technology. 1994.
[6] Narendra, K. V. Lakes of Bangalore – The Current Scenario, Bangalore, Centre for Science & Technology, 1993.
[7] Ramoo S.K. “Groundwater in Bangalore unfit for consumption”, The Hindu, Jan 23, 1999.
[8] Resource Communications (ed)., Bangalore: Scenes from an Indian City, Gangarams Publications Private Ltd., Bangalore, October, 1994.
[9] Tejaswi, J. M. Pay 40% more for (Ulsoor) Lakeview, Times of India, August 13.Times of India (2004), “Greening your city”, Times of India,January 6,. 2004. p. 3
130
“Sustainable Management and Development of Mountainous and Island Areas”
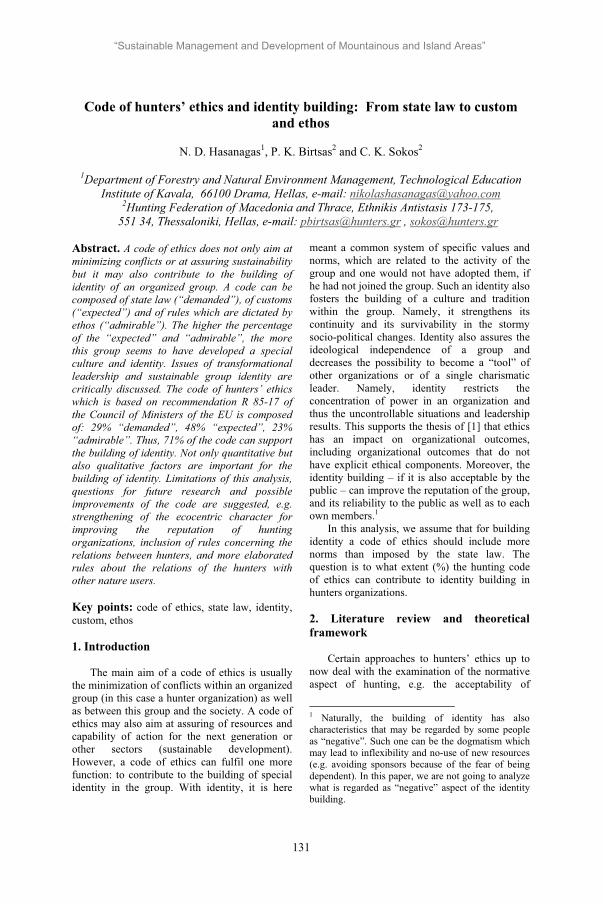
Code of hunters’ ethics and identity building: From state law to custom and ethos
N. D. Hasanagas1, P. K. Birtsas2 and C. K. Sokos2
1Department of Forestry and Natural Environment Management, Technological Education Institute of Kavala, 66100 Drama, Hellas, e-mail: [email protected]
2Hunting Federation of Macedonia and Thrace, Ethnikis Antistasis 173-175, 551 34, Thessaloniki, Hellas, e-mail: [email protected] , [email protected]
Abstract. A code of ethics does not only aim at minimizing conflicts or at assuring sustainability but it may also contribute to the building of identity of an organized group. A code can be composed of state law (“demanded”), of customs (“expected”) and of rules which are dictated by ethos (“admirable”). The higher the percentage of the “expected” and “admirable”, the more this group seems to have developed a special culture and identity. Issues of transformational leadership and sustainable group identity are critically discussed. The code of hunters’ ethics which is based on recommendation R 85-17 of the Council of Ministers of the EU is composed of: 29% “demanded”, 48% “expected”, 23% “admirable”. Thus, 71% of the code can support the building of identity. Not only quantitative but also qualitative factors are important for the building of identity. Limitations of this analysis, questions for future research and possible improvements of the code are suggested, e.g. strengthening of the ecocentric character for improving the reputation of hunting organizations, inclusion of rules concerning the relations between hunters, and more elaborated rules about the relations of the hunters with other nature users.
Key points: code of ethics, state law, identity, custom, ethos
1. Introduction
The main aim of a code of ethics is usually the minimization of conflicts within an organized group (in this case a hunter organization) as well as between this group and the society. A code of ethics may also aim at assuring of resources and capability of action for the next generation or other sectors (sustainable development). However, a code of ethics can fulfil one more function: to contribute to the building of special identity in the group. With identity, it is here
meant a common system of specific values and norms, which are related to the activity of the group and one would not have adopted them, if he had not joined the group. Such an identity also fosters the building of a culture and tradition within the group. Namely, it strengthens its continuity and its survivability in the stormy socio-political changes. Identity also assures the ideological independence of a group and decreases the possibility to become a “tool” of other organizations or of a single charismatic leader. Namely, identity restricts the concentration of power in an organization and thus the uncontrollable situations and leadership results. This supports the thesis of [1] that ethics has an impact on organizational outcomes, including organizational outcomes that do not have explicit ethical components. Moreover, the identity building – if it is also acceptable by the public – can improve the reputation of the group, and its reliability to the public as well as to each own members.1
In this analysis, we assume that for building identity a code of ethics should include more norms than imposed by the state law. The question is to what extent (%) the hunting code of ethics can contribute to identity building in hunters organizations.
2. Literature review and theoretical framework
Certain approaches to hunters’ ethics up to now deal with the examination of the normative aspect of hunting, e.g. the acceptability of
1 Naturally, the building of identity has also characteristics that may be regarded by some people as “negative”. Such one can be the dogmatism which may lead to inflexibility and no-use of new resources (e.g. avoiding sponsors because of the fear of being dependent). In this paper, we are not going to analyze what is regarded as “negative” aspect of the identity building.
131
“Sustainable Management and Development of Mountainous and Island Areas”
hunting by the society [2], abstract philosophical discourse about whether hunting should be regarded as a “natural” or a human-induced activity [3], or the question of compatibility of the Sportsman’s code with hunting [4]. However, there is a lack of literature about the socio-cultural and organizational aspect of the hunters’ code of ethics. Our analysis is expected to contribute to the exploration of these two aspects. Specifically, in the following paragraphs we will show how a code of ethics contributes to building a sustainable identity for hunters and why such a code-based group identity is useful. Moreover we will put forward a system for categorizing rules which will be useful for the analysis of the potential of a code in identity building:
How will a code of ethics contribute to a sustainable group identity building? Why such an identity is useful?
If a code of ethics only repeats state law, then it just serves as a simplified legal databank focus on the group activity (hunting), and so its members do not need to search in big legal volumes (which would be too time-consuming and uncertain). Beyond state law about hunting, e.g. hunting time, there are also unwritten rules, e.g. behavior in hunting. If the hitherto unwritten rules become part of the written code of ethics of a group, then this decision implies that the group members or at least the decision-makers of this group, e.g. the board, want to make a step towards institutionalizing values, desired behaviors and restrictions, and thus consolidating an identity [cf. 5]. According to the Advocacy Coalition Framework [6], if an organization wants to enter a network, or in other words to cooperate with other organizations, it should adopt changes. In this case, first the secondary aspects, e.g. public relation plans, will be adapted to the new cooperation requirements, next the policy core beliefs, e.g. traditional activities and behaviors, lobbying orientations, established activities, law-making suggestions, and last the deep core beliefs, e.g. general ideology and principles. Normally, the identity of an organized group is determined only by the deep core beliefs but these are very abstract (e.g. “hunting as a way of life” or “social value”). Such an abstract identity makes practically no difference to other groups. Thus, it is understandable that if further details like policy core beliefs and secondary aspects are included
in the code of ethics, then the identity of the group is strengthened, the board is more able to control the members, and the possibility for the group to be dependent on or guided by other organizations and ideologies is minimized, e.g. it is more difficult for a political party or an environmental group to influence the hunter group just through ideological arguments. Therefore, a detailed code of ethics and the strong identity which it contributes to can save the group from cooperation with external actors which can be later regarded by some members as “undesirable” or “deceptive”. On the other hand, it may serve as a tool for more acceptable decision-making in general and minimize possible oligarchic behavior on the part of the board.
Beyond the external function of a code-based group which is described above, the code and the code-based identity have also a leadership function within the organization: [7] have distinguished between “authentic” and “pseudo-” transformational leadership. They argued that the former is based on inspirational motivation and intellectual stimulation, while the latter just on ethical values embedded in the vision of a single charismatic leader. Here we suggest that such an “authentic” transformation can succeed through a code of ethics, if this code contributes in the building of a sustainable group identity. A sustainable identity is based on the conscience of the members even after the term of the office of the leading persons and even if there not enough wildlife wardens to control them. A group identity has better chance to be a sustainable one if it is based on a written code which has not been imposed on the members just by a decision of a single charismatic leader or of a few leading persons (top-down decision-making) but on a common organizational culture which has been gradually disseminated among the members. There are various studies suggesting hunting rules (some examples will be presented below). These constitute already a written basis of group culture and could make the code more effective in identity building, if they are included through an acceptable procedure that will be regarded as a democratic one by as many hunters as possible. A code which has gained in acceptability through a bottom-up decision-making process (in this case by using literature of individual authors who belonged to the anonymous group of hunters) also helps the board of a hunting organization follow the transformational leadership model rather than the transactional one. Namely, the
132
“Sustainable Management and Development of Mountainous and Island Areas”

board can better convince the members to adjust their way of thinking and values to the code and not just implement rules. In other words, they have a better chance to achieve the desired behavior from the members, even when they can not observe them during hunting. In this way, a hunting organization achieves maximal reliability and reputation.
In contrast to the arguments of [8], the sustainable identity as described above and a code of ethics which is derived from a bottom-up process and produces a sustainable identity are objective elements which show that practically there is a point in the distinction between “authentic” and “pseudo”- transformation.
At this point, we should also point out that the hypothesis of [1] that the shared perception of what is ethically correct behaviour and how ethical issues should be handled within an organization is an outgrowth of the personal values and motives of organizational founders and other early organizational leaders is apparently inapplicable in hunting organizations. This may be true in organizations which had a particular ideology and a founder as a central basis of development e.g. environmental organizations like Greenpeace or WWF [9]. This is not the case in hunting: hunters had existed, before the hunting organizations, and most of them had already had their own values, behavioural patterns and expectations. Thus, a bottom-up process for establishing a code of ethics and an identity is the only acceptable way.
How can we categorize the rules?
The next theoretical requirement is to distinguish the rules of a code in state law and “beyond state law” in order to compare the percentage of these categories. Comparing the codes of ethics of various groups (physicians, engineers, lawyers etc), one observes that the model of Meinong-Roberts (in [10] Fig. 1) is applicable [5]. Namely, the codes can consist of:
- State law. Its implementation is demanded and is based on the fear of criminal law.
- Customs. These are patterns of behavior which have been established through tradition in the conscience of the members of the group as acceptable or even necessary rules for the preservation of the social cohesion. Therefore, their implementation is expected by everyone. Breaking the expected causes group
discontent and leads to the social isolation of the offender.
- Ethos. Ethos is every deep principle which can be implemented, only if someone really believes in it. The ethos is embedded in an internalized control (authoritative power [11]). Thus, its implementation requires neither the fear of criminal law, nor the fear of social isolation. The ethos leads to actions which are surprising (not usual) and are regarded as such by those who see them positively as admirable. Ethos necessitates considerable personal “sacrifices” and is practiced by someone even if he is not observed by anyone or even if he is not interested in the opinion of the others. An illustrative example of ethos was the decision of Socrates to accept the death penalty, eventhough he could escape from prison and leave Athens.
Customs and Ethos go beyond state law and can thus create special identity in a group. Before we analyze hunting rules, it is useful to present an example from everyday life in order to better clarify the three categories of rules. If we have a pedestrian: a. The demanded is not to assault him, b. expected is to help him, if he falls, and c. admirable is to risk our own life in order to help him, if he falls on the railway, while the train is coming.
However, the boundary between expected and admirable is not always clear. Many people could consider that admirable is not only to help someone, risk our own life but also risking to miss our plane or bus because of the time we lose to help him. The more anxiety and uncertainty characterize our world, the more individualism becomes acceptable. As a result of this fact, a certain sacrifice, e.g. to miss the bus in order to help someone becomes everyday more and more “admirable”, or, in other words, the lowest limit of sacrifice required for characterizing an action as “admirable” becomes everyday lower and lower, e.g. in the past, one should risk his life in order to be admired, while today it may be enough to miss the bus. An absolute criterion for characterizing an action as admirable in any case is the life risk or the risk of physical pain. According to the last criteria, it is almost
133
“Sustainable Management and Development of Mountainous and Island Areas”

impossible that a code of ethics includes extreme admirable rules.2
In Fig. 1, the diametrically opposite category of the admirable is the tolerable (it is tolerable that in order to serve our own interest we don’t help someone). The opposite of the expected is the objectionable (it is objectionable, if someone falls on the pavement and we do not help him, though we are not in a hurry). Finally, the opposite of the demanded is the penalized (e.g. if we assault a pedestrian). Moving from the area of demanded to the area of the admirable (and from the tolerable to the penalized, respectively), we pass from the area of usual behaviors to the area of surprising behaviors3.
Figure 1. Model of Meinong-Roberts in [10] modified by [5].
3. Method
The code of ethics for hunting is based on the Recommendation 85-17 of the Council of Ministers of the European Union. The category of Demanded has resulted after comparison with the Greek hunting laws. This seems to be a limitation on the generalizability of the results to other countries. However, it is mitigated through the fact that the formulation of the
2 An example of code encouraging extreme admirable actions is this of the Greek Lawyer Association. According to this, duty of a lawyer is to defend with “fighting spirit” the rights of the client even in courts that serve dictatorial regimes. This is a result of long historical experience. 3 We also see that a surprising behavior may be considerable by some admirable and by some else just criminal (penalized). An example is the violent actions of some environmental groups.
Recommendation is very general and the hunting laws of most countries have more similarities than differences.
For the categorization of the rules, the articles were analyzed in simple and self-inclusive sentences, when they dictate more than one norm. When these are abstract and thus can be classified in more than one category, e.g. “respect the habitants who welcome you in their place” belongs both to demand and expected or even to admirable, depending on the form of respect, they will be classified in the lowest category, because they do not encourage any action beyond the minimal norm. In a non-professional activity like hunting, normally one will not risk his life or his job in order to achieve “something better” (this is improbable, even in case of professional activities). For this reason, a hunting rule will be here classified in the category of admirable, if it encourages the hunters to do something which is time-consuming, and could otherwise be easily avoided without causing group disapproval, e.g. “I have a lot to do, I have no time” etc, and its correct fulfilling cannot be clearly evaluated, but it is only based on the self-control and conscientiousness of each hunter (e.g. the duty of the hunters to complete research questionnaires).
Observations of hunting activity and interviews with hunters have supported this analysis.
4. Results and discussion
The hunting rules can be classified as in Table 1. We see that with this classification, the hunting code consists of 29% Demanded (namely repetition of state law), 48% Expected, and 23% Admirable. In other words, it can contribute to building special group identity at a degree of 71% (=48+23) (Fig. 2). We see that the largest part of the hunters’ code builds identity and may serve as a supportive tool for transformational leadership. However, there are several points to be improved in order to achieve an acceptable “authentic” transformational leadership and a really sustainable group identity.
Naturally, not only the quantity but also the quality of the rules is important for identity building. The term quality of rules here means clearness, acceptability, usefulness for the special needs of the group activity and the extent to which the rules really minimize conflicts and ethical dilemmas. Evidently, there are rules in
Code of ethics
expected
admirabledemanded
tolerable
objectionable
penalized surp
risi
ng
usual
“bad”
“good”
134
“Sustainable Management and Development of Mountainous and Island Areas”

this code that may be further clarified (e.g. “respect the quarry”, “help wildlife survive under difficult conditions”). The code could be clear for example about the relations between hunters
and other groups (sometimes hunters come in conflict with excursionists because they disturb each other).
Table 1. Classification of the hunting rules of recommendation R 85-17 of the Council of Ministers of the EU. Demanded 29% (16 rules)
1. Observe the restrictions about the place, the method and the time of hunting. 2. Do not disturb the animals during the reproduction time. 3. Be sure that you do not shoot at protected species. Even the mistake is not to be justified. 4. Avoid hunting in harsh weather because then the quarry has fewer chances to defend itself. 5. Respect the quarry 6. Be a specialized hunter. Learn the species, the law and the rules. 7. Respect the habitants who welcome you in their place. 8. Respect the property of the others. 9. Do not forget to close the fence again. 10. Respect the agriculture. 11. Do not shoot at cables and wires. 12. Do not shoot at signs. 13. Observe the safety rules near inhabited areas. 14. Hold always the hunting license with you. 15. During transport, the gun should be empty, disassembled and in the case. 16. In house, the gun should be disassembled and at a safe place.
Expected 48% (27 rules) 1. Do not shoot at too long distance, because you will only injure the quarry. 2. Do not sell the quarry to profit from it. 3. Try to adjust the hunting method to the conservation needs of the migrational species. 4. Support the protection and the development of wildlife habitats: help in the prevention of
forest fires. 5. Do not frighten the domestic animals. 6. Do not smoke in the forest. 7. Respect the other nature users as well as nature watchers. 8. Observe the rules of good behavior near inhabited areas. 9. Do not let your dogs become aggressive or disobedient 10. All guns should be completely checked and in well maintained. 11. Use always an assembled gun so carefully, as if it is charged. 12. Do not let a charged gun, even for a few minutes, on a tree, or in sun, or in a car etc 13. Do not jump over a fence with a charged gun. 14. Do not use the gun to play. 15. Keep the barrel clean to avoid accident- especially after a difficult passing or falling 16. Do not keep the gun horizontally but always directed to the ground especially when you close
the barrel. 17. During hunting, keep the finger away from the trigger. 18. Use always suitable cartridges for the each gun. 19. Do not trust the sear. 20. During hunting, keep the sling aside. 21. Do not shoot at not recognized target. 22. Do not shoot at a bush. You do not know what is behind. 23. Do not shoot towards a person, even if it seems too far enough. 24. If you shoot with heavy ammunitation be careful with ostracism on frozen ground, trunks etc. 25. Be sure that the bullet will come finally to the ground. 26. Do not shoot over the horizon line. 27. Do not make fire.
Admirable 23 % (13 rules) 1. Do not confuse the quantity with the quality! Best hunter is not the one who catches the most
quarries. 2. Help the wildlife survive under difficult conditions. 3. Try systematically to find wounded or dead quarries.
135
“Sustainable Management and Development of Mountainous and Island Areas”
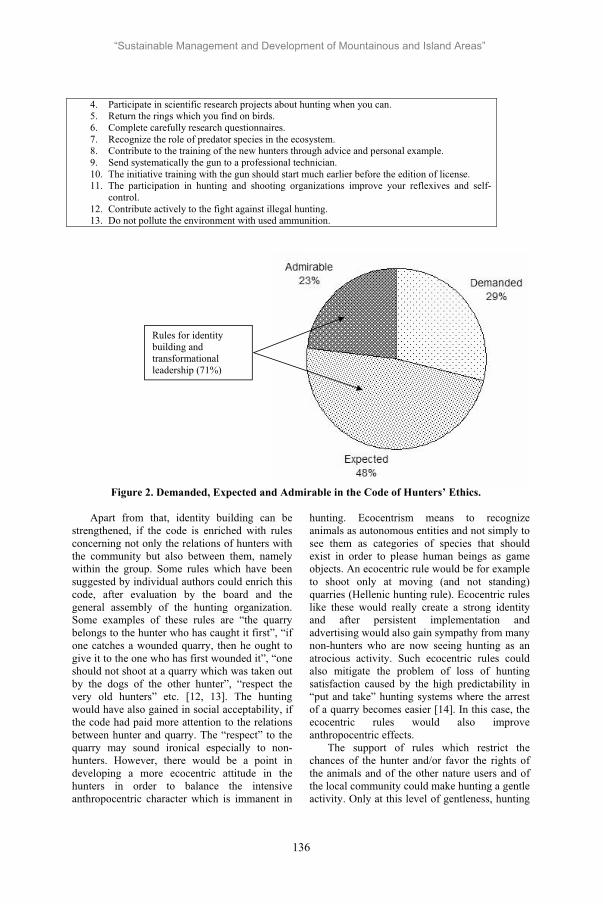
4. Participate in scientific research projects about hunting when you can. 5. Return the rings which you find on birds. 6. Complete carefully research questionnaires. 7. Recognize the role of predator species in the ecosystem. 8. Contribute to the training of the new hunters through advice and personal example. 9. Send systematically the gun to a professional technician. 10. The initiative training with the gun should start much earlier before the edition of license. 11. The participation in hunting and shooting organizations improve your reflexives and self-
control. 12. Contribute actively to the fight against illegal hunting. 13. Do not pollute the environment with used ammunition.
Figure 2. Demanded, Expected and Admirable in the Code of Hunters’ Ethics.
Apart from that, identity building can be strengthened, if the code is enriched with rules concerning not only the relations of hunters with the community but also between them, namely within the group. Some rules which have been suggested by individual authors could enrich this code, after evaluation by the board and the general assembly of the hunting organization. Some examples of these rules are “the quarry belongs to the hunter who has caught it first”, “if one catches a wounded quarry, then he ought to give it to the one who has first wounded it”, “one should not shoot at a quarry which was taken out by the dogs of the other hunter”, “respect the very old hunters” etc. [12, 13]. The hunting would have also gained in social acceptability, if the code had paid more attention to the relations between hunter and quarry. The “respect” to the quarry may sound ironical especially to non-hunters. However, there would be a point in developing a more ecocentric attitude in the hunters in order to balance the intensive anthropocentric character which is immanent in
hunting. Ecocentrism means to recognize animals as autonomous entities and not simply to see them as categories of species that should exist in order to please human beings as game objects. An ecocentric rule would be for example to shoot only at moving (and not standing) quarries (Hellenic hunting rule). Ecocentric rules like these would really create a strong identity and after persistent implementation and advertising would also gain sympathy from many non-hunters who are now seeing hunting as an atrocious activity. Such ecocentric rules could also mitigate the problem of loss of hunting satisfaction caused by the high predictability in “put and take” hunting systems where the arrest of a quarry becomes easier [14]. In this case, the ecocentric rules would also improve anthropocentric effects.
The support of rules which restrict the chances of the hunter and/or favor the rights of the animals and of the other nature users and of the local community could make hunting a gentle activity. Only at this level of gentleness, hunting
Rules for identity building and transformational leadership (71%)
136
“Sustainable Management and Development of Mountainous and Island Areas”

could be regarded by hunters as well as many non-hunters not merely as a sport [15] but also as a general way of life which is based on the feeling of fairness as well as having pedagogical value.
5. Conclusions, limitations and points for further research
We have seen that the hunters’ code of ethics seems to strongly contribute to group identity building. However, a further enrichment of the Expected and Admirable area of the code with more elaborated and apparently acceptable rules is possible for improving the chance for “authentic” transformational leadership (inspirational motivation, intellectual stimulation) and a sustainable identity. Various studies on the subject can be used in order to make the code more sustainable and suitable for transformational leadership. As argued in the method, we believe that this analysis is to certain extent generalizable, though we have used the Greek state law as basis for identifying the Demanded in the EU Code of Hunting Ethics (R 85-17). Possible improvements of the code could be to include more concrete ecocentric rules which may improve the reputation of hunters, rules about the relations between them and more elaborated rules about the relations between hunters and other nature users. Certain limitations and points for further research are the following:
1) Although we should accept that this rule classification is not the only possible one, somebody can suggest a different interpretation of state law and thus include more expected behaviors in the list the demanded ones. This could be a question for future research which could be based on judiciary decisions.
2) One could also disagree with the boundary between Expected and Admirable in this analysis. It could be researched in a future project with extensive group discussions, which can uncover further unwritten rules and criteria [cf. 16], and standardized questionnaires in a plausible sample of hunters and external observers (non-hunters). However, the distinction between expected and admirable is not very important for this study, because this paper was based on the hypothesis that the identity is created by the
integration of unwritten rules (beyond state law) in the code of ethics, and the expected and admirable ones are both categories of unwritten rules. Thus, the compiled result of 71% is not influenced by a possible change of boundaries between expected and admirable. A more specific role of the Admirable could be that this influences the specific character of the identity: The higher the percentage of the Admirable, the more ambitious and gentle the culture of the group becomes. Namely, the presence of a high percentage of admirable rules in a code of ethics of an organized group means that basic questions about how to behave have been definitively answered, and now the members of the group are dealing with issues that at the earlier stage of the history of this group would be “unnecessary luxury”, e.g. contribution of hunters to the scientific research by completing questionnaires. Such a progress can further minimize conflicts and the unpredictability in the relations within the group or between the group and society. Hunting is as old as the human being. Hunting organizations have existed for a long time. Thus, development of admirable rules could be expected. Nevertheless, we should compare the hunters’ code with codes of other organized groups of various backgrounds and orientations, e.g. sport, journalism, engineering etc, in order to say whether 23% Admirable is little or much.
References
[1] Dickson MW, Smith DB, Grojean MW, Ehrhart M. An organizational climate regarding ethics: the outcome of leader values and the practices that reflect them. The Leadership Quarterly 2001; 12(2): 197-217.
[2] Peterson MN. An approach for demonstrating the social legitimacy of hunting. Wildlife Society Bulletin 2004; 32(2): 310-321.
[3] Moriarty PV, Woods M. Hunting not equal predation. Environmental Ethics 1997; 19(4): 391-404.
[4] Luke B. A critical analysis of hunters’ ethics. Environmental Ethics 1997; 19(1): 25-44.
137
“Sustainable Management and Development of Mountainous and Island Areas”
[5] Hasanagas ND. Professional Ethics. echnological Education Institution of
Kavala. Branch Drama. Department of Forestry and Natural Environment Management 2006 (original in Greek).
[6] Sabatier P. The Advocacy Coalition Framework: Revisions and relevance for Europe. In: Journal of European Public Policy1998; 5: 98-130.
[7] Bass BM, Steidlmeier P. Ethics, character, and authentic transformational leadership behaviour. The Leadership Quarterly 1999; 10(2): 181-217.
[8] Price TL. The ethics of authentic transformational leadership. The Leadership Quarterly 2003; 14(1): 67-81.
[9] Hasanagas ND. External handling potential and internal structures of organizations. Ibidem 2004 (original in German).
[10] Papanoutsos EP. Ethics. Vol. II. Athens. Dodoni; 1995 (original in Greek).
[11] Popitz H. Phänomene der Macht (phenomena of power). J.C.B. Mohr Tuebingen; 1992.
[12] Koutras K. The unwritten rules of hunting. Hunting Inquiries 2005; 4-5. Publ. Hunting Organization of Komotini (original in Greek)
[13] Nikolaidis . Hunting as a sport – Analysis of legal framework. The handbook of hunting. Hunting Federation of Macedonia & Thrace. (original in Greek).
[14] Sokos CK, Birtsas PK. The alienation of hunting: the case of “put & take” in hunting preserves. Scientific Annals of the Faculty of Forestry and Natural Environment. Aristotle University of Thessaloniki 2006; Vol. MB (in press).
[15] Kabouroglou P. The hunting conscientiousness as a system of rules with ethical-philosophical dimensions. Hunter & Nature (original in Greek)
[16] Leifer R Lee S Durgee J. Deep structures. Real information requirements determination. Information & Management 1994; 27(5): 275-285.
138
“Sustainable Management and Development of Mountainous and Island Areas”

New technologies in geoinformation science and technology for sustainable management and development in the mountainous area of Naxos
Ioannis (John) N. Hatzopoulos Professor and director of Remote Sensing and GIS Laboratory
University of Aegean, Dept. of Environmental Studies University Hill, Mytilene, 81100
Abstract. A great advancement has happened recently in geoinformation science and technology which gives more opportunities to provide data and manage information especially for remote and mountainous areas for sustainable development. Classical geoinformation areas of remote sensing and Gis have been both evolved using new technologies. This presentation will discuss issues related to those technologies particularly those that can be used for sustainable development in such areas. Technologies such as airborne laser scanning can provide information on vegetation mapping in three dimensions being able to estimate the biomass distribution and volume with high accuracy. Information on biomass could be applied on models such as: erosion, desertification, natural hazards, etc. This type of technology is a combination of two other technologies such as global positioning system (GPS) and inertial measuring unit (IMU or INS). Other technologies such as photogrammetry and satellite imagery have also been advanced providing useful data for this kind of applications. Gis technology has also being advanced to perform the classical management of geospatial data and recent advances allow more application models to be directly incorporated within the Gis system so that to make appropriate data processing and derive useful information for sustainable development. This paper will also present such information on water management and mapping of hiking trails in the mountainous area of the island of Naxos.
Keywords. GIS, LIDAR, Remote Sensing, DTM, Sustainable development.
1. Introduction
The discussion will start with basic principles of airborne topographic Lidar and its advantages in digital terrain modeling (DTM) data extraction, as well as, vegetation and forest resources mapping. Then it will be discussed some of the technologies for digital terrain modeling (DTM) such as Interferometric Synthetic Aperture Radar (Ifsar). Finally there will be shown some applications of DTM in management of water recourses and in mapping hiking trails as a contribution to the sustainable development in the mountainous area of the island of Naxos.
2. Airborne Lidar – basic principles
A general concept of topographic Lidar (LIDAR = Light Detection and Ranging) is shown in Fig. 1. As shown in Fig. 1, [3], [6],
Figure 1. General concept of topographic Lidar
139
“Sustainable Management and Development of Mountainous and Island Areas”

there is a laser scanning device with a rotating mirror located in the airplane. The position of his device is measured and recorded in real time by a global positioning system (GPS) and an inertial measuring unit (IMU) system. Differential GPS measurements are controlled by using one more GPS device at a known ground station. Airborne Lidar systems use an active laser beam of coherent electromagnetic radiation centered in the near infrared spectrum region for ground measurements and in the visible spectrum region for underwater measurements. Measurements are actually spot elevations as shown in Fig. 1 at a frequency ranging from 10000 Hz to 50000 Hz. Geometry of Lidar system is shown in Fig. 2 [6] and the position and orientation of the laser beam is computed from GPS data (Xa, Ya, Za),IMU data (Xm, Ym, Zm, roll, pitch, heading (yaw)), and the well known distances (AM -Lever arm), (AL), and (ML) from laboratory calibration measurements. The distance (LG – boresight) is computed using recorded time of return beam by Lidar system. Actually Lidar data include ignition time of pulse which is curried out by used Lidar measuring frequency (10 – 40 KHz) and recorded time for one or more beam returns. The ancillary data of GPS and IMU are also recorded in real time and are used to determine the position of mirror L and boresight orientation.
Figure 2. Geometric analysis of topographic Lidar
Typical specifications for Lidar measurements are shown in Table 1, [3], [6]. The elevation accuracy of Lidar data as shown in Table 1, is quite high (~15 cm) as compared to the horizontal accuracy (~10 – 100 cm). This
Table 1. Specifications of topographic Lidar
Specifications Typical value Spectral wavelength 1.064, 1.5 m Topo /
0.532 m Hydro. Repeat rate 5 – 33 hz , Max 50
hz Pulse energy 100s JPulse width 10 ns Beam deviation 0.25 – 2 mrad Scanning angle 40 – max 75Scanning rate 25 – 40 Hz Scanning patterns Zig – zag
Parallel Ellipsoidal Sinusoidal
Frequency of GPS measurements
1 – 2 times per second
Frequency of IMU 50 Hz – Max 200 Hz Flight altitude 100 – 1000 m – Max
6000 m Dimensions of ground footprint
0.25 – 2.00 m (1000 m altitude)
Multiple returns of single beam
1 – 5
Ground grid dimensions
0.5 – 2.00 m
Ground elevation RMSE
15 + cm
Ground horizontal RMSE
10 – 100 cm
creates a problem to determine precisely the brake lines of ground features such as river banks, outlines of features, etc. For that reason and because Lidar is a relatively low cost technology, Lidar is used together with other remote sensing technologies such as aerial photography and satellite imagery. In this way remote sensing together with Lidar is an upgraded system to provide complete and accurate land cover information into the three dimensional space [10].
2.1. Lidar – Topographic elevation data
Lidar is capable to gather a large volume of elevation data which in combination with remote sensing data provide a complete coverage of topographic surface in three dimensions with high accuracy. Lidar is using an active sensor and can perform measurements day or night under any weather conditions with the limitation
140
“Sustainable Management and Development of Mountainous and Island Areas”

that there is visibility between sensor and target. Elevation data for DEM can be collected on topographic surface even if it is covered by vegetation.
2.2. Lidar – Forestry
The most important application of Lidar in sustainable development of natural resources is its application in forestry [1], [2], [5], [8]. In Fig. 3 it is shown that a single Lidar pulse may have recorded up to 5 returns from various heights of
Figure 3. Lidar vegetation mapping
vegetation cover. In this way vegetation can be mapped at various heights and various types such as trees, brass, bushes, etc. The use of Lidar in vegetation mapping helps to estimate: a) Geometric characteristics of vegetation such
as the high and width of trees. b) Monitoring of tree growth rate for planted
areas with trees. c) Monitoring of wooded areas used for
sustainable timber management. Other processing methods of Lidar data are using stochastic models [1], [2], [10], taking advantage of multiple pulse return to determine various parameters which are useful in forestry. Such parameters are determined as shown in Fig. 4 where foliage density is determined and is shown by its vertical profile.
Figure 4. Lidar vertical distribution of foliage density
Such methods help to determine: Simultaneous mapping of tree canopy and ground surface Vertical profile of tree foliage Estimation of tree density Detail information for composition and structure of foliage.
2.3. Lidar – coastal engineering
Lidar has significant applications in coastal engineering being a technology which can perform mapping over sandy beaches and sand dunes. Coastal processes are dynamic and must
Figure 5. Hydrographic Lidar
be monitored at frequent intervals for a better management of the area particularly on maters of maintenance and sustainability. Topographic Lidar together with hydrographic Lidar can be used together for simultaneous mapping of
141
“Sustainable Management and Development of Mountainous and Island Areas”

coastal zone in both land and shallow water areas. As shown in Fig. 5 hydrographic Lidar can be used to do bathymetric mapping [3], [6], for up to 50 meters water depth of clear water.
2.4. Lidar – data processing
Processing of Lidar data deals with elimination of points which do not correspond to the target surface which is measured. Lidar data can be used for real time rough estimates of elevation data or, for precise estimates of post processed data. Post processing originally forms a cloud of elevation points to provide a synoptic view of the project and requires mainly two levels of processing. The first lever uses an automatic algorithm which eliminates 90% of wrong elevation points. The second level works manually with the operator’s aid to eliminate the rest of 10% of wrong elevation points. It must be noted that manual processing absorbs 40% of resources of total costs of a Lidar project. Lidar projects may be found in web references [12], [13] and [18]. Lidar data may be found in web references [14], [15], [16] and [17].
3. Interferometric Synthetic Aperture Radar (IFSAR) technology.
Ifsar technology is based on intersection of ground points by two microwave (RADAR) pulses. As shown in Fig. 6 [3], [6], two beams K1
Figure 6. Principles of IFSAR system
and K2 from the ends of a baseline B transmit microwave coherent pulses covering a ground swath width and the back scatter is received and the time is recorded. Recorded time defines the distance to the corresponding target and thus for
each target there are two distances recorded one from K1 antenna and one from K2. Ifsar systems include GPS and IMU systems in a similar way as those are used in Lidar systems (see Fig. 2). Ifsar systems are operating day and night and under all weather conditions. The system is usually mounted in a jet plane and can cover relative large areas as comparing to Lidar systems but provides less accuracy. Usually Ifsar systems work on a single band and perform either top of the vegetation mapping or ground surface mapping. X–band is used for example for ground surface mapping while P–band is used for top of vegetation mapping. However there are systems which use both bands to map in a single flight both the top of vegetation and the ground surface. Such systems have a total of four tranceivers, two for the X-band and two for the P-band. It must be noted that a single target point on the ground is viewed from many transmitted pulses of same transceiver from different locations of the course of the aeroplane. Synthesis of those pulses to define a single target point defines the synthetic part of the Radar system.
4. GIS technologies
New technologies as described for data acquisition to create three dimensional remote sensing data of land cover are constantly developed and used for a wide range of applications. Parallel to this GIS systems are also evolving into more sophisticated systems. It must be noted the role of software on such technologies which represents almost 98% of total costs and total processing performance. GIS is used to manage a large volume of data distributed over the geographical space and deal with data values and geographical locations of such values. Management includes input and output operations, data storage and retrieval and almost unlimited ways of data processing to derive useful information. Output operations include data visualization options such as thematic map and three dimensional presentations or even virtual reality presentations. Those capabilities of GIS systems make them particularly useful tools for sustainable development projects. Such projects are worked out over geographic locations and geographical space is an integral part of the project. On the other hand many phenomena which take place
142
“Sustainable Management and Development of Mountainous and Island Areas”
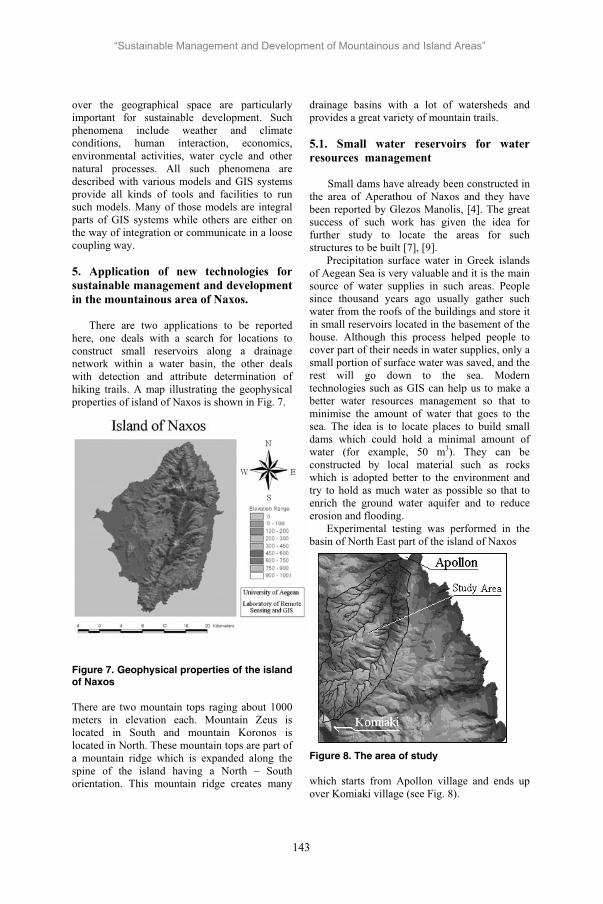
over the geographical space are particularly important for sustainable development. Such phenomena include weather and climate conditions, human interaction, economics, environmental activities, water cycle and other natural processes. All such phenomena are described with various models and GIS systems provide all kinds of tools and facilities to run such models. Many of those models are integral parts of GIS systems while others are either on the way of integration or communicate in a loose coupling way.
5. Application of new technologies for sustainable management and development in the mountainous area of Naxos.
There are two applications to be reported here, one deals with a search for locations to construct small reservoirs along a drainage network within a water basin, the other deals with detection and attribute determination of hiking trails. A map illustrating the geophysical properties of island of Naxos is shown in Fig. 7.
Figure 7. Geophysical properties of the island of Naxos
There are two mountain tops raging about 1000 meters in elevation each. Mountain Zeus is located in South and mountain Koronos is located in North. These mountain tops are part of a mountain ridge which is expanded along the spine of the island having a North – South orientation. This mountain ridge creates many
drainage basins with a lot of watersheds and provides a great variety of mountain trails.
5.1. Small water reservoirs for water resources management
Small dams have already been constructed in the area of Aperathou of Naxos and they have been reported by Glezos Manolis, [4]. The great success of such work has given the idea for further study to locate the areas for such structures to be built [7], [9]. Precipitation surface water in Greek islands of Aegean Sea is very valuable and it is the main source of water supplies in such areas. People since thousand years ago usually gather such water from the roofs of the buildings and store it in small reservoirs located in the basement of the house. Although this process helped people to cover part of their needs in water supplies, only a small portion of surface water was saved, and the rest will go down to the sea. Modern technologies such as GIS can help us to make a better water resources management so that to minimise the amount of water that goes to the sea. The idea is to locate places to build small dams which could hold a minimal amount of water (for example, 50 m3). They can be constructed by local material such as rocks which is adopted better to the environment and try to hold as much water as possible so that to enrich the ground water aquifer and to reduce erosion and flooding. Experimental testing was performed in the basin of North East part of the island of Naxos
Figure 8. The area of study
which starts from Apollon village and ends up over Komiaki village (see Fig. 8).
143
“Sustainable Management and Development of Mountainous and Island Areas”
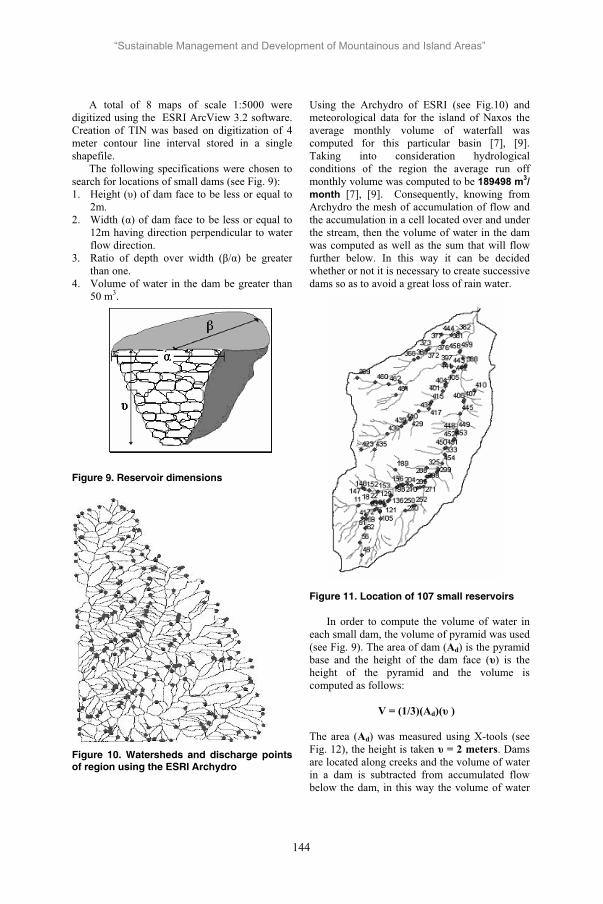
A total of 8 maps of scale 1:5000 were digitized using the ESRI ArcView 3.2 software. Creation of TIN was based on digitization of 4 meter contour line interval stored in a single shapefile. The following specifications were chosen to search for locations of small dams (see Fig. 9): 1. eight ( ) of dam face to be less or equal to
2m. 2. Width ( ) of dam face to be less or equal to
12m having direction perpendicular to water flow direction.
3. Ratio of depth over width ( / ) be greater than one.
4. Volume of water in the dam be greater than 50 m3.
Figure 9. Reservoir dimensions
Figure 10. Watersheds and discharge points of region using the ESRI Archydro
Using the Archydro of ESRI (see Fig.10) and meteorological data for the island of Naxos the average monthly volume of waterfall was computed for this particular basin [7], [9]. Taking into consideration hydrological conditions of the region the average run off monthly volume was computed to be 189498 m3/month [7], [9]. Consequently, knowing from Archydro the mesh of accumulation of flow and the accumulation in a cell located over and under the stream, then the volume of water in the dam was computed as well as the sum that will flow further below. In this way it can be decided whether or not it is necessary to create successive dams so as to avoid a great loss of rain water.
Figure 11. Location of 107 small reservoirs
In order to compute the volume of water in each small dam, the volume of pyramid was used (see Fig. 9). The area of dam (Ad) is the pyramid base and the height of the dam face ( ) is the height of the pyramid and the volume is computed as follows:
V = (1/3)(Ad)( )
The area (Ad) was measured using X-tools (see Fig. 12), the height is taken = 2 meters. Dams are located along creeks and the volume of water in a dam is subtracted from accumulated flow below the dam, in this way the volume of water
144
“Sustainable Management and Development of Mountainous and Island Areas”

reaching the see can be calculated. Throughout this experiment spots for 107 small dams were located (see Figure 11) and a volume of 9786 m3
of rain water is anticipated to be held in these dams or 5.16% of the total monthly rainfall (see
Figure 12. Location of small reservoirs using X – tools along 2m interpolated contours
Table 2). Table 2 shows Dam ID, Area, reservoir Volume, Accumulated volume upwards the dam, and Accumulated volume downwards the dam.
Table 2. Individual and accumulated reservoir water volume [7], [9]
Dam
s_ID
Area Vdams Vaccum
ulated
Upwards Downw
ards
11 157,263 104,842 5.380,42 5.380,42 5.275,58
18 126,329 84,219 7.986,10 7.881,26 7.797,04
19 85,860 57,240 8.031,29 7.842,23 7.784,99
20 133,144 88,763 8.200,12 7.953,82 7.865,06
22 75,939 50,626 8.258,46 7.923,40 7.872,77
23 101,049 67,366 8.362,50 7.976,81 7.909,44
25 75,315 50,210 8.614,84 8.161,78 8.111,57
… … … … … …
121 106,089 70,726 18.329,0 17.555,9 17.485,2
127 128,262 85,508 28.531,1 27.103,5 27.018,0
460 87,965 58,643 3.346,51 3.275,42 3.216,78
461 96,662 64,441 2.314,46 2.314,46 2.250,02
462 77,474 51,649 7.456,80 7.327,07 7.275,42
Total 9786,06
5.2. Detection and attribute determination of hiking trails
The same region of the Komiaki – Apollon basin shown in Fig. 8 was used to study the hiking trails. Such studies are greatly facilitated by using remote sensing images together with Lidar surveys to detect and locate existing hiking trails. The island of Naxos and this particular region before 1960 did not have car driven roads and all transportation in the area was performed
through hiking trails using mules and donkeys. However, there is a quite dense network of hiking trails all over this region. The existing maps of 1:5000 scale were produced by the Greek Army Geographical Service using aerial photographs taken in late 1980. However, most of existing trails are shown on the 1:5000 scale maps. For this reason trails were directly digitized from the 1:5000 scale maps. The 4m contour lines as mentioned in paragraph 5.1 were also digitized and an appropriate TIN was developed.
Figure 13. Location of two hiking trails in the basin of Komiaki - Apollon
As shown in Fig. 13 [11], out of a dense trail network two significant trails were located. The first one is located in the West part of the basin and connects Apollon with Komiaki. The second one is located in the East part of the basin and connects Apollon with Mesi. Using GIS technology to process the elevation data, some attributes of such trails can be derived. The most important attribute is the degree of slope along the trail which determines the rank of difficulty. This attribute can be analytically determined as the ratio of elevation difference between two points over the horizontal distance between those points. However, slope changes along the path of the
145
“Sustainable Management and Development of Mountainous and Island Areas”

trail and there is an average slope along a specific trail. Slope data can be analytically illustrate in a trail profile which is a vertical section along the trail length. Trails may be ranked by the degree of slope as follows: a) Slope 1% - 3% Easy b) Slope 4% - 7 % moderate difficulty c) Slope 8% - 10 % difficult Slopes greater than 10% must be avoided because of erosion problems unless trails are paved by pieces of rock. Both trails shown in Fig. 13 provide courses of all ranks of difficulty. Generally specifications for trails are well analyzed by [11] and are based on work done by [19], [20]. An other attribute to be determine by GIS technology is the vista points which can be found using visualization techniques. Vista points can be chosen by viewing through three dimensional analysis the trail bath using different points of view and different angles of view. Vista points can be also associated with construction of kiosks and other facilities to facilitate hikers. Other attributes to be managed by the GIS system is all year around cultural activities along the trail path. It is important to understand that the Greek islands maintain an over thirty thousand years of accumulated culture which to a certain degree is still maintained. Such culture includes hospitality, traditional agriculture and quality agricultural products, local customs (dancing, weddings, cooking, etc.), local industry such as wine making, water mills, hand made pottery, production of cheese, local products from wool and text styles, just to mention a few. The entire trail path can be simulated in a virtual reality product to be distributed for potential tourists.
6. Conclusions
Sustainable development is a serious issue for keeping a delicate balance between production and environmental concerns. However, geoinformation technologies can greatly facilitate such processes, by providing reliable data and tools such as GIS tools to derive useful information. Modern data acquisition remote sensing technologies such as Lidar, Ifsar, aerial photography, and satellite imagery can provide up to date multitemporal information for mapping and monitoring of most important factors affecting sustainable development.
Emphasis was given to Lidar airborne laser scanning which is an evolving technology for vegetation and biomass mapping. This technology is particularly useful because of its ability to provide multiple returns from vegetation elements located vertically at various heights provided there is optical contact with the Lidar sensor – transmitter system. The applications to the mountainous area o the island of Naxos showed that water management is important because a lot of water from rainfall reaches the sea causing erosion and flooding in a region where water is a very valuable resource. However new technologies could help to estimate water quantities at specific discharge points of watersheds after a rain fall and help to locate small reservoir structures, which are adopted to the environment and hold water destructive power and facilitate feeding of ground water aquifer. Hiking trails which carry about thirty thousand years of history in the mountainous areas of Greek islands are also greatly facilitated by such technologies since a wealth of natural and cultural recourses can be managed in a way according to the sustainable development to maximize their attraction to tourism.
7. References
[1] Hans-Erik Andersen, The use of airborne laser scanner data (LIDAR) for forest measurement applications, Precision Forestry Cooperative University of Washington College of Forest Resources. Unpublished Ph.D. dissertation, University of Washington, Seattle, WA.
[2] Andersen, H.-E., J. Foster, and S. Reutebuch. 2003. Estimating forest structure parameters within Fort Lewis Military Reservation using airborne laser scanner (LIDAR) data. In: Proceedings, 2nd Inter-national Precision Forestry Symposium. Seattle, Washington. University of Washington, College of ForestResources: 45-53.
[3] ASPRS, David F. Maune editor, 2001. Digital elevation models technologies and applications: The DEM users manual.
[4] Glezos Manolis, 1993, Enrichment of Aquifer using Low Dams for Stream Flow Interception in Mountainous regions, Proceedings, 2 Hydrologic Congress of Greek Committee of Hydrogeology, November 24-29, Volume ’, pp. 99-105.
146
“Sustainable Management and Development of Mountainous and Island Areas”

[5] Harding, D., M. Lefsky, G. Parker, J. Blair. 2001. Laser altimeter canopy height profiles: Methods and validation for closed-canopy, broadleaf forests. Remote Sensing of theEnvironment 76:283-297.
[6] Hatzopoulos J., N. 2006. Topographia, B. Giourdas Publishers.
[7] Hatzopoulos John N., Stilianos Karafillis, Dimitra Gkitakou, 2005. Digital Elevation Data and the Use of ArcHydro to Locate Places for Creation of Small Dams in the North East part of the Greek Island of Naxos. Proceedings, 9th International Conference of Environmental Science and Technology, 1 - 3 September 2005, Phodos Greece.
[8] Jennings, S.B., N. Brown, and D. Sheil. 1999. Assessing forest canopies and understory illumination: canopy closure, canopy cover and other measures. Forestry 72(1): 59-73.
[9] Karafillis S., Gkitakou Dimitra, 2004, ArcHydro hydrologic model application in North Eastern part of Naxos island and utilisation of data to locate places for small dam creation. Senior Project, Laboratory o Remote Sensing and Gis, University of Aegean, Department of Environmental Studies.
[10] Lim, K., and P. Treitz, 2004. Estimation of aboveground forest biomass from airborne discrete return laser scanner data using canopy-based quantile estimators, Scandinavian Journal of Forest Research, 19:558-570.
[11] Pappi Eugenie, 2003. Planning for the development of North East part of the Greek island of Naxos using GIS with emphasis on hiking trails for tourists. Master thesis on Policy and Management post graduate program, University of Aegean, Department of Environmental Studies.
[12] http://cswgcin.nbii.gov/ecoregion/forthood/[13] http://www.tsarp.org/viewmaps.html[14] http://www.cast.uark.edu/cast/geostor/[15] http://atlas.lsu.edu/lidar/[16] http://seamless.usgs.gov/[17]http://www.csc.noaa.gov/crs/tcm/missions.ht
ml[18]http://rocky2.ess.washington.edu/data/raster/
lidar/index.htm[19]Federation of Greek Climbers 1983,
Instructions for planning trails in Europe.
[20]The Florida Recreational Trails Council 1998 “Florida Greenway and Trail system design guidelines for unpaved and padding trails”
147
“Sustainable Management and Development of Mountainous and Island Areas”

Sustainable Use of Peatlands
Csilla Hudek, PhD student, Corvinus University of Budapest, Department of Soil Science and Water
Management, Villanyi ut 29-43. Budapest, 1118 Hungary [email protected]
Abstract. Peatlands play an important role in the biosphere and are a key characteristic of the landscape. Managed in an unsustainable manner it can have a negative impact on a local, regional and global level. The peatland habitat needs special protection, especially from human encroachment. Inappropriate cultivation causes peat to shrink twice as fast as it does under pasture. The paper discusses the present local situation of these areas including all the human interests and activities. It also reveals the regional and global sustainability and climate stabilization interests of this specific environment.
Keywords. landscape, peatland, sustainability
1. Introduction
Peat is a soil that is made up of partially rotted remains of dead plants which have accumulated on top of each other in waterlogged places for thousands of years. Theoretically if the conditions are right any plant community can form peat. Of course not any plant species can grow under these conditions. The most important criteria is that the soil and peat must be saturated with water all the time. The following factors controlling peat formation: - climate conditions, the balance between rainfall and evaporation, - soil type and drainage, - soil chemicals which determine the amount of water passing through the soil. Peat is formed in poorly-drained regions of high humidity but warm enough for the growth of vegetation. In drier areas peat can form only where defective drainage causes water to collect. Boglands are huge chemical and energy stores which can be an investment for our future and a repository of information relating to all our past. Peatlands have been used by humans for many centuries in a sustainable way. All these
human activities have become more intensive in the decades following WWI. This leads us to a serious problem, the loss of original peatland habitat that jeopardises the global environment.
2.1. Peatlands in the world
3-4% of the world’s surface is covered by peatlands, which is approximately 4 million km2. Peatlands have been formed in every continent except the Antarctic. Any country which has cool and wet climatic conditions is ideal for peatland formation. The largest areas are found in the north temperature zone, simply because the climatic conditions are better for peatland formation. Over 30 million ha have been converted to forest or agricultural fields and a further 5 million ha have already been exploited for fuel, horticulture and various other purposes worldwide. Over 30% of our carbon is stored in peatlands, this is of high importance in climate change issues. It also stores some 20% of all liquid freshwater resources in the world.
Figure 1. Distribution of Mires(Source: International Peat Society)
Australia and New Zealand have a total of 10 800 km² of peatland with the most characteristic bog type; cushion-plant bog which is unique to this continent. Sphagnum harvesting on this continent is on the increase. The majority of the production is coming from
148
“Sustainable Management and Development of Mountainous and Island Areas”
natural sphagnum peatlands but in New Zealand there is a growth trial of Sphagnum moss in glasshouses. There is no control on moss harvesting in Tasmania for the domestic market on private lands. However, on bog land where protected species are living, a licence is required to harvest. Peatlands in Africa are rare. Highlands give home to the biggest boglands in Africa, but in all are not larger than 58 405 km². Trials have already taken place in Central Africa to determine the viability of peat as an option for fuel. There is a total of 1 847 216 km2 of peatland all together in the South and the North of America. We have to separate South and North America if we are talking about peat. In the south, Brazil, Peru, Chile, Cuba and other countries have large peatlands, but not more than 112216 km2 in total. The North part of America of course is a different subject. Nearly 40% of the world’s total peatlands have formed in Canada and in the US. Alaska has the largest extensive and undeveloped boglands in the whole world, mainly with arctic type bog. The majority of the bog in the south of the US is a sub-tropical savannah fen, which is typical of Florida. Today, Canada is the leading country in the world in terms of volume of horticultural peat produced. Currently 0.02% of peat has been harvested for horticultural use in Canada which is 16 200 ha of peatland. Approximately 800 000 tons of peat and more than 18 000 000 ha of peatland have been converted to other land uses; urban, industrial and agriculture development. Canada is the 3rd largest producer of cranberries in the world, with 17 million kg berries a year, most of which is produced on peatland.Siberia has over 706 000 km2 of peatland and different varieties therein. From the North to the South we find the arctic, flat palsa, domed palsa, and the most common, the domed raised bog with the combination of pools and ridges. With 5 160 000 ha of land, Western Siberia has the largest single raised bog in the world which is an enormous carbon sink. China, Indonesia, and Malaysia have the biggest peatlands in the tropical zone with topogenous and ombrogenous types of peatland. Peat is in jeopardy in North and South East Asia. The majority of these lands have been affected whilst being converted for agricultural use by
various methods; over drainage, overgrazing, afforestation, and fire. The Chinese State Council recognised the importance of the lands and recently adopted a strategic plan for wetland conservation for the next 50 years. Asia has 1 523 287 km2 ofbogland.
2.2. Peatlands in Europe
Peatlands in Europe are extremely diverse and cover approximately 515 000 km2 in total. The most extensive areas are in Scandinavia and Russia. Latvia, Norway, Sweden, Ukraine, Russia and Liechtenstein have more than 50% of their original peatland resources remaining. There are huge areas of bogland that had been disturbed by human activities. This is typical of the Western European countries, where the technological improvements helped to better exploit the peatlands’ resources. The lands have been cultivated and almost entirely used for agricultural purposes; the Netherlands would be a perfect example of this practice. In Ireland and the United Kingdom, 90% of raised bogs and nearly 85% of blanket bog have been lost. Peat used for fuel and the inappropriate management of the bog caused 20 percent of the total original peatland loss in Europe. In Eastern Europe, the state of their peatlands is more encouraging due to less exploitation but this is set to change as the peat mining companies of Western Europe have already targeted countries like Estonia, and begun the preparations to use this peat for more industrial purposes.
3. Environmental issues of cultivated peatlands
Bogs have a unique ecosystem. Bogs and fens are the only place many rare organisms can be found, and human disturbance of these areas could cause irreversible damage, and disappearance of valuable endemic species. Populations of plants and animals can disappear for ever. A typical peatland bog supports several species of plants such as pitcher plants (Sarracenia spp.), butter worts (Pinguicula spp.) and sundews (Drosera spp.), not commonly found in mineral soils. These species tolerate only a relatively narrow range of disturbance and changes in their exclusive ecosystem.
149
“Sustainable Management and Development of Mountainous and Island Areas”

Peatland afforestation caused 150 000 km2 of peatland loss in the world. The cause of 30% of peatland losses in the non tropical world is the result of virgin or cutover peatland afforestration. After World War II many countries had drained their peatlands and converted them into forests. Between the 1950’s and 1980’s, 50% of the original boglands of Finland had been drained and converted into forests, and today in Canada, nearly 25 000 ha peatlands have suffered the same fate. Converting virgin peatlands into forest can have various negative effects, flora and fauna that need open air to stay alive and to breed, are threatened. The predator population also increases which could cause a serious decrease in other animal species. Original flora and fauna disappear, and the increase of run off causes erosion and cracking of peat moss, resulting in drastic changes in the biodiversity and the landscape. Nutritional enrichment from fertilizers causes local eutrophication, as well as the sedimentation and acidification of rivers. To manage peatland forest in an inappropriate manner can also cause serious harm in the lasting peatland environment. It is necessary to choose the appropriate wood species and control the area after the plantation is finished. It is hard to control the vegetation if the main wood species are slower growing than other species on the field. In this case the other faster growing species will take over and control the field and sooner or later will replace the original timber colonies. The fern colonies are typical fast growing plants which can have negative effects on wood plantations in peatlands. It is required to mention the socio-economical importance of the peat swamp forests in the tropical zone too. Timber is one of the most important industries of many countries in this zone. As long as illegal massive exploitation of the peatlands’ woods is tolerated, there is considerable danger to the remaining peatlands’ habitat. Peatland losses in the non tropical world caused by agriculture are some 250 000 km2
,which is 50% of the total loss. To graze on peat is one typical and traditional way of using peatlands in many countries, but overgrazing is one of the principal factors of peatland erosion. Large numbers of livestock can damage the vegetation cover, and reduce the number of endemic species, thus changing the
characteristics of the area and giving space for invading species. It is important to know how many animals can feed off the area and when and how long one has to take the livestock off from the field until the vegetation can regenerate. In the European Union, grant aid encouraging farmers to increase the number of livestock quickly leads to overgrazing problems. But there is another problem with grazing. Farmers use fire to clean the field and stimulate the succulent heather shoots favoured by grazers each and every year. In Asia, bog is an important field for the local work communities to graze. Tibetan herders are one of the best examples of this dependency. Farmers have known for some time that to convert the bog into cultivatable land, they need to go through a massive preparation process, and have to introduce a lot of fertilisers into the soil. The drainage of the bog is essential in low altitude bogland areas; this will improve its worth as agricultural land, especially for growing potatoes if the field has been managed in the appropriate manner. To use cutover and cutaway bogs for grassland seems to be the practical choice. The arable and vegetable crops that could be cultivated grow only on deep fen peat and they are not commercially sound in any case. To put cereal on the cutover is not a viable option either, due to the problems of an acidic soil and pest problems. Berries however, have been proven to thrive under these conditions as does grass sod but neither are really a worth the effort given their poor marketability. Two other alternatives for peatlands both have their merits but, due to their nature, they cannot co-exist, so a decision has to be made. Peatlands that have already been drained to allow extraction can sometimes double as a reserve for wildlife, facilitating rambling, fishing and other outdoor pursuits. The other option is to install wind farms on these lands but of course, this would see a decline in the bird population and a subsequent negative impact on local biodiversity. Although there isn’t a dedicated, widespread policy for wind farms in many countries at the moment; it will have to become a more pressing issue in the future given our dependence on non-renewable energy resources.
150
“Sustainable Management and Development of Mountainous and Island Areas”

4.1. Use of Peat for Different Purposes
All over the world peat has been used for various purposes. Farmers graze sheep and cattle on bogland which gives enough feed for the animals during the vegetative period. In Ireland most of the high altitude blanket bogs have been converted into woodlands. The reason for this is that the conditions are not suitable for any agricultural manipulation, but with intensive drainage and additional phosphates, it gives good conditions for conifers to grow. Only 9% of Irelands’ land is forest which makes the country the second least forested country in Europe. This is changing due to national policies and organisations putting effort into raising the number of woodland ha for many years. It is also important to mention that the procedure, during which the peatland becomes suitable for silvicultureal purposes, will take time and money, especially if we are talking about virgin peatlands. Not mentioned yet is the environmental disturbance to the area and the surroundings. The water of the rivers is also affected by the drained water from the peat and the leaching of the fertilisers added into the soil later on. There have been many experiments carried out regarding the use of energy forests in peatland since the 1970’s. Unfortunately the prices of other energy sources at that time were lower which gave a more economically efficient option at the time. Use of cut away bog for silviculture seemed to be a better idea. Diverse, fast growing vegetation, give good cover for the soil and protect the surface from erosion. It gives space for new biological ecosystems. The most important factor is the diversity within an ecosystem. This means the system is less vulnerable, more stable and because of this the use of any external chemicals would not be required.
4.2. Peat for fuel
In modern times many bogs have been modified by human action. In Irish history peat has been an important domestic fuel. The cutting of peat for fuel in Ireland began in the 17th century and continued at an increasing rate until the mid twentieth century. Dried bogs are sometimes called turf. Turf for domestic use, for a long time, had been cut by hand. During
World War II turf was the only available fuel in Ireland. After the war other resources with lower prices were available and that decreased the harvest of the bog. Nowadays peat is still sold commercially as peat briquette which is a milled peat compressed in high temperature, but most households use other energy sources for fuel these days. The industrial importance of peat as a fuel also has a long history. It has been used since the 18th century by blacksmiths and up to the 21st
century in electric power stations. From the 1970’s, turf cutting machines replaced the old hand-cutting method and this increased the amount of peat that could be excavated. Back in the 1960’s in Ireland, over 40% of electricity consumption was covered by feeding power stations with turf. At present 10% of the total electricity use in Ireland is supplied by peat used power stations.
4.3. Peat in the horticultural industry
The horticultural use of peat, commonly known as moss peat, has become widely industrialised. In nearly every part of horticulture, peat plays a significant role. Some decades ago many research projects tried to find an economically viable use for the peat moss left over from the power stations. Today’s scientists are working on finding peat alternatives so less is in used in horticulture. Of all the peat moss used for horticultural purposes in the UK, 2/3 of the peat has been used by amateur gardeners and only the reminding 1/3 has been used by professionals. Germany and the UK are the highest peat users in professional horticulture. All over Europe there is a recognisable increase in the use of peat alternatives. Countries where the peat is not available locally in a high quantity or at all, have been used other peat alternatives, like pine barks in France. In the Netherlands, peat is an import material and dependant on other countries supplying it, so they always search for new peat alternatives and invest in research to find new growing materials. Barks, coir, rice husks are just some examples that have been used as a peat alternative. Environmental policies in the EU are getting stricter regarding the conversion of peatlands.
151
“Sustainable Management and Development of Mountainous and Island Areas”

4.4. Peat in other fields of use
Peat for medical purposes; peat baths have been used from the 19th century in Europe. The warm peat mud is believed to possess healing properties. Peat for building material; it was a common building material in the 17th
and 18th centuries in Ireland for families who could not afford other traditional materials. The mixture of peat with other resources was used in construction, as insulation for example. Peat for packaging; peat moss had been used as a packaging material during transportation of vegetables and fruit. Peat in food industry; the harvest of wild berries from peatland is common, especially in Northern Europe. Millions of kg of berries have been harvested every year in Finland and other parts of Scandinavia. In Ireland some distilleries prefer peat in the filtering process when making whiskey. Peat as a filter; peat can be an effective natural filter for removing hazardous materials. It has been used to filter gases, odours, and liquids by pharmaceutical industries and it has been used in bio-filtrations systems. In Europe over 10 000 m3 of peat has been used for air purification, and over the past 20 years it has been used to absorb oil spills. Peat for textiles; peat fibre or Cotton-grass (Eriophorum augustifolium) hasbeen used in Europe for over a century to make textiles. It is an expensive procedure to make textiles from peat fibre so it is not common practice, however; it was used in wartime England due to a lack of alternatives. Cultural references to peat; peat would have played a significant role, both as a physical resource and source of revenue in many communities and as such it has been immortalised in song, story and phrase, in painting and in poetry.
4.5. Peat as an archaeological sink
Peatlands hold important information about our past. Archaeologists bring objects and bodies up from the bog still in excellent condition. The nature of the bog is such that some thousands year old bodies return to the surface perfectly preserved. Not only the bones, but the skin, hair and stomach contents remain intact. That allows scientists to easily determine causes of the death, to be able to analyse diseases, and the date of death. The clothing materials also remain on the body unharmed. Buried wood, metal, stone objects as well as food are regularly found in bogs. Precise data about our cultural history can be found in the contents of our boglands. With our modern analytical techniques we can determine the history of the area’s vegetation and climatic condition. It is a major issue to maintain boglands in a sustainable way. With an inappropriate field management system not only will the natural ecosystem suffer irreparable damage but we can also lose important information about our history. With pollen analysis from the different layers of peat, we easily can deduce the areas vegetation and with carbon - 14 dating, specify the year as well. The tephra analysis helps to analyse volcanic ash and this can identify climatic conditions in that specific year. Archaeological research helps us to discover our past and leads us to understand what future brings us.
5. Carbon cycle
Peatlands are rich in organic matter and contain about 50% carbon. Both bogland and its carbon cycle have a unique and strong connection to each other, this cycle gives the field its key characteristics. Undisturbed peatlands have a balanced carbon cycle and accumulate carbon from the air at a rate of up to 0.7 tonnes per hectare per year. After the peat has been disturbed this balance is disrupted. Less carbon is absorbed and more CO2 is released along with methane. This combined with other greenhouse gasses from the burning of fossil fuels exacerbates the problem of global warming. Boreal, subarctic peatlands have an estimated 455 Gt carbon content, the tropical peatlands have a total
152
carbon store which may not be as large, but significant at 70 Gt. Peatlands globally contain 1200 t C ha-1 and peatlands in the tropic hold 5000 t C ha-1. The present carbon accumulation rate for boreal and subarctic bogs and fens is estimated as 0.21 t C ha-1 year-1 but in the tropical zone rapid carbon accumulation can happen from 0.61 to 1.45 t C ha-1 year-1. If even a small percentage of these lands were to be drained there would be a massive increase in the amount of CO2 put into our atmosphere. The greenhouse effects caused by the release of carbon gases from drained peatlands are a significant threat to our environment. The formation of the United Nations Framework Convention on Climate Change highlights the growing concern over CO2emissions on a global scale. This led to the Kyoto Protocol, and although the reliance on fossil fuels is the main concern for the countries signed up to this framework, peatlands still account for a large percentage of many countries’ CO2 emissions.
6. Conclusion
“All farm managers in the twenty-first century must be aware of the effects their production practices have on the environment, both on and off the farm and take the steps necessary to keep our agricultural resources productive and environmentally safe.” (Duffy 2004) The land is the most critical physical resource; it is essentially a fixed supply and the most valuable asset in the balance sheet of agriculture. There are numerous varieties of peatland throughout the world and they have a common factor in that they are all subject to our influence. Nowadays farm managers need to spend more time to educate themselves, to be better organised and to make more efficient, faster management decisions than previous generations. This is due to agriculture becoming more complex, with advances in technology and the presence of environmental issues we simply did not consider in the past. These factors are creating new management problems but also present new opportunities. Farmers should be aware of the different values present in farm organisation. They must consider a balance of practices, those that benefit them personally (e.g. financially), and practices undertaken solely to maintain the local, regional and subsequently, the global
environment of which peatlands are an integral part. “The successful managers are those who can generate the profit while sustaining resources on the farm and minimizing environmental problems off the farm.” (Duffy 2004) It is necessary to support peatland research, to collect as much information as possible and to identify any problems or recommendations regarding sustainability. We must find solutions to satisfy the land owner and the environmental regulations they are subject to. Even if the farmers’ methods do not meet an environmental regulator’s requirements, the government should take responsibility and support the farmer in different ways. One solution could be via financial aid, to encourage farmers to pursue more environmentally sound farm practices. Regulation of land use is required today more than ever given our knowledge of the consequences of inappropriate land management, and the willingness of some to put their interests and desires before the local, and consequently, global environment.
7. References
[1] Bellamy D. The Wild Boglands Bellamy’s Ireland. Dublin: Country House; 1986.
[2] Cook J G. Your Guide to the Soil. Herts: Merrow Publishing Co; 1965
[3] Crawford P. The Living Isles A Natural History of Britain and Island. London: British Broadcasting Corporation; 1985.
[4] Denny H, Treweek J. Selected topics in Environmental Science. Milton Keynes: The Open University; 2002.
[5] Drennan G. Learning About Your Countryside Field Studies in Northern Ireland. Belfast: Black stuff Press; 1973.
[6] Duffy P A, Edwards W M, Kay R D. Farm Management. New York: McGraw-Hill; 2004
[7] Foster W J. editor. Nature in Ireland A Scientific and Cultural History. Dublin: The Lilliput Press Ltd; 1997.
[8] Warr K. editor. Climate Changes. Milton Keynes: The Open University; 2006.
153
“Sustainable Management and Development of Mountainous and Island Areas”

[9] Reynolds R. Environmental Science – Extreme Weather, Atmospheric Chemistry and Pollution, Wetlands and the Carbon Cycle, Cryosphere. Milton Keynes: The Open University; 2006
[10] Attenborough D. The Private Life of Plants A Natural History of Plant Behaviour. London: BBC Enterprises Ltd; 1995
[11] Limin S, Putir EP.: The massive exploitation of peat swamp forest potentiality has not successfully increased the local people’s prosperity in Central Kalimantan. wwwgeo.ees.hokudai.ac.jp/core-univ/ english/proceeding/Tropeat99.pdf [06.22.2006]
[12] Jauhiahinen J, Vasander H.: Carbon fluxes in Central Kalimantan peatlands. http://www.alterra-research.nl/pls/portal30/docs/folder/strapeat/strapeat/download/11%20structure%20and%20biodiversity.pdf [06.22.2006]
[13] Mansor M, Mansor A.: The structure and biodiversity of peat swamp forests. http://www.alterra-research.nl/pls/portal30/docs/folder/strapeat/strapeat/download/11%20structure%20and%20biodiversity.pdf [06.22.2006]
[14] Hope C, Sinha S.K. editor. Intergovernmental panel on climate change Climate Change 2001: Working Group II: Impacts, Adaptation and Vulnerability, (5.8.1.2. Carbon Sink), http://www.grida.no/climate/ipcc_tar/wg2/657.htm [06.22.2006]
[15] MacGowan F.: Overgrazing, cutting and trampling and their effects on the ecology of bogs. Irish Peatland Conservation Council 2002. http://www.ipcc.ie/currentaction2005-12.html [06.22.2006]
[16] Survey of Energie Resources, Peat. World Energie Council; 2001. http://www.worldenergy.org/wec-geis/publications/reports/ser/peat/peat.asp [06/22/2006]
[17] IPCC's Bogs and Fens Conservation Plan 2005, Global Warming. Irish Peatland Conservation Council; 2001. http://www.ipcc.ie/currentaction2005-10.html [06/22/2006]
154
“Sustainable Management and Development of Mountainous and Island Areas”
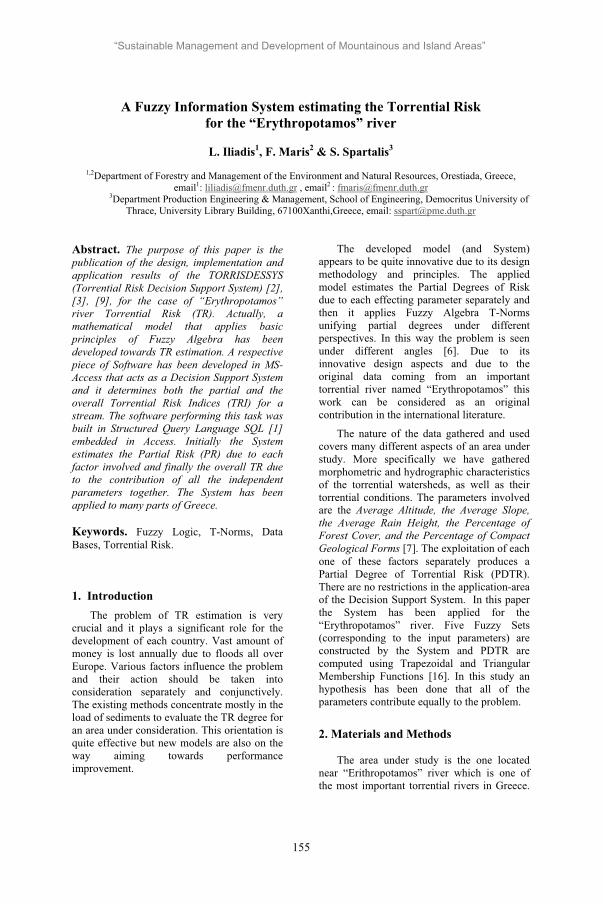
A Fuzzy Information System estimating the Torrential Risk for the “Erythropotamos” river
L. Iliadis1, F. Maris2 & S. Spartalis3
1,2Department of Forestry and Management of the Environment and Natural Resources, Orestiada, Greece, email1: [email protected] , email2 : [email protected]
3Department Production Engineering & Management, School of Engineering, Democritus University of Thrace, University Library Building, 67100Xanthi,Greece, email: [email protected]
Abstract. The purpose of this paper is the publication of the design, implementation and application results of the TORRISDESSYS (Torrential Risk Decision Support System) [2], [3], [9], for the case of “Erythropotamos” river Torrential Risk (TR). Actually, a mathematical model that applies basic principles of Fuzzy Algebra has been developed towards TR estimation. A respective piece of Software has been developed in MS-Access that acts as a Decision Support System and it determines both the partial and the overall Torrential Risk Indices (TRI) for a stream. The software performing this task was built in Structured Query Language SQL [1] embedded in Access. Initially the System estimates the Partial Risk (PR) due to each factor involved and finally the overall TR due to the contribution of all the independent parameters together. The System has been applied to many parts of Greece.
Keywords. Fuzzy Logic, T-Norms, Data Bases, Torrential Risk.
1. Introduction The problem of TR estimation is very
crucial and it plays a significant role for the development of each country. Vast amount of money is lost annually due to floods all over Europe. Various factors influence the problem and their action should be taken into consideration separately and conjunctively. The existing methods concentrate mostly in the load of sediments to evaluate the TR degree for an area under consideration. This orientation is quite effective but new models are also on the way aiming towards performance improvement.
The developed model (and System) appears to be quite innovative due to its design methodology and principles. The applied model estimates the Partial Degrees of Risk due to each effecting parameter separately and then it applies Fuzzy Algebra T-Norms unifying partial degrees under different perspectives. In this way the problem is seen under different angles [6]. Due to its innovative design aspects and due to the original data coming from an important torrential river named “Erythropotamos” this work can be considered as an original contribution in the international literature.
The nature of the data gathered and used covers many different aspects of an area under study. More specifically we have gathered morphometric and hydrographic characteristics of the torrential watersheds, as well as their torrential conditions. The parameters involved are the Average Altitude, the Average Slope, the Average Rain Height, the Percentage of Forest Cover, and the Percentage of Compact Geological Forms [7]. The exploitation of each one of these factors separately produces a Partial Degree of Torrential Risk (PDTR). There are no restrictions in the application-area of the Decision Support System. In this paper the System has been applied for the “Erythropotamos” river. Five Fuzzy Sets (corresponding to the input parameters) are constructed by the System and PDTR are computed using Trapezoidal and Triangular Membership Functions [16]. In this study an hypothesis has been done that all of the parameters contribute equally to the problem.
2. Materials and Methods
The area under study is the one located near “Erithropotamos” river which is one of the most important torrential rivers in Greece.
155
“Sustainable Management and Development of Mountainous and Island Areas”

It is responsible for many flood phenomena on an annual basis.
2.1. Description of the “Erithropotamos” river area The “Erithropotamos” river is located in the prefecture of “Evros” in North Eastern Greece.
Table 1: The most important streams of “Erithropotamos” river
Code Stream’s name Code Stream’s
name1 Lefki 6 Kounias 2 Anonymous 7 Diavolorema 3 Anonymous 8 Anonymous4 Bulgarian 9 Kazatzi 5 Anonymous 10 Krios
Table 2: Average monthly and annual rain height (Meteorological station Soufli)
Meteorological station Soufli
Period : 1973-1997
Altitude 15 m Geographic Latitude :41 12'
Geographic Longitude : 26 17'
January 57,7 July 23,5 February 63,5 August 19,6 March 58,0 September 24,4 April 54,2 October 63,2 May 41,3 November 105,3 June 42,6 December 99,6 Average annual
Rain-Height 652,9 mm
Picture 1: The area under study
2.2. Nature of gathered Data The first task towards data gathering was
the determination of the morphometric characteristics of the watersheds that appear to play an important role for the torrential risk estimation. We have looked up in well established bibliography as it is included in the book of “Mountainous Hydronomy” of professor Kotoulas [7], and Viessman [14]. According to Kotoulas [7], the most important morphometric characteristics of the watersheds that influence their torrential risk are the area, the perimeter, the shape of the watershed, the degree of the round shape of the watershed, the maximum altitude, the minimum altitude, the average altitude, the average slope of the watershed. We have visited the area of “Erytropotamos” river and we have gathered important data concerning morphometric characteristics. Of course beforehand we had specified the limits of the research areas. Maps of the Geographical Army Service (GAS) with a scale of 1:50.000 were used for this purpose. The upper and lower limits of the watershed areas are 300 2 km2 respectively [7].
Of course data concerning morphometriccharacteristics for every torrential stream were gathered. The morphometric characteristics were produced after the process of maps (scale 1:50.000) of the GAS and the accuracy of the data was confirmed by visits of our research teams in the research areas.
Finally we have gathered data concerning the average annual and monthly rain height from all the meteorological stations in the area.
The torrential rock formulations of the area were determined from the 1:50.000 scale maps based on the clustering of Professor Kotoulas [7].
2.3. The Algebraic model For each Fuzzy Set there exists a degree of
membership s( ) that is mapped on (0,1). Every element of the real world belongs to every Fuzzy Set with the specified s( ) [5]. As it is widely accepted Fuzzy Logic is a tool for embedding structured human knowledge into workable algorithms [6].
It has already been mentioned that this paper is a part of a wider research project that aims in early Torrential Risk evaluation of Mountainous Watersheds (TRMW).
156
“Sustainable Management and Development of Mountainous and Island Areas”
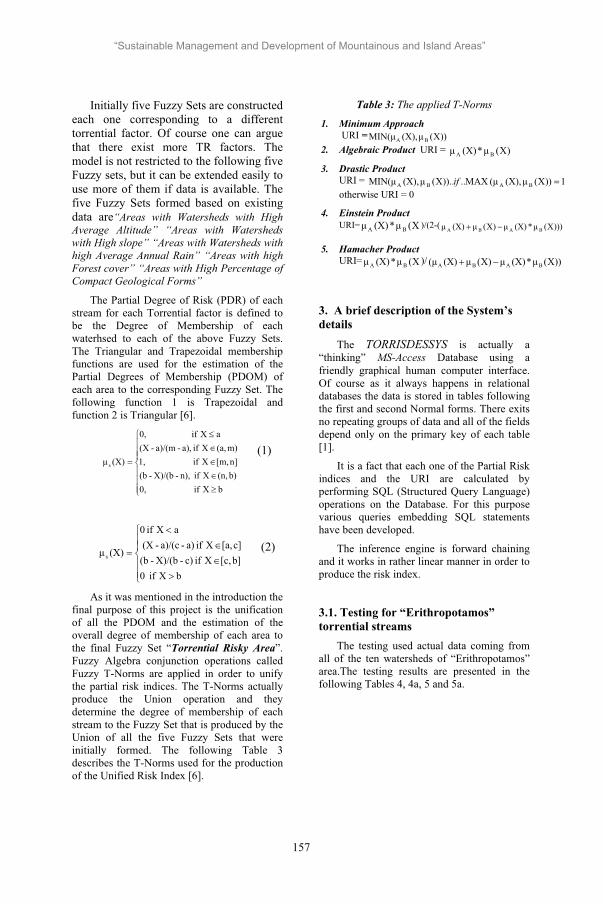
Initially five Fuzzy Sets are constructed each one corresponding to a different torrential factor. Of course one can argue that there exist more TR factors. The model is not restricted to the following five Fuzzy sets, but it can be extended easily to use more of them if data is available. The five Fuzzy Sets formed based on existing data are“Areas with Watersheds with High Average Altitude” “Areas with Watersheds with High slope” “Areas with Watersheds with high Average Annual Rain” “Areas with high Forest cover” “Areas with High Percentage of Compact Geological Forms”
The Partial Degree of Risk (PDR) of each stream for each Torrential factor is defined to be the Degree of Membership of each waterhsed to each of the above Fuzzy Sets. The Triangular and Trapezoidal membership functions are used for the estimation of the Partial Degrees of Membership (PDOM) of each area to the corresponding Fuzzy Set. The following function 1 is Trapezoidal and function 2 is Triangular [6].
bXif0,b)(n,Xifn),-X)/(b-(bn][m,Xif1,
m)(a,Xifa),-a)/(m-(XaXif0,
(X)s
(1)
bXif0b][c,Xifc)-X)/(b-(bc][a,Xifa)-a)/(c-(X
aXif0
( )s (2)
As it was mentioned in the introduction the final purpose of this project is the unification of all the PDOM and the estimation of the overall degree of membership of each area to the final Fuzzy Set “Torrential Risky Area”. Fuzzy Algebra conjunction operations called Fuzzy T-Norms are applied in order to unify the partial risk indices. The T-Norms actually produce the Union operation and they determine the degree of membership of each stream to the Fuzzy Set that is produced by the Union of all the five Fuzzy Sets that were initially formed. The following Table 3 describes the T-Norms used for the production of the Unified Risk Index [6].
Table 3: The applied T-Norms
3. A brief description of the System’s details
The TORRISDESSYS is actually a “thinking” MS-Access Database using a friendly graphical human computer interface. Of course as it always happens in relational databases the data is stored in tables following the first and second Normal forms. There exits no repeating groups of data and all of the fields depend only on the primary key of each table [1].
It is a fact that each one of the Partial Risk indices and the URI are calculated by performing SQL (Structured Query Language) operations on the Database. For this purpose various queries embedding SQL statements have been developed.
The inference engine is forward chaining and it works in rather linear manner in order to produce the risk index.
3.1. Testing for “Erithropotamos” torrential streams
The testing used actual data coming from all of the ten watersheds of “Erithropotamos” area.The testing results are presented in the following Tables 4, 4a, 5 and 5a.
1. Minimum Approach URI = ))(( ),MIN(
2. Algebraic Product URI = )(*( )
3. Drastic Product URI = 1))(( ),(MAX..))..(( ),MIN( ifotherwise URI = 0
4. Einstein Product URI= (*( ) )/(2-( )))(*( ))(( )
5. Hamacher Product URI= (*( ) )/ ))(*( ))(( )(
157
“Sustainable Management and Development of Mountainous and Island Areas”
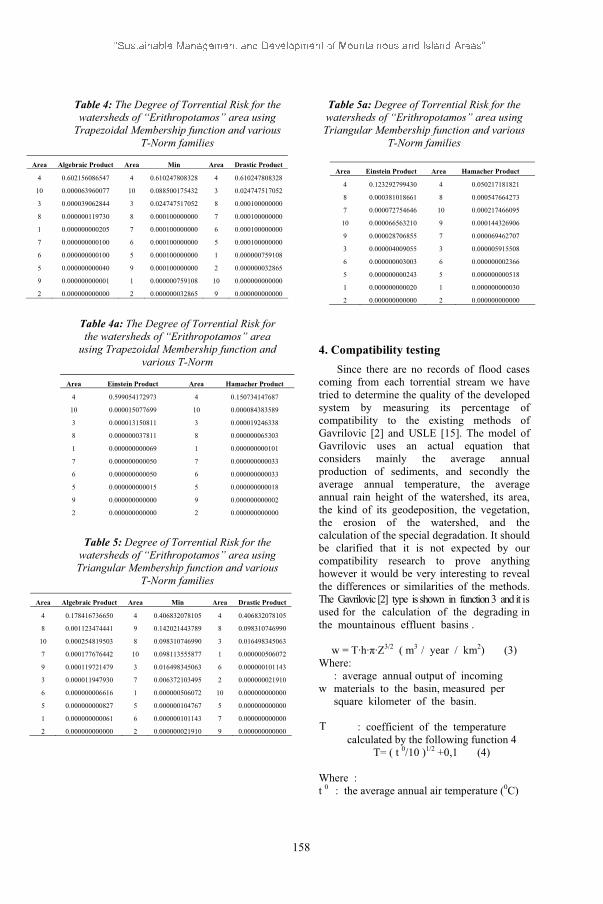
Table 4: The Degree of Torrential Risk for the watersheds of “Erithropotamos” area using
Trapezoidal Membership function and various T-Norm families
Area Algebraic Product Area Min Area Drastic Product
4 0.602156086547 4 0.610247808328 4 0.610247808328
10 0.000063960077 10 0.088500175432 3 0.024747517052
3 0.000039062844 3 0.024747517052 8 0.000100000000
8 0.000000119730 8 0.000100000000 7 0.000100000000
1 0.000000000205 7 0.000100000000 6 0.000100000000
7 0.000000000100 6 0.000100000000 5 0.000100000000
6 0.000000000100 5 0.000100000000 1 0.000000759108
5 0.000000000040 9 0.000100000000 2 0.000000032865
9 0.000000000001 1 0.000000759108 10 0.000000000000
2 0.000000000000 2 0.000000032865 9 0.000000000000
Table 4a: The Degree of Torrential Risk for the watersheds of “Erithropotamos” area
using Trapezoidal Membership function and various T-Norm
Area Einstein Product Area Hamacher Product
4 0.599054172973 4 0.150734147687
10 0.000015077699 10 0.000084383589
3 0.000013150811 3 0.000019246338
8 0.000000037811 8 0.000000065303
1 0.000000000069 1 0.000000000101
7 0.000000000050 7 0.000000000033
6 0.000000000050 6 0.000000000033
5 0.000000000015 5 0.000000000018
9 0.000000000000 9 0.000000000002
2 0.000000000000 2 0.000000000000
Table 5: Degree of Torrential Risk for the watersheds of “Erithropotamos” area using Triangular Membership function and various
T-Norm families
Area Algebraic Product Area Min Area Drastic Product
4 0.178416736650 4 0.406832078105 4 0.406832078105
8 0.001123474441 9 0.142021443789 8 0.098310746990
10 0.000254819503 8 0.098310746990 3 0.016498345063
7 0.000177676442 10 0.098113555877 1 0.000000506072
9 0.000119721479 3 0.016498345063 6 0.000000101143
3 0.000011947930 7 0.006372103495 2 0.000000021910
6 0.000000006616 1 0.000000506072 10 0.000000000000
5 0.000000000827 5 0.000000104767 5 0.000000000000
1 0.000000000061 6 0.000000101143 7 0.000000000000
2 0.000000000000 2 0.000000021910 9 0.000000000000
Table 5a: Degree of Torrential Risk for the watersheds of “Erithropotamos” area using Triangular Membership function and various
T-Norm families
4. Compatibility testing Since there are no records of flood cases
coming from each torrential stream we have tried to determine the quality of the developed system by measuring its percentage of compatibility to the existing methods of Gavrilovic [2] and USLE [15]. The model of Gavrilovic uses an actual equation that considers mainly the average annual production of sediments, and secondly the average annual temperature, the average annual rain height of the watershed, its area, the kind of its geodeposition, the vegetation, the erosion of the watershed, and the calculation of the special degradation. It should be clarified that it is not expected by our compatibility research to prove anything however it would be very interesting to reveal the differences or similarities of the methods. The Gavrilovic [2] type is shown in function 3 and it is used for the calculation of the degrading in the mountainous effluent basins .
w = T·h· ·Z3/2 ( m3 / year / km2) (3) Where:
w: average annual output of incoming materials to the basin, measured per square kilometer of the basin.
T : coefficient of the temperature calculated by the following function 4
T= ( t 0/10 )1/2 +0,1 (4)
Where : t 0 : the average annual air temperature (0C)
Area Einstein Product Area Hamacher Product
4 0.123292799430 4 0.050217181821
8 0.000381018661 8 0.000547664273
7 0.000072754646 10 0.000217466095
10 0.000066563210 9 0.000144326906
9 0.000028706855 7 0.000069462707
3 0.000004009055 3 0.000005915508
6 0.000000003003 6 0.000000002366
5 0.000000000243 5 0.000000000518
1 0.000000000020 1 0.000000000030
2 0.000000000000 2 0.000000000000
158

in the effluent basin. h : average annual rain height of the
basin (mm) in the Hmed of the basin. : 3,1415927
Z : the coefficient of erosion is calculated by the following function 5 :
= · · ( +J1/2 ) (5)
Where:
X: coefficient which gives the reduction of the resistance of the geological deposition during the erosion depending on the situation and the cultivation and based on vegetation. : coefficient of the erosion of the geological deposition, which based on the building rocks and the territorial formation of the basin.
: coefficient giving the type and the amount of erosion in the effluent basin.
J : average inclination of the surface of the effluent basin ( % ).
The average annual output of brought in materials into the basin ( m3 / year ) is estimated by the following function 6. W= w·Fn (6) Where:w : average annual production of incoming
materials to the basin per square kilometer of the basin ( m3 / year / km2 ).
Fn : area of effluent basin (km2).
The Universal Soil Loss Equation (USLE) model was developed by Wischmeier, Smith, and others. USLE was initially published in 1965 and it was revised in 1978. USLE is a major conservation planning tool which is used in the United States and other countries in the world [13]. The USLE estimates the average annual erosion by using a functional relationship of several factors.
A = R * K * LS * C * P (7)
It should be clarified that A is the computed spatial average soil loss and temporal average soil loss per unit of area. Usually, A is expressed in tons/acre/year (other units can also be used). R is the rainfall-runoff erosivity factor. K is the soil erodibility factor, i.e. the soil loss rate per erosion index unit for a specified soil as measured on a standard plot which is defined as a 72.6-ft (22.1 m) length of
uniform 9% slope in continuous clean-tilled fallow. L is the slope length factor. S is the slope steepness factor, i.e. the ratio of soil loss from the field slope gradient to soil loss from a 9% slope under otherwise identical conditions. C is the cover-management factor. i.e. the ratio of soil loss from an area with specified cover and management to soil loss from an identical area in tilled continuous fallow. Finally P is the support practice factor, i.e. the ratio of soil loss with a support practice such as contouring, stripcropping, or terracing to soil loss with straight-row farming up and down the slope. The terrain factor – “L” is the most difficult one to compute. The soil loss equation is much less sensitive to L factor than another terrain factor named (S factor) which can easily be computed from the digital elevation model (DEM). L factor and S factor are usually considered together to combine the effect of slope and slope-length, which basically reflects the terrain on a given site. For this project, an approach developed by Moore and Burch [10], [11], [12], is used to compute LS factor. They developed an equation to compute length-slope factor.
LS=(As/22.13)^m · (sin /0.0896)^n (8)
where:
m = 0.4 – 0.6 and n = 1.2 – 1.3. LS = computed LS factor. As = specific catchment area, i.e. the upslope contributing area per unit width of contour (or rill), in m‘ / m. It is calculated in Are/Info using the function called “flowaccumulation” multiply by the squared cell size and divided by the cell size. As = calculated flowaccumulation * 30 * 30 / 30 (for cell size = 30 m).
= slope angle in degrees. It is calculated in Arc/Info using the function called “slope” with option “percentrise” which is 100 times Tan
. Then is calculated using “Atan” function in Arc/Info. Tan = slope (in percentrise) / 100
= Atan (Tan )
A good level of compatibility has been revealed in some case by our small scale research. The following table 6 shows clearly
159
“Sustainable Management and Development of Mountainous and Island Areas”

the degree of compatibility between the TORRISDESSYS and the existing methodologies.
Table 6: Compatibility between the TORRISDESSYS and Gavrilovic and Usle
methods
Compatibility of TORRISDESSYS
to Gavrilovic
Compatibility of TORRISDESSYS
to USLE
T-NORM Method
A Triangular Membership Function
Algebraic Product
2/5 40 % 3/5 60 %
Minimum Product
2/5 40 % 3/5 60 %
Drastic Product
3/5 60 % 1/5 20 %
Einstein Product
2/5 40 % 3/5 60 %
Hamacher Product
2/5 40 % 3/5 60 %
A Trapezoidal Membership Function
Algebraic Product
2/5 40 % 2/5 40 %
Minimum Product
2/5 40 % 3/5 60 %
Drastic Product
2/5 40 % 3/5 60 %
Einstein Product
2/5 40 % 2/5 40 %
Hamacher Product
2/5 40 % 2/5 40 %
Obviously the Triangular Membership function is more consistent to the methodologies of Gavrilovic and USLE than the Trapezoidal one. More specifically the highest compatibility between TORRISDESSYS and Gavrilovic exists in the case of Drastic product T-Norms when the Triangular Membership function is used and it
is as high as 60%. This compatibility is quite good considering that TORRISDESSYS faces the Torrential Risk problem under different perspectives and it uses various factors, whereas the Gavrilovic method is rather monolithic approaches. The compatibility of TORRISDESSYS to the USLE model is also as high as 60% in the cases of Minimum, Hamacher and Einstein T-Norms when the Triangular Membership function is used. It is also 60% when the Trapezoidal MF is applied and the Minimum and Drastic product T-Norms are used. It is more than obvious that the best compatibility is achieved between the TORRISDESSYS and USLE.
5. Discussion The differentiation between the Torrential
Risk evaluation performed by TORRISDESSYS and the other existing methods is due to the multi level “thinking” of our System. There is no doubt that the System phases the problem of TR under different points of view due to the different nature of conjunction operations performed. Also it is a fact that the existing approaches appear to have significant levels of differentiation them selves. Due to all of the above the deviation (which can be considered as high) between TORRISDESSYS and Gavrilovic, USLE methods is something that was expected from the beginning.
Depending on the area and its characteristics this deviation can range from low to high. Another main reason for the deviation is the fact that we consider several factors equally and their overall contribution is measured. On the other hand the existing method focus mainly in the load of sediments. For example there may exist an area with a low volume of sediments due to its high percentage of forest cover. This area after a serious forest fire will become very risky. This will be detected by our system at once whereas the existing methods will need time to measure the increasing load of sediments and to change its risk evaluation. After all we are offering a new approach and it should have its own point of view.
Potential improvement of TORRISDESSYS would require more risk factors included in the system’s reasoning and
160
“Sustainable Management and Development of Mountainous and Island Areas”

more data records over time. The testing of the System will go on for several years and for other areas. Data has already been gathered for the selected areas under study. This new records of data will enable the System to evaluate the new up to date characteristics of the watersheds and to output the risky areas based on an overall approach, on partial risk factors and on extreme situations formulating a time series of results. Finally a future system’s evaluation approach would require the comparison of its output to the actually risky streams based on the number of actual floods caused by each of them.
It is really important to have an overall risk measure for such a serious problem. Of course as mentioned before this is a part of a wider research effort aiming in the TR determination of various selected parts of Greece. The System has also been tested so far for the areas of Greek Evros (Northern, Central and Southern Evros) Rodopi, Trixonida and Lisimaxia with remarkable results [3], [4] and lately for the “Panaitoliko” mountain.
References
[1] Date C.J. 1990. An Introduction to Database Systems. Addison-Wesley, New York.
[2] Gavrilovic Sl. 1972. Inzenjering o bujicnim tovoklima i eroziji. Beograd
[3] Iliadis L., Spartalis S., Maris F., Marinos D. 2004. A Decision Support System Unifying Trapezoidal Function Membership Values using T-Norms: The case of river Evros Torrential Risk Estimation. Proceedings of the 2004 ICNAAM, Greece. J. Wiley-VCH Verlag GmbH Publishing co. pp.173-177 Weinheim Germany
[4] Iliadis L., Maris F., Marinos D. 2004. A Decision Support System using Fuzzy relations for the estimation of long-term torrential risk of mountainous watersheds: The case of river Evros.
[5] Kandel A. 1992. Fuzzy Expert Systems. CRC Press. USA.
[6] Kecman 2001. Learning and Soft Computing. MIT Press. London England
[7] Kotoulas D. 1997. Management of Torrents I. Publications of the University of Thessaloniki.
[8] Leondes C.T. 1998, Fuzzy Logic and Expert Systems Applications. Academic Press. California USA
[9] Maris F., Iliadis L., Marinos D. 2004. Estimation of the torrential risk of Rodopi mountainous watersheds, by a Fuzzy Decision Support System: The case of Trapezoidal Membership function and Fuzzy conjunction Proceedings ISBN: 960-7475-29-1 7th
Greek Geographical Conference Aegean University Greece
[10] Moore, I.D and Burch, G. 1986. Physical Basis of the Length-Slope Factor in the Universal Soil Loss Equation. Soil Sci. Soc. Amer. J. 50: 1294-1298.
[11] Moore, I.D and Burch, G. 1986. Modeling erosion and deposition: topografic effects. Trans of ASAE 29(6): 1624-1630, 1640.
[12] Moore, I.D and Burch, G. 1992. Length-Slope Factors for the Revised Universal Soil Loss Equation: Simplified method of estimation. J. Soil and Water. Cons. 47, 423-428.
[13] Renard, K.G., Foster, G.R., Weesies G.A., McCool, D.K., and Yoder, D.C. 1997. Predicting soil erosion by water: A guide to conservation planning with the Revised Universal Soil Loss Equation (rusle). Agriculture Handbook. No. 703. U.S. Department of Agriculture.
[14] Viessman J.W., Levis G.L., Knappt J.W., 1989. Introduction to Hydrology. Harper and Raw, Publishers, New Vork, Cambridge, an Francisco, London.
[15] Wischmeier W. H. and Smith D.,1978. Predicting rainfall erosion losses - a guide to conversation planning. Agricultural Handbook No 537. US Department of Agriculture, Washington, DC.
[16] Zimmermann H.J., 1991. Fuzzy set theory and its applications, 2nd edition, Boston, Kluwer.
161
“Sustainable Management and Development of Mountainous and Island Areas”

The Effect of Eucalyptus-Rice Based Agroforestry System on the Prevalence of Major Rice Diseases
K.K.Islam1 and G.M.M.Rahman2
1Lecturer, Department of Agroforestry, Bangladesh Agricultural University, Mymensingh-2202. E-mail: [email protected].
2Professor, Department of Agroforestry, Bangladesh Agricultural University, Mymensingh-2202. E-mail: [email protected]
Abstract. The prevalence of major foliar diseases of transplant Aman rice (Variety BR11) grown in different orientations under eleven-year old Eucalyptus (Eucalyptus cameldulensis) tree was studied in the field laboratory of the Department of Agroforestry, Bangladesh Agricultural University, Mymensingh during July to December, 2004. Disease severity of Brown spot, Blast, BLB and Sheath blight of rice were recorded individually in North, South, East and West orientations under the canopy of Eucalyptus tree. Regarding the Brown spot and Blast diseases of the four orientations, South orientation received the highest light intensity and it produced the lowest disease severity for brown spot and blast diseases (25.19% & 20.42%) followed by East (26.33% & 21.39%) and West (26.21% & 21.40%) respectively, while north orientation showed the highest disease severity (28.07% & 22.48%) due to its poor light penetration. In case of BLB and Sheath blight, South orientation received the highest light intensity and showed the lowest diseases severity (33.35% & 17.24%) followed by West (34.66% & 18.34%) and East (35.02% & 18.42%) respectively. The highest BLB and Sheath blight severity was (36.06% & 19.44%) found in North orientation due to its lowest light penetration. On the other hand light intensity in the control plot (outside the Eucalyptus tree) was maximum (100%) and it caused minimum severity of diseases compared with other orientations. Therefore, the light intensity (due to orientation) had direct impact on the development of rice diseases. Increase of light intensity decreased disease severity of rice significantly.
Keywords. Eucalyptus-rice associations, Orientations, Rice diseases.
1. Introduction
Agroforestry, the integration of tree and crop in the same area of land is a promising production system for maximizing yield (10) and maintaining a friendly environment. The farmers get income from both agriculture and forest products in this system. In Bangladesh farming is mostly subsistence and crop based. Rice is the principal crop covering about 80% of the total cropped land of the country (2) while forest production is very meager. Since there is neither scope for expanding the forest area nor the sole grain crop areas, the country has to develop a combined production system integrating trees and grain crop which is a kind of Agroforestry. Cropland Agroforestry includes trees that are cultivated along with various annual crops like paddy, wheat, cereals and other cash crops in farmers’ lands. Regarding the total cropped area and production, rice ranks top position covering about 10.80 million ha of land from which 25.08 million tons of rice is produced per annum (2). Various trees are sparsely planted in rice fields in rows and / or aisles. Eucalyptus camaldulensiswhich is an exotic and very fast growing tree is one of them. Farmers can get early return from the tree which is an ideal firewood / fuel wood species / provider. Farmers, who have been practicing monocultures of rice for all these years, are now switching to a combined production system of tree and crop. Rice suffers from more than 60 different diseases. In Bangladesh, 43 diseases are known to occur on the rice crop (7). Practicing rice as monoculture resulted in the incidence of various types of disease that caused yield loss as well as degradation in the fertility and productivity of land.
162

In this context, if we apply theimplementation of the simultaneous cultivation of rice with suitable tree species, the overall production may be increased. Under such production system, it is necessary to determine the incidence of major rice diseases and their effects on yield. Hence, an attempt was made to study the effect of different orientations of the Eucalyptus tree on the incidence of major diseases of rice.
2. Study area and methods
The experiment was conducted at the Field Laboratory, Department of Agroforestry, Bangladesh Agricultural University, Mymensingh during July-December 2004. Geographically it is located at 24075 North Latitude and 90050 East Longitude at an elevation of 18 m above sea level. The area is under sub-tropical climate characterized by heavy rainfall from April to September and scanty rainfall from October to March.The experiment was carried out in Randomized Complete Block Design (RCBD) with three replications using the recommended rate of fertilizers for rice (4). The treatments were as follows:
O0= Open field (outside the Eucalyptus canopy) ON= North side from Eucalyptus base OS= South side from Eucalyptus base OE= East side from Eucalyptus base OW= West side from Eucalyptus base.
The tree species (Eucalyptus camaldulensis)were 11 years old and rice (BR11) was used as under story crop. The crown diameter of each tree was measured along north-south and east-west axis using a measuring tape. The selected plot area for each orientation was 3 m x 1 m, starting 40 cm away from the tree base. Thirty-day-old seedlings of BR11 were collected and two seedlings per hill were transplanted in the prepared field. Sampling was done from each Eucalyptus-rice association at North, South, East and West orientation and also for control plot (from outside the tree canopy area). Within the plot area 50 rice tillers were collected randomlyfor each orientation under the Eucalyptus tree and every tiller (leaf/sheath area) was observed individually to determine their respective grading. A similar procedure was followed for
the other replications and control plots. Light intensity was recorded using Quantum Sensorfrom the base of the tree at South, North, East and West orientation and in the control plot. The mean-season light intensity in each tree-rice association was calculated by averaging the light intensity reading of the sampling dates at the respective tree-rice association. The severity (Leaf/sheath diseased area) of blast, brown spot, bacterial leaf blight and sheath blight were recorded following the IRRI standard grading scale (Standard Evaluation System for Rice, 1988). Considering the disease severity of the above four diseases, the infection index (%) of all diseases was estimated following the method of Singh 1984:
Infection index (%)
Sum of all numerical disease rating = -----------------------------------------------×100 Total no. of ratings × maximum diseases grade
The collected data were individually analyzed for each disease following the appropriate design of the experiment. Duncan’s Multiple Range Test (DMRT) was done to show the significant differences among the treatment mean.
3. Results and Discussion
3.1. Effect of different orientations on the infection index of Brown spot
Among the four orientations the highest Brown spot severity was 28.07, observed in North orientation (ON), (Table 1). Next to North orientation (ON) the disease severity grade was higher in West orientation (OW) estimated as26.33 which was statistically similar to the East orientation (OE) estimated as 26.21. The lowest result was found in South orientation (OS) and itwas 25.19. The result also revealed that where the Eucalyptus tree was absent (open field) the disease severity grade was 19.76 the lowest compared with all other orientations. On the other hand, in absence of the Eucalyptus tree, light penetration was 100% in open field; thus, disease severity was minimum compared with all other orientations. Longer duration of darkness increased conidia germination of brown spot
163
“Sustainable Management and Development of Mountainous and Island Areas”

diseases (12). The above result revealed thatlight has direct relationship with the disease development of rice.
3.2. Effect of different orientations on the infection index of Blast
The highest disease severity (infection index) was found in the ON (22.48) form the base of Eucalyptus tree (Table 1). The lowest result was observed in the OS (20.42). In the case of open field (O0) the result showed that in absence of the Eucalyptus tree the disease severity was 17.95and it was minimum compared with all other orientations. Thus, it is observed that decrease of light penetration increases the disease severity grade of rice under the different orientations in Eucalyptus tree. In Bangladesh conditions, shade effect was severe in North-East orientation and so it produced highest disease incidence, while South orientation received the maximum light penetration and produced the lowest disease severity of rice.
3.3. Effect of different orientations on the infection index of Bacterial Leaf Blight”
The highest disease severity index was 36.06 and it was found in ON, which was statistically identical to the OW (35.02) (Table 1). After North orientation the higher BLB severity occurred in the OE (34.66), and the lowest result was found in OS (33.35). The absence of Eucalyptus tree control (O0) produced the lowest BLB severity compared with that of all other orientations. The rice plants grown under different orientations of the Eucalyptus tree developed BLB disease in relation to light availability. Similarly, researchers (3) observed that light decreased the disease intensity of bacterial leaf blight.
3.4. Effect of different orientations on the infection index of Sheath blight
The severity grade of sheath blight disease was the highest in ON (19.44) (Table 1). Next to ON higher severity of Sheath blight disease occurred in OW (18.42). The lowest result was found in OS (17.24) which was statistically similar to East and West orientations. In case of control the disease severity grade (14.70) was minimum compared with all other orientations.
Table 1. Effect of different orientations on the incidence of Brown spot, Blast, BLB and Sheath blight disease of rice under Eucalyptus camaldulensis trees.
Orientations (O)
Infection Index/ Diseases Severity (%)
Brown spot
Blast BLB Sheath blight
Control (OO) 19.76d 17.95d 29.15d 14.70d
North (ON) 28.07a 22.48a 36.06a 19.44a
South (OS) 25.19c 20.42c 33.35c 17.24b
East (OE) 26.21b 21.40b 34.66b 18.34ab
West (OW) 26.33b 21.39b 35.02a 18.42ab
Means followed by same letter (s) are not significantly different at 5% level by DMRT.
Development of higher disease incidence in the rice plants grown under North-East orientations of Eucalyptus tree was higher due to poor penetration of light. Although there was no relevant report on tree rice Agroforestry system, influence of light on disease development in mono-cropping system showed that light intensity is directly correlated with rice disease development.
Light evidently inhibits the development of Piricularia oryzae (1). Exposure of plants to sunlight after inoculation with sclerotia reduced infection; if sunlight extended to 12 hours, no infection was observed (5). It was also observed that low infection following exposure to sunlight was directly related to the influence of sunlight on the fungus (6). Rice seedlings were more extensively infected by Helminthoportium oryzae in the absence rather than in the presence of light (11). On the other hand rice plants growing under low light intensity enhanced the susceptibility of Xanthanous oryzae (13). While light intensity had direct impact on the development of rice diseases increase of light intensity significantly decreased rice disease severity (12).
Shading resulted good disease incidence (9, 14) and also found that the lesions of brown spot reached maximum in darkness, but at later stage, lesion enlargement in medium shade (8). Therefore, light intensity has direct impact on the development of rice diseases. Increased light intensity significantly decreased severity of rice diseases. Orientation of the Eucalyptus tree having better light penetration is suggested for lower diseases incidence in Eucalyptus-rice
164
“Sustainable Management and Development of Mountainous and Island Areas”

based Agroforestry system. Finally for successful cultivation of rice under Eucalyptus tree, orientation and the selection of canopy size are very important, while tree of dense canopy required heavy pruning especially in North- East orientations.
6. References
[1] Abe T. Effect of sunlight on the infection of the rice plant by Piricularia oryzae. Forschan Geb. Pflkrankh., Kyoto, Japan. 1931; 1: 46-53. (Rev. Appl. Mycol. 13:264).
[2] BBS (Bangladesh Bureau of Static). Monthly Statistical Bulletin, November. Ministry of Planning Government of the peoples Republic of Bangladesh. Dhaka; 2002. p. 45-50.
[3] Bhagawati R, Bhagabati KN. Interaction of light intensity and bacterial leaf blight of rice. Journal of the Asian Science Society. 1993; 35(4): 289-293.
[4] BRRI. Modern rice cultivation (Bengali Bulletin), Bangladesh Rice Research Institute. Gazipur; 1999. p.26.
[5] Endo S. On the influence of hydrogen-ion concentration on the mycelial growth of the causal fungi of selerotial diseases of the rice plant. Bull. Miyazaki coll. Agric. For., 1935a; 8:11.
[6] Endo S. Effect of sunlight on the infection of the rice plant by Hypochnus sasakii shirai. Bull. Miyazaki Coll. Agric. For., 1935b; p. 75-78 (Rev. Appl. Mycol. 15:48).
[7] Fakir G A. An annotated list of seed-born diseases in Bangladesh. Seed pathology centre, department of plant pathology, Bangladesh Agricultural University, Mymensingh; 2001.
[8] Imura J. On the effect of sunlight upon the enlargement of lesions of rice blast fungus. Ann. Phytophat. Soc. Japan; 1938. p. 23-33.
[9] Imura J. On the influence of sunlight upon the incubation period and the development of the blast diseases and the Helminthosporium diseases of rice plant. Ann. Phytopath. Soc. Japan; 1940. p. 16-26.
[10] Nair PKR. An Introduction to Agroforestry. Kluwer Academic Publishers, ICRAF; 1990.
[11] Naito N. On the effect of sunlight upon the development of the Healminthosporium disease of rice. Ann. Phytophat. Soc. Japan; 1973. 7:1-13.
[12] Rahman A. Prevalence of major rice diseases in tree-rice Agroforestry system, M.S. Thesis, Department of Agroforestry Bangladesh Agricultural University, Mymensingh; 2004.
[13] Reddy PR, Nayak P, Sridhar R. Physiology of bacterial leaf blight of rice: Influence of light intensity on some biochemical changes associated with the diseases development. Indian Phytopathology. 1977; 30(1): 51-54.
[14] Suzuki Y, Yoshimura S. Effect of light on sproulation of the rice blast fungus. Ann. Phytopathol. Soc. Japan. 1963; 28:62-63.
165
“Sustainable Management and Development of Mountainous and Island Areas”

Feedforward Neural Network Modeling of Fir Taper in Natural Forests of Greece
Spiros Kaloudis, Thomas Glezakos, Konstantinos P. Ferentinos, Theodore A. Tsiligiridis, Constantinos P. Yialouris
Informatics Laboratory, Agricultural University of Athens, Iera Odos 75, 11855, Athens, Greece.
[email protected], [email protected], [email protected], {tsili, yialouris}@aua.gr
Abstract. In this paper, a model of the taper of fir natural forests in three specific areas of Greece is developed. The modeling approach was that of feedforward neural networks, trained by the backpropagation training algorithm. Several one- and two-hidden-layer topologies were inves-tigated and three final networks were trained and tested on real measured data. The obtained taper values were accurate enough so that neural net-works could be considered as a useful alternative to the not so precise multivariable linear regres-sion methodology used so far.
Keywords. Fir, neural networks, taper.
1. Introduction
Forests management planning is a compli-cated task due to the high number of environ-mental and forest variables that participate in forest evolution, the long scheduling time and the contradictory human demands. Due to the com-plexity of forest management planning, forests managers need to have some insight information about all the factors that affect forest production. Factors with crucial role are the potential forest productivity and the usability of the produced timber for various uses.
The productivity of a forested area depends on several environmental factors, such as climate and topography, and tree species. This is ex-pressed by the high of dominant trees at a refer-ence age [6]. Other indices for site quality also apply, such us climatic characteristics and soil properties, but they are not considered credible for general use [16]. The usability of a tree log for special uses such as poles, depends on its shape. The shape of tree stem can be described by the change of its diameter over the length unit
of the stem, which is called taper. The diameter of trees is affected by stand density; subse-quently taper is also affected by stand density [3]. This is the reason why taper is considered of limited applicability as site quality index. How-ever, due to the impact of stand density, taper can be manipulated by applying convenient sil-vicultural treatments to the stand. Thus, the im-provement of timber usability can be achieved for each forest location, in respect both to envi-ronmental limitations and silvicultural treat-ments.
The purpose of this paper is to demonstrate a methodology that could be able to estimate the taper of a tree species (fir in our case), based on selected environmental factors and stand density. Two parameters were used as a metric of stand density: the crown closure and the basal area of the trees with diameter larger than 14cm. Rele-vant studies have been made for the prediction of the Site Quality Index or taper by environmental factors [5], [6], [8], [12], [21], [22]. Most of the undertaken studies use the multivariable linear regression as the basic correlation mechanism. Due to the fact that certain environmental vari-ables like altitude have no linear effect on forest species, linear regression is not considered as the best method in this case. In addition, non-linear regression models are difficult to apply. In this work, feedforward neural networks were used to model the taper.
Neural networks (NNs) have been used to model a variety of biological and environmental processes (e.g., [1], [9]-[12], [20]), but not in the specific area of taper modeling. Due to their ca-pability to model highly non-linear processes, purely based on measured data, feedforward NNs were considered a proper alternative to the not so successful multivariable linear regression.
166
“Sustainable Management and Development of Mountainous and Island Areas”

2. Materials and methods
The samples were collected from three differ-ent areas of the mainland of Greece, namely (from south to north) Parnitha, Karpenisi and Pertouli. These three areas are mountainous with varying topography. The first study area (Par-nitha), according to Scaltsoyiannes et al. [19] and Mitsopoulos and Panetsos [19], is covered by firforest (Abies Cephalonica). The forest was de-clared as a national park and consists of very old trees due to the reduction of cuttings. It suffers from severe attacks by parasite Viscum album[14]. The climate is hot-Mediterranean and the summer is hot with an annual number of biologi-cally dry days between 40 and 75. The majority of rocks are limestone and flysch. The soil in most cases is shallow and only in a few places with low inclination and reach vegetation it is deep.
The second study area (Karpenisi) consists of a hybrid fir species (Abies borissi-regis) pro-duced by fertilization between Abies alba and Abies Cephalonica [15], [19]. The forest is in good condition and is managed by the local for-est service. The climate is wet and cold, the aver-age annual rainfall is 1380mm and in the winter there is high snow accumulation. The dry season is short and appears annually from July to Sep-tember. The most common types of rocks are flysch, psammite and limestone. The soil is of medium depth and also contains medium quanti-ties of organic matter.
The forest in the third study area (Pertouli) consists of Abies borissi-regis and is one of the few forests that belong to the School of Forestry, University of Thessalonica. The forest is in good condition and managed regularly.
2.1. Taper
Taper is defined as the amount of tree diame-ter change over the unit length of tree stem [13]. It expresses the tree stem completeness and thus provides an index for the stem usability to some special uses, such as poles. Taper is not constant across the whole length of the tree stem. Two types of taper can be distinguished: i. The absolute taper, which is the difference
between two diameters with a distance of one meter, and
ii. The relevant taper, which is the difference between breast height diameter (considered having a value equal to 100) and other diame-
ters, which are measured in various distances from breast height and expressed as a per-centage of the breast height diameter. There are various ways to calculate taper [2],
[13], [17]. In this study, taper is calculated by:
1.30
1.30h
dT
(1)
where, T is taper, d1.30 is the diameter at breast height (in cm) and h is the total tree height (in m).
In order to investigate the effect of taper cal-culation to the accuracy of the prediction, taper was calculated by two sets of trees. Specifically, it was calculated over either the entire number of measured trees of each data set, or over the five dominant trees.
2.3. Sampling methodology
Seventy eight sampling surfaces were col-lected in total (29 from Parnitha, 21 from Karpenisi and 28 from Pertouli). Each surface forms a square with a side of 15 meters (225m2
area). The two sides were positioned in parallel to the contours and the other two vertically. In each sampling surface, only trees with a breast height diameter equal to or greater than 14cm were considered. For each tree the diameter at breast height and the total tree height were meas-ured. The following factors were also measured: Altitude with GPS, aspect with a compass, slope with a clinometer, position on the incline in qualitative terms, incline shape in qualitative terms, soil depth in qualitative terms taken from maps and field observations, surface rock content measured as coverage percentage and taken from field observations, soil acidity (pH) measured by pH-meter, crown closure measured as coverage percentage, taken from field observations.
3. Feedforward Neural Network modeling
Given the fact that the traditional statistic methods are not well adapted to the problem, it was decided that the design and use of an appro-priate NN with good generalization capabilities, could facilitate towards a solid solution. The program that was used for the design and imple-mentation of the various networks was Brain-Maker [4]. The feedforward type of NNs was used (multi-layer perceptron) while the back-
167
“Sustainable Management and Development of Mountainous and Island Areas”
propagation training algorithm [18] was used as the training methodology.
3.1. Initial data manipulation
The initially accumulated data, which con-tained 78 samples, were assembled out of the three study areas. All measured variables de-scribed in Section 2.3 comprised the NN inputs, while taper was the single NN output (Table 1). These variables were selected in regards to their relevance towards the value of taper, as well as their availability and ease of measurement.
Table 1. The 12 measured environmental variables that formed the NN inputs
Variable Type of NN input
Min Max Number of NN inputs
Altitude Number (meters)
750 1391 1
Aspect Number (grads)
0 395 1
Slope Number (degrees)
0 39 1
Soil acidity (pH)
Number 4.2 7.3 1
Surface rock content
Number (percent)
2 90 1
Basal area Number (m2)
0.279 2.576 1
Crown clo-sure
Number (percent)
10 90 2
Position on the incline
Qualitative (Binary)
0 1 3
Incline shape Qualitative (Binary)
0 1 3
Soil depth Qualitative (Binary)
0 1 3
Location Qualitative (Binary)
0 1 3
Tree species Qualitative (Binary)
0 1 2
Total number of NN inputs: 22
They can be organized into two categories: structural data, such as altitude or soil depth, which express constant variables for each loca-tion, and variable data, such as basal area or crown closure, which express properties at the level of the tree.
The initial data set was characterized by cer-tain problems towards its usage as input to the NN. Firstly, the volume of the data set is consid-ered to be minimal for the training and testing of a NN. In addition to that, there were 21 missing values for the crown closure variable, which were manipulated according to the procedures proposed in [4].
Finally, there was the need to analyze the available data in order to uncover possible stand-alone predictors of the taper variable. Each col-umn of data was compared with the taper column in regards to correlation and Table 2 was pro-duced.
The strength of correlation reveals the inten-sity of the connection between two variables, as well as its direction. The results clearly show a strong correlation of positive strength between the requested outputs taper and slope as well as soil acidity (pH). The rest of the correlation val-ues are not that strong and probably indicate that it should take the combination of such inputs to render a recognizable effect as a strong predictor for taper. The role of the NN to be designed is to uncover such relationships and take control of them so as to produce a system with good gener-alization capabilities.
Table 2. Strength of input/output data correlations
Variable Strength Altitude – Taper 0.35 Slope – Taper 0.47 Soil acidity (pH) – Taper 0.41 Surface rock content – Taper 0.27 Basal area – Taper 0.30
The next step in data manipulation was to ex-amine the distribution of data for each variable and eliminate the potential problem arisen by outlier values. Such values may turn the net-work’s attention to certain isolated cases which, although they may exist, they are not so common in the data set. If these extreme values were to bear the same importance as the more common values, the network would have more trouble in distinguishing between them and the more com-mon ones and setting them aside. For example, the data distribution histogram for the variable basal area (Fig. 1a) clearly shows that there is an extreme lonely case at the far right which should be eliminated before the variable would be fed into the NN.
(a)
168
“Sustainable Management and Development of Mountainous and Island Areas”

(b)
Figure 1. Distribution histogram of basal area variable in the training data set, (a) initially and (b) after appropriate data manipulation
In order to improve the performance of the network by giving to the NN the inherent ability to look more closely at the most typical values, the maximum range should be altered for this variable, resulting in a more normally spread out distribution histogram (Fig. 1b). This does not mean that the extreme values are swept away from the network’s consideration, but rather that the system will give more attention looking closer at the typical range, without of course ignoring the outliers.
Finally, shuffling of the available data sam-ples was performed in order to minimize the bias of the system to be produced. The initial data set was comprised of records grouped by the loca-tion of the study areas.
3.2. Data sets formulation and NN design and training
The need to overcome the scarcity of data led to the decision to develop a large number of net-works and evaluate them initially by their scores towards a small number of samples which the networks had not “seen” before. The networks which best performed during this procedure would furthermore undergo training using cross-validation.
The initial randomized and manipulated data set of the 78 samples was split into two parts. The first segment of data, comprising of 73 sam-ples, was considered as the training set and would be further split into two sections in a ratio of 9:1, forming the training and cross-validation data sets for the NNs respectively. The second segment of the initial data set, including only 5 samples, formed the testing set to be used for the evaluation of the performance of the trained net-works.
3.2.1. Design of NN topologies
In order to select the best performing network topology, the common trial-and-error approach was used, evaluating the performance of each NN topology in regards to RMS and average errors and the achieved R-squared. The networks were trained with training tolerance and cross-validation tolerance equal to 0.1, a constant learning rate of 1 and a basic smooth factor equal to 0.9. Several feedforward NN topologies rang-ing from one hidden layer (1-HL) containing only 5 neurons to two hidden layers (2-HL) with 5 and 22 hidden neurons respectively were trained and investigated. The most effective net-work according to both average and RMS errors, but also one with the best R-squared, had two hidden layers with 7 and 11 hidden nodes respec-tively. Table 3 shows the 5 best performing NN topologies sorted by their RMS error values.
The criterion for the number of hidden layers and neurons for the next network which partici-pated in our research, took under consideration the number of inputs and patterns of our initial data set, as well as the number of data samples contained in the initial training set. This network had only one hidden layer with 9 hidden nodes, a value given by the following equation [4]:
92
)*1.0(2
)( NoTSOutputsInputs
HN(2
)
Where, HN = Hidden Neurons, NoTS = Number of Training Samples.
Lastly, the third NN contained again only one hidden layer with 19 neurons, which was the output of another trial-an-error procedure, based on the raw available data, before any special data manipulation.
3.2.2. NN training and cross-validation
Initially, we tried to fully train the networks without cross-validation, that is, by using the entire training set of 73 samples. However, after convergence, their evaluation was lower than expected, with success ranging from 62.5% to 67.5%. This was a clear indication that the train-ing set was rather small, thus cross-validation was used for early stopping of the training proc-ess so that overfitting was avoided.
169
“Sustainable Management and Development of Mountainous and Island Areas”

Three pairs of networks were trained with two randomly generated training and cross-validation sets from the initial set of available data. The entire NN design and training process was re-peated five times with different randomly gener-ated training/testing sets combinations, in order to better prove the value of the results.
Table 3. Best performing NN topologies sorted by their RMS error values.
Rank-ing
1-HL
2-HL
Trainingiterations
Avgerror
RMS error
R2
Taper 1 7 11 285 0.0183 0.0240 0.95402 36 7 672 0.0235 0.0336 0.93223 22 8 145 0.0260 0.0317 0.92244 33 10 97 0.0281 0.0358 0.95815 38 6 346 0.0289 0.0331 0.9439
4. Testing results
In this section, the results of the application of the three final NN topologies to the four testing data sets are presented. These three network to-pologies were trained each time with two differ-ent randomly generated training sets. Training was performed with and without cross-validation for early stopping. Thus, in total, 12 different configurations were produced, as described in Table 4.
As described in Section 2.2, taper values were calculated over either the entire number of meas-ured trees of each data set, or over the five domi-nant trees. These two approaches are denoted as Taper-All and Taper-5, respectively. Figures 2–4 summarize the average performance of all 12
configurations over the five randomly generated testing sets.
Table 4. The various network configura-tions considered for testing. Configura-tions ending with “1” used cross-validation during training for early stop-ping, while those ending with “0” did not.
Configurations NN topology Training data set no.
CONF10, CONF11 1-HL, 9 nodes 1 CONF20, CONF21 1-HL, 9 nodes 2 CONF30, CONF31 1-HL, 19 nodes 1 CONF40, CONF41 1-HL, 19 nodes 2 CONF50, CONF51 2-HL, 7 – 11 nodes 1 CONF60, CONF61 2-HL, 7 – 11 nodes 2
Generally, RMS of Taper-5 has less variation among the various configurations, compared to Taper-All. Its best performance is achieved with configuration 11 (CONF11), with RMS value of 0.369 (cm/m) (Fig. 2). Taper-All has the best performance with configuration 51 (CONF51), with RMS value of 0.350 (cm/m) (Fig. 2).
The observed and predicted values of Taper-5 with CONF51, averaged over the five testing sets, are given in Fig 3. The correlation coeffi-cient (R) between the observed and predicted values is 0.559, while the corresponding value for Taper-All is 0.701. In Fig. 4, the observed and predicted values of Taper-All with configu-ration CONF51 are shown, again averaged over the five testing sets. Among all examined cases, the predicted values of Taper-All using the con-figuration CONF51 achieved the best fit to the observed values.
170
“Sustainable Management and Development of Mountainous and Island Areas”

Figure 2. Average RMS of observed and predicted values of Taper-5 and Taper-All, for the five tested data sets, with the various configurations of NN.
Figure 3. Observed and predicted values of Taper-5, averaged over the five testing sets, based on NN configuration 11 (CONF11), and the corresponding errors.
Figure 4. Observed and predicted values of Taper-All, averaged over the five testing sets, based on NN configuration 51 (CONF51), and the corresponding errors.
5. Conclusions
In this work, a model of the taper of fir natu-ral forests in three specific areas of Greece was developed. Taper values for training and testing purposes were calculated over either the entire number of measured trees of each data set, or over the five dominant trees. After some data manipulation and preliminary training explora-tions over the best possible network topology, 12 network topology/training approach configura-tions were considered for the final testing of the developed modeling methodology. Among all these configurations, a 2-hidden-layer NN with 7 and 11 nodes in the first and second hidden layer respectively, trained using cross-validation for
early training stopping to avoid overfitting, achieved the best performance.
Linear models of taper use a large number of variables and thus loose their efficacy or they obtain low accuracy. In addition, any appropriate non-linear models are very hard to manipulate. Therefore, the accuracy achieved by the pro-posed neural network approach, make it a useful modeling alternative.
Future work includes the introduction of dif-ferent environmental variables and the considera-tion of a larger amount of measured data samples for further improvement of the developed neural network model.
171
“Sustainable Management and Development of Mountainous and Island Areas”
6. References
[1] Altendorf, C.T., Elliott, R.L., Stevens, E.W., Stone, M.L. Development and Validation of a Neural Network Model for Soil Water Content Prediction with Comparison to Re-gression Techniques. Trans. ASAE 1999; 42: 691-699
[2] Anuchin, N. Forest Mensuration. 2nd Edition. Israel Program for Scientific Translations. Jerusalem 1970.
[3] Assmman, E. Waldertragskunde. 1961. [4] BrainMaker Professional, Neural Network
Simulation Software. User’s Guide and Ref-erence Manual, Part1 & Part2.
[5] Corona, P., Scotti, R., Tarchiani, N. Rela-tionship Between Environmental Factors and Site Index in Douglas – Fir Plantations in Central Italy. Forest Ecology and Manage-ment 1998; 110: 195-207
[6] Curt, ., Bouchaud, ., Agrech, G. Predict-ing Site Index of Douglas – Fir Plantations from Ecological Variables in the Massif Cen-tral Area of France. Forest Ecology and Management 2001; 149: 61-74.
[7] Davis, L.S., Johnson, K.N. Forest Manage-ment. McGraw-Hill; 1987.
[8] Economou, A. Site Quality Evaluation of Planted and Naturally Regenerated Black Pine (Pinus nigra, (Arn) var. pallasiana(Lamb) in Arcadia and Central Pindos Range, Greece. PhD dissertation; 1987.
[9] Ferentinos, K.P., Albright, L.D. Predictive Neural Network Modeling of pH and Elec-trical Conductivity in Deep-Trough Hydro-ponics. Trans. ASAE 2002; 45: 2007-2015
[10] Ferentinos, K.P.: Biological Engineering Applications of Feedforward Neural Net-works Designed and Parameterized by Ge-netic Algorithms. Neural Networks 2005; 18: 934-950
[11] Hong, F., Tan, J., McCall, D.G. Application of Neural Network and Time Series Tech-niques in Wool Growth Modeling. Trans. ASAE 2000; 43: 139-144
[12] Kaloudis, S., Touratzi, T., Didaskalou, K., Galanopoulou, S., Kerkides, P. Taper Corre-lation with Environmental Factors and Stand Density in Fir Forest of Parnitha. In: Pro-ceedings of 1st pan-Hellenic environmental congress “Modern Environmental Matters” (in Greek). Orestiada 2004; p. 60-68.
[13] Matis, . Forest Biometrics , vol. , (in Greek). Thessaloniki: 1994.
[14] Ministry of Agriculture of Greece, General Secretariat of Forests and Natural Environ-ment. Natural Forest of Parnitha, Research on structure and evolution of fir forest. (in Greek) Athens, Greece: 1996.
[15] Mitsopoulos, D., Panetsos, C. Origin of Variation in Fir Forests of Greece. Silvae Genetica 1984; 36: 1-15
[16] Papamihos, N. Lecture Notes in Forest Ed-aphology (in Greek). Thessaloniki: 1979.
[17] Prodan, M. Sauerlander’s Verlag. Frankfurt: (1965)
[18] Rumelhart, D.E., Hinton, G.E., Williams, R.J. Learning Representations by Back-Propagating Errors. Nature 1986; 323: 533-536
[19] Scaltsoyiannes, A., Tsaktsira, M., Drouzas, D. Allozyme Differentation in the Mediter-ranean Firs (Abies, Pinaceae): A First Com-parative Study With Phylogenetic Implica-tions. Plant Systematics and Evolution 1998; 216: 289-307
[20] Seginer, I., Boulard, T., Bailey, B.J. Neural Network Models of the Greenhouse Climate. J. of Agr. Eng. Res. 1994; 59: 203-216
[21] Tyler, A.L., Macmillan, D.C., Dutch, J. Pre-dicting the Yield of Douglas Fir from Site Factors on Better Quality Sites in Scotland. Ann. Sci. For. 1995; 53: 619-634.
[22] Wang, G.G. Is Height of Dominant Trees at a Reference Diameter an Adequate Measure of Site Quality?. Forest Ecology and Man-agement 1998; 112: 49-54
172
“Sustainable Management and Development of Mountainous and Island Areas”
Greenway Planning: Historic, Sociocultural, and Economic Issues. Prospects for a new land use strategy in Greece.
Alexander Kantartzis TEI Epirus, PO box 110,47100 Arta
[email protected] Varras
TEI Epirus, PO box 110,47100 Arta [email protected] Koukladas
TEI Epirus, PO box 110,47100 Arta [email protected] Kakouri
TEI Epirus, PO box 110,47100 Arta [email protected]
Maria Koutsikou TEI Epirus, PO box 110,47100 Arta
[email protected] Papadopoulou
Aristotelian University of Thessaloniki [email protected]
Abstract A Greenway is a corridor of protected open space that is usually managed for conservation and/or recreation. The common characteristic of greenways is that they follow natural land or water features, like ridges or rivers, or human landscape features like abandoned railroad corridors or canals. They link natural reserves, parks, cultural and historic sites with each other and, in some cases, with populated areas. Greenways not only protect environmentally sensitive lands and wildlife, but also can provide people with access to outdoor recreation and enjoyment close to home.
Within the landscape, greenways serve at least three major functions: a) they protect and/or enhance remaining natural, cultural and historical resources, b) they provide linear open space for compatible human use, and c) they maintain connectivity between conservation lands, communities, parks and other recreational facilities, cultural and historic sites.
Today Greece is hesitatingly exploring greenway planning and it is this paper’s thesis that the tremendous power found in this new land use strategy is worth implementing at national, regional and local (scale wise), as well as physical and administrative (nature wise) levels.
Keywords. Economic planning, greenways, sociocultural planning.
1. Introduction
The establishment of ecological networks in Europe and greenways in America has required some of the most advanced applications of the principles of landscape ecology to land use planning. Over the past two decades developments in this emerging field have arised combining the theoretical concepts of landscape ecology with the actual practice of landscape planning and management [6]. In addition to biological and physical considerations important to biodiversity protection and restoration, equal weight is given to historic, sociocultural and economic issues to illustrate how sympathetic, sustainable land use policies can be implemented.
Today Greece is hesitatingly exploring greenway planning and it is this paper’s thesis that the tremendous power found in this new land use strategy is worth implementing at national, regional and local (scale wise), as well as physical and administrative (nature wise) levels.
173
“Sustainable Management and Development of Mountainous and Island Areas”

2. Terms
Greenways are innovative and effective land use methods to preserve land and restore regional ecosystems. They are formed along waterfront lands, ridgelines, as hedgerows dividing farmlands, as greenbelts around cities, restored railways, and many other areas. "A greenway is a corridor of protected open space that is usually managed for conservation and/or recreation. The unique and quite innovative feature of greenways is that they are linear spaces, not just blocks of land set aside as landscaped parks or untouched wilderness areas that lead to fragmented habitats, isolation and extinction. Their linear design is measured in terms of connectivity as well as in the size of their space. Connectivity is one method of measuring the success of conservation and ecological restoration processes. Greenways are transport corridors, developed along independent routes following past or disused communication pathways and tracks that are available for non-motorised soft traffic. They provide a series of common characteristics such as:
o Ease of passage: slopes, either low or zero gradient, allow use by all types of users, including mobility impaired people.
o Safety, due to their separation from roads, and to appropriate safeguards at the intersections.
o Continuity with suitable solutions for any difficulties and alternative routes.
o Respect for the environment along itineraries and distils this respect to its users.
Greenways provide facilities based on infrastructures and fixtures of old pathways and tracks, such as disused railway stations and lock keepers' houses. These facilities can take several shapes: general accommodation, museums, bicycle rentals, accommodation for equestrians, hostels etc. They serve local users as well as tourists. Greenways should have information available such as maps and brochures, supplied along the route and on access points to nearby sites of interest.
Common characteristic of greenways is that they follow natural land or water features, like ridges and rivers, or human landscape features
like abandoned railroad corridors or canals. They link natural reserves, parks, cultural and historic sites with each other and, in some cases, with populated areas. Greenways not only protect environmentally sensitive lands and wildlife, but can also provide people with access to sociohistorical sites, outdoor recreation and even enjoyment close to home.
In a summary fashion, greenways within the landscape, serve at least three major functions:
o they protect and/or enhance remaining natural, cultural and historical resources,
o they provide linear open space for compatible human use, and
o they maintain connectivity between conservation lands, communities, parks and other recreational facilities, cultural and historic sites.
3. International History of Greenways
Greenway Planning includes the design and implementation of greenways. The origin of greenway planning goes back to the beginning of the landscape architecture profession in the United States. Prominent are three phases of this evolution of planning which started with Frederick Law Olmsted's Boston's Emerald Necklace, the planning of this Boston Park System by Frederick Law Olmsted, during the late 19th century and by Charles Eliot, a pupil of Olmsted. The second phase of this evolution was during the early 20th century. This time, Olmsted's sons and Eliot's nephew expanded the work of Olmsted and Eliot. The third phase of this greenway evolution was by Phil Lewis, Ian McHarg and others during the post-World War II decades, also known as the environmental decades. Interestingly, all planners of these first three phases of greenway planning were landscape architects [1].
Results of literature review examining the beginning of greenway planning during the 1980s and 1990s conclude that while the greenway movement has resulted in thousands of greenway plans and projects in the USA, it produced only a small amount of publications, placed in research libraries. Unfortunately, greenway reports of greenway projects are published for limited distribution and only a handful of these reports become part of "scholarly literature". Also, greenway reports seldom include relevant literature review or descriptions of the study methodology. Hence,
174
“Sustainable Management and Development of Mountainous and Island Areas”

their research and educational value is limited [2].
Two current greenway plans in the United States were initiated and done at the Department of Landscape Architecture at the University of Massachusetts. Julius Fabos served as co-director of both of these plans. The first plan is a vision plan for New England region, which consists of six states at the Northeast corner of the United States. This plan was prepared for the Centennial Conference of the American Society of Landscape Architects in 1999. Its aim was to stimulate landscape architectural professionals to join the greenway movement. The second plan builds on planning efforts of US governmental, non-governmental agencies and some visionary planners of the past century. All published greenways and greenspaces were mapped and recent proposals by governmental agencies, non-governmental organizations (NGO) and individuals were gathered. Finally, additional proposals were made by the UMASS research team, which if implemented would result in an ideal network of greenways and green spaces at the national level in the USA [4].
European Greenways Association
In May 1997, it was decided within the framework of the First European Conference on Soft Traffic and Railway Paths (Val-Dieu, Belgium) to set up the European Greenways Association.The association's constituent assembly was held in Namur, Belgium, on January 8th, 1998. A statute was signed by 17 representatives of institutions and associations from many European countries. The European Greenways Association:
o contributes towards the preservation of infrastructures such as disused railway corridors, tow paths and historic routes (Roman roads, pilgrim's path, drove ways, etc.) in the public domain to develop, along them, non-motorised itineraries.
o encourages the use of non-motorised transport, draws up inventories of potential routes and writes technical reports.
o promotes and coordinates the exchange of expertise and information among different associations and national and local bodies which are currently developing these initiatives in Europe.
o informs and advises local and national bodies on how to develop non-motorised itineraries.
o collaborates with European bodies to support their policies in term of sustainable development, environment, regional balance and employment.
According to the European Greenways Association, greenways:
o Improve communications and non-motorised itineraries in Europe: hundreds of kilometers running through European countries are available for pedestrians, cyclists, equestrians and mobility impaired people.
o Promote healthier and more balanced ways of life and transport reducing the congestion and the pollution of cities.
o Promote rural development, active tourism and local employment.
o Encourage a more human and closer relationship among citizens [3].
European Greenways Association declared that in order to bring Europeans closer to both their natural and cultural environment,
a) European Union must take action:
o To consider European Greenway Network as one of the EU's priority objectives,
o To ensure that European Greenway Network and greenways in general, are eligible for funding under European funding programmes, in particular the Structural Funds,
o To facilitate adoption of a common definition and harmonisation of standards of quality and way-markings,
o To facilitate development of a common methodology for the study and identification of routes, which would favour economic and social development of areas crossed, while also taking into account the quality of surrounding natural areas,
o To facilitate definition, construction, assessment, and promotion of the European Greenway Network,
o To facilitate establishment of trans-European routes and their extension into
175
member countries of the Council of Europe,
o To put in place a European consultative committee on greenways
b) Member states of EU must take action:
o to ensure coherent national greenway networks through identification of outline framework plans and common standards on quality and way signage,
o to put in place long term budget lines for planning, implementation, management and maintenance of national greenway networks,
o to support national campaigns aimed at mobilising central, regional and local authorities in relation to greenways policies and issues.
c) Regional and local authorities must take action to commit themselves to the development of greenway networks:
o by integrating greenways as structural elements into their development plans for urban and rural areas, dedicating a percentage of their roads and transport budgets,
o by preserving, through designation or acquisition, disused transport lines, engineering structures and service buildings so to enable greenways and ancillary services to be realised along them,
o by enhancing natural, cultural and built heritage along or around the vicinity of greenways,
o by promoting, in their area, greenways as a high quality, environmentally friendly infrastructure,
o by promoting the setting up of services for greenways users,
o by working towards these objectives in consultation with all interested associations.
d) Railway, inland waterway, and forestry management authorities must take action:
o to give preference to reuse and restoration of infrastructures and equipment that would aid greenways development,
o to adapt existing infrastructures for use as greenways progressively as opportunities arise during the evolution of their work,
o to facilitate connections between greenways and rail, ferry, and inland water transport.
e) Associations must take action:
o to participate in the development of greenways at local, regional, national and European level,
o to monitor the quality of greenways in partnership with local authorities,
o to take part in the promotion, and popularising the use of green ways.
4. Sociocultural Issues
Integrating Social and Ecological Values
Greenways are a mean to connect built to natural environment, which fosters an intrinsic interconnection between humanity and nature. Open spaces and parks in the interconnected form of greenways, offer places for people to connect with natural ecological processes and attain peace of mind. This can be seen and experienced everyday. Whether walking or cycling along a riverside trail, or just sitting down with friends and family to enjoy the peace and serenity of an area away from the city, many people use scenic corridors as a means to enjoy nature within the city. Small pockets of remaining open space desperately need to be restored as a functional greenway. Unfortunately, it is a realization that the Greek Ministry of Physical Planning and other related agencies have not been able to balance with overriding economic and political pressures to develop Greek land. It is known all over the world that Greece has an abundant wealth of historical and cultural sites that though preserved up to date, deserve a better future tying these sites closer to everyday living.
Public participation
It is important to note that most efforts of the Greenway movement, globally have been citizen led. Citizens believed that restoring the natural environment that exists in and around a community increases the ability for people to
176
“Sustainable Management and Development of Mountainous and Island Areas”

connect with nature which can greatly improve many qualities of life within the community. Recreation, hiking, cycling, commuter pathways, and natural history education all provided by functional greenways, can improve the livability of a community.
Strengthening Social Structure
By conserving green infrastructure connections and by connecting people and the land in a manner that re-establishes close connections between a communities' environment, economy and society, greenway systems can help build the much desired sustainable future of communities. Community greenway systems have the potential not only to conserve green infrastructure and aesthetic qualities of a community, but they can also provide important economic benefits by attracting users and businesses who serve them. Greenways are one of the features which improve a community's quality of life making it attractive to potential residents and businesses. Greenways also improve a communities' quality of life so people can escape the hustle of urban living, providing opportunities for personal interaction, involvement, socialization and community-building. Greenways often become a unifying feature for communities and become expressions of community character in which they take great pride.
5. Economic Impacts of Greenway Development
Globally, the development of pedestrian and/or bicycle facilities of greenways is proving to be a wise economic investment for the involved communities. Trails and pathways have a positive effect on nearby properties as homebuyers and business owners realize the value that such facilities bring to a community. Many types of businesses — including restaurants, convenience stores, bicycle shops, campgrounds and small motel establishments — attribute at least part of their success to a nearby trail. Realtors and homebuyers alike are recognizing the benefits of pedestrian and/or bicycle facilities and the value of properties located close to such facilities. Locally and nationally, pedestrian and bicycle facilities have proven to be a cost effective use of public funds. The construction of multi use trails will allow more Greeks to replace automobile trips with non motorized trips, thereby moving the nation
closer to achieving national and community public health objectives by providing increased opportunities for physical exercise. On an international level, many studies demonstrate that parks, greenways and trails increase nearby property values [5]. Spending and expenditures by local residents on greenway related activities help support recreation related business and employment, as well as businesses patronized by greenway and trail users. As a result residents are increasingly spending vacations closer to home, thus spending increasing amounts of vacation euros within the boundaries of a nearby region. Greenways often provide business opportunities, locations and resources for commercial activities such as recreation equipment rentals and sales, lessons, and other related businesses. Greenways are often major tourist attractions which generate expenditures on lodging, food, and recreation related services. Moreover, tourism is one of Greece’s largest and most stable industries, and is projected to become its largest. Natural beauty, the richest of Greece’s blessings is probably the single most important criterion for tourists in selecting outdoor recreation destinations in the country. The agency responsible for managing a greenway, river, or trail can help support local businesses by purchasing supplies and services. Jobs created by the managing agency may also help increase local employment opportunities. The quality of life of a community is an increasingly important factor in corporate relocation decisions. Greenways are often cited as important contributors to quality of life and to the attractiveness of a community to which businesses are considering relocating. In conserving water bodies such as seashores, rivers, or lakes, trails and greenways can help local governments and other public agencies reduce public costs resulting from flooding and other natural hazards. While greenways have many economic benefits it is important to remember the intrinsic environmental and recreation value of preserving rivers, trails and other open space corridors. Greenways along rivers can help reduce the cost of repairing flood damage and improving water quality [7].
177
“Sustainable Management and Development of Mountainous and Island Areas”
6. Discussion
Analysis and Evaluation of Greenway Planning in Greece(Restrictions and Potentials)
One of Greece's greatest challenges is to build a sustainable future - that is, a future in which the needs of the present generation are met in ways that expand rather than limit the ability of future generations to meet their own needs. The concept of a sustainable future has been further defined by the World Commission on Environment and Development in 1987 as follows: "This Commission believes that people can build a future that is more prosperous, more just, and more secure. Our report, Our Common Future, is not a prediction of ever increasing environmental decay, poverty, and hardship in an ever more polluted world among ever decreasing resources. We see instead the possibility for a new era of economic growth, one that must be based on policies that sustain and expand the environmental resource base." Sustaining and expanding Greece's environmental resource base - green infrastructure - to ensure a prosperous economy and a productive society requires bold administrative and political decisions. Simply put, the "green infrastructure" is the system of native landscapes and ecosystems that supports native plant and animal species; sustains clean air, water, fisheries, and other natural resources; and maintains the scenic natural beauty that draws people to visit and settle in Greece. A healthy and diverse green infrastructure through adaptation of the Greenway strategy must, therefore, be the underlying basis of Greece's sustainable, programmed and implemented future. The rich cultural heritage of the country's first inhabitants, Native Greeks, illustrates the close and mutually dependent connection among environment, economy and society. But that close connection has not always been maintained. Many of Greece's historic/cultural landscapes and native ecosystems have been degraded or isolated over the years as wetlands have been filled, uplands have been paved estuaries have been polluted. There is scientific evidence that Greece's green infrastructure cannot be sustained without watersheds, ridges and other natural corridors that connect its native landscapes and ecosystems. At the same time,
there is concern that many Greeks have lost the sense of connection with their rich natural, historic and cultural heritage.
Greenways and greenway systems offer an exciting new opportunity to reestablish connections between the country's green infrastructure and its people. Greenway networks can:
o help conserve native landscapes and ecosystems by protecting, maintaining, and restoring natural connecting corridors,
o reconnect Greeks with their natural, historical and cultural heritage through a system of trails and other connectors.
Greenways: o heighten sensitivity to the natural
environment, o promote additional greenway and
parkland development, o protect open space and promote
livability within urban areas.
Greenways can: o separate and buffer incompatible
adjacent land uses, o promote economically efficient and
productive land uses of lands marginal for development,
o provide opportunities for recreation, exercise and alternative transportation.
Greenways are one part of a complex interconnected set of solutions to move towards ecological sustainable development. The intentions of the other state wide planning goals, along with a Greek National Greenway Vision Plan, can be interpreted as efforts to move towards sustainable development. The state wide planning goals address these needs , but there are no explicit policy statements about transgressing resource planning to sustainable development. Planning efforts have emphasized maintaining economic uses more so than any emphasis on all together preserving land in order to fully restore regional ecological integrity. Finding the balance between ecology and economy has proven to be the largest controversy, usually giving way to perceived economic necessities resulting in overall environmental deterioration. Greece has suffered the consequences of economic prioritization,
178
“Sustainable Management and Development of Mountainous and Island Areas”

with reduced watershed water quality from pesticide and other non-point source pollutants, and lost fish habitats from forest clear-cutting debris, and soil erosion.
There have been major shifts in the economy to move from a one primarily based on natural resources to an economy based on knowledge and technology. This economic shift does not recognize sustainable development as the ends to which the means of a knowledge and technology based economy serve to strengthen the environment. After more than 30 years of implementing land-use planning policy and goals, urban growth, pollution, and environmental degradation, continue to get worse globally. Goals established in 1975 were ahead of their time on addressing solutions to the problems perceived at that time, but the problems have become more complex. Nationwide goals need to be met first and foremost. Greeks need to understand that the problems have increased because they have not met these standards. Solutions only become more difficult to obtain the further one moves away from achieving them. Every individual, every business, every learning institution needs to be held accountable, and needs to hold themselves responsible to achieving state wide planning goals. One possible first step, is the preservation all remaining open space along proposed Historical and Cultural Greenways.
7. Conclusions Greek Greenways: history at its
making
A. Greece as part of the European Planning Context must advocate:
o Ecological determinism. (Where is Greece physically/ecologically?)
o Economic determinism. (Where is Greece economically?)
o Social determinism. (Where is Greece socially?)
o Cultural imperialism. (Greece is an inetrnational cultural cradle of global civilization)
These can be organized, structured and presented with the aid of the Greenway Planning concept.
Up to date there has not been a coordinated official effort or approach for Greece to adopt a greenway policy on national, regional or local level. No official governmental or administrative
agency has included greenway planning as a land use strategy with related actions.
B. Greece must explore and illustrate methods for developing Greenway Network Strategic Plans that:
o Protect vital natural resources of forest, soil, water, air and minerals (physical realm/planning).
o Link common cultural, social, economic and environmental interests (implications of the physical realm/planning to social, economic, legal and political policies and regulations).
o Link areas of potential preservation to local, regional and international networks (scaling/network organization).
o Examine current public policy implications with regard to future hazards and opportunities (pollution, desertification, ecotourism, ecologically appropriate housing and industrialization).
C. It is the research team’s vision to see a National Vision Plan being conceived, developed and implemented for Greece. If implemented, this plan would protect all nationally significant and environmentally sensitive corridors and areas or green spaces. It would also provide the population of Greece with increased recreational opportunities and thirdly, it would upgrade and/or restore all nationally significant historical and cultural sites.
The aim of this National Vision Plan is to show a plausible planning direction based on principles of both, landscape and greenway planning. This National Vision Plan could illustrate the importance of planning greenways comprehensively. It calls for nature protection, for development of appropriate recreational uses, and for preservation and restoration of valuable historical/cultural resources. Not surprising, the vast majority of the nation's historical and cultural resources are within river corridors or shorelines. Greenway planning can, indeed, evolve as a planning tool of multipurpose greenway corridors at every scale and planning levels, ranging from sites through municipal and regional to national levels.
179
“Sustainable Management and Development of Mountainous and Island Areas”

D. In order to formulate such a National Vision Plan the following steps of action are recommended:
o Need to educate government administration at National level: the Department of Physical Planning and the Environment (Y ).
o Need to educate government administration at Regional level: the 13 Regions that comprise Greece’s administrative territory.
o Need to educate government administration at Local level: the 54 Prefectures and 1540 Municipalities that comprise Greece’s physical territory.
o Need to educate non government organizations (NGO’s).
o Need to alert educational institutions to join their forces and build a sound and valid technical expert base.
o Need to promote public awareness and education, public participation and participative planning techniques.
o Need to create collaboration among government and administrative agencies, academic institutions, NGO’s and the public in order to make valid and feasible, economically viable and environmentally sustainable proposals.
Selected References
[1] Ahern J, Fabos J. Greenways: the beginning of an international movement. Landscape and Urban Planning, October 1995;Vol. 33 No. 1-3.
[2] Ahern J, Greenways as a planning strategy. Landscape and Urban Planning, October 1995;Vol. 33 No. 1-3: 131-155.
[3] European Greenways Association, The European Greenways Good Practice Guide: Examples of Actions Undertaken in Cities and the Periphery. European Greenways Association, 1998.
[4] Fabos J, Introduction and overview: the greenway movement, uses and potential of greenways. Landscape and Urban Planning, October 1995;Vol. 33 No. 1-3: 1-13.
[5] Fink C, Searns R, Greenways: a guide to planning design and development. Washington DC: Island Press, The conservation Fund; 1993.
[6] Jongman R, Pungetti G, Ecological Networks and Greenways: Concept, Design, Implementation. Cambridge University Press. Cambridge; 1999.
[7] Little C, Greenways for America. Baltimore: John Hopkins University Press; 1990.
180
“Sustainable Management and Development of Mountainous and Island Areas”

Study of Primary and Secondary School Environmental Educators’ Understandings of Sustainable Development, Education for Sustainable
Development and its relation with Environmental Education
Karameris Athanasios, Ragkou Polyxeni, Papanikolaou Anastasios Studentstudy of Forest Recreation, Environmental Education and Sociology
School of Forestry and Natural Environment, Aristotle University of Thessaloniki [email protected], [email protected], [email protected]
Abstract. The idea that sustainable development is the ultimate goal of the relationship humans - environment and that education is one of the most important means for achieving this goal, was expressed in the 90s. What does “sustainable development” mean? Are changes needed in the semantic and methodological context of Environmental Education (EE)? We examine how teachers of Primary and Secondary Education conceptualize EE, Sustainable Development, the relation between them, so that any obscureness or weakness of dealing with those issues is ascertained, so that measures can be proposed to make more efficient the contribution of EE in dealing with environmental issues.
Keywords. Education for Sustainable Development, Sustainability, Environmental Educators, Environmental Education, Sustainable Development,
1. Introduction
The concept of Sustainable Development (SD), since the first attempts to formulate a definition: “Sustainable Development is a development that meets the needs of the present without compromising the ability of future generations to meet their own needs.” (Brundtland Commision, WCED 1987) to the more recent approaches of the notional content of the term (IUCN/UNEP/WWF,1991; UNESCO,1997; Fien,1996; Harribey,1998), was considered to be extremely complicated and at the same time vested with contradictions and obscurity. The content of the term varies depending on different societal and environmental conditions (Orr,1992; Reid,1995; Huckle & Martin,2001; Scott & Gough,2003). The various interpretations and approaches in the international literature make it difficult for a general consent about the content of the term to
be achieved amongst the scientific community: what is sustainable, to what level, in which time and spatial scale and which values should it promote.(Serafy,1992;Sauvé,1996;Bonnett,1999,2002). However, it is generally agreed that economy, environment, and society are the three pillars of SD (Gough 2002, p. 65).
The association of the concept of development with the concept of sustainability, which is why the term SD is criticized or not accepted by many authors, makes the term accepted and popular both in industrial countries, because it enshrines the principle of development and in developing countries, because it carries with it a hope of better participation of them in the use of natural resources (Smyth 1995 p. 12).
It is widely acceptable that the modern way of life is environmentally and politically unsustainable (Goodland, 1996; McKeown & Hopkins, 2003). During the ‘90s, especially after the 1992 Rio Earth Summit, education in its broader sense, is recognized as one of the most important tools for achieving a sustainable world, through fostering new knowledge, skills, values and attitudes (UN, 1993; Keating, 1993). The recommendations of the 1997 International Conference by UNESCO in Thessaloniki that Environmental Education may also be referred to as Education for the Environment and Sustainability, have caused and continue to trigger, a heated discussion among the environmental educators’ community. The controversy that surrounded the term sustainable development has reached the field of EE.
An intense speculation and rhetoric was initiated about the content of an ESD, and the deeper changes in the notional and ideological orientation of EE (Huckle, 1996; Stables & Scott, 2002; Jickling, 1992, Sauve, 1999a; Sauve & Berryman, 2005).
UNESCO proclaims the time period 2005-2014 as the United Nations “Decade of Education for Sustainable Development” and the
181
“Sustainable Management and Development of Mountainous and Island Areas”

term sustainable development becomes a nucleus of bringing about changes for a pedagogy for the environment, and a strategy for educational reformation in general. Education for Sustainable Development “is a holistic approach to developing the knowledge and skills needed, as well as changes in values in order to empower everyone to better understand the complexity and interconnectedness of the world in which they live and to make decisions and act individually or collectively in culturally appropriate and locally relevant ways to redress the problems that threaten our common future” (free translation, UNESCO, 2003, p. 4).
In order for these notional and methodological changes to get through to students and trainees, educators should be acquainted with the new context of EE that is brought about by the concept of sustainability (Kysilka, 1998). Informing educators about the framework of the notional changes that are brought about in the educational process by the concept of sustainable development is considered to be a critical prerequisite for such innovations in the educational field (Rauch et al.,2005).
Therefore, the study of environmental educators’ understanding of the notional context of SD, becomes an imperative, in order for their training to be designed more effectively. This paper draws from a research study which was designed to explore environmental educators’ understandings of the conceptual context of: the term “Sustainable Development”, its characteristics, the stakeholders who are responsible for planning and materializing its goals, the tools for its implementation, the concept of Education for Sustainable Development and its relation with Environmental Education.
The literature review showed only a small number of similar studies in the educators’ field. In other studies concerning training, transdisciplinary cooperation, teaching methods, reformation of analytic programs and implementation of curricula for ESD the views of educators of all grades, students-future educators, educational stuff and administrations about SD and ESD were surveyed (Schreuder et al., 1998; Summers et al., 200b, 2003, 2004, 2005; Caridad, 2003; Gayford, 2004). The findings showed that generally, educators of all stages attributed to the term SD the major characteristics that are met in the international bibliography. Emphasis on the one or the other dimension (environmental, social, economic),
was given depending on the speciality of educator. Natural sciences educators considered the environmental dimension of SD to be more important than the other two. The satisfactory level of conceptualization of the term was attributed to the fact that their basic study involved such concepts and, also, to the fact that subjects about SD have been imported in the analytic program of anglosaxon countries.
2. Methodology
Primary and secondary school environmental educators of all Prefectures of Greece constituted the statistical population of the research. The data of research were assembled with the help of a relevant questionnaire. The questionnaires were distributed privately (100) and via internet (3713), to all of the schools of the country, in order to be filled in by environmental educators, to the administrators of EE in Greece and to all Environmental Education Centers. 176 filled-in questionnaires were returned.
The content of the questionnaire was derived from our knowledge of the relevant literature. Qualitative and quantitative (discontinuous) variables were used in the questionnaire. SPSS 12.0 was used for the statistical analysis of the data. Analysis of content was also used for some cases.
3. Results
3.1. Environmental educators’ perceptions of the concept of SD
Educators were asked to give an open definition to SD. Registering educators’ perceptions of the concept of SD was considered to be important, because these perceptions determine their approach to ESD. The results are as follow:
30,7 % of educators did not give an answer to the question which means that either they are not familiar with the concept or the concept is too complex to describe. On the other hand, 30,7 % of the educators gave a complete answer to the question. A complete answer was considered to be an answer in which all three pillars of SD, as they are met in the international bibliography (environment, society and economy) were mentioned. 18,7% of the educators mentioned only the environmental dimension, while 6,8% of the educators emphasized the social dimension of
182
“Sustainable Management and Development of Mountainous and Island Areas”

SD (solidarity, transgenerational equality etc). The definitions that combined the economic dimension with the other two were fewer than 6%.
Although it is encouraging that one out of three educators is well familiarized with the relatively new concept of SD, a large proportion of them fail to conceptualize the term SD.
3.2. Environmental educators’ perceptions of the characteristics of SD
For further investigation of their comprehension of the concept of SD, it was asked of them to express their agreement or disagreement to a number of characteristics of SD. We believe that, SD should aim at economic and social development within the framework of environmental protection, to address issues locally, regionally, nationally and globally in a multiple time scale and promote values of trangenerational solidarity, democracy and equality (UNESCO, 1997, 2004). The results appear in Table 1.
Table 1. Environmental educators’ perceptions of the characteristics of SD
SUSTAINABLE DEVELOPMENT
DIS
AG
REE
C
OM
PLET
ELY
(%
)
PAR
TLY
DIS
AG
REE
(%
)
NO
OPI
NIO
N
(%)
PAR
TLY
AG
REE
(%)
AG
REE
C
OM
PLET
ELY
(%
)
is a Utopia 58,1 24,4 4,4 9,4 3,8 opposes to the capitalistic perception of development 6,5 10,7 11,9 35,1 35,7 is a form of survival of capitalistic system 39,5 23,5 17,9 15,4 3,7 raises the contradiction: Development or Environment 14,7 12,3 7,4 26,4 39,3 addresses issues locally, regionally, nationally, and globally 3,0 2,4 6,0 28,6 60,1 promotes values of solidarity, democracy and equality 1,2 4,2 7,2 30,1 57,2 is unlimited and continuous economic growth 64,8 15,8 4,8 9,1 5,5 takes into consideration the time factor while analyzing a phenomenon 2,4 4,2 20,5 32,5 40,4 emphasizes on the relations and interdependences of various factors 0,6 0,6 8,5 39,4 50,9 aims at the austerity of the way of life 13,3 24,8 10,9 39,4 11,5 aims at economic and social development within the framework of environmental protection
1,8 4,8 - 27,4 66,1
is achieved with radical changes of economic model of development 1,8 7,8 15,0 42,5 32,9 takes into consideration simultaneously ecological, economic and social factors in the management of natural resource
0,6 5,3 - 29,4 64,7
The majority of the educators believe that SD presupposes change of economic model of development and addresses issues in a multiple geographic and time scale. The 3 dimensions of SD were recognized even though the economic dimension was not mentioned by the majority in the open definition (question 1)
3.3. Environmental educators’ perceptions of the stakeholders who are responsible for planning and materializing the goals of SD
Environmental educators graded a number of stakeholders that are responsible for planning and materializing the goals of SD, depending on their degree of significance. An 8-degree scale was used, where 1 meant very important and 8 meant least important. Results are as follow:
The most important stakeholder is considered to be the central (official) government with a mean of preferences 2,141. Education, as one of society’s institutions, also plays a major role, which is ranked in second place with 3,423. In the following places are the responsible and conscientious citizen with 3,910, industry with 3,922, local and prefectural authorities with 4,346 and environmental organizations with a mean 5,205.
Central government is naturally considered to be the major stakeholder that is responsible for planning and materializing the goals of SD. The fact that education and the responsible citizen are considered to be major stakeholders is very important, because it indicates the acknowledgement of the major role that those two play towards achieving the goals of SD.
3.4. Environmental educators’ sources of information about SD
Environmental educators inform themselves about SD from various sources. In the first place, are training seminars (75,1%) and in second place is personal study (74,6%). 72,3% of the educators are informed from existing educational material relevant to EE and then follow the environmental organisations and the internet with 56,1% and 55,5% respectively. 48,3% of the educators are informed about SD issues from congresses, a relatively high percentage, (40,5%), from the mass media and finally a 6,3% retrieve information from other sources.
The fact that training seminars are in the first place, indicates the necessity of their existence. The high percentage of personal study shows the concern and will of the educators to inform themselves about SD in order to rise to requirements of their work.
3.5. Environmental educators’ perceptions of the tools for the implementation of SD
183
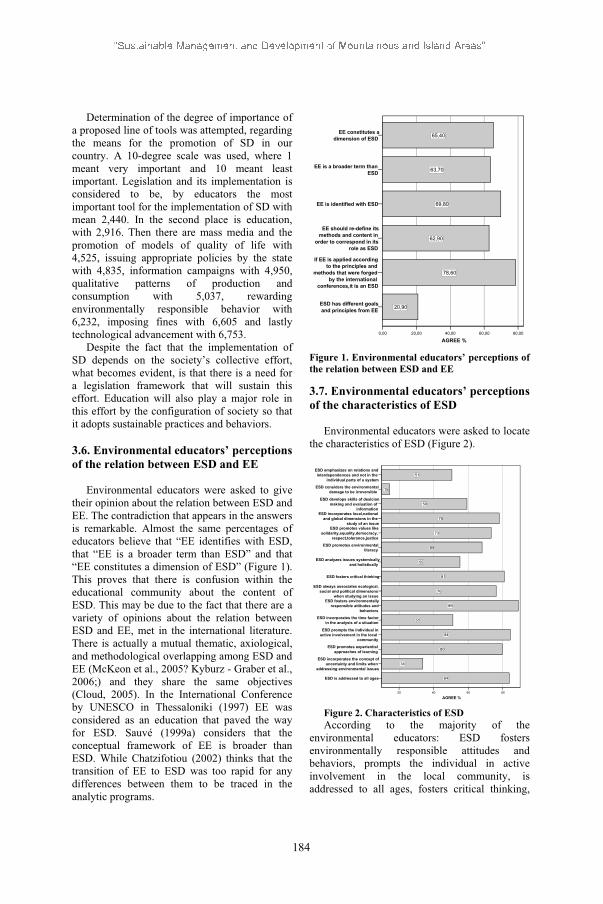
Determination of the degree of importance of a proposed line of tools was attempted, regarding the means for the promotion of SD in our country. A 10-degree scale was used, where 1 meant very important and 10 meant least important. Legislation and its implementation is considered to be, by educators the most important tool for the implementation of SD with mean 2,440. In the second place is education, with 2,916. Then there are mass media and the promotion of models of quality of life with 4,525, issuing appropriate policies by the state with 4,835, information campaigns with 4,950, qualitative patterns of production and consumption with 5,037, rewarding environmentally responsible behavior with 6,232, imposing fines with 6,605 and lastly technological advancement with 6,753.
Despite the fact that the implementation of SD depends on the society’s collective effort, what becomes evident, is that there is a need for a legislation framework that will sustain this effort. Education will also play a major role in this effort by the configuration of society so that it adopts sustainable practices and behaviors.
3.6. Environmental educators’ perceptions of the relation between ESD and EE
Environmental educators were asked to give their opinion about the relation between ESD and EE. The contradiction that appears in the answers is remarkable. Almost the same percentages of educators believe that “EE identifies with ESD, that “EE is a broader term than ESD” and that “EE constitutes a dimension of ESD” (Figure 1). This proves that there is confusion within the educational community about the content of ESD. This may be due to the fact that there are a variety of opinions about the relation between ESD and EE, met in the international literature. There is actually a mutual thematic, axiological, and methodological overlapping among ESD and EE (McKeon et al., 2005? Kyburz - Graber et al., 2006;) and they share the same objectives (Cloud, 2005). In the International Conference by UNESCO in Thessaloniki (1997) EE was considered as an education that paved the way for ESD. Sauvé (1999a) considers that the conceptual framework of EE is broader than ESD. While Chatzifotiou (2002) thinks that the transition of EE to ESD was too rapid for any differences between them to be traced in the analytic programs.
ESD has different goals and principles from EE
If EE is applied according to the principles and
methods that were forged by the international
conferences,it is an ESD
EE should re-define its methods and content in
order to correspond in its role as ESD
EE is identified with ESD
EE is a broader term than ESD
EE constitutes a dimension of ESD
0,00 20,00 40,00 60,00 80,00
AGREE %
20,90
78,60
69,80
62,90
63,70
65,40
Figure 1. Environmental educators’ perceptions of the relation between ESD and EE
3.7. Environmental educators’ perceptions of the characteristics of ESD
Environmental educators were asked to locate the characteristics of ESD (Figure 2).
ESD is addressed to all ages
ESD incorporates the concept of uncertainty and limits when
addressing environmental issues
ESD promotes experiential approaches of learning
ESD prompts the individual in active involvement in the local
community
ESD incorporates the time factor in the analysis of a situation
ESD fosters environmentally responsible attitudes and
behaviors
ESD always associates ecological,social and political dimensions
when studying an issue
ESD fosters critical thinking
ESD analyzes issues systemically and holistically
ESD promotes environmental literacy
ESD promotes values like solidarity,equality,democracy,
respect,tolerance,justice
ESD incorporates local,national and global dimensions in the
study of an issue
ESD develops skills of desicion making and evaluation of
information
ESD considers the environmental damage to be irreversible
ESD emphasizes on relations and interdependences and not in the
individual parts of a system
20 40 60 80
AGREE %
84
34
80
84
51
89
76
81
55
68
73
78
59
15
51
Figure 2. Characteristics of ESD According to the majority of the
environmental educators: ESD fosters environmentally responsible attitudes and behaviors, prompts the individual in active involvement in the local community, is addressed to all ages, fosters critical thinking,
184

promotes experiential approaches of learning, analyzes issues in multiple spatial scale and always associates ecological, social and political dimensions when studying an issue. What is derived from the above is that the majority of educators are in position to locate an important part of the characteristics of ESD, nevertheless it is not complete knowledge of the characteristics, and in some cases this knowledge is considerably limited. This confirms the ascertainment that was reached (questions 1 & 6) about the content of SD and the relation between ESD and EE
3.8. Environmental educators’ perceptions of the characteristics of ESD and EE
The contradistinction of educators’ opinions about the characteristics of ESD and EE (Table 2) is of great interest.
Table 2. Characteristics of ESD and EE
Characteristics EE (%)
ESD(%)
Approx. Sig.
considers the environmental damage to be irreversible 3,4 14,5 0,012 incorporates the concept of uncertainty and limits when addressing environmental issues 23,3 33,7 0,000 analyzes issues systemically and holistically 50,0 55,2 0,000 incorporates the time factor in the analysis of a situation 35,8 51,2 0,000 always associates ecological, social and political dimensions when studying an issue 71,6 76,2 0,000 promotes environmental literacy 69,3 68,0 0,000 is addressed to all ages 73,9 83,7 0,000 incorporates local, national and global dimensions in the study of an issue 73,9 77,9 0,000 prompts the individual in active involvement in the local community 88,1 84,3 0,224 promotes experiential approaches of learning 85,8 79,7 0,005 fosters critical thinking 85,2 80,8 0,000 promotes values like solidarity, equality, democracy, respect, tolerance, justice 74,4 73,3 0,000 develops skills of decision-making and evaluation of information 54,5 59,3 0,000 emphasizes on relations and interdependences and not in the individual parts of a system 44,3 50,6 0,000 fosters environmentally responsible attitudes and behaviours 92,6 89,0 0,000
It is remarkable that educators attribute almost the same characteristics to ESD and EE, although they attributed some characteristics more or less to the one or the other, as it shown by the approximate significance.
Another element of comparison of ESD and EE is which educational themes are the subject of study of ESD or EE. Environmental educators were asked to give their opinion on the issue. (Table 3)
Table 3. Educational Themes
EDUCATIONAL THEME EE (%)
ESD(%)
Approx. Sig.
Food production and its environmental impact 69,9 77,7 0,092 Production of consuming goods and its environmental impact 65,7 80,1 0,340 Effect of technology in the environment 67,5 69,9 0,024
Carrying capacity of ecosystems 58,4 62,0 0,045 Management of ecosystems of a region 63,9 66,3 0,073 Climatic changes 70,5 48,8 0,477 Urbanisation and its repercussions 58,4 59,6 0,312 Human rights 40,4 37,3 0,194 Recycling 78,9 74,7 0,616 Potable water 78,9 74,7 0,211 Arts and Music 24,1 10,2 0,589 Racism and its consequences in the society 24,7 20,5 0,475 Transgenderal equality 20,5 16,9 0,245 Consumer Behaviour and environment 71,1 68,7 0,136 Sexual hygiene 12,7 12,7 0,345 Population growth 43,4 67,3 0,233 Mineral resources 57,2 75,2 0,825 Addictive substances and society 16,3 13,3 0,794 Biodiversity 71,7 66,9 0,565
Approximate significance does not show any differentiations as far as educational themes are concerned, except for the themes “Effect of technology in the environment” and “Carrying capacity of ecosystems”, which are considered to be by the educators rather a subject of ESD, maybe because the concept of development is more associated with the terms technology and carrying capacity of the ecosystems, as an element of managing the environment. Most educational themes however, are considered to be by the majority, as subjects of study of both ESD and EE.
The educational themes: arts and music, racism and its consequences in the society, transgenderal equality, addictive substances and society, sexual hygiene and human rights are considered to be the subject of some other education. We believe that the above educational themes were correctly distinguished from the thematcal context of EE. However, they could also be the subject of study of ESD, if it is considered to be a broad educational strategy that will incorporate the social dimension in the syllabus.
Educators see ESD as a concept that almost identifies with EE, attributing minor differences to one or the other, a fact that contradicts the ascertainment that was reached about the relation between ESD and EE. (question 6).
3.9. Ways of incorporating the principles of sustainability to our educational system
Environmental educators were asked to give their opinion about which of the proposed ways would be better for the principles of sustainability to be incorporated into the Greek educational system. Results are as follow (Figure 3):
185
“Sustainable Management and Development of Mountainous and Island Areas”
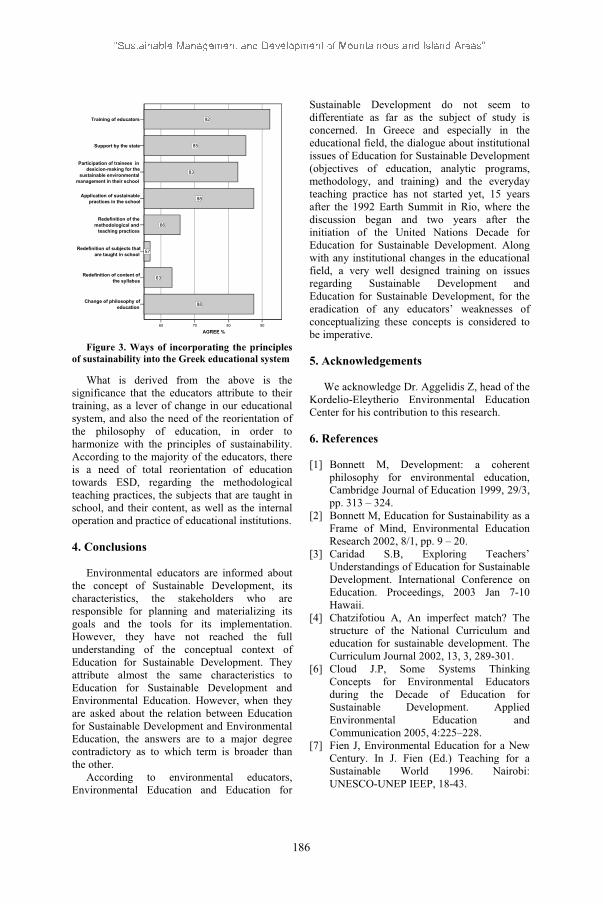
Change of philosophy of education
Redefinition of content of the syllabus
Redefinition of subjects that are taught in school
Redefinition of the methodological and
teaching practices
Application of sustainable practices in the school
Participation of trainees in desicion-making for the
sustainable environmental management in their school
Support by the state
Training of educators
60 70 80 90
AGREE %
88
63
57
66
88
83
85
92
Figure 3. Ways of incorporating the principles of sustainability into the Greek educational system
What is derived from the above is the significance that the educators attribute to their training, as a lever of change in our educational system, and also the need of the reorientation of the philosophy of education, in order to harmonize with the principles of sustainability. According to the majority of the educators, there is a need of total reorientation of education towards ESD, regarding the methodological teaching practices, the subjects that are taught in school, and their content, as well as the internal operation and practice of educational institutions.
4. Conclusions
Environmental educators are informed about the concept of Sustainable Development, its characteristics, the stakeholders who are responsible for planning and materializing its goals and the tools for its implementation. However, they have not reached the full understanding of the conceptual context of Education for Sustainable Development. They attribute almost the same characteristics to Education for Sustainable Development and Environmental Education. However, when they are asked about the relation between Education for Sustainable Development and Environmental Education, the answers are to a major degree contradictory as to which term is broader than the other.
According to environmental educators, Environmental Education and Education for
Sustainable Development do not seem to differentiate as far as the subject of study is concerned. In Greece and especially in the educational field, the dialogue about institutional issues of Education for Sustainable Development (objectives of education, analytic programs, methodology, and training) and the everyday teaching practice has not started yet, 15 years after the 1992 Earth Summit in Rio, where the discussion began and two years after the initiation of the United Nations Decade for Education for Sustainable Development. Along with any institutional changes in the educational field, a very well designed training on issues regarding Sustainable Development and Education for Sustainable Development, for the eradication of any educators’ weaknesses of conceptualizing these concepts is considered to be imperative.
5. Acknowledgements
We acknowledge Dr. Aggelidis Z, head of the Kordelio-Eleytherio Environmental Education Center for his contribution to this research.
6. References
[1] Bonnett M, Development: a coherent philosophy for environmental education, Cambridge Journal of Education 1999, 29/3, pp. 313 – 324.
[2] Bonnett M, Education for Sustainability as a Frame of Mind, Environmental Education Research 2002, 8/1, pp. 9 – 20.
[3] Caridad S.B, Exploring Teachers’ Understandings of Education for Sustainable Development. International Conference on Education. Proceedings, 2003 Jan 7-10 Hawaii.
[4] Chatzifotiou A, An imperfect match? The structure of the National Curriculum and education for sustainable development. The Curriculum Journal 2002, 13, 3, 289-301.
[6] Cloud J.P, Some Systems Thinking Concepts for Environmental Educators during the Decade of Education for Sustainable Development. Applied Environmental Education and Communication 2005, 4:225–228.
[7] Fien J, Environmental Education for a New Century. In J. Fien (Ed.) Teaching for a Sustainable World 1996. Nairobi: UNESCO-UNEP IEEP, 18-43.
186

[8] Gayford C, A model for planning and evaluation of aspects of education for sustainability for students training to teach science in primary schools. Environmental Education Research. 2004, 10, 2, 255-271.
[9] Goodland R, Growth has reached its limits. In J. Mander & E. Goldsmith. (Eds.), The case against the global economy: And for a turn toward the global (pp.207-217). San Francisco: Sierra Club Books, 1996.
[10] Gough S, Increasing the value of the environment: A “real options” metaphor for learning Environmental Education Research 2002, 8, 1, 61-72.
[11] Harribey J.M, Le développement soutenable, 1998, Economica, Paris.
[12] Huckle J, Realising sustainability in changing times. In J. Huckle & S. Sterling (Eds), Education for sustainability (pp. 3-17). London: Earthscan Publications, 1996.
[13] Huckle J & Martin A, Environments in a Changing World, Harlow, Prentice Hall, 2001.
[14] IUCN/UNEP/WWF, Caring for the Earth: A Strategy for Sustainable Living. Gland, Switzerland : IUCN/UNEP/WWF 1991.
[15] Jickling B, Why I don’t want my children to be educated for sustainable development. Journal of Environmental Education 1992, 23 (4), 5-8.
[16] Keating M, The Earth Summit’s Agenda for Change – A plain language version of Agenda 21 and the Rio Agreements. Geneva Switzerland: Centre for our Common Future, 1993.
[17] Kyburz-Graber R, Hofer, K, and Wolfensberger, B. Studies on a socio-ecological approach to environmental education: a contribution to a critical position in the education for sustainable development discourse. Environmental Education Research 2006, 12, 1, 101 – 114.
[18] Kysilka M, Understanding integrated curriculum, The Curriculum Journal 1998, 9, 197–209.
[19] McKeown R & Hopkins C, EE/ESD: defusing the worry. Environmental Education Research 2003, 9,1, 117-128.
[20] McKeown R & Hopkins C, EE and ESD: Two Paradigms, One Crucial Goal. Applied Environmental Education and Communication 2005, 4:221–224.
[21] Orr D, Ecological Literacy: Education and the Transition to a Postmodern World. Albany : SUNY Press, 1992.
[22] Rauch F and Steiner R, “University Course «Education for Sustainable Development - Innovations in Teacher Education» (BINE): Reasons, Concept and First Experiences” Conference Paper, International Conference “Committing Universities to Sustainable Development” 2005 April 20-23, Graz.
[23] Reid D, Sustainable Development: an introductory guide, London, Earthscan, 1995.
[24] Sauvé L, Environmental education and sustainable development: a further appraisal, Canadian Journal of Environmental Education 1996, 1, pp. 7–35.
[25] Sauvé L, “Environmental Education between modernity and postmodernity: Searching for an integrating educational framework”. Canadian Journal of Environmental Education 1999, 4, 9-35.
[26] Sauvé L and Berryman T, Challenging a “Closing Circle”: Alternative research Agendas for the ESD Decade. Applied Environmental Education and Communication 2005, 4, 229-232.
[27] Schreuder D and Le Grange L, Sustaining EE Research and Teacher Education through Partnerships Between Universities and Schools: Thoughts from South Africa. International Research in Geographical and Environmental Education 1998, 7, 3, 240-243.
[28] Scott W & Gough S, Oral evidence to the House of Commons Environmental Audit Committee’s enquiry into sustainable development, University of Bath 2003.
[29] Serafy S.E, Sustainability, Income Measurement and Growth. In Goodland, R., Daly, H., Serafy, S.E. and Droste, B.v., Eds. 1992, Environmentally Sustainable Development : Building on Brundtland. Paris : UNESCO 1992.
[30] Smyth J, Environment and education: a view of a changing scene. Environmental Education Research 1995, Vol.1 No. 1 pp 3-20.
[31] Stables A and Scott W, The quest for holism in education for sustainable development. Environmental Education Research 2002, 8, 1, 53-60.
[32] Summers M, Corney G and Childs A, One Small Step: understanding the science of environmental issues, Association for Science Education, Hatfield, 2000b
[33] Summers M, Corney G and Childs A, Teaching Sustainable Development in
187
“Sustainable Management and Development of Mountainous and Island Areas”

Primary Schools: an empirical study of issues for teachers. Environmental Education Research 2003, 9, 3, 327-346
[34] Summers M, Corney G and Childs A, Student teachers’ conceptions of sustainable development: the starting-points of geographers and scientists. Environmental Education Research 2004, 46, 2, 163-182.
[35] Summers M, Corney G and Childs A, Education for sustainable development in initial teacher training: issues for interdisciplinary collaboration. Environmental Education Research 2005, 11, 5, 623–647.
[36] United Nations, Earth Summit Agenda 21, The United Nations Programme of Action from Rio. New York: 1993.
[37] UNESCO, “Educating for a sustainable future: A transdisciplinary vision for concerted action”. Report of the International Conference on Environment and Society: Education and Public Awareness for Sustainability, 1997, Thessaloniki, Greece. Switzerland: UNESCO.
[38] UNESCO, The Decade of Education for Sustainable Development: framework for a draft international implementation scheme, Paris: Unesco, 2003.
[39] UNESCO, United Nations Decade of Education for Sustainable Development 2005-2014 Draft International Implementation Scheme. Paris: Unesco, 2004.
[40] WCED (World Commission on Environment and Development), Our Common Future, Oxford: Oxford University Press, 1987
188
“Sustainable Management and Development of Mountainous and Island Areas”

Assessing Global Environmental Problems: The Case of Forestry Students in a Greek University
P. Karanikola, E. Manolas, S. Tampakis, G. Tsantopoulos
Department of Forestry and Management of the Environment and Natural Resources, Democritus University of Thrace,
193 Pantazidou Street, 68200 Orestiada, Greece.
Abstract. Mankind today faces the challenge of dealing with a multiplicity of environmental problems. In this paper, students from the entire spectrum of the academic program in the Department of Forestry and Management of the Environment and Natural Resources of the University of Thrace were asked to assess seven global environmental problems namely, the greenhouse effect, ozone depletion, acid rain, deforestation, overpopulation, loss of biodiversity and disposal of nuclear waste.
The research was carried out using self-management questionnaires which were completed by 297 students.
According to descriptive statistical analysis the students who completed the questionnaire regard the non-appropriate disposal of nuclear waste as the most serious problem while the problems coming immediately after are ozone depletion and the greenhouse effect. Next, in order of importance, are deforestation, acid rain and loss of biodiversity with the last one being the problem of overpopulation.
In the questions used, reliability was checked through reliability analysis. The value of the reliability coefficient alpha was found very high (0.8189) which shows that the available data tend to measure the same thing.
Validity was checked through the application of factor analysis with the use of two components. The first component included the factors “greenhouse effect”, “acid rain” and “disposal of nuclear waste” and was called “problems caused by industrial and economic development”. The second component which was called “no human respect for the wealth of nature” included the variables “deforestation” and “loss of biodiversity”. The variable
“overpopulation” is not included in the above components.
Keywords: Global environmental problems, reliability analysis, factor analysis.
1. Introduction
No other issue ties us all together as global citizens than the environment. Environmental problems are becoming increasingly serious and transnational in nature as they involve more than one country in terms of being responsible for the problem, dealing with its impact, and ultimately providing solutions.
Loss of forest and woodland in the period 1700-1980 is estimated at one fifth, down from 47 percent of the global area in 1700 to 38 percent in 1980. From 1990 to 1995, 65 million hectares of forest were lost. One could list the thousands of species that will not be knowable by future generations because they will have been systematically wiped from the earth's surface. Since 1600 extinction has occurred at 50 to 100 times the average estimated natural rate. Furthermore, the extinction rate is expected to rise between 1,000 and 10,000 times the natural rate.
Since 1960, the population doubled, and even though the rate of population growth has begun to slow, the increase from 6 billion to 7 billion will take eleven years. Within a half-century thereafter the number of people on Earth, each potentially a protector of the environment but each a consumer, each making an environmental impact, will be around 10 billion. The fastest-growing regions include parts of Africa that have the least developed environmental management systems.
189
“Sustainable Management and Development of Mountainous and Island Areas”

Acid rain is now found in many regions of the world. Energy-demand projections linked to economic development indicate an ever-increasing use of fossil fuels, with concomitant environmental challenges. Several regions continue to experience the accumulation of radioactive waste and the effects of past radioactive spills. Long-range transport of a variety of pollutants threatens areas once considered pristine, including the planet's poles [8].
Scientists have known for years that a group of chemicals – the chlorofluorocarbons (CFCs) used in air conditioners, refrigerators, Styrofoam containers, and many other applications – decomposes ozone. Many refused to take the threat to the upper atmosphere seriously, however, until a giant hole in the ozone layer, which opens up a few months every year, was discovered over Antarctica. Scientists were shocked to discover how rapidly the ozone layer has been thinning over the rest of the world as well. Increased ultraviolet radiation, due to ozone depletion, causes skin cancer, cataracts and other eye problems, suppression of the immune system, harm to animals, and a decrease in crop yields.
Of all the hazards of air pollution, perhaps the greatest potential threat comes from what is known as the greenhouse effect. The build up of gases from the burning of various fuels and other human activities is changing the composition of the atmosphere. These gases are holding in more of the energy that comes to earth from the sun and are thereby raising the air temperature like the greenhouse of an orchid grower. Although there is a great deal of controversy about the subject, many scientists predict that the rises in global temperature would melt much of the polar ice caps, raise sea levels, and push the oceans up over low-lying land around the world. Other areas will become arid and there will be movements of big segments of populations with all the political, economic and social consequences that such an event entails.
Given the growing importance of the problems described above and the fact that human choices for the planet’s sustainable management and development may change [11] then one would need information on
current views on the subject. In this respect, questionnaires may help all the responsible bodies to collect and assess data on opinions, attitudes and preferences of the population [1]. The aim of this paper is to assess the views of the students of the Department of Forestry and Management of the Environment and Natural Resources of the University of Thrace, Greece, regarding seven global environmental problems and, in particular, disposal of nuclear waste, ozone depletion, greenhouse effect, deforestation, acid rain, loss of biodiversity and overpopulation.
2. Research methodology
This research was carried out at the Department of Forestry and Management of the Environment and Natural Resources, Democritus University of Thrace, Orestiada. Due to the importance timing has for the carrying out of research [2], this research was carried out during the examination periods of June and September 2005 and included the students who participated in the examination of at least one course, that is the active students of the department. Active students are those who participate in the examinations and not those who have completed the registration process. At the time this research was carried out the registered students of the department were 391 while those who participated in the research that is, the active students, were 297.
The research was carried out through the use of self-management questionnaires. The questionnaires were given to each student in person before his / her examination. After explaining the aims of the research and giving instructions as to how to complete the questionnaire, the students were left free to answer and return the questionnaires as they pleased. Generally, there were no problems with student participation in the process. The few who neglected to complete the questionnaire were personally invited to do so (through announcements in the departmental notice-board or phone calls). The time required for the completion of the questionnaire was 10 to 15 minutes. The technique of collecting data through self-management questionnaires ensures high response rates, sampling precision and limits
190
“Sustainable Management and Development of Mountainous and Island Areas”
the dangers of the interviewees being influenced by the interviewer [10]. The students who at the time of the research were just starting their studies were approached in their classrooms shortly before commencement of teaching.
All the questions together constitute a multi-theme variable to be tested through reliability analysis. Evaluating the reliability of any measuring procedure depends on defining the degree of variance in the ranking given by the respondents. This can be attributed to real differences and inconsistencies in the measuring process [10], [7].
In particular, in order to determine the internal reliability of a questionnaire [3], that is to find out if the data have the tendency to measure the same thing [5] the co-efficient alpha is used (or a-Cronbach co-efficient). If the co-efficient alpha has value 0.70 or bigger is regarded satisfactory [5], while if the value is bigger than 0.80 then the co-efficient alpha is regarded very satisfactory. In practice, however, reliability co-efficients are accepted even if they have lower value, and, in particular, no lower than 0.60.
The testing must be reliable in order to be useful. However, the testing must not only be reliable, it must also be credible, something which is achieved through factor analysis [10].
Factor analysis is a statistical method aiming at discovering the existence of factors which are common in a group of variables [9]. It is more of an effort to interpret structure rather than variability [6]. The goal of factor analysis is to reproduce in the highest degree possible the correlations between variables, using the smallest possible number of factors and lead to a solution which can be easily interpreted [10].
Also, this paper used the method of principal components. The selection of the factors is a dynamic process [6]. In particular, this paper used the variance percentage which can be explained, leading us to the selection of two factors.
In addition, this paper made use of the rotation sums of squared loadings in accordance to Kaiser’s method [4]. Finally, aim of this paper is to find if there are some factors which can be used to explain the correlations among the variables of our date
and attempt an interpretation of these factors (if it can be done). According to [3] the variables which “belong” to each factor are those for which the co-efficients in the rotated component matrix in which factor burdens appear, after rotation, are bigger than 0.5. The analysis of our data was carried out through the use of SPSS.
3. Results
3.1 Descriptive Statistical Analysis
The seven international environmental problems were assessed by the students of the Department of Forestry and Management of the Environment and Natural Resources according to the extent each problem contributes to the destruction of the environment (table 1). All the students, with overall means 8.58, believe that the most serious problem faced by the planet is the disposal of nuclear waste. Next come ozone depletion and the greenhouse effect with overall means 8.34 and 8.22 respectively. Following in order of importance are deforestation (mostly tropical deforestation) with overall means 7.99 and acid rain with overall means 7.99. Less concern cause the loss of biodiversity and overpopulation with overall means 7.19 and 6.56 respectively.
The examination of table 1 reveals that students in different years of study rank differently the environmental problems in question. Table 1 makes it clear that 4th and 5th year students become stricter in their judgment without, however, significant changes in the ranking order of the problems.
3.2 Reliability Analysis
The correlation matrix of the problems of the multiple-theme variable (table 2) shows that there are lower value correlations between the problems “overpopulation” and “nuclear waste disposal” (r = 0.1839) while the highest value correlation (r = 0.7351) is noted between the problems “greenhouse effect” and “ozone depletion”.
191
“Sustainable Management and Development of Mountainous and Island Areas”

Table 1. Assessment of Global Environmental Problems by Forestry Students. 1o year 2o year 3o year 4o year 5o year Total
Number 54 50 49 46 41 57 297
Ment 5.78 6.46 6.21 6.87 7.07 7.05 6.562.455 2.418 2.760 1.881 2.229 2.082 2.353
Ment 8.15 7.80 8.15 8.59 8.12 8.47 8.222.105 2.365 1.557 1.326 1.778 1.616 1.836
Ment 8.35 8.42 8.17 8.54 8.02 8.37 8.322.364 2.120 2.014 1.425 2.230 1.599 1.973
Ment 7.13 7.48 7.29 7.43 7.49 7.37 7.362.741 1.876 1.529 1.797 1.748 1.988 1.995
Ment 7.70 8.16 7.31 8.17 8.66 8.07 7.992.295 1.658 2.460 1.539 1.697 1.741 1.964
Ment 7.06 7.16 6.79 6.91 8.05 7.30 7.192.543 2.244 1.786 2.127 1.843 2.212 2.175
Ment 8.37 8.42 8.33 8.80 8.80 8.81 8.582.077 2.269 2.056 1.485 1.750 1.540 1.885
Overpopulation
Global Environmental Problems
Greenhouse effect
Loss of biodiversity
Ozone depletion
Std.Dev.
Nuclear waste disposal
Acid rain
Deforestation Std.Dev.
Std.Dev.
Std.Dev.
New entr.
Std.Dev.
Std.Dev.
Std.Dev.
Regarding statistics for scale (all the problems) the overall mean is 54.22 with standard deviation 9.85, while the per item mean is 7.75 with range 2.03. The mean item variance is 4.13 with minimum 3.37 and maximum 5.54. The inter-item correlation is 0.40 while the values of the correlation components among the problems fluctuates from 0.18 to 0.74 while the relation max/min is 4.00.
Table 3 shows that the correlation of the problem “overpopulation” with the Corrected Item-Total Correlation of the rest of the problems is relatively low ( r = 0.3568). On the contrary, the problem “ozone depletion” (r = 0.6707) and “greenhouse effect” (r = 0.6698) in relation to the totality of the problems assessed have the highest correlation.
Also, the squared multiple R2 shows that the problems “ozone depletion” and “greenhouse effect” can be explained in relation to the rest of the problems in percentage 62% (R2 = 0.6181) and 59% (R2
= 0.5901) respectively, while the problem “overpopulation” is very low (16%).
The value of the reliability co-efficient alpha is statistically significant (0.8189). This constitutes a significant indication that the variables have the tendency to measure the same thing. Besides, the above statistical significance is supported from the statistically significant reliability co-efficients alpha after the deleting of a problem. In particular, after the deleting of a problem (any problem) no increase of the reliability co-efficient alpha can be achieved.
Table 2. Correlation matrix of the problems of the multiple-theme variable. 1 2 3 4 5 6 7
1 = Overpopulation 1.0000
2 = Greenhouse effect 0.3574 1.0000
3 = Ozone depletion 0.2498 0.7351 1.0000
4 = Acid rain 0.2664 0.5675 0.6278 1.0000
5 = Deforestation 0.2473 0.3906 0.4187 0.4116 1.0000
6 = Loss of biodiversity 0.2823 0.3537 0.3907 0.4394 0.5874 1.0000
7 = Nuclear waste disposal 0.1839 0.3984 0.4161 0.4265 0.3719 0.3495 1.0000
192
“Sustainable Management and Development of Mountainous and Island Areas”

Table 3. Averages, variances, and alpha coefficients, correlation coefficients with other subjects and multiple definition, on a scale level.
Variable Scale Mean if Item Deleted
Scale Variance if
Item Deleted
Corrected Item-Total Correlation
Squared Multiple
Correlation
Alpha if ItemDeleted
Overpopulation 47.6655 76.7861 0.3568 0.1623 0.8345
Greenhouse effect 46.0068 72.6983 0.6698 0.5901 0.7782
Ozone depletion 45.9020 70.8616 0.6707 0.6181 0.7762
Acid rain 46.8649 71.2088 0.6489 0.4741 0.7797
Deforestation 46.2297 73.8318 0.5732 0.4071 0.7926
Loss of biodiversity 47.0304 71.5347 0.5644 0.4089 0.7942
Nuclear waste disposal 45.6385 77.1740 0.4925 0.2614 0.8055
3.3 Factor Analysis
The examination of the correlation matrix (table 2) indicates that the correlations between the variables per pair are satisfactory. In all cases, with a few exceptions, there are high values in the correlation coefficients.
The value of the Keser-Meyer-Olkin (KMO) measure is 0.822. Although, the KMO measure has to be bigger than 0.80, nevertheless, values higher than 0.60 are permissible [9]. Also, as expected, the Bartlett’s Test of Sphericity rejects the zero hypothesis that the correlation is unitary. Similarly, the partial correlation coefficients between the two variables in each pair are relatively low. All of the above show that our data can be used for factor analysis.
However, before the application of factor analysis, we need to investigate if all the variables can be used in the model. The
measure of sampling adequacy for the variables used have values ranging from high to very high, which support the view that the factor analysis model we used is acceptable. Also, the squared multiple R2
have relatively high values (from 0.240 to 0.801). Although, the variable referring to the problem of “overpopulation” seems to have a minor relationship with the other variables, nevertheless, it was included in the group of variables.
The variance percentage as explained from the two variables selected is 62.8% (table 4). The second column shows the variance percentage attributed to each factor, while the third column shows the variance percentage attributed to each factor after rotation.
Table 5 shows factor burdens before and after rotation. The bigger the burden of a variable after rotation in each factor, the bigger the responsibility of this factor for the total variance in the variable we study.
Table 4. Information on the factors extracted.
Tota
l
% o
f Var
ianc
e
Cum
ulat
ive
%
Tota
l
% o
f Var
ianc
e
Cum
ulat
ive
%
Tota
l
% o
f Var
ianc
e
Cum
ulat
ive
%
1 3.4853 49.7907 49.7907 3.4853 49.7907 49.7907 2.4812 35.4451 35.4451
2 0.9086 12.9793 62.7700 0.9086 12.9793 62.7700 1.9127 27.3249 62.7700
3 0.8573 12.2476 75.0176
4 0.6538 9.3403 84.3579
5 0.4623 6.6045 90.9624
6 0.3854 5.5053 96.4677
7 0.2473 3.5323 100.0000
Com
pone
nt
Initial EigenvaluesSums of Squared Loadings
Before the rotation Afterwards the rotation
193
“Sustainable Management and Development of Mountainous and Island Areas”

Table 5. Table of factor burdens, before and after rotation.
1 2 1 2
Overpopulation 0.474 0.123 0.293 0.392
Greenhouse effect 0.795 -0.390 0.865 0.192
Ozone depletion 0.812 -0.377 0.869 0.212
Acid rain 0.783 -0.208 0.741 0.326
Deforestation 0.696 0.503 0.230 0.827
Loss of biodiversity 0.687 0.550 0.193 0.859
Nuclear waste disposal 0.633 -0.011 0.501 0.387
Variable Before the rotation Afterwards the rotation
Factor burdens
The variables which “belong” to each factor are those for which the burden (columns 1, 2) is bigger (higher than 0.5) in the particular factor. In the first factor belong the factors “greenhouse effect”, “ozone depletion”, “acid rain” and “disposal of nuclear waste”. This factor can be called “problems which are consequences of industrial-economic development”. The second factor titled “no respect by humans of the wealth of nature” includes the variables “deforestation” and “loss of biodiversity”. The above two problems constitute a significant part of the curriculum of the Department of Forestry and it is, therefore, logical that they are interrelated. The variable “overpopulation” is not included in a group, which is something that leads us to the conclusion that the students do not connect the problem of overpopulation with the problems caused by industrial-economic development or with the lack of respect of humans towards nature. This makes it obvious that the problem of overpopulation is not raised the way it should in the teaching / learning process.
The “problems which are consequences of the industrial-economic development” can be confronted by decreasing the pollutants released into the environment, improving the methods of production and thus reducing waste, increasing the life-span of products as well as promoting the recycling of these products and by conserving resources and energy.
The second factor, that is, “no respect by humans of the wealth of nature”, concerns mainly the developing (poor) countries which overexploit their natural resources in their effort to achieve development.
However, since the protection of earth is a duty of every human being, then a possible solution to the problem could be a more just distribution of the wealth the planet offers.
4. Conclusions
The students of the Department of Forestry and Management of the Environment and Natural Resources at the University of Thrace, Greece, were asked to assess in a scale from 1 to 10 seven global environmental problems. These problems were the disposal of nuclear waste, the greenhouse effect, ozone depletion, acid rain, loss of biodiversity, deforestation and overpopulation.
In their ranking of the above international environmental problems the students were particularly sensitive in the problems related to industrial development. In particular, the students think that the most important environmental problem is the disposal of nuclear waste. Next come the problem of the greenhouse effect and ozone depletion. The problems of overpopulation, loss of biodiversity and deforestation are considered less important.
As students advance in their years of study and acquire new knowledge and skills they become stricter in their assessment of the seven environmental problems. There is, however, no significant alteration in the order of importance of the particular problems. The low grades given to the problem of overpopulation shows that this particular subject is not raised the way it should in the teaching / learning process.
The use of reliability analysis and, in particular, the high value of the co-efficient
194
“Sustainable Management and Development of Mountainous and Island Areas”

alpha, shows that the components of the multi-theme variable have the tendency to measure the same thing. In addition, with the help of factor analysis and the use of the two factor solution this paper attempted to interpret correlations among the variables. The first factor called “problems which are consequences of industrial economic development” included the variables “greenhouse effect”, “ozone depletion”, “acid rain” and “disposal of nuclear waste”, while the second factor called “lack of respect by humans of the wealth of nature” included the variables “deforestation” and “loss of biodiversity”. The variable “overpopulation” is not included in a group.
The first group comprises of problems which are a consequence of industrialization with their source being the developed world. The problems included in the second factor are characteristic of developing countries which overexploit their natural resources (their forests) in order to achieve development. However, since the protection of the earth is a duty of every human being, then a possible solution to the problem could be a more just distribution of the wealth the planet offers.
5. References
[1] Butler, L. M. and Robert, E. H. (reprinted 1993). “Coping with change: Community needs assessment techniques in (s)” WREP 44, Corvallis OR: Western Rural Development Center.
[2] Daoutopoulos, G.A., 1994. Social Research Methodology in Agricultural Areas, Second Edition Thessaloniki.
[3] Frangos C. . 2004. Market Research Methodology and Data Analysis with the application of the Statistical Package SPSS FOR WINDOWS. “Interbooks” Publications.
[4] Harman H. H., 1976. Modern Factor Analysis. Chicago: The University of Chicago Press.
[5] Howitt D. and Gramer D. 2003. Statistics with SPSS 11 and Windows. Klidarithmos.
[6] Karlis D., 2005. Multi-variable Statistical Analysis. Stamoulis.
[7] Philias ., Pappas P., Antonopoulos ., Zarnaris ., Maganara . Meimaris
., Nikolakopoulos ., Papachristos .Perantzakis ., Samson . and Psihogios ., 2000. Introduction to the Methodology and Techniques of Social Research, Gutenberg Social Library, Athens.
[8] Seinfeld J. and Pandis S., 1998. Atmospheric Chemistry and Physics- From air pollution to climatic change. John Wiley and Sons, Inc.
[9] Sharma S. 1996. Applied Multivariate Techniques. John Wiley & Sons, Inc.Canada.
[10] Siardos G. K., 1999. Research Methodology in Agricultural Sociology. Thessaloniki: Zitis.
[11] Van Kooten, G. C. and Vertinsky, I. 1999. “Introduction: Framework for Forest Policy Comparisons”, Forest Policy.
195
“Sustainable Management and Development of Mountainous and Island Areas”
Forest fires in the islands of Northern Sporades during the years 1965 - 2004
P. Karanikola1, Tampakis S.1, Tampakis .1 and Karantoni M.1
1 Department of Forestry and Management of the Environment and Natural Resources, Democritus University of Thrace, Greece
Abstract. In the present study the number of forest fires, that occurred during the period 1965 – 2004, in the area of Northern Sporades (Skiathos, Skopelos, Alonnisos), is presented and at the same time the month in which the fire broke out, the cause that brought the fire about and the extent of the burnt forest areas, are recorded. This presentation allows the diachronic analysis of this phenomenon for each island separately. The number of forest fires in the island of Skopelos remains more or less the same, in Skiathos fires broke out mainly during the decade 1985-1994, whereas in Alonnisos the number of fires diminishes steadily.
As far as the burnt areas are concerned, quadruple areas are burnt in the island of Skiathos altogether in relation to the two other islands, with the phenomenon’s intensity mainly during the last decade. During the decade 1985-1994 there is an increase of the burnt areas in Skopelos and Alonnisos, whereas these last years there is a significant decrease of the burnt areas .
Forest fires in Northern Sporades do not arise only during the inter-fire period, but are also distributed round the year. Most forest fires (14.8%) break out in the area of Northern Sporades in August and burn 24.2% of the fired surface, whereas most areas are burnt in April (30%) and form 8.4% of the fires. To be more specific for each island separately, in Alonnisos significant areas are burnt in October (63.1%), in Skopelos in September (28.1%) and in Skiathos in April (43.5%).
With reference to the causes of the set fires it follows that the main reason in both Alonnisos (68.5%) and Skopelos (43.1%) is negligence; in the latter a significant number of fires are due to thunderbolts (25.5%). In Skiathos most fires are due to unspecified reasons (64.5%) and less to negligence
(29.0%). With the aid of loglinear analysis we are able to establish that Skiathos is diversified in relation to the other two islands as far as investigation of causes is concerned, hence in Skiathos most fires are characterized as being caused by unspecified reason in contrast to Skopelos and Alonnisos where better investigation of the causes is carried out. Furthermore, fire causes are better investigated and characterized as specified during the non - fire period, compared to the fires during the inter-fire period which are characterized as provoked by unspecified reason.
Keywords: Forest fires, Northern Sporades, fire statistics, loglinear analysis.
1. Introduction
The island complex of Northern Sporades (Skiathos, Skopelos and Alonnisos) stretches eastwards of the Prefecture of Magnesia and forms a unified complex, given that their inbetween distance is very small (average distance Skiathos – Skopelos 8 km and Skopelos – Alonnisos 10km).
These islands present a high percentage of forest coverage, covered in their majority by Pinus halepensis, which either form pure pinewoods with chaparral undergrowth, or in small or high percentage mix with the rural arboricultural cultivations. In Skopelos and Alonnisos the forests in their majority belong to the state or are in private possession, whereas in Skiathos they belong to the municipality. In certain higher positions the forest growing vegetation is degrading due to overgrazing, revealing this way that cattle-breeding was very intense in these certain islands.
196
The vegetation composition and dry thermal environment combined with the changes of socioeconomical factors – mainly due to the islands’ tourist development – may be a factor in increasing the risk for the outbreak and expansion of a fire. Moreover the phenomenon’s intensity should be attributed to the high tourist traveling season during summer months (mainly in Skiathos and Skopelos), the existence of single interspersed residences and tourist lodgings, the continuous growth of road network, the abandonment of arboricultural cultivations and therefore the expansion of bushes, creating this way unified forest vert and finally the reduction of cattle-breeding (sheep and goat breeding) which increases the combustible material in our forest ecosystems [4], [9]. The present study aims at presenting and analyzing the forest fires’ phenomenon diachronically (1965-2004) in the islands of Northern Sporades and searching for diversifications among these islands by distributing the fires per annum, month and reason for each island separately, in order for useful conclusions to be drawn – referring to the fireproof protection measures that should be taken in the future.
2. Research Method
All statistical data come from the Forest Inspection of Skopelos. Although from 1998 and on, Forest Fire Fighting was by law devolved from the Forest Service to the Fire Brigade all data recording that refer to forest fires fairly continue to be recorded by the same service, in order for the same recording mode to be ensured and for the data to be exploited accordingly.
Tables were created for better understanding of the data, whereas for the variables «island», «fire reason» «burnt area» frequency analysis for more than two criteria was carried out. The hierarchical loglinear analysis was applied (Loglinear Analysis). First, the size of the expected frequencies in the crossing table is examined [7]. Large number of the expected frequencies (bigger than 20%) with rate lower than 5 – but not lower than 1, run the risk of leading to the power loss of the applied analysis [8]. This examination is carried out with control of double-sided crossing tables through the SPSS
program [6], [2]. The variables’ classes were grouped in order to satisfy the above mentioned acceptances.
The research data are classified in accordance with 3 criteria and express frequencies. The assumption Ho is:Ho = full independence among these 3 criteria It is unlikely for this assumption to get accepted, but the analysis will show the precise level of various interrelations and which will be included in a model that expresses the data interrelations [2]. For the estimation of the correspondence degree between model and data statistics controls of optimum adjustment are applied. Statistical significance shows that the examined model does not represent the observed frequencies perfectly, whereas the statistical non-significance means that the model under examination is adjusted to the observed frequencies respectively. Control X2
is the applied statistical control [3]. Loglinear analysis forms a special case of
multiple regression analysis according to which one or more variables relate to others, in the framework of a multidimensional crossing table. During this analysis, independent are considered to be all homogrades and dependent any recess of the crossing table [7]. Finally in order to interpret the impacts on the model of optimum adjustment we present the data in the form of one or two – dimensional table [3].
3. Results
Forest fires and burnt areas of the period 1965-2004 per annum for the three islands of Northern Sporades are presented in Table 1. We note that in Alonnisos the last forty years more fires (73) in relation to Skopelos (51) and especially in Skiathos (31) broke out altogether, whereas on the contrary in Skiathos larger areas (10,558,000.28 sq.m.) were burnt compared to Skopelos (2,576,000.47 sq.m.) and Alonnisos (2,966,000.48 sq.m.) and, furthermore, the corresponding burnt area per fire is much greater in Skiathos (340,000.59 sq.m.) than in Skopelos (50,000.52 sq.m.) and Alonnisos (40,000.64 sq.m.).
For a full comprehension of diachronic fire development, fires were split in decades (Table 1) and the following are to be noted: a) in Skopelos the number of forest fires throughout this period remains per decade more or less the same, whereas burnt areas present small
197
“Sustainable Management and Development of Mountainous and Island Areas”

fluctuation and only during the decade from 1985 – 1994 they almost doubled and in the last decade from 1995 – 2004 a decrease of the both forest fires and burnt areas was observed. b) Likewise in Skiathos the fire phenomenon gets more intense during the decade 1985 – 1994. During the last decade (1995- 2004) the existence of two big fires, in 1999 and 2000 respectively, caused the destruction of more than fifty percent of the areas that have been burned the last forty years and made a significant diversification for the island. c) In Alonnisos on the contrary, the number of fires get diminished in the course of the decades, whereas burnt areas were increased during the decade 1985 – 1994. d) We can say that in the total of the three islands, although the number of forest fires does not present remarkable changes, we do have a significant increase of burnt areas with a specific peak period from 1985 – 1994. Furthermore the last decade we have a relevant decline of the fires’ number, which is considered as anticipated. Only in Skiathos we have an increase of burnt areas, due to two big fires in 1999 and 2000 respectively.
By distributing forest fires (number and burnt area) according to their outbreak month (Table 2) we see that during summer months in Sporades more than one third of the forest fires (36.7%) occur, with the following hierarchy: August 14.8%, July 11.6% and September 10.3%. If we add to the above percentages the fires of the month June 9.0%, October 7.7% and May 5.2%, then during the formal inter-fire period (1st of May to 31st of October) 58.6% of the total fires’ number occur in Sporades, whereas 84.15% of the total fires according to Dimitrakopoulos [1] and 81.9% according to Markalas and Pantelis [5] break out countrywide.
198
“Sustainable Management and Development of Mountainous and Island Areas”

Table 1. Diachronic progress of forest fires in the islands of Sporades during the period 1965 – 2004.
Number Number Number Number
1965 1 1.00 1 1.00 2 23.00 4 25.001966 2 500.60 1 1.00 4 44.50 7 546.101967 3 19.50 0 0.00 2 20.00 5 39.501968 1 1.00 0 0.00 7 122.50 8 123.501969 0 0.00 0 0.00 2 22.00 2 22.001970 2 3.00 0 0.00 2 14.00 4 17.001971 0 0.00 0 0.00 3 12.00 3 12.001972 0 0.00 2 0.90 0 0.00 2 0.901973 1 100.00 0 0.00 2 9.00 3 109.001974 1 8.00 0 0.00 4 250.00 5 258.00
1965-74 11 633.10 4 2.90 28 517.00 43 1153.001975 1 1.00 0 0.00 4 49.10 5 50.101976 0 0.00 1 35.00 3 5.90 4 40.901977 1 1.20 3 1104.00 4 321.50 8 1426.701978 4 310.05 0 0.00 1 50.00 5 360.051979 1 10.00 0 0.00 0 0.00 1 10.001980 0 0.00 0 0.00 0 0.00 0 0.001981 1 0.50 0 0.00 3 11.34 4 11.841982 2 3.05 2 505.20 4 11.44 8 519.691983 4 57.49 1 0.94 6 30.19 11 88.621984 0 0.00 0 0.00 1 0.19 1 0.19
1975-84 14 383.29 7 1645.14 26 479.65 47 2508.081985 1 5.36 1 0.99 4 6.77 6 13.121986 0 0.00 3 1985.65 3 175.39 6 2161.041987 2 582.03 0 0.00 3 3.39 5 585.421988 2 10.20 0 0.00 1 2.00 3 12.201989 4 59.74 3 3.80 0 0.00 7 63.541990 1 0.90 6 38.54 0 0.00 7 39.441991 1 250.00 1 20.00 0 0.00 2 270.001992 1 120.00 1 9.26 2 1625.67 4 1754.921993 2 12.76 2 1460.30 1 0.03 5 1473.091994 1 18.13 0 0.00 1 51.50 2 69.63
1985-94 15 1059.11 17 3518.54 15 1864.75 471995 1 17.10 0 0.00 2 67.29 3 84.391996 0 0.00 0 0.00 2 37.80 2 37.801997 2 102.80 0 0.00 0 0.00 2 102.801998 3 178.30 0 0.00 0 0.00 3 178.301999 0 0.00 1 2608.00 0 0.00 1 2608.002000 0 0.00 1 2783.70 0 0.00 1 2783.702001 2 192.10 0 0.00 0 0.00 2 192.102002 2 8.46 1 0.00 0 0.00 3 8.462003 0 0.00 0 0.00 0 0.00 0 0.002004 1 2.21 0 0.00 0 0.00 1 2.21
1995-04 11 500.96 3 5391.70 4 105.09 18 5997.75Total 51 2576.47 31 10558.28 73 2966.48 155 16101.23Mean 1.28 64.41 0.78 263.96 1.82 74.17 3.88 402.53
s 1.154 133.410 1.250 703.767 1.824 260.819 2.524 739.819Burnt area per fire
Mean 50.52 340.59 40.64 103.88s 114.383 783.700 193.189 394.286
6442.40
Total
Burnt area (sq.m.)
Burnt area (sq.m.)
Alonnisos
Burnt area (sq.m.)
Burnt area (sq.m.)
Skopelos Skiathos
Moreover we note in Table 2 that the fires which break out during summer months in Sporades burn only 38.3% of the areas and during the whole inter-fire period the total of 56.4% of the total fired area gets burned contrary to the rest of Greece, where during
this period we have almost the total (96.36%) of burnt areas [1]. We should also stress the extent of forest areas that get burned during October in Alonnisos 1,872.000.53 sq.m. (percentage 63.1%), September and August in Skopelos with 724,000.69 sq.m. and
199
“Sustainable Management and Development of Mountainous and Island Areas”

700,000.90 sq.m. respectively (percentage 28.1% and 27.2%). In Skiathos three fires in April have destroyed 4,588,000.5 sq.m. (43.5%), three fires in August 2,776,000.29 sq.m. (26.3%) and two fires in January 1,460,000.20 sq.m. (13.8%) respectively.
As far as the period during which disastrous fires break out, we see a differentiation between Skiathos and other islands. Besides August the subsequent months are also disastrous for Skopelos and Alonnisos, a period of time when the harvest preparation of olive-crops and burning of the cultivation’s organic remains is carried out. In contrast to Skiathos, where an abandonment of
the agricultural activities is observed, cleaning and burning of greens is usually carried out in the beginning of the tourist period. Furthermore the growing price value of land, due to tourist development, motivates the illegal land reclamation and the necessity of burning the remains that could compose an indication of this illegal act.
Forest fires do differentiate from month to month as to their outbreak cause. It is “rational” for an arsonist, to turn to this obnoxious act during the peak period of this phenomenon because of the publicity it generates through the mass media.
Table 2. Distribution of fires and burnt area during the twelve months of a year in the slands of Sporades, for the years 1965 – 2004.
January February March AprilMay June July August September October November December
January 5.9% 4.1% 6.5% 13.8% 6.8% 3.4% 6.5% 10.3%February 9.8% 2.0% 6.5% 0.1% 2.7% 1.4% 5.8% 0.7%March 9.8% 0.6% 9.7% 0.1% 6.8% 0.9% 8.4% 0.3%April 2.0% 0.1% 9.7% 43.5% 12.3% 8.1% 8.4% 30.0%May 3.9% 7.5% 6.5% 0.0% 5.5% 2.0% 5.2% 1.6%June 11.8% 6.1% 16.1% 5.0% 4.1% 0.2% 9.0% 4.3%July 9.8% 7.6% 25.8% 10.9% 6.8% 3.3% 11.6% 9.0%August 13.7% 27.2% 9.7% 26.3% 17.8% 14.0% 14.8% 24.2%September 7.8% 28.1% 0.0% 0.0% 16.4% 3.1% 10.3% 5.1%October 5.9% 3.2% 3.2% 0.0% 11.0% 63.1% 7.7% 12.2%November 13.7% 12.8% 3.2% 0.1% 4.1% 0.2% 7.1% 2.2%December 5.9% 0.7% 3.2% 0.1% 5.5% 0.3% 5.2% 0.2%
TotalBurnt area
(sq.m.)Burnt area
(sq.m.)Burnt area
(sq.m.)Burnt area
(sq.m.)NumberMonth
Skopelos Skiathos Alonnisos
Number NumberNumber
1959.20348.1537.72
Perc
enta
ge p
ropo
rtion
s
10.254.47
89.26
82.63328.88
1665.90104.7350.22
4829.48
1872.53
231612
816.47415.9091.78
255.52690.24
1450.523893.09
81418
100.5342.0027.12
239.4859.924.82
97.702776.29
0.00
105.17
4.05
2.50528.90
1156.10
1460.2010.307.38
4588.50
52.4315.72
Abso
lute
pric
es
4
73
1.50193.10156.52196.73700.90724.69
1114.8018.21
01
3
3
5512657
22332583
11
52594351312834
1091313
Fires that break out in the non – fire period, find the competent authorities relaxed resulting to both slow perception and reaction to the fires and areas’ burning. It is therefore important to extend fireproof protection measures for the protection of the natural forest wealth of the islands, for the two subsequent months in Skopelos and Alonnisos and for the two preceding ones in Skiathos. Necessary are also: sensitization of local residents relating to the fire risk due to negligence (sprigs’ burning) in combination
with the controlled program of remains’ burning (determination of the days during which burning can be carried out –in September also) as well as the guarding of forest areas round the year.
In Table 3 the comparison of statistical data, between number and burnt area with the fire causes in the islands of Northern Sporades, is cited. According to this table, the majority of fires are due to negligence in Alonnisos in a percentage of 68.5%, the corresponding burnt area though comes up to only 15.8% of the
200
“Sustainable Management and Development of Mountainous and Island Areas”

total burnt area; to unspecified reasons is 24.7% of the fire numbers, a number which corresponds to 83.9% of the burnt area. In Skopelos likewise 43.1% of the total fire numbers is due to negligence corresponding to 41.5% of the total burnt area, whereas the significant fire percentage of 25.5% is due to thunderbolts in the island, burning 33.1% of the burnt area. In Skiathos, on the contrary,
most of the fires (64.5%) are due to unspecified reasons that could not be determined by the competent service, burning down 99.7% of the total burnt area. This happened because there is no appropriate personnel for investigating the causes, or because the existing personnel is negligent and resorts to the easy solution of characterizing the causes as unspecified.
Table 3. Relation of fire numbers and burnt area per fire cause in the islands of Sporades, during the years 1965 – 2004.
Lightning Accidentally NegligenceUnspecifiedIntentions
Lightning 25.5% 33.1% 6.5% 0.0% 4.1% 0.0% 11.6% 5.3%Accidentally 3.9% 4.7% 0.0% 0.0% 0.0% 0.0% 1.3% 0.7%Negligence 43.1% 41.5% 29.0% 0.3% 68.5% 15.8% 52.3% 9.8%Unspecified 15.7% 8.4% 64.5% 99.7% 24.7% 83.9% 29.7% 82.2%Intentions 11.8% 12.3% 0.0% 0.0% 2.7% 0.3% 5.2% 2.0%
13228.4110523.5432.94
325.830.00 2 7.77 818 2489.27 46
81
855.710 0.00 2 120.05
1571.230 0.00
50 468.609
6 318.07 08 215.60 20
Burnt area(sq.m.)
13 853.06 2 1.80 3 0.85 18
Skiathos Alonnisos Total
Number Burnt area(sq.m.) Number Burnt area
(sq.m.) Number Burnt area(sq.m.) Number
Abs
olut
e pr
ices
Per
.pro
porti
ons
CausesSkopelos
22 1069.702 120.05
We applied loglinear analysis, in our effort to investigate the existence of the causes’ differentiation for the fire period in the islands of Northern Sporades. Prior to the application of loglinear analysis we first examine the crossing table (Table 4) and observe that the anticipated frequencies lower than 5 are 2.4
and 4.8. Because their prices are not lower than 1 and their frequency is lower than 20% there exists no problem with low anticipated frequencies. That means that the assumption of full independency between these three criteria is incorrect.
Table 4. Cross-tabulation of the three variables.
Known UnspecifierCount 22 5 27Expected Count 17.1 9.9 27.0Count 5 14 19Expected Count 12.0 7.0 19.0Count 30 14 44Expected Count 27.9 16.1 44.0Count 57 33 90Expected Count 57.0 33.0 90.0Count 21 3 24Expected Count 19.2 4.6 24.0Count 6 6 12Expected Count 9.6 2.4 12.0Count 25 4 29Expected Count 23.2 5.8 29.0Count 52 13 65Expected Count 52.0 13.0 65.0
Total
Inter-fire period(1 May -
31 October)
No-fire period(1 November -
30 April)
Skopelos
Alonnisos
Skopelos
Alonnisos
Period
Total
Causes
Skiathos
Skiathos
Island
Total
It was established that with the application of the Hierarchical Loglinear Analysis
Program the most adequate pattern, after the term’s removal of the third degree interaction,
201
“Sustainable Management and Development of Mountainous and Island Areas”

is the one that includes both main impacts and interactions of the variables by two. The interaction is eliminated according to 3 criteria, because X2 of Pearson = 1.031 is in effect with probability (p) = 0.905 and 2 probability ratio = 1.028 with probability (p) = 0.906. All of the above are confirmed by the “nullification” controls of the impacts of k terms and terms of higher degree, as well as the “nullification” controls of k terms impacts [6]. As it is shown
in Table 5 there exists no interaction according to 3 criteria, since the probability rate is (p) = 0.8157. There exists though an interaction according to 2 criteria (since the probability (p) < 0.05). In the two variable pairs (Island – Fire Cause and Fire Cause – Period) there exists a significant statistical interaction. The observed and anticipated frequencies in accordance with the hierarchical loglinear analysis are cited in Table 6.
Table 5. Nullity controls.
K DF Prob Prob Iteration
3 2 0.397 0.8200 0.407 0.8157 42 7 28.530 0.0002 30.329 0.0001 21 11 76.411 0.0000 76.406 0.0000 0
K DF Prob Prob Iteration
1 4 47.881 0.0000 46.077 0.0000 02 5 28.133 0.0000 29.922 0.0000 03 2 0.397 0.8200 0.407 0.8157 0
Tests that K-way and higher order effects are zero.
Tests that K-way effects are zero.
L.R. Chisq
L.R. Chisq
Pearson Chisq
Pearson Chisq
For the impacts’ interpretation, we should present the data in the form of two-dimensional tables (Crosstabs). With the aid of Table 7 we see that the island of Skiathos relates to the fires concerning the cause that brought the fire about and is characterized as unspecified, whereas in the other two islands (Skopelos and Alonnisos) the causes are known. In Table 8 we see that the fires caused by unspecified reason relate to the inter-fire period, namely these fires were broken out
during the period from the 1st of May to the 31st of October, whereas the fires of the non – fire period (1st of November to 30th of April) are characterized with one of the known causes. It therefore becomes obvious that the island of Skiathos is differentiated from the other two islands in the causes’ investigation and that the investigation by the Forest Inspection of Skopelos is better carried out during the non-fire period, when working pressure is less.
Table 6. Frequencies observed and forecasted based on the hierarchical loglinear analysis.
Known UnspecifierCount 22 5Expected Count 22.5 5.7Count 5 14Expected Count 5.8 14.3Count 30 14Expected Count 28.8 12.9Count 21 3Expected Count 20.5 2.3Count 6 6Expected Count 5.2 5.7Count 25 4Expected Count 26.2 5.1
Skopelos
Skiathos
Alonnisos
No-fire period(1 November -
30 April)Alonnisos
CausesIsland
Inter-fire period(1 May -
31 October)
Skopelos
Skiathos
Period
202
“Sustainable Management and Development of Mountainous and Island Areas”

Table 7. Cross-tabulation of the “island” and “causes of fire” variables.
Known UnspecifierCount 43 8 51Expected Count 35.9 15.1 51.0Residual 7.1 -7.1Count 11 20 31Expected Count 21.8 9.2 31.0Residual -10.8 10.8Count 55 18 73Expected Count 51.3 21.7 73.0Residual 3.7 -3.7Count 109 46 155Expected Count 109.0 46.0 155.0
Causes of fire
Total
TotalIsland
Skiathos
Skopelos
Alonnisos
Table 8. Cross-tabulation of the “cause of fire” and “period” variables.
Inter-fire No-fireCount 57 52 109Expected Count 63.3 45.7 109.0Residual -6.3 6.3Count 33 13 46Expected Count 26.7 19.3 46.0Residual 6.3 -6.3Count 90 65 155Expected Count 90.0 65.0 155.0
PeriodCauses of fire Total
Total
Known
Unspecifier
4. Conclusions – Suggestions
In the area of Northern Sporades during the period 1965 – 2004 the number of forest fires did not increase considerably, in contrast to burnt areas which were rapidly increased especially during the decade 1985 – 1994.
Alonnisos had most fires (73) compared to Skopelos (51) and Skiathos (31). The annual average burnt area though was much higher in Skiathos (263,000.96 sq.m.) compared to Alonnisos (74,000.17 sq.m.) and Skopelos (64,000.41 sq.m.), together with the average burnt area per fire, which for the island of Skiathos (340,000.59 sq.m.) is seven times higher compared to the other two islands, Skopelos (50,000.52 sq.m.) and Alonnisos (40,000.64 sq.m.). In Skiathos though we have a smaller number of fires, they do burn quadruple areas compared to the other two islands of Northern Sporades that are bigger in size. The last decade (1995-2004) in Skiathos we had two big fires in 1999 and 2000 respectively, with a destructed area that equals to half the area that was burnt in total in the last forty years.
Relating to the months during which most forest fires break out, we see that more than half (58.6%) occur during the enacted inter-fire period (1st of May – 31st of October), which burn 56.47% of the total burnt area. The extension of fireproof protection measures for the two subsequent months in Skopelos and Alonnisos and the two preceding ones in Skiathos is therefore fundamental. The sensitization of local residents relating to the fire risk due to negligence (sprigs’ burning) in combination with the controlled program of remains’ burning (determination of the days during which burning can be carried out –in September also) as well as the guarding of forest areas round the year would contribute immensely to the reduction of fires.
In Alonnisos a significant percentage of forest fires (68.5%) is due to negligence, which are responsible for only 15.8% of the total burnt area, whereas a smaller number of fires (24.7%) caused by unspecified reason burn much higher areas (83.9%). In Skopelos likewise 43.1% of the total fire numbers is due to negligence corresponding to 41.5% of the total burnt area, whereas the significant fire percentage of 25.5% is due to thunderbolts in
203
“Sustainable Management and Development of Mountainous and Island Areas”

the island, burning 33.1% of the burnt area. In Skiathos on the contrary most of the fires (64.5%) are due to unspecified reasons, burning down 99.7% of the total burnt area. We are led to the assumption that either in Skiathos there is no appropriate personnel for investigating the causes, or that the existing personnel is negligent.
The above are also confirmed by the application of the Hierarchical Loglinear Analysis, according to which there seems to exist a statistical interaction in the two variable pairs (Island – Fire Cause and Fire Cause – Period). The island of Skiathos relates to the fires concerning the cause that brought the fire about and is characterized as unspecified, whereas in the other two islands (Skopelos and Alonnisos) the causes are known. Fires caused by unspecified reason relate to the inter-fire period, whereas fires of the non - fire period are characterized as known causes. Due to the fact that the citizens’ number gets significantly increased during the summer season, the working volume that should be carried out by the personnel of the Forest Inspection of Skopelos gets respectively increased. Therefore it seems that the investigation of the fire causes is not top priority during this period and fires are easily characterized as being caused by unspecified reasons, which is not the case when working pressure is less (period from 1st of November to 30th of April).
Statistical data analysis reveals mistakes and omissions that took place in the past. When mistakes are recognized only then they can be corrected. The necessity of the uniform recording of the forest fires’ features therefore becomes obvious.
Nowadays, though the situation concerning the extinguishing carrier of forest fires is differentiated, the personnel’s employment by the Forest Service for the prevention of forest fires and protection in general is estimated as necessary, together with the employment of specialized personnel by the Fire Brigade for prompt extinguishing of forest fires, valid investigation of fire causes and recording of the features of forest fires in a uniform modus (that could be statistically exploited).
5. References
[1] Dimitrakopoulos ., 2004. Chronical Parameters of Forest Fires’ Outbreak in Greece during the period 1980 – 1997. Geotechnical Scientific Topics, line – Volume 15, Issue 1, pages 29 – 36.
[2] Frangos . ., 2004. Market Research Methodology and Data Analysis with the application of the Statistical Package SPSS FOR WINDOWS. “Interbooks” Publications.
[3] Howitt D. and Gramer D., 2003. Statistics with SPSS 11 and Windows. Klidarithmos.
[4] Karanikola P. and Tampakis S., 2003. Social Groups and Forest Fires. Minutes of 11th Forestry Convention, Olympia from 30th of September – 3rd of October 2003. Pag. 583 – 595.
[5] Markalas S. and Pantelis D., 1997. Forest Fires and Forest Areas in Greece from 1994. Aristotle University of Thessaloniki, Department of Forestry and Natural Environment, Lab. of Forest Protection, Paper No. 5/1997, Thessaloniki, 40 pages.
[6] Norusis Marija J., 1994. SPSS Advanced Statistics 6.1. Chicago: SPSS Inc.
[7] Siardos G. ., 1999. Multivariable Statistical Analysis Methods. Part One «Research in variables’ relations» Ziti Publications. Thessaloniki.
[8] Tabachick B. G. Fidell L. S., 1989. Using Multivariete Statistics 2nd ed., New York: Harper and Row.
[9] Tampakis S., Papageorgiou A., Karanikola P., Arabatzis G. and Tsantopoulos G., 2005. The forest fires in the Mediterranean from a policy point of view. New Medit, Mediterranean Journal of Economics, Agriculture, and Envi-ronment. Issue 3/2005, 47 - 51 p.
204
“Sustainable Management and Development of Mountainous and Island Areas”
Releasing Captive Brown Hare (Lepus europaeus) to the Wild – The Role of Predators
Ilias Karmiris
Laboratory of Forest Rangelands. 236. School of Forestry and Natural Department. 54124. Aristotle University of Thessaloniki. E-mail: [email protected]
Abstract. The purpose of this research was to investigate the survival ability of 16 captive reared brown hares which were released to a typical Mediterranean rangeland in central Macedonia. The animals were radio-collared and were monitored until their death. Hare carcasses were autopsied to determine mortality cause. Only 9 hares survived for more than 10 days and just 1 lived for about 2 months. The main mortality cause was predation by foxes (Vulpes vulpes) and beech marten (Martes foina). Releasing captive hares to the wild is an ineffective management practice, in cases where no control of predator populations has taken place.
Keywords: game management, mortality, predator, radiotelemetry, restocking, survival
1. Introduction
Rearing and releasing game animals to the wild are management practices which have been used in many hunting areas worldwide in order to increase game population levels [3]. In many cases, these practices have failed, primarily because of the inability of released animals to effectively avoid predators [4]. Only in few cases captive reared animals have been adapted to the wild and this has usually taken place in areas where predator population levels were generally low [13].
The brown hare (Lepus europaeus) is among the most important game species in Europe and other parts of the world [2]. Releasing captive-reared hares to the wild is generally an unsuccessful practice because hares fail to establish viable populations [2], [14]. The majority of researches concerning the ability of captive-reared hares to adapt to the wild have been conducted in intensively cultivated areas. The purpose of this research was to investigate the survival ability of 16 captive reared brown hares fitted with radio-transmitters on a day-to-
day-basis and to specify the causes of mortality after their release to a typical Mediterranean rangeland in central Macedonia. Estimates of hare survival after their releasing to the wild are essential to evaluate the effectiveness of restoration programs. Radio-telemetry can ensure the monitoring of animals with a minimum of disturbance and interference with the normal behaviour patterns of an animal [12].
2. Methods
The study area was a 200 ha rangeland located in the northern part of a low mountain range (160-360 m altitude) near the city of Thessaloniki in central Macedonia, Greece. This area was occupied by a Calabria pine (Pinusbrutia) forest, which was almost totally destroyed by a wild fire in summer of 1997. The experimental area, which was not affected by the fire, is dominated by stands of kermes oak (Quercus coccifera), less than 1 m height, intermingled with scattered patches (0.3 and 3 ha) of grasslands. Scattered scrubs, such as Jerusalem thorn (Paliurus spina cristi), Spanish broom (Spartium jungeum), dog rose (Rosa canina), hawthorn (Crataegus monogyna) and phryganic plants, such as pink rockrose (Cistus incanus), thorny burnet (Sarcopoterium spinosum) and asparagus (Asparagus acutifolius)also occur sporadically in these grasslands. The main herbaceous species in the study area are brusch grass (Chrysopogon gryllus), yellow bluestem (Dichanthium ischaemum), sheep’s fescue (Festuca valesiaca), Bermuda grass (Cynodon dactylon), star clover (Trifolium stellatum), hairy medick (Medicago polymorpha)and salad burnet (Sanguisorba minor). The main wild mammal species in the study area except brown hare, were fox (Vulpes vulpes), beech marten (Martes foina), weasel (Mustela nivalis), and badger (Meles meles). There is no farmland in the vicinity and hunting is not allowed.
205
“Sustainable Management and Development of Mountainous and Island Areas”

The climate in the study area is semiarid, with cold winters and hot dry summers. The average annual precipitation is 416 mm. The dry season expands from May to middle September. Soil is shallow of low productivity and heavily degraded.
In spring 2001, 16 brown hares (8 males and 8 females), which had been born and raised in captivity in cages in the University farm near the city of Thessaloniki, were released into the study area. The treated animals were marked with plastic ear tags, fitted with radio-transmitters and released into the study area (Table 1). Hares were released in the morning between 06.00 and 07.00. The released animals had a pre-releasing period for 7 days in two fencing areas (32 m2
each) with natural vegetation near their cages. Additionally, during the pre-releasing week hares were, on a daily basis, supplementing with natural vegetation from the study area in order for the animals to gradually get used to feeding themselves using natural foods. Then, the hares were monitored from the release date until their death. Transportation and release were done following the guidelines of the American Society of Mammalogists [1].
Table 1. Data on sex, hare body weight, transmitter weight, day of release and survival for 16 hares monitored in the study area during spring 2001.
*1 : male, F: female *2 including transmitter weight
The causes of death were identified by examination of hare carcasses found in the field [7]. When possible, predators were identified by tracks, hair and scats [5], [7]. The distinction between predation and scavenging was based on: (i) the hare carcasses had marks of aggression in the neck or on the radio-collar and (ii) the
aggression was directly observed. The estimation of time of death was done within 24 hours after the kill. The location of hares was determined using 2 portable recievers (RX-81) with hand-held, 3-element Yagi antenna [12].
The distance of the death point from the place of release was calculated as an index of the distribution of hares into the study area [2], [6]. Comparisons between males and females in survival time and distance of the place of release were done using Mann-Whitney U-test. The main cause of death was evaluated with 2
goodness-of-fit-test. All statistical tests were performed at a =
0.05, according to Siegel and Castellan [16].
3. Results
All released hares died within 2 months after release. More specifically, 7 hares (43.75%) died within 10 days after release, 3 hares (18.75%) died between 11 and 20 days after release, 1 hare (6.25%) lived for 21 to 30 days and 2 hares (12.5%) lived over 30 days. The average survival time was 14.5 days (SD = 16.05). The survival time between males ( = 4, SD = 2.94, n = 4) and females ( = 3, S.D. = 2.12, n = 5) did not differ significantly (U = 19.5, P = 0.188).
There was no effect of survival time on dispersal rates (rs = 0.336, P = 0.203, n = 16). Moreover, there was no difference in the distance from death point to release site between sexes (U = 28, P = 0.674). The majority of released animals (75%) were killed by natural predators, red fox and beech marten. Predation was the main cause of death of released hares ( 2 = 6.760, df = 1, P = 0.009).
Table 2. Mortality causes of released hares. Mortality cause Number of hares Fox 7 Beech marten 5 Unidentified 4 Total 16
4. Discussion
The mortality of captive-bred hares was very high during the first 10 days after their release into the wild. The inability of released animals to effectively avoid their predators is considered as a fatal disadvantage for hares. Only one individual survived for two months. Generally, the released hares concentrated their activities in a relatively small area [11]. But this limited
Sex *1
Age (months)
Body weight
(g)
Collar weight (g)*2
Day of release
Survival (days)
M1M2M3M4M5M6M7M8F1F2F3F4F5F6F7F8
11 11 11 11 11 11 11 10 11 11 12 11 11 12 11 10
3339 3612 3513 3180 3246 3356 3179 3404 3286 3561 3870 3798 3317 3662 3557 3221
66 63 64 65 66 65 62 65 65 65 65 66 62 65 64 63
27/4 27/4 28/4 8/5
26/5 6/6
17/6 30/6 27/4 28/4 8/5
19/5 26/5 17/6 20/6 30/6
342 16 57 11 23 263
11 8
22 1
24 12
206

mobility by captive hares when they were released to the wild leads to the accumulation of odors which attracts predators. Special attention must be given therefore, to predator population levels in the releasing area because the limited use of space by the released animals is an inert reaction which inevitably increases the probability of death by natural enemies [3].
The results of this study agree with those of Angelici et al. [2], i.e. predation by fox and beech marten was the main cause of mortality for released hares in their natural environment. Besides, fox is considered as the most dangerous natural enemy for hares in Europe [8], [9], [15]. Even though, beech marten is not considered to be a crucial predator of hares in natural environment, in our study and this of Angelici et al. [2], this predator was responsible for a large percentage of the total deaths of released hares.
Both sexes did not move different distances from the releasing site, thus, it can be considered that males and females follow similar behaviour. Hares in our study were dispersed in a relatively small area, not to far from the released site. Other studies on similar subjects have reported that hares were dispersed in variable distances from the released site either longer or sorter [2], [6], [10], [14], [15]. These differences can be attributed to:
a) The different kind of habitats. b) The different methods for the estimation of
distance. c) The different population levels of hares in
the releasing areas. In conclusion, releasing captive-bred hares
into the wild is an ineffective conservation practice, because of the high mortality rates within a short time after release. Captive hares are not capable of avoiding their natural enemies and the releasing of such animals into a specific area may lead to the attraction of predators into this area. Future trials should incorporate the population levels of hare predators in the releasing area and if this is needed to reduce their numbers before releasing takes place. Additional research is also needed on teaching and preparing the captive hares to recognize and to effectively avoid their predators [13].
5. Acknowledgements
The author is very grateful to Professor N. Papageorgiou for supervision and to Associate Professor C. Vlachos for his kindly advices during the research.
6. References
[1] American Society of Mammalogists. Guidelines for the capture, handling, and care of mammals as approved by the American Society of Mammalogists. Journal of Mammalogy 1998; 79: 1416-31.
[2] Angelici FM, Riga F, Boitani L, Luiselli L. Fate of captive-reared brown hares (Lepuseuropaeus) released at a mountain site in central Italy. Wildlife Biology 2000 ; 6: 173-78.
[3] Banks PB, Norrdahl K, Koprimaki E. Mobility decisions and the predation risks of introduction. Biological Conservation 2002; 103: 133-38.
[4] Biggins DE, Vargas A, Godbey JL, Anderson SH. Influence of prelease experience on reintroduced black footed ferrets (Mustela nigripes). Biological Conservation 1999; 89: 121-29.
[5] Brand CJ, Vowles RH, Keith LB. Snowshoe hare mortality monitored by telemetry. Journal of Wildlife Management 1975; 39: 741-47.
[6] Broekhuizen S, Maaskamp F. Movement, home range, and clustering in the European hare (Lepus europaeus Pallas) in the Netherlands. Zeitschrift f r S ugetierkunde 1982; 47: 22-32.
[7] Dolbeer RA, Holler NR, Hawthorne DV. Identification and control of wildlife damage. In: Bookhout TA editor. Research and management techniques for wildlife and habitats. The Wildlife Society, Bethesda, Maryland: Allen Press; 1996.
[8] Goszczynski J, Wasilewski M. Predation of foxes on a hare population in central Poland. Acta Theriologica 1992; 37: 329-38.
[9] Goszczynski J, Ryszkowski L, Truszkowski J. The role of the European hare in the diet of predators in cultivated field systems. In: Pielowski Z, Pucek Z, editors. Proceedings of the Ecology and Management of European Hare Populations; 1976; Warsawa, Poland. Polish Hunting Association, Warsawa; 1976. p. 127-33.
[10] Jezierski, W. Some ecological aspects of introduction of the European hare. Acta Theriologica 1968; 13: 1-30.
[11] Karmiris I. Releasing captive-bred brown hares (Lepus europaeus) to the wild. M. Sc. Thesis. Aristotle University of
207
“Sustainable Management and Development of Mountainous and Island Areas”

Thessaloniki. (In Greek with English summary); 2002.
[12] Kenward, RE. Wildlife radio tagging. San Diego: Academic Press; 1987.
[13] Mclean IJ, Lundie-Jenkins G, Jarman PJ. Teaching an endagered mammal to recognise predators. Biological Conservation 1996; 87: 51-62.
[14] Pepin D, Cargnelutti B. Dispersal et cantonement de lievres de repeuplement (Lepus europaeus). Biology of Behaviour 1985; 10: 353-65.
[15] Pielowski, Z. Studies on resettlement of hares. In: Pielowski Z, Pucek Z, editors. Proceedings of the Ecology and Management of European hare populations; 1976; Warsawa, Poland. Polish Hunting Association, Warsawa; 1976. p. 265-68.
[16] Siegel S, Castellan NJJr. Nonparametric statistics for the behavioral sciences, 2nd
edition. Singapore: McGraw-Hill Book Company; 1988.
208
“Sustainable Management and Development of Mountainous and Island Areas”
Wireless Local Area Network (WLAN) among four organizations in the area of Thessaloniki
I.V. Kirkenidis 1, Z.S.Andreopoulou1 , T.D.Fragopoulos2, P.D.Lefakis1
1. Laboratory of Forest Informatics, Department of Forestry and Natural Environment, Aristotle University of Thessaloniki, 54124, Thessaloniki, Greece, email: [email protected] , [email protected]. Cisco Certified Network Associate - Network Specialist, email : [email protected]
Abstract.
This paper studies the wireless connection among four (4) forestry related institutions in the area of Thessaloniki. It describes in detail the planning and designing of the wireless network and the necessary elements required for the creation of the wireless network (Software – Hardware) with, graphic designs. The wireless connection contributes to the direct and rapid exchange of data concerning the subjects of forestry and environment, decision making, information etc. Moreover, this study contributes to the connection of research and production.
Keywords. Wireless, Network, Data Exchange, Video conference, Decision Making
1. Introduction
Whether it is because someone has made a call using a mobile phone, received a message on his pager, checked his email from a PDA or even just seen an advertisement related to it, almost all the population of the civilised World have come across a wireless data or voice network. Wireless technology is used everywhere, from mobiles and Telco’s to sensor arrays and network infrastructures.
The basic pursuit in every aspect of human life is the fastest possible transaction in business and social obligations. In our time and age, especially in the professional field, the development of a wireless communication is considered absolutely necessary.
This paper deals with the study of the connection among four (4) institutions of forestry in the area of Thessaloniki, i.e. Forest Service, School of Forestry and Natural Environment at the Aristotle University of Thessaloniki campus, School of Forestry and Natural Environment in
Finikas, Institute of Forest Research (a part of the National Agricultural Research Foundation). The central aim is to design a Wireless Local Area Network (WLAN) in order to achieve virtual digital connection.
2. Materials and methods
The main purpose of this study is the planning and designing of the wireless network with reference to all of the necessary elements required for the creation of the wireless network (Software – Hardware). The four physical locations that will be wirelessly connected are 4 buildings in the wider area of Thessaloniki, as follows: 1.Forest Service of Thessaloniki located near the docks of Thessaloniki, which will be referred to as Building A, 2. School of Forestry and Natural Environment at the Aristotle University of Thessaloniki campus, as Building B, 3. School of Forestry and Natural Environment, in the suburb of Finikas, Kalamaria Thessaloniki, as Building C and 4. The Iinstitute of Forest Research which is located near New Redestos Village, as Building D). Furthermore, the appropriate designs will be displayed with the connections of the equipment listed above. All of these elements will be applied to the joining of the organizations mentioned before, in order to achieve a direct and rapid exchange of data concerning the subjects of forestry and environment for the transmission of data about decision making, knowledge transfer and education of employees, students etc. Moreover, this study aims to bring together research and production. The organizations listed above use the raw data in research and reach conclusions, which afterwards will be used again as raw data.
209
“Sustainable Management and Development of Mountainous and Island Areas”

3. Types of Wireless Networks
There are four wireless types that can be distinguished. WLANS, WPANS, WMANS and WWANS. WLANS (Wireless Local Area Networks) allow users in a local area, such as a university campus or library, to form a network or gain access to the internet. Given that there is no need to access network resource, a temporary network can be formed by a small number of users without the need of an access point. WPANS (Wireless Personal Area Networks) are basically based on two technologies, Infra Red (IR) and Bluetooth (IEEE 802.15). These will allow the connectivity of personal devices within an area of about 30 feet. However, IR requires a direct line of site and the range is less. WMANS (Wireless Metropolitan Networks) is a technology which allows the connection of multiple networks in a metropolitan area such as different buildings in a city, which can be an alternative or backup to laying copper or fibre cabling. WWANS (Wireless Wide Area Networks) can be maintained over large areas, such as cities or countries, via multiple satellite systems or antenna sites looked after by an ISP.
These types of systems are referred to as 2G (2nd
Generation) systems.
4. Wireless Networks Technology
WLAN standards fall under the family of 802.11 specifications. Both 802.11b and g operate in the 2.4 GHz band which is unregulated by the FCC. This means you do not need a license to set up and use a wireless LAN.802.11a. Although this can also be considered for a Wi-Fi implementation, nevertheless, it operates in the 5 GHz radio band and is considered incompatible with either 802.11b or g (although it is also unregulated by the FCC). The 2.4 GHz spectrum which is used by both 802.11 b and g, actually represents a range of frequencies from 2.4 to 2.4835 GHz. 802.11a equipment operates at frequencies between 5.15 to 5.25 GHz band at 50 mW, 5.25 to 5.35 GHz at 250 mW, and 5.725 to 5.825 at 1 Watt. [8]
There is also WiMAX technology, which is not yet standarized.
Below, table 1, saws the Wireless specifications and some of their attributes
Table 1. Wireless specificationsType Specification Speed Frequency Compatibility
Original WLAN Specification
802.11 1 to 2 Mbps 2.4 GHz 802.11b and 802.11g
WLAN/WWAN/WMAN Specification
802.11a 54 Mbps 5 GHz None
WLAN Specification
802.11b 11 Mbps 2.4 GHz 802.11g
WLAN Specification
802.11g 54 Mbps 2.4 GHz 802.11b
WPAN Specification
802.15 721 Kbps -10 Mbps 2.4 GHz None
WMAN Specification
802.16 70 Mbps 10-66 GHz None
5. Advantages / Disadvantages of Wireless Networks.
Generally the noticeable advantage of wireless technology is that there is no need to implement a network with cables. Another advantage is that wireless technology can be used to reach areas where it would not normally be possible to throw cabling, or the cable network is expensive to implement. The major disadvantages are the low speed comparing to the speed of wired LANs (maximum 54MBps – maximum of 1GBit ) and interference by other radio signals and weather conditions.
In our situation, the creation of a backbone between four buildings, the speed of the wireless connection to be implemented is faster than the one we would be able to rent by a provider for a Leased line or Frame Relay. The monthly cost for leased lines or Frame Relay connections via a service provider are very high, from 1000E/month for a 1MBit leased line. Frame Relay connections are usually cheaper, but even then, the cost/month still consists of more than 800E per month per link. Having a total of four links, the monthly cost would be more than 3200E. Apart from the cost of the equipment for implementing the
210
“Sustainable Management and Development of Mountainous and Island Areas”

wireless backbone, there are no other monthly fees apart from the maintenance which exists on all networks. Special routers should also be purchased when using leased lines and frame relay. [2]
6. Connecting the Buildings
The four buildings which will form the WMAN are a. Forest Service of Thessaloniki stated near the docks of Thessaloniki, that will be referred to as Building A, b. School of Forestry and Natural Environment at the campus of the Aristotle University of Thessaloniki campus, referred to as Building B,c. School of Forestry and Natural Environment, in the suburb of Finikas, Kalamaria Thessaloniki, referred to as Building C and d. The Institute of Forest Research which is located near New Redestos Village, referred to as Building D. The distance between buildings A and B is 2-3km, between B and C 7-8km and between C and D about 11-13km. These distances were measured using a topographic drawing of Thessaloniki and refer to a clear Line of Sight (LOS).
Figure 1. Wan Links
The four buildings will connect through Directional Antennas that will be using WiFi technology. Because of the geographic placement of the buildings and because the Directional Antennas need a Line of Sight for the link to be created, the most probable scenario is that not all four buildings will be directly connected. Taking into account the distance between the buildings and the elevation difference of the ground on the sites, we will assume that only one intermediate spot
will be needed between buildings C and D. There is no way of calculating the number of intermediate spots needed till a survey of the areas has been conducted. The links as shown in Figure 1, will be forming a Chain.
Buildings A and D are the end points of the WMAN, so only one Directional Antenna will be needed for each of them. Buildings B and C which are positioned inside the chain, will need two Directional Antennas. Building B will have two Wireless Connections, one with building A and one with building C. Building C will also have two Wireless Connections, one with building B and one with the intermediate spot. Finally the intermediate spot will have two Directional Antennas, for connecting buildings C and D.. The use of Directional Antennas is safe despite the distance [1]
The Antennas should be positioned on a high altitude over the building, in a place where the two antennas creating the Point to Point (P2P) connection should have a clear Line of Sight (LOS), so the signal can reach each other. The true spot of implementation cannot be determined because of the wireless problems such as interference and direct view/link. A survey on-site with binoculars should be conducted as mentioned before, to decide the exact spot for the placement of the antennas. After the decision has been taken, the procedure to pin-point the exact spot for placing the antenna begins. Techinician Crews should be placed in both buildings ready to be connected with the wireless link, to adjust the antennas so the signal from one antenna to the other can be reached. Mounting of the antennas should be the last thing to do. All antennas should be in boxes to keep them safe from weather conditions [9]
Every spot on the buildings, including the intermediate spots, should include apart from the antennas, a bridge and a router. The router can be positioned anywhere in a maximum distance of 80m from the bridge. The length restriction is due to the media being used connecting the two hardware. The bridge is used for connecting the antenna with the router. The bridge should have at least one RF connector for the connection with the external antenna and an Ethernet interface for the connection with the router. The bridge should be positioned as close as possible to the antenna, so no loss of power should occur. The bridge should be also protected from weather conditions e.t.c. With a use of a UTP cat 5e/6
211
“Sustainable Management and Development of Mountainous and Island Areas”

cable the bridge will be connected with the router. The router afterwards is connected to the existing LAN of the building. The routers should all have at least two Ethernet Wan ports and two switched ports. The two Wan ports are used for creating the wireless Wan links , one switched port for the connection with the existing LAN, and the other switch port or ports are used for future implementations. The routers should support standard protocols such as PPP,HDLC,RIPv1,RIPv2. It would be best for the routers to support more protocols such as EIGRP and OSPF. Technologies such as QoS, VLAN, and VLSM should also be supported including PoE (Power over Ethernet). Recommended products are the Cisco Aironet 1400 Series (bridge) and Cisco 1811/1812/1841 Series (Router). The Cisco Aironet series are specialised for use on WMANs. [4]
Figure 2. Equipment Interconnection
There are products that act as a Wireless bridge and as a router at the same time. Assuming that they follow the same characteristics of the bridge and router that are mentioned above, these products can also be used.
The above topology assumes that there is an existing LAN on each building with no router,
or with a router which can be replaced by the new one. In case there is another router used e.g. for internet purposes, special configuration should be made for the routing processes to function properly. A solution to this configuration problem, would be to connect the existing router to a switched port of the newly bought router and changing the gateway of the workstations to match its IP address. Then with simple configuration, the new router will forward all packets for the internet to the old one. A UTP cross-class cable should be used for interconnecting the two routers. Figure 2 shows the connection of the hardware such as the antenna the router and bridges per building.
7. Migrating the LANS to the WMAN.
Before connecting the LANs of the four buildings together, there are a series of steps to be followed. For the four networks to be connected together properly and no conflicts to arise, every LAN should use a different range of IP addresses. If all LANs use the same IP range then the routers will not be able to know where to send the information and IP conflicts could occur. An address scheme should be created and implemented. For the address scheme to be created, the number of connected workstations on each LAN should be first counted. Future positions should also be considered. The following Figure 3 assumes that the schema has been decided and a Class C network has been chosen as sufficient for each LAN. It presents a simple network schema for the four buildings in a chain topology. Each LAN will be assigned with a network. LAN A will use 192.168.1.0 network, LAN B 192.168.2.0, LAN C 192.168.3.0, LAN C 192.168.3.0, LAN D 192.168.4.0. The class C networks can have up to 254 network devices such as workstations, servers, routers e.t.c. The Wan links between the buildings will also be assigned with networks such as 192.168.5.0, 192.168.6.0, 192.168.7.0, and 192.168.8.0. The Wan links need only two IP addresses since they are P2P links, but because we have sufficient IP addresses we can assign each link with a whole Class C Network. After the schema has been decided, appropriate configuration should then be made for the WMAN to work. The P2P links are WAN links and should not be confused with internal links. Access Lists should be created to provide better security and better use of bandwidth. [3][6] In every LAN there should be a Server which would serve as a Domain Controller (DC) and
212
“Sustainable Management and Development of Mountainous and Island Areas”
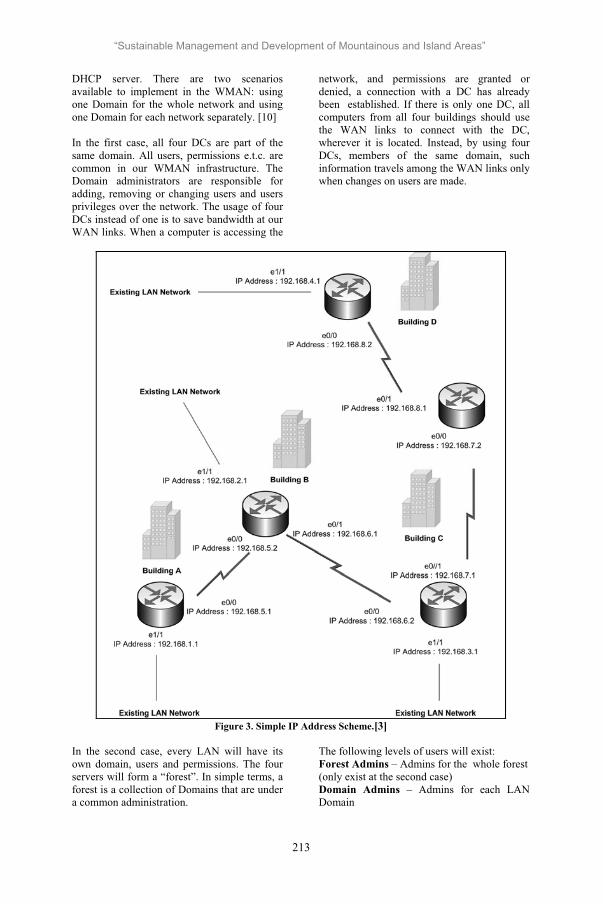
DHCP server. There are two scenarios available to implement in the WMAN: using one Domain for the whole network and using one Domain for each network separately. [10]
In the first case, all four DCs are part of the same domain. All users, permissions e.t.c. are common in our WMAN infrastructure. The Domain administrators are responsible for adding, removing or changing users and users privileges over the network. The usage of four DCs instead of one is to save bandwidth at our WAN links. When a computer is accessing the
network, and permissions are granted or denied, a connection with a DC has already been established. If there is only one DC, all computers from all four buildings should use the WAN links to connect with the DC, wherever it is located. Instead, by using four DCs, members of the same domain, such information travels among the WAN links only when changes on users are made.
Figure 3. Simple IP Address Scheme.[3]
In the second case, every LAN will have its own domain, users and permissions. The four servers will form a “forest”. In simple terms, a forest is a collection of Domains that are under a common administration.
The following levels of users will exist: Forest Admins – Admins for the whole forest (only exist at the second case) Domain Admins – Admins for each LAN Domain
213
“Sustainable Management and Development of Mountainous and Island Areas”

Maintainance Users – Users with specific privileges used for maintenance purposes User Groups – All other users with their appropriate permissions.
This case, is a more difficult approach, and it is not recommended unless necessary because of the highly sophisticated configuration that has to be made, to servers and routers, so the trust relationships among the four domains can work properly.
In both cases, the DCs will act as DHCP servers as mentioned before. They will provide IP addresses to the workstations of the LANs. Servers and routers should be configured with static IPs and the DHCP servers should be configured to exclude these addresses from their IP address pool. Apart from the DCs, a common fileserver system should be considered. The file server system should be positioned at buildings B or C. It can be composed by one file server or by an array of file servers.
System requirements for the DC and file server systems will be set according to the number of computers on each building’s LAN, needs of speed and redundancy and file sharing space. Recommended software for both types of servers, is Microsoft’s Windows 2003 R2 server operating system. The file server system might be a specialized network system that can have another operating system Unix/Linux based. Both rack mounted and desktop solutions can be used, limited only by size restrictions.
8. Equipment & Costs
As referred to before, the most probable scenario will be to have one intermediate spot between buildings C and D forming a chain. This means that there is a total of five spots where it is necessary to install appropriate equipment. As previously mentioned and shown in figures, there is a need for a total of eight Directional Antennas, eight Bridges, five Routers and the appropriate accessories such as RF cabling, UTP cabling, power cabling - unless PoE is used, which in that case the UTP cable will be providing power to the equipment. Of course, each antenna should be grounded. The antennas depending on the exact location of the spot will be mounted on pylons which will be pined down on the roof or at an any place at the exterior of the building where it will have a LOS with the other antenna. [5]
The following table 2 shows an estimated cost for our case study using recommended equipment. The prices are estimated after reviewing global pricing. There are cheaper solutions and more expensive ones. The provided solution below is taking into account non modular equipment but highly sophisticated. The antenna used has a gain of 28dbi and it is specialized for very big distances. Prices for Servers and configuration are estimated based on a medium LAN infrastructure with normal requirements. Windows 2003 Server Operating System is not included in the table, because special prices and licensing exist for educational and research purposes, and licenses work per workstation seat basis. So an estimated price cannot be calculated. All prices are in Euros. In table 3 we can view some characteristics of the equipment used.
Table 2. Item Quantity and Price List
a/a Item Q/ty Cost / Unit
TotalCost
1
AIR-ANT58G28SD
A-N Dish Directional
Antenna
8 1.000 8.000
2 Cisco Aironet 1400 Bridge 8 4.000 32.000
3Cisco
1811/1812 Router
5 1.200 6.000
4 DC Servers 4 2.000 8.000
5 File Servers (optional) 1 4.000 4.000
6 U.P.S. 4 500 2.000
7Backup
Solutions (optional)
4 1.500 6.000
8Configuration
of Internal Networks
4 5.000 20.000
9 Antennas Configuration 5 500 2.500
10
Other Equipment or Configuration
needs
1 3.000 3.000
91.500
214
“Sustainable Management and Development of Mountainous and Island Areas”

Table 3. Item Characteristics a/a Item Characteristics
1
Outdoor long-range directional
connections Gain 28dbi,
5.8GHz frequency Operating
Temperature -30c to 60c
Aproximate Range at 54MBps
2
Waterproof Design 54MBps supported
speed 5.8GHz frequency
3
DSL WAN Port 2x 10/100 FE Wan
Ports 8-Port Managed Switch ISDN/PSTN Dial
BackupAuxiliary and Console
Ports
There are a variety of products that can be used in a WMAN implementation. It would be preferable though to buy equipment that will provide the network with extensibility in the future, such as Cisco’s modular equipment. By using modular equipment will be able easily to expand the WMAN at our future needs.
9. Future Implementations
Upgrades in a Wireless LAN can be made as easy as on an LAN implemented by cable. Omni-Directional Antennas can be used in conjunction with the Directional Antennas, to provide access to the WMAN by authorized people such as professors, students or other authorized personnel. The only addition needed to the existing infrastructure, will be the antenna, bridge and if modular routers are used, probably a new module. VPN technology and access lists will be used for the security of the connections apart from the user authentication. Encryptions such as WEP should be used (Fig. 4).
The chain topology could also be transformed easily into a mesh topology for redundancy by adding more Directional Antennas. By using the term “mesh topology” , we refer to the topology where all buildings are connected to each other through new Wireless links. For the mesh topology to be implemented more advanced routers need to be bought. New
buildings can also be added to the WMAN following the same approach.
Voice over IP (VoIP) can be also implemented among the four buildings, creating a transparent telephone exchange system while providing the users with intercommunication. Private Branch Exchange Systems (PBX) should be used as well as specialized software for the proper implementation of the VoIP. Quality of Service (QoS) should be properly configured on the routers so the voice data can be transferred with priority and no delay and degradation can occur. Most medium-sized and larger companies use a PBX because it is much less expensive than connecting an external telephone line to every telephone in the organization. In addition, it is easier to call someone within a PBX because the number you need to dial is typically just 3 or 4 digits. A new variation on the PBX theme is the Centrex, which is a PBX with all switching occurring at a local telephone office instead of the company's premises.
Figure 4. Authorized Externall Access
10. Discussion-Conclusion
The wireless connection among the four (4) different parts of forest discipline in the area of Thessaloniki has been described in detail. It concerns the planning and design of the wireless network the necessary elements required for the creation of the wireless network in Software and Hardware along with the necessary graphic designs for the application.
215
“Sustainable Management and Development of Mountainous and Island Areas”
The wireless connection contributes to a direct and rapid exchange of data concerning the subjects of forestry and environment and could be a useful tool in making decisions, obtaining data etc. It also brings together research and production efforts.
It is obvious that it has to be presumed that these organizations will upgrade their substructures and educate their personnel. Another aspect which has to be changed is the bureaucracy that is usual in these organizations in order to facilitate the whole project and as with all networks, with a wireless network, other technologies can be used too such as VoIP for connecting the 4 laboratories communication systems together, or part of it, and having no cost on phonecalls between them or using the network for Video Conferences. The application of the WMAN, connects the four networks which are sharing capabilities, speeds up collaboration among the four physical locations of forest application in Thessaloniki, and provides a better accommodation at a lower cost.
By using adjusting routers, the users of the network can easily attain any kind of configuration that could be needed in the future. The proposed routers are non modular and modular. Except the new antennas new modules should be provided instead of providing new routers. The modular approach decreases significantly the financial costs of the new installation.
11. Acknowledgements
Special thanks to Mark Lobjoit for sharing his expertise and experience over Wired and Wireless Networks.
12. References
[1] BICSI, Wireless Design Reference Manual 1st Edition. BICSI; 2004 [2] Bulk F. Wireless MANs - Giving WMANs a Little Muscle; 2004. http://www.network computing.com/showitem.jhtml?docid=1505ws1 [28/06/2006] [3] Cisco Networking Academy Program. CCNA 1 and 2 Companion Guide, Revised 3rd Edition. Cisco Press; 2003
[4] Cisco Networking Academy Program. CCNA 3 & 4 Companion Guide, Revised 3rd Edition. Cisco Press; 2003. [5] Cisco Systems. Cisco Metropolitan Mobile Network Solution. Cisco Systems Inc. http://www.cisco.com/en/US/netsol/ns473/net working_solutions_package.Html [28/06/2006] [6] Gast M.S. 802.11 Wireless Networks: The Definitive Guide, Second Edition. O'Reilly Media; 2004 [7] Potter B., Fleck B. 802.11 Security. O'Reilly Media; 2002 [8] Pyles J. WLANS, WPANS and WMANS. Oh My!. WiredWriter.net; 2006. http://www. Wiredwriter.net/index.html?page=Articles [28/06/2006] [9] Roshan P., Leary J. 802.11 Wireless LAN Fundamentals. Cisco Press; 2003. [10] Russel C., Crawford S., Gerend J. Microsoft Windows 2003 Administrators Companion 2nd Edition. Redmond Washington: Microsoft Press; 2003.
216
“Sustainable Management and Development of Mountainous and Island Areas”

REGIONAL PLANNING AND SUSTAINABLE DEVELOPMENT: A CASE STUDY FOR GREEK ISLANDS-NAXOS
George M. Korres
Assistant Professor, University of Aegean, Department of Geography, University Hill, Mitilene: 81100, Lesvos, Greece. Tel.: (22510)-36429, Fax: (22510)-36409, Email: [email protected]
Emmanuel Marmaras
Corresponding Address: Professor Dr. Emmanuel Marmaras, University of Aegean, Department of Geography, University Hill, Mitilene: 81100, Lesvos, Greece. Tel.: (210)-7482693, Fax: (210)-7772600, Email: [email protected]
Aikaterini Kokkinou
Corresponding Address: Aikaterini Kokkinou, University of Aegean, Department of Geography, University Hill, Mitilene: 81100, Lesvos, Greece. And also Public Debt Management Agency, Greece, Email: [email protected].
Abstract. The long-term planning and stabilisation policy affect directly the socio-economic variables and furthermore the growth and development process. Economic policy is one of the main pillars leading to economic growth process. Economic policy is also considered as the necessary and the pre-required condition for the development of social policy. The contemporary planning within the European policy framework is aiming to achieve the cohesion and the convergence of member states. During the last decades, in most of the member states there is an apparent trend for rapid economic growth, however despite of these positive growth rates, there is also a continuous tendency to increase the regional inequalities between and within member states. On this matter, during the last decades, economic growth in Greece has not achieved the economic and social convergence within the country. However, the «inter-regional» and «intra-regional» disparities still exist, and moreover the gap is still widening for the country. On the same route, the dis-industrialisation phenomenon and also the decline of economic activities in the primary section have induced and increased the economic stagnation, and especially regional disparities. Looking at the Greek regions, especially rural regions and small islands, the under-development process and regional disparities are more obvious and extended. This paper is aiming to analyse the regional planning, to review the subsidy and incentive policies, the development
process, the prospects of Greek regions, paying emphasis on a case-study of Cyclades.
Key Words. Regional planning, incentives, economic and social policy, regional growth, social development.
1. Introduction
The surface area of Greece is 130,100 km2 of which 20% is distributed to its 3,000 islands, whereas, two thirds of the Greek territory is mountainous. Greece has the longest coastline in Europe with a total length exceeding 15.000 km of which 5% belongs to areas of unique ecological value. The national population reaches 11 million with a density of 84 inhabitants/ km2 (one of the lowest densities in Europe). About one third of Greek population concentrates along the coastline. During the last 15 years the average annual population increase is approximately 0.5% and decreases steadily reaching the EU average. As a result, the national population is aging as 16% is over 65 years (2001 NSSG data). This trend, in parallel with the fact that the life expectancy is approximately 80 years old, creates significant pressures on the national social security and health systems. It is worth mentioning that over one million of foreign immigrants entered Greece during the 1990s consisting today 15 % of the total working force.
217
“Sustainable Management and Development of Mountainous and Island Areas”

In Greece the Principles of Sustainable Development have been established by the case law of the fifth Section of the Supreme Administrative Court (Council of State), having jurisdiction on environmental matters, among them the principles of sustainability, of carrying capacity of man-made systems and ecosystems, of sustainable land development, of management of fragile ecosystems, biodiversity and others.
In the early 1980s, the urban planning legislation was mainly based on the Urban Development Law (1983) that introduced «urban controlled zones» to direct urban development, safeguarded sensitive areas and restrained unplanned construction. This Law also entailed provisions adapting the town-planning legislation according to sustainable development principles, for the expansion of newly developed areas and the improvement of the institutional framework and procedures.
In 1986, Law 1650 for the Environment was passed, establishing a framework of sanctions and liabilities for the protection of the environment.
In 1997, this Law was updated with the Sustainable Urban Development Law 2508/97 that introduced improved guiding principles and procedures on urban planning for the balanced and sustainable development of cities and smaller settlements.
In 1999, a new land-use planning framework at the national and regional level was established in Greece, through the Law for «Spatial Planning and Sustainable Development» (Law 2742/1999). Based on this Law, the national plan, known as the General Framework for Spatial Planning and Sustainable Development, set specific goals concerning conflicting issues in land use management, which aim at the sustainable use of land and the minimization of negative environmental impacts.
This paper is aiming to analyse the regional planning, to review the subsidy and incentive policies, the development process, the prospects of Greek regions, paying emphasis in a inter-comparison study between Cyclades and Greece.
2. The Process of Growth and Sustainability in Greece
Sustainability is related to the quality of life in a community -- whether the economic, social and environmental systems that make up the community are providing a healthy,
productive, meaningful life for all community residents, present and future.
A view of community that shows the links among its three parts:
the economic part, the social part and the environmental part.
The goal of sustainable development concerns all citizens of the European Union, and indeed of the whole world. Sustainable development is a fundamental objective of the European Union. The European Union’s commitment to sustainable development at the first Earth Summit in Rio de Janeiro in 1992 ultimately led to an EU-wide sustainable development strategy (SDS), which was adopted by the Gothenburg European Council in June 2001. In 1996, the United Nations Commission on Sustainable Development (UNCSD) proposed a list of 134 indicators 3, defined by reference to the principles and policy guidance provided by Agenda 21, to be tested in selected countries. In 2001, the European Commission attempted to translate the vision of sustainable development into an operational strategy 8. This strategy, which was endorsed by the Heads of States or Government at their meeting in Gothenburg on 15 and 16 June 2001, sets out a broad vision of what is sustainable and identifies six trends that are not sustainable. Actions should focus on:
(a). Limiting climate change and increasing the use of clean energy;
(b). Addressing threats to public health; (c). Managing natural resources more
responsibly; (d). Improving the transport system and
land-use management; (e). Combating poverty and social
exclusion; and (f). Dealing with the economic and social
implications of an ageing society. In 2002 at Barcelona, recognising the
importance of both internal and external factors, the European Council added an external dimension to the strategy, committing the EU to take a leading role in the pursuit of global sustainable development.
Sustainable Measures is committed to the development and growth of sustainable communities. Figure 1 illustrates the links of sustainability between economic, social and environmental sectors, whereas Table 1 illustrates the main sustainable measures and indicators.
218

Figure 1: The Links of Sustainability
Table 1: Sustainable Measures and Indicators
ECONOMIC DEVELOPMENT (Growth rate of GDP per capita)
Business IndicatorsPercent of organizations that have adopted sustainable development goals, Business participation in school and civic events, Office vacancy rate, Percent of companies developing new products or services, State rank in telecommunications technology, New business starts, Number of environmental services, products and technologies exported, Percent of GDP from secondary production and business services, Number of building permits issued, Number of business establishments, Government subsidies as percent of gross income, Manufacturing productivity
Competitiveness IndicatorsLabour productivity per hour worked, International price competitiveness (real effective exchange rate), Investment as % of GDP by institutional sector, real GDP growth rate, GDP per capita in PPS, Regional breakdown of GDP per capita, Net National Income as a % of GDP, Inflation Rate, Total Consumption Expenditure as a % of GDP.
Children IndicatorsChildren living in poverty, Students eligible for free or reduced price lunch
Diversity IndicatorsUnemployment rate by ethnicity, Discrimination in the workplace, Occupational distribution of women and minorities, Number of commercial crop varieties, Employment by sector, Employment by top five employers
Employment IndicatorsAverage age of commercial fish harvesters, Percent of residents who want to work full
time who actually work full time, Long-term unemployment, Manufacturing wage and salary jobs as a percent of total jobs, Real unemployment (estimated), Unemployment rate, Professional, technical and managerial occupations as percent of total, Agricultural employment, Number of green jobs, Employment rate, Total wage and salary jobs per employed resident, Net job growth, Job growth among new businesses, Total wage and salary jobs, Number of jobs in value-added manufacturing
Finance IndicatorsIndex of Sustainable Economic Welfare, Number and value of business loans in low income area, Percent of products and services where price reflects life-cycle cost, Energy and machinery expenses as percent of gross farm income, Per capita debt, GDP per capita adjusted for natural resource depletion, Environmentally adjusted Net Domestic Product, Percent of GDP spent on research and development, Market value of environmental permits traded or sold, Growth in value added in forest products industry (paper and lumber), Agriculture value added as a percent of gross sales, Value of business personal property per worker, Annual capital dollars invested in municipal infrastructure, Value of industrial and commercial property, Per capita gross state product as percent of US GNP, Value of residential and business properties, Total dollars and dollars per capita deposited in local banks annually, Value of goods exported internationally, Assessed value of real estate per capita, inflation adjusted, Value of building permits
Income IndicatorsDistribution of wealth, Percent of jobs that pay a liveable wage for a family of two, Corporate executive to production worker wages (ratio), Percent of jobs that did not pay a self-sufficiency wage, Income distribution, Percent of disposable personal income that is being saved, Average income of the bottom and top 20 percent, Hours of labor required to meet basic needs, Population areas with poverty more than 1.5 times state rate, People living below the poverty line, Manufacturing wage and salary earnings as a percent of total income, Food stamp recipients, Length of time on welfare, Number or percent of residents receiving welfare assistance, Income disparity among counties, Per capita income in non metropolitan areas, Per capita income
219
“Sustainable Management and Development of Mountainous and Island Areas”

as percent of state average, Cost of living index, Households with incomes more than 200 percent above poverty line, Population in areas with per capita income less than 70 percent of US, Effective buying income per capita, Personal income per capita, Average earnings per job, Median family income as percent of US median
Resource Use IndicatorsSales of locally produced food at farmers market, Percent of harvested forest successfully restocked, Affordable warmth (average energy efficiency rating of homes), Annual acreage in field crops, Feed production and use balance, Industrial use of toxic chemicals, Farm acreage, Volume of large saw-timber trees, Fish landings by weight, Key natural resource harvests, Values of key natural resources, Cost of 1,000 kWh of electricity
Sales IndicatorsDollars spent in locally-owned businesses, Retail sales per capita, Retail sales as a percent of personal income
Tourism IndicatorsValue added in hotel and lodging industry, Tourism/bed-tax revenues, Employment in hotel and lodging industry
Transportation IndicatorsPercent of all manufacturing freight
transported by rail, air, or water, Containers transported through seaport, Freight shipping
availability in non-metro areas POVERTY- SOCIAL EXCLUSION (At-risk-
of-poverty rate after social transfers)Monetary Poverty- Access to Labour Market
and Other Aspects of Social ExclusionAt-persistent-risk-of-poverty rate, At-risk-of-poverty rate, by gender, by age group, by highest level of education attained, and by household type, Relative at-risk-of-poverty gap, Inequality of income distribution (Income quintile share ratio), Total Long-Term Unemployment Rate, Poverty mobility (i.e. probability to enter or exit poverty), Gender pay gap in unadjusted form, Early School Leavers, Very long-term unemployment rate, People living in jobless households, by age group, At risk-of-poverty rate after social transfers by most frequent activity, Persons with low educational attainment, by age group, Adequacy of housing conditions. AGEING SOCIETY (At-risk-of-poverty rate
after social transfers)Current and projected old age dependency
PUBLIC-HEALTH (Healthy Life Years at Birth by Gender)
Health risks Due to Environmental Conditions, Chemicals Management, Food Safety and Quality, Human Health Protection and Life Styles, Percentage of overweight people by age group, Resistance to antibiotics (Streptococcus pneumoniae pathogens), Deaths due to infectious food-borne diseases, Salmonellosis incidence rate in human beings, Index of apparent consumption of chemicals, by toxicity class, Index of production of chemicals, by toxicity class, Population exposure to air pollution by particulate matter. CLIMATE CHANGE AND ENERGY (Total
Greenhouse Gas Emissions, Gross Inland Energy Consumption by Fuel)
Energy Intensity of the Economy, Final Energy Consumption by Sector, Gross Electricity Generation by Fuel Used in Power Stations
PRODUCTION AND CONSUMPTION PATTERNS (Total material consumption
and GDP at constant prices, Domestic Material Consumption and GDP at
constant prices)Emissions of-acidifying substances and ozone precursors and GDP at constant prices, by source sector Generation of waste by all economic activities and by households Municipal waste collected per capita Electricity consumption per dwelling for lighting and domestic appliances Green public procurement Share of area under EU agri-environmental support in total utilised agricultural area Livestock density index t.
MANAGEMENT OF NATURAL RESOURCES (Land Use, Fresh Water
Resources, Marine Eco-Systems, Biodiversity)
Sufficiency of Member States proposals for protected sites under the EU Habitats directive, Trends of spawning biomass of selected fish stocks, Groundwater abstraction as % of available groundwater resources,
220
“Sustainable Management and Development of Mountainous and Island Areas”

Land use change by category, Built-up area as a % of total land area, Exceedance of critical loads of acidifying substances and nitrogen in sensitive natural.
TRANSPORT (Vehicle-km and GDP at constant price, Energy Consumption by Transport and GDP at constant prices, Social and Environmental Impact of
Transport, Transport Prices, Transport Growth)
Car share of inland passenger transport, Road share of inland freight transport, External costs of transport activities, Emissions of air pollutants (particulate matter and ozone precursors) from transport activities, Greenhouse gas emissions by transport activities by mode
GOOD GOVERNANCE (Public Participation, Policy Coherence)
Proportion of environmentally harmful subsidies, Number of infringement cases brought in front of the Court of Justice, by policy area, Administrative cost imposed by legislation, Voter turnout in national parliamentary elections, Responses to EC Internet public consultations
GLOBAL PARTNERSHIP(Official Development Assistance as 5 of GNI, Resource Management, Financing,
Globalization of Trade)EU imports from developing countries (total and agricultural products) and agricultural budgetary support, Sales of selected fair-trade labelled products, Bilateral ODA by category, EU imports of materials from developing countries, by group of products
Source: E.U
Looking for the growth process in Greece the GDP was $ 117 billion dollars while the per capita GDP reached $16,000 dollars in 2002. However, the distance between Greece and the other EU member states is considerable as the per capita GDP consists 70% of the EU average. The structure of the Greek economy shows significant increase in the service sector, contributing with 68.5% to the Gross Production Value (GPV). Following the continuous growth between 1995 and 2002, the share of business investment — which represents by far the largest part of total investment — has decreased from 18.4 to 17.0 % of GDP between 2000 and 2004. The best performing countries over the period
were Estonia (+ 3.3 %), Lithuania (+ 2.3 %) and Greece (+ 1.9 %) (see additional data on Eurostat website). Public investment declined from 3.0 % in 1995 to 2.3 % in 2000 and has since remained approximately stable at both EU-25 and EU-15 levels.
Furthermore, tourism plays an important role as Greece is manufacturing sector is limited (23.5%), while industrial activity concentrates in traditional sectors dominated by a large number of small and medium sized enterprises making the sector vulnerable to external pressures from international competition. In addition, the Greek tourism sector is built on the nation’s rich natural and cultural heritage. After approximately 20 years of rapid growth, today the tourism business presents 6 % of GDP contributing significantly to employment and regional development. Even though tourist arrivals present an increasing trend on the long-run, income from the tourism business presents a decreasing trend. Recently, rigid monetary policy has led to the reduction of the public deficit and inflation which fell to 3% of the GDP and 2% respectively. Public investments have increased significantly during the last decade mostly financed by 2nd the 3rd
Community Support Framework for the periods 1994 - 1999 and 2000 – 2006, respectively.
The total active population reached 4.46 million people, showing an increase of 12.5% in relation to last year figures. Approximately 17% is employed in the primary sector, 23% in the secondary sector, and the remaining 60% in the tertiary sector. Unemployment remains over 10% consisting mainly of long term unemployed and women. Figures 2-4 illustrate the mean annual GDP growth in Greece and in E.U. and also the employment distribution in main economic sectors and finally the Urban concentration in Greece, respectively.
0
0,5
1
1,5
2
2,5
3
3,5
4
(%)
1990-2000 1999-2002
Figure 2: Mean Annual GDP growth in Greece and EU
GREECE E.U. (15)
221
“Sustainable Management and Development of Mountainous and Island Areas”

The most important pressures on the natural environment and some of the main future trends are:
In the last two decades a decrease in the urbanisation rate has been noticed due to regional development initiatives. Agricultural land in mountainous areas has been abandoned while in more productive areas agricultural production has been intensified. Forest areas are diminishing in size due to forest fires.
The problems of water management are mainly focused on quantity issues and not on the quality ones. The uneven distribution of water resources and rainfall in space and time creates water availability problems. Agriculture is the most significant water consumer while demand for irrigation has been doubled in the last twenty years. Significant progress has been made in wastewater management as 50% of the national population is serviced by wastewater treatment plants. In addition, 98% of the Greek coasts meet the standards set by the bathing waters Directive.
Economic development, intense urbanisation and changes in consumption patterns have resulted in the increase of solid waste quantities. Inappropriate waste disposal and management practices still persist leading to the degradation of surface and ground waters, air pollution and forest fires. However, significant progress has been made in the management of hazardous wastes and sludge. During the last years, waste management infrastructure projects have been financed using national and EU funds.
0
20
40
60
80
100
(%)
GREECE E.U.(15)
Figure 3: Employment Distribution in Main Economic Sectors, 2002
Primary Secondary Tertiary
0
5
10
15
20
25
30
35
(%)
Athens Other UrbanCenters
Semi-UrbanCenters
Rural Areas
Figure 4: Urban Concentration
1991 2002
The contribution of the industrial sector to environmental pressures is decreasing due to the lower degree of manufacturing expansion and the institutional changes that have been recently introduced aiming at a more effective use of natural resources. Nevertheless, specific measures have been envisaged for further enhancing the industrial sector’s environmental performances aiming at increasing its competitiveness, income and employment prospects, as well as its access to markets with high purchasing power and environmental awareness, within the globalised economy and the European markets.
Considering the importance of the environmental dimension of sustainable development in relation to those of economic and societal, the Greek Strategy for Sustainable Development sets the basic principles for environmental policy:
These necessitates for the effective confrontation of environmental impacts, and especially the non – reversible impacts on ecosystems and human health.
The cost of environmental impacts in market mechanisms and prices.
The equity that distributes the burden responsibility among parties and takes into account their potential to contribute towards the confrontation of environmental problems.
3. The Geographic Sources of Regional Growth and Regional Disparities
Regional policy is aiming to reduce the existing inequalities and to enhance the cohesion. In order to measure the existing disparities at
222
“Sustainable Management and Development of Mountainous and Island Areas”

regional and sectoral levels, we can use the component-quotient indexes. Industry clusters were classified by the location quotients measured by both industry employment and by establishment counts. The Location Quotient (LQ) based on employment is defined as:
n
r
in
ir
LL
LL
LQ /
where: Lir : is the number of employees in industry (i) in the region (n)
Lin : is the total number of employees in all industries in location-region (r),
Lr : is the total employment in the region (r)
Ln : is the total employment in the whole regions of the country
In order to compare the performance of firms located within the industry clusters versus those outside clusters, the sample firms are classified into clustered and non-clustered groups based on the criteria and in particular, if a location has a L Q equal to or greater than unity, then there is a high concentration of the particular activity and those firms located in this area or location are classified as clustered. More simply, the clustered group has a LQ >1, and the non-clustered group has a LQ<l .The Urban Space Concentration Index (CI) based on employment is defined as:
k
i n
r
in
ir
LL
LL
CI1
/21
where: Lir : is the number of employees in industry (i) in the region (n)
Lin : is the total number of employees in all industries in location-region (r),
Lr : is the total employment in the region (r)
Ln : is the total employment in the whole regions of the country
k: is the number of regions in the country
Table 2: Location Quotient Component Index for Regions & Activities in Greece, 1999
Regions \ Sectors
1 2 3 4 5 6 7 8 9 10
11
12
13
14
Agriculture
0,006
0,017
2,039
2,978
1,200
1,973
1,328
2,117
1,555
0,043
2,198
1,120
0,416
1,926
Fisheries
0,1
0,2
0,9
2,3
0,3
0,5
2,2
0,8
3,8
0,3
1,6
6,5
5,3
0,6
28
97
14
62
47
89
23
44
51
26
50
50
33
69
Mining
0,201
0,099
1,664
1,315
11,689
0,430
0,465
0,352
4,038
0,275
1,967
0,667
1,604
0,247
Manuf.Industries
1,194
1,595
0,797
4,038
0,972
0,690
0,484
0,616
1,172
1,227
0,588
0,569
0,483
0,427
Electricity
1,237
0,609
0,529
1,331
5,018
0,625
0,442
0,627
0,943
1,239
1,001
1,188
1,237
0,683
Construction
0,842
0,780
0,774
2,569
1,274
1,011
1,254
1,212
1,195
0,941
0,992
1,517
1,701
0,842
Retail Services
1,221
1,375
0,779
3,273
0,759
0,841
0,997
0,765
0,738
1,208
0,739
0,936
0,947
0,796
Hotels –Restaurants
0,685
0,905
0,823
3,068
0,829
0,827
2,587
0,704
0,780
0,724
0,754
1,032
4,123
1,927
Transportations
1,486
0,993
0,631
2,311
0,605
0,547
1,169
0,764
0,750
1,447
0,712
1,485
1,098
0,633
Financial Organizations
1,822
1,123
0,433
2,398
0,557
0,505
0,455
0,503
0,412
1,697
0,620
0,690
0,521
0,586
Real Estate
1,659
1,598
0,411
3,063
0,611
0,537
0,562
0,456
0,587
1,570
0,488
0,719
0,763
0,521
Public Services
1,383
0,966
0,888
2,304
0,826
0,825
0,581
0,754
0,790
1,351
0,633
1,147
1,011
0,740
Education
1,232
1,381
0,807
2,973
1,031
0,988
0,636
0,804
0,861
1,175
0,764
0,891
0,532
0,912
Health Services-Social Protection
1,454
1,390
0,754
2,760
0,730
0,687
0,624
0,687
0,452
1,393
0,613
0,826
0,638
0,906
Other Activities
1,359
1,255
0,725
2,865
0,729
0,770
0,862
0,601
0,715
1,330
0,812
0,789
1,305
0,614
PrivateHouseholds
1,847
1,027
0,373
2,633
0,452
0,560
0,817
0,584
0,307
1,767
0,245
0,276
0,393
0,436
Other Organizations
2,369
0 0 0 0 0 2,553
0 0 2,119
0 0 0 1,374
Source: Our Estimations Note: 1 = Capital – Region of Athens 2 = Region of Thessalonica 3 = Region of East Macedonia and Thrace 4 = Region of Central Macedonia
223
“Sustainable Management and Development of Mountainous and Island Areas”

5 = Region of West Macedonia 6 = Region of Thessaly 7 = Region of Ionian Islands 8 = Region of West Greece 9 = Region of East Main / Sterea Greece 10 = Region of Attica 11 = Region of Peloponnesus 12 = Region of N. Aegean 13 =Region of S. Aegean 14 = Region of Crete
A location quotient greater than unity, indicates a higher clustering in location s relative to the whole country. When the CI is greater than unity there is a specialization for this particular activity – concentration index in the region that accounts the most of the employment in this specific region. From the other hand, when the CI is equal to a unity there is non-specialization in this particular activity – concentration in the region and the employment in this specific activity in the region is more or less the same with that of the national level. Likewise, a location quotient less than unity indicate that an economic activity is relatively less concentrated. We can use the location quotients to measure the level of clustering of industry clustering and trace the changes of economic development using location quotients at county level over the past three decades.
Table 3: Urban Space Concentration Component Index of Regions-Activities in Greece, 1999
Regions Urban Space Concentration Index
Agriculture 0,0000008 Fisheries 0,0000015 Mining 0,0000022
Manufacturing Industries
0,0000007
Electricity 0Construction 0,0000018
Retail Services 0,0000133 Hotels –
Restaurants 0
Transportations 0Financial
Organizations 0
Real Estate 0,0000024 Public Services 0
Education 0,0000103 Health Services & Social Protection
0,0000046
Source: Our Estimations
We have used the available data-set from Greece derived from National Statistic Search of Labour Force, in order to investigate at a sectoral and regional analysis the ranking of cohesion and disparities. Tables 2 and 3 illustrate the results of indexes component analysis. Table 4 illustrates the basic economic and social data and indices for Greece imcluded the whole country and also for Cyclades in order to make several intercomparisons for the regional and sustainable growth process.
Table 4: Economic and Social Data for Greece
Greece Industry-Manufacturing-Construction Sectors 1994 1995 2000 2001 Number of Manufacturing-Construction Firms 48314 49362 - -Average Annual Employment--Persons 392905 388625 - -Annual Revenues, mill. Drs. 10542773 11006200 - -Number of Manufacturing Firms 36117 37056 82960 83606Number of Manufacturing Firms 353818 348663 - -Annual Reveneues of Manufacturing Firms, mill. Drs. And mill. Euro from 2000 9420955 9776121 34850,41 41505,14 Number of Construction Firms 12197 12306 80371 82187Average Annual Employment--Persons 39087 39962 - -Annual Revenues Construction Firms, mill. Drs. And mill. Euro from 2000 1121818 1230079 8598,78 10799,54 Number of Manufacturing Firms (Employees > 10 persons) 5945 5814 5016 3918 Value Added of Manufacturing Firms (Employees >10 persons), mill. Drs. 2143529,96 2325434 3455620,1 3771217,6 Sales of Manufacturing Firms (employes >10 persons) mill. Drs 5015612,59 5653818 8626653,47 8787423,4
Average Annual Employment (Employment > 10 persons) - - 233584 233340 Wages and Salaries of Manufacturing Firms (Employment > 10 persons), mill. Drs. - - 1216620,14 1283076,1 Licenses for New Manufacturing Firms 826 878 711 1156 Total HP of New Manufacturing Firms - - 115565 125350
Greece
Agriculture 1970 1982 1990 2003 Total cultivated hectaries 40792528 40626276 40030473 -
Irrigated agricultural hectaries 7793224 9678384 11831018 -
Greece
224
“Sustainable Management and Development of Mountainous and Island Areas”

Public Fiscal Management (mill.Drs.and thousands Euro from 2002) 1970 1982 1990 2003
Public Revenues 53468 571794 2761576 -
Public Payments 30281 353090 1723967 -
Indirect Taxes 36286 357193 1836049 -
Direct Taxes 8733 160829 798068 -Number of Tax Payers - 1723461 2521529 5126512
Greece
Investment (mill. Drs.) 1990 1995 1998 2003
Private Investment, mill Drs and thousands Euro from 2002 2451600 4182530 6279500 28439 Private Investment in Real Estate, mill Drs and thousands Euro from 2002 1116196 1350000 1903100 -Private Investment L.D.2234/23 ,Number of Approved Applications - 48 29 - Private Investment L.D. 23 , budget - 96425 41595 -
Private Investment 23 , total expenditures until 2/2000 - 72585 12975 - Private Investment 23 , subsidies until 2/2000 - 25406 4540 - Private Investment L.D. 2234/23 ,number of approved applications - 50 298 -
Private Investment L.D. 23 , budget - 22561 96550 - Private Investment L.D. 23 , total expenditures until 2/2000 - 20255 27750 - Private Investment L.D. 23 , subsidies until 2/2000 - 8102 11181 - Private Investment L.D. 2234/23, number of approved applications - 98 327 -
Private Investment L.D. 2234/23, budget - 118986 138145 - Private Investment L.D. 2234/23, total expenditures until 2/2000 - 92840 40725 - Private Investment L.D. 2234/23, subsidies until 2/2000 - 33508 15721 -Number of Manufacturing Firms (Employees > 10 persons) - 5814 5344 -Investment Number of Manufacturing Firms (Employees > 10 persons) - 369300 576598 -Public Investment, mill. Drs. And mill. Euro from 2002 575500 883441 1335600 5340 Total Investment, mill.Drs. And mill. Euro from 2002 3027100 5065971 7615100 33779 Investment included in Third CSFs-Private Investment until 31/12, thousand Euro - - - 1043787,19 Investment included in Third CSFs-Private Investment-SMEs until 31/12, - - - 347364,99
thousand Euro
Investment included in Third CSFs-Private Investment-Tourism until 31/12, thousand Euro - - - 340324,05 Total Investment included in Third CSFs 2000-2006, until 31/12, thousand Euro - - - 16563965
Greece
Commerce-Services 1969 1978 1995 2001 Number of Firms Wholesale Commerce 26760 25293 39998 62857Average Annual Employment-Persons (Wholesal Commerce) 85211 91343 126594 -Total Revenuesof Wholesale Commerce, mill.Drs and mill. Euro from 2000 - - 9397989 40841,69 Number of Firms Retail Commerce 134898 160599 89623 182285 Average Annual Employment-Persons (Retail Commerce) 237634 287459 238929 -
Greece
Population 1971 1981 1990 2002 Number of Permanent Inhabitants 8768641 9738945 10161019 10987559 Number of Inhabitants in Capital City 2548065 3027331 3099033 -
Surface, sq. khm. 131957 131957 131957 131957 Population Density, Inhabitants / sq.khm. 66,45 73,8 77 83,26
Urban Population 4675313 5670442 - -Semi-Urban Population 1019421 1125547 - -
Rural Population 3079999 2953870 - -
Labour Force 3243394 3543269 - -
Employees 3141684 3387990 - -
Unemployed 101372 63290 193811 -
Greece
Product-Income 1981 1990 2000 2001 Agriculture, mill.Drs. - 1409869 2741196 2847264
Mining, mill.Drs. - - 233315 241986 Manufacturing, mill. Drs. - 2092441 4231318 4550039
Energy, mill.Drs. - 457158 722622 786551 Construction, mill. Drs. - 1075520 2708465 3154050 Services, mill. Drs. - 8108110 26916025 29169504 Commerce, mill. Drs. - - 5328142 5835523Hotels and Restaurants, mill. Drs. - - 2708500 2969618Transport-Telecommunications, mill. Drs - - 2972525 3313499Financial Sector, mill. Drs - - 1891006 2021758Gross Value Added, mill. Drs, mill. Euro from 2002 - 13143098 37552941 40749394 Gross Domestic Product, mill. Drs, mill. Euro from 2002 1804182 13143098 41452557 44613450
225
“Sustainable Management and Development of Mountainous and Island Areas”

Agriculture as a % of GDP - - 7,29 6,98 Industry as a % of GDP - - 21,02 21,43 Mining as a % of GDP - - 0,62 0,59 Manufacturing as a % of GDP - - 11,26 11,16 Energy as a % of GDP - - 1,92 1,93 Construction as a % of GDP - - 7,21 7,74 Services as a % of GDP - - 71,67 71,58 Hotels and Restaurants as a % of GDP - - 7,21 7,28 Gross Domestic Product per capita as a % of Average of country 99,99 100 100 100 Gross Domestoc Product per capita, Drs. And Euro from 2002 - 1293537 3796906 4074305 Manufacturing as a % of Total Manufacuring of the Country - 100 100 100Services as a % of Services of the Country - 100 100 100Agriculture as a % of the Total Agriculture of the Country - 100 100 100Hotels and Restaurants as a % of Total Hotels and Restaurants of the Country - - 100 100GDP as a % of GDP of the Country 100 100 100 100
Greece
Tourism 1980 1990 2004 1980
Number of Beds 279566 438382 660976 9662 Number of Beds in 5 Stars Hotels - - 44865 -Number of Beds in 4 Stars Hotels - - 172411 -
Hotels - - 8843 -
Hotels 5 Stars - - 119 -
Hotels 4 Stars - - 907 -
Traditional Hotels - - - -Arrivals from Abroad 29596704 36298604 - 514888
Health 1970 1980 1990 2001 Number of Hospital Beds 54633 60067 51329 -Number of Public Hospitals - - - 141Number of Private Hospitals - - - 218
Number of Private Hospital Beds - - 15214 15806
Length of Stay - 15031627 12724561 -
Number of Doctors 14263 23469 34333 47944
Number of Dentists 1670 7646 10038 12394 Number of Drug-Stores 1739 4138 7463 -Number of Doctors per 1000 Inhabitants - - 3,37 4,37
Source: ESYE and Epilogi
Table 5: Economic and Social Data for Cyclades
Cyclades Industry-Manufacturing-Construction Sectors 1994 1995 2000 2001 Number of Manufacturing-Construction Firms 372 378 - -Average Annual Employment--Persons 560 569 - -Annual Revenues, mill. Drs. 14899 16179 - -Number of Manufacturing Firms 190 189 675 755Number of Manufacturing Firms 299 318 - -Annual Reveneues of Manufacturing Firms, mill. Drs. And mill. Euro from 2000 7901 9358 48,36 99,11 Number of Construction Firms 182 189 2058 2239 Average Annual Employment--Persons 261 251 - -Annual Revenues Construction Firms, mill. Drs. And mill. Euro from 2000 6998 6821 64,68 79,43 Number of Manufacturing Firms (Employees > 10 persons) 18 - 17 13Value Added of Manufacturing Firms (Employees >10 persons), mill. Drs. 2401,4 - 8653,36 14806,1 Sales of Manufacturing Firms (employes >10 persons) mill. Drs 4170,7 - 6692,93 6853,7
Average Annual Employment (Employment > 10 persons) - - 966 1056 Wages and Salaries of Manufacturing Firms (Employment > 10 persons), mill. Drs. - - 5155,09 6450 Licenses for New Manufacturing Firms - - 24 15Total HP of New Manufacturing Firms - - 2499 539
Cyclades
Agriculture 1970 1982 1990 2003 Total cultivated hectaries 492482 460234 379525 -
Irrigated agricultural hectaries 50790 52195 32385 -
CycladesPublic Fiscal Management (mill.Drs.and thousands Euro from 2002) 1970 1982 1990 2003
Public Revenues 76 1380 7758 -
Public Payments 115 996 5671 -
Indirect Taxes 36 589 4238 -
Direct Taxes 21 674 3058 -Number of Tax Payers - 11904 20318 54827
Cyclades
Investment (mill. Drs.) 1990 1995 1998 2003
226
“Sustainable Management and Development of Mountainous and Island Areas”
Private Investment, mill Drs and thousands Euro from 2002 - - - -Private Investment in Real Estate, mill Drs and thousands Euro from 2002 23147 37566 33436 -Private Investment L.D.2234/23 ,Number of Approved Applications - - 1 - Private Investment L.D. 23 , budget - - 3100 -
Private Investment 23 , total expenditures until 2/2000 - - 1378 - Private Investment 23 , subsidies until 2/2000 - - 482 - Private Investment L.D. 2234/23 ,number of approved applications - 1 - -
Private Investment L.D. 23 , budget - 700 - - Private Investment L.D. 23 , total expenditures until 2/2000 - 350 - - Private Investment L.D. 23 , subsidies until 2/2000 - 140 - - Private Investment L.D. 2234/23, number of approved applications - 1 1 -
Private Investment L.D. 2234/23, budget - 700 3100 - Private Investment L.D. 2234/23, total expenditures until 2/2000 - 350 1378 - Private Investment L.D. 2234/23, subsidies until 2/2000 - 140 482 -Number of Manufacturing Firms (Employees > 10 persons) - 19 19 -Investment Number of Manufacturing Firms (Employees > 10 persons) - 187 1347 -Public Investment, mill. Drs. And mill. Euro from 2002 3347 8310 - -Total Investment, mill.Drs. And mill. Euro from 2002 - - - -Investment included in Third CSFs-Private Investment until 31/12, thousand Euro - - - 813 Investment included in Third CSFs-Private Investment-SMEs until 31/12, thousand Euro - - - 863Investment included in Third CSFs-Private Investment-Tourism until 31/12, thousand Euro - - - 17083Total Investment included in Third CSFs 2000-2006, until 31/12, thousand Euro - - - 230156
Cyclades
Commerce-Services 1969 1978 1995 2001 Number of Firms Wholesale Commerce 225 151 257 404
Average Annual Employment-Persons (Wholesal Commerce) 382 284 336 -Total Revenuesof Wholesale Commerce, mill.Drs and mill. Euro from 2000 - - 23254 180,92 Number of Firms Retail Commerce 1660 1802 1334 3252 Average Annual Employment-Persons (Retail Commerce) 2359 2493 1065 -
Cyclades
Population 1971 1981 1990 2002 Number of Permanent Inhabitants 86337 88458 92871 110506 Number of Inhabitants in Capital City 13506 - - -
Surface, sq. khm. 2572 2572 2572 2572 Population Density, Inhabitants / sq.khm. 33,6 34,39 36,1 42,96
Urban Population 16082 - - -Semi-Urban Population 9798 - - -
Rural Population 60457 - - -
Labour Force 29580 - - -
Employees 29012 - - -
Unemployed 568 121 862 -
Cyclades
Product-Income 1990 2000 2001 Agriculture, mill.Drs. 14558 37343 37703
Mining, mill.Drs. - 10168 8319 Manufacturing, mill. Drs. 8958 10580 11300
Energy, mill.Drs. 19115 11182 11875Construction, mill. Drs. 21487 8311 9678 Services, mill. Drs. 74760 313563 339716 Commerce, mill. Drs. - 53352 58014Hotels and Restaurants, mill. Drs. - 40459 44359Transport-Telecommunications, mill. Drs - 39675 44226Financial Sector, mill. Drs - 17963 19205Gross Value Added, mill. Drs, mill. Euro from 2002 - 391147 418591 Gross Domestic Product, mill. Drs, mill. Euro from 2002 138878 431765 458284 Agriculture as a % of GDP 10,48 9,54 9Industry as a % of GDP 35,68 10,28 9,83 Mining as a % of GDP - 2,59 1,98 Manufacturing as a % of GDP - 2,7 2,69 Energy as a % of GDP - 2,85 2,83 Construction as a % of GDP - 2,12 2,31 Services as a % of GDP 53,83 80,16 81,15 Hotels and Restaurants as a % of GDP - 10,34 10,59 Gross Domestic Product per capita as a % of Average of country 115,6 103,97 102,17
227
“Sustainable Management and Development of Mountainous and Island Areas”

Gross Domestoc Product per capita, Drs. And Euro from 2002 1495449,07 3947817,82 4163075,95 Manufacturing as a % of Total Manufacuring of the Country 0,42 0,25 0,24 Services as a % of Services of the Country 0,92 1,16 1,16 Agriculture as a % of the Total Agriculture of the Country 1,03 1,36 1,32 Hotels and Restaurants as a % of Total Hotels and Restaurants of the Country - 1,49 1,49 GDP as a % of GDP of the Country - 1,04 1,02
Tourism 1990 2000 2002 2004
Number of Beds 22446 37394 37685 39024Number of Beds in 5 Stars Hotels - - 1094 1554 Number of Beds in 4 Stars Hotels - - 6420 6552
Hotels - 838 859 879
Hotels 5 Stars - - 9 12
Hotels 4 Stars - - 112 113
Traditional Hotels - 29 - -Arrivals from Abroad 664881 942928 879292 -
Cyclades
Health 1970 1980 1990 2001 Number of Hospital Beds 275 160 110 -Number of Public Hospitals - - - 1Number of Private Hospitals - - - -
Number of Private Hospital Beds - - - -
Length of Stay - 21817 18175 -
Number of Doctors 92 70 120 296
Number of Dentists 21 21 43 77 Number of Drug-Stores 14 21 50 -Number of Doctors per 1000 Inhabitants - - 1,29 2,68
Source: ESYE and Epilogi
4. Policy Implications and Conclusions
As a result of its geographic location, Greece's own security and welfare is closely linked to stability and economic prosperity in developing and transition countries in the Balkans, the Black Sea area and the eastern Mediterranean. As a developed and stable country in these complicated multicultural regions, Greece responds to development challenges in its neighbourhood. Greece also perceives it has a significant comparative advantage here, due to shared history and
cultural interaction, a high degree of mutual understanding, good political and trade linkages and its own recent development experience.
Sustainable ' principles are implemented through the following actions:
(a). Conservation and protection of high productivity agricultural land
(b). Prevention of the quality degradation of agricultural land (erosion, pollution from heavy metals etc.)
(c). Protection of the quality of surface and underground waters.
(d). Assessment of the impact of atmospheric pollution and greenhouse effect on cultivations, and research on pollution resistant cultivations
(g). Economic incentives to farmers for the conservation of endangered species of flora and fauna
(h). Protection and conservation of ecologically sensitive areas
During the first five-year programme, each of Greece's 13 implementing ministries/agencies received an annual budget allocation which they then managed semi-autonomously, including by negotiating bilateral agreements with each of their main partner countries. This contributed to an aid programme with a diverse range of small and short-term activities. To improve efficiency, Greece intends, during its second five-year programme, to reduce significantly the number of implementing ministries/agencies. In order to attain sustainable development Greece is focusing on the following targets:
Incorporation of the principles, values, sensitivities and priorities of ecology in sustainable development.
Balanced socio-economic development, reduction of differences between the so-called «developed» and «problematic» regions or between centre and periphery.
Decentralisation of activities and population. Improvement and development of potentials
of peripheral regions and survival of small towns and rural centres.
Mitigation and reversion of the trends of migration and urbanisation.
Reinforcement of the economic, social and cultural development of remote areas.
Reshapement of the local government's services and responsibilities.
Energy planning towards renewable energies.
228
“Sustainable Management and Development of Mountainous and Island Areas”

Enhancement of the social cohesion and the environmental and cultural identity of urban centres and minor settlements.
Conservation of the balance, harmony and diversity of the Greek nature and ecosystems.
Rational and integrated management, control and protection of water resources.
Abatement of coastal and marine pollution. Improvement of the urban environment and
living conditions (reduction of atmospheric and noise pollution in large urban centres, integrated and rational waste management).
Mitigation of unemployment problems and improvement of working and safety conditions.
Education, training and awareness raising for sustainable living patterns.
Promotion of international cooperation and implementation of international conventions.
Enhancement of the participation of major groups.
5. References
[1] Caves, Douglas W., Laurits R. Christensen, and W. Erwin Diewert (1982), «The Economic Theory of Index Numbers and the Measurement of Input, Output, and Productivity», Econometrica, pp. 1393-1413. [2] Diewert, Erwin W. (1976), «Exact and Superlative Index Numbers», Journal of Econometrics, pp.115-45. [3] Diewert, Erwin W. (1987a), «Index Numbers», in J. Eatwell, M. Milgate and P. Newman (eds.), The New Palgrave: A Dictionary of Economics. [4] Epilogi: Various Data, Athens, Greece. [5] Fisher, M. Franklin and Karl Shell (1998), Economic Analysis of Production Price Indexes, Cambridge University Press. [6] Guisan, M. Carmen & Cancelo, M. Teresa & Diaz, M. Rosario (1998) «Evaluation of the effects of European regional policy in the diminution of regional disparities». Working Paper no. 29 of the Series Economic Development, available on line. [7] Guisan, M.C. and Aguayo, E. (2004) «Comparative Studies of European Countries: Employment, population and regional development in Western and Central Europe: Econometric Models and Challenges of EU Enlargement», Applied Econometrics and International Development, Volume 4, Issue 2, April-June, pp. 129-142.
[8] Harberger, Arnold C. (1998), «A Vision of the Growth Process», American Economic Review, March. [9] Hatzimihalis Kostis (1992), «Regional Growth and Policy», Exantas Publishers, 1992. [10] Hill, Peter (1988), «Recent Developments in Index Number Theory and Practice», Economic Studies No. 10, OECD, Paris. [11] Hulten, Charles R. (1973), «Divisia Index Numbers», Econometrica 41. [12] Institute of Regional Development «The Contemporary Trends in the Regional Growth» Scientific Congress, Athens 1995. [13] KEPE (Center for Economic Research and Planning): «Regional Policy» / A Review for the Programme 1988-1992, Athens 1991. [14] Konsolas J. N..: «The Regional Economic Policy», Papazizis Publishers, second edition, Athens 1985. [15] Korres M. George and Dionysios Chionis, "Greek Economy: Economic Policy and Analysis of Basic Macroeconomic Sizes", Stamoulis Publishers, Athens 2003. [16] Malmquist, Sten (1953), «Index Numbers and Indifference Surfaces», Trabajos de Estatistica 4, pp. 209-242. [17] National Statistical Services of Greece (NSSG): Various Data, Athens, Greece. [18] OECD (2004), «Potential Output, Output Gaps, and Structural Budget Balances», (eds.) in Giorno et al, 2004, Paris, France. [19] Papadaki – G (1989), «The effect of Regional Policy in National and Community Level in the Structural Change of Economy of Greek Regions», Athens 1989. [20] Papadaskalopoulos A. (1995), «Models and Policies of Regional Growth», Papazisis Publishers 1995. [21] Richardson H (2000), «Regional Economy», Vol. 7th, Papazisis Publishers [22] Skountzos Theodoros (1989), «Regional Economic Analysis and Pol cy», Stamoulis Publishers, Athens, 1989 [23] Stefanou A. K. (2002): «The European Completion», Vol. A: General and Institutional Characteristics afterwards the Nice, Sixth Publication, 2002
229
“Sustainable Management and Development of Mountainous and Island Areas”

A M e t h o d f o r S e l e c t i n g S u s t a i n a b i l i t y St a t e E n v i ro n m e n t a l I n d i c a t o r s f o r I n s u l a r A re a s
Koulouri M. Department of Environmental Studies, University of the Aegean, University Hill, Mytilini,
81100, [email protected] I.
Department of Environmental Studies, University of the Aegean, [email protected] T.
Department of Geography, University of the Aegean, [email protected] I.
Department of Geography, University of the Aegean, [email protected]
Abstract. The notion of sustainability has become a modern catchword. Although it is used widely at the policy level, only few cases deal with its measurement, especially at the local level. Here, we develop and apply a practical tool at island level with the use of indicators selected and adapted from international agencies and institutes. The identification of the environmental state significant factors and the selection of the indicators are based on island characteristics and the fact that it is in the Mediterranean. The values of these indicators were calculated for the island of Paros, Greece. The findings reveal that the method can be of great use for sustainability evaluation and planning islands’ sustainable development.
Keywords. Islands, Environmental indicators, State Indicators; Sustainability Measurement.
1 . I n t r o d u c t i o n
Sustainability and sustainable development are notions that are widely used today in areas of research, policies, monitoring and planning. After their original adoption from the United Nations (UN) back in 1992, a number of different approaches have been developed, both at theoretical and practical levels. The outcome is that sustainability has become a modern ‘catchword’ that everyone uses, but its content and estimation methods vary. Most of these approaches however, even if they define it differently, aim at constructing measurement tools for evaluating policies. These methods can be classified into three categories: (a) sectoral methods of measurement; (b) methods based on the different dimensions of sustainability; and (c) integrated methods.
Most of the sectoral methods found in the literature are restricted to issues regarding enterprises and their performance [5], or sustainability and impact of specific sectors such as agriculture [20].
Measurements of the different sustainability dimensions include methods for:
(a) Economic dimension based on traditional economic methods and models, with the Index of Sustainable Economic Welfare (ISEW) a common one [6].
(b) Social dimension, based on the welfare of people and societies, including issues such as quality of life, social cohesion, human development etc. [9], mostly at the international level [19].
(c) Environmental dimension, such as the Environmental Sustainability Index (ESI) [28] and the Environmental Performance Index (EPI) [13] among others. A special category here is resource efficiency measures, such as the ecological footprint [26]. Also, here international organizations have developed conceptual frameworks for measuring sustainability such as the PSR (Pressure – State – Response), the DSR (Driving Forces – State – Response), and the DPSIR (Driving Forces - Pressure – State – Impact - Response) [16]; [24]; [11].
Integrated methods for measuring sustainability include methods that develop theoretical frameworks for the analysis and/ or assessment of sustainable development such as UNEP [25], among others [2]; [3]; [18]. Other methods assist the development and/ or selection of sustainability indicators, some with a single index [29]; [1] and others with many indicators [12]. The EU has incorporated sustainability and sustainable development in all its policies, with a so-called ‘three pillars approach’, which
230
simultaneously aims at the achievement of economic efficiency, social equity and cohesion and environmental conservation [5].
Here, we develop and apply a practical tool for sustainability measurement and improvement at the local level that of an island. The conceptual model behind the method is that of the DPSIR, adapted to include economic and social issues as well as environmental ones [22]. Overall, 9 indicators were selected for the state of the economy in the area, 11 for the state of society and 19 for the state of the environment [22]. In this paper, the approach of recording the environmental state with the use of selected indicators will be presented for a specific island, that of Paros in the South Aegean Region of Greece. In the next section the method is presented in some detail, along with the research conducted to apply it to the case study island. The presentation of the results follows with a discussion of the application of the method in the particular case study and its positive and negative points.
2 . M e t h o d s a n d D a t a
2.1 The Method Developed
In the DPSIR framework, the state of the environment at the local level is presented with the use of selected indicators. By state of the environment, we refer to the quality and quantity of the environmental resources under change or pressure from human activities. This definition is adopted to highlight the problems and then offer solutions that eventually will improve the state of the environment. The indicators used are scale specific and site specific. Different scales (e.g. international, national, local) allow focusing on different aspects and issues that are more significant and relevent for the environment at each scale. Especially for environmental issues, scale is very important because as the level of detail grows, different spatial and temporal aspects of the environment have to be taken into account. At the same time, different localities also require different indicators, as the importance of most of the environmental issues differs in different localities.
In this particular approach, the method is developed for a small island, that of Paros (and the smaller island of Antiparos). The identification of the most significant factors for the environmental state in such a locality is performed with producing a general matrix of
environmental issues and selecting the significant factors by their relevant importance for the study area. This matrix (Table 1) is divided in five unities (visually five columns): (a) the ecosystem type which is considered to be the basic environmental unit designating natural resources quality and quantity and human activity intensity; (b) biotic and abiotic resources in each of these types; (c) liquid, gas and solid waste for each ecosystem type; (d) natural dangers and catastrophes; and (e) ecosystemic functions that change or threats resulting from changes in the previous unities. In the horizontal dimension of the matrix, concepts mentioned once are not repeated (e.g. the flora and fauna of the biotic resources correspond to all ecosystem types but are only mentioned once). Three types of ecosystems were considered: natural, agricultural and built. Natural ones were further subdivided to terrestrial, inland waters, coastal and marine ones; the agricultural ones are divided to cultivated and grazing lands; and built areas were divided to settlements, tourism areas (is separate from settlements), infrastructure and industry – manufacture areas.
The selection of the significant factors and threats for the area studied from this general matrix is done according to environmental, social and economic criteria compiled with the use of previous research (especially [16]; [10]; [24]).
The study area, small Mediterranean islands (in contrast with bigger islands like Corse, Crete, etc.) are thus characterized by:
(a) Insularity, which involves small spatial scale, limited natural resources, accessibility problems and high population variability during the year [20].
(b) “Mediterraneanity”, which involves (i) a climate characterized by long, dry and hot summers and short and intense rainfalls in a short period of winter [8]; (ii) a relief of mountain areas of high gradients and variability of geology and soil types [8]; [4]; (iii) strong human presence and shaping of landscapes in most of the areas for long time periods, leading to semi-natural habitats and environments that fluctuate with economic and social changes. Moreover, human presence is connected with cultural heritage, which is regarded as an asset and a resource for the area and at the same time imposes restrictions on economy and land use.
(c) An economy based on tourism and services mostly, but also on small scale, family agriculture. In the approach employed here, we are interested in the more “dynamic” sectors of
231
“Sustainable Management and Development of Mountainous and Island Areas”

the economy. By “dynamic”, or “competitive” activities we refer to activities that can be characterized as ‘exporting’, namely products or services that bring incomes to the area and not those that are mostly for the local civil sector that recycle existing incomes (e.g. commerce, public administration, education services). Such activities for the areas in question are considered agriculture (in the extent that it may produce products that are exported from the islands) and tourism services.
From the analysis of the functions, threats and particularities that are studied (Table 1), five environmental factors were considered as most important for the local level: (a) biodiversity; (b) land use; (c) water quantity and quality; (d) soil quantity and quality and; (e) urban environment. The indicators that are selected for each of these factors are taken from existing approaches from international agencies and institutes [10]; [24]; [12]; [17]. Some were adapted to the particularities of the Mediterranean islands’ conditions and in addition some new indicators were created according to this study’s requirements. Overall, 19 indicators were selected for the state of the environment [22] (Table 2).The selected significant environmental factors are:
(i). Biodiversity or biological diversity measures ecosystem and species richness in an area. Three different ‘levels’ are used: genetic, species and habitat diversity. Higher levels of biodiversity are generally linked with environmental stability and better state of the environment. Protection and protected areas are essential in preserving biodiversity [24] and the percentage of such areas can serve as an indicator of the existence of ecosystems that are rare or endangered or are habitats for rare or endangered species. Here, it is covered by two indicators (I1, I2), measuring the percentage of protected areas as a whole and per type of ecosystem. These indicators are considered as Response in the DPSIR framework, but are used here as it is assumed that they can assess biodiversity at the local level.
(ii).Land uses are indicators of the environmental state and their changes assess pressures on the environment due to human actions. The type of land use defines or affects species and soil and water resources [16] and the type of change can alter the state of an area permanently, especially when it involves building or infrastructures. Land uses also shape landscapes and their changes alter the functions
and forms of these landscapes. Land use change is covered by five indicators. The first of these is actually a series of indicators, with values as many as the land uses that are measured in the area (I3). The rest of the indicators cover important aspects of land use change like fire (I4), sparse built-up area in general (I5) and in particular for coastal areas (I6) where the pressures are greater in tourism islands and land use diversity with the use of Shannon’s index (I7) [27].
(iii). Water quantity and quality is an environmental issue of great importance and refers to marine, coastal, surface and underground waters. For each of these ecosystems, different issues are more important, according to the type of pressures applied on them. Especially for, surface and underground water quality is very important. On islands, surface waters are rare and most of the water used for drinking and irrigation comes from the underground aquifers via pumping. At the same time, coastal waters are a vital tourism resource and their quality is of great importance. Here, it is covered with five indicators, measuring underground water quantity (I8) and drinking water quality (I9) (measured by the concentrations of a number of chemical compounds and elements according to EU directives 75/440 and 98/83/EE and relative national legislation). Available water in storage reservoirs (I10) is also measured, along with desalinated or imported water (I11) that indicates local scarcity of drinking water. Finally, bathing water quality (I12) is measured according to EU Directive 76/160/EEC.
(iv). Soil quantity and quality is also an environmental issue of great importance and is mostly related to cultivated soils that are under more pressures than the rest. Apart from the type of land use, farming practices and management techniques are very important for determining the intensity of pressures on soils [11]. In the Mediterranean, the threats on soils come mostly from erosion and quality degradation that can cause desertification [23]. Degraded soils are less productive and support less diverse ecosystems and this degradation is usually permanent [24]. There are also soils that are affected from actions such as landfills and waste treatment in general. These soils may be severely degraded but on a small scale compared to agricultural lands. Here, Soil quality and quantity is measured with four indicators, a complex index [14] of Environmental Sensitive Areas to desertification
232
“Sustainable Management and Development of Mountainous and Island Areas”

(I13), a series of indicators for the different types of cultivated land per category of practices intensity (low, medium, great)(I14), the percentage of the organic farming area (I15) and the solid waste landfill area (I16).
(v). Urban environment includes settlements, tourist areas, infrastructures and industry – manufacture areas. Each of these types generates different pressures on the environment. Besides waste generation and land use change, the quality of the built environment is also related to the quality of life in it (landscape, commonly used areas, traffic, noise, microclimates, etc.). On islands with high tourism intensity, air pollution is not very important, although traffic and noise issues can be severe seasonally. Here, urban environment is covered with three indicators measuring non built-up urban areas in the total urban area of the main settlement (I17), the number of cars per km of road (I18) and the percentage of renewable energy produced per total conventional energy produced (I19).
2.2 Data for the Application of the Method
Data for calculating the values of the selected indicators were derived through primary research and from official sources (published or unpublished). Research was required due to unavailability of monitoring data even for relatively simple issues, such as the land uses or the water reserves of the island in question. As land uses and their changes are central to the approach developed here, an exact calculation was essential. This was accomplished via photograph interpretation of aerial photos of 1996, the most recent available. These photographs were digitally corrected and 16 different categories of land uses were calculated (Table 3). Field observations were conducted in winter 2006 for disputed areas. Overall, the data sources and the calculation method (where applicable) are presented in detail in Table 2.
3 . A p p l i c a t i o n o f t h e M e t h o d a n d F i n d i n g s
Paros is a medium size island of the Aegean Sea Greek islands (approximately 230 km2), with a population of 12,853 inhabitants (2001). It is a tourism dependent island and a popular summer destination for Greeks and foreigners. It can be reached via ferry-boat from Pireas port and airplane from Athens airport. It can be regarded as one of the most accessible Aegean islands
[23]. In the past, agriculture was also developed, due to the extended plain areas and fertile soils comparatively to most small neighboring islands, but nowadays it is abandoned. Today, 11% of the active population is still employed in agriculture, most aged.
Table 3. Area per ecosystem type and areas under protection on Paros
Type of ecosystem
under protectio
n(NATURA 2000)
Land use class (aerial photo
interpretation)
Land use type Total area in km2 (%)
Area for
protection in km2
(%)
Arable land High intensity agricultural land 70.11 30.5) 0.2 (0.3)
Tree crops Low intensity agricultural land 14.35 (6.2) Cultivated
land
Vines Medium intensity agricultural land 6.80 (3.0)
Shrub (<10%) graze land 77.0 (33.6) Shrub (10-40%) graze land 17.14 (7.5)
Mediterranean bushes (maquis) Shrub (>40%) Natural shrubland 27.4 (11.9)
9.37 (7.7)
Forest Forest 0.33 (0.1) Forests Forest (10-40%) Forest 0.15 (0.1)
0.1 (21)
Coastal urban settlements 2.03 (0.9) Sparse urban area settlements 4.06 (1.8) Built areas Settlements, infr. settlements 3.09 (1.3)
0.04 (0.4)
Bare rock other 5.75 (2.5) Coastal rocky Quarry other 0.49 (0.2) 0.44 (7.7)
Coastal sandy Sandy beaches other 0.54 (0.2) 0.44
(81.3)
Freshwater Rivers surface water 0.24 (0.1) 0.24(100)
Wetlands Lakes – wetlands surface water 0.07 (0.0) 0.04(55.6)
Total 229.6 (100) 10.87 (4.7)
For considering the biodiversity factor, two areas of Paros are placed among the sites to be protected in the NATURA 2000 network: the area Petaloudes on Paros island (GR4220016) and small islets Despotiko and Stroggilo(GR4220017) of total land area 10.87 km2 (4.7% of the total). These areas include cultivated land, Mediterranean maquis vegetation, forests, settlements, coastal rocky ecosystems, coastal sandy ecosystems, freshwater and wetlands (Table 3). Some of the most important and fragile types (such as wetlands, sandy beaches and rivers) are under protection in a great extent, along with forests.
For land uses, 16 different types were identified (Table 3): 3 types of cultivated land (arable; trees; vines), 2 types of grazing land distinguished by the density of shrubs (<10%; 10-40%), 1 type of natural shrubland, 2 types of forest also distinguished by tree density (dense forest; 10-40%), 3 types of built areas (coastal urban; sparse urban; settlements, airport, infrastructure), 2 types of surface waters (rivers; lakes – wetlands) and 3 other (bare rock; quarry; sandy beaches). Most of the area is shrub (53% of the total area), which is grazed at different
233
“Sustainable Management and Development of Mountainous and Island Areas”

degrees of intensity and an important part (30.5%) is arable land. Urban areas are less in size than sparse built up areas, revealing urban sprawl, especially in coastal areas. Burnt areas are few on the island and in 2003 only 7 incidents occurred burning a small percentage of cultivated and grazing land (Table 2). Overall, the different patches are small and diversity values are high, a positive result, although local differences can be important, especially between hilly and plain areas and coastal and non coastal, with higher diversity in plain and coastal areas.
Drinking water quality is in general satisfactory, as all measurements of 2005 are always below the official limits, with the exception of one measurement for which further monitoring is required. Nevertheless, microbial measurements are not conducted (as the water is chlorined), neither analysis for pesticides or organic substances in general. Moreover, monitoring is inconsistent and the possibility of seasonal or accidental high or low values can not be estimated. Coastal water quality is also satisfactory for all 17 points of sampling, with the exception of 2 sites in 2002 and 6 sites in 2003 (high values but lower than the limits). These measurements indicate point local sources of organic waste that require further monitoring to identify them. But, older measurements indicate that the state of coastal water quality is improved, as the values of tar, organic waste and oils is significantly reduced since 1994 when annual monitoring begun.
Water quantity indicators show that the drinking water is not enough as 450,000m3 are desalinized each year with maximum daily rate at 1,200 m3. Underground water is theoretically enough (8,960,000 m3 together with the island of Antiparos), but not all of it can be used. Supplementary fresh water is stored in small dams approximately at 220,000 m3 per year (3% of the underground reserve) and it is used for irrigation, as it is available only in winter months, where demand is lower than summer, where tourists increase the population demand for fresh water.
Soil quality is at risk on Paros. The ESAI method results (Figure 1) reveal that a significant part of the island is under desertification threat (79% of Paros and 81% of Antiparos are classified as critical), especially hilly grazed areas. Brave decisions both at EU, national and local policy levels are required to reduce this risk, as management practices are held responsible for this situation to a great extent.
Such decisions should include reducing grazing pressure and maintaining terraces among others. These findings are verified by the intensity of agricultural land uses (cultivated and grazing lands). Although exact and comparable data are not available for all types of land use, the grazing pressure (number of grazing animals per ha of grazing land) is overall high (in total 1,533 cows, 4,091 sheep and 6,446 goats graze the 94,190 ha of grazing lands, resulting to densities of 3.1 Animal units/ha), but locally it is even higher, leading to increased risks of soil degradation. Arable land on Paros is mostly irrigated vegetables, irrigated animal feed and non irrigated cereals. The first two types can be considered of high intensity for the islands resources. The rest land use types (olives and vines) are considered of lower intensity, but hold together 18% of the total area (Tables 2 and 3). Moreover, organic farming is very limited and only on less intensive uses (olives and vines). Finally, the area where untreated solid waste is laid is small (0.105 km2 or 0.05 % of the area), but it is a source of point pollution, especially since waste is untreated.
The state of the urban environment appears to be overall satisfactory, but averages can be misleading. The percentage of open spaces stands at 20% of the total urban areas in the main settlement of the island, but a closer look reveals that the way this settlement is built leaves no open spaces in its old and preserved centre and the wider spaces are located in the more recently built edges. As the centre is traditional and part of the islands’ identity, this situation will not change. Therefore, traffic problems are severe in the tourism peak season. Finally, the local branch of the Public Energy Enterprise provided no data for renewable energy sources on the island. Our experience and local informants converge that there are no such sources besides domestic solar water heating. All the indicators’ values and an initial assessment are summarized in Table 2.
4 . D i s c u s s i o n
The method developed here for the estimation of environmental sustainability state at a local scale and its application on the island of Paros has revealed a number of issues for such methods:
(i) Although there is no standard monitoring method for the environmental state in Greece, data for many of the indices used here (with the exception of land use allocation) are available
234

from different public services (National, Regional or local). An agency that could collect the data from all these sources could monitor the environmental state at all levels.
(ii) Local scale environmental sustainability state estimation is a difficult target, more difficult than higher spatial level approaches (regional, national, international. As the level of detail grows, averages prove less and less suitable and explicit spatial specialization is required. Some examples of how averages shade local issues are grazing pressure that available data do not allow its spatial allocation and water quantity and quality, where acceptable average values may hide local problems. This is an inherent problem of environmental issues at all spatial levels, but the local level appears more troublesome, as more seasonal concerns may be applicable as well. In the case study used here, the overall environmental state of Paros appears as less than acceptable, but more severe problems may shade themselves underneath this overall assertion.
(iii) Constant monitoring is required if the method presented here is to produce useful results. The values of the indicators provide a baseline for an initial assessment and for further reference. Different indicators require different monitoring time scales to cover seasonal issues as well. The unavailability of an existing monitoring system implies that such a system should be build. If so, then these findings could be used for identifying the causes that the state is not satisfactory and respond to these causes to improve the sustainability state eventually.
(iii) The fact that the case study is an island is very helpful in determining people, material and energy flows. Indeed, islands are exemplary cases for these types of estimations at local level, revealing both their strength as concrete spatial entities, but also their weakness, in the sense that separate estimations are necessary for each island, while in continental areas ‘summing up’ can be easier.
The method presented here has provided an initial but necessary step for environmental sustainability state evaluation and eventually planning for sustainable development at the local scale. It has produced a set of indicators and applied them to an island to underline the strong and weak points. Further research is required for its connection with planning procedures and monitoring systems for its application.
A c k n o w l e d g m e n t s
The method and its application were financed by the ISTOS program (Innovation for Sustainable Tourism and Services in the South Aegean, Action 1.1 of Activity 7.1), a co-financed regional innovation program (by EC and the Greek Ministry of Economics and Finance).
R e f e r e n c e s
[1] Anderson J, Nicol S, Ng M, Veale A, Imberger I. The sustainability index for Western Australia: a methodological framework for the contribution of a new measure of progress. Proceedings of the International Conference Nature, Science and Social Movements; 2004 June 25-28; Mytilene, Greece; 2004.
[2] Bell S, Morse S. Sustainability indicators: measuring the immeasurable. London: Earthscan; 1999.
[3] Bell S. Morse S. Experiences with sustainability indicators and stakeholder participation: a case study relating to a ‘Blue Plan’ project in Malta. Sustainable Development 2004; 12: 1-14.
[4] Brant C J, Thornes J. B. Mediterranean desertification and land use. London: John Wiley and Sons; 1996.
[5] CEC. Draft declaration on guiding principles for sustainable development. COM(2005) 218 final. Brussels: CEC; 2005.
[6] Dalal-Clayton B, Sadler B. Sustainability appraisal: a review of international experience and practice. IIED; 2005.
[7] Daly , Cobb B J. For the common good: redirecting the economy toward community, the environment and a sustainable. London: Greenprint 1990.
[8] Di Castri F. Mediterranean-type shrublands of the world. In: Di Castri F, Goodall, Specht editors. Ecosystems of the World-Mediterranean–type shrublands. The Netherlands: Elsevier; 1981.
[9] Duhaime G, Searles E, Usher J P, Myers H, Fréchette P. Social cohesion and living conditions in the Canadian Arctic: from theory to measurement. Social Indicators Research; 2004; 66: 295–317.
[10] European Commission. Towards environmental pressure indicators for the EU. Luxembourg: European Commission,
235
“Sustainable Management and Development of Mountainous and Island Areas”
http://www.e-m-a-i-l.nu/tepi/document.htm;1999.
[11] EEA. Indicator Factsheet, Signals 2001. www.eea.eu.int/indicators; 2001.[12] GHK, PSI, IEEP, CE & National Evaluators. The Thematic Evaluation on the Contribution of the Structural Funds to Sustainable Development. Final Report to the European Commission, DG REGIO, ECOTEC Research and Consulting Ltd, Birmingham, Brussels, London, Madrid; 2002.
[13] Hoti S, Pauwels L L, McAleer M. Measuring environmental risk. Proceedings of the iEMS Conference; 2004; June 7-9; Copenhagen Denmark; 2004.
[14] Kosmas C, Kirkby M, Geeson N, editors. Manual on key indicators of desertification and mapping environmentally sensitive areas to desertification. The MEDALUS project: Mediterranean Desertification and Land Use. EC; Luxemburg; 1999.
[15] OECD. OECD core set of indicators for environmental performance reviews. OECD Environment Monographs No. 83. Paris: OECD ; 1993.
[16] OECD. Environmental Data, Compendium 2002. Paris: OECD; 2002.
[17] OECD. OECD environmental indicators: development, measurement and use. Reference Paper. Paris: OECD; www.oecd.org/env; 2003.
[18] Ravetz J. City region 2020. Integrated planning for a sustainable environment. London: Earthscan Publications; 2000.
[19] Sirgy M J, Lee D J, Miller C, Littlefield E J. The impact of globalization on a country’s quality of life: towards an integrated model. Social Indicators Research; 2004; 68: 251-298.
[20] Smith C S, McDonald G T. Assessing the sustainability of agriculture at the planning stage. Journal of Environmental Management; 1998; 52: 15-37.
[21] Spilanis I. Qualité versus quantité: une stratégie durable pour les îles’. In Meistersheim A. Editor. L’île laboratoire, Ajaccio: Alain Piazzola; 1998.
[22] Spilanis I, Kizos T, Kondili J, Koulouri M, Vakoufaris H. Sustainability Measurement In Islands: The Case Of South Aegean Islands, Greece. Proceedings of the Conference Biodiversity conservation and sustainable development in mountain areas
of Europe; 2005; Sep 20-24; Ioannina, Greece; 2005.
[23] Spilanis I, Kizos T, Kondili I, Misailidis N. Accessibility and attractiveness of Aegean Islands. Aeihoros; in press (in Greek).
[24] UNCSD. Indicators of sustainable development: guidelines and methodologies. New York: UN; 2001.
[25] UNEP. Integrated assessment and planning for sustainable development. Guidelines for pilot projects. UN; 2004.
[26] Wackernagel M, Rees W E. Our ecological footprint: Reducing human impact on the earth. New Society Publishers; 1996.
[27] Wacsher D M. Agri-Environmental Indicators for Sustainable Agriculture in Europe. The Netherlands: ECNC; 1999.
[28] Yale Center for Environmental Law and Policy and Center for International Earth Science Information Network. 2005 Environmental Sustainability Index. Benchmarking National Environmental Stewardship. USA: Center for Environmental Law and Policy www.yale.edu/esi; 2005.
[29] Zoeteman K. Sustainability of nations. International Journal of Sustainable Development and World Ecology; 2001; 8: 93-109.
236
“Sustainable Management and Development of Mountainous and Island Areas”

Tab
le 1
. Sp
ecif
icat
ion
of
a g
ener
al e
nvi
ron
men
tal p
rob
lem
s m
atri
x fo
r th
e ar
ea s
tud
ied
R
esou
rces
W
aste
Ec
osys
tem
Bi
otic
Ab
iotic
Cu
ltura
l Li
quid
So
lid
Gas
eous
Dan
gers
/ na
tura
l ca
tast
roph
es
Func
tions
/thre
ats
Env
iron
men
tal i
ssue
s
Red
uctio
n of
flor
a an
d fa
una
dive
rsity
U
nder
grou
nd w
ater
qua
lity
and
quan
tity:
Exh
aust
ion,
ov
erex
ploi
tatio
n; S
alin
izat
ion
Und
ergr
ound
wat
er q
ualit
y an
d qu
antit
y
Land
use
cha
nges
: Lan
d cl
eari
ng; A
band
onm
ent;
Bui
ldin
gSp
arse
and
unp
lann
ed b
uild
ing
Fire
s Fi
res
Floo
ds
Eros
ion
Des
ertif
icat
ion
Des
ertif
icat
ion
Land
scap
e ch
ange
Pr
otec
ted
habi
tats
and
spec
ies
Prot
ecte
d ha
bita
ts a
nd sp
ecie
s C
oast
al w
ater
qua
lity:
Eut
roph
icat
ion;
Dep
ositi
on; I
lluvi
atio
n C
oast
al w
ater
qua
lity;
Lan
dfill
Su
rfac
e w
ater
qua
lity
Surf
ace
wat
er q
ualit
y
Nat
ural
:Te
rres
tria
l
Wat
er
Coa
stal
Mar
ine
Flor
a
Faun
a
Mic
ro-
orga
nism
s
-So
il -
Und
ergr
ound
aq
uife
rs
-Ro
cks
-M
iner
als
-Cl
imat
e -
Wat
er
-Co
asta
l fo
rmat
ions
-
Mar
ine
soil
form
atio
ns
Land
scap
e
Recr
eatio
n
Soil
mat
eria
l fro
m e
rosi
on
Fire
s Ea
rthqu
akes
Fl
oods
/sto
rms
Land
slid
es
Dro
ught
M
ajor
ship
ac
cide
nts
Sea
wat
er q
ualit
yFa
rmin
g pr
actic
es: c
onve
ntio
nal o
r su
stai
nabl
e O
rgan
ic /
sust
aina
ble
agric
ultu
re
Soil
salin
izat
ion
Soil
crus
ting
Ferti
lity
degr
adat
ion
Prod
uctiv
ity d
egra
datio
n C
hem
ical
subs
tanc
es u
se
Che
mic
al su
bsta
nces
use
M
onoc
ultu
re
Cul
tivat
ed sp
ecie
s – A
nim
als r
aise
d C
ultiv
atio
n te
rrac
es m
aint
enan
ce
Nat
ural
veg
etat
ion
clus
ters
mai
nten
ance
L
ocal
/ ad
apte
d sp
ecie
s and
var
ietie
sO
verg
razi
ng
Ove
rgra
zing
Fi
res
Flor
a an
d fa
una
dive
rsity
redu
ctio
nU
nder
grou
nd w
ater
qua
lity
and
quan
tity:
Exh
aust
ion,
ov
erex
ploi
tatio
n; S
alin
izat
ion
Land
use
cha
nges
: Lan
d cl
eari
ng; A
band
onm
ent;
Bui
ldin
gA
band
onm
ent
Eros
ion
Des
ertif
icat
ion
Land
scap
e ch
ange
Agr
icul
tura
lC
ultiv
atio
ns
Gra
ze la
nds
Culti
vate
d sp
ecie
s –
Ani
mal
s ra
ised
Flor
a
Faun
a
Soil
Und
ergr
ound
aq
uife
rs
Roc
ks
Land
scap
e
Recr
eatio
n
Agr
icul
tura
l la
nd ru
noff
Eros
ion
sedi
men
ts
Bio
tech
nolo
gy
Dis
ease
s of
larg
e sc
ale
Fire
s Ea
rthqu
akes
Fl
oods
/sto
rms
Land
slid
es
Dro
ught
Prot
ecte
d ha
bita
ts a
nd sp
ecie
s U
ntre
ated
liqu
id w
aste
U
ntre
ated
liqu
id w
aste
U
ntre
ated
solid
was
te
Unt
reat
ed so
lid w
aste
G
as e
mis
sion
s G
as e
mis
sion
s Tr
ansp
ort /
traf
ficU
npla
nned
bui
ldin
gIm
perm
eabl
e ar
eas i
ncre
ase
Urb
an e
nvir
onm
ent q
ualit
y U
rban
env
ironm
ent q
ualit
y
Built
Se
ttlem
ents
, To
uris
t are
as,
Indu
stry
- M
anuf
actu
re
A
tmos
pher
e
Cultu
re
Unt
reat
ed
urba
n w
aste
U
ntre
ated
in
dust
rial
was
te
Unt
reat
ed
urba
n w
aste
U
ntre
ated
in
dust
rial
was
te
Veh
icle
em
issi
ons
Indu
stry
w
aste
Fire
s Ea
rthqu
akes
Fl
oods
/sto
rms
Land
slid
es
Dro
ught
E
nerg
y pr
oduc
tion
Ener
gy p
rodu
ctio
n
Bold
: thr
eats
of h
igh
signi
fican
ce fo
r th
e ar
ea st
udie
d; It
alic
s: th
reat
s of m
ediu
m si
gnifi
canc
e fo
r the
are
a stu
died
; Gre
y co
lore
d: th
reat
s of l
ow sf
or th
e ar
ea st
udie
d
237
“Sustainable Management and Development of Mountainous and Island Areas”

Tab
le 2
. Sec
tors
of
the
stat
e o
f th
e en
viro
nm
ent
of
the
area
stu
die
d, i
nd
icat
ors
use
d p
er s
ecto
r, d
ata
sou
rces
an
d c
alcu
lati
on
met
ho
d
Envi
ronm
ent
al Is
sue
Indi
cato
rs (m
easu
rem
ent u
nits
) D
ata
sour
ces (
year
); C
alcu
latio
n m
etho
d R
esul
ts
Ass
essm
ent
I1 .P
rote
cted
are
a / t
otal
are
a (%
) M
inis
try o
f Env
ironm
ent,
Spat
ial P
lann
ing
and
Publ
ic W
orks
dat
abas
e on
NA
TURA
200
0 si
tes a
nd M
inist
ry o
f A
gric
ultu
re, I
nter
pret
atio
n of
aer
ial p
hoto
s (19
96)
4.7
%
++
Bio
-di
vers
ity
I2. P
rote
cted
are
a pe
r ty
pe o
f ec
osys
tem
/ tot
al
area
(%)
Min
istry
of E
nviro
nmen
t, Sp
atia
l Pla
nnin
g an
d Pu
blic
Wor
ks d
atab
ase
on N
ATU
RA 2
000
site
s and
Min
istry
of
Agr
icul
ture
, Int
erpr
etat
ion
of a
eria
l pho
tos (
1996
) Ta
ble
3 ++
I3. L
and
use
area
per
land
use
/ tot
al a
rea
(%)
Min
istry
of A
gric
ultu
re, I
nter
pret
atio
n of
aer
ial p
hoto
s (19
96)
Tabl
e 3
+
I4. B
urnt
are
a pe
r lan
d us
e/ to
tal a
rea
(%)
Fire
Dep
artm
ent o
f Par
os (2
003)
and
Min
istry
of A
gric
ultu
re, I
nter
pret
atio
n of
aer
ial p
hoto
s (19
96)
Cul
tivat
ed la
nd 0
.04%
G
razi
ng la
nd 0
.2%
++
I5. S
pars
e bu
ilt-u
p ar
ea /
tota
l are
a (%
) M
inis
try o
f Agr
icul
ture
, Int
erpr
etat
ion
of a
eria
l pho
tos (
1996
) 2.
7%
- I6
. Bui
lt-up
coa
stal
are
a/ to
tal a
rea
(%)
Min
istry
of A
gric
ultu
re, I
nter
pret
atio
n of
aer
ial p
hoto
s (19
96)
0.8%
-
Land
use
ty
pes
I7.
Div
ersi
ty o
f la
nd u
se (
Shan
non’
s in
dex,
nu
mbe
r)
Min
istry
of
Agr
icul
ture
, In
terp
reta
tion
of a
eria
l ph
otos
(19
96);
Cal
cula
tion
with
Sha
nnon
equ
atio
n [2
7]
ji
ji
pp
bH
//
ln)
(;H
(b) s
tand
s fo
r lim
it di
vers
ity b
etw
een
diffe
rent
land
use
pat
ches
, Pi/j
sta
nds
for
the
perc
enta
ge o
f the
lim
it be
twee
n ne
ighb
ourin
g pa
tche
s i a
nd j
for t
he to
tal n
umbe
r o
f lim
its in
the
area
++
I8. F
resh
wat
er re
sour
ces q
uant
ity (m
3 )W
ater
res
erve
s m
anag
emen
t pr
ogra
m f
or G
reec
e (2
002)
and
met
eoro
logi
cal
data
(19
98-2
002)
; Ca
lcul
atio
ns
with
use
of “
Theo
retic
al e
xist
ing
grou
nd w
ater
pot
entia
l” (m
3 * 1
0-6) t
hat r
epre
sent
s th
e m
axim
um q
uant
ity o
f w
ater
that
can
be
stor
ed in
the
aqui
fers
of t
he a
rea
(in m
ost c
ases
30-
40%
can
act
ually
be
used
) 8.
96 m
3 *10-6
++
I9.
Qua
lity
of d
rinki
ng a
nd i
rrig
atio
n w
ater
(c
once
ntra
tion
of c
hem
ical
s, pp
m, p
pb)
Publ
ic E
nter
pris
e fo
r D
rinki
ng W
ater
and
Sew
ages
of
Paro
s (2
005)
; Ca
lcul
atio
ns a
ccor
ding
EU
Dire
ctiv
es
75/4
40/E
E, 9
8/83
/EE
and
2000
/60/
EE
Acc
epta
ble
+
I10.
Ava
ilabl
e w
ater
in st
orag
e re
serv
oirs
(m3 )
Publ
ic E
nter
prise
for D
rinki
ng W
ater
and
Sew
ages
of P
aros
(200
4)
7.60
0.00
0 m
3 ++
I1
1. D
esal
inat
ed o
r im
porte
d w
ater
(m3 )
Publ
ic E
nter
prise
for D
rinki
ng W
ater
and
Sew
ages
of P
aros
(200
4)
450.
000m
3 -
Wat
er
qual
ity a
nd
quan
tity
I12.
B
athi
ng
wat
er
qual
ity
(bac
teria
co
ncen
tratio
n, p
pm, p
pb)
Min
istry
of
Envi
ronm
ent,
Spat
ial
Plan
ning
and
Pub
lic W
orks
mea
sure
men
ts (
2002
-200
4);
Calc
ulat
ions
ac
cord
ing
to E
U D
irect
ive
76/1
60/E
EC
Acc
epta
ble
+
I13.
Des
ertif
ied
area
/ to
tal a
rea
(%)
Min
istry
of
Agr
icul
ture
, In
terp
reta
tion
of a
eria
l ph
otos
(19
96);
Calc
ulat
ion
with
the
use
of
the
inde
x fo
r En
viro
nmen
tally
Sen
sitiv
e A
reas
to d
eser
tific
atio
n (E
SAI)
[14
] w
ith q
ualit
y in
dica
tors
for
soi
l (SQ
I), c
limat
e (C
QI)
, ve
geta
tion
(VQ
I) an
d m
anag
emen
t (M
QI).
ES
AI
calc
ulat
ed
with
fo
rmul
a:
ESA
I =
(SQ
I*C
QI*
VQ
I*M
QI)
1/4 . A
ccor
ding
to th
e va
lues
of E
SAI,
the
area
s are
cha
ract
eriz
ed in
to 8
cla
sses
: 3 c
ritic
al;
3 se
nsiti
ve; 1
pos
sibl
e an
d 1
neut
ral
Figu
re 1
-
I14.
Cul
tivat
ed a
rea
per c
ateg
ory
of in
tens
ity /
tota
l are
a (%
) M
inis
try o
f Agr
icul
ture
, Int
erpr
etat
ion
of a
eria
l pho
tos (
1996
)
Ara
ble
(hig
h in
tens
ity):
70.1
1 km
2 (37.
8%)
Gra
zing
land
s (hi
gh in
tens
ity):
94.1
9 km
2 (50.
8%)
Tree
cro
ps (l
ow in
tens
ity):
14.3
5 km
2 (7.8
%)
Vin
es (l
ow-m
ediu
m in
tens
ity):
6.8
km2 (3
.7%
)
-
I15.
Org
anic
far
min
g ar
ea /
tot
al c
ultiv
ated
ar
ea (%
) D
epar
tmen
t of
Agr
icul
ture
and
Rur
al D
evel
opm
ent
on S
iros
isla
nd (
2003
) an
d M
inis
try o
f A
gric
ultu
re,
Inte
rpre
tatio
n of
aer
ial p
hoto
s (19
96)
Oliv
es: 1
.28%
V
ines
: 1.1
8%
-
Soil
qual
ity
and
quan
tity
I16.
Sol
id w
aste
land
fill a
rea
(ha)
M
unic
ipal
ity o
f Par
os (2
005)
0.
105
km2 (0
.05
% o
f tot
al)
+ I1
7. N
on b
uilt-
up u
rban
are
as /
tota
l urb
an a
rea
(%)
Mun
icip
ality
of P
aros
(200
5) a
nd M
inis
try o
f Agr
icul
ture
, Int
erpr
etat
ion
of a
eria
l pho
tos (
1996
) 0.
057
km2 (2
0% o
f urb
an)
++
I18.
Num
ber o
f car
s per
km
(car
s / K
m)
Nat
iona
l Sta
tistic
s Ser
vice
of G
reec
e (2
003)
/ M
unic
ipal
ity o
f Par
os (2
005)
- U
rban
envi
ronm
ent
I19.
R
enew
able
en
ergy
pr
oduc
ed
/ co
nven
tiona
l ene
rgy
prod
uced
(%)
Loca
l bra
nch
of P
ublic
Ele
ctric
ity E
nter
pris
e (n
o da
ta)
No
data
*
(++)
: Goo
d st
ate;
(+) A
ccep
tabl
e st
ate;
(-):
Not
acc
epta
ble;
(*):
Unk
now
n (n
o da
ta)
238
“Sustainable Management and Development of Mountainous and Island Areas”
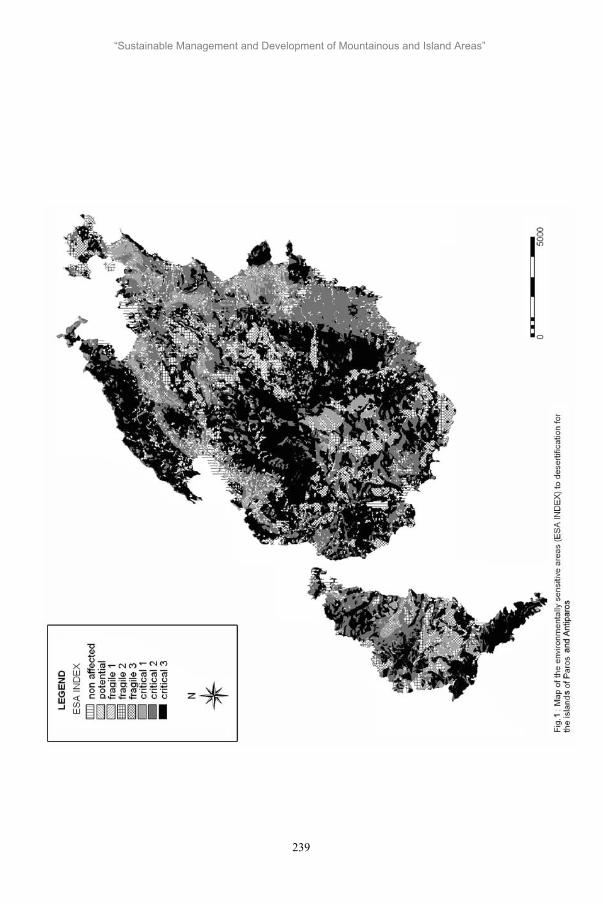
239
“Sustainable Management and Development of Mountainous and Island Areas”

Sustainability Narratives on Caretta-Caretta: Evidence from Zakynthos and Crete
Kousis Maria Professor, Graduate Program in Bioethics, University of Crete, Rethimno, 74100 Greece.
E-mail: [email protected]
Psarikidou Katerina Post-Graduate Student, Graduate Program in Bioethics, University of Crete, Rethimno, 74100 Greece.
E-mail: [email protected]
Abstract. In European Mediterranean regions, human-induced environmental changes have led to a growth in concern over “biodiversity” and “sustainability” mainly by environmental activists and policy-makers. The aim of this paper is to examine Caretta-Caretta related environmental activism and sustainability issues on the Greek islands of Zakynthos and Crete. It examines environmental activist narratives concerning threats to the survival of Caretta-caretta, and environmentalist aims towards its protection. Environmental narratives prove to be essential for a shift to a more attentive, sustainable, approach by policy-makers and local stakeholders dealing with the EU Habitats Directive and the problems of its implementation which are intricately tied to local tourism and fishing interests. The data come mainly from the EC, DGXII funded project on “Participatory Governance and Institutional Innovation”.
Keywords. Environmental NGOs, Caretta-Caretta, Sustainability, Zakynthos, Crete, Greece
1. Introduction
Island communities, as most marine and coastal regions around the globe, face serious environmental problems (Huber et al, 2003). For Southern European islands, these problems increased since the 1960s, which witnessed an extension of economic growth in coastal and marine areas. Tourism has been an important source of negative environmental impacts on Mediterranean coastal regions (MCSD, 1998). This development has altered the dynamics in the use of local natural resources, especially for the closed island ecosystems, which constitute
important contributors to biodiversity (Briguglio and Briguglio, 1996). In both Zakynthos and Crete tourism related activities, as in other Mediterranean islands had negative impacts on wild life and local natural resources (Kousis, 2001).
Caretta-caretta, the Mediterranean sea turtle threatened by tourism activities, is enlisted as one of the endangered species under the EU Habitats Directive. Out of the seven species of sea turtles in the world, three can be found in the Mediterranean, and only the loggerhead sea turtle nests in Greece (Sea Turtle Biology, Sea turtles in Greece, 2004). According to the international treaties of Ramsar and Barcelona, the National Ministry of Environment in Greece is obliged to accept the habitats of caretta-caretta as protected areas, since Greece is considered among the only remaining habitats of the species (Hellenic Republic, Ministry of Foreign Affairs, 2004). Both natural and human-induced, threats and enemies, await for the turtles in the sea as well on the coast. These might include natural threats, such as the weather, beach erosion, which destroys nesting beaches, or animals1. Nevertheless, the most significant threats to sea-turtle are caused by human activities.
The most important nesting beaches are located in Zakynthos, in the bay of Laganas, where the establishment of the National Marine Park resulted in 1999, after a long struggle led by the environmental NGOs ARCHELON, WWF-GR and Medasset. Important nesting sites also exist on the island of Crete, in Rethimnon, the bay of Chania and the bay of Messara, where national marine
1 Sea Turtle Biology, Threats to Survival. Retrived December 11, 2004. http://www.archelon.gr/eng/biology.htm.
240
“Sustainable Management and Development of Mountainous and Island Areas”

parks have not been established (Sea Turtle Biology, 2004). This paper addresses environmental NGO narratives related to caretta-caretta protection in Zakynthos and Crete. Using internet sites of environmental NGOs and other related actors as well as interview material from NGO representatives in Athens, Zakynthos and Crete, this work examines environmental activist narratives concerning threats to the survival of Caretta-caretta, and environmentalist aims towards its protection. By doing so it offers a discussion of how these environmental narratives are linked to sustainability issues addressing wider biodiversity and economic development dilemmas. The data come mainly from the EC, DGXII funded project on “Participatory Governance and Institutional Innovation” (Contract No. 505791; www.paganini-project.net ).
2. What is Sustainable Development?
The Habitats Directive aiming towards the promotion of biodiversity lies within the wider sustainable development policies of the EU. Sustainable development however is a contested concept that is best visualized in terms of four alternative approaches: the treadmill, the weak, the strong, and the ideal sustainable development models (Baker et al,1997). In the treadmill approach, ecosystems are viewed in terms of their utility to producers and production related agencies. The weak sustainable development approach is usually adopted by states, supra national bodies and the more conservative wings of environmental social movement organizations. Strong sustainable development is characterized by changes in patterns of production and consumption and is often more appealing to eco-centric NGOs and grassroots groups, as well as to political ecology NGOs. Finally, the ideal type aims towards more profound changes at socio-economic, ideological, and political levels. The more radical grassroots groups and NGOs are likely to adopt this approach, as it would require drastic restructuring of political, legal, social, and economic institutions (Kousis, 2001).
3. Environmental NGOs active towards the protection of Caretta-caretta
Three professional environmental NGOs stand out as promoters of Caretta-caretta protection in Greece: Archelon, WWF GR, and Medasset. Local environmental NGOs and citizens’ environmental initiatives also share in this concern and have been active on the islands of Zakinthos and Crete. The ‘Citizens’ Initiative of Zakinthos’ (former Zakynthian Ecological Movement), as well as the ‘Ecological Initiative of Chania’ (‘Eco-Chania’) constitute two of the most significant local environmental NGOs. Other, national or local NGOs, and bodies have also been, directly or indirectly related to caretta-caretta conservation.. These include: Greenpeace-Greece, and the Ornithological Association of Greece, the ‘Citizens’ Initiative of Rethimnon,’ the “Ecological Intervention of Iraklion”, the Association for the Environmental Protection of Kokkinos Pyrgos” and the ‘Ecological Intervention of Makris Gialos Mountainous Municipality’ in Crete, (‘Orinoterra’) and other associations , such as the ‘First Order of Sea-Scouts’, ‘XEN’ Association of Christian Youth , ‘Biological Bee Keepers’, ‘Cinema Society’ ‘Rental Rooms Union’, ‘Platyforos Association for cultural research and development’, and others (Archelon, 2005).
4. Environmental NGO Narratives on Local Activities or Sources threatening the survival of Caretta-caretta
Environmental NGOs have focused on tourism’s local impacts related to local traffic (mostly in the form of local land traffic), as well as to the construction, extension, and operation of: a) tourist-catering or hosting facilities/buildings, such as hotels, camping facilities, resort projects, holiday homes, etc.; b) associated recreational facilities, for example, night life/entertainment clubs, golf grounds, aquatic parks, yacht clubs, ski areas, rally grounds, other sports areas; and, d) infra-structural projects such as airports, roads, parking areas, and marine-harbours. Additional sources of ecosystem intervention include water or sand extracting activities, traffic and congestion, waste and sewage problems, and lack/non-implementation of environmental
241
“Sustainable Management and Development of Mountainous and Island Areas”

protection policies. These tourism-related sources and activities create ecosystem offences such as water shortage, fresh-water, marine, coastal, and soil pollution, noise pollution, damage to flora and fauna, and sometimes a general destruction of local ecosystems. The offences in turn produce a wide range of impacts which include negative aesthetic, recreational, cultural/historical, economic, ecosystem, psychological, and public health impacts. The above constitute parts of the process of ecological marginalization (Kousis, 1998, 2001). Despite the fact that loggerhead sea turtles live in the sea, the coasts are of vital significance for their survival and their sustainability. Their biological circle is completed on beaches, where they lay their eggs and construct their nests. It is where their hatchlings break out of the eggs and race towards the sea, following the reflection of the starlight (WWF Greece, 2004). Nevertheless, only one small proportion of the eggs will succeed in producing hatchlings (about 35 to 50), and a much smaller number of the newborn will reach adulthood. Scientists believe that the number of the turtles which finally succeed in becoming adults may be about 10 from each nest (Caretta-caretta, 2004). Threats imposed by human activities on caretta-caretta were identified by important environmental NGOs in Zakynthos and Crete. Using content analysis techniques related to those applied in studies of environmental activism (see Kousis, 1999) these threats were coded as they appear on web sites, interviews and other related sources. Based on the coding of the ecological marginalization process (Kousis, 1998, 2001), they were distinguished into sources or activities, offences and impacts threatening the survival of Caretta-Caretta. Ten major sources or activities are shown as identified by the activists. They include tourism expansion and construction activities; the existence of obstacles such as lights, beach furniture, traffic, speed boats and waste ; as well as fishing activities. These in turn lead to coastal, sea and noise pollution, beach shrinking, disorientation of the turtles, sand erosion and compactness, as well as the disorganization of the local ecosystem. The consequences of these offences lead to negative impacts such as negative ecosystem impacts, decreases in nesting
beaches and nests, negative impacts on the health of the turtles (e.g. poisoning), negative impacts on the population of the species.
5. Environmental NGO Narratives on their Aims towards the protection of Caretta-caretta
The main environmental professional and local NGOs involved in the Caretta-caretta case aim towards :
Species and Ecosystem protection Sustainable Management Sustainability built on Laws and regulations Collaborations with the local community, and Consideration of Local Needs
A cooperative relationship between the most active environmental NGOs involved in Caretta-Caretta protection and the local community has been one of the goal which was earlier met with resistance but which has been established in the later period (Theodossopoulos, 2003). Professional NGOs have contributed to the protection of caretta-caretta by activities such as, a) the promotion the participation of an increasing number of greek volunteers sensitized to caretta-caretta’s survival and to coastal sustainability issues; b) the co-operation with various local institutions, such as schools, church, the media (Tzilivakis, 2001); c) collaboration with scientists; and d) the educational campaigns to raise public awareness. Much energy has also been spent on collection of signatures and public protesting e-mails, (e.g. WWF GR, Euronatur, Medasset2), monitoring and clean-up programs, as well as information campaigns, including tourists, and lobbying local governments and international bodies to legislate for protection of the natural environment (Pridham, 2001). Examples include the STPS Awareness Programme carried out through the Information Station at West Laganas and the slide/film shows at hotels and portable kiosks, coupled with information signs set by the prefecture, the Port Police Substation, the ‘look-out stand’, the 2 ( Ecocrete, Medasset, ”Collection of signatures for the survival of the 27 management agencies for Greek under protection areas” Press release in Greek, 28/06/2004. Retrieved March 2, 2005.
242

natural hatchery and the STPS team. The EEC and WWF’s support for the promotion of this program was generous (Dimopoulos, 1991).
7. Discussion
Economic dependence appears to hinder local environmental activism. Simultaneously, state agencies, pressured by producers, proceed to solve environmental problems at low political cost for the state and low economic cost for the producers. Treadmill or weak sustainable development views characterize local actors since economic sustainability is of vital importance to them. More recently however, environmental sustainability is gaining ground among local groups. Professional or local, environmental NGOs, and other actors engaged in intense activities to protect caretta-caretta follow a strong sustainable development approach, as depicted in their narratives concerning the protection of caretta-caretta.
8. References
[1] Huber et al Priority Problems Facing the Global Marine and Coastal Environment and Recommended Approaches to their solution. Ocean and Coastal Management 46(5):479-485; 2003.
[2] Mediterranean Commission for Sustainable Development (MCSD), Plan Bleu, UNEP. ‘Synthesis Report of the Working Group: Tourism and Sustainable Development in the Mediterranean Region,’ Mediterranean Action Plan, Monaco, 20-22 October; 1998
[3] Briguglio, L. and M. Briguglio. Sustainable Tourism in the Maltese Islands. In Briguglio, L., R. Butler, D. Harrison and W. Leal Filho (eds) Sustainable Tourism in Islands & Small States: Case Studies. London: Pinter; 1996.
[4] Kousis M., Tourism and the Environment in Corsica, Sardinia, Sicily, and Crete. In D. Ioannides, Y. Apostolopoulos, and S. F. Sonmez (eds.) Mediterranean Islands and Sustainable Tourism Development,London: Cassell Academic; 2001.
[5] Sea Turtle Biology, Sea turtles in Greece.Retrieved December 11, 2004.
http://www.archelon.gr/eng/biology.htm
[6] Hellenic Republic, Ministry of Foreign Affairs, Environmental Policy-Protection Measures. Retrieved December 10, 2004. http://www.mfa.gr/english/today/environment/protection.html
[7] Sea Turtle Biology, Threats to Survival. Retrieved December 11, 2004. http://www.archelon.gr/eng/biology.htm
[8] Sea Turtle Biology, Threats to Survival. Retrieved December 11, 2004
[9] Baker, S., Kousis, M., Richardson, D., and Young, S. Introduction. In Baker, S., Kousis, M., Richardson, D., and Young, S. (eds) Politics of Sustainable Development. Theory, Policy and Practice in the European Union,Routledge, London; 1997.
[10] Kousis M., Tourism and the Environment in Corsica, Sardinia, Sicily, and Crete. In D. Ioannides, Y. Apostolopoulos, and S. F. Sonmez (eds.) Mediterranean Islands and Sustainable Tourism Development,London: Cassell Academic; 2001.
[11] http://www.archelon.gr & interview pa 0705, Athens; 2005.
[12] Kousis M. Ecological marginalization in rural areas: Actors, impacts, responses, Sociologia Ruralis 38, 86-108; 1998
[13] WWF Greece, caretta-caretta, . Retrieved December 10, 2004.
http://www.wwf.gr/caretta.htm[14] WWF Greece, Caretta-caretta sea turtle,
Dangers-Threats. Retrieved December 10, 2004. http://www.wwf.gr/caretta.htm
[15] WWF GR. Elias Tziritzis, “WWF denouncement of seashore infringements in Zakynthos”. The District Attorney’s Office, Zakynthos (18/2/2005). Retrieved March 2, 2005. http://www.ecocrete.gr/index.php?option=content&task=view&id=1173.
[16] Caretta-caretta. Retrieved December 10, 2004. http://www.dimitrisvilla.gr/print.php?w=2&id=11
[17] Kousis M., Sustaining local environmen-tal mobilisations: Groups, actions and claims in Southern Europe, in C. Rootes, Environmental Politics, Special issue: Environmental Movements: Local, National and Global; 1999, pp.172-198
243
“Sustainable Management and Development of Mountainous and Island Areas”

[18] Kousis M. Ecological marginalization in rural areas: Actors, impacts, responses, Sociologia Ruralis 38, 86-108; 1998
[19] Theodossopoulos, D. Troubles with turtles: Cultural Understandings of the Environment on a Greek Island. Oxford: Berghahn; 2003
[20] Tzilivakis, K., “Loggerhed turtles threatened by overfishing and development”, 2000. p. A04, Athens News onLine, 12/07/2000.
[21] Ecocrete, Medasset, “Collection of signatures for the survival of the 27 management agencies for greek under protection areas” Press release in greek, 28/06/2004. Retrieved March 2 , 2005
[22] Pridham, G. “Tourism Policy and Sustainability in Italy, Spain and Greece,” in Eder and Kousis (eds) 2001 Environmental Politics in Southern Europe: Actors, Institutions and Discourses in a Europeanizing Society,Dordrecht: Kluwer; 2001.
[23] Dimopoulos, D. 1991. Zakynthos 1990: An update on the public Awareness Programme. Marine Turtle Newsletter 54:21-23
244
“Sustainable Management and Development of Mountainous and Island Areas”

The involvement of farmers in multiple business activities in the context of sustainable management and development of island areas:
The case of the prefecture of Corfu
T. Koutroumanidis1, S. Tampakis2, E. Manolas2, D. Giannoukos1, C. Stoupas1
1Department of Agricultural Development, Democritus University of Thrace,
193 Pantazidou Street, 68200 Orestiada, Greece.
2Department of Forestry and Management of the Environment and Natural Resources,
Democritus University of Thrace, 193 Pantazidou Street, 68200 Orestiada, Greece.
Abstract. In order to hold the population in the countryside the Greek government encouraged the involvement of farmers in tourist activities. The government encouraged the development of agrotourism mainly as a supplementary activity for increasing income. This paper analyzes statistical data about the prefecture of Corfu, taken from the 1991 and 2001 censuses of the National Statistical Service of Greece. They concern the employment of the prefecture’s economically active population in the productive sectors and branches. The examination of the data showed that, with a few exceptions, Corfu rapidly became a services society but such a change occurred hastily and without systematic planning. Also, the development programs LEADER II and LEADER +, whose target was to contribute to economic and social cohesion through balanced sustainable management and development of island areas, did not have the expected results.
Keywords: involvement in multiple business activities, agricultural sector, tourism, sustainable management and development, Corfu
1. Introduction
The involvement of farmers in diverse business activities is an old phenomenon directly related to the very nature of agricultural work [4].
Today, poor farmers, rural families and middle and high income farmers look for supplementary income taking advantage of the opportunities provided by development in the countryside and, in particular, tourist development [5], [9]. The involvement of farmers in multiple business activities is also encouraged by various European Union and national measures and programs. These measures aim at exploiting opportunities related to the development of employment strategies for the surplus labour force in the rural sector, reducing unemployment and, generally, increasing development prospects in the countryside [2]. Poor farmers are interested in involving themselves in multiple business activities in order to earn extra money and because this extra income helps them overcome the difficulties created by unexpected events such as natural disasters, fall of prices regarding agricultural products etc. [10] The involvement of farmers in other branches of the economy and, in particular, tourist and trade professions, seems to fully change the social characteristics of the farming profession since the main income of these people is earned from involvement in the services sector and not from involvement in traditional agricultural activities. For many, this is the first step before the total abandonment of the agricultural profession, while for others, agricultural activities are put in the margin acquiring, in
245
“Sustainable Management and Development of Mountainous and Island Areas”
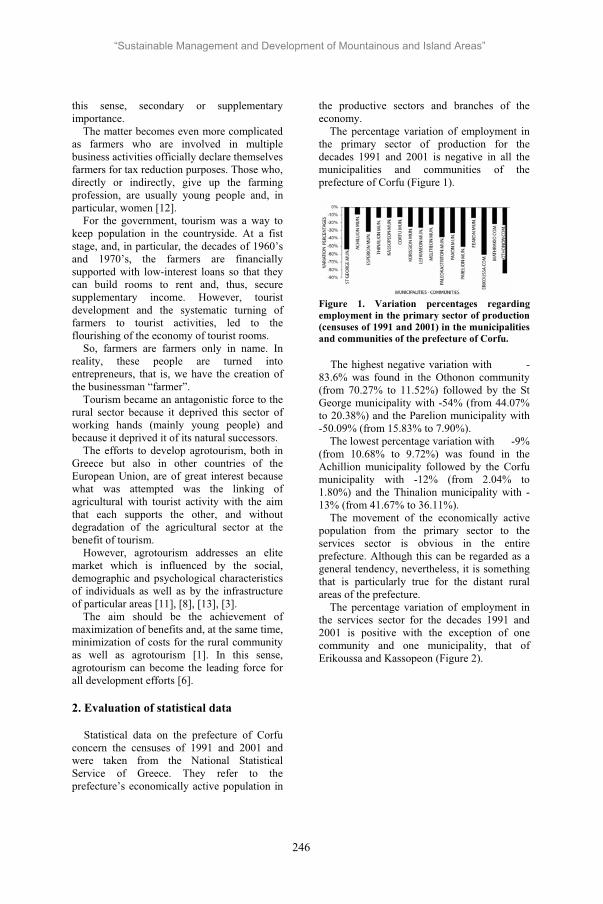
this sense, secondary or supplementary importance. The matter becomes even more complicated as farmers who are involved in multiple business activities officially declare themselves farmers for tax reduction purposes. Those who, directly or indirectly, give up the farming profession, are usually young people and, in particular, women [12]. For the government, tourism was a way to keep population in the countryside. At a fist stage, and, in particular, the decades of 1960’s and 1970’s, the farmers are financially supported with low-interest loans so that they can build rooms to rent and, thus, secure supplementary income. However, tourist development and the systematic turning of farmers to tourist activities, led to the flourishing of the economy of tourist rooms. So, farmers are farmers only in name. In reality, these people are turned into entrepreneurs, that is, we have the creation of the businessman “farmer”. Tourism became an antagonistic force to the rural sector because it deprived this sector of working hands (mainly young people) and because it deprived it of its natural successors. The efforts to develop agrotourism, both in Greece but also in other countries of the European Union, are of great interest because what was attempted was the linking of agricultural with tourist activity with the aim that each supports the other, and without degradation of the agricultural sector at the benefit of tourism. However, agrotourism addresses an elite market which is influenced by the social, demographic and psychological characteristics of individuals as well as by the infrastructure of particular areas [11], [8], [13], [3]. The aim should be the achievement of maximization of benefits and, at the same time, minimization of costs for the rural community as well as agrotourism [1]. In this sense, agrotourism can become the leading force for all development efforts [6].
2. Evaluation of statistical data
Statistical data on the prefecture of Corfu concern the censuses of 1991 and 2001 and were taken from the National Statistical Service of Greece. They refer to the prefecture’s economically active population in
the productive sectors and branches of the economy. The percentage variation of employment in the primary sector of production for the decades 1991 and 2001 is negative in all the municipalities and communities of the prefecture of Corfu (Figure 1).
Figure 1. Variation percentages regarding employment in the primary sector of production (censuses of 1991 and 2001) in the municipalities and communities of the prefecture of Corfu.
The highest negative variation with -83.6% was found in the Othonon community (from 70.27% to 11.52%) followed by the St George municipality with -54% (from 44.07% to 20.38%) and the Parelion municipality with -50.09% (from 15.83% to 7.90%). The lowest percentage variation with -9% (from 10.68% to 9.72%) was found in the Achillion municipality followed by the Corfu municipality with -12% (from 2.04% to 1.80%) and the Thinalion municipality with -13% (from 41.67% to 36.11%). The movement of the economically active population from the primary sector to the services sector is obvious in the entire prefecture. Although this can be regarded as a general tendency, nevertheless, it is something that is particularly true for the distant rural areas of the prefecture. The percentage variation of employment in the services sector for the decades 1991 and 2001 is positive with the exception of one community and one municipality, that of Erikoussa and Kassopeon (Figure 2).
246
“Sustainable Management and Development of Mountainous and Island Areas”

Figure 2. Variation percentages in the services sector of production (censuses of 1991 and 2001) in the municipalities and communities of the prefecture of Corfu.
The highest positive variation was found in the Othoneon community with 104.68% (from 29.70% to 60.79%). High percentage variation was also found in the following municipalities: St George with 57% (from 34.33% to 53.81%), Esperion with 49% (from 36.15% to 53.99%) and Korission with 36% (from 34.21% to 46.58%). The Achillion municipality with 4% (from 59.11% to 61.57%), the Corfu municipality (from 71.15% to 73.01%), the Melitieon municipality with 2.42% (from 46.65% to 47.78%) and the Mathrakio community with 2.40% (from 40% to 40.96%) also have positive percentage variation but it is below 5%. A general comment could be that on the basis of variation regarding employment in the services sector, municipalities and communities in the prefecture of Corfu could be divided into those with particularly high positive variation and into those with low or negligible positive variation. However, it should be noted, that the second group which has low or negligible positive variation, comprises of areas with the highest employment rates in the services sector (tourism), which shows that employment in the tourist sector has increased even in the areas of the prefecture which, with regard to tourism, have traditionally been inferior. The examination of the evolution of employment for the decades 1991 and 2001, in certain branches of the services sector which are connected with tourism reveals that: For the communities and municipalities of the prefecture of Corfu the employment rate for the branch hotels-restaurants has increased significantly (Figure 3).
Figure 3. Variation percentages regarding employment in hotels-restaurants (censuses of 1991 and 2001) in the municipalities and communities of the prefecture of Corfu.
There are some municipalities and communities which were found to have negative percentage variation and these can be regarded as exceptions in the general trend. These are the Melitieon municipality with -16.27% (from 26.67% to 22.21%), the Achillion municipality with -16% (from 16.65% to 13.95%) and the Erikoussa community with -6.44% (from 23.91% to 22.37%). In some cases, the positive variation is very high. For example, high positive variation was found in the following two communities: Mathrakio with 197% (from 5% to 14.85%) and Othonon with 127.53% (from 8.10% to 18.43%). High positive variation was also found in the following municipalities: Esperion with 86% (from 13.79% to 25.63%), Thinalion with 79% (from 10.75% to 19.24%) and Paxon with 68.59% (from 7.96% to 13.42%). In the prefecture of Corfu the variation can be regarded negligible. In the branch of whole-sale / retail trade and repairs, and with regard to employment, the municipalities and communities of the prefecture of Corfu have varied percentage variation (Figure 4).
Figure 4. Variation percentages regarding employment in whole-sale / retail and repairs (censuses of 1991 and 2001) in the municipalities and communities of the prefecture of Corfu.
247
“Sustainable Management and Development of Mountainous and Island Areas”

The highest percentage variation was found in the Erikoussa community with -67% (from 15.21% to 5.02%). The Kassopeon municipality and the Corfu municipality were also found to have decreased percentage variation. However, in the branch of whole-sale / retail and repairs, and with regard to employment, most municipalities were found to have positive percentage variation. The municipalities with the highest values regarding positive variation were: Paxon with 39.25% (from 6.65% to 9.26%), St George with 36% (from 7.01% to 9.51%) and Parelion with 34.27% (from 12.08% to 16.22%). Finally, in the branch of transportation-warehousing and telecommunications for the decades 1991 and 2001, and with regard to employment, most municipalities and communities in the prefecture of Corfu were found to have negative percentage variation (Figure 5).
Figure 5. Variation percentages regarding employment in transportation-warehousing and telecommunications (censuses of 1991 and 2001) in the municipalities and communities of the prefecture of Corfu.
The highest negative percentage variation was found in the Erikoussa community with -58.13% (from 6.52% to 2.73%) and Mathrakio with -40.6% (from 20% to 11.88%). The Korission municipality with 21% (from 7.27% to 8.83%) and the St George municipality with 20% (from 6.96% to 8.32%) were found to have the most important positive percentage variation.
3. Discussion – Conclusions
Corfu evolved to a society of services and land as a factor of development is exploited only for services related activities. The island’s natural environment is degraded on a daily basis. In all the sectors of economic activity the capital invested is only partially utilized.
It is now difficult to find new farmers. Today, agricultural land occupies about half of the island’s total area. Due to building activities and the development of tourist infrastructure the arable land in the prefecture is continuously diminished. The development of tourism created opportunities for easy income in much lesser time than that earned from involvement in agricultural activities. Only cultivations such as olive trees are taken seriously which, it must be noted, require work for a few months only and, in particular, from November to March. A great percentage of farmers in Corfu (62%) are directly or indirectly involved in tourist professions. The main income of farmers in Corfu comes from sources other than agriculture, mainly tourism. Those who have declared farming as a secondary profession do not invest many workdays in the profession: 56.5% does not exceed 50 days of work and 88.8% does not exceed 99 days of work [7]. In Corfu, the programs LEADER II and LEADER + were applied. These concerned the development of tourism and the utilization of the local economy with the purpose of distributing agricultural products. The protection of the environment was also a goal, and this was realized through appropriate interventions whenever required. The evolution of agricultural employment showed that the efforts made through the LEADER II and LEADER + programs could not bear fruit because it did not hold the rural population in the countryside. In effect, it created yet another reason for the abandonment of the agricultural sector by the young to other professions, mainly tourism.
4. References
[1] Ananikas L, Valavanidou A, Iakovidou O, Idos C, Kazana V, Kalaklis A, Lambrianidou M. Research Project on the Development of Agrotourism in the Mountainous Communities of the Province of Paionia – Prefecture of Kilkis. Thessaloniki; 1994.
[2] Brakatsoulas V. Greek Agriculture in Recent Years: 1950-2003. Athens; 2003.
[3] Emmanouilidou M, Iakovidou O, Stavrakas T, Chrisostomidis G. Demand Features of Potential Travellers in
248
“Sustainable Management and Development of Mountainous and Island Areas”

Agrotourist Destinations. Paper presented in the International Conference “Tourism in Island Areas and Other Preferred Destinations”, Chios; 14-16 December 2000.
[4] Gidarakou I. Involvement in Multiple Business Activities and Local Development. Paper presented in the ETAGRO meeting, Florina; 2002.
[5] Kazakopoulos L. Strategies for the Involvement of Farmers in Multiple Business Activities and the Development of Agricultural Areas. Paper presented in the scientific meeting “Multiple Business Activities and Agricultural Development. Ministry of Agriculture, Directorate of Rural Economy; 1986.
[6] Kazakopoulos L, Klonaris S, Koutsouris A. The Creation of Markets as a Factor in Agricultural Development. Paper presented in the 4th Panhellenic Agricultural Economy Conference “Competitiveness and Development of the Rural Sector: New Challenges for Greece”. Thessaloniki; 28-30 November 2000.
[7] Theodoropoulos K, Kalokardou-Krantonelli R, Manoglou E, Maroudas K, Pappas P, Tsartas P, Fakiolas N. The Social Impact of Tourism on the Prefectures of Corfu and Lasithi. National Center for Social Research – National Organization of Tourism; 1995.
[8] Triantafyllou K. St Germanos and Alternative Forms of Tourism. The Contribution of Female Agrotourism. Postgraduate dissertation, Department of Agricultural Studies, Aristotle University of Thessaloniki, Thessaloniki; 1999.
[9] Tsartas P. The Involvement of Farmers in Multiple Business Activities and Tourism. National Center for Social Research; 1991.
[10] Tsartas P. Tourism and the Involvement of Farmers in Multiple Business Activities. National Center for Social Research; 1991.
[11] Vlachou C, Voltsou A, Iakovidou O, Partalidou M. Mountainous and Disadvantaged Areas of Greece: Agrotourism – Geotechnical Chamber of Greece; 2000.
[12] Zakopoulou E, Kassimis C, Kiriazi-Allison E. Family Farming. National Center for Social Research; 2000.
[13] Velasco MJP. Andalusian Women and their participation in Rural Tourist Trade. Geo Journal. Volume 48; 1999.
249
“Sustainable Management and Development of Mountainous and Island Areas”

Ecological and Socio-economic Approaches of Traditional Silvoarable Systems: The Case of Andros Island, Greece
Kyriazopoulos A. and Arabatzis G. Democritus University of Thrace
Department of Forestry and Management of the Environment and Natural Resources 193 Padazidou str., 682 00 Orestiada, Greece [email protected]; [email protected]
Abstract. Traditional silvoarable systems are present in several parts of Greece and play an important role in the local economy. They also play a very important ecological role not only because they enhance biodiversity but also because they prevent soil erosion and surface runoff. The research was conducted on the island of Andros, Cyclades prefecture, southern Greece in 2004. Several combinations of trees and crops were identified. The main tree species were olive trees and fruit trees, while the understorey crops consisted mainly of cereals (maize, barley), lucerne, grape and beans. Crops were used for livestock feeding directly (grazing) and indirectly (grain, hay). Over the last decades, these systems have been reduced due to several reasons. Incentives should be given to farmers in order to maintain these systems and manage them properly.
Keywords. conservation, intercropping, grazing,
1. Introduction
Silvoarable agroforestry consists of widely spaced trees inter-cropped with annual or perennial crops. It is one of the three agroforestry types, along with silvopastoral agroforestry and agrosilvopastoral agroforestry [9]. Such systems have traditionally formed important elements of the Mediterranean landscape, and may have the potential to make a positive contribution towards sustainable agriculture in Europe in the future [4].
Trees have traditionally served three main purposes in the agrarian economy – the production of fruits, fodder and wood for fuel, litter or timber. In addition, they have amenity value, provide shade and shelter for labourers and livestock, enhance biodiversity and combat wind and water erosion. When grown in combination with crops, trees compete for
resources, and hence the modern convention is to separate forestry and agriculture into discrete areas of land. However, to focus on the negative effects of trees on associated crops is overly simplistic and ignores a range of both positive and negative effects on arable productivity [5]. Although the shade cast by trees may limit the growth of crops, the consequent reduction in irradiance and thus transpiration may be beneficial in arid areas, especially when growing sensitive understorey vegetable crops; in some cases, there may be a moderate beneficial effect of shading for crop yield [7]. Although competition for nutrients may also occur, the deeper rooting systems of trees bring up nutrients from deeper soil layers and reduce nutrient leaching from the topsoil. These nutrients are then recycled via leaf litter and turnover of roots, thereby increasing the overall resource-use efficiency of the system ([10], [5]).
In Greece there are several traditional silvoarable systems [11]. Over the last decades these systems have been reduced due to the rapid socio-economic changes involving extensification of human activities or intensification of agricultural practices [8]. Traditional silvoarable systems have gradually been abandoned in marginal agricultural areas, but on more productive soils have been replaced by crop monocultures. There is no motivation for farmers to maintain silvoarable systems which have often been perceived as an obstacle to modernisation via mechanisation. Incentives should be given to farmers in order to maintain these systems and manage them properly.
2. European Union Policies and Land Use
Common Agricultural Policy (CAP) has achieved the objectives for which it was enacted that is to say the promotion of the production and the productivity in the agricultural sector, it stabilised the markets, it ensured the offer of
250
“Sustainable Management and Development of Mountainous and Island Areas”

goods and protected the farmers from the fluctuations in the world markets. However, the maximisation of agricultural production led to monocultures of agricultural plants mainly for the production of food to be promoted in all the European Union (EU). At the same time surpluses in a lot of agricultural products began to appear which required serious subsidies in order to export them. As a result, there was an increase in the agricultural expenditures of the EU, while, unfavourable impacts in the environment from the intensive use of fertilizers and pesticides appeared. Since the '80s certain reforms of CAP took place in order to resolve the above problems. Nevertheless, these reforms had little effectiveness. With the reforms in the 1990s and recently (2003), CAP changed in an important degree, placing as objective the reduction of production [1].
At the same time in the policies of the EU the countryside presented as a place of conservation, protection and restoration of natural environment, cultural values and quality of life. The agri-environmental measures, the measures for the early retirement, the measures for the afforestation, the regulations on the organic (biological) farming and livestock-farming, has contributed to the transformation and differentiation of the recent production system, in farm level and moreover promote the multifunctional role of agriculture and countryside more generally [1].
Particularly in the less favoured regions, as the islands, the differentiation of local economies and the multi-activity of the farmers in combination with the protection and appointment of natural environment and rural landscape, are acclaimed as its basic factors of development.
The afforestation of agricultural lands that was applied in the context of regulation 2080/92 and today in the context of regulation 1257/99 had as a result several agricultural lands to be set aside from the food production and being led to the wood production. However, in most extents the quality of timber that is produced is not high enough, because forest trees are planted very densely, while in mountainous regions, mainly the forest plantations have almost been abandoned.
Even if the silvoarable systems have existed for centuries, contributing to the sustainable development and management of the countryside, in the EU policies are not included measures for their conservation and extension.
With the silvoarable systems, farmers continue to cultivate their land by planting trees in bigger spaces between them, which can produce high timber quality contributing thus to the reduction of the EU’s deficit [3]. The institution of incentives and aids for the establishment of silvoarable systems, especially in the mountainous and less favoured areas will contribute considerably to the local productive and social system and to the environmental balance.
3. Materials and Methods
The research was conducted on the island of Andros, Cyclades prefecture, southern Greece in 2004. Andros is the second largest (380 km2)island in the Cyclades prefecture, after Naxos. Mean annual precipitation is 380 mm and mean annual temperature is 17 oC. Drought period lasts for six months (mid March to mid September). Soil texture is described as SL to S. Individual farms holding silvoarable systems were located on the island and their owners were identified. A special inventory sheet was prepared and the information describing each farm was collected directly from the farmers – owners of the farms. The inventoried silvoarable systems were grouped according to tree species and crops.
4. Results and Discussion
Twenty different privately owned silvoarable systems were recorded. The main characteristics of these systems was the small area of the farms, 75% of them were less than 0,5 ha. Olive tree trees and fruit trees occurred in most of the systems (Table 1).
All the trees in these systems were planted. The trees are mainly used for the production of fruit and olive oil and also for a small amount of fuelwood. Grazing animals use the leaves of olive trees from the cut branches. Olive trees form a continuous landscape element in many parts of southern Europe, with diverse crops sown between the trees. This practice is thought to date back to pre-Roman times, when wheat was cultivated between rows of olive trees on alternate years, as this was known to increase the yield of olives in the following year [6].
251
“Sustainable Management and Development of Mountainous and Island Areas”
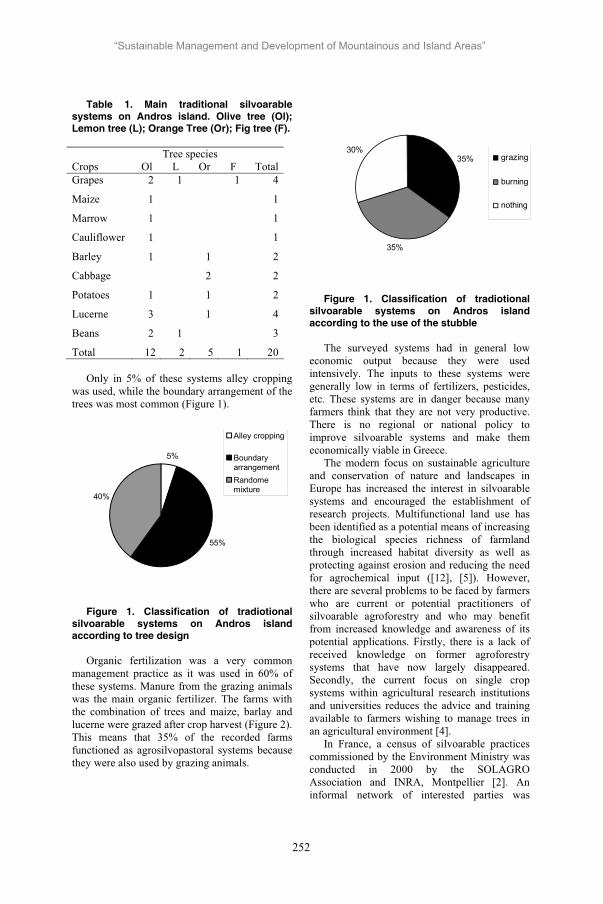
Table 1. Main traditional silvoarable systems on Andros island. Olive tree (Ol); Lemon tree (L); Orange Tree (Or); Fig tree (F).
Tree species Crops Ol L Or F TotalGrapes 2 1 1 4
Maize 1 1
Marrow 1 1
Cauliflower 1 1
Barley 1 1 2
Cabbage 2 2
Potatoes 1 1 2
Lucerne 3 1 4
Beans 2 1 3
Total 12 2 5 1 20
Only in 5% of these systems alley cropping was used, while the boundary arrangement of the trees was most common (Figure 1).
5%
55%
40%
Alley cropping
BoundaryarrangementRandomemixture
Figure 1. Classification of tradiotional silvoarable systems on Andros island according to tree design
Organic fertilization was a very common management practice as it was used in 60% of these systems. Manure from the grazing animals was the main organic fertilizer. The farms with the combination of trees and maize, barlay and lucerne were grazed after crop harvest (Figure 2). This means that 35% of the recorded farms functioned as agrosilvopastoral systems because they were also used by grazing animals.
35%
35%
30%grazing
burning
nothing
Figure 1. Classification of tradiotional silvoarable systems on Andros island according to the use of the stubble
The surveyed systems had in general low economic output because they were used intensively. The inputs to these systems were generally low in terms of fertilizers, pesticides, etc. These systems are in danger because many farmers think that they are not very productive. There is no regional or national policy to improve silvoarable systems and make them economically viable in Greece.
The modern focus on sustainable agriculture and conservation of nature and landscapes in Europe has increased the interest in silvoarable systems and encouraged the establishment of research projects. Multifunctional land use has been identified as a potential means of increasing the biological species richness of farmland through increased habitat diversity as well as protecting against erosion and reducing the need for agrochemical input ([12], [5]). However, there are several problems to be faced by farmers who are current or potential practitioners of silvoarable agroforestry and who may benefit from increased knowledge and awareness of its potential applications. Firstly, there is a lack of received knowledge on former agroforestry systems that have now largely disappeared. Secondly, the current focus on single crop systems within agricultural research institutions and universities reduces the advice and training available to farmers wishing to manage trees in an agricultural environment [4].
In France, a census of silvoarable practices commissioned by the Environment Ministry was conducted in 2000 by the SOLAGRO Association and INRA, Montpellier [2]. An informal network of interested parties was
252
“Sustainable Management and Development of Mountainous and Island Areas”
formed to lobby for the reform of agricultural and forestry laws to support agroforestry systems and has succeeded in changing the application of subsidies. Since 2001, intercrops are eligible for CAP subsidies, agroforestry plantations receive forestry subsidies and the area planted with trees is eligible for the European PCPR subsidy for lost arable income. Agroforestry is therefore currently strongly supported by regulations within France. The only solution for the conservation of silvoarable agroforestry systems might be to provide special incentives to owners to keep the trees, plant new trees in their farms or to intercrop among their olive trees. Farmers should be educated so they will be able to manage properly these valuable systems.
5. Conclusions and recommendations
On Andros island traditional silvoarable systems occupy a small area of plots. They consist mainly of olive and fruit trees, cereals, lucerne and grapes. A lot of them are also used as agrosilvopastoral systems. These systems are in danger of extinction due to their low economic output. Special incentives sould be given to farmers in order to maintain these systems.
6. References
[1] Arabatzis, G. 2005. European Union, Common Agricultural Policy (CAP) and the afforestation of agricultural land in Greece. New Medt, Mediterranean Journal of Economics, Agriculture and Environment 4: 48-54.
[2] Coulon F., Dupraz C., Liagre F. and Pointereau P. 2001. E tude des pratiques agroforestie` res associant des arbres fruitiers de haute tige a ` des cultures ou des pastures. Solagro/Inra, Ministe` re de l’Amenagement et du Territoire et de l’Environnement, Toulouse, France, 199 pp.
[3] Dupraz, C. and Newman S. M. 1997. Temperate agroforestry: The European way. In: A.M. Gordon and S.M. Newman (eds), Temperate Agroforestry Systems. CAB International. London, pp. 181-235.
[4] Eichhorn M. P., Paris P., Herzog F., Incoll1 L. D., Liagre F., Mantzanas K., Mayus M., Moreno G., Papanastasis V. P., Pilbeam D. J., Pisanelli A. and Dupraz C. 2006. Silvoarable systems in Europe – past,
present and future prospects. Agroforesrty Systems 67: 29-50.
[5] Jose S., Gillespie A .R. and Pallardy S. G. 2004. Interspecific interactions in temperate agroforestry. Agroforestry Systems 61: 237–255.
[6] Lelle M. A. and Gold M. A. 1994. Agroforestry systems for temperate climates: lessons from Roman Italy. Forest Conserv. Hist. 38: 118–126.
[7] Lin C. H., McGraw R. L., George M .F. and Garrett H. E. 1999. Shade effects on forage crops with potential in temperate agroforestry practices. Agroforestry Systems 44: 109–119.
[8] Mantzanas K., Tsatsiadis E., Ispikoudis I. and Papanastasis V. P. 2004. Traditional silvoarable systems and their evolution in Greece. In: Mosquera-Losada M. R., McAdam J. and Rigueiro-Rodriguez A. (eds). Silvopastoralism and Sustainable Land Management. Proceedings of an International Congress. pp 53-54.
[9] Nair, P. K. R. 1991. State of the art of agroforestry systems. In: Jarvis, P. G. (ed.) Agroforestry: Principles and Practices. Elsevier, Amsterdam, The Netherlands, pp. 5-29.
[10] van Noordwijk M., Lawson G., Soumare A., Groot J. J. R. and Hairiah K. 1996. Root distribution of trees and crops: competition and/or complementarity. In: Ong C.K. and Huxley P. (eds), Tree-Crop Interactions: A Physiological Approach. CAB International, Wallingford, UK, pp. 319–364.
[11] Schultz A. M., Papanastasis V. P., Katelman T., Tsiouvaras C., Kandrelis S. and Nastis A. 1987. Agroforestry in Greece. Laboratory of Range Science, Department of Wildlife and Range Science, Aristotle University, Thessaloniki, Greece, 101 pp.
[12] Vandermeer J. 1989. The Ecology of Intercropping. Cambridge University Press, Cambridge, 237 pp.
253
“Sustainable Management and Development of Mountainous and Island Areas”

Science education for environmental awareness: approaches to integrating cognitive and affective domains
Dr Michael Littledyke Research Director
Faculty of Education, Humanities and Science University of Gloucestershire Francis Close Hall Campus
Swindon Road Cheltenham
Glos. UK GL50 2 RH
Tel: +44 (01242) 543414/532821 Fax: +44 (01242) 536262
email: [email protected]
Abstract. Science education has an important part in developing understanding of concepts that underpin environmental issues, leading potentially to pro-environmental behaviour. However, science is commonly perceived negatively, leading to inappropriate and negative models of science that do not connect to people’s experiences. The article argues that the cognitive and affective domains need to be explicitly integrated in a science education that informs environmental education, as a sense of relationship is essential for environmental care and responsibility leading to informed action. The features of such approaches to science education are discussed, including possible strategies for making connections between cognitive and affective domains. This incorporates the development of positive approaches to science and environmental issues through teacher modelling of biophilic behaviour, active learning through constructivist pedagogy, suitable experiences of natural environments and living organisms, and science curricula that emphasise conceptual integration to demonstrate complex environmental effects, including the environmental consequences of human behaviour. Examples of such approaches are discussed.
Keywords. Science and environmental education, cognitive and affective integration, environmental issues-based pedagogy
Introduction.
At the heart of an environmental perspective that can lead to sustainability is 'the perception of reality as relationship' [54, p. 204]. A central challenge of environmental education, therefore, is how to encourage and develop in children a sense of relationship with the environment, which may translate into pro-environmental behaviour that follows through into adulthood. This article addresses the implications of this challenge in the context of the science curriculum, which, as a core subject in the National Curriculum, provides significant opportunity to make this sense of relationship with the environment explicit. This is underpinned by the premise that such perception of relationship involves cognitive and affective dimensions. Hence, an understanding of environmental relationship may be complemented by a love of and respect for nature with feelings of interconnectedness with living things that can lead to motivation to act from a sense of responsibility and concern for environmental protection. This is an aspect of moral behaviour described by Gilligan [30] as based on care through empathy in human contexts, whilst this applies in the environmental moral context through empathy, care and responsibility to the natural world. Although a gap between knowledge about environmental problems and action to support the environment can commonly exist [47], explicit education for knowledge that enhances environmental relationship can potentially support environmental education,
254
“Sustainable Management and Development of Mountainous and Island Areas”
so fostering the conditions for pro-environmental behaviour.
The affective domain in the curriculum is acknowledged to be an important aspect to learning [17, 27, 28, 31, 62, 78, 90], and there have been a number of studies concerning the affective domain in science education, mainly concerned with attitudes to science and its effect on learning [1, 2, 15, 25, 26, 48, 49, 81, 82, 84, 87, 93, 98]. Whilst the affective domain is commonly seen to be important in environmental education in fostering positive attitudes towards the environment [11]), few studies have investigated explicit connections between science education, environmental education and affective education [34, 101]. As Alsop and Watts [1] observe, ‘the interrelationships between cognitive and affective domains of learning are both underresearched and understated’. This article, therefore, attempts to address a relative paucity in the literature connecting cognitive and affective domains in the context of science and environmental education. It also proposes that a contribution to bridging the gap between knowledge and action can be provided by science education that develops explicit understanding of environmental relationship that may enhance the affective domain of learning, and presents a rationale and agenda for incorporating this important aspect into the science curriculum. The implications for the science curriculum are explored, with a view to considering an agenda for science education to support environmental education.
Limitations of science education.
Although environmental education is essentially cross-curricular in nature, science education has an important part to play in developing understanding of the scientific principles that underpin environmental issues. Also, science education has achieved considerably higher curriculum status in recent years due to its position as a core subject in the National Curriculum, and environmental education has had less curriculum time in many schools due to competing teaching and assessment time for ‘higher status’ subjects, driven by inspection and reporting requirements [55]. Therefore, given its high status and significant potential in environmental education, the science curriculum offers many opportunities to support environmental awareness [57, 79].
However, research studies on attitudes to school science since the early 1970s indicate that attitudes become less positive as pupils progress through school [46, 61]), leading to many pupils avoiding studying science at higher levels [76], and the development of an anti-science stance in many adults [40]. Underpinning these problems are issues of relevance in the science curriculum and to what extent this influences pupils to identify with and become involved in the learning process and to relate it to the wider world [94]. This has led numerous authors to challenge traditional approaches to science and look for revitalised approaches to science and science education [7, 35, 54, 55, 61].
One of the major obstacles to achieving a rounded and broad education that integrates cognitive and affective domains in individuals is the common stereotypical view held by many of the arts and sciences. Thus, the arts are commonly perceived as oriented to the right brain, aesthetic, values-dominated, irrational or anti-rational, while the sciences may be stereotypically seen as left-brain oriented, functional, value-free, and involved in a search for rational, objective ‘truth’. Such stereotypes are problematic in that they can lead to undervaluing of both aspects, resulting in arts-illiterate science students or science-illiterate arts students. Both of these positions are also problematic to environmental education, because of the need for both dimensions in developing a positive relationship with the environment that is based on informed motivation for action.
These stereotyped views can be represented by contrasting views of science, which illustrate how science can be interpreted in different ways with positive or negative implications to its impact on the world and how it may be taught. Such different perspectives of science indicate how science can have different attributes, depending on how it is perceived and implemented.
Thus, the National Curriculum view defines science in the context of education as a neutral process that leads to understanding:
The exploration of phenomena in order to gain understanding ... it can lead to the solving of problems ... (and) progressively more powerful ways of understanding the natural world. ... it relies heavily on skills ... the making and testing of hypotheses. [63, p. A4]
255
“Sustainable Management and Development of Mountainous and Island Areas”
Positive views of science are often held by people who are engaged in it and understand its significance. Thus, Poincaré sees science as reflecting intrinsic beauty in the world:
The scientist does not study nature because it is useful; he studies it because he delights in it and because it is beautiful. Of course I do not speak here of that beauty which strikes the senses, the beauty of quality and appearance; not that I undervalue such beauty, far from it, but it has nothing to do with science. I mean the profound beauty which comes from the harmonious order of the parts and which pure intelligence can grasp. [100, p. 57]
Whilst, Hawking sees science as a complete system of knowledge that can counter the ontological claims of religion:
... then we shall all, philosophers, scientists and just ordinary people, be able to take part in the discussion of why it is that we and the universe exist. If we find the answer to that it would be the ultimate triumph of human reason, for then we should know the mind of God. [37, p.175]
A pragmatically functional view of science is given by Appleyard: ‘Science provides a way of knowing and doing almost anything we like ... It is conceptually and technologically effective’ [3, p.6]. Whilst, Nehru sees science as linked to political power: ‘The future belongs to science and those who make friends with science’ [37, p.175].
However, others may hold negative views of science. Thus, science may be implicated as a destroyer of beauty: ‘Knowledge has killed the sun, making it a ball of gas with spots ... The world of reason and science ... this is the dry and sterile world that the abstracted mind inhabits’ [100, p. ix]. And,
science can be presented as devoid of meaning: ‘Science is meaningless because it gives no answer to our question, the only important question important for us: “What shall we do and how shall we be?”’ [100, p. 144]. Or, as Wittgenstein professes, ‘We feel, that even when all scientific questions have been answered, the problems of life remain completely untouched’ [99, p. 187].
Also, science has also been implicated as contributing to environmental destruction, and Havel sees it as a destroyer of God and nature:
Modern science ... abolishes as mere fiction the innermost foundations of our natural world: it kills God and takes his place on the vacant throne so henceforth it would be science that would hold the order of being in its hand as its sole legitimate guardian and so be the legitimate arbiter of all relevant truth ... People thought they could explain and conquer nature - yet the outcome is that they destroyed it and disinherited themselves from it. [100, p. ix]
Such views represent science as essentially destructive and disconnected with the world, and appear to be reflected by views of many people today. For example, a common activity on many Initial Teacher Education courses encourages students to reflect on their views about science, as represented by the instruction ‘draw a scientist doing something scientific’. The image produced by the majority of students, which is also matched by views of school children [21], is one of the ‘egghead scientist’, who is typically a lab-coated male, balding, often with spectacles and using test tubes, bunsen burners and other school chemistry equipment. A typical variation on this image includes the ‘mad scientist’ with wild hair and involved in creating explosions or other such dangerous activities.
256
“Sustainable Management and Development of Mountainous and Island Areas”

Figure 1: A typical image of the ‘egghead scientist’ when asked to draw ‘a scientist doing something scientific’ (drawn by 10 year old child)
In discussions with students about the semiotics of the stereotypical image, a number of meanings emerge from the various elements. These are shown in table 1, which shows that the features of the ‘egghead scientist’ point to a clinical, abstract, physical, unemotional and reductionist view of science as practised by a clever, but eccentric and emotionally dysfunctional individual. Such images can have the effect of producing negative attitudes to science in that science can be seen to be male dominated, abstract
and fragmenting knowledge in a way that is unrelated to life, as well as being a difficult subject, which is hard to succeed in, and having some potentially sinister or dangerous applications. Given such evidently prevalent negative stereotyped images, it is no wonder that many people have negative views of science and are discouraged from studying it or using the ideas and processes of science to critically inform their understanding of the world [40].
Table 1: Semiotic analysis of the meanings in the elements of the ‘egghead scientist’ Feature Quality Attitude to science
White lab coat Clinical, abstract, physical, unemotional
Unrelated to real life
Test-tubes, Bunsen burner etc., may produce explosions
Reductionist, using specialised equipment with sometimes spectacular results
Failure to connect with the whole, factual, potentially dangerous implications
257
“Sustainable Management and Development of Mountainous and Island Areas”

Glasses/Egg-head Learned, intellectual, clever, eccentric, emotionally dysfunctional
Difficult subject - hard to succeed
Male Patriarchal authority, power of knowledge
Unquestioned authority
In relation to environmental education this stereotyped model of science as represented by the ‘egghead scientist’ is very unhelpful, as science is viewed as contributing to environmental problems in the world rather than providing an essential tool for understanding the root causes of environmental issues and informing suitable action for environmental change.
This model of science is embodied in science that emerged from the scientific revolution of the Enlightenment in the seventeenth century leading to the so-called modern era, and has been characterised as positivist, reductionist, determinist, mechanistic and with claims for absolute truth through the pursuit of objective scientific knowledge [36, 85]. Benefits of modern science are evident, for example through medical advances and other associated great improvements in living standards, but modern science has also been incriminated for contributing to environmentally damaging approaches to technology through ‘mechanomorphism’, in which ecological systems are inappropriately treated as machines with resulting environmental damage [54].
However, the modern model of science has been discredited and overturned by postmodern science, which has been influenced by postmodern philosophy and the history and philosophy of science. Postmodern writers such as Derrida, Lyotard and Rorty contest the idea of absolute truth claims of science with its objective descriptions of the universe, and propose that all ideas are ultimately confined within the constraints of human language systems and culture [58]. This so-called deconstructive postmodernism seeks to eliminate the ingredients for a modern world-view and attacks the notion of a meta-language, meta-narrative or meta-theory that explains and connects things. This emphasises
pragmatism, drawing on the earlier ideas of Nietzchse, Wittgenstein, and Heidegger, leading to a relativistic view, which proposes that all knowledge is culturally bound. In this approach a scientific view has no more validity as an approach to reality than other views, religious, aesthetic, ethical or cultural.
Griffin [33] however, rejects the relativism of deconstructive post modernism and proposes a constructive or revisionary postmodernism.
This seeks to revise modern concepts to construct ‘a new unity of scientific, ethical, aesthetic and religious institutions. It rejects not science as such but only that scientism in which the data of the modern sciences are alone allowed to contribute to the construction of our worldview’ [33, p. x]. This constructive postmodernism embraces the affective and cognitive features of science and science education. It is confirmed by twentieth century scientific developments, including the history and philosophy of science, which shows that scientific knowledge is constantly changing with ‘paradigm shifts’, with scientists involved in social activity [60] and with new technological developments, scientific findings and scientific theories developed through attempts to falsify hypotheses rather than proving ultimate ‘truths’ [73]. Findings in neurophysiology also confirm that we construct our perceptions and understanding of the world through neurological processes and absolute objectivity through positivist perception of an independent reality is not possible. Dennett [20] postulates that dualism, which separates the observer from that which is observed, confirms sense experience but it is a manifestation of an illusionary ‘Cartesian Theatre’ which has evolved to give a sense of self and which is essential for biological survival. Furthermore, quantum physics and the science of complexity verify that we influence what we observe, demolishing the
258
“Sustainable Management and Development of Mountainous and Island Areas”

concept of absolute objectivity, and complex interactions are inherently impossible to predict in any finite sense, leaving uncertainty and probability as the main way of interpreting complex systems [32, 44].
This radical epistemological transformation in science resulting from twentieth century developments within science has implications for a science education that may still be rooted in practice in inappropriate modern science. Science education for a constructive postmodern world-view is more appropriate for a science education of the twenty first century and also for environmental education, as this is more compatible with approaches to sustainability than modern science. Such an approach may also contribute to reversing the trend in pupils’ disillusionment and cynicism that is prevalent towards science [61]. In responding to this challenge, Littledyke [54, pp. 206-7] proposes features of constructive postmodern science education to include an integration of effective and affective components:
Effective features of learning: to educate pupils into the methods and ideas of science so that they can use science to interpret and understand the world; to assist pupils in creating meaningful personal frameworks for understanding science; to critically analyse ideas and the application of ideas for scientific validity; to critically evaluate the social and environmental implications of the application of scientific ideas.
Affective features of learning: to foster a sense of interest, enjoyment and excitement in learning in science; to include a sense of beauty, respect, reverence and awe in approaches to the environment and understanding our place in the universe.
Integrating cognitive and affective domains in environmental learning.
Environmental learning has multiple dimensions, and it is well understood that environmental learning occurs in a wide range of contexts and from many sources beyond the formal educational system [8, 15, 77]. However, Falk [23] points out that traditional ways of interpreting research on learning are
flawed: ‘Asking: What did an individual learn as a consequence of this educational experience? Is an inappropriate way to frame the question? A more appropriate way to frame questions of learning would be to ask: How did this educational experience contribute to an individual’s learning?’ The first frame focusses on a transmission, knowledge-centred model of learning, where individuals are passive recipients of knowledge, whilst the second emphasises a process-based, learner-centred model where individuals actively construct knowledge. This shift in emphasis is based on the premise that learning is a personalised, active, multi-dimensional process [28] that is influenced by prior experience, contextual settings [8] and takes place in social situations [95]. Effective learning also occurs when meaningful connections are made with prior experience [65]. This also matches what is now known about how learning occurs through the construction of complex neural nets, which are developed in response to experience and which are highly specific to individuals.
Much research on conceptual change in the learning of science has focused on the cognitive domain, for example the model developed by Strike and Posner [83] who proposed that conceptual change only takes place if curriculum material is intelligible, plausible and fruitful, an approach that ignores the affective domain. The cognitive constructivist model of science education is prominent in recent research, which draws on Piaget’s ideas of cognitive processes that take place within the individual [69, 72], while social constructivism developed from the ideas of Vygotsky, who emphasised the importance of shared culture and language in learning [51, 91]. Treagust [89] cited by Falk [23]) extends the model of Strike and Posner to propose a model of conceptual change that is influenced by dimensions of epistemology (where material needs to be intelligible, plausible and fruitful), ontology (based on beliefs about fundamental categories of the world [11]) and social / affective dimensions (where individuals learners and as groups influence learning). Watts and Alsop [97] take this further to suggest that material also needs to be salient (where the material needs to be noticeable or striking), palatable (or agreeable to the mind) and germane (or how relevant or applicable the material is to the learner’s world), which incorporates the affective dimension in learning.
259
“Sustainable Management and Development of Mountainous and Island Areas”

Goleman [31] proposes that education for emotional intelligence is a vital ingredient in an integrated education that develops affective and cognitive domains. This approach applies Gardner’s [27, 28] multiple intelligences model, which shows that intelligence has multiple dimensions, including the effective and affective. Goleman illustrates the problem of over-rationalistic approaches to science through Dr Spock from the TV show ‘Star Trek’, who represents a fictitious archetypal scientific model with supposed finely developed powers of analysis and reason that are not encumbered by emotion. Goleman demonstrates that such a character is impossible in the real world, as developed reason is not tenable without emotional involvement; Dr Spock would be intellectually challenged if he were to exist. This is because thought and emotion are closely linked through neural pathways involving the sensory thalamus, which links to the amygdala, the emotional centre of the brain, but also to the sensory cortex, where reasoning activities take place. Sensory responses can involve an emotional path, which does not involve the cortex, leading to rapid emotional responses that have survival value in our ancient evolutionary environment, where mere survival was paramount. But, the evolutionary refinement of the cerebral cortex as the location of reasoning activity tempers emotional responses; significantly, reason must involve emotional involvement in some way, as the amygdala is involved in either pathway [31]. In addition to identifying these specific pathways for connecting the influence of cognition and emotion in behaviour, neurological research indicates that concepts, feelings, and behaviours are all highly interconnected [18, 19]) and these are involved in the formation of attitudes and beliefs, which are involved in constructing value systems that underpin environmental relationships [8].
So, reason and emotion are linked through neural pathways, and this is the basis for ‘the two moral stances that our times call for … self restraint and compassion’ [31, p. xii], which also can be seen to lie at the root of environmental action; self restraint being informed by rational understanding of environmental problems and the various options for action; with environmental action influenced by emotional motivation through care and concern for the environment.
This integration of the rational and emotional has particular relevance to fostering reflective awareness at a number of levels, including:
Intra-relation (self awareness: how one’s actions impact on the environment, influencing lifestyle choices that impact on the environment, e.g. consumer choices)
Inter-relations (social awareness: how people interact socially to influence individual choices, e.g. the social dynamics that influence consumer choices)
Co-relations (environmental awareness: how society impacts on ecosystems through political choices)
In this way, reason and emotions can be integrated with socially or ecologically beneficial behaviour at the individual, societal and political levels.
Even when integration between cognitive and affective domains is achieved, contradictory gaps may occur between knowledge, environmental care and action [47]. However, there is evidence that environmental learning can influence attitudes and behaviour, particularly in informal contexts [4, 8]. Lester et al. [52] provide evidence that students with science knowledge can be more environmentally active than those with poorer knowledge, and activism increased as they gained more knowledge, hence the importance of an appropriate science education that is compatible with constructive postmodernism and supports environmental education.
Integrating cognitive and affective domains in science and environmental education.
There are opportunities within science curricula for developing understanding of scientific principles to foster a sense of relationship with the environment that may lead to environmental care with the potential for informed pro-environmental behaviour.
Teachers’ and children’s positive approaches to science and environmental issues.
In considering approaches to education of young children, Hyun [42] discusses how children’s perceptions of nature are bondings-to-the-earth, as an affinity that children have
Amygdal
260
“Sustainable Management and Development of Mountainous and Island Areas”
across all cultures for their natural environment, described by Wilson [96, 97] as biophilia, or a love of nature. However, if this natural propensity is not fostered or negative influences are experienced, the opposite, or biophobia, may develop [66, 67, 68] which ranges from discomfort with natural environments or an actively negative view where nature is seen as inferior to human settings, with nature viewed as an objective resource to be exploited. Kahn [43] relates this to children’s moral environmental reasoning where they may compare natural organisms to humans (isomorphic biocentric reasoning), so animals warrant similar consideration to humans because they have similar needs. They may progress to a view where natural entities are seen as having needs for their own sake (transmorphic biocentric reasoning) and where moral principles can be applied equally to humans and other creatures.
Developmentally meaningful and culturally meaningful approaches to young children include adults helping children to make meaningful connections with what they want to know and how they wish to make meaningful experiences [41]. Adults, therefore, need to demonstrate biophilic traits and to support children’s natural curiosity of nature in interacting with children in order to enhance their biophilia and biocentric reasoning. This applies to how teachers interact with children of all ages so that they develop positive attitudes to the environment and behaviour is informed by understanding, while science curricula also need to be compatible with biophilic attitudes to the environment.
Teachers’ attitudes to learning can influence children’s responses, hence the models teachers present are very important. Teachers can also foster children’s positive scientific and environmental attitudes to learning include: curiosity, interest, enjoyment of learning (affecting motivation to learn); confidence, creativity (fostering independence in learning); criticality, understanding of uncertainty (encouraging evaluation of evidence); awe and wonder, understanding of interconnectedness of living things (nurturing spirituality and a sense of relational identity); empathy/care of self, others and environment (influencing motivation to act positively).
The personalisation and politicisation of science.
Hodson [39] describes the need for the personalisation and politicisation of science education to make it meaningful to the contemporary world. Environmental relationship and care need to be added to this to support sustainability leading potentially to informed action about the environment. This supports the primary aims of environmental education which are to inform, provide experiences and to stimulate action to support sustainable practice; or environmental education about, through and for the environment, as defined by the National Curriculum Council [64].
Constructivist approaches to teaching, derived from the ideas of Piaget [72], start with learners’ experiences and ideas as a way of encouraging meaningful approaches to learning that relate scientific concepts to life experiences. The constructivist teaching sequence including orientation, elicitation, intervention, review and application specifically helps children connect scientific ideas to their personal experiences and world-view [56]. Social interaction is an important feature of the process [91], as personal views need to be set against the views of others and generally accepted scientific positions. Such approaches, which respond to children’s interests, also increase motivation to learn [71].
This approach needs to be supported by experiences of living organisms and natural environments, which are important in enhancing meaningful learning that links directly to affective experiences [11]. Evolutionary biologists have suggested that attitudes to certain species may be genetically influenced, such as anthropomorphic preferences for large mammals with similar features to humans in appearance and behaviour, with capacity for social grouping or those which are familiar, particularly domestic farmed or zoo animals with human-like features [92]). Similarly, irrational dislike of snakes or spiders may have evolutionary links to actual dangers for our distant tree-dwelling human ancestors. Also, children often describe animal as organisms that are large terrestrial and quadruped [6] and they prefer animals to plants [24] because they identify with and are fascinated by movement [45]. However, experiences of living organisms can enhance children’s
261
“Sustainable Management and Development of Mountainous and Island Areas”
attitudes to a range of species and extend their understanding of biological concepts [45]. This increases the range of identification with the living world, so potentially engendering a wider sense of care and responsibility.
In view of the alarming loss of biodiversity at this time, which prompts Sagan and Druyan [80] refer to the present time the as the sixth extinction period, it is essential to educate children about the value and diversity of organisms [38]. It is particularly important to educate children at an early stage to foster the biophilia that young children tend to exhibit towards living organisms [96, 97]. However 6-10 year olds were also found to be most unfeeling and exploitative in their attitudes towards animals, so there is a priority to emphasise affective concern for living species in this age group particularly [38].
Care is an essential ingredient in encouraging pro-environmental behaviour. The evolutionary roots of altruism is through kin selection in that animals tend to care for others with related genes and human morality is associated with this sense of related care. Hence, a sense of relationship is an essential prerequisite for care [75]. Empathy is also fundamental to altruistic behaviour, as this is how humans recognise others’ emotions. Empathy has a neuronal basis, as ‘mirror neurones’ fire in an observer’s brain when others’ emotional behavioural responses are recognised, often triggering similar emotional responses. For example, we may feel elated at seeing joy in others, cry when we perceive others’ sadness, or flinch when we perceive pain. Empathy and care, which lie at the root of morality can be emphasised in science curricula to explicitly show how humans are part of an interconnected whole with relationships to other living organisms and part of interconnected systems where actions can have positive or negative environmental consequences.
The politicisation of science looks at how scientific application impacts on the environment. Approaches to controversial issues can involve a variety of interactive strategies to enhance learning [70]. This variety is important to enhance motivation and there should also be appropriate challenge to meet students’ interests and capacities. Palmer [71] recommends emphasis of student choice and direction of task with small working groups to enhance motivation feeding back to the larger group, with teacher modelling of enthusiasm and interest and with confidence
in students’ abilities to work at high levels with praise and encouragement for achievements [71]. Such variety is important because of problems of monotony when strategies are repeated too often and can include combinations of approaches, including, for example, discussions and a combination of practical, teacher explanation [12], application to real life contexts [5], use of photographs and newspaper articles [88], discussion and laboratory approach [14], and peer group collaboration and computer simulation [86]. Drama is a particularly useful teaching strategy, as it engages the whole person in the learning process [56, 59]. This can involve identification of individuals through drama with the environmental consequences of actions. Approaches to environmental ethics in this context may emphasise awareness of personal responsibility for consequences of actions through analysis of Situations, Opportunities, Consequences and Solutions to environmental problems (SOCS; after Goleman [31]). Empathy and care is fundamental in this and the choices between ‘cooperate’ or ‘cheat’ [74] on an environmental level influence whether the action taken is oriented to the individual’s or the environment’s interest. In developing such approaches to environmental ethics there are a number of levels of interest in considering action towards the environment:
Self (anthropocentric): personal health Other people (sociocentric): interpersonal
relationsOther living things (biocentric): animal
welfare Ecosystems (ecocentric): endangered
ecosystems, species Planetary (Giacentric): planetary problems,
e.g. climate change
Ultimately, the aim is to secure positive attitudes, which may lead to pro-environmental behaviour, as evidenced by studies that show positive impact of science projects on understanding and attitudes to science or the environment [9, 15, 29].
Conceptual integration to demonstrate complex interactive environmental effects.
The application part of the constructivist teaching sequence is particularly important in linking scientific ideas to real life phenomena
262
“Sustainable Management and Development of Mountainous and Island Areas”

and this is where connections can be made to the environmental issues. In this process it is important to make chains of connections in events and processes explicit so that actions and consequences can be understood [79]. For example Calabrese Barton et al. [10] discuss a project linking food with farming, processing, packaging, transport, cooking and consumption relating these to issues of environmental and health impact. Food keeps animals and plants alive, yet children often do not make the connection between food and how the body works, why food keeps humans alive and how it is created [22]. This is an example of how the so-called ‘big ideas’ of science provide an integrating function to make sense of science concepts in relation to life experiences and choices linked with environmental consequences.
Central features of this approach are to develop scientific understanding of key concepts that also show how features of the universe are deeply inter-related, leading to responses of awe, wonder, empathy and a sense of relationship that may lead to care and pro-environmental behaviour. This also shows that humans are an integrated part of the biosphere and affect it through a range of activities, including consumer behaviour. Examples of some of these ‘big ideas’ include:
Ecology Food webs illustrate directly the inter-
dependence of life. This can be related to human dietary patterns to show how eating practices have impact on species and ecosystems with ethical implications for animal welfare.
Matter cycles show how materials are continually recycled and conserved in natural ecosystems, pointing to the need for recycling in human activities.
Principles of energy flow through ecosystems demonstrate the need for energy conservation and efficient energy use for sustainable systems, with implications for uses in society and personal impact on this.
Gaseous cycles: show how changes in atmospheric gases linked to increased use of fossil fuels, in particular, lead to climate change and global warming with implications for connecting energy use with greenhouse gas emissions.
Biodiversity shows biological complexity. This highlights the precarious existence of
endangered species and the need for conservation measures.
Levels of biological organisation show how living things are organised within many different, connected, interacting levels to include cells, tissues, organs, organ systems, individual, species, community, ecosystem and biosphere. This provides a sense of place in the universal order of living and non living things. Fractals are a useful way of connecting these ideas to art and aesthetics.
Evolution and classification systems show how all living organisms are related providing and explicit connection of humans to the ‘family of life’.
Human biology Functions of the body link directly to health
choices associated with patterns of eating and activity.
Understanding how materials enter, are used in and leave the body makes explicit the need to balance input and output to achieve a healthy body size.
Understanding of energy flow through the body illustrates the effects of foods that have high potential for energy transfer in the body and the implications for body size.
Genetics DNA is the universal molecule and code for
life on Planet earth and humans share this code with all other life forms. Degrees of relatedness are shown by similarity of DNA; e.g. we are about 50% related to bacteria and some 70% related to plants because of similar biochemical processes, while we are 99% related to chimpanzees, our closest relatives. This further illustrates that humans are part of the ‘family of life’, which extends the circle of relationship and direct connection with other living things with potential for developing empathy, care and responsibility.
Evolution Ancestral connections of the ‘family of life’
that gave rise to humans are shown through evolutionary relatedness. This can be well illustrated by a time line that shows which life forms were present at different points of time throughout evolutionary history.
263
“Sustainable Management and Development of Mountainous and Island Areas”

Earth and space Scale models of the solar system to include
space as well as relative sizes of planets show the vastness of space, generating a sense of awe and wonder.
Maps in space demonstrate how we are located in the universe; e.g. I live in my house, in my street, in my town, in my county, in my country, in my continent, in my planet, in my solar system, in my galaxy, in my universe.
A time map of events from the ‘Big Bang’ to present illustrates the formation of features of the Universe, contributing to a sense of location in time.
The idea of formation of light elements in the time after the Big Bang and the heavier elements in the formation of stars, with conservation and recycling of elements shows that we are effectively ‘Stardust’; the materials that make us are constantly being changed and recycled through compounds in living and non living systems.
Matter and energy The permanence of matter concept is
important to realise that materials do not disappear but may be changed; e.g. fossil fuel conversion to carbon dioxide in the atmosphere contributing to global warming. This concept is important to understand that human activity can create pollution of many kinds, but can be limited by resource conservation and recycling of materials, which takes place in natural ecosystems.
The material cycles of meteorology, geology and biology show how matter changes and is constantly transferred through chemical and physical processes.
Geological cycles, including rock cycles and tectonic changes illustrate processes of changes of the Earth through time.
Classification of materials shows how all atoms are composed of the same essential ingredients, which take on different properties in different combination as elements and compounds, leading to an understanding of material properties and use in society.
How fuels combine with oxygen to release energy is important to efficient energy use and energy conservation.
History and philosophy of science
Stories of activities of scientists and how ideas developed through history illustrate that scientific ideas are tentative, change with new evidence and have impact on society: e.g. the development of ideas of electricity from Thales in 600BC who demonstrated static electricity by rubbing amber with silk through to the present universal use of electricity to power society [50, pp49-50].
These ideas are examples to show how scientific concepts can be used to support understanding of environmental issues, which can lead to positive environmental attitudes and supportive action. The list is not intended to be exhaustive and needs to be developed further through debate about how the science curriculum may be taught to lead to scientifically literate individuals who are sensitive and concerned about the environment leading to informed action.
An issues-based approach is a useful way of organising the curriculum to develop such concepts in a way that supports constructivist pedagogy and an integration of the cognitive and affective domains in science with clear links to environmental issues. Ross et al. [79] use the following topics to forge such links: Matter; Genetics; Atmosphere; Biodiversity; Energy; Agriculture; The Home; Health; Transport. This approach covers all the concept areas of the science national curriculum, setting them in a meaningful environmental context. Such an approach is desirable to address science in the national curriculum in a way that supports meaningful learning of science, fosters understanding of environmental issues and emphasises care and responsibility with informed action based on a sense of relationship to other living organisms and interconnectedness with the environment at large.
References.
[1] Alsop S, Watts M. Facts and feelings: exploring the affective domain in the learning of physics. Physics Education 2000; 35: 132-138.
[2] Andre T, Whigham M, Hendrickson A, Chambers S. Competency beliefs, positive affect, and gender stereotypes of elementary students and their parents about science versus other school subjects. Journal of Research in Science Teaching 1999; 36: 719-747.
264
“Sustainable Management and Development of Mountainous and Island Areas”

[3] Appleyard B. Understanding the Present: Science and the Soul of Modern Man. London: Pan; 1992.
[4] Ballantyne R, Packer J. Promoting environmentally sustainable attitudes and behaviour through free choice learning experiences: what is the state of the game? Environmental Education Research, 2005; 11: 281-295.
[5] Banet E, Nunez F. Teaching and learning about human nutrition: a constructivist approach. International Journal of Science Education 1997, 19, 1169-1194.
[6] Bell BF. When is an animal not an animal? Journal of Biological Education 1997; 15: 213-218.
[7] Bohm D, Peat FD. Science, order and creativity. New York: Bantam Books; 1987.
[8] Brody M. Learning in nature, Environmental Education Research, 2005; 11: 603-621.
[9] Brossard D, Lewenstein B, Bonney R. Scientific knowledge and attitude change; the impact of a citizen science project. International Journal of Science Education 2005; 27: 1099-1121.
[10] Calabrese Barton A, Koch PD, Contento IR, Hagiwara S. From global sustainability to inclusive education: understanding urban children’s ideas about the food system. International Journal of Science Education 2005; 27: 1163-1186.
[11] Caro TM, Pelkey N, Grigione M. Effects of conservation biology education on attitudes toward nature. Conservation Biology 1994; 8: 846-852.
[12] Chinn CA, Brewer WF. The role of anomalous data in knowledge acquisition: a theoretical framework and implications for science education, Review of Educational Research 1993; 63: 1-49.
[13] Chin C, Malhotra BA. Children’s responses to anomalous scientific data: how is conceptual change impeded? Journal of Educational Psychology 2002; 94: 383-401.
[14] Christianson RG, Fisher KM. Comparison of student leaning about diffusion and osmosis in constructivist and traditional classrooms, International Journal of Science Education 1999; 21: 687-698.
[15] Crane V, Nicholson H, Chen M, Bitgood S, editors. Informal science learning: what the research says about television, science museums, and
community-based projects. Ephrata, PA: Science Press; 1994.
[16] Crawley FE, Koballa TR. Attitude research in science education: contemporary models and methods, Science Education 1994; 78: 35-56.
[17] Currie JR. Affect in the schools: a return to the most basic of basics, Childhood Education 1988; 65: 83-87.
[18] Damasio SS. Descarte’s error: emotion, reason and the human brain. New York: Avon Books; 1994.
[19] Damasio SS. The feeling of what happens: body and emotion in the making of consciousness. New York, Avon Books; 1999.
[20] Dennett DC. Consciousness explained. London, Viking; 1993.
[21] Driver R, Guesne T, Tiberghien A. Children’s ideas in science. Milton Keynes, Open University; 1985.
[22] Driver R, Squires A, Rushworth P, Wood-Robinson V. Making sense of secondary science: research into children’s ideas. London: Routledge; 1994.
[23] Falk JH. Free-choice environmental learning: framing the discussion, Environmental Education Research 2005; 11: 265-280.
[24] Flannery MC. Considering plants, The American Biology Teacher 1991; 53: 306-309.
[25] Francis LJ, Greer JE. Measuring attitude towards science among secondary school students: the affective domain. Research in Science and Technology Education 1999; 17: 219-26.
[26] Freedman MP. Relationship among laboratory instruction, attitude toward science, and achievement in science knowledge. Science Education 1995; 84: 445-468.
[27] Gardner H. Frames of mind: the theory of multiple intelligences. New York: Basic Books; 1983.
[28] Gardner H. Multiple intelligences: the theory in practice (New York, Basic Books; 1993.
[29] George R, Kaplan D. A structural model of parent and teacher influences on science attitudes of eighth graders: evidence from NELS:88. Journal of Research into Science Teaching 1998; 82: 93-109.
[30] Gilligan C. In a different voice: psychological theory and women's development. Cambridge: Harvard University Press; 1982.
265
“Sustainable Management and Development of Mountainous and Island Areas”

[31] Goleman D. Emotional intelligence. London: Bloomsbury; 1996.
[32] Greene B. The elegant universe: superstrings, hidden dimensions and the quest for the ultimate theory. London, Vintage; 2000.
[33] Griffin DR. editor. The reenchantment of science: postmodern proposals Albany: State University of New York Press; 1988.
[34] Gurevitz R. Affective approaches to environmental education: going beyond the imagined worlds of childhood? International Journal of Science Education 2002; 24: 645-660.
[35] Harmon W. Global mind change. Indianapolis, IN: Knowledge Systems; 1988.
[36] Harvey D. The condition of postmodernity. Oxford: Blackwell; 1989.
[37] Hawking SH. A brief history of time: from the big bang to black holes. London, Bantam; 1988.
[38] Heywood VH, editor. Global diversity assessment. Cambridge: Cambridge University Press; 1995.
[39] Hodson D. Seeking directions for change: the personalisation and politicisation of science education. Curriculum Studies 1994; 2: 71-97.
[40] Holton G. How to think about the ‘anti-science’ phenomenon. Public Understanding of Science 1992; 1: 103-128.
[41] Hyun E. Making sense of developmentally and culturally appropriate practice (DCAP). New York: Peter Lang; 1998.
[42] Hyun E. How is young children’s intellectual culture of perceiving nature different from adults? Environmental Education Research 2005; 11: 199-214.
[43] Kahn PH Jr. The human relationship with nature: development and culture. Cambridge, MA: The MIT press; 1999.
[44] Kaufman S. At home in the universe: the search for the laws of complexity. London, Penguin; 1995.
[45] Kinchin IM. Investigating secondary-school girls’ preferences for animals or plants: a simple ‘head-to-head’ comparison using two unfamiliar organisms. Journal of Biological Education 1999; 33: 95-99.
[46] Koballa TR. Children's attitudes toward learning science, in SM Glynn, R Duit. Editors. Learning science in the
schools. Research reforming practice. New Jersey: Lawrence Erlbaum Associates; 1995.
[47] Kollmuss A, Agyeman J. Mind the gap: why do people act environmentally and what are the barriers to pro-environmental behaviour? Environmental Education Research 2002; 9: 447-460.
[48] Kupermintz H. Affective and conative factors as aptitude resources in high school science achievement. Journal of Science Education and Technology 1997; 6: 245-255.
[49] Laforgia J. The affective domain related to science education and its evaluation. Science Education 1988; 72: 407-21.
[50] Lakin L. Faraday, bubbles and science processes, in M Littledyke, K Ross, L Lakin, Science knowledge and the environment: a guide for students and teachers in primary education. London, David Fulton; 2000.
[51] Lemke JL. Articulating communities: sociocutural perspectives in science education. Journal of Research in Science Education 2001; 38: 303-318.
[52] Lester BT, Li M, OkheeL, Lambert J. Social activism in elementary science education: a science, technology, and society approach to teach global warming. International Journal of Science Education 2006; 28: 315-339.
[53] Lindemann-Matthies P. ‘Loveable’ mammals and ‘lifeless’ plants: how children’s interest in common local organisms can be enhanced through observation of nature. International Journal of Science Education 2005; 27: 655-677.
[54] Littledyke M. Science education for environmental awareness in a postmodern world. Environmental Education Research 1996; 2: 197-214.
[55] Littledyke M. Science education for environmental education? Primary teacher perspectives and practices. British Educational Research Journal 1997; 23: 641-659.
[56] Littledyke M. Live issues: drama strategies for personal social and moral education. Birmingham: Questions Publishing Company; 1998.
[57] Littledyke M, Ross K, Lakin L. Science knowledge and the environment: a guide for students and teachers in primary education. London, David Fulton; 2000.
266
[58] Lyon D. Postmodernity. Buckingham, Open University Press, 1994.
[59] McNaughton MJ. Educational drama in the teaching of education for sustainability, Environmental Education Research 2004; 10: 139-155.
[60] Medawar P. Is the scientific paper a fraud?, London: BBC Publications, reprinted in Brown J, Cooper A, Horton T, Toates F, Zeldin D, editors. Science in Schools. Milton Keynes: Open University Press; 1979.
[61] Moheno BB. Toward a fully human science education: an exploratory study of prospective teachers’ attitudes towards humanistic science education. International Journal of Science Education 1993; 15: 95-106.
[62] Morgan H. Cognitive styles and classroom learning. Wesport, CT: Praeger; 1997.
[63] National Curriculum Council. Science: non statutory guidance. York: NCC; 1989.
[64] National Curriculum Council. Curriculum Guidance 7: Environmental Education. York: NCC; 1990.
[65] Novak J. Gowin D. Learning how to learn. Cambridge: Cambridge University Press; 1984.
[66] Orr DW. Ecological literacy; education and the transition to a postmodern world. Albany, NY: State University of New York Press; 1992.
[67] Orr DW. Love it or lose it: the coming Biophilia revolution, in SR Kellert, EO. Wilson, editors. The Biophilia hypothesis. Washington, DC: Island Press; 1993.
[68] Orr DW. Earth in mind. Washington, DC: Island Press; 1994.
[69] Osborne RJ, Wittrock MC. Learning in science: a generative process. Science Education 1983; 67: 489-508.
[70] Oulton C, Dillon J, Grace M. Reconceptualising the teaching of controversial issues. International Journal of Science Education 2004; 26: 411-424.
[71] Palmer D. A motivational view of constructivist-informed teaching. International Journal of Science Education 2005; 27: 1853-1881.
[72] Piaget J. The development of thought: equilibration of cognitive structures. Oxford, Blackwell; 1978.
[73] Popper K. Conjectures and refutations. London, Routledge, Keegan and Paul; 1963.
[74] Poundstone W. Prisoner’s dilemma. Oxford, Oxford University Press; 1992.
[75] Ridley M. The origins of virtue. London, Penguin; 1997.
[76] Rodriguez A. The dangerous discourse of invisibility. Journal of Research into Science Teaching 1997; 34: 19-38.
[77] Rogoff B, Lave J. Everyday cognition: its development in social contexts. Cambridge, MA: Harvard University Press; 1984.
[78] Romiszowski AJ. Attitudes and affect in learning and instruction. Educational Media International 1989; 26: 85-100.
[79] Ross K, Lakin L, Burch G, Littledyke M. Science issues and the national curriculum. Cheltenham, University of Gloucestershire; 2005.
[80] Sagan C, Druyan A. Shadows of forgotten ancestors. London: Arrow; 1993.
[81] Simpson RD, Koballa T, Oliver JS. Rawley J. Research on the affective dimension of science teaching. In DL Gabel, editor. Handbook of research on science teaching and learning. New York: Macmillan; 94.
[82] Southerland SA, Sinatra GM, Matthews MR. Belief, knowledge, and science education, Science Education 2000; 84: 445-468.
[83] Strike KA, Posner GJ. A conceptual change view of learning and understanding. In LHT Pines, AL West, editors. Cognitive structure and conceptual change. London, Academic Press; 1985.
[84] Stone SJ, Glascott K. The affective side of science instruction: Teaching strategies, Childhood Education 1997; 74: 102-04.
[85] Swimme B. The Cosmic Creation Story. In Griffin DR, editor, The reenchantment of science: postmodern proposals. Albany: State University of New York Press; 1988.
[86] Tao PK. Gunstone RF. Conceptual change in science through collaborative learning at the computer, International Journal of Science Education 1999; 21: 39-57.
[87] Thompson TL, Mintzes JJ. Cognitive structure and the affective
267
“Sustainable Management and Development of Mountainous and Island Areas”

domain: on knowing and feeling in biology. Journal of Research in Science Teaching 1999; 36: 719-747.
[88] Thorpe S, editor. Race, equality and science teaching. Hatfield, Association of Science Education; 1991.
[89] Treagust DF. Conceptual change: a multidimensional interpretive framework. Paper presented to the Academic Educational Research Association SIG Symposium ‘Subject matter and conceptual change’, April, New York; 1996.
[90] Vernon A. Thinking, feeling, and behaviour. Champaign, IL: Research Press; 1995.
[91] Vygotsky LS. Thought and language. Massachusetts, The M.I.T. Press; 1962).
[92] Ward PI, Moberger N, KistlerC, Fischer O. The relationship between popularity and body size in zoo animals. Conservation Biology 1998; 12: 1408-1411.
[93] Watts M, Alsop S. A feeling for learning: modelling affective learning in school science. The Curriculum Journal 1997; 8: 351-365.
[94] Watts DM, McGrath C. SATIS Factions: approaches to relevance in science education. School Science Review 1998; 79(288): 61-65.
[95] Wenger E. Communities of practice – learning, meaning and identity. Cambridge: Cambridge University Press; 1998.
[96] Wilson EO. Biophilia. Cambridge, MA: Harvard University Press; 1984.
[97] Wilson EO. The diversity of life. Cambridge, MA: Harvard University Press; 1992.
[98] Wood S J. Implementing a successful affective curriculum. Intervention in School and Clinic. 1996; 32: 126-28.
[99] Wittgenstein L. Tractatus logico-philosophicus. London, Routledge Keegan and Paul; 1951.
[100] Wolpert L. The unnatural nature of science. London: Faber; 1992.
[101] Yount JR, Horton PB. Factors Influencing Environmental Attitude: The Relationship between Environmental Attitude Defensibility and Cognitive Reasoning Level. Journal of Research in Science Teaching 1992; 29: 1059-78.
268
“Sustainable Management and Development of Mountainous and Island Areas”

Forest Visualisation Systems
Hendrika Filakti Mamali Msc Forest and Nature Management
Wageningen Universit, The Netherlands Salaminos 46
16674 Athens, Greece E-mail: [email protected]
Abstract. In recent years, visualisation has been widely applied to the management of forest resources. Visual representations have been used to communicate the impact of environmental change, to depict various characteristics and variations existing in the forest, to demonstrate the growth mechanism of individual trees or to judge the visual quality of the landscape. This study reports on the existing visualisation systems. It describes the visualisation methodology used in the forest visualisation packages and contains the most important characteristics of the software packages. It presents ten different visualisation packages (MONSU, Smart Forest, Stand Visualisation System, UTOOLS/UVIEW, Landscape Management System, Vantage Point, Virtual Forest, EnVision, AMAP, FORSI). The choice for these packages is based on information that is available in literature, on the World Wide Web and verbal information from expertise on the subject of visualisation. In addition, the importance of Geographical Information Systems in forest visualisation software packages is outlined. Finally, the applicability of forest visualisation systems to support forest decision management and the usefulness of such tools in forestry research and education are discussed.
Keywords. Visualisation systems, software packages, Geographical Information Systems, forest decision management.
1. Introduction
Computer visualisation is increasingly employed to evaluate and forecast environmental changes and has been widely applied to the management of natural resources [13]. Visual interpretation of data sets and processes is a major trend in all areas of science to bring greater understanding to complex problems [5]. Visualisation tools have been increasingly used to assist in the compilation of large and complex
natural resource data sets [6, 15]. Natural resource scientists are using visualisation tools to better understand their science and social scientists seeking to better understand human behaviour vis-à-vis those resources [8].
The use of three dimensional display formats, combined with colour, shade and scale can support the exploration of more complex relationships and the animation of series of such images can be used to include issues of change over time.
Within a human lifetime many processes of environmental changes are essentially irreversible. Logging activities are especially visible and have a huge impact on scenery and recreational activities as well as on the future growth and yield of timber resources. The uses of a virtual forest make it possible to assess the consequences of each alternative before they occur [26].
Visualisation also provides an efficient tool to communicate with non-experts and engage them in decision-making. Visualisation helps the forest managers to communicate their proposed actions and obtain better feedback on social issues for inclusion in their decision making process. By linking forest ecosystem modelling to visualisation displays, it becomes possible to test observer reactions to controlled ecosystem conditions and to gain valuable information on the social acceptability of proposed alternatives [16]. Thus, it is a valuable tool in decision support in forest management.
Visualisation can also be seen as a tool to educate the public on issues concerning forest ecology recreation and forest management. It is widely recognised within the forestry profession that the public often has little awareness of long term changes such as tree growth and death, and of temporal concepts such as succession and harvest rotations. Visualisation can depict both spatial and temporal variations in the ecosystem, in a visual or geographic context, which many people can recognise and relate to. It therefore
269

offers the opportunity of improving public knowledge regarding ecosystem management [16].
Forestry is a research area in which there has been a dramatic increase both in the complexity of what is known about the interaction within forest ecosystems, and in the necessity to incorporate multiple values in the design and implementation of management strategies. For these reasons data visualisation and virtual reality technology have been receiving increasing attention in forestry decision-making.
2. Visualisation characteristics
Visualisation provides additional insights to results, which would otherwise be displayed as text or numbers [7]. It is a form of communication which is universal, and which has the ability to form an abstraction of the real world into a graphical representation, which is comprehensible to a wide range of people. Computer visualisation is increasingly used to communicate the implication of natural and management changes in biological systems, in national parks and forests [11].
Traditional tools for visual communication of resource issues have included simple graphic devices such as maps, line charts, sketches, photographs and renderings. The new tools include coloured computer maps, 3D models, animations, and interactive virtual reality environments used to explore design ideas. Virtual reality (VR) allows fuller interactivity between the viewer and the visualisation system, whereby viewpoints, travel speeds, landscape conditions, etc. can be modified at will and in real time by user commands. Advanced VR systems allow the observer to experience virtual landscapes as though they were within it, and include headset systems for individual users and a growing variety of multiple observer systems using sophisticated forms of computer projection [16].
2.1 Visualisation techniques
Several techniques have been utilised in forest visualisation applications. The oldest ones, related to landscape aesthetics assessment, were based on individual photographs. Computer visualisation methods range from 3D perspective diagrams to complete virtual realities. Four distinct categories of visualisation techniques can be identified: geometric modelling, video
imaging, geometric video imaging, and image draping [9].
Geometric modelling techniques build 3D geometric models of individual features (or components) such as trees, buildings and roads. The individual objects are assembled to create forest stand or landscape view depicting the perspective from a given viewpoint. The most common use of this approach utilises 3D cones for tree symbols [2].
Video imaging is a computer technique that “cuts and pastes” digital photographic images to represent changes on the landscape. This approach produces high quality visualisation output, but is very manually intensive, contains no direct geo-referencing to a GIS database and often suffers from the artistic/subjective nature of the creation process. In many instances, PC software like Adobe Photoshop is used to manipulate the images [2].
Geometric video imaging is a hybrid approach to combining video-imaging techniques with geometric modelling, typically undertaken with GIS.
Image draping is a well-established technique in GIS. It involves draping an image, such as orthophoto or classified satellite imagery, onto a 3D perspective view. Image draping results in good texture and can produce visualisations suitable for depicting landscape-scale vegetation patterns. However, image drapping is not effective for representing key viewpoint visualisations, typically required for evaluating harvest block layout.
2.2 Project scales for visualisation
Visualisations can be characterised at three different projection scales for natural resources: individual plot, stand and landscape levels. Each project scale represents a specific level of detail and unique requirements for generating realistic visualisations. In many cases, projects require visualisation at different scales. Landscape visualisations are often used to show altered vegetation patterns, and visual quality impacts within a valley or watershed. Stand or plot scale visualisations are typically used to show harvest unit layouts or specific stand treatments. Stand and plot scales tend to be used more for engineering purposes, while landscape is used for planning and public presentation.
Plot level visualisation usually covers a small area and has an objective of depicting forest structure, habitat quality and silviculture
270
“Sustainable Management and Development of Mountainous and Island Areas”
prescriptions. Tree detail includes species, height, diameter and crown/foliage characteristics. Typical data requirements are individual tree characteristics, under-storey conditions and spatial arrangement of individual scene elements. Most plot level programs do not contain variations in the terrain.
Stand level scales occur over much larger areas up to 200 ha. The goal of these visualisation systems is to project area layout such as harvesting parcels. Tree detail encompasses species and height, colour, density and crown characteristics. Data requirements include topography, ground surface characteristics, stand polygons, tree size, species distribution and general under-storey conditions.
Landscape scales involve areas over 200 ha and track vegetation texture, spatial arrangements of stand types, location of project areas, visual quality, insect or other stand damage effects. Tree detail is as high as on stand scales in the foreground but often diminishes to texture mapping at greater distances. The data requirements are similar to those of stand level visualisation.
As a general rule, the larger the area, the less details are required in the input data and final visualisations. Yet, greater data volumes are often needed to generate landscape level visualisations due to significantly larger areas of interest [2].
2.3 Data for developing a virtual forest
Constructing a virtual forest requires integrating information from various sources; information about the topography, delineation of management boundaries such as stands and forest inventory data possibly including the outputs of forest growth simulators and other ecosystem models.
In most forest visualisation applications, the terrain elevation is in the form of a digital elevation model (DEM). Topographic information from the DEM, and the vector boundaries of the stand delineation, provide the basic spatial information for visualising forest data. Trees in a stand are typically described by a list of 10-150 surrogate trees –each surrogate standing in for the whole class of n close-to-identical trees. A complete list of each tree in a stand is rarely available and in most cases unnecessary, since trees are generally not managed with a high degree of specificity [24].
For the representation of the tree data several techniques are available. Trees can be represented as simple line graphics or as texture mapped objects. Digitised photographs can also be used for the representation of the tree data. A tree designer dialog box allows users to easily modify the parameters that control the shape and appearance of individual plants.
If trees are needed for close range drawings, 2D tree patterns are not sufficient; using 3D tree patterns, however, requires much computational time and memory storage. If the location of the viewpoint is fixed, some parts of the data will not be visible. 2.5D tree patterns are a logical alternative to using 3D patterns. A 2D tree pattern that rotates around a vertical line passing through the centre of the trunk can be used. This kind of rotating 2D pattern in called a 2.5D pattern. In a program that produces perspectives, the tree pattern automatically rotates with the viewpoint's rotation so that the front view always shows. If, however, the viewpoint rotates above the tree, a 3D representation will be required to see the top of the tree instead of just a line.
For the representation of the terrain, coloured maps or textured maps can be used.
At the time rendering visualisation actions are applied such as definition of a viewpoint, sun and light source conditions, atmospheric conditions, sky conditions and seasons. The orientation of the visualisation view allows users to dynamically rotate, pan and zoom ("fly") the rendered landscape interactively. Viewing parameters can also be preset.
Several factors make visual techniques more realistic. Atmospheric effects can be added as visualisation events using several different techniques. The primary techniques include sky, haze and fog representation.
The availability of tree or forest simulators is an important tool when visualisation is used for supporting forest management.
3. Forestry Visualisation Software
There are a number of software packages designed for forestry visualisation. Ten different software packages will be presented (MONSU,Smart Forest, Stand Visualisation System, UTOOLS/UVIEW, Landscape Management System, Vantage Point, Virtual Forest, En Vision, AMAP, FORSI). Some of these packages are public domain and some are commercially available [4, 17-23]. Two software packages (AMAP and FORSI) will not be fully
271
“Sustainable Management and Development of Mountainous and Island Areas”

described as they are not available for free but will be mentioned for their wide range of applicability.
3.1 MONSU
MONSU is a forest planning and visualisation software package developed by Prof. Timo Pukkala at the University of Joensuu, Faculty of Forestry, Finland. MONSU requires three types of input data: data on trees (list of representative trees) for every stand, a raster map of stands, and a digital elevation model (DEM) in the raster format.
In MONSU, the visualisations are produced by drawing tree symbols at random positions within a stand on top of the DEM. The species and size distribution of trees and the number of trees per hectare correspond to the compartment of the location as indicated by the compartment data. The trees, which are abstract tree symbols, are drawn by using line graphics. It uses a species-specific crown profile and colour set and fills the crown area with small rectangles or ellipsoids. These are drawn with a darker colour on one side of the crown, resulting in a simple shading effect. Depending on the need of visual accuracy tree graphics can be of poor, medium or high quality. High quality graphics reduce the speed of the program. Six characteristics are used to render the trees: tree species, basal area, number of trees, age, tree height and diameter [14].
MONSU allows the user to specify the distance from the viewpoint to the front edge of the area to be visualised. The user can also change his viewpoint, by changing the location, the elevation, depth and rotation. Additionally, the viewpoint can be within the forest on the ground level, where changes can also be made to elevation, depth and rotation. Besides changing the location of the viewpoint the user can choose the season and the atmospheric conditions.
With the method used in MONSU planning software, the outcomes of different treatment schedules for the stands are predicted by the planning software prior to optimisation. MONSU uses tree growth simulation models to enable optimisation. The outcomes of the different treatment schedules are collected into the planning model together with the management objectives specified by the decision-makers. The planning model is then solved using numerical optimisation. The result is a proposal for a forest management plan. Future states of the forest in
the optimal plan can be visualised using the visualisation module of MONSU. The visualisation characteristics of the MONSU are shown in Table 1.
Table 1. Visualisation characteristics of MONSU.
Visualisation technique
Geometric modelling Image drapping
Project scale Stand and Landscape
Data requirements
Data on trees Raster map Digital Elevation Model
Trees Line graphics Data representation
Terrain Colour map
Environmental conditions
Atmospheric effects, Seasonal effect
Users navigation
Users define location, rotate, zoom
Vis
ualis
atio
n ch
arac
teris
tics M
ON
SU
Simulation of management alternatives
Available
3.2 SmartForest
SmartForest is an advanced graphically oriented forest visualisation program developed at the Imaging Systems Laboratory, University of Illinois in collaboration with the UDSA Forest Service and the University of Helsinki. SmartForest is an interactive 3D forest environment where each tree symbol represents biological data about tree type, size and vigour. The user can view the ground level within a forest, walk between the trees, view large forest areas from user-defined aerial height and classify stands and trees by highlighting them with different user-defined colour-codes. With separate commands the program renders the ground and trees with realistic textures that creates a highly realistic virtual world surrogate of the forest [11-12].
SmartForest has three main data components. A digital elevation model (DEM) provides topographical data for creating the landform features; a stand file provides the locations for stand data to be overlaid on the DEM; and tree list files provide the records of the trees to place in those stands. The stand file is a grid file matching the cell dimensions of the DEM in use and compiled either directly from digitisation or as an output of a geographical information system (GIS). Four characteristics are used to render the trees: tree species, diameter breast height (dbh), number of trees per hectare and tree
272
“Sustainable Management and Development of Mountainous and Island Areas”
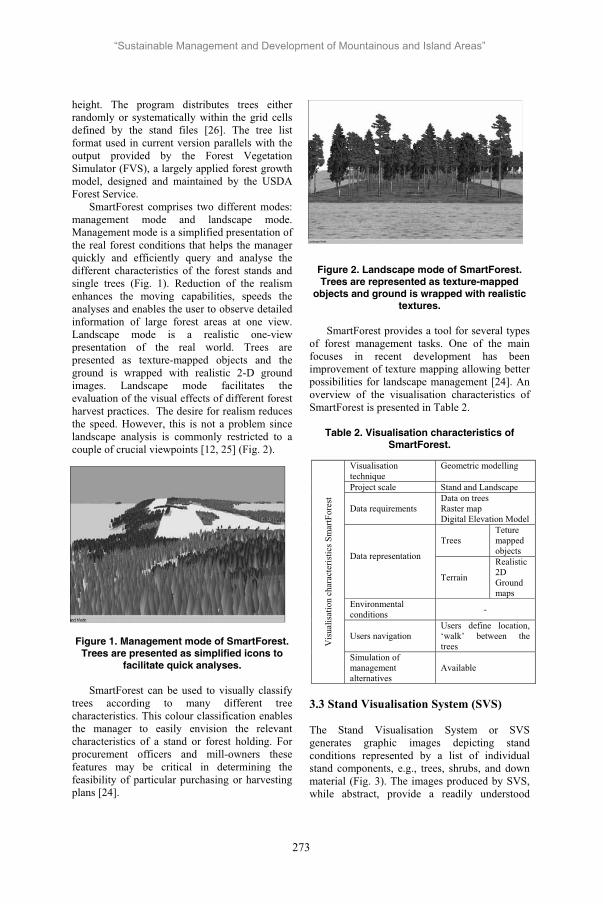
height. The program distributes trees either randomly or systematically within the grid cells defined by the stand files [26]. The tree list format used in current version parallels with the output provided by the Forest Vegetation Simulator (FVS), a largely applied forest growth model, designed and maintained by the USDA Forest Service.
SmartForest comprises two different modes: management mode and landscape mode. Management mode is a simplified presentation of the real forest conditions that helps the manager quickly and efficiently query and analyse the different characteristics of the forest stands and single trees (Fig. 1). Reduction of the realism enhances the moving capabilities, speeds the analyses and enables the user to observe detailed information of large forest areas at one view. Landscape mode is a realistic one-view presentation of the real world. Trees are presented as texture-mapped objects and the ground is wrapped with realistic 2-D ground images. Landscape mode facilitates the evaluation of the visual effects of different forest harvest practices. The desire for realism reduces the speed. However, this is not a problem since landscape analysis is commonly restricted to a couple of crucial viewpoints [12, 25] (Fig. 2).
Figure 1. Management mode of SmartForest. Trees are presented as simplified icons to
facilitate quick analyses.
SmartForest can be used to visually classify trees according to many different tree characteristics. This colour classification enables the manager to easily envision the relevant characteristics of a stand or forest holding. For procurement officers and mill-owners these features may be critical in determining the feasibility of particular purchasing or harvesting plans [24].
Figure 2. Landscape mode of SmartForest. Trees are represented as texture-mapped
objects and ground is wrapped with realistic textures.
SmartForest provides a tool for several types of forest management tasks. One of the main focuses in recent development has been improvement of texture mapping allowing better possibilities for landscape management [24]. An overview of the visualisation characteristics of SmartForest is presented in Table 2.
Table 2. Visualisation characteristics of SmartForest.
3.3 Stand Visualisation System (SVS)
The Stand Visualisation System or SVS generates graphic images depicting stand conditions represented by a list of individual stand components, e.g., trees, shrubs, and down material (Fig. 3). The images produced by SVS, while abstract, provide a readily understood
Visualisation technique
Geometric modelling
Project scale Stand and Landscape
Data requirements Data on trees Raster map Digital Elevation Model
Trees Teture mapped objects Data representation
Terrain
Realistic 2DGround maps
Environmental conditions -
Users navigation Users define location, ‘walk’ between the treesV
isua
lisat
ion
char
acte
ristic
s Sm
artF
ores
t
Simulation of management alternatives
Available
273
“Sustainable Management and Development of Mountainous and Island Areas”
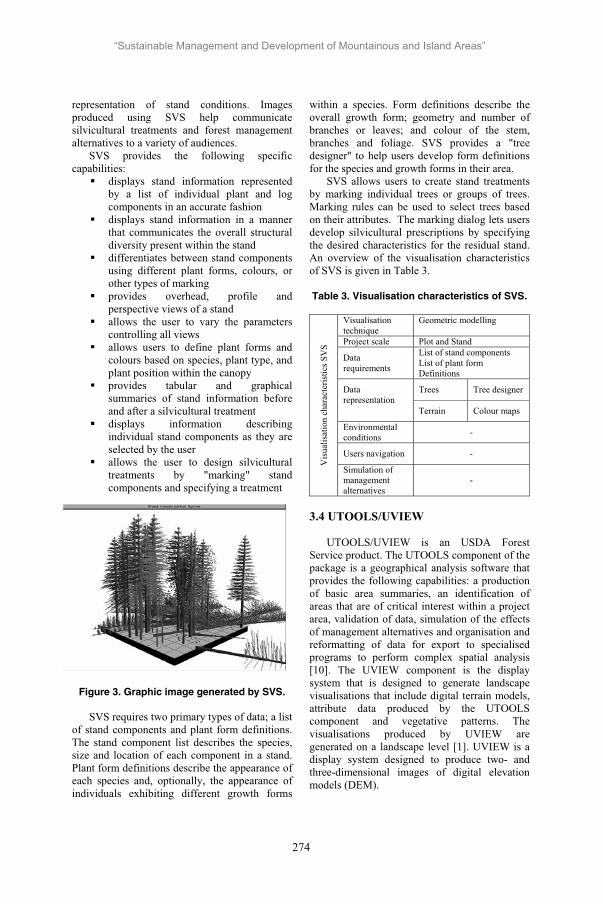
representation of stand conditions. Images produced using SVS help communicate silvicultural treatments and forest management alternatives to a variety of audiences.
SVS provides the following specific capabilities:
displays stand information represented by a list of individual plant and log components in an accurate fashion displays stand information in a manner that communicates the overall structural diversity present within the stand differentiates between stand components using different plant forms, colours, or other types of marking provides overhead, profile and perspective views of a stand allows the user to vary the parameters controlling all views allows users to define plant forms and colours based on species, plant type, and plant position within the canopy provides tabular and graphical summaries of stand information before and after a silvicultural treatment displays information describing individual stand components as they are selected by the user allows the user to design silvicultural treatments by "marking" stand components and specifying a treatment
Figure 3. Graphic image generated by SVS.
SVS requires two primary types of data; a list of stand components and plant form definitions. The stand component list describes the species, size and location of each component in a stand. Plant form definitions describe the appearance of each species and, optionally, the appearance of individuals exhibiting different growth forms
within a species. Form definitions describe the overall growth form; geometry and number of branches or leaves; and colour of the stem, branches and foliage. SVS provides a "tree designer" to help users develop form definitions for the species and growth forms in their area.
SVS allows users to create stand treatments by marking individual trees or groups of trees. Marking rules can be used to select trees based on their attributes. The marking dialog lets users develop silvicultural prescriptions by specifying the desired characteristics for the residual stand. An overview of the visualisation characteristics of SVS is given in Table 3.
Table 3. Visualisation characteristics of SVS.
Visualisation technique
Geometric modelling
Project scale Plot and Stand
Data requirements
List of stand components List of plant form Definitions
Trees Tree designer Data representation
Terrain Colour maps
Environmental conditions -
Users navigation -
Vis
ualis
atio
n ch
arac
teris
tics S
VS
Simulation of management alternatives
-
3.4 UTOOLS/UVIEW
UTOOLS/UVIEW is an USDA Forest Service product. The UTOOLS component of the package is a geographical analysis software that provides the following capabilities: a production of basic area summaries, an identification of areas that are of critical interest within a project area, validation of data, simulation of the effects of management alternatives and organisation and reformatting of data for export to specialised programs to perform complex spatial analysis [10]. The UVIEW component is the display system that is designed to generate landscape visualisations that include digital terrain models, attribute data produced by the UTOOLS component and vegetative patterns. The visualisations produced by UVIEW are generated on a landscape level [1]. UVIEW is a display system designed to produce two- and three-dimensional images of digital elevation models (DEM).
274
“Sustainable Management and Development of Mountainous and Island Areas”

UVIEW provides a system for viewing a digital elevation model. Four parameters control the appearance of perspective views:
head or eye location focus or target location camera lens focal length vertical exaggeration
UVIEW allows users to specify exact co-ordinates for the head and focus locations or interactively select a head and focus location while viewing a simple perspective representation of the DEM. Users can also "fly" over and around a low resolution image of a DEM using a mouse controlled "virtual trackball".
UVIEW models vegetation patterns to simulate existing or desired landscape conditions. The visualisation characteristics of UTOOLS/UVIEW are presented in Table 4.
Table 4. Visualisation characteristics of UTOOLS/UVIEW.
Visualisation technique
Geometric modelling
Project scale Stand and Landscape
Data requirements
Data on trees Layer description Density description DEM
Trees Linegraphics Data
representation Terrain Colour
maps Environmental conditions -
Users navigation Users define location, ‘fly’ over and around a low resolution image
Vis
ualis
atio
n ch
arac
teris
tics U
TOO
LS/U
VIE
W
Simulation of management alternatives
Available
The primary goal in the vegetation modelling is to simulate overall landscape texture and pattern rather than specific, detailed vegetation structure. UVIEW uses two methods to visualise vegetation patterns. The first method uses estimates of canopy closure contained in a spatial database to generate tree cover for each pixel. The second method relies on vegetation codes contained in a spatial database and a second database containing structure definitions for each possible vegetation code. Canopy closure based vegetation modelling represents vegetation patterns over an entire landscape. The canopy closure method represents differences in stand densities but does not represent differences in
stand composition and structure. UVIEW represents all values of canopy closure using the same type and size of plant; only the density of plants varies. Vegetation modelling, based on structure definitions, represents both stand density and stand composition. Stand structure definitions consist of layer descriptions. Each layer in a vegetation type is described by the type of plant, plant stem diameter, plant height, plant crown diameter, plant live crown ratio, a factor describing the variability of the size parameters and the number of plants per unit area (normally acres or hectares). UVIEW represents a variety of plant types ranging from grass to mature, healthy conifer and hardwood trees.
3.5 Landscape Management System (LMS)
The Landscape Management System (LMS) is a set of software tools designed to aid in landscape management of forest resources. LMS is a computerised system that integrates landscape level spatial information, stand level-inventory data and individual tree growth models to project changes through time across forested landscapes. LMS uses the Stand Visualisation System (SVS) for its stand visualisation. Landscape visualisation in LMS is accomplished by using UVIEW from the UTOOLS Watershed Analyses package (Fig. 4).
Figure 4. SVS and UVIEW combined in the software of LMS.
LMS facilitates forest management planning, policy-making, as well as education. LMS projects changes in individual stands and landscapes up to 20.000 ha. LMS can be used in any forested region for which there is a growth model and appropriate inventory information. LMS projects growth at the stand and landscape levels using existing growth models. Changes in
275
“Sustainable Management and Development of Mountainous and Island Areas”

stands and landscapes can be projected over time under different management regimes.
LMS co-ordinates the activities of various pieces of software that in combination can be used for the management, projection, summarisation and visualisation of information about stands on the landscape. It is an integrative effort that combines technologies and available software into a comprehensive system that facilitates landscape level planning, management and analysis.
In LMS, landscapes are composed of stands. These stands are projected through time using available forest projection models. The stands in LMS are represented by a tree list for each stand. The tree list includes species, diameter, height, trees per acre and other attributes for trees in the stand. These tree lists are the basic unit of projection and allow LMS to be flexible because information about individual trees on the landscape is maintained as the stands are projected. An overview of the visualisation characteristics of LSM is presented in Table 5.
Table 5. Visualisation characteristics of LSM.
Visualisation technique
Geometric modelling
Project scale Stand and Landscape
Data requirements
Data on trees Layer description Density description DEM
Trees Tree designerData
representation Terrain Colour
maps Environmental conditions -
Users navigation
Users define location, ‘fly’ over and around a low resolution image V
isua
lisat
ion
char
acte
ristic
s LM
S
Simulation of management alternatives
Available
3.6 VantagePoint
VantagePoint generates and displays perspective colour images of forest landscapes ranging in size from individual harvest units to multiple watersheds. VantagePoint assists forest engineers to visualise forest operations on the landscape and can also aid in the evaluation of visual quality.
Images are generated from 3D spatial data representing topography, tree stands and the location of forest planting, harvesting and road
building activities. The VantagePoint user interface is provided with a timeline. The user places a sequence of events on the timeline and manipulates the parameters of the events to simulate management activities.
Events are broken into two categories, those that set viewing parameters and those that introduce and manipulate elements of the landscape. Viewer parameter events begin with a general view control event that allows the user to set “camera” variables and elements of the landscape to display. Viewing parameter events establish background, atmospheric and lighting conditions.
Landscape elements controlled by timeline include ground topography, linear feature (roads, streams and boundaries) and tree stands, which are supplied by the user.
VantagePoint uses digital elevation model (DEM) files. VantagePoint can accommodate DEM data with different resolutions but requires a raster data structure in all elevation models. VantagePoint accepts data from a GIS describing linear and polygon features such as roads, streams and boundaries. Individual forest stands are represented using data describing the distribution of species and the size classes. Data are organised into stand descriptions consisting of one or more stand layers. Each layer is described by a table listing the species, initial size and number of stems per acre within the layer.
VantagePoint uses a planting event to place trees within stand polygons (Fig. 5-6). This activity expands the stand description into a list of individual trees that will be drawn within the stand polygon. This detailed tree list allows the user to model a variety of treatments on individual stands.
Figure 5. Harvest unit boundaries imported from a GIS displayed by VantagePointon a
perspective view of a landscape.
276
“Sustainable Management and Development of Mountainous and Island Areas”
Figure 6. Landscape generated by VantagePoint with tree stands.
Harvest operations can be simulated by removing a certain proportion of the trees from a stand (Fig. 7). Additional trees can be "planted" to simulate natural regeneration or actual planting operations.
Figure 7. A VantagePoint generated landscape with one harvest unit clear-cut.
Vantage Point addresses the dimensional accuracy issue by allowing the user to interact more directly with 3D landscape data. Design information can be displayed and manipulated on a perspective image of the landscape. More importantly, the user may view the landscape from any position and magnification. Design information can be imported and exported to a GIS.
VantagePoint provides a number of features that allow the user to produce more realistic looking images. One of these is the tree designer similar to the SVS tree designer. Data provided by the user describes the species and size distribution of trees within any particular stand. The actual appearance of individual trees is however determined by the user by creating tree models with the tree designer.
VantagePoint provides the capability to texture map ground surfaces. Textures can be applied to the ground beneath a forest stand to
simulate the appearance of shrubs and regeneration or to open areas to simulate grass meadows or other non-forest vegetation. Textures are developed from scanned photography or taken from existing texture libraries commonly used with ray-tracing and rendering packages. Textures are applied to the ground surface within polygon boundaries. The visualisation characteristics of VantagePoint are presented in Table 6.
Table 6. Visualisation characteristics of VantagePoint.
Visualisation technique
Video imaging
Project scale Landscape
Data requirements
Data on trees Stand description Stand layers Raster data Stand polygons DEM
Trees Treedesigner Data
representation Terrain Texture
maps
Environmental conditions
Atmospheric effects, sun and light source conditions
Users navigation Users define location Vis
ualis
atio
n ch
arac
teris
tics V
anta
gePo
int
Simulation of management alternatives
Available, with a timeline interface
3.7 VirtualForest
VirtualForest is a development project that integrates the advanced capabilities of scientific visualisation software with production forestry GIS database inventories based on ARC/INFO GIS platform. VirtualForest (VF) integrates sophisticated 3-D visualisation programs with ARC/INFO spatial data management tools. The coupling provides an interactive platform for generating real-time images of the forested landscape with striking realism. Data is transferred from ARC/INFO GRID and vector coverages to the rendering software. Through a separate interface VF provides capabilities for the user to define Landscape Views with separate themes defining the specific visualisation event. Theme types include 3-D DEM surface representation, sun illumination, visual exposure, atmospheric effects, polygon rendering and texture mapping, tree plantings (or renderings), and tree removals (or harvests). The ability to
277
“Sustainable Management and Development of Mountainous and Island Areas”

define different themes allows the user to represent multiple landscape visualisations such as different harvest cut-block design alternatives in forestry. This methodology supports temporal events that can reflect silvicultural treatment and green-up issues.
Virtual Forest is structured as two independent interfaces, the Tree Designer and the Landscape Viewer. The Tree Designer interface supports the creation and editing of 3D tree objects (Fig. 8) The Landscape Viewer is the primary interface for rendering 3D visualisations utilising the 3D objects designed with the Tree Designer.
The Tree Designer interface supports the definition of individual 3D tree symbols to be used at rendering time by the Landscape Viewer.
Figure 8. Tree designer of VirtualForest.
The Landscape Viewer is the interface for creating visualisations. The design of the interface defines temporal events in a chronological timeline. Events represent explicit visualisation actions including definition of a DEM view, sun and light source conditions, atmospheric conditions, sky conditions, vector polygon boundaries, DEM surface texturing, tree stand boundaries, planting (tree rendering), and harvesting (tree removal). Events are dragged into the timeline area to represent a series of chronological actions taking place on the landscape. Specific events are viewed by simply dragging the date action line past the event of interest. Specific parameters are defined for each events using standard properties menus based on the event type.
Events are viewed in an adjoining graphics display window. The orientation of the visualisation view in the graphics window is controlled by a separate menu that allows users
to dynamically rotate and zoom (‘fly’) the DEM surface interactively.
An overview of the visualisation characteristics of VirtualForest is given in Table 7.
Table 7. Visualisation characteristics of VirtualForest.
Visualisation technique
Geometric modelling
Project scale Stand and Landscape
Data requirements Data on trees Polygon geometrics DEM
Trees
Linegraphics Texture mapped objectsTreedesigner (3-d shaded geometric objects)
Datarepresentation
Terrain Texture maps
Environmental conditions
Atmospheric effects, sun and light source conditions, sky conditions
Users navigation Users define location, rotate, zoom (‘fly’)
Vis
ualis
atio
n ch
arac
teris
tics V
irtua
lFor
est
Simulation of management alternatives
Available
The data logic of the software distinguishes between fundamental data components including:
DEM surface (multi-dimensional array grid surface referred to as a DEM) polygon geometrics (typically converted from GIS polygon coverage of forest stands) forest areas (polygon containers for the rendered trees) plantings (rendering or placement of trees)
Three different techniques are supported for tree rendering:
linear markers or sticks - (typically used for very quick displays during design activities) texture mapping (light source shaded bitmaps) full 3-D shaded geometric objects
The primary rendering capabilities supported in the initial development of VirtualForest are:
278
“Sustainable Management and Development of Mountainous and Island Areas”

atmospheric effects; atmospheric effects can be added as events using several different techniques. The primary techniques include sky, haze and fog representation. polygon texture mapping; polygons can be rendered using bitmap based texture mapping. This technique allows the pseudo realistic rendering of roads (harvest roads), cut-blocks (scarified, early treatment, etc), water, and other landscape features. polygon boundary extrusion; using 2D boundary geometry features can be extruded onto the surface as 3D containers (walls). Parameters for the polygon representation such as height of walls, symbology for display of nodes, arcs, and vertices, are user definable.
3.8 EnVision
EnVision is designed to be a full featured rendering system for stand- and landscape-scale images. Applicable projects range from a few to several thousand acres. The system is built upon many of the original concepts used to develop the VantagePoint visualisation system. However, EnVision does not attempt to model changes to the landscape over time.
The basic components of an EnVision project include a digital terrain model to define the ground surface, colour and texture maps to define ground surface characteristics, and groups of objects or "actors". Scene definitions include background imagery used to add clouds and distant landscape features, model components (e.g. terrain model(s) and polygon overlays), viewpoint and camera characteristics, and foreground imagery used to provide high detail in the image foreground. EnVision models individual light sources including a simulated sun position and atmospheric effects such as fog and haze. EnVision renders images using a geometrically correct camera model making it possible to match real photographs taken from known viewpoints to simulated scenes.
An EnVision model includes the following components:
digital elevation model ground texture and colour maps used to describe ground surface characteristics polygon, line, and point data used to locate ground surface textures or object sets
object sets used to represent populations of trees or individual objects such as buildings
In addition to the EnVision model, a scene includes the following components:
background image(s) used to provide elements such as clouds and distant scenery light sources and characteristics camera characteristics and location atmospheric effects such as fog and haze foreground image used to provide foreground detail
The visualisation characteristics of EnVision are presented in Table 8.
Table 8. Visualisation characteristics of EnVision.
3.9 AMAP
AMAP is a software product developed by the Agronomic Department of Montpelier, France (CIRAD). It is designed to incorporate knowledge about the effects of the physiological processes on plant morphology and utilise visualisation in understanding these phenomena. It combines also a landscape simulator to reconstitute environmental changes, represent the effects of improvements and analyse management strategies. The terrain elevation is read in the form of the digital elevation model (DEM) in accordance with GIS information.
3.10 Forest Landscape Simulator (FORSI)
Plustech Oy, which is a Timberjack-affiliate company specialising in advanced long-range product development has developed a simulator that creates realistic working conditions for both
Visualisation technique
Video imaging
Project scale Landscape
Datarequirements
Polygon, line and point data to represent object sets DEM
Trees Digitised photographs Data
representation Terrain Colour and
texture maps Environmental conditions
Atmospheric effects, sun and light source conditions, sky conditions
Users navigation Users define location by camera model
Vis
ualis
atio
n ch
arac
teris
tics E
nVis
ion
Simulation of management alternatives
Available
279
“Sustainable Management and Development of Mountainous and Island Areas”

landscape and machine operating levels. The unit comprises a harvester simulator and a Forest Landscape Simulator (FORSI) [24].
FORSI is a software package that creates a 3-dimensional virtual landscape by applying digital map information and forestry databases. A tool for planning logging operations and creating virtual images of the impact of harvesting on the forest landscape, FORSI can be used to create virtual visual landscapes of a desired forest area. If the user’s GIS system includes growth models, the landscape can be visualised over time, to show the long-term effects of various treatments. FORSI can also be used to compare the effects of alternative harvesting operations. In this way, landscape effects can be determined before harvesting occurs. The FORSI harvester simulator allows users to 'fly' over the harvested site for an aerial view of the operations and their work.
4. Classification of a visualisation system
A review, in the form of a table (ANNEX 1), of all the visualisation systems described is given. Based on these characteristics a comparison on the different visualisation systems is done.
4.1 Comparison of the visualisation systems
According to ANNEX 1, differences between the software visualisation packages exist on:
The level of detail. In geometric modelling techniques the emphasis is given more on numerically accurate but visually symbolic representations of the database[24]. In video imaging the emphasis is given on establishing valid representations of the visual conditions with less ability to demonstrate strong relationships to underlying tree data [36]. Image draping results in better texture and can produce visualisations suitable for depicting landscape-scale vegetation patterns. However, image draping is not effective for representing key viewpoint visualisations, typically required for evaluating harvest block layout. The visualisation systems also differ in the representation of the trees. Trees are represented as texture mapped objects, as full 3D objects or as line graphics. If the intent is to convey the potential impact of proposed management actions, with the goal of informing public review and approval processes, then more realism and detail may be demanded in the visualisation [11].
The presence of additional components such as atmospheric effects, light effects, sky conditions and seasonal effects increase realism.
The project scale of the software package.In most cases, projects require visualisation on different scales. Landscape level visualisations are used to show altered vegetation patterns and visual quality impacts within a valley or watershed. Stand or plot scale visualisations are used to show harvest unit layouts or specific stand treatments. Stand and plot scales tend to be used more for engineering purposes, while landscape level is used for planning [3].
The availability of data. Each visualisation system requires a list of data, which refer to GIS data (stand polygons and tree lists), DEM, topographic data (roads, lakes, houses etc.) and inventory or growth simulator data. Depending on the existence of these data and the format of the data the choice for a visualisation system is realised.
The degree of interactivity and navigation.The user has the possibility to control the viewing conditions, to perceive changes in the forest and to see how the forest will look like after any user-defined period. If for example, the program comprises of a growth simulator the user can foresee the effects of a management plan. The degree of interactivity is related to the user friendliness of the program [16].
5. Conclusions
The conclusions of the present study may be summarised as follows:
Visualisation is becoming a very important tool in forestry. It can be applied to the management of forest resources and support decision management. It provides an efficient tool to communicate with different stakeholders and engage them in decision making and can also be seen as a tool to educate the public.
A number of software visualisation packages are currently available for forest visualisation.
Although the method that is used to develop a forest visualisation system is similar in every software package, differences exist in the modelling technique and characteristics of the software packages. Software packages that achieve a high visual accuracy are a very powerful tool when the goal is to inform the public on proposed management actions. In other packages the emphasis is given more on numerically accurate but visually symbolic representations of the database. If a software
280
“Sustainable Management and Development of Mountainous and Island Areas”

package is needed primarily for engineering purposes stand and plot scales tend to be used, while the landscape level is used primarily for planning. Also the presence of special features such as atmospheric effects, sun and light effects, and seasonal effects increase the visual accuracy of the software. The degree of interaction and the possibility to actually navigate through the forest are even more important characteristics.
However, visualisation software packages can differ in the input data they require and the format of this data. This can lead to problems when data has to be converted and might cause the loss of information. For these reasons, making the different software packages compatible is an important issue. In addition, software packages including tree or forest growth simulators to support forest planning have to be adjusted for each situation, as the site and climatic conditions differ between areas and certainly countries.
GIS-based visualisation goes beyond the simple ability to discuss anticipated outcomes via traditional graphic tools. It offers the opportunity to visualise relationships across time and space, and to explore more comprehensive ranges of possibility. Currently the emphasis for providing that flexibility is on GIS. However, GIS-driven image creation does not currently provide a means of integrating detailed, small-scale visualization with large-scale regional views. The coarse grain of data sources such as digital elevation models and remote sensed imagery make GIS most appropriate for large-scale, synoptic, views of resource issues. It is as yet not so useful for small scale, detailed visualisations.
Having investigated several forest visualisation packages, it can be concluded that visualisation is a very important tool in all areas of forestry. What should be studied further is the actual implementation of such a tool in forest management, research and education.
In addition, the power of visualisation as a communication tool requires a cautious and informed approach, due to the practical limitations and threats to validity, which exist with these techniques. More information is needed on their use, and a better guidance and training for the increasing number of users of visualisation. Criteria and priorities have to be proposed for testing and evaluating visualisation systems.
6. References
[1] Adams, J. 2001. Facilitating the visualization of stand table information. http://filebox.vt.edu/users/jeadams/GeoStand.htm.
[2] Berry, J., Buckley, D.J. and C. Ulbricht. 1998. Visualizing realistic landscapes. GIS World, cover article, August.
[3] Buckley, J., Ulbricht, C. and J. Berry. 1998. The Virtual Forest: advanced 3-D visualization techniques for forest management and research. In Proceedings of the ESRI User Conference, July 27-31, San Diego, CA. http://www.innovativegis.com/products/vforest/contents/vfoverpaper.htm.
[4] CIRAD-AMIS. 2001. Plant modeling (AMAP). France.
[5] Cox, D.J. 1990. The art of scientific visualization. Academic computing 46: 20-56.
[6] Ekstrom, M.P. 1984. Digital image processing. Acedemic Press, San Diego, CA.
[7] Loh, D.K., Holtfrerich, D.R., Choo, Y.K. and Power, J.M. 1992. Techniques for incorporating visualization in environmental assessment: an object-oriented perspective. Landscape and Urban Planning, 21. pp. 305-307.
[8] Malm, W., Kelley, K., Molenar, J. and T. Daniel. 1981. Human perception of visual air quality (uniform haze). Atmospheric Environment 15(10/11): 1875-1890.
[9] McGaughey, R.J. 1997. Visualizing forest stand dynamics using the stand visualization system. In Proceedings of the ACSM/ASPRS/RT Annual Convention, April 7-10, Seattle. pp. 248-257.
[10] McGaughey, R.J. and A.A. Ager. 1996. UTOOLS and UVIEW: analysis and visualization software. In Proceedings of the 6th Biennial USDA Forest Service Remote Sensing Application Conference, April 29-May 3, Denver, CO. Bethesda, MD: American Society of Photogrammetry and Remote Sensing, pp. 319-329.
[11] Orland, B. 1994. SmartForest: a 3-D interactive forest visualization environment. In Proceedings Decision Support 2001-Resource Technology 94.
281
“Sustainable Management and Development of Mountainous and Island Areas”

American Society for Photogrammetry and Remote Sensing, Washington DC. Pp. 181-190.
[12] Orland, B. and J. Uusitalo. 1998. Immersion in a virtual forest-some implications. In Forests and Landscapes: Linking Ecology, Sustainability and Aesthetics, eds. S.R.J Sheppard and H.W. Harshaw. IUFRO Research series, vol. 6. pp. 205-224.
[13] Orland, B., Daniel, T.C., Lynch, A.M. and E.H. Holsten. 1992. Data-driven visual simulation of alternative future for forested landscapes. In Proceedings IUFRO: Integrating Forest Information over Space and Time, Canberra. International Union of Forest Research Organizations, pp. 368-378.
[14] Rautalin, M., Uusitalo, J. and T. Pukkala. 2001. Estimation of tree stand characteristics through computer visualization. Landscape and Urban Planning 53: 85-94.
[15] Rozenfield, A. and A.C. Kak. 1982. Digital picture processing. Academic Press, San Diego, CA.
[16] Sheppard, S.R.J. 2000. Visualization as decision-support tool for managing forest ecosystems. The Compiler 16(1): 25-40.
[17] Unknown Author. 2001a. EnVision: Environmental visualization system. http://forsys.cfr.washington.edu/envision.html.
[18] Unknown Author. 2001b. Forest Stand Data Visualization with POVRAY and VRML.http://www.silvafor.org/povray/povray.htm.
[19] Unknown Author. 2001c. SVS: Stand visualization system. http://forsys.cfr.washington.edu/svs.html
[20] Unknown Author. 2001d. Syllabus Flora.http://www.bio.una.nl/procedure/CORE/00/08/CIC.HTML.
[21] Unknown Author. 2001e. UTOOLS: Landscape analysis software. http://forsys.cfr.washington.edu/utools_uview.html.
[22] Unknown Author. 2001f. Virtual forest. http://www.innovativegis.com/products/vforest/index.html.
[23] Unknown Author. 2001g. Visualization tools.http://bamboo.mluri.sari.ac.uk/ccw/task-three/vtools.html.
[24] Uusitalo, J. and B. Orland. 2001. Virtual forest management: possibilities and challenges. International Journal of Forest Engineering, 7-16.
[25] Uusitalo, J. and V.P. Kivinen. 1998. Implementing SmartForest forest visualization tool on PC environment. In Proceedings of the Resource Technology Nordic Conference, June 8-12, Rovaniemi, Finland. The Finnish Forest Research Institute Research Papers. http://www.metla.fi/event/rt98/abs/Uus-Kiv.htm.
[26] Uusitalo, J., Orland, B. and K. Liu. 1997a. A forest visualization interface for harvest planning. In Proceedings of the ACSM/ASPRS/RT Annual Convention, April 7-10, Seattle. pp. 204-215.
282
“Sustainable Management and Development of Mountainous and Island Areas”

ANNEX 1
Visualisation Systems Characteristics
MONSU Smart Forest SVS Utools/
Uview LMS VantagePoint
Virtual Forest EnVision AMAP FORSI
Modelling Technique IM,GM GM GM GM GM VI GM VI GM VI
Project scale Stand & Landscape
Stand & Landscape
Plot & stand
Stand & Landscape
Stand & Landscape Landscape Stand &
Landscape Landscape All scales Landscape
Trees Linegraphics
Texturemapped objects
Tree designer
Line graphics
Tree desig ner
Tree designer
Tree designer
Digitised photo-graphs
Tree designer
Digitised photo-graphs Data
Terrain Colour maps
2D Ground maps
Colour maps
Colour maps
Colour maps
Texturemaps
Texturemaps
Colour and texture maps
Texturemaps
Texturemaps
Environmental conditions
Atmo- spheric effects, seasonal
effect
- - - -
Atmo- spheric
effects, sun and light source
conditions
Atmo- spheric
effects, sun and light source
conditions,sky
conditions
!
.
Atmo- spheric
effects, sun and light source
conditions, sky
conditions
-
Users navigation
Users define
location,rotate,
zoom ('fly')
Users define
locationwalk
between the trees
-
Users define
location,fly over
and around a low
resolution image
Users define
location fly over and around a
low resolu-tion image
Users define
location
Users define
location,rotate,
zoom ('fly')
Users define
location,rotate, zoom
-
Users zoom ('fly) over the forest
area
Simulation of management alter-natives
Available Available - Available Available Available Available Available - Available
Note: GM: Geometric modelling, IM: Image draping, VI: Video image
283
“Sustainable Management and Development of Mountainous and Island Areas”

Wastewaters and Indicators of Microbiological Quality
Mandilara D. Georgia1*, Smeti M. Eleni2, Mavridou Th. Athena3, Lambiri P. Maria1,Vatopoulos C. Alkiviadis1, Rigas P.Fotis4
1National School of Public Health – Department of Microbiology, Athens, Greece 2 Water Supply and Sewerage Company of Athens, Athens, Greece
3 Technological Educational Institution of Athens – Department of Medical Laboratories, Athens, Greece
4 National Technical University of Athens – School of Chemical Engineering, Athens, Greece
Abstract The use of bacteriophages as potential indicators of faecal pollution has recently been studied. The correlation of the number of bacterial indicators and the presence of three groups of bacteriophages, namely somatic coliphages, F-RNA specific phages and phages of Bacteroides fragilis, in raw and treated wastewater is presented in this study. Raw and treated wastewater from two wastewater treatment plants in Athens were collected, and analysed for total coliforms, Escherichia coli, intestinal enterococci and the three groups of bacteriophages. A clear correlation between the number of bacterial indicators and the presence of bacteriophages was observed. SOMCPH may be used as additional indicators, because of their high densities and their resistance to various treatment steps.
Key words: bacteriophages, bacterial indicators, wastewater
1. Introduction
Lack of clean water, and limited water resources in dry regions, is observed worldwide. Consequently, the reuse of treated wastewater for various activities, mainly in agriculture and aquaculture, is a rapidly developing field of increased significance [28].
Sewage facilities reduce pathogen load, leading to decrease in public health risks associated with exposure. Validation of the treatment processes and assurance of the microbiological quality of the effluent is not easy to perform, since methods for isolation and identification of pathogens are complicated, expensive and time-consuming. Surrogate indicators (faecal coliforms, Escherichia coli,intestinal enterococci) are used for routine
evaluation of treatment plant performance and effluent quality.
Internationally, there are no standards regulating the production and microbiological quality of reclaimed water, although WHO has developed guidelines for the use of reclaimed water, recommending monitoring of faecal coliforms and intestinal nematodes.
Various microorganisms exhibit different extents of inactivation after treatment processes, and the bacterial indicators do not follow the same die-off kinetics as viruses, parasitic protozoa and helminths [25]. Therefore, bacteriological standards do not adequately protect against virus-associated health risks. Somatic coliphages, F-RNA specific bacteriophages and phages infecting Bacteroides fragilis have been studied as potential indicators of water quality and/or virus content, additional to bacterial indicators [9]. These groups of bacteriophages, found also in wastewaters, can infect bacteria of the normal flora of the human gastrointestinal tract. The methods for their detection and enumeration are simple, rapid, inexpensive and require no confirmation. An important drawback for the use of somatic coliphages as indicators is that some of them may multiply in water environments [6,3]. However, according to recent studies [21,22] only 3% of the environmental non-faecal host-bacteria can support the multiplication of somatic coliphages, and the conditions that support their multiplication are rarely found in water environments. There is no indication that F-specific bacteriophages and phages infecting B. fragilis can multiply in the environment [27,4].
In previous studies [17,18] correlations between bacterial indicators and bacteriophages were reported and threshold values for the presence of bacteriophages in sewage were
284
“Sustainable Management and Development of Mountainous and Island Areas”

determined. The aim of the present research was to study the type and grade of this correlation in raw / treated wastewater, and evaluate the use of bacteriophages as supplementary indicators to current bacterial indicators.
2. Materials and Methods
2.1 Facilities.
Samples were collected from two sewage treatment plants. Plant (A) is the main sewage treatment plant of Athens with a capacity of 750,000 m3/d and handles the sewage of the city. It includes, a pre-treatment stage, (sand and oil removal), and primary settling. The primary sludge undergoes anaerobic mesophilic digestion for stabilization (30-35ºC for approximately 28 days). Plant (B) treats part of the urban sewage and all the septages of the city of Athens. Its capacity is 24,000 m3/d for the septages and 20,000 m3/d for the urban sewage. This plant includes, a pre-treatment stage, (sand and oil removal), separate primary settling for the urban sewage and septages, biological treatment and secondary settling (secondary treatment) and chlorination. Effectiveness of chlorination is questionable, since the mean concentration of residual chlorine was 0.3 ppm. Primary and secondary sludge is stabilized with the mesophilic anaerobic digestion method (30-35ºCfor approximately 28 days).
2.2 Sampling.
Samples were collected monthly, over a 2-year period (from November 2000 to September 2002), from each of the following treatment units: raw wastewater after the pretreatment unit at plant A (influent A), outlet of the primary settling (effluent A), raw urban wastewater after the pretreatment unit at plant B (influent B1), raw septages at plant B (influent B2), outlets of the primary settlings (of the urban wastewater, and of the septages), inlet of the biological treatment unit and outlets of the biological treatment unit, secondary settling and chlorination. The sampling and the transport of the samples to the laboratory were carried out according to international standards [10,11].
2.3 Sewage samples.
Sewage samples were homogenized by stomacher for 2 minutes. The samples with heavy faecal pollution (raw wastewater, the outlet of the primary settlings and the biological treatment) were previously suspended in peptone saline at a ratio of 1:10. The enumeration of the indicator bacteria was made using the membrane filtration method [2].
Fungi and bacteria were removed from the samples by filtration through 0.22- m-pore-size membranes. The decontaminated samples were the filtrates.
2.4 Bacteriophage analysis.
E.coli WG5 (nalidixic acid resistant) was used for the quantification of somatic coliphages, and B.fragilis RYC2056 for the phages of Bacteroides fragilis. Bacteriophages plaquing on the host Salmonella typhimuriumWG 49 were counted as F-total bacteriophages and the difference between the total and the number of plaques counted on plates with 40 gof RNase / ml into the assay medium was attributed to F-specific RNA bacteriophages. All phages were quantified by the double-agar-layer method in line with standard procedures [12,13,14]. Five replicate volume of 2 ml were plated, except in the case of disinfected effluent samples, for which 10 replicates of 2 ml each were plated. Pfus/100ml were calculated after 18h incubation. Detection limits for bacteriophages were 10 pfus/100 ml in wastewater.
2.5 Quality assurance.
A first-line quality control was performed using reference materials, for both bacteria and bacteriophages. Reference materials (lenticules) of E.coli and intestinal enterococci, provided by HPA, were used. Pure cultures of bacteriophages
X174, MS2 and B56-1, were prepared [20] and used as reference materials for the SOMCPH, FRNAPH and BFRPH, respectively.
2.6 Statistical analysis.
Statistical analyses were conducted using SPSS version 11.0. Log10 transformed values were used for all computations and tests. Differences were considered significant at
285
“Sustainable Management and Development of Mountainous and Island Areas”

p<0.05, as determined by the appropriate comparative test [1]. Non parametric statistical tests were utilized for non normally distributed data. Parametric tests were used for analysis of variance. The Spearman rank correlation was used to test the relationship between bacterial indicators and bacteriophages. A binary logistic regression model (SPSS 13.0) was utilized to determine whether indicator organism concentrations predicted the probability of the occurrence of bacteriophages in wastewater samples. The dependent variable (bacteriophages) was treated as a binary variable; that is score of 0 was assigned when bacteriophage was not detected and a score of 1 was assigned when bacteriophage was detected. The independent variables were continuous, and values for samples in which organisms were not detected were reported as 0.
3. Results & Discussion
3.1 Microbial concentrations and treatment process.
Concentrations of bacterial indicators and bacteriophages before and after treatments are shown in Figure 1 in a box plot format. Total coliform (TC) concentrations were the highest of the microbial measurements in influent samples (>107 cfus /100ml), followed by E.coli and intestinal enterococci (~106 cfus/100ml). Among the three groups of bacteriophages SOMCPH were the most abundant (~105 pfus/100ml). Concentrations of FRNAPH ranged between 103-105 pfus/100ml. BFRPH presented the lowest concentrations (103-104 pfus/100ml).
E. coli and, enterococci counts are usually more or less similar. Among the three groups of bacteriophages, SOMCPH are the most abundant, and BFRPH present the lowest concentrations [24,25]. Our results are in agreement with these data.
In Table 1 the average Log10 reduction of the various indicators after every treatment step is presented. After primary sedimentation, changes in concentrations of all microbiological parameters were not statistically significant. However, after secondary treatment (biological treatment and secondary sedimentation) a 1.54-3.15 Log10 reduction of all parameters was observed. Chlorination (0.3 ppm Cl-) of treated effluents, caused a statistically significant reduction of total coliforms and E.coli (p<0.05),
but had no effect on enterococci, SOMCPH and FRNAPH (p>0.05), as they are more resistant. BFRPH were not detectable in chlorinated sewage. Our results are comparable to previous studies. It has been reported that biological wastewater treatment processes have similar removal efficiency for viruses, bacteriophages and faecal bacteria. Chemical disinfectants, such as chlorine, inactivate faecal bacteria and have little or no effect on viruses and bacteriophages. Among bacterial indicators, enterococci present greater resistance to chlorination [7,8,23,26,19].
Percentages of pooled samples from each treatment step, containing detectable levels of microorganisms are summarized in Table 2. All microorganisms were detected in 100% of influent wastewater samples. Total coliforms, E.coli and enterococci were detected in 100% of effluent after secondary treatment and chlorination of wastewater. SOMCPH were detected in all samples after secondary treatment, and in 95% of samples after chlorination. FRNAPH were detected in 85% of samples after secondary treatment and in 70 % of samples after chlorination. BFRPH were detected in 15% and 10% of samples after secondary treatment and chlorination, respectively.
Among the three groups of bacteriophages, SOMCPH presented always the highest concentrations and were detected even after chlorination (>2.8x10³ pfus/100ml). Among all microorganisms, FRNAPH and BFRPH presented the lowest reduction after secondary treatment step, and BFRPH being almost non-detectable after this treatment step. Therefore, BFRPH cannot be used to evaluate the performance of chlorination.
3.2 Predictive relationships between microorganisms.
Data from wastewater were analyzed as a pooled data set (both plants and all treatment steps) to determine correlations between bacteria indicators and bacteriophages. Significant correlations between concentrations of any combination of bacterial indicators and bacteriophages were observed. Table 3 present Spearman correlation coefficients in wastewater. Spearman coefficients between any bacterial indicators and bacteriophages were rS>0.6 in wastewater samples. Spearman correlation
286
“Sustainable Management and Development of Mountainous and Island Areas”

coefficient rS >0.6 reveals a strong relationship between the two variables.
Logistic regression analysis was used to test the hypothesis that bacterial indicators were predictive of the presence or absence of bacteriophages in wastewater samples. Bacteriophages counts were converted to binary data, and the relationship between the concentration of each bacterial indicator and the presence or absence of each group of bacteriophages were assessed. Nagelkerke’s R-square, ranges from 0.0 to 1.0, and denotes the strength of the association; strong associations have values closer to 1.0. Two bacterial indicator-bacteriophage combinations displayed the strongest correlations: total coliforms concentration and presence/absence of FRNAPH (R-square=0.710) and E.coli concentrations and presence/absence of BFRPH (R-square=0.73).
When effluents are used for agricultural purposes, pathogens may infect crops and underground waters. Monitoring the microbiological quality of treatment products is crucial for the protection of public health. Bacteriophages can be very useful as model organisms for monitoring the effectiveness of a treatment process and the microbiological quality of the product. Moreover, they can be used as model/surrogates for enteric viruses since they closely meet key requirements for this function [16,5].
According to our observations, bacteriophages are significantly correlated to bacterial indicators, and hence to faecal pollution. Considering the fact that bacteriophages present higher resistance to all treatment steps than bacterial indicators, phages seem to be a useful tool for evaluating the effect of treatment on wastewater for a wide range of microorganisms. Somatic coliphages seem to be the best indicators of microbiological quality and treatment performance, since they are always found in detectable concentrations in wastewater (even after chlorination step) and the method for their detection is simple and rapid. Somatic coliphages can greatly help assessment of the validity of predictive models of quality of treated wastewater.
4. Acknowledgments
We thank the Head and Staff of the Sewage Treatment Plants of Athens (Psittalia and Metamorphosis) for their support in this study.
Special thanks go to Mrs S. Panagouli for her assistance throughout this study.
287
“Sustainable Management and Development of Mountainous and Island Areas”

5. References [1] Anon. (2001). Statistic program SPSS for
Windows, Version 11.00.263. [2} Berg, G. and Berman, D. (1989)
Destruction by anaerobic mesophilic and thermophilic digestion of viruses and indicators bacteria indigenous to domestic sludges. Appl. Environ. Microbiol., 39,361-368
[3] Borrego, JJ., Cornax, R., Morinigo, MA., Martinez-Manzares, E., Romero, P. (1990) Coliphages as an indicator of faecal pollution in water. Their survival and productive infectivity in natural aquatic environment. Water Res., 24, 111-116
[4] Contreras - Coll, N., Lucena, F., Mooijman, K., Havelaar, A., Pierzo, V., Boque, M., Gawler, A., Holler, C., Lambiri, M., Mirolo, G., Moreno, B., Niemi, M., Sommer, R., Valentin, B., Wiedenmann, A., Young, V., Jofre, J. (2002) Occurrence and levels of indicator bacteriophages in bathing waters throughout Europe. Water Res.,36, 4963-4974
[5] Grabow, WOK. (1986) Indicators systems assessment of the virological safety of treated drinking water. Water Sci. Technol.,18, 159-165
[6] Grabow, WOK., Coupbrough, P., Nupen, EM., Bateman, BW. (1984) Evaluation of coliphages as indicators of the virological quality of sewage polluted water. WaterSA., 10, 7-14
[7] Havelaar AH, Nieuwstad TJ. (1985). Bacteriophages and faecal bacteria as indicators of chlorination efficiency of biologically treated wastewater. J. Water Poll. Control Fed. 57:1084-1088
[8] Havelaar AH. (1987). Bacteriophages as model organisms in water treatment. Microbiol. Sci. 12:362-364
[9] IAWPRC Study Group on Health Related Water Microbiology (1991). Bacteriophages as model viruses in water quality control. Water Res., 25, 529-545
[10] ISO 5667 –2 (1982) Water Quality – Sampling. Part 2: Guidance on sampling techniques.
[11] ISO 5667 –3 (1985) Water Quality – Sampling. Part 3: Guidance on the preservation and handling of samples
[12] ISO/CD 10705-1 (1997) Water Quality- Detection and Enumeration of Bacteriophages, Part 2: Enumeration of F-Specific Bacteriophages
[13] ISO/CD 10705-2 (1997) Water Quality- Detection and Enumeration of Bacteriophages, Part 2: Enumeration of Somatic Coliphages
[14] ISO/CD 10705-4 (1999) Water Quality- Detection and Enumeration of Bacteriophages, Part 4: Enumeration of Bacteriophages Infecting Bacteroides fragilis
[15] Jofre, J., Lucena, F., Mooijman, K., Pierzo, V., Araujo, R., Bahar, M., Demarquilly, C., Havelaar, A. (2000) BCR Information. Bacteriophages in bathing water, a feasibility study on the development of a method based on bacteriophages for the determination of microbiological quality of bathing waters. Publication EUR-19506-EN2000. Office for Official Publications of the European Communities, European Commission, Luxembourg.
[16] Kott Y. (1981) Viruses and bacteriophages. Sci Total Environ.,18,13-23
[17] Mandilara DG., Mavridou A., Lambiri M., Vatopoulos A., Rigas F. (2005) Microbiological quality monitoring of the effluent of a wastewater treatment plant by use of bacteriophages, IASME (International Association of Mechanical Engineering) Transactions,4(2) 651-661
[18] Mandilara DG., Mavridou A., Lambiri M., Vatopoulos A., Rigas F. (2006) The use of bacteriophages for monitoring the microbiological quality of sewage sludge. Environmental Technology, 27,367-375
[19] Mara D, Cairncross SS. (1989). Guidelines for the use of wastewater and excreta in agriculture and aquaculture. Measures for public health protection. WHO, Geneva,187 p.
[20] Mooijman KA, Bahar M, Havelaar AH. (1999) Preparation and use of reference materials containing bacteriophages. Bilthoven, The Netherlands: National
288
“Sustainable Management and Development of Mountainous and Island Areas”

Institute of Public Health and the Environment (RIVM). Report No. 285690 005, p. 43
[21] Muniesa, M., Jofre, J. (2004) Factors influencing the replication of somatic coliphages in the water environment. Antonie van Leeuwenhoek,.85, 65-76
[22] Muniesa, M., Mice-Llivina, L., Katayama, H., Jofre, J. (2003) Bacterial host strains that support replication of somatic coliphages. Antonie van Leeuwenhoek, 83, 305-315
[23] Nieuwstad ThJ, Mulder EP, Havelaar AH, Olphen M. (1988). Elimination of microorganisms from wastewater by tertiary precipitation followed by filtration. Water Res. 22:1389-1397
[24] Scheuerman, PR., Farrah, SR., Bitton, G., (1991) Laboratory studies of virus survival during aerobic and anaerobic digestion of sewage sludge. Water Res.,
[25] Stenström, TA. (2002) Reduction efficiency of index pathogens in dry sanitation compared with traditional and alternative wastewater treatment systems. Eco. San. Res.
[26] Tartera C, Bosch A, Jofre J. (1988). The inactivation of bacteriophages infecting Bacteroides fragilis by chlorine treatment and UV irradiation. FEMS Microbiol. Letters 56:313-316
[27] Tartera, C., Araujo, T., Michel, T., Jofre, J. (1992) Culture and decontaminating methods affecting enumeration of phages infecting Bacteroides fragilis in sewage. Appl. Environ Microbiol., 58,2670-2673
[28] WHO Report (1989) Health Guidelines for the Use of Wastewater in Agriculture and Aquaculture. (Technical report Series 778)
289
“Sustainable Management and Development of Mountainous and Island Areas”
Table 1: Average Log 10 reduction of microorganism concentrations after each treatment
step.
* Data from primary settlings, pooled from Plants A & B
Table 2: Percentage of pooled samples with detectable indicator organisms and phages.
% of samples with detectable indicators and phagesIndicators
Influent wastewater
(N=60)*
Effluent of secondary treatment
(N=20)
Effluent of chlorination
(N=20)Total coliforms 100 100 100
E.coli 100 100 100
Enterococci 100 100 100
SOMCPH 100 100 95
FRNAPH 100 85 70
BFRPH 100 15 10 * Data from influents and primary settlings, pooled from Plants A & B
Table 3: Spearman correlation coefficients between microbiological parameters in raw and treated wastewater samples (correlation is significant at the 0.05 level)
Total coliforms
E.coli Enterococci SOMCPH FRNAPH BFRPH
Total coliforms 0.806 0.639 0.663 0.627 0.702 E.coli 0.806 0.645 0.696 0.635 0.758 Enterococci 0.639 0.645 0.558 0.685 0.597 SOMCPH 0.663 0.696 0.558 0.543 0.726 FRNAPH 0.627 0.635 0.685 0.543 0.683 BFRPH 0.702 0.758 0.597 0.726 0.683
Primary settling*
(N=60)*
Secondary treatment
(N=20)
Chlorination
(N=20) Average Log10 reduction
Total coliforms 0.29 3.15 0.52 E.coli 0.09 2.55 0.29 Intestinal enterococci 0.18 2.15 -0.06 SOMCPH 0.04 2.17 -0.20 FRNAPH 0.02 1.54 0.07 BFRPH 0.05 1.57 -0.30
290
“Sustainable Management and Development of Mountainous and Island Areas”

Figure 1. Mean microorganism concentrations in: (a) raw wastewater (pooled data, Plant A & B, N=60), (b) wastewater after primary settling (pooled data, Plant A & B, N=60), (c) wastewater before (N=20) ,and (d) after secondary treatment (N=20), (e) chlorinated effluent (N=20), Log10 concentrations of bacterial indicators (cfus/100ml or cfus/g) and bacteriophages (pfus/100ml or pfus/g). Boxes represent 50% of the data, the vertical lines represent the mean, lines extending from the boxes represent the 95% confidence limits.
1086420 1086420 1086420
7654321 654321
TC
EC
IE
SOMCPH
FRNAPH
BFRPH
TC
EC
IE
SOMCPH
FRNAPH
BFRPH
TC
EC
IE
SOMCPH
FRNAPH
BFRPH
Microorganisms / 100ml
a
e
b c
d
291
“Sustainable Management and Development of Mountainous and Island Areas”

Designing a sustainable society: An Application of the Richard E. Gross Problem-Solving Model
Evangelos I. Manolas Assistant Professor
Department of Forestry and Management of the Environment and Natural Resources, Democritus University of Thrace,
193 Pantazidou Street, 68200 Orestiada, Greece.
E-mail: [email protected]
Abstract. Problem-based learning is an educational approach in which students work together to find a solution to a “real world” problem. The problem serves as a stimulus and framework for learning which is different from the traditional teaching practices, mainly lectures, where knowledge is transmitted through the instructor. In their efforts to solve the problem students develop skills in collecting, evaluating, and synthesizing resources. Above all problem-based learning helps students become self-directed learners. This paper discusses the classroom use of a problem-based instructional model known as the Richard E. Gross Problem-Solving Model. Following presentation of the steps of the model, the paper attempts to apply the model to the problem of designing a sustainable society.
Keywords. Problem-based learning, cooperation, sustainable society
1. Introduction
Traditional instruction, such as the typical lecture-based session, often involves delivering as much information as possible as quickly as possible. The lecture method is one of the most effective and efficient ways to disseminate information and has often been used for this end. However, this type of instruction has often allowed students to be passive in the classroom. Students, not knowing how to be active participants in the lecture, have relied on transcription, memorization, and repetition for learning [14].
In recent decades, however, we have learned a great deal from cognitive science research about the nature of learning. Students
construct knowledge; they do not take it in as it is disseminated, but rather they build on knowledge they have gained previously [7]. They benefit from working together, and they may learn best from teaching each other [1], [13]. Research also suggests that students learn best in the context of a compelling problem [9]; they learn through experience [8]. In short, students learn through making cognitive connections, social connections, and experiential connections [8]. Because they make these connections differently, students do not learn in the same way. This relatively new information suggests that teaching is a complex activity, and it necessitates the emergence and development of approaches to instruction that are consistent with what we know about the way that learning happens [9]. This new understanding has given rise to the notion of a paradigm shift in education, one from a focus on teaching to a focus on learning [3]. New "powerful pedagogies" emphasizing learning, such as project-based learning, inquiry-based learning, case-based learning, research-based learning, situation-based learning, action learning, and problem-based learning intimate that alternative pedagogies may be gaining in prominence and may ultimately become the dominant classroom paradigm.
Problem-based learning is an educational approach in which complex problems serve as the context and the stimulus for learning. In problem-based learning classes, students work together to solve one or more complex and compelling "real world" problems. In their efforts to find a solution to a multi-faceted problem they develop skills in collecting, evaluating, and synthesizing resources [12].
Because the amount of direct instruction is reduced in problem based learning, students
292
“Sustainable Management and Development of Mountainous and Island Areas”

assume greater responsibility for their own learning [4]. The instructor's role becomes one of subject matter expert, resource guide, and task group consultant. This arrangement promotes group processing of information rather than an imparting of information by faculty [17]. The instructor's role is to encourage student participation, provide appropriate information to keep students on track, avoid negative feedback, and assume the role of fellow learner [2].
This paper discusses the classroom use of a problem based instructional model known as the Problem-Solving Model, designed by Richard E. Gross, Stanford University [10]. Following a presentation of the steps of the model, the paper attempts to apply Gross’s ideas to the issue of how a sustainable society would look like.
2. The Richard E. Gross Problem-Solving Model
Gross’s Problem-Solving Model includes six steps that the teacher and the students go through in order to study, examine, analyze, and attempt to resolve the issue [10], [5]. It should be noted that each step merges into the next, and that the lesson usually flows naturally from one procedure into another.
Steps in the Richard Gross Problem-Solving Model
Step 1. Defines the problem, taking account of societal values
Step 2. Lists the various feasible courses of action
Step 3. Collects and interprets pertinent data
Step 4. Reaches a tentative decision based on the data
Step 5. Acts in accordance with the decision
Step 6. Evaluates the results and modifies future action accordingly
Step 1: Define the problem, taking account of societal values. The first step to the problems approach is for the teacher to decide on the problem to be presented to the class. The
teacher has to consider several questions to determine whether the problem will be appropriate. For example he / she must determine if it is of concern to the students and if it is important enough for the class to study it in depth. The teacher or a student then presents the problem to the class. The students are then encouraged to answer questions such as how solving the problem will help them, how the problem might affect their lives or what the basic elements of the problem are. The answers of the students are recorded on the chalkboard.
Step 2: List the various feasible courses of action. The second step in this approach is to discuss possible courses of action that might solve the problem. Some questions may be useful in guiding the discussion.
Step 3: Collect and interpret pertinent data. The third step of the Problems-Solving Approach Model is to collect data. The teacher and students figure out what kinds of information might be needed so that they can find an appropriate solution to the problem. The class determines what information they already have and what they need in addition. This data can be obtained through several methods, including reading, experimentation, interviews and surveys, role play, and student discussion.
After the data are collected, the students must interpret the information to see which is most pertinent for selecting the best course of action. They must make sure that the material is meaningful as well as understandable.
Step 4: Reach a tentative decision based on the data. The fourth step includes the class reaching a tentative decision based on the data. In this process the class determines whether or not they are biased in their decisions and what the consequences of the possible courses of action might be. They also discuss which actions are the most feasible for them to perform in their situation and which are of lesser importance. After these questions are considered, the class is left with only a few courses of action. They must now understand their reasons as they choose among the remaining options. They decide for each option if the action will provide a good solution or if it will create other problems. The class looks for inconsistencies between the evidence and the conclusion and
293
“Sustainable Management and Development of Mountainous and Island Areas”

then arrives at a group decision which may involve a compromise. This may be accomplished by having smaller groups reach a decision and present their reasoning to the class.
Step 5: Act in accordance with the decision. The fifth step is the action part of the Problems-Solving Approach Model. The action program might involve using community surveys or interviews, doing a play, writing letters to political figures, or designing a video.
Step 6: Evaluate the results and modify future action accordingly. During this final step of the Problems-Solving Approach Model the students evaluate what they have accomplished, what they have learned, and how they might apply these learnings in their life.
3. Using the Richard E. Gross Problem-solving Model in the Classroom
The following is an example of how the Gross Problem-Solving Approach Model can be used in the classroom.
Step 1: Define the problem, taking account of societal values. The problem chosen and written on the board is the following: What would a sustainable society look like? Develop a view of how a sustainable society would look like and how we could get there. Avoid easy techno-panacea solutions such as “a new invention will replace all fossil fuel needs with no pollution”: Assume that only existing technology will be available, and be realistic about the capabilities of solar and other renewable resources. Take seriously the point that you must make hard choices [16].
Following announcement of the problem the following question is put to the students: Why should we engage in such an activity? The discussion of such a question should establish the rationale for such an activity and settle the audience. After a few answers the class moves to the next stage.
Step 2: Lists the various feasible courses of action. In this step, students in their classroom brainstorm ideas and approaches to solving the problem in their own classroom. They focus on a series of questions [16], [11]:
1. Values: What values should characterize the new society? What sanctions should accompany these values?
2. Energy needs: How will your society’s energy needs be met sustainably? What industrial products should stop being used?
3. Economic structure: What will be the main industries in your society? Will your society simply export “dirty industries” to poorer countries? Can the world then still be called sustainable? How will agriculture’s use of petrochemicals in fuel, fertilizers and pesticides be eliminated?
4. Urban Structure: How will housing be laid out (consider suburbanization is probably unsustainable due to transport costs)? How will transport be organized? How will you reshape the cities: will people be forced to move?
5. Class structure: Will equity be a goal / possible? What about with other countries? How will decisions be made concerning who pays the price for and who benefits from the transition to sustainability? How will you deal with those workers who lose their jobs?
6. Democratic Institutions: How will decisions for reaching sustainability be made? What will you do with dissenting voices: those who do not wish to give up their unsustainable lifestyles? Will your country submit to global governance for sustainability (World Federation)?
All ideas the students come up with are listed on the board so that all can see and evaluate them. The teacher may add ideas which he / she considers important but were omitted by the students. The students are also primed for the next stage.
Step 3: Collect and interpret pertinent data. In this step, students determine what they already knew and what additional information they need to find a solution. The teacher places the students in small groups with each group covering each of the six areas described in step 2. When the formation of the six groups is completed the teacher assigns each group various activities with the aim of gathering additional information. The activities that
294
“Sustainable Management and Development of Mountainous and Island Areas”

students in each group could do include interviews with parents, older people or other teachers; surveys; specialists; and articles they can read about their assigned task. An effective way for the students to keep track of the information they collect is to keep a research log or journal in which they write down what they find as well as theirs or other peoples’ comments on the information gathered.
Step 4: Reach a tentative decision based on the data. In this step the groups are reformed so that each group has an expert in each of the six areas described in step 2. Each of these new groups should now produce its vision of what a sustainable society would look like. An outline of the societies which will be designed by these groups should be presented to the class. The class then discusses the different visions, eliminating ideas that might not work or that would be too difficult to accomplish. The basic elements of the new society as they emerge from the discussion are written on the board.
Step 5: Act in accordance with the decision. In this step the students should determine how to carry out the decision they made in step 4. One idea is for the class to produce a poster to be posted in the school’s notice boards. The poster could also be published in student magazines, the internet or / and sent to other schools.
Step 6: Evaluate the results and modify future action accordingly. The period after a problem has been solved has been identified by Polya [15] as a key moment in time when significant learning can take place. The type of activities that students should be encouraged to undertake to promote learning from problem solving are [18]:
Extending processes – Review the process that was used to solve the problem. How could the problem have been solved another way? Extending solutions – What will happen to the solution if an important parameter is made a little bigger or a little smaller? Stating a new problem – Can you think of another problem that could be solved in a similar way? Self-reflection – What did you learn from solving this problem? How have your minds been changed? How would you act
in the future based on the new knowledge you have acquired?
4. Conclusion
Problem-based learning may promote students’ empowerment for learning to a greater extent than do conventional teaching methods such as lectures. It emphasizes critical thinking skills, understanding, and working cooperatively with others. Above all it encourages students to take charge of their education. This paper discussed the classroom use of a problem-based instructional model known as the Richard E. Gross Problem-Solving Model. Following presentation of the steps of the model, the paper attempted to apply the model to the problem of designing a sustainable society. The example based on the Gross model as analyzed in this paper may be used for several subjects, grade levels or course structures.
5. References
[1] Annis LF. The process and effects of peer tutoring. Human Learning 1983; 2: 39-47.
[2] Aspy DN, Aspy CB, Quimby PM. What doctors can teach teachers about problem-based learning. Educational Leadership 1993; 50 (7): 22-24.
[3] Barr R, Tagg J. From teaching to learning: A new paradigm for undergraduate education. Change 1995; 27 (6): 12-25.
[4] Bridges EM, Hallinger P. Problem-based learning in medical and managerial education. Paper presented for the Cognition and School Leadership Conference of the National Center for Educational Leadership and the Ontario Institute for Studies in Education. Nashville, TN; September 1991.
[5] Chilcoat GW, Ligon JA. Issues-centered instruction in the social studies classroom: The Richard E. Gross problem-solving approach model. Social Studies Review 2004; 44: 40-46.
[6] Chorneyko DM, Christmas RJ, Cosk S, Dibbs SE, Hamielek CM, MacLeod LK, Moore RF, Norman SL, Stoankovich RJ, Tyne SC, Wong LK, Woods DR. What is problem solving? Chemical Engineering Education Summer 1979: 132-137.
295
“Sustainable Management and Development of Mountainous and Island Areas”

[7] Cross KP. Opening windows on learning: The cross papers number 2. Mission Viejo, CA: League for Innovation in the Community College and Educational Testing Service; 1998.
[8] Cross KP. Learning is about making connections: The cross papers number 3. Mission Viejo, CA: League for Innovation in the Community College and Educational Testing Service; 1999.
[9] Ewell PT. Organizing for learning: A new imperative. AAHE Bulletin 1997; 50 (4): 3-6.
[10] Gross RE. The problems approach. In: Gross Re, Zeleny LD, Editors. Educating Citizens for Democracy: Curriculum and Instruction in Secondary Social Studies. New York: Oxford University Press; 1958. pp.341-367.
[11] Manolas EI. The Teaching and Learning of Sociological Theory on the Natural Environment. Athens: Tipothito; 2001.
[12] Mayo P, Donnely MB, Nash PP, Schwartz. Student perceptions of tutor effectiveness in problem based surgery clerkship. Teaching and Learning in Medicine 1993; 5 (4): 227-233.
[13] McKeachie WJ, Pintrich PR, Lin YG, Smith DAF. Teaching and Learning in the College Classroom: A Review of the Research Literature. Ann Arbor: University of Michigan, National Center for Research to Improve Postsecondary Teaching and Learning; 1986.
[14] Musinski B. The educator as facilitator: A new kind of leadership. Nursing Forum 1999; 34 (1): 23-29.
[15] Polya G. How to Solve It. Second Edition. Princeton University Press; 1957.
[16] Timmons Roberts J. Classroom Simulations of Environmental Conflicts; 1996.Available:http://www.centerforpoliticalecology.org/resources/robertsclasssim.html
[17] Vernon DT, Blake RL. Does problem-based learning work? A meta-analysis of evaluative research. Academic Medicine 1993; 68 (7): 550-563.
[18] Wilson JA, Fernandez ML, Hadaway N. Mathematical Problem Solving. Available http://jwilson.coe.uga.edu/emt725/PSsyn/PSsyn.html
296
“Sustainable Management and Development of Mountainous and Island Areas”

Estimation of Cyclades islands water balance and the problem of sustainable water utilization
Marinos D.1, Maris F.2
1 Phd , Torrentialist & Environmentalist, Democritus University of Thrace, Department of Forestry & Management of the Environment & Natural Resources, 193 Padazidou str. Gr-68200 Orestiada,
Hellas, [email protected] Lecturer, Democritus University of Thrace, Department of Forestry & Management of the
Environment & Natural Resources, 193 Padazidou str. Gr-68200 Orestiada, Hellas, [email protected]
Abstract. Cyclades islands face the problem of poor water resources due to the low rain heights compared to the rest of Greece. Summer seasons of Cyclades are the driest in Greece with the rain height practically close to zero for months. Estimations of the torrential water balances for the islands show that there exist sufficient rain quantities and that with the proper utilization (dams in torrential basins) the problem of water shortage will be solved. A new era of sustainable surface water use for the islands will begin.
Keywords. Emanation basin, emanation water volume, torrent, water balance.
1. Introduction
Meteorological data from the meteorological stations of the islands can be used for the estimation of their annual water balances. Cyclades islands have a big number of torrents with sizes of emanation basins sufficient to produce water volumes for utilization. In this paper we estimate the water balances of two torrents (one in Kimolos and one in Tinos) using the same -reliable- methods that we used in relevant pilot Research Programs of the Aristotelian University of Thessaloniki (AUTH). We have found that the surface water balances of the island torrents can solve the insufficiency of water for Cyclades islands permanently and sustainably.
2. Research areas
This research has focused in two Cyclades islands: Tinos and Kimolos. Tinos is located at the north side of Cyclades, at the center of Aegean sea with a surface of 194,2 km2 and a
population of 9.000 people. The biggest town of the island is Tinos with 4.000 people. The island has 12 other villages and a great number of pilgrims, as for the Greek people Tinos is the island of Madonna and for this reason, one of the most important religious destinations. The location of the Komis torrent in Tinos island is shown in figure1.
Figure 1. The “Komis” torrent in Tinos island.
Kimolos is a small island in the southwestern part of Cyclades covering a surface of 35,71km2.It is also one of the driest islands (Figure 2). The capital of the island is named “Xorio”. Kimolos is a part of Milos province and it is known for the mines of “Kimolitis” which is the most important product of the island. This product is not found anywhere else in Greece. The tallest mountain of the island is Paleokastro (362m) with two other peaks Sklavos (358m) and Petalia (312m).
297
“Sustainable Management and Development of Mountainous and Island Areas”

Figure 2. Torrent Panagias of Kimolos isl.
3. Research method
The research methodology that has been used is the following: 1. We have recorded all the torrents. We have used topographic maps of Milos and Tinos islands from the “G.A.S.” (Georgraphical Army Service of Greece) scaled in 1:50.000. From all the torrents of the islands we have selected the torrent “Komis” of Tinos –the biggest- and “Panagias” of Kimolos –a small one. 2. Climate Search was based on climatic data from the meteorological stations (MS) located in the islands of Cyclades. We have used data from stations of Milos and Naxos. The station of Milos is situated 15km from “Panagias” torrent and is used as the basis station for calculation purposes. The Naxos station was the basis station for the calculations for the torrent “Komis”.
The MS of “Milos” operates in an altitude of 183m and has a medium annual rain height of 435mm and a medium annual temperature of 18,3oC (1994). The MS of “Naxos” operates in an altitude of 10m and has a medium annual rain height of 385,5mm and medium annual temperature of 18,5 oC (1979). Using data from the two MS mentioned we have estimated the rain step and temperature step for the areas that dominate the two stations: The rain step of Tinos island is calculated:
Pm=32,13mm/100m, temperature step: -0,35oC/100m. (MS Naxos). The rain step of Kimolos island is calculated: rain step: Pm=34,39mm/100m, temperature step: -0,35oC/100m. (MS Milos).
Climatic data for each one of the two torrents was estimated using data of each MS basis and the difference between the altitude of the basis MS and the mean altitude (Hmed) of emanation basin of the torrent. In this way we had mean heights of rain and temperatures expected for the two torrents.
3. We have estimated the basic morfometric and hydrographic elements of each basin like the ones defined by the science of Mountainous Hydronomy [2], [4], [5], [6], [8], [17].
In the present paper we have estimated the mean climate conditions of the basins to be used at the estimation of the average water volume of the torrents. For the years with bigger rain heights the water volume is much more than the average and for the years with rain heights smaller than the average, the water volumes are less than the average.
For the estimation of water balances the methods used are:
a) The method of emanation factor, b) The Viparelli method c) The method of water balance [1], [3], [9]. Water absorbed by vegetation (Lp) isestimated by using part factors. The simple model of soil moisture is applied but does not consider the evapotranspiration procedure ( ). This model uses rain P and the dynamic evapotranspiration as input and it gives as outcome the real evapotranspiration r and the total exceed amounts of the emanation basin. This model is normally used on a monthly basis. It uses the parameter of the maximum water contains (given to plants) of the soil (Sto). The Model equations are the following: 0 Stn<0
Stn=Stn 0 Stn Sto Sto S tn>Sto Q=0 Stn St o
Et p= P-Q-St n+ St n-1 St= St n-1+P-Et p = existing soil moisture (mm) St o= maximum available soil moisture (mm)
Q= total exceeding quantity of water (mm or m3)
ET1p=Dynamic Evapotranspiration (mm)
r = Real (true) Evapotraspiration (mm) = Height of rain (mm)
n= number of period of time for the count of sizes (normally one month)
All exceeding quantity estimated by the above method appears concentrated during the winter and it reaches zero during the summer. In fact this does not happen because part of the water of the exceeding months is given with time delay as basic emanation, springs etc. This happens because part of the exceeding quantity is stored in underground water carriers and it is given with time delay. The above inclination is normally corrected by the following equation:
Qn = a Q + (1 – a) Qn –1(a=parameter that normally is 0,5)
298
“Sustainable Management and Development of Mountainous and Island Areas”
Estimation of dynamic evapotranspiration is done by the appropriate equation (Penman, Turc, Thornthwaite, etc.), with the available climatic data. Only values of air temperature were available in the area under research. We have used the method of Thornthwaite [19].
Due to the importance of water hold (I) by plants Pavlidis in a relevant paper [10] gave the equations of water hold (I) in relation with the rain height in rain steps. Estimation of water hold (I) was based on the equation L=aP, where a is the monthly factor of water hold at steps of the monthly heights of rain (table 2). The mathematical model of the new improved method of monthly water balance is:
1. Precipitation: P(mm), the monthly rain with the assistance of the annual rain and mean altitude of the emanation basin.
2. Water hold by plants: L=aP where a is the monthly factor of water hold (table 2).
3. Temperature of air T: The mean monthly temperature was estimated with the equations of temperature step and the mean altitude of the emanation basin.
4. Dynamic Evapotranspisration : ETp is estimated by the equation of Thornthwaite [19] E p = 16Ld [10 / ]a
where Ld is the ratio of the mean duration of day of each month to the day of duration of 12 hours, T is the mean monthly temperature of air in Cand I is an annual factor of heat that is estimated with the equation:
= (1 12) j j = ( j /5)1,514
where T is the mean air temperature of each month and i are the correlative monthly factors of heat. Factor a is estimated by the equation:a= 0,000000675( )3 - 0,000077 ( )2 + 0,0 792( ) + 0,49239
prices for factor Ld are in table 3 for the geographic width of 37o in relation with the month of the year.
Table 2. Factors of water hold by plants in research areas by month and rain heights.
Rain Jan Feb. Mar. .. Nov. Dec.
0-3. 0,398 0,441 0,606 .. 0,559 0,467 3-5. 0,332 0,35 0,486 .. 0,418 0,375 …. …. … … … … 140-160
0,013 0,015 0,018 .. 0,017 0,016
>160 0,011 0,012 0,014 .. 0,012 0,012
(Rain is in mm)
Table 3 : Values of Ld for geographic width of 37o in relation with month of year.
Jan Feb. Mar. Apr. May. Jun. 0,835 0,84 1,03 1,11 1,245 1,255
Jul. Aug. Sep. Oct. Nov. Dec. 1,265 1,18 1,035 0,955 0,835 0,81
We believe that the term dynamical evapotranspiration does not give the true dimension of the phenomenon that expresses the «roof» of vegetation’s evapotranspiration and should be replaced with dynamic evapotranspiaration that gives the above condition accurately.
5. Water excess Y. .: i) if P-L-E>0 then Y. .= P-L-E ii) if P-L-E 0 then Y. .=0
6. Water shortage Y.E.: i) if P-L-E<0 then Y.E.=|P-L-E|, ii) if P-L-E 0 then Y.E.=0
7.Adding water shortage APWL : ( PW L )i , = ( PW L ) i-1 , + (Y.E.) i , when Y. .>0 then (PW L ) i , = St [ln(sto ) - (st)
8. Course of fluctuation of soil moisture : St=Stoe-(APWL)/Sto, where Sto=mean available water hold of soil. When Y. .>0 then ( PWL)i,= St [ln(sto ) - (st) ]
9. Soil moisture consumption ( St )=St - - St .When St - - St then St =
10. Real Evapotranspiration Et: when St= 0 then Etr = Etp, when St > then Etr = -L+ St
11. Recorded water shortage: K.Y.E. = Etp - Etr
12. Total water excess: . . . i) St<Sto then . . .=0 ii) St=StO then . . .=St+Y. .-St
13. Water filtration . . the annual water amount filtered is estimated by the equation
.N.=K*n*t where K= hydraulic actionability, n=number of rainy days of the year and t=duration of rain in hours/day.
14. Emanation volume O.A.= ( . . .- . .)*where A area of emanation basin. When
. . < .. . then . .= * . . where B factor with different values for each month (Table 4):
299
“Sustainable Management and Development of Mountainous and Island Areas”
Table 4 : Values of B for estimation of �.�.
J F M A M J 0,572 0,598 0,576 0,604 0,527 0,549
J A S O N D 0,631 0,608 0,692 0,634 0,501 0,508
Using the model we have estimated all hydrologic sizes for the emanation basins for the mean year.
4. Results
4.1 Morfometric characteristicsMain morfometric characteristics of interest at
present are (Table 5): maximum and mean altitude (Hmax Hmed,), area of basins F, mean slope of basins JF , mean slope of main bed, and length of main bed Lk.
Mean slope of main bed: Panagias: 6,95%, Komis: 3,55%.
Table 5: Morphometric characteristics of the torrents
Area of basin
F
Altitude
MaxHmax
mean Hmed
Basin mean slope
Torrent
(km2)
(m) (m) %
Panagias 3,37 358 120 35 Komis 39,26 647 259 26,42
Mean slope of main bed: Panagias: 6,95%, Komis: 3,55%.
4.2 Climatic dataMean monthly and annual heights of rain (mm)
were estimated with the rain steps of the areas and presented at the table 6 below.
Table 6: Estimated mean rain heights of torrentsTor. J F J Pan. 63,6 94,9 21,0 23,2 25,9 13,2 Kom. 60,7 81,1 20,9 2,4 1,2 0
J S D Year 0,9 0,0 0,0 17,6 86,2 66,9 413,4 0,0 0,0 0,0 72,7 113,1 114,5 466,6
4.3 Water balance
Parameters of concerning water balance that interest the hydrologic research and hydrologic application are: rain (P) mm, water hold by plants (Lp) mm, dynamic evapotranspiration ( ) mm, water filtration (QA) mm, and volumes of water moved amounts (QR) m3 (table 7, mean hydrological year).
Table 7: Water balance for conditions of mean year rain
Tor (P) Lp QA QRPan 413,4 50,54 974,8 18,3 494.770 Kom 466,6 17,94 875,4 24,5 7.419.632
5. Conclusions
During mean year (with the average rain and temperature conditions), the available volumes of water are 7.400.000m3 for the Komis torrent and 500.000m3 for the Panagias torrent from areas of 3,37km2 and 40 km2. We have examined one torrent with a small area of basin and another with a big area compared with the areas of the torrents of the other islands of Cyclades. The mean water volumes for the two torrents define the quantities of water available for utilization.
During driest years the water volumes are reduced at 20% of the amounts of mean years according to similar research programmes in Greece [10],[11],[12],[13]. These years 35.000m3/km2 of water are expected for utilisation. Even with these quantities many torrents of Cyclades islands can give significant volumes of water for utilisation.
During years with height amounts of rain the amount of water volumes are nearly tripled compared to the correlative volumes of the mean years. These years 450.000m3/km2 are expected at the torrent basins of Cyclades according to similar research programmes in Greece.
The current study shows that with the appropriate constructions (dams) and development at the torrents of Cyclades the current water problems will be solved.
5. References
[1] Chow V.T., (ed.) 1964: Handbook of Hydrology. New York.
[2] Derruau ., 1956: Precis de Geomorphologie. Paris.
[3] Garg, S.K. 1987: Hydrology and Water Resources Engineering. New Delhi.
300
“Sustainable Management and Development of Mountainous and Island Areas”

[4] Gregory K.J., Walling .., 1983: Drainage Basin. Form and Process. .Geomorphological Approach. Fletcher and Son L TD, Norwich. U.K.
[5] Horton R., 1932: Drainage Basins Characteristics. Transactions, AGU, 350-361.
[6] Kotoulas D., 1997: Torrent arrangement (Mountain Hydronomics I). Thessaloniki
[7] Linsley R., Kohler ., Paulhus J., 1982: Hydrology for Engineers, 3rd ed. McGraw i .
[8] Murphy J., Wallace ., Lane L., 1977: Geomorphic Parameters: Predict Hydrographic
Characteristics in the Southwest. Water res. BuI. Am. Water. Res. Ass. l.13(1), 25-38.
[9] Papamichail D., Pavlidis Th. 1998: «Research of confrontation and utilization of water problems of Xortiatis Mountain» Research Work, Research Committee A. U. Th.
[10] Pavlidis Th. 1997: Handling methods of emanation basins and main beds for increasing water disposables. Example of torrent “Morniotiko”. Research Work, Research Committee A. U. Th.
[11] Pavlidis Th. 1998: “Research of confrontation of water problems and rational utilization of water amounts of Pieria. Research Work, Research Committee A.U.Th.
[12] Pavlidis Th. 2002: Research of torrent conditions and design of a complete hydronomic torrent arrangement at Municipality “N. Kazantzakis”.
Research Work, Research Committee A.U.Th. [13] Pavlidis Th. 2003: “Research of torrent and
water conditions of torrent “Liapatorema” of Municipality Molos, Fthiotida and final study of a pilot antiflood dam”.
Research Work, Research Committee A.U.Th. [14] Shaw ., 1983: Hydrology in Practice (ed.).
Van Norstrand Reihold, . , Co. Ltd. [15] Shouse P. , Jury W. A. Stolry L. H. 1980:
“Use of deterministic and empirical modes to predict pontential evapotranspitation in advective environment” Agron J. 1994-1998
[16] Slabbers P. J., 1977: “Surface toughnes of crops and potential evapotranspiration” J. Hydr 34, 181-191
[17] Tsakiris G. 1995: “Technical Water take” Athens
[18] Viessman Jr. W. Levis G.L., Knappt J.W. , 1989: Introduction to Hydrology. Harper and Raw, Publishers, new Vork, Cambridge, an Francisco, London.
[19] Thornthwaite C. W., Mather J. R., 1955: “The waterbalance” Climatology 8, 1-104
301
“Sustainable Management and Development of Mountainous and Island Areas”

Soil loss evaluation in the Polifitou lake basin using GIS
Maris F.1, Karagiorgos K.2, Anastasiadis S.2, Vassiliou A. 3 & Karagiannis I. 4
1 Lecturer, Democritus University of Thrace. Department of Forestry and Environmental Management and Natural Resourses,193 Pantazidou ,68200, Orestiada, Greece,
[email protected] Forester, Democritus University of Thrace. Department of Forestry and Environmental Management and
Natural Resourses,193 Pantazidou ,68200, Orestiada, Greece, [email protected], [email protected]
3 Forester, Prospective Doctor, Democritus University of Thrace. Department of Forestry and Environmental Management and Natural Resourses,193 Pantazidou ,68200, Orestiada, Greece,
[email protected] Mechanical Engineer, West Macedonian Development Company (ANKO) S.A.,
Fon Karagianni 1-3, 50100, Kozani, Greece, [email protected]
Abstract. The artificial lake of Polifitou in Aliakmona river was formed during the 70s (1975), after the construction of the hydrologic power station of Polifitou. It covers a surface of 74 km² and receives water from the river Aliakmonas and from several streams coming from the hydrological basin, the size of which is 5630 km².The fluctuation in water level is 15m.The lake belongs to Public Power Corporation., but it has been given to the inhabitants of the surrounding area for fishing and cultural activities. It is a unique ecosystem in our country with great ecological, social and cultural importance. The purpose of this survey is to evaluate the soil loss of the hydrological basin based on the Universal soil loss equation using a Geographical Information System as well as the functioning of the existing hydrological constructions.
Key words. Hydrological basin, dam, Universal soil loss equation, Geographical Information System, surface erosion.
1.Introduction The artificial lake of Polifitou is in western Macedonia and was created by the Public Power Corporation in the 1970’s after the construction of the dam at Polifitou of a height of 112 m and beneficial capacity of 1200 x 106
m3 across the Aliakmona river (figure 1). The River Aliakmonas is the largest river
of Greece. Its source are the mountains Voio and Varnounta and its total length is 297 km. The hydrological basin is of a height 9210 km2, the average rainfall is 818m, the average water bulk is 7533 x106 m3 and the average
flow-leakage is estimated at 3900 x 106 m3.It passes through the prefectures of Kastoria, Kozani, Grevena, Imathia and Pieria and enters the Thermaikos sea.
The artificial lake of Polifitou is a unique water ecosystem with great ecological, social and cultural importance.
The artificial lake of Polifitou, irrigates the owland of Veroia, from 2004 supplies with water the city of Thessaloniki, while from 1982 provides with water the coal-mined power stations of the Public Power Corporation in Kozani - Ptolemaida for their operation. The over-exploitation of water due to the intensive agriculture of locations beside the lake, the lack of plant and forest constructions in the wider area of the hydrological basin, the lack of cobstructions for water sources and the uncontrolled logging of forests resulted in the creation of large problems in the lake. One of the most important problems is the alluvium, which threatens the proper functioning of the bank.
The rational use of the mountain hydrological basins of the lake, requires the evaluation of all forest constructions as well as evaluation of surface corrosion with the universal soil loss equation and the incorporation of geographical data through the use of geographical information systems in each one of them. Their use makes possible the simulation of elements of the geographical area. At the same time, the connection between the geographical information from the database and the quantitative estimation of all of the variants that participate on the calculation of surface corrosion, is possible.
302
“Sustainable Management and Development of Mountainous and Island Areas”

The purposes of the assignment are, the estimation of the surface corrosion based on hydrometereological data and also the portioning of corrosion of basins. For this purpose the universal soil loss equation and the geographical information systems were combined.
The area of use in this model consists of the twenty three most important hydrological basins of torrent streams which flow into the artificial lake of Polifitou.
2. Field of survey The field of survey is in the northern part
of Greece, in the prefecture of Kozani (figure1).The artificial lake of Polifitou is located in the south east part of the prefecture of western Macedonia, in the prefecture of Kozani and its correct function has an important effect on the environment of the area.
The hydrographical network of the artificial lake of Polifitou includes 23 torrent streams - flows (table 1, map 2).
Figure 1. The field of survey in Greece
3. Data - Materials The data which were used for the
application are divided into geographical and hydrometereological. Geographical data include the creation of a digital terrain model of the hydrological basin (DTM) (figure 2), the location of the meteorological station, the use of land, geology of the basin and the hydrographical network of the torrent streams-flows of the artificial lake of Polifitou. The hydrometereological data include the monthly precipitation prices from the meteorological station of Velventou of the Institute of Forest Research (table 2).
Table 2. Monthly and annual average rainfall of meteorological station of Velventou
Location of the metereological
station: FR
Period : 1960-2003
Elevation 500m G.Latitude 40 15'
G.Longitude:: 22 04'
January 35,4 July 36,6 February 35,6 August 27,1 March 47,6 September 41,3 April 44,1 October 39,8 May 59,4 November 55,1 Jun 36,1 December 57,7 Mean annual
precipitation price 487,6 mm
Figure 2. Digital terrain model of the hydrological basin of the artificial lake of
Polifitou (DTM)
4. Method used for the survey 4.1. Generally-The universal soil loss equation
The universal soil loss equation is used in the estimation of soil loss due to the surface corrosion and lack of standard measurements. Soil loss is the space at a certain time of the soil material that was corroded minus the quantity that was left in the same position.
The soil loss equation is [17] :
A = R · K · LS · C · P Where:
A = Soil loss in t/ha/year R = Variant of rain corrosion K = Variant of soil corrosion LS = Variant of anaglyph C = Variant of cover plant P = Variant of control of corrosion
303
“Sustainable Management and Development of Mountainous and Island Areas”

With this equation we have the ability to make a close estimation of the average soil loss per year on cultivated and non cultivated lands.
4.2 Variants of the Universal soil loss equation
4.2.1. Variant of cover plant C For the use of the model we must know the
variant of cover plant C, which expresses the meter of soil loss due to plantation.
The calculation type of the variant is:
CXERFXERCOIKFOIKCTHAMFTHAMCDASFDASC100100100100
Where: CDAS = 0,004 CTHAM = 0,03 COIK = 0,001 CXER = 0,2 F The area of the field
The numbers of variant c were formed by surveys and are described in international bibliography [17].
In our assignment the calculation of the cover plant variant, has been done with the help of the land use map (map3) of the year 2000.
4.2.2. Anaglyph variant LS The Anaglyph variant LS dominates the
soil topography, it is different for every basin and is calculated with the Mitchell and Bubenzer type [17], [11], [23], [24].
LS = ( /22,13)m X (0,065+0,045·S+0,065·S)
Where: L = length of slope S = slant of slope M = exponent proportional to the slope(0,5 for the study areas)
4.2.3. Variant of rain corrosion R The variant R expresses the effect of rain
on corrosion. The means of calculation of this variant is a function of the total kinetic energy with maximum rainfall tension of 30 minutes. So we have:
R=5,9·10-4E·I30Where:
jDtjIjIj )ln(14,379,3Where:
E = total rainfall kinetic energy per surface unit
I30 = maximum rainfall tension of 30 minutes Dt = rainfall time with the correlative tension
The main problem in the calculation of R comes from the lack of detailed information.
Thus we went to the Kirkby-Morgan type of1980, where the average rainfall per year P(mm) equals the average number per year of R multiplied by the variant a.
R = ·P Where:
A = 0,1 ± 0,05 depending on the climate of the area.
4.2.4. Variant of control of corrosion P Variant P expresses the amount of human
interference for the protection from corrosion. For this assignment the variant P is equal to 1. The co-efficient P indicates the degree of human intervention regarding protection from erosion. In the present paper regarding the mountainous hydrological basins in which no projects for the protection of soils from erosion were carried out the co-efficient P equals 1. The co-efficient P is considered smaller than 1 if the projects which were carried out are considered less important.
4.2.5. Variant of soil corrosion K Variant K is directly connected to the
mechanical soil composition and especially the percentage of clay, sand and alluviums. Other parameters for the calculation of variant C are the structure, soil penetration and also the granulation curve.
The type of calculation of variant K, which was used on the condition that the alluviums and the sand will not exceed 70% is:
=2,1· 1,14·10-6 · (12- )+0,0325 · · (b-2) + 0,025· (C-3)
=PS · (100-PC)Where:
M = parameter of the size of grain Ps = percentage of alluvium and sand in the soil (%) Pc = clay percentage in the soil(%) a = percentage of organic soil material b = code of soil structure c = code of soil penetration
In our case it was not possible to collect the necessary elements for the calculation of
304
“Sustainable Management and Development of Mountainous and Island Areas”

the corrosion variant, resulting in the use of the monograph of Wischmeier-Smith [17].
The necessary elements for its use (percentage of clay, alluvium and sand, and the degree of penetration and the type of structure) came from the analysis of the geological map. Initially we located the geological background that governs the hydrological basins. Afterwards we analyzed its components, resulting in n ability to calculate the corrosion variant K (figure 3).
ArgilArgil
coefficient
coefficient
AlluvionAlluvion
Figure 3. Numbers of variant case in proportion to the granulation composition of
soil, for 2 constituents of organic components
4.2.6. Degree of solid provision Not all of the materials which are produced
in the hydrological basin are carried to the exit of the hydrological basin. The percentage of the produced materials that reaches in annual base the exit of the hydrological basin is called degree of solid provision and it is given as the average of the following relations:
logDR = 1,8768 – 0,14191·log (10F) and:
logDR = 2,94259 – 0,82362·log (L/DH) Where:
F = the square meter area of the hydrological basin in mi2(1 mi2=1,60934 km) L = length of the greater water flow of the area DH = height difference of the beginning and the end of the water flow
5. Results of the research 5.1 Use of the universal soil loss equation in the hydrological basin 5.1.1. Square meter calculation of the hydrological basin
The total hydrological basin, calculated by the use of Areas command is 816,02 km2
It includes the sub basins of twenty three torrent streams taking into account the structure of the Ilariona barrier. The most
important of the 23 torrent streams are the torrent Potamia with the next most important (in size) being the Livadi stream, the Magouliotiko stream and the Leykarias stream. In similar ways the lengths of the central watercourse, were formed (figure1).
Finally, there was a digitalization of maps with ArcGIS which led to the calculation of the average slope of basins. (figure 1). The slopes of the hydrological basins are:
5.1.2. Calculation of cover plant variant C The cover plant variant in the 23
hydrological sub basins of the area of the survey was formed on the basis of the plantation map of the year 2000. The numbers of the cover plant variant of the 23 hydrological basins are shown in table 3.
5.1.3. Calculation of Anaglyph variant LS With the use of the ArcGis program we
calculated the anaglyph variant for every sub basin (table 3).
5.1.4. Calculation of Variant of rain corrosion RFrom the elements that result from the
meteorological station of Velvendou, we found that the average rainfall is 487,6 mm.
For the calculation of variant R (as a proportion of tension and energy of rains of 1 year that could create soil corrosion) the use of rain is necessary. Because there were no rain graphics, we used the empirical reciprocation equation (Schwartzman equation), [17], [11], [23], [24].
R = 0,083 · N - 1, 77 Where:
R : in (N/h) N : annual rainfall average in (mm)
So it was calculated R = 38, 69877
5.1.5. Calculation of Variant of soil corrosion K
With the use of the ArcGis program we calculated the variant of corrosion for every sub basin (table 3).In the area of survey the beach placers dominate the lower parts of the hydrological basins and after that we have the limestone and marbles.
5.2. Calculation of soil loss with the use of USLE
305
“Sustainable Management and Development of Mountainous and Island Areas”

After the application of the USLE equation and its variants and the numbers that are shown on table 4, a soil loss appeared in the 23 sub basins of the lake (table 4).
In the total corrosion of the hydrological basins, we must also add the corrosion of the torrent shores, which is estimated empirically as a percentage of 20% of the surface corrosion [17], [23], [24].
So the corrosion of the hydrological basin is the sum of the surface corrosion and the corrosion of the water flows (table 4):
= +0,2· ( tn/year)
5.3. Calculation of degree of solid provision DR
According to the calculation method of the degree of solid provision DR the numbers of DR1, DR2 and DR for every torrent flow were calculated, and they are shown on table 5.
So the degree DR of solid provision is given by the type:
DR = (DR1+DR2)/2 After that we had the application of the
soil loss estimation equation. These calculations are very important, because they give us the estimation of brought materials which will be carried to the exit of the hydrological basin of every torrent stream-flow (table 6). These materials might create problems in the proper functioning of the lake.
We notice that the torrent flow with the greater corrosion is the Leykaria stream. Less corrosion have the 2 torrents which flow into the central water source of the river Aliakmonas, the Melissia Lakkos and the stream Potamia. The rest of them do not show great degradation.
6. Conclusions
The artificial lake of Polifitou does not appear to have great alluvium problems because of great corrosion in the mountain hydrological basins. The small slopes and the solid rock formations that dominate the mountain hydrological basins, in combination with the small annual average rainfall, do not create conditions which favor the surface corrosion.
Only three torrents appear important in the production of brought materials. These are the stream of Leykaria, the Melissia Lakkos and
the stream of Potamia. From these three, the first one flows directly into the lake. These torrents must be the subject of important technical and plant arrangements.
Simultaneously, the proper percentage of forest cover must be maintained and increased where possible.
The pre-existing important problems in the flows of Avouziani, Katharolakkos and Valkanies near the village of Velventos were in the past dealt with particular technical arrangements. However, as the above constructions have not up to date been properly maintained, there is a need for their evaluation regarding their operating efficiency.
The artificial lake of Polifitou constitutes no threat to the torrents of the area, but the maintenance of the important percentages of forest cover of its mountain hydrological basins is necessary.
306
“Sustainable Management and Development of Mountainous and Island Areas”
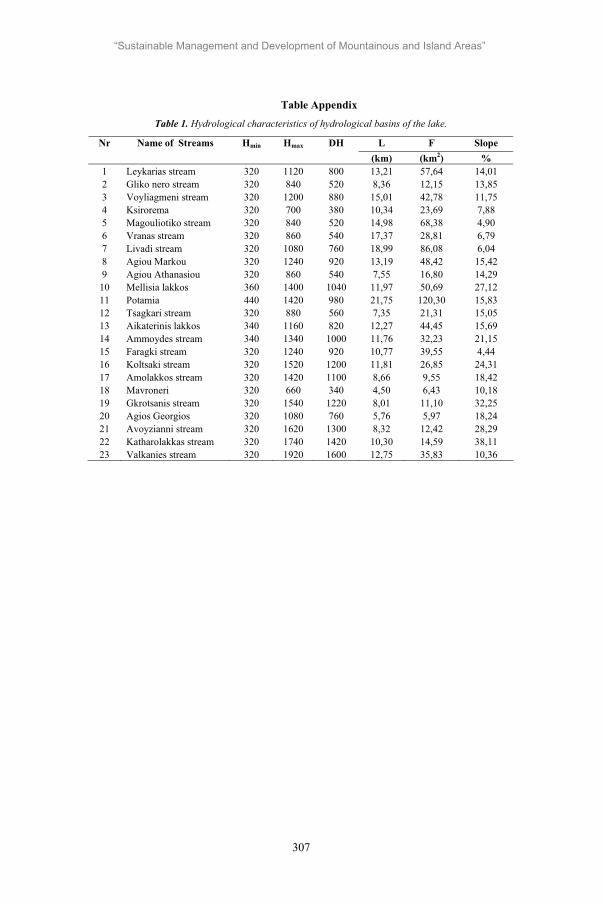
Table Appendix Table 1. Hydrological characteristics of hydrological basins of the lake.
L F Slope Nr Name of Streams min Hmax DH (km) (km2) %
1 Leykarias stream 320 1120 800 13,21 57,64 14,01 2 Gliko nero stream 320 840 520 8,36 12,15 13,85 3 Voyliagmeni stream 320 1200 880 15,01 42,78 11,75 4 Ksirorema 320 700 380 10,34 23,69 7,88 5 Magouliotiko stream 320 840 520 14,98 68,38 4,90 6 Vranas stream 320 860 540 17,37 28,81 6,79 7 Livadi stream 320 1080 760 18,99 86,08 6,04 8 Agiou Markou 320 1240 920 13,19 48,42 15,42 9 Agiou Athanasiou 320 860 540 7,55 16,80 14,29
10 Mellisia lakkos 360 1400 1040 11,97 50,69 27,12 11 Potamia 440 1420 980 21,75 120,30 15,83 12 Tsagkari stream 320 880 560 7,35 21,31 15,05 13 Aikaterinis lakkos 340 1160 820 12,27 44,45 15,69 14 Ammoydes stream 340 1340 1000 11,76 32,23 21,15 15 Faragki stream 320 1240 920 10,77 39,55 4,44 16 Koltsaki stream 320 1520 1200 11,81 26,85 24,31 17 Amolakkos stream 320 1420 1100 8,66 9,55 18,42 18 Mavroneri 320 660 340 4,50 6,43 10,18 19 Gkrotsanis stream 320 1540 1220 8,01 11,10 32,25 20 Agios Georgios 320 1080 760 5,76 5,97 18,24 21 Avoyzianni stream 320 1620 1300 8,32 12,42 28,29 22 Katharolakkas stream 320 1740 1420 10,30 14,59 38,11 23 Valkanies stream 320 1920 1600 12,75 35,83 10,36
307
“Sustainable Management and Development of Mountainous and Island Areas”

Table 3. Table of prices of variants USLE Nr Name of Streams R K C LS P 1 Leykarias stream 38,69877 0,475 0,1291251 14,01 0,8 2 Gliko nero stream 38,69877 0,475 0,0907503 13,85 0,8 3 Voyliagmeni stream 38,69877 0,475 0,0897335 11,75 0,8 4 Ksirorema 38,69877 0,475 0,0263607 7,88 0,8 5 Magouliotiko stream 38,69877 0,475 0,0154753 4,9 0,8 6 Vranas stream 38,69877 0,475 0,0589371 6,79 0,8 7 Livadi stream 38,69877 0,475 0,028199 6,04 0,8 8 Agiou Markou 38,69877 0,475 0,0329712 15,42 0,8 9 Agiou Athanasiou 38,69877 0,475 0,0175245 14,290 0,8
10 Mellisia lakkos 38,69877 0,475 0,066952 27,120 0,8 11 Potamia 38,69877 0,475 0,0521754 15,830 0,8 12 Tsagkari stream 38,69877 0,475 0,0379292 15,050 0,8 13 Aikaterinis lakkos 38,69877 0,475 0,0438395 15,690 0,8 14 Ammoydes stream 38,69877 0,475 0,0609526 21,150 0,8 15 Faragki stream 38,69877 0,475 0,0537249 4,440 0,8 16 Koltsaki stream 38,69877 0,475 0,0127198 24,310 0,8 17 Amolakkos stream 38,69877 0,475 0,0103756 18,420 0,8 18 Mavroneri 38,69877 0,475 0,0164554 10,18 0,8 19 Gkrotsanis stream 38,69877 0,475 0,0165738 32,25 0,8 20 Agios Georgios 38,69877 0,475 0,0126213 18,24 0,8 21 Avoyzianni stream 38,69877 0,475 0,0157935 28,29 0,4 22 Katharolakkas stream 38,69877 0,475 0,0028577 38,11 0,4 23 Valkanies stream 38,69877 0,475 0,0202007 10,36 0,4
Table 4. Table of numbers of soil loss with USLE equation Nr Name of Streams F
(km2)F
(ha) A
(t/ha year) A
(t/year) A
(t/year) 1 Leykarias stream 57,64 57640 0,2660294 15333,93 18400,72 2 Gliko nero stream 12,15 12150 0,1848327 2245,717 2694,86 3 Voyliagmeni stream 42,78 42780 0,1550506 6633,063 7959,676 4 Ksirorema 23,69 23690 0,0305467 723,6504 868,3804 5 Magouliotiko stream 68,38 68380 0,0111511 762,5101 915,0121 6 Vranas stream 28,81 28810 0,058849 1695,441 2034,529 7 Livadi stream 86,08 86080 0,0250467 2156,021 2587,225 8 Agiou Markou 48,42 48420 0,0747652 3620,132 4344,158 9 Agiou Athanasiou 16,80 16800 0,0368263 618,682 742,4184 10 Mellisia lakkos 50,69 50690 0,2670138 13534,93 16241,92 11 Potamia 120,30 120300 0,1214583 14611,43 17533,72 12 Tsagkari stream 21,31 21310 0,0839444 1788,854 2146,625 13 Aikaterinis lakkos 44,45 44450 0,1011509 4496,157 5395,389 14 Ammoydes stream 32,23 32230 0,1895761 6110,039 7332,046 15 Faragki stream 39,55 39550 0,0350783 1387,348 1664,818 16 Koltsaki stream 26,85 26850 0,0454721 1220,926 1465,111 17 Amolakkos stream 9,55 9550 0,0281049 268,402 322,0824 18 Mavroneri 6,43 6430 0,0246341 158,397 190,0763 19 Gkrotsanis stream 11,10 11100 0,0786018 872,4796 1046,975 20 Agios Georgios 5,97 5970 0,0338539 202,1077 242,5293 21 Avoyzianni stream 12,42 12420 0,0328521 408,0233 489,6279 22 Katharolakkas stream 14,59 14590 0,0080077 116,8319 140,1983 23 Valkanies stream 35,83 35830 0,0153878 551,3453 661,6143
308
“Sustainable Management and Development of Mountainous and Island Areas”

Table 5. Table of degree of solid provision DR Nr Name of Streams min
(m)Hmax (m)
DH(m)
L(m)
F(mi2)
DR1%
DR2%
DR %
DR
1 Leykarias stream 320 1120 800 57640 22,480 34,919 8,880 21,899 0,219 2 Gliko nero stream 320 840 520 12150 4,739 43,552 22,450 33,001 0,330 3 Voyliagmeni stream 320 1200 880 42780 16,684 36,428 12,279 24,353 0,244 4 Ksirorema 320 700 380 23690 9,239 39,615 10,004 24,809 0,248 5 Magouliotiko stream 320 840 520 68380 26,668 34,082 5,410 19,746 0,197 6 Vranas stream 320 860 540 28810 11,236 38,530 11,373 24,952 0,250 7 Livadi stream 320 1080 760 86080 33,571 32,987 6,118 19,552 0,196 8 Agiou Markou 320 1240 920 48420 18,884 35,793 11,501 23,647 0,236 9 Agiou Athanasiou 320 860 540 16800 6,552 41,595 17,734 29,664 0,297
10 Mellisia lakkos 360 1400 1040 50690 19,769 35,561 12,252 23,907 0,239 11 Potamia 440 1420 980 120300 46,917 31,457 5,726 18,591 0,186 12 Tsagkari stream 320 880 560 21310 8,311 40,215 15,023 27,619 0,276 13 Aikaterinis lakkos 340 1160 820 44450 17,336 36,230 11,225 23,728 0,237 14 Ammoydes stream 340 1340 1000 32230 12,570 37,921 17,225 27,573 0,276 15 Faragki stream 320 1240 920 39550 15,425 36,836 13,587 25,212 0,252 16 Koltsaki stream 320 1520 1200 26850 10,472 38,917 23,265 31,091 0,311 17 Amolakkos stream 320 1420 1100 9550 3,725 45,066 50,739 47,902 0,479 18 Mavroneri 320 660 340 6430 2,508 47,668 26,721 37,195 0,372 19 Gkrotsanis stream 320 1540 1220 11100 4,329 44,114 48,818 46,466 0,465 20 Agios Georgios 320 1080 760 5970 2,328 48,173 55,097 51,635 0,516 21 Avoyzianni stream 320 1620 1300 12420 4,844 43,416 46,893 45,155 0,452 22 Katharolakkas stream 320 1740 1420 14590 5,690 42,436 44,166 43,301 0,433 23 Valkanies stream 320 1920 1600 35830 13,974 37,356 23,249 30,303 0,303
Table 6 .Degree numbers of solid provision DRNr Name of Streams A (tn/year) DR Sum 1 Leykarias stream 18400,72 0,218994 4029,64 2 Gliko nero stream 2694,86 0,33001 889,33 3 Voyliagmeni stream 7959,676 0,243532 1938,44 4 Ksirorema 868,3804 0,248095 215,44 5 Magouliotiko stream 915,0121 0,197462 180,68 6 Vranas stream 2034,529 0,249516 507,65 7 Livadi stream 2587,225 0,195524 505,86 8 Agiou Markou 4344,158 0,236473 1027,28 9 Agiou Athanasiou 742,4184 0,296643 220,23
10 Mellisia lakkos 16241,92 0,239068 3882,92 11 Potamia 17533,72 0,185911 3259,71 12 Tsagkari stream 2146,625 0,276187 592,87 13 Aikaterinis lakkos 5395,389 0,237278 1280,21 14 Ammoydes stream 7332,046 0,275733 2021,69 15 Faragki stream 1664,818 0,252116 419,73 16 Koltsaki stream 1465,111 0,310912 455,52 17 Amolakkos stream 322,0824 0,479025 154,29 18 Mavroneri 190,0763 0,371947 70,70 19 Gkrotsanis stream 1046,975 0,464661 486,49 20 Agios Georgios 242,5293 0,516349 125,23 21 Avoyzianni stream 489,6279 0,451546 221,09 22 Katharolakkas stream 140,1983 0,433008 60,71 23 Valkanies stream 661,6143 0,303025 200,49
309

Map Appendix
1. Map of digital terrain model
2. Map of hydro-graphical network
310
“Sustainable Management and Development of Mountainous and Island Areas”

3. Map of land uses
4. Slope map
311
“Sustainable Management and Development of Mountainous and Island Areas”

5. Aspect map
References
[1] Date C.J., 1990: An Introduction to Database Systems. Addison- Wesley, New York.
[2] Engelund F. and Hansen E., 1967: A monograph on sediment transport in alluvial streams“, Teknisk Forlag, Copenhagen.
[3] Forest Service: Bioclimatic stores and characteristics of the Mediterranean climate for the prefectures of Thrace. (In the vegetation maps 1:200.000).
[4] Giakoumakis S., Tsakiris G. and Efremides D: On the rainfall runoff modeling in a Mediterranean island environment. Advantages in water resources technology, Balkema 1991.
[5] Giakoumakis S., Tsakiris G. and Efremides D., 1991: .On the rainfall runoff modelling in a Mediterranean island environment. Advantages in water resources technology, Balkema, Rotterdam.
[6] Giakoumakis S. and Tsakiris G., \ 1992: Modelling of surface erosion in the north part of the hydrological Mornos basin, 5th Greek Conference of The Greek
Hydrological Unio, Larisa, November 1992[7] Williams J.R., 1975: “Sedinent
routing for agricultural watersheds”, water resources bulletin, vol. 11, no 5, p. 965-974.
[8] Morgan R.P.C., Quinton J.N. and Rickson R.J., 1991: “EUROSEM – A user guide” Sisloe College, MK 45 4DT, UK
[9] Kotoulas D., 1973: The flood problem of Greece. Publication No.47. Laboratory of Forestry and Mountainous Hydronomics. School of Geopony and Forestry, Aristotle University of Thessaloniki
[10] Kotoulas D., 1986: Natuerliche Entwicklung der Laengen- und Querprofilform der Fluesse, ein Beitrag zum Naturnahen Flussbau. Veroeff. d. Inst. Siedl. wass. Wirtsch. 12, T.U. Graz.
[11] Kotoulas D., 2001: Arrangements of Stream Torrents I. Service of Publications, A.U.Th., Thessaloniki
[12] National Meteorological Service 1978: Climate data of the Greek network (period 1930-1975). Athens
312
“Sustainable Management and Development of Mountainous and Island Areas”

[13] Nielsen S. A., Storm B. and Styzen M., 1986: “Development of distributed soil erosion component for the SHE hudrological modelling system”, International conference on eater quality modelling in island natural environment”, Bournemouth, England, p. 1-13
[14] Poesen J., 1985: “An improved splash transport model”, Zeitschrift fur Geomorfologie, 29,2, p. 193-211
[15] Sakkas Ioannis G., 2004: Technical hydrology, issue 1, Hydrology of Surface Waters, Thessaloniki 2004
[16] Williams J.R. and Berndt. HD., 1972: “Sediment yield computed with universal equation” (Prooceedings ASCEm journal of the Hydraulics division, vol. 98, 2087-2098)
[17] Wischmeier W. H. and Smith D., 1978: “Predicting rainfall erosion losses. A guide to conversation planning”, US Department of Agriculture, Handbook no 537.
[18] Yang C.T. and Stall J. B., 1976: “Applicability of unit stream power equation”, “Journal of the hydraulics division”, ASCE, vol. 102, no HY5, p. 559-568
[19] Williams J.R., 1997: “Sediment delivery ratio determined with sediment ant runoff models”, proceedings of the Paris Symposium, IAHS publication No. 122, p.168-179 Beasley D.B., Huggins L.F. and Monke E.J., 1980. “Answers: A model for watershed planning”, transactions of the ASAE, 23: 938-944
[20] Woolhiser, DA., Smith R.E. and Goodrich D.C., 1990. “A cinematic run off and erosion model” Documentation and user manual. USDA, Agricaltural research service, ARS-77
[21] Viessman Jr. W. Levis G.L., Knappt J.W. , 1989: Introduction to Hydrology.
[22] Van Vuuren W. E, 1982: “Prediction of sediment yield for mountainous basins in Colombia, South America” proceedings of the Exeter symposium: “Recent developments in explanation and prediction of erosion and sentiment yield”, IAHS publication No. 137, p.
313-325 Harper and Raw, Publishers, New York, Cambridge, San Fransisco, London.
[23] Chrisanthou V., 1993: “Notes on technical hydrology II”, Ksanthi 1993
[24] Chrisanthou V., 1989: “Storage of brought materials in reservoirs”, Technical Annals A, Vol. 9, issue 4, p.123-151.
313
“Sustainable Management and Development of Mountainous and Island Areas”

The Island of Ikaria: Terrestrial ecosystems and restoration prospects
Mavrokordopoulou Olga Laboratory of Silviculture, School of Forestry and Natural Environment,
Aristotle University, Thessaloniki 54124, Greece
Aslanidou Maria Laboratory of Silviculture, School of Forestry and Natural Environment,
Aristotle University, Thessaloniki 54124, Greece
Smiris Pavlos Laboratory of Silviculture, School of Forestry and Natural Environment,
Aristotle University, Thessaloniki 54124, Greece, e-mail: [email protected]
Abstract. The island of Ikaria belongs to the complex of eastern islands of the central Aegean Sea. The climate due to the island’s geographic location and the surrounding sea is characterized as Mediterranean with mild winter and prolonged dry-hot summer. The effect of environmental factors mainly climate, results in the configuration of vegetation in characteristic ecosystems, which have been strongly degraded. The aim of the present study is the description of the existing terrestrial ecosystems and the proposal of appropriate measures for the restoration of the degraded ecosystems.
Keywords. Ikaria, terrestrial ecosystems, restoration measures
1.Introduction
The island of Ikaria belongs to the complex of eastern islands of the central Aegean Sea between Samos and Mykonos. It’s one of the bigger islands, with 255 square kilometers area, 102 kilometers shoreline and a population of 8.354. It belongs to the Prefecture of Samos and is divided into the Municipality of Saint Kyrikos with 3.401 residents, the Municipality of Eudilos with 2.811 residents and the Municipality of Rahon with 2.142 residents. The capital and central harbor of the island is Saint Kyrikos in the southeastern side with 2.688 residents [3].
The main economic activities include agriculture, livestock farming and fishery, while tourism contributes additively to the island’s income during summertime. The basic categories of land use, in acres, according to the General Secretariat of the National Statistical Service of Greece are presented in Table 1.
The rural property is shredded and this hinders further agricultural development. Agricultural production is limited and does not cover the island’s needs. The island is mountainous in its bigger part. It is crossed by the mountain range of Atheras whose highest peak is 1.040 meters. Soil morphology, vegetation and the lack of big carnivorous animals increased the number of ovine. The use of traditional livestock-farming techniques influenced negatively the natural environment.
In Ikaria and particularly in the region of Rahon, due to the flora diversity and the existence of extensive forests, apiculture is very developed.
Although the fish fauna contains many different species, their populations are small because of the coastal configuration, the high winds that prevail and illegal fishery (dynamites).
2.Climate
Ikaria’s climate due to the island’s geographic location and the surrounding sea is characterized as Mediterranean with mild winters and prolonged dry-hot summers. The annual mean temperature is
314
“Sustainable Management and Development of Mountainous and Island Areas”

18.9oC. The monthly mean minimum temperature is 9oC (February) and the
monthly mean maximum temperature is 29,3oC (July).
Table 1. Basic categories of land use in acres Municipality
Land Uses Saint Kyrikos Eudilos Rahon Cultivations
(annual crops) 465,5 1.619,8 384
Forests 5.230,7 5.793,7 3.819,5 Pastures and Grasslands 6.116 5.950,4 3.047
Other land uses (after fallowing,
perennial crops etc.) 278 600,3 2.169,9
The prevailing winds come mainly from the north and northeast especially during summertime, while the southern and southwestern winds blow at winter. The mean annual precipitation is 579,8 mm with a maximum in January and a minimum in August. The dry period lasts from April to October.
3. Geology – Soil
The bas-relief of Ikaria is diverse. The northern section is even with deep furrows while southern section is steep. It is crossed by the mountain range of Atheras. Ikaria is divided into the west porphyritic zone, the east metamorphic sedimentary and the volcanic zone. The soils are gray-brown podzolic and brown- forest. In certain areas we find retzines with Mediterranean brown-forest soils.
4. Ecosystems
The effect of environmental factors especially climate, geology and soil result in the configuration of vegetation in characteristic ecosystems, which belong to specific vegetation zones and sub-zones [2,1].
Terrestrial ecosystems
- Thermomediterranean ecosystems (vegetation zone Quercetalia ilicis,sub-zone Oleo-Ceratonion).Characteristic species are: Olea europaea, Ceratonia siliqua, Pinus brutia, Pistacia lentiscus
- Eumediterranean ecosystems (vegetation zone Quercetalia ilicis,sub-zone Quercion ilicis). Characteristic species are: Quercus ilex, Erica arborea, Arbutus unedo, Pinus brutia.
- Paramediterranean ecosystems (vegetation zone Quercetalia pubescentis, sub-zone Ostryo Carpinion). Characteristic species are: Quercus coccifera, Pinus brutia, Quercus sp.
- Riparian ecosystems. Characteristic species are: Platanus orientalis, Alnus glutinosa.
Aquatic ecosystems
- Sea. The sea has an important fish fauna which intensive, illegal fishery and tourism have greatly diminished.
- Rivers and streams
Agricultural ecosystems
- Olive plantations, orchards, vineyards and truck farms.
4.1 Terrestrial ecosystems
4.1.1 Thermomediterranean and Eumediterranean ecosystems
In these ecosystems, winter is characterized by the lack of frost, as they are adjacent to sea, consequently the species that
315
“Sustainable Management and Development of Mountainous and Island Areas”

grow maintain their foliage all year long [4]. The lack of rainfall during summer results in the domination of xerophytes, which survive in low moisture, such as the evergreen sclerophyll species: Quercus coccifera, Pistacia lentiscus, Arbutus adrachne, Arbutus unedo, Olea europaea, Phillyrea latifolia, Erica arborea, Quercus ilex etc.
On the north part of the island the weather is cooler and more humid because of the prevailing north winds so a characteristic vegetation type is formed which is called maquis. This vegetation type forms dense and impassable stands, with a height over 1.5 m.
In Ikaria the evergreen, sclerophyll vegetation grows up to 600m in elevation on northern aspects and up to 700m on southern aspects. The evergreen sclerophyll vegetation is divided in:
- The thermomediterranean ecosystems - The eumediterranean ecosystems
These ecosystems are the main residential areas of the island. All the cultivated fields, vineyards and grove - oils are located here which results in the degradation of the natural vegetation.
4.1.1.1 Thermomediterranean ecosystems
Thermomediterranean ecosystems go up to 250m on the north facing slopes and 300-400m on the south facing slopes. The annual mean temperature is between 16.6 0Cand 18.4 0C. These ecosystems occupy dry areas, which are close to sea and include agricultural areas, which are economically important. Olea europaea cultivations dominate along with orchards and truck farms.
The evergreen schlerophyll vegetation, which appears in uncultivated slopes and between olive groves, is characterized by the predominance of Pistacia lentiscus and Olea europaea.Moreover, other characteristic species are: Ceratonia siliqua, Asparagus aphyllus, Juniperus macrocarpa, Juniperus phoenicea, Euphorbia dendroides, Quercus coccifera, Phillyrea latifolia, Pistacia terebinthus, Styrax officinalis.
Where shrublands have not been disturbed, herbaceous vegetation does not grow. In a lot of cases however where gaps exists, phrygana and therophytes enter. This vegetation type also appears as the understory vegetation of Pinus brutiaespecially where canopy is thin. Pinus brutiaforests grow from the coasts up to 1000m in elevation with a peak between 300 and 800m.
In regions with unfavorable ecological conditions (inclining rocky slopes on southern aspects) where logging, clearances or fire have destroyed maquis, Pinus brutia’s regeneration is impended. Characteristic species are: Cistus sp., Thymus capitatus, Satureja thymbra, Lavandula stoechas, Anthyllis hermanniae, Salvia sp., Asparagus aphyllus, Sacropoterium spinosum as well as many annual or perennial herbaceous species such as Orchis sp. and Ophrys sp.
In cases where the destruction of maquis is followed by grazing, thorny shrubs appear mainly Sarcopoterium spinosum and Genista acanthoclada. This vegetation type is called phrygana and its composition depends on ecological factors, the successional stage and the intensity of human activities.
4.1.1.2 Eumediterranean ecosystem
These ecosystems begin from the upper limits of Oleo - Ceratonion and go up to 800m in elevation on the south facing slopes and 600m roughly on the north facing slopes. The annual mean temperature is between 14.2oC and 16.6oC. The physiognomy of this ecosystem is characterized by the domination of less xerophytic species such as: Quercus ilex, Cupressus sempervirens and Arbutus unedo.Other species that take part are: Styraxofficinalis, Quercus coccifera, Pistacia terebinthus, Quercus infectona, P. pinea, Calicotome villosa, Phillyrea latifolia, Rhammus alaternus, Myrtus communis, Laurus nobilis, Cercis siliquastrum, Ruscus aculeatus, Cistus spp, Dorycnium hirsutum, Hypericum empetrifolium, Anthyllis hermanniae, Genista acanthoclada [5].
In this ecosystem Pinus brutia finds ideal growing conditions. According to the Forest Administration, Pinus brutia’s forests
316
“Sustainable Management and Development of Mountainous and Island Areas”
occupied more than 22% of the island’s area. The geographical distribution of Pinus brutiais in the northeastern section of the Mediterranean basin. It is one of the xerothermic coniferous species. It grows in coastal regions of the Eastern Mediterranean, where summers are dry, winters are mild, the annual precipitation is above 400mm and the relative humidity is high. It is a light-demanding species, which can withstand higher temperatures compared to other conifers. On the contrary it is very vulnerable to low temperatures (- 18oC). Pinus brutia within its natural area of geographical distribution grows without regard to the bedrock. In Ikaria it grows in sedimentary rocks at the eastern part of the island and in limestones at the western.
4.1.2 Paramediterranean ecosystems
Paramediterranean ecosystems occupy high regions of the island. The lower limits are found around 600-700m in elevation and the higher at 900-1000m. The main regions, which belong to this ecosystem, are found on the western and northern part of the island. The annual mean temperature amounts roughly in 12.4 - 14.2 0C. Characteristic woody species are: Cupressus sempervirens, Castanea sativa, Quercus coccifera, Pyrus spinosa, Sorbus umbellata and Fraxinus ornus. Characteristic shrubs are: Juniperus oxycedrus, Prunus spinosa, Cersis siliquastrum, Chamaecytisus
eriocarpus, Coronilla emerus, Rhus coriaria, Pistacia terebinthus and Styrax officinalis.
4.1.3 Riparian ecosystems
The annual mean temperature in these ecosystems amounts roughly in 13.0 0 -18.4 0C. Riparian ecosystems can be divided in:
Sand dunes vegetation: Otanthus maritimus, Ammophila arenaria, Pancratium maritimum Pasture vegetation: Juncus acutus, Scirpus spp.Reed vegetation: Phragmites australis, Typha latifolia, Arundo donaxShrub vegetation: Nerium oleander, Vitex agnus-castus, Tamarix spp. Woody riparian vegetation: Platanus orientalis, Populus alba
5. Fauna
The most important species of fish fauna, shellfishes and cephalopods are given in Table 2. The most important mammal and reptile species whose populations are under protection are given in Table 3. As far as the bird fauna is concerned, the island is a migrating corridor. The bird species that have been recorded are given in Table 4.
Table 2. Ikaria’s fish fauna 1. Sardina pilochardus sardina E (enough) 2. Mugil sp. E3. Pagellus erythrinus E4. Solla sp. E5. Mullus barbutus F (Few) 6. Pagellus lathognatus mormurus F7. Chrysophirus auratus F8. Dicentrarchus F9. Trachurus trachurus E10. Maena chrysalis F11. Maena smaris F
1. Mytilus galloprovincialis E2. Cardium edule E3. Ostrea edulis E4. Pina nobilis E
1. Sepia (officinalis) vulgaris E
317
“Sustainable Management and Development of Mountainous and Island Areas”

Table 3. Ikaria’s mammals and reptilesMammals Presence 1. Meles meles Vulnerable 2. Monachus monachus Threatened with
extinction 3. Lepus europaeus Vulnerable 4. Mustela nivalis L. Vulnerable
Reptiles Presence1. Lacerta trilineata Permanent presence 2. Caretta caretta Threatened with
extinction 3. Chelonia mydas Permanent presence
Table 4. Ikaria’s Bird Fauna Species Presence PELECANIFORMES
1. Pelecanus crispus
Threatened with extinction Presence during migration
CICONIIFORMES
1. Plegadis falcinellus Presence during migration
2. Phoenicipterus ruber Presence during migration Presence in winter
3. Ciconia ciconia presence in summertime
ANSERIFORMES
1. Anser anser Threatened with extinction Presence in winter
2. Aythya nyroca Presence during migration
3. Tadorna ferruginea Threatened with extinction Presence in winter
ACCIPITRIFORMES 1. Buteo buteo permanent presence 2. Circus aeruginosus permanent presence
FALKONIFORMES 1. Falco peregrinus permanent presence
CHARADRIIFORMES 1. Larus melanocephalus Presence in winter 2. Larus ridibundus Presence in winter 3. Larus argentatus permanent presence 4. Chlidonias niger Presence in winter
5. Larus audouinii Threatened with extinction Permanent presence
6. Scolopax rusticola Presence in winter
318
“Sustainable Management and Development of Mountainous and Island Areas”
COLUMBIOFORMES 1. Streptopelia decaocto permanent presence
STRIGOFORMES 1. Bubo bubo permanent presence
CORACIIFORMES 1. Alcedo atthis permanent presence
2. Merops apiaster presence in summertime
PASSERIFORMES
1. Hirundo rustica presence in summertime
2. Saxicola rubetra Presence during migration
3. Turdus merula permanent presence 4. Corvus monedula permanent presence 5. Corvus corone permanent presence 6. Passer domesticus permanent presence 7. Fringilla coelebs permanent presence 8. Serinus serinus permanent presence 9. Carduelis chloris permanent presence 10. Carduelis carduelis permanent presence
11. Sylvia ruepelli presence in summertime
12. Sitta krueperi permanent presence
6. Results – Conclusions
Ikaria’s forest ecosystems are greatly degraded mainly due to overgrazing and wildfires. Nevertheless on the west section of the island productive forests of Pinus brutia exist. Because of their enormous aesthetical and hydronomic value it is essential to handle them with an ecologically oriented silvicultural system and settle the property problem.
Specifically in the thermomediterranean ecosystems Ceratonia siliqua, Juniperus macrocarpa,Juniperus phoenicea and Nerium oleandermust be planted in large numbers in order to promote their aesthetical, hydronomic and livestock-farming values.
To restore eumediterranean ecosystems we must reforest them with Quercus infectona, Pinus pinea, Quercus ilex, Cupressus sempervirens and Ceratonia siliqua according to the quality of the site. In Pinus brutia’s productive forests natural regeneration must be promoted, wood transportation done with
animals and the irregular shelterwood structure obtained or maintained.
In paramediterranean ecosystems emphasis must be given on the cultivation of Cupressus sempervirens, Castanea sativa, Farxinus ornus and Quercus sp.
Riparian ecosystems should be protected and the appropriate regenerations with Populus, Platanus, Salix and Tamarix species done according to the quality of the site.
Fire-protection zones must be created for protection against forest wildfires.
Games preserve zones 15-20m of width must be established which will cover the whole island from the north to the south point.
7. References
[1] Burton VB, Donald RZ, Shirley R D and Stephen HS. “Forest ecology’’. Fourth Edition. John Wiley & Sons, Inc; 1998. [2] Dafis S., 1976. Classification of forest vegetation of Greece. Min. of Agriculture-
319

Gen. Direct. Of Forests, Publ. No 36, Athens; 1976. [3] General Secretariat of National Statistical Service of Greece: www.statistics.gr[4] Ministry of Agriculture, General Directorate of Forests and Natural Environment, 1992. Results of the first National Forest Inventory. Athens; 1992. [5] Spanos K, Trakolis D, Spanos I and Malamidis G. Classification of Forest Vegetation in Greece. Conference "Indicators for forest biodiversity – from ideas to operationality 13–15 Nov 2003 Florence, Italy, 2003.
320
“Sustainable Management and Development of Mountainous and Island Areas”

Bear Habitat Suitability in Relation to Habitat Types of European Interest in NE Pindos Mountain Range, Greece.
Mertzanis G1., Korakis G.2, Kallimanis A.3, Sgardelis St.3, Aravidis I.4
1:NGO “Callisto”, 5, Nik. Foka St.,54621 Thessaloniki - [email protected] 2:Democritus University of Thrace, Dept Forestry, Environment and Natural Resources P.O.
Box 129, Pantazidou 193, 68200, Orestiada, - [email protected] 3: Aristotle University of Thessaloniki, School of Biology, Dept Ecology, UPB 119, 54124
Thessaloniki ,- [email protected], [email protected] 4: Development Agency of Thessaloniki-27, Ploutonos st.-54655, Thessaloniki -
Abstract. Northern Pindos mountain range constitutes the largest continuous bear habitat in Greece and the southernmost edge of the Dinara-Pindos bear population. It is mostly covered by high forest vegetation including many important habitat types of European interest. In this study, results from a 2 year bear monitoring period using satellite telemetry, and ground surveys, as well as results from a habitat type inventory, using field surveys and remote sensing, are presented and analysed.
Ecological Niche Factor Analysis (ENFA) model as performed by the Biomapper package was used to compile and analyze brown bear data sets in relation to key habitat factors.
Bear habitat suitability maps were produced in order to compare bear habitat suitability levels to spatial distribution of EU habitat types.
Keywords. Habitat types, habitat use, Pindos, satellite telemetry, Ursus arctos.
1. Introduction.
For a given species and/or population, physical habitat could be essentially defined as the number of environmental components, necessary to satisfy its ecological and biological requirements in a given time and space frame and at any stage of its biological cycle. A habitat is also defined as any part of the biosphere where a particular species can live either temporarily or permanently [8]. We could refine the habitat use concept in relation to a specific bear population/sub-population, given the fact that even though the basic ecological requirements of the species present general common features throughout its distributional range in a given eco-geographic region (i.e. S. Balkans), the realized
habitat preferences in a more specific geographical area may differ to a certain extent from those exhibited in another sector of the species regional range. In an environmental management context targeting a geographically defined bear sub-population, we need to take into account the aforementioned assumption in order to adjust and optimize the necessary measures for the conservation of the specific sub-population.
Moreover, definition of the habitat concept has been formulated by the EU terminology [12] for the Habitats Directive (92/43 EEC). Under this legislative tool “habitat of a species” means “the environment defined by specific abiotic and biotic factors, in which the species lives at any stage of its biological cycle”. However, under the 92/43 Directive the term “habitat” has been also used to include a more broad bio-geo-coenose concept. According to this approach “naturalhabitats are terrestrial or aquatic areas distinguished by geographic, abiotic and biotic features, whether entirely natural or semi-natural”. The identification and categorization of natural habitat types is achieved in most cases by means of phyto-sociological classification criteria of plant communities in high taxonomic ranks.
The establishment of the European ecological network Natura 2000 is based on the designation of sites that are important for the conservation or restoration of rare and/or typical natural habitats (habitat types of Community interest) and habitats of rare and/or endemic species (species of Community interest).
However, the two interpretations of the concept of habitat have direct consequences in the implementation of the concept in the field and
321
“Sustainable Management and Development of Mountainous and Island Areas”

ultimately inenvironmental management. The aim of this study is to implement and compare the two interpretations in a defined area. More specifically, in the Grevena region of NE Pindos we study the fine scale habitat suitability of the brown bear (Ursusarctos), a conservation priority species. In the same area, we define the habitat types in accordance to the EU directive. We compare the two results and highlight how they are interrelated and how this possible combination could enhance conservation proposals.
2. Materials and Methods
2.1. Study area
Our study site Grevena extends over 800 km2
of a mixed forest and agricultural ecosystem and is located in the north-eastern part of Pindos mountain range (Lygos and Hassia mountain massifs) (Fig. 1). Of this area 75% are forests, 10% meadows (pasture lands), 14% agricultural lands, whereas low population density human settlements occupy 0.3% of the total area. Major forest vegetation types comprise oak (Quercusspp.), black pine (Pinus nigra ssp. nigra var.caramanica) and beech (Fagus sylvatica ssp.sylvatica). A mosaic of dense forests, openings and small-scale cultivations characterizes the area. Altitude ranges between 500 m - 2200 m asl. Mean monthly temperatures range from -3.4° C min to 28.2° C max. Mean annual precipitation is 589 mm. [13]. Part of the study site is included in the Northern Pindos National Park.
Figure 1. Brown bear range in Greece and study area
2.2 Data collection
We used an ‘Aldrich Foot Snare’ trap type to catch six adult brown bear specimens (13.6% of the minimum sub-population estimated at 44 individuals through DNA typing [14]. Sex ratio and age classes of the sample were partitioned as follows: 4 young adult males and two adult females. The bears were sedated with Zoletil (50)/Domitor (MT). We fitted the bears with satellite GPS TELEVILT radio-collars with remote download system (RX-900 TELEVILT receiver) and 12 hours VHF beaconing. The collars were set-up to give 15-17 positions daily (the effective positions averaged 6-10 daily). GPS telemetry data coordinates were directly mapped on EGSA 87 probolic system using ArcGis 9.2 software. Duration of bear monitoring period ranged from 1 to 13 months (average 6.8 months). Total monitoring period extended from 2003 to 2005.
We also conducted systematic ground surveys for collection of bear signs of presence and activity. The total length of sampling transects (1,008 km) followed the dense (1.5 km/km2)forest road network present in the study area.
As the source data for landscape structure quantification, we used raster maps (resolution 50 x 50 m2) of the land cover of the study sites. The vegetation cover was mapped by the forestry service (Forest Management Plans of 1994 at a resolution of 1:20.000) and updated based upon orthorectified aerial photographs of the area. For each cell we considered its land use (classified as dense forest, partially forested area, grassland meadows, bare land, cultivated fields, infrastructure and surface water). Woodlands were further classified as oak (Quercus spp.), beech (Fagus sylvatica ssp. sylvatica), black pine (Pinus nigra ssp. nigra var. caramanica), white-barked pine (Pinus heldreichii) and mixed broadleaved species.
Our analysis took into consideration not only the contents of each cell in our raster, but also the landscape composition of its spatial neighborhood. We quantified the landscape composition in neighborhoods of different size around each cell and examined how the neighborhood affected the bear’s habitat preference. More specifically, we defined the radius of the neighborhoods at 250 m and 450 m. Then, we measured what percentage of the neighborhood area each land use class and each forest type covered. This process was repeated for each cell in our raster.
322
“Sustainable Management and Development of Mountainous and Island Areas”

The land cover maps included information regarding villages and streams. For each cell in our raster, we estimated the distance from the nearest village and stream using the spatial analyst of ArcGIS 9. Topographical information included elevation, slope and aspect, and was obtained from a 100 m Digital Elevation Model (DEM).
2.3 Vegetation and habitat types classification
The inventory of vegetation types was carried out, by the use aerial photographs, forestry service maps and field survey. Furthermore, a classification of the corresponding habitat types was made following the criteria and methodology described in European Union Directive 92/43 [12] and the respective European Union manuals and handbooks [4], [3], [1] &[2]. The nomenclature of taxa follows [16] (Fig.2).
Figure 2. Map of habitat types in the study area
2.4 Statistical analysis
We used location data from bear sign (n=1,410) as well as telemetry data (n=4,564).For each background layer, we estimated the value at the location of the recorded bear presence; we compared the distribution of these values with the distribution of values for this layer in the entire landscape (presence versus availability) [9]. The null hypothesis being that
all values of the background layer were equally suitable and its frequency of use depended only on its availability across the landscape. We used the entire extent as background, because bears were observed throughout the area. Ecological Niche Factor Analysis (ENFA) [5] starts off at this point, comparing the distribution of values where the animal is present with the distribution of values in the background. ENFA relies on identifying differences in the two distributions with respect to the mean (marginality) and with respect to the standard deviation (specialization). This idea is applied to all background variables, in our study related to topography, vegetation and land use, as well as the composition of the spatial neighborhood around each cell. The final habitat suitability is estimated with the use of ordination techniques, such as principal component analysis. The analysis estimates an overall marginality index, which expresses the difference between the mean animal preference and the mean condition of the study site. Also the overall specialization index is estimated, which is a measure of the range of environmental conditions the animal tolerates compared to the range of values recorded in the study site. For both indices values close to “0” indicate a species with can equally well utilize the entire area and values close to “1” indicate a highly specialized species that can only use a small part of the available landscape. We performed the analysis using the Biomapper 3.0 software package [6].
3. Results
Bears were present throughout the entire extend of the study area, but they appeared to prefer some parts of the area and avoid others. They avoided areas of high altitude (>1900 m asl), steep slopes (>70% inclination). They preferred areas close to streams and rivers and at an intermediate distance from human settlements. The bear presence in the different land use categories of the area differs slightly from their availability (Table 1). About 61.6% of the area consists of dense forests, and 65% of the bear presences were recorded in this type of structure. Partially forested areas cover 13.8% of the site, and account for 12.9% of the bear presences. Cultivated fields cover 14.3%, and 13.4% of the bear locations were found in this type of land use. Grasslands cover 9.9%, and 8.8% of bear presences were recorded there. Other land use categories are negligible.
323
“Sustainable Management and Development of Mountainous and Island Areas”

Table 1: Landscape availability versus bear use in the study area.Landscape type
Landscapeavailability
Bear presence
Dense forests 61.6 % 65.0 % Partially forested 13.8 % 12.9 % Grasslands 9.9 % 8.8 % Agricultural Land 14.3 % 13.4 % Bare land 0.2 % 0.0 % Infrastructure 0.3 % 0.0 %
Forests were further analyzed according to their dominant vegetation and the presence of natural habitat types (Table 2). Oak forests (Quercus spp.) assigned to Balkanic and supra-Mediterranean oak woods habitat type (coded as 924A) dominated in the study area accounting for 36.3% of the area and for 38.5% of the bear presences. Black pine (Pinus nigra ssp. nigra var. caramanica) assigned to Mediterranean pine forests with endemic black pines habitat type (coded as 9536*) was the second most abundant forest type (29.3% of the site) and accounted for 32.3% of the bear presences. Beech forests (Fagus sylvatica ssp. sylvatica) assigned to Luzulo-Fagetum beech forests habitat type (coded as 9110) and white-barked pine forests (Pinus heldreichii) assigned to Mediterranean pine forests with endemic mesogean pines (coded as 9540) each covered 3.4% of the area and were avoided by bears (2.4% of the presences in beech and only 0.6% in white-barked pines). Finally mixed broadleaved forests assigned to Hop-hornbeam, oriental hornbeam and mixed thermophilous forests habitat type (coded as 925A) were relatively rare (1.5% of the area) and were preferred by the bears (3.7% of the presences).
Table 2: Habitat types availability versus bear use in the study area. Dominant species / Habitat code
Landscapeavailability
Bear presence
Oak /924A 36.3 % 38.5 % Black pine /9536 29.7 % 32.3 % Beech /9110 3.6 % 2.4 % White-barked pine /9540
3.6 % 0.3 %
Mixed broadleaved /925A
1.5 % 3.7 %
Open landscape formations
24.6 % 22.2 %
In order to estimate the importance of the different habitat types in relation to the overall habitat suitability profile of the study area for bears, and for practical reasons, we classified the study area into two main suitability levelsaccording to the habitat suitability gradient produced by ENFA.
In the most suitable habitat configuration the landscape composition was 42.3% oak forest (Quercus spp.), 27.6% black pine (Pinus nigrassp. nigra var. caramanica), 27% open landscape formations whereas all other forest types covered approximately 3%, mixed broadleaved 1.5%, beech (Fagus sylvatica ssp. sylvatica ) 0.7%, and white-barked pine (Pinus heldreichii) 0.8%.
In the less suitable habitat configuration, oak (Quercus spp.) covered 30.6%, black pine (Pinus nigra ssp. nigra var. caramanica) 31.9%, open landscape formations 22.6%, beech (Fagussylvatica ssp. sylvatica) 6.4%, white-barked pine (Pinus heldreichii) 6.3% and mixed broadleaved forests 1.5%. Thus, all forest types were present in both levels of bear habitat suitability. However, oak (Quercus spp.) forests, open landscape formations and mixed broadleaved had more than 50% of their total surface each characterizing the high suitability habitat configuration.
On the other hand, black pine had 56.9% of its surface characterizing the less suitable level configuration. In the case of beech (Fagussylvatica ssp. sylvatica) and white-barked pine (Pinus heldreichii) forests more than 90% of their surface (or occupied area) characterized the less suitable habitat level .
Black pine as a priority habitat type is of special interest in this analysis. For this type of forest we observe two contrasting results. The frequency of bear presence in this type is comparatively higher than its availability across the landscape, although only 43.1% of its area is characterized as highly suitable.
More importantly, the land cover composition of the neighborhood around each cell influenced the bears’ behavior. The percentage of the area covered by open landscape formations (grasslands, cultivated land and fallow land) strongly affected the habitat preference pattern. Bears seem to prefer locations that include such formations in their neighborhood, but avoid sites that either have no open formations or that have predominately open formations in their neighborhoods (>90%). According to this outcome, bears seem to prefer sites near the edge of grasslands and cultivated fields, but avoid
324
“Sustainable Management and Development of Mountainous and Island Areas”

going to the center of large patches of grasslands and cultivated fields.
Ecological Niche Factor Analysis showed that the bears scores 0.37 in the marginality index, and 0.77 in the specialization index. This means that for bears a significant portion of the site is of high suitability but not all. Figure 2 shows the habitat suitability map of the area produced by ENFA. Habitat suitability is represented as a grayscale gradient, with the darker shades representing less suitable habitat.
Figure 2. The habitat suitability map produced by the ecological niche factor analysis. Habitat suitability is presented by a grayscale gradient. The brighter the color the more suitable habitat location for the bear
6. Discussion
In our study site, evidence of bear presence was abundant throughout the area. Habitat selection is a scale dependent process and different characteristics of the landscape influence habitat selection at different scales [10]. At the coarse scale, the entire extent of our study site consist of suitable habitat for the brown bear. The present study analyses the fine scale habitat preference of the bears and makes an attempt to relate it to habitat types importance and role.
The frequency of the bear presences display specific patterns of avoidance and preference as also recorded in an adjacent mountain region to the study area [7]. Bears seem to avoid alpine meadows, but prefer black pine, oak and mixed broadleaved forests. However, the deviation between the bear presences and the availability of these landscape types is limited. Also the bears show a strong preference for sites near
streams and rivers as also recorded in bear populations of N. America [15]. Furthermore, the bears display an avoidance of human settlements, but a preference for areas at intermediate distances from them, especially areas that serve as food sources (e.g. orchards) [11].
The brown bear is a large mammal species that perceives the surrounding area at a broad scale comparable to the human. Therefore, its habitat preferences do not depend only on the location point but also on the adjacent areas of a habitat unit. This was confirmed by our analysis showing that bears seem to be strongly influenced by the landscape composition of the spatial neighborhood around the location point. Bears seem to prefer areas in the edge of the habitat types, especially in the interface between forest and open landscape formations (i.e. grasslands and agricultural land). Bears seem to avoid locations that are in the core area of the different habitat types in the area. This apparent preference might be explained as a combination between safety, in terms of coverage provided by the neighboring forest vegetation, and feeding opportunities related to the grasslands and fallow lands.
The results show also that bear preference for black pine formations is characteristic. This can be attributed to the seasonal (spring, fall) trophic value related to the presence of the understory species that occur in the shrub and herb layer (berries and graminoids) of this habitat type [7]. It is important to underline that that black pine formations constitute an important habitat component for bears at a regional scale in the southern part of the Balkan eco-region. At the same time black pine forests is a priority habitat type. These facts enhance the criteria for the implementation of specific management and conservation measures targeting both a priority species and a priority habitat type.
Nevertheless, the results of the present study lead us to the assumption that the habitat selection of brown bears is not strongly associated with the concept of habitat as a specific plant community, but takes into consideration wider aspects of the physical environment (such as the landscape composition and fragmentation of the adjacent areas and the intensity of the human presence). Therefore even though the principle of preserving specific habitat types may offer many advantages for several species, in the case of a flag wide ranged species such as the brown bear it has to be
325
“Sustainable Management and Development of Mountainous and Island Areas”

preceded by a landscape spatial analysis in order to define specific correlations between habitat availability and habitat use.
8. Acknowledgements
We would like to acknowledge the financial support of the Hellenic Ministry of Environment, Physical Planning and Public Works, the EU (DGRegio) and EGNATIA ODOS SA, in the framework of the “Monitoring project on impact evaluation of Egnatia highway construction (stretch 4.1) on large mammals in the area of Grevena (2002-2005)” in which the present study was realized. We also acknowledge the contribution of the field team composed by: Y. Iliopoulos, I. Isaak, Al. Karamanlidis, K. Selinidis, S. Riegler, A. Riegler, Ath. Tragos for data collection.
9. References
[1] Dafis S, Papastergiadou E, Lazaridou E,. Technical manual of identification, description and mapping of Greek habitat types. Thessaloniki: Greek Biotope-Wetland Center (EKBY); 1999.
[2] Dafis S, Papastergiadou E, Lazaridou E, Tsiafouli M, 2001. Technical manual of identification, description and mapping of Greek habitat types Thessaloniki: Greek Biotope-Wetland Center, (EKBY); 2001.
[3] Devillers P, Devillers J,. A classification of palearctic habitats. Nature and Environment 78. Council of Europe, Strasburg; 1996.
[4] European Communities. CORINE biotopes manual. Habitats of the European Community. Office for official publications of the EC; Luxemburg 1991.
[5] Hirzel A H, Hausser J, Chessel D, Perrin N. Ecological-Niche Factor Analysis: How to Compute Habitat- Suitability Maps Without Absence Data? Ecology 2002; 83: 2027-36.
[6] Hirzel, A.H., Hausser J, Perrin N. biomapper 3.0. Division of Conservation Biology, University of Bern; 2004. http://www.unil.ch/biomapper [25/05/06]
[7] Kanellopoulos N, Mertzanis G, Korakis G, Panagiotopoulou M. Selective habitat use by brown bear (Ursus arctos L.) in northern Pindos, Greece. Journal of Biological Research 2006 ;(in press).
[8] Krebs C.J. Ecology. Harper Collins College Publishers; 1994.
[9] Marcum C, Loftsgaarden D. Anonmapping technique for studying habitats preferences. Journal of Wildlife Management. 1980. 44: 936-68.
[10] McLoughlin, PD, Case, RL, Gau, RJ, Cluff, H.D, Mulders R, Messier F. Hierarchical habitat selection by barren-ground grizzly bears in the central Canadian Arctic. Oecologia 2002; 132: 102–8.
[11] Mertzanis G. Aspects biogeographiques et ecologiques des populations helleniques d’ours brun (Ursus arctos L.). Cas d’une sous-population du Pinde: application a la conservation de l’espece et de son habitat. 1992 ; These, Universite de Montpellier II,France,220pp.
[12] Official Newspaper of the European Union, Directive 92/43 of the Council for the preservation of natural habitats, wild fauna and flora. 1992.L206: 7-15+ Annexes.
[13] Papageorgiou, Kokkinakis A. Water ecosystems, fish fauna & fish populations. In Mertzanis G, editor. Monitoring and evaluation of impact of the Egnatia highway construction (stretch 4.1) on large mammals and their habitats. Project final report. 2005.p. 468-600.
[14] Scouras Z., Drosopoulou E. Genetic study of the bear sub-population. In Mertzanis G, editor. Monitoring and evaluation of impact of the Egnatia highway construction (stretch 4.1) on large mammals and their habitats. Project final report. 2005.p. 114- 197.
[15] Stratman M., Alden D., Pelton M., Sunquist M. Habitat use by black bears in the sandhills of Florida.Ursus 2001;12:109-14.
[16] Strid, A, Tan K. Flora Hellenica. Vols 1, 2. Königstein: Koeltz Scientific Books; 1997- 2002.
326
“Sustainable Management and Development of Mountainous and Island Areas”

Silvicultural Treatments Aiming at the Preservation and Increase of Juniperus excelsa Bieb. Presence in Stands Located in the Slopes in the
Central Part of Nestos Valley
Elias Milios Petros Petrou Elias Pipinis
Democritus University of Thrace, Department of Forestry and Management of the Environment and Natural Resources, Pantazidou 193, 682 00 Orestiada, Greece
Abstract. Apart from the traditional management goal of timber production an objective which silviculture serves is the preservation of some locally or globally important forest ecosystems or species. In the present study, the main objective is to recommend the appropriate silvicultural treatments in order to preserve and increase the Juniperus excelsa component in stands located in the slopes in the central part of Nestos valley. Under the present conditions J. excelsa exhibits an adequate recruitment and does not face any immediate danger. However, if grazing stops in the future, J. excelsa will be replaced in better sites by more competitive species. In order to preserve an important component of landscape such as J. excelsa stands and the integrity of ecosystem diversity, forest practice must imitate the impact of grazing and illegal cuttings in better sites. The other species have to be suppressed through periodic cuttings. Controlled grazing must be avoided due to the negative effects upon the soil. Moreover the density of J. excelsa trees can be increased through specific silvicultural treatments such as thinnings (in the J. excelsa groups) and planting.
Keywords. Disturbance, diversity, Juniperus excelsa Bieb., planting, silvicultural treatments, thinnings.
1. Introduction
Silviculture is applied ecology. According to Smith et al. [13] in an applied science such as silviculture, in the absence of total knowledge we are always condemned to act on a basis of thoughtful judgment. In order to achieve sustainability in forest management, ecologists have to understand the historic forces that have shaped forest ecosystems and work with the
mechanisms by which ecosystems sustain themselves [10]. A major factor which determined the structure and the character of forest ecosystems to a great extent is disturbances.
The best way to create a definite stand structure is to imitate the disturbance that creates that structure in natural forests [13]. Moreover Dafis [6] claims that a forester analyzes the previous stand growth history and dynamics in order to estimate the future stand development before the application of any silvicultural operation. It is the safest way to choose the correct silvicultural treatments in order to deliberately guide forest structure to a direction which will best serve the management goals.
Except for the traditional management goal of timber production an objective which silviculture serves is the preservation of some locally or globally important forest ecosystems or species.
In the present study, the main objective is to recommend the appropriate silvicultural treatments in order to preserve and to increase the Juniperus excelsa component in stands located in the slopes in the central part of Nestos valley.
2. Juniperus excelsa
Juniperus excelsa Bieb. expands from the central and south Balkans through Anatolia to Crimea, central and southwest Asia and east Africa [3], [4], [14]. It creates extended forests in Baluchistan of Pakistan and in Turkey [1], [2], [5]. J. excelsa is also the dominant component of the woody vegetation above 2100 m altitude in almost all the northern mountains of Oman [7], [8]. Even though overgrazing and other anthropogenic factors lead to a lack of Juniper regeneration in many stands in Turkey and Baluchistan [1], [2], [5] and there is a dieback of
327
“Sustainable Management and Development of Mountainous and Island Areas”

J. excelsa at lower altitudes in Oman (possibly due to continuing climate change), J. excelsa stands or woodlands are generally not deteriorating. In Greece J. excelsa is found as a component of degraded scrublands and as scattered individuals or as very small aggregations of trees in open forests of altitude between 50 and 1600 m. In some cases it has been observed in larger units of mixed or pure stands.
J. excelsa can attain a height of 20 m and is a site insensitive species which has the ability to grow on shallow and stony soils in severe environments (cold, hot and dry climates) [7], [5]. It is considered to be a slow growing species [2], [5].
J. excelsa is considered to endure shade in its first stages of life. In the valley of Hayl Juwari, most J. excelsa trees <2m in height, either grow in the dense shade of a much taller tree or in the northern side of a nurse plant [7]. Furthermore, in Balouchistan, J. excelsa seedlings occur with a canopy cover of dense shrubs or in the vicinity of groups of parent trees [1], [2]. Ahmed et al. [1] found J. excelsa seedlings which were over the age of 50 under dense canopies with height more than 1 m. Carus [5] mentions that J. excelsaresembles Pinus nigra (which is a semi shade tolerant species) as far as its shade tolerance is concerned.
3. Study area
The J. excelsa stands are found in the slopes located in the central part of Nestos valley. This area is located in the south of central Rhodope mountains in the northwest region of Xanthi, which lies in northeast Greece close to the Bulgarian borders. J. excelsa stands are located in the east part of Pascalia public forest (41o 12’ to 41o 16’ N, 24o 29’ to 24o 38’ E). The altitude there ranges from 100 to 350 m. The closest meteorological stations are a) this of Echinos situated on an elevation of 300 m about 43 kilometres away from our area and b) that of Xanthi which lies on an elevation of 50 m approximately 36 kilometres away. On average, the annual rainfall in Echinos is 771 mm and the mean yearly temperature is 12.1 oC while the corresponding values for Xanthi are 580.6 mm and 15.4 oC. The climatic conditions describing Nestos valley are estimated to be in the middle of these two climates.
Juniperus excelsa stands are located in the five following site types [12]: a) in moderate
south facing slopes = MSFS, b) in extremely steep, most southerly facing slopes = ESSFS, c) in narrow ridges = NR d) in wide ridges = WR and e) in a mountain plateau = MP. The substratum is limestone and the soils are sandy – clay and rocky [11]. In many cases surface appearances of parent material are observed. The soil is almost absent in extremely steep slopes (ESSFS), in the narrow and wide ridges (NR and WR) is shallow while in moderate slopes and in the mountain plateau (MSFS and MP) is more or less deeper than in the rest site types [12].
Many scattered small J. excelsa stands are found in each site type except for MP where there is a complete and uniform cover of J. excelsa trees. The stands in the steep slopes and in the plateau are pure. Small mixed stands of J. excelsa and species such as Quercus coccifera, Phillyrea latifolia, Fraxinus ornus, Paliurus spina – christy, Juniperus oxycendrus and Quercus pubescens exist in the rest of the sites [12]. J. excelsa is absent from northern facing slopes or appears in the form of single trees under the intense dominance of other species.
In MSFS and WR stands there are a) scattered, too old, bad-formed J. excelsa trees of great dimensions b) dominant J. excelsa trees more or less scattered, without any severe competition (in most cases) and c) J. excelsatrees, which are aggregated around and beneath the trees that have great dimensions or (in a few cases) around and beneath some dominant trees, and which create dense groups of J. excelsa trees with dense branches and foliage that reach the ground [12]. Under the dense tree crowns there is soil rich in humus. In these groups many J. excelsa trees grew in shade, or side shade and there were also some dead J. excelsa trees in deep shade. An analogous to MSFS and WR stands structure and spatial distribution is observed in the stands of NR site type, but in NR stands the groups of J. excelsa trees are by far looser.
The other species components of MSFS, NR and WR J. excelsa stands consist of trees with small dimensions, which are mainly stump and seedling sprouts, and a few larger individual trees. In most cases the stands in these three site types present a mosaic structure of patches, where aggregations of J. excelsa trees or areaswith scattered dominant J. excelsa trees alternate with a) groups of other species trees and b) areas with more or less bare ground. Only in few cases J. excelsa trees of small dimensions intermingle with other species plants [12].
328
“Sustainable Management and Development of Mountainous and Island Areas”

In ESSFS stands, only scattered single dominant J. excelsa trees without competition were observed [12].
In the MP site type, J. excelsa trees create an almost uniform open canopy with many shade free areas and one main storey (8 m), while the other site type stands are multistoried. The oldest trees, in all site types, have a broken top, probably due to winds or thunder. As a result the highest heights range from 8 to 10 m [12].
Almost all regeneration, in MSFS, NR, MP and WR J. excelsa stands, except for a small number of plants which grow in the open, is found under the facilitation of nurse plants (dense groups of J. excelsa trees with dense branches and foliage that reach the ground or single dominant J. excelsa trees), either under their canopy, or under their canopy edge. Facilitation in this case is likely related to a) the creation of certain microhabitats with adequate amount of nurse plant litter and b) the protection of seedlings from grazing [12].
The prevailing disturbances in the entire Nestos Valley area are grazing and illegal cutting of branches and small dimension sprouts for the livestock feeding. These disturbances have taken place over a long period of time with various intensities and intervals.
The fact that the disturbance factors persist to act, even with lower intensity, gave J. excelsa the ability to dominate even in better sites as the result of low competition [12], since foliage of the other species component is preferable to grazing even though J. excelsa seedlings and saplings are grazed too (personal observations and communication with shepherds).
4. Silvicultural treatments
In the present conditions J. excelsa exhibits an adequate recruitment and does not confront any immediate danger [12]. However, if grazing stops in the future, J. excelsa will be replaced in better sites, by more competitive species having greater site sensitivity. Groups of J. excelsa trees will be restricted in ESSFS and in parts of NR and WR site types and only scattered individuals will be found in MSFS and MP site types [12]. Likewise it is the decline of human activities (mainly grazing) and the consecutive colonization of other species which threaten the J. thurifera stands growing in deep soils in the Alps and Pyrenees [9].
In order to preserve J. excelsa stands, forest practice must imitate the impact of grazing and
illegal cuttings in better sites. The other species have to be suppressed through periodic cuttings. Controlled grazing must be avoided due to the negative effects upon the soil (compaction, erosion). Moreover through specific silvicultural treatments the density of J. excelsa trees has to be increased.
First of all, in the cases where J. excelsa trees of small dimensions intermingle with other species plants we must release juniper seedlings and saplings from competition through the gradual cutting of other species competitive trees (Figure 1).
In the case of J. excelsa groups, the basic objectives are: a) to give the shaded and side shaded juniper seedlings and saplings enough light and growing space to grow adequately and develop into larger trees and b) to <<stabilize>>, <<strengthen>> and enlarge these groups through the redistribution of growing space. This procedure may be accomplished in two successive steps according to the dimensions and the density of the groups.
Step1: to prune the dense branches in the lowest stem part of some juniper trees in the cases when under these trees there are other J. excelsa trees (Figures 2, 3).
Step 2: to apply successive thinnings in which the very suppressed and in any way damaged trees of the group will be removed (Figure 3).
It must be mentioned that: a) In these thinnings the central old and with
great dimensions tree (or dominant tree) around which the group of junipers is created is not removed (cut). These trees are a kind of assurance for the species survival against a possible future period of intense disturbances, since trees with great dimensions can more successfully confront disturbances such grazing and illegal cutting of branches compared to small trees. We cut these trees only in the case when they are almost dead or very damaged in order to enhance the growth of other juniper trees. When this happens a major goal is to stimulate the growth of certain robust trees in order to rapidly attain large dimensions.
b) The thinning severity must be very light and the tree removing (cutting) procedure has to be very gradual in order to avoid the abrupt exposure of shaded junipers to light, which could possibly cause a physiological shock. According to Ahmed et al. [1] shaded juniper seedlings and
329
“Sustainable Management and Development of Mountainous and Island Areas”
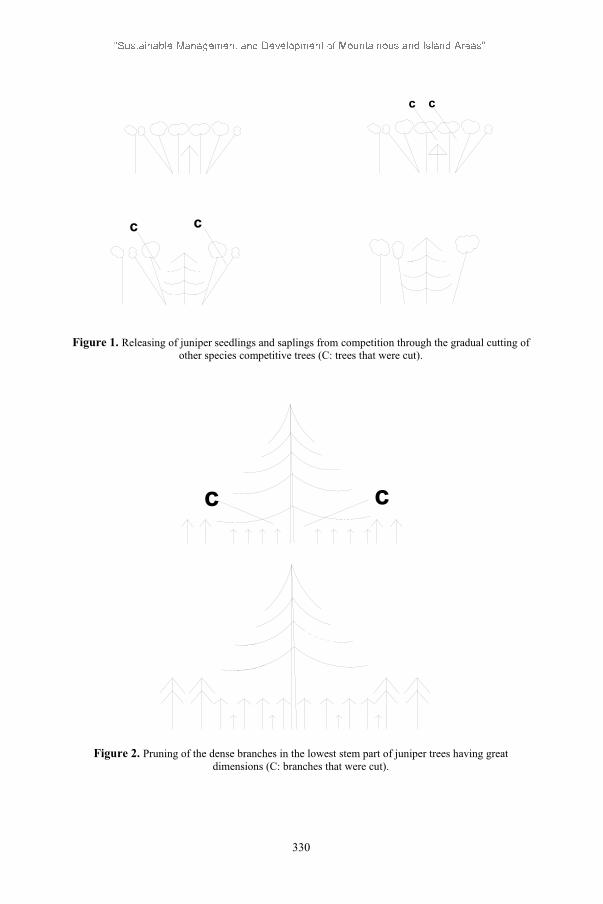
c c
Figure 1. Releasing of juniper seedlings and saplings from competition through the gradual cutting of other species competitive trees (C: trees that were cut).
Figure 2. Pruning of the dense branches in the lowest stem part of juniper trees having great dimensions (C: branches that were cut).
c c
cc
330

Figure 3. Thinnings in which the very suppressed and in any way damaged trees of the group are removed. The dense branches in the lowest stem part of some juniper trees are pruned also (C: trees or branches that were
cut).
saplings in Baluchistan failed to survive when canopy cover was removed.
c) The density of groups has to be retained to such levels so as to preserve the microhabitats (with favourable microclimate, adequate amount of nurse plant litter, improved soil conditions and high soil fertility) which are created under the J. excelsa groups throughout the whole process of thinnings.
A more positive fashion to favor and increase the participation of J. excelsa trees in stands located in the slopes of central part of Nestos valley is by planting. The planted trees can be: a) wildings of natural origin dug mainly from shaded microhabitats which are created under the J. excelsa groups, since in many cases a great regeneration density is observed in these favourable microenvironments or b) planting stock raised in nurseries from seeds collected
from the Nestos valley J. excelsa stands. These trees must be planted: a) mainly beneath other species shade (afterwards these plants will be released from competition through the gradual cutting of competitive trees) and b) only in few cases in bare ground under full light. In these environments J. excelsa natural regeneration has a competitive advantage (J. excelsa is a site insensitive species) since the conditions are not favourable for the other species regeneration due to shallow and unfertile soil.
All or a part of the abovementioned silvicultural treatments may be used, combined or even diversified in the different site type J. excelsa stands according to the specific structural conditions, since in silviculture manipulations the general usage of simplistic rules and prescriptions in all structures and stands always leads to problems and failures [6], 13].
331
“Sustainable Management and Development of Mountainous and Island Areas”

It has to be clear that our objective is not the creation of pure J. excelsa stands but the preservation and increase of juniper participation in central Nestos valley stands. As a result: a) we must not try to eliminate the other species component at J. excelsa stands and b) we have to plant J. excelsa trees in other species stands (mainly in low and medium productivity sites) in order to enhance the expansion of J. excelsa in the area.
As in all silvicultural operations only the absolutely necessary treatments must be applied in each stand, in order to keep the costs in low levels.
The benefit which will derive from the abovementioned silvicultural treatments is the preservation of a) an important component of landscape such as J. excelsa stands and b) the integrity of ecosystem diversity, which is crucial for the ecosystem stability and for the natural heritage conservation of the area.
5. References
[1] Ahmed M, Ahmed I, Anjum PI. A study of natural regeneration of Juniperus excelsa M. Bieb in Baluchistan, Pakistan. Pakistan Journal of Botany 1989; 21: 118-127.
[2] Ahmed M, Shaukat SS, Buzdar AH. Population structure and dynamics of Juniperus excelsa in Balouchistan, Pakistan. Journal of Vegetation Science 1990; 1: 271-276.
[3] Athanasiadis N. Forest botany (in Greek) Part II. Thessaloniki; 1986.
[4] Boratynski A, Browicz K, Zielinski J. Chorology of trees and shrubs in Greece. Poznan/Kornik; 1992.
[5] Carus S. Increment and growth in Crimean Juniper (Juniperus excelsa Bieb.) stands in Isparta-Sütcüler region of Turkey. Journal of Biological Sciences 2004; 4: 173-179.
[6] Dafis S. Applied Silviculture. (in Greek).Giahoudis, Giapoulis; 1989.
[7] Fisher M, Gardner AS. The status and ecology of a Juniperus excelsa subsp. polycarpos woodland in the northern mountains of Oman. Vegetatio 1995; 119: 33-51.
[8] Gardner AS, Fisher M. The distribution and status of the montane juniper woodlands of Oman. Journal of Biogeography 1996; 23: 791-803.
[9] Gauquelin T, Bertaudiére V, Montés N, Badri W, Asmode JF. Endangered stands of
thuriferous juniper in the western Mediterranean basin: ecological status, conservation and management. Biodiversity Conservation 1999; 8: 1479-1498.
[10] Kohm KA, Franklin JF, editors. Creating a Forestry for the 21st Century. The Science of Ecosystem Management.1997. Island Press; 1997.
[11] Maragos N. Management plan (in Greek) of Pascalia public forest. Forest commission of Stavroupolis; 1998.
[12] Milios E, Pipinis E, Petrou P, Akritidou S, Smiris P, Aslanidou M. Structure and regeneration patterns of the Juniperusexcelsa Bieb. stands in the central part of Nestos valley on northeast Greece. Submitted for publication in Ecological Research.
[13] Smith DM, Larson BC, Kelty MJ, Ashton PMS. The practice of silviculture, Applied Forest Ecology. New York: John Willey & Sons Inc.; 1997.
[14] Strid A, Tan K, editors. Flora Hellenica. Koeltz Scientific Books; 1997.
332

Pancratium maritimum Ecosystems in Greece
Nikopoulos Dimitrios, Nikopoulou Despina, Papadopoulou Kaliopi, Alexopoulos Alexios TEI of Kalamata TEI of Kalamata University of Thessaly TEI of Kalamata
[email protected] [email protected] [email protected] [email protected]
Abstract. Pancratium maritimum is a native plant that occurs along the sandy beaches of Greece. In 2005 - 2006, 142 P. maritimum patches of a total length of 211.8 km were reported, displaying a wide geographical distribution. At these patches other vegetation species are also present, constituting members of a particular native vegetation community. On-site research and botanic classification of the main members of the vegetation communities were conducted on 17 patches. The existence of symbiotic micro-organisms at 5 patches was also investigated. All samples that were studied (P. maritimum, Agropyrum junceum, Ammophyla arenaria, Cyperus capitatus, Crepis bulbosa, Crithmum maritimum, Eryngium maritimum) have showed mycorrhizal roots.
Keywords. Sustainability, ecosystems, Greece, mycorrhizae, Pancratium maritimum.
Introduction
The sea daffodil (Pancratium maritimum L.) has been reported to grow naturally on many sandy beaches of the Mediterranean, the Atlantic Ocean, the Black and Caspian seas [7]. At these areas there are usually other naturally grown plant species (Cakile maritima, Euphorbia sp.,Eryngium sp., Silene sp., etc.), constituting a numerous vegetation community [19]. Despite the fact that P. maritimum is widely distributed along the coastline of the Mediterranean, in recent years this plant species has been classified as threatened in France, Spain [19], Italy [1] and Turkey [14].
P. maritimum is a perennial plant which forms a large bulb (diameter up to 10 cm) and belongs to the family Amaryllidaceae [5, 6, 13]. It has great historical value for Greece where it
This study was conducted within the framework of the programme EPEAEK II: Environment - Archimedes II - Support of TEI Research Groups, which is funded by the EU and the Hellenic Ministry of Education & Religion.
has been known for at least 2500 years and is depicted on murals of Minoan buildings in Crete and Santorini as well as on the Mycenaean bronze sword, which is displayed at the Archaeological Museum of Athens [3]. This plant is mentioned by Dioskouredes as Pancration [9].
P. maritimum forms large inflorescences [13] of remarkable beauty and fragrance, which, along with the other plant species of the family Amaryllidaceae as the ones of the genera Amaryllis and Narcissus, carries particular ornamental worth and thus significant economic value. It is also of particular interest due to the ability to extract alkaloids from its bulbs, leaves or flowers [4] and flavonoids again from the bulbs [18]. Some of these substances have medicinal properties and consequently can be used for the production of medicines [4, 18].
The sandy coastal areas, at which the P.maritimum occurs, are characterised by low content of organic matter and nutritional substances, high salinity and low water retention. These characteristics create an unfavourable environment for plants. However, the presence of symbiotic micro-organisms (nitrogen fixation bacteria and mycorrhizae) contributes determinedly to the survival and growth of this plant species [10, 2].
Plants do not grow alone. From the moment roots develop in soil, they are penetrated and colonized extensively by filamentous fungi in "fungus-root" associations called mycorrhizae. These associations are "mutualistic" in that both host and fungus benefit. The plant receives inorganic nutrients and water from fungal hyphae foraging far beyond the root zone. The fungus, in turn, obtains a steady supply of carbon and energy directly from the plant with a minimal competition from other soil microbes. The at least 400 million years ago origin of mycorrhizae indicates that they are critical to the growth and reproduction of both plant and fungus. As a result of coevolution, mycorrhizae are found in most habitats worldwide and in approximately 95% of all plant species [11]. The diagnostic feature of arbuscular mycorrhizae
333
“Sustainable Management and Development of Mountainous and Island Areas”

(AM) is the development of a highly branched arbuscule within root cortical cells. Other structures produced by some AM fungi include vesicles, auxiliary cells, and asexual spores. Vesicles are thin-walled, lipid-filled structures that usually form in intercellular spaces. Auxiliary cells are formed in the soil and can be coiled or knobby. Spores produced by fungi forming AM associations are asexual, formed by the differentiation of vegetative hyphae [16].
The aim of the present study is to locate and record the P. maritimum patches in Greece, to detect and identify the main plant species that take part in the ecosystems of P. maritimum and,to explore the presence of symbiotic micro-organisms.
Root samples of Leguminosae (Medicago marina and Medicago littoralis) were collected of Methoni patch. The nitrogen-fixing bacteria on the root nodules had been taken for further investigation (through molecular analysis).
Materials and Methods
The identification and recording of the P. maritimum patches were conducted in two ways: 1. on-site research by a research team at a large number of locations in Greece, 2. consultation and validation of information with local organizations and services.
For a P. maritimum patch to be considered for recording, 200 m2 in area and minimum density of 1 plant per 10 m2 were required. The data recorded for each patch were the following: geographical location, name of location, existence of sand dunes, orientation, length, minimum and maximum width. Data recording and botanic classification of plant species [9, 17, 15] were conducted at 17 patches, which are geographically distributed in the Dodecanesa (Rhodes: Aphadou, Tsambika-Kolimbia), Cyclades (Naxos: Agios Georgios-Stellida, Agia Anna-Malaga, Nisides-Hora Naxos; Tinos: Agios Ioannis-Porto), the Peloponnesus (Messinia: Lambes-Methoni, Finikounda, Petrochori - Pylia; Lakonia: Elos, Skala, Panagia-Elafonissos, Simos-Elafonissos,
The samples were cleared and stained according to INVAM method as follows.
The roots were cleared (removing cytoplasmic contents from cells) using hot solution of 10% KOH. 10-20 samples were usually processed at a time. Incubation time varied according to thickness and fragility of roots and three time periods of 20, 25 and 30 minutes were used. The same procedure described above to clear roots was carried out again, only with a solution of 0.036% chlorazol black E.
The stain was prepared by mixing water, glycerine, and lactic acid in proportions of 1:1:1 (v/v/v). Incubation time varied, from 30 minutes to 2 hours. The incubator was fixed at 90oC. The stain was poured into another container and was used three times after filtration through cheesecloth. The roots were then rinsed under tap water for 5 min. For long-term storage of stained roots, they were placed in screw-top glass tubes containing a water-glycerine mix (2:1 v/v) with 1-2 drops of 0.1% sodium azide [8].
The mycorrhizal roots were photographically documented through a Leica Microscope with zoom range 2.5-100x. Special effort was acquainted in order endomycorrhizal organs as arbuscules, vesicles, spores, seeds, auxiliary cells, coils and intraradical hyphae, to be documented.
Results and Discussion
P. maritimum patches (Table 1) are widely distributed at insular areas of Greece and the Peloponnesus. Most P. maritimum patches (a percentage of 74.65%) are coastal areas without sand dunes.
Most patches located at sand dunes were found mainly in Cyclades, Crete and Peloponnesus (Table 2). The orientation of patches varies from location to location: extensive patches oriented towards the South (Messinia), the East (Rhodes), the West (Ilia) and the North (Lefkada) were observed (Table 2).
Elikas-Neapolis, Plytras; Ilia: Kaiafas) and the Ionian Islands (Lefkada: Gyra).
Root samples of P. maritimum, Cyperuscapitatus, Agropyrum junceum, Crepis bulbosa Crythmon maritimum and Eryngium maritimum, were extirpated from five locations: Aphadou (Rhodes), Gyra (Lefkada), Elos (Lakonia),
334
“Sustainable Management and Development of Mountainous and Island Areas”

Table 1. Distribution of P. maritimum patches in Greece. Geographical
AreaPrefectures-
Islands Localties
Thrace Xanthi Erasmiou Maganon Myrodato Nestos Macedonia Halkidiki Azapiko Thessaly Magnisia Potistika Kastri
Kaiafas Pyrgos Spiantza Sarakina Letrina Kyani akti Kavouri Katakolo Ilia Agios Ilias Thines Arkoudi Kylini
Messinia Finikounda Lambes (Methoni) Petrochori (Pylia) Elos Kyani akti Simos (Elafonissos) Skala Plytra (Molai) Elykas (Neapolis) Kalami-xidia (Monembasia) Leimonas
Peloponnesus
LakoniaPanagia (Elafonissos)
Kefalonia Megalaco Minies Corfu Limnothalassa Korision Glyfada
Kalamaki Dafni Gerakas Alykes Zakynthos Vasilikos Ionia Islands
Lefkada Gyra Plakias Agia Galini Triopetra Comniana Rethimno Agios Pavlos Platanias - Stauromenos Georgioupoli – Episkopi Rodakino Pahia ammos Xerokampos Ierapetra Agia Fotia Lasithi Ferma Koutsounari Graligia Gaidouronisi Falasarna Pahia ammos Mauro Mogo Balos Kolimbari Malaimai Agia Marina Gerani
Crete
HaniaStauros Agria Grambousa Elafonissi Platanias
Karpathos Vronti Afoti Kos Tigaki Nisyros Pali Kipi Dodecanesa
Rhodos Aphadou Tsambika-Kolimbia Faliraki I Faliraki II Milos Plasena Deka Sarackniko Kimolos Bonatsas Serifos Vagias Sikaminias Psyli ammos Sifnos Kamares Vathi Kythnos Flambouria I Flambouria II Styphos Syros Agathopes Famprika Andros Agios Petros Kea Agios Georgios Otzias Gyaliskari
Xrysi akti Tsardaki Cryos Santa Maria Paros Limnes (Plastira) Platia Ammos Ftelia Kalo livadi Panormos Paraga Myconos Corfos
Samos Psyli ammos Potokaci Cambos Ios Maganari Kalamo Plakes Naxos Agios Georgios - Stellida Nisides (Hora Naxos) Agia Anna (Malaga) Tinos Agios Ioannis (Porto) Agiou Romanou
Cyclades
Santorini Perissa Skyros Molos Magazia Skopelos Arminopetra Sporades Skiathos Koukoynaries Mantraki Agistros Mytilini Vatera Skala (Eresos) Halatses Tarti Psara Limnos Archontiki Hios Avlonia Agia Dynami Potami Komi
Kalliopi (Ceros) Kontopouli (Meftina) Kontopouli (Saravari) Havouli
North and East Aegean Islands
Limnos Fanaraki Skandali Portiano
The total length of the 142 P. maritimum patches which were recorded reaches 211.8 km (Table 3). The mean length of the patches is estimated at 1.491 km. The lowest mean value was observed in the Cyclades (0.89 km) and the highest in the Peloponnesus (3.083 km). It is worth noting that the length of patches varies greatly, ranging from 20 m to 5000 m while their width ranges from 1m to 500 m (Table 3). The smallest patch was located at Lakonia with an area of 200 m2 and the largest at Ilia with an
Table 4 refers to the 17 patches from which data were recorded in relation to the main members of the vegetation community, their dimensions and orientation as well as to the existence of sand dunes.
Table 5 presents the main plant species that were detected at the 17 P. maritimum patches.
Kaiafas (Ilia) and Finikounda (Messinia).
335
“Sustainable Management and Development of Mountainous and Island Areas”

area of 30000 m2.
Table 2. Concise presentation of characteristics of P. maritimum patches according to the geographical areas of Greece.
Sund-dunes OrientationGeographical Area Number
of patches not with - E-S S S-W W W-N
Thrace 4 4 - - - - - 4 - - - Macedonia 1 1 - - - - - 1 - - - Epirus * - - - - - - - - - - Thessaly 2 2 - - - 2 - - - - - Greek Mainland, Euboea * - - - - - - - - - - Peloponnesus 24 18 6 - - - - 10 - 14 - Ionia Islands 10 4 6 1 1 - 4 - - 2 2 Crete 28 20 8 12 - - - 14 - 2 - Dodecanesa 9 7 2 2 1 4 2 - - - - Cyclades 41 35 6 10 3 3 6 4 6 7 2 Sporades 6 4 2 1 - 1 - - 1 1 2 North and East Aegean Islands 17 11 6 - - 2 5 5 3 2 - Greece (total) 142 106 36 26 5 12 17 38 10 28 6
* not located
Table 3. Size characteristics of P. maritimum patches in Greece. Geographical
Area Number of
patches Total length
(m) Mean length
(m) Minimum length (m)
Maximum length (m)
Minimum width (m)
Maximum width (m)
Thrace 4 6,500 1,625 50 2,000 20 50 Macedonia 1 1,000 1,000 1,000 1,000 30 60 Thessaly 2 2,000 1,000 500 1,500 30 50 Peloponnesus 24 74,000 3,083 20 5,000 5 100 Ionia Islands 10 12,200 1,220 200 3,000 20 100 Crete 28 40,000 1,428 200 5,000 20 500 Dodecanesa 9 11,200 1,244 50 4,000 10 100 Cyclades 41 36,500 890 50 3,500 1 200 Sporades 6 6,400 1,067 500 2,000 20 500 North and East Aegean Islands
17 22,000 1,294 25 3,000 10 100
Greece (total) 142 211,800 1,491 20 5,000 1 500
Table 4. Dimensions, sand-dunes presence and orientation of P. maritimum patches visited in 2005-6 in Greece.
Patch dimensions GeographicalArea
Prefectures- Islands
Patches Mean length
(m) Mean width
(m)
sand-dunes presence
Patch orientation
Lambes (Methoni) 200 50 not S Finikounda 1,500 120 yes S Messinia Petrochori (Pylia) 500 80 yes W Elos 2,000 90 yes S Scala 200 70 yes S Panagia (Elafonissos) 500 40 yes W Simos (Elafonissos) 1,500 120 yes S Elikas (Neapolis) 1,200 15 not S
Lakonia
Plytra 300 40 not S
Peloponnesus
Ilia Kaiafas 5,000 80 yes W Aphadou 4,000 60 not E
Dodecanesa Rhodes Tsambika-Kolimbia 1,000 30 not E Ionia Islands Lefkada Gyra 1,200 80 yes N
Agios Georgios-Stellida 3,500 120 yes W Agia Anna (Malaga) 1,200 20 not S Cyclades Naxos Nisides (Hora Naxos) 1,000 100 yes N, E
Cyclades Tinos Agios Ioannis (Porto) 500 70 not S
336
“Sustainable Management and Development of Mountainous and Island Areas”
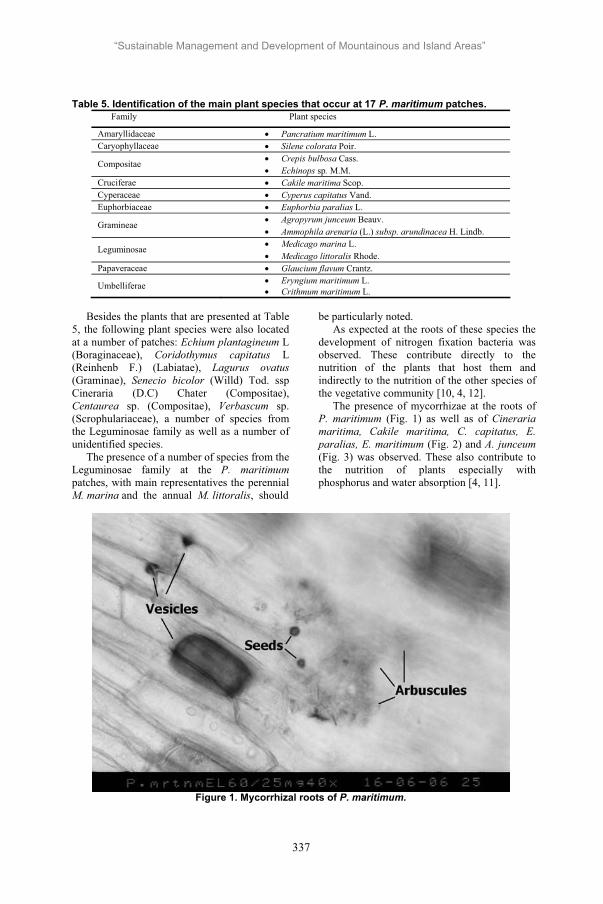
Table 5. Identification of the main plant species that occur at 17 P. maritimum patches. Family Plant species
Amaryllidaceae Pancratium maritimum L.Caryophyllaceae Silene colorata Poir.
Crepis bulbosa Cass.CompositaeEchinops sp. . .
Cruciferae Cakile maritima Scop. Cyperaceae Cyperus capitatus Vand.Euphorbiaceae Euphorbia paralias L.
Agropyrum junceum Beauv.GramineaeAmmophila arenaria (L.) subsp. arundinacea H. Lindb.Medicago marina L.LeguminosaeMedicago littoralis Rhode.
Papaveraceae Glaucium flavum Crantz.
Umbelliferae Eryngium maritimum L.Crithmum maritimum L.
Besides the plants that are presented at Table 5, the following plant species were also located at a number of patches: Echium plantagineum L(Boraginaceae), Coridothymus capitatus L(Reinhenb F.) (Labiatae), Lagurus ovatus(Graminae), Senecio bicolor (Willd) Tod. ssp Cineraria (D.C) Chater (Compositae), Centaurea sp. (Compositae), Verbascum sp. (Scrophulariaceae), a number of species from the Leguminosae family as well as a number of unidentified species.
The presence of a number of species from the Leguminosae family at the P. maritimum patches, with main representatives the perennial M. marina and the annual M. littoralis, should
be particularly noted. As expected at the roots of these species the
development of nitrogen fixation bacteria was observed. These contribute directly to the nutrition of the plants that host them and indirectly to the nutrition of the other species of the vegetative community [10, 4, 12].
The presence of mycorrhizae at the roots of P. maritimum (Fig. 1) as well as of Cinerariamaritima, Cakile maritima, C. capitatus, E. paralias, E. maritimum (Fig. 2) and A. junceum(Fig. 3) was observed. These also contribute to the nutrition of plants especially with phosphorus and water absorption [4, 11].
Figure 1. Mycorrhizal roots of P. maritimum.
337
“Sustainable Management and Development of Mountainous and Island Areas”

Figure 2. Mycorrhizal roots of Eryngium maritimum.
Figure 3. Mycorrhizal roots of Agropyrum junceum.
338
“Sustainable Management and Development of Mountainous and Island Areas”

Conclusions
An ecosystem consists of a community of organisms that lives in a specific environment and the natural elements in that environment with which organisms interact. Specifically, the P.maritimum ecosystems develop in highly adverse conditions, i.e., sandy and littoral and are comprised of a significant number of plant species and micro-organisms of particular interest, namely, nitrogen fixation bacteria and mycorrhizae. The study of the symbiotic relation between the plant species and the micro-organisms in such ecosystems may bring about invaluable findings with potential use in a sustainable agriculture and especially in a potential growth of plants in adverse environments. Besides the above, these ecosystems contribute significantly towards the conservation of the native biodiversity of Greece and could be considered as a natural resource for the local communities, people and the country in general.
The distribution of the P. maritimum ecosystems along sandy coasts of a total length of only 211.8 km, as well as the adversities to locate patches at large geographical areas of Greece (Epirus, Greek Mainland, Attica and Euboea) which have a large number of extended sandy coasts suggest that this plant species is encountering difficulties to survive and will eventually become scarce as is the case in other Mediterranean countries (France, Spain, Italy, Turkey) [19, 1, 14].
On site research at P. maritimum patches and subsequent consultation with local organizations and services indicate that human intervention, namely, tourism development of littoral areas, the use of machinery to clean beaches, high volume traffic, urbanization, picking flowers and removing plants and, the overgrazing of animals which feed on the green pods and leaves of P. maritimum are risk factors for the conservation of P. maritimum patches. At this point, it should be mentioned that the presence of certain herbivorous wild animals, such as wild rabbits at the island of Naxos and hares and turtles at the island of Elafonissos, seems not to disturb the growth and reproduction of P. maritimum and hence not to hinder the conservation of these ecosystems.
Excessive tourism and urban development of littoral areas in Greece can be expected to limit and potentially constitute as extinct a large number of P. maritimum ecosystems, which have resulted from a long-term evolutionary process. For this
last reason it seems necessary measures that either control or prohibit certain human activities that pose a risk to these ecosystems are taken. Such measures could be the participation in environmental protection programmes such as Natura 2000 in which the Municipalities of Methoni in Messinia and Zacharo in Ilia are already participating. More importantly, though, it is through the initiative of local communities towards the sustainable development of local areas and communities that would protect such ecosystems.
References
[1] Balestri E, Cinelli F. Germination and early-seedling establishment capacity of Pancratium maritimum L. (Amaryllidaceae) on coastal dunes in the north-western Mediterranean. Journal of Coastal Research 2004; 20: 761-70.
[2] Basha MG, Vivekanandan M. Potency of rhizobial strains from different environments to increase economic productivity in some legumes. Philippine Journal of Science 2000; 129(2): 131-4.
[3] Baumann . Greek Wild Flowers and Plant Lore in Ancient Greece. London: Herbert Press; 1996.
[4] Berkov S, Evstatieva L, Popov S. Alkaloids in Bulgarian Pancratium maritimum L. Zeitschrift fur Naturforschung C-A Journal of Biosciences 2004; 59: 65-9.
[5] Blamey M, Grey-Wilson C. Mediterranean Wild Flowers. Great Britain: Haper Colins; 1993.
[6] Bryan JE. Bulbs Vol 1. Portland: Timber Press Inc; 1989.
[7] Dothan NF. Flora Palaestina vol. 4. Jerusalem: Israel Academy of Sciences and Humanity; 1986.
[8] http://invam.caf.wvu.edu/methods/my corrhizae/staining.htm [23/09/2004]
[9] Kavvadas D. Botanical Plant Dictionary. Athens: Press; 1956.
[10] Kumar R, Gupta PP, Jalali BL. Impact of VA-mycorrhiza, Azotobacter and Rhizobium on growth and nutrition of cowpea. Journal of Mycology and Plant Pathology 2001; 31: 38-41.
[11] Morton JB. Mycorrhizae. In: McGraw-Hill, editor. Yearbook of Science and Technology. New York: McGraw - Hill Co; 1997. p. 324-7.
339
“Sustainable Management and Development of Mountainous and Island Areas”

[12] Ohwada T, Sasaki Y, Koike H. Igawa K, Sato T. Corrwlation between NaCl sensitivity of Rhizobium bacteria and ineffective nodulation of leguminous plants. Bioscience, Biotechnology and Biochemistry 1998; 62: 2086-90.
[13] Polunin O, Huxley A. Flowers of the Mediterranean. London: Chato and Windus; 1994 [14] Senel G, Ozkan M, Kandemir N. A karyological investigation on some rare and endangered species of Amaryllidaceae in Turkey. Pakistan Journal of Botany 2002; 34: 229-35.
[14] Senel G, Ozkan M, Kandemir N. A karyological investigation on some rare and endangered species of Amaryllidaceae in Turkey. Pakistan Journal of Botany 2002; 34: 229-35.
[15] Stefanaki-Nikiforaki M. Systenatic Botany -Klides Vol . Athens: Stamoulis Press; 1999.
[16] Shi ZY, Feng G, Christle P, Li XL. Arbuscular mycorrhizal status of spring ephemerals in the desert ecosystem of Junggar Basin, China. Mycorrhiza 2006; 16: 267-75.
[17] urland NJ, Chilton L, Press JR. Flora Europea Vols I-V. Cambridge: Cambridge University Press; 1993.
[18] Youssef DTA, Ramadan MA, Khalifa AA. Acetophenones, a chalcone, a chromone and flavonoids from Pancratium maririmum.Phytochemistry 1998; 49: 2579-83.
[19] Zachreddine H, Clubbe C, Baalbaki R, Ghalayini A, Talhouk SN. Status of native species in threatened Mediterranean habitats: the case of Pancratium maritimum L. (sea daffodil) in Lebanon. Biological Conservation 2004; 120: 11-8.
340
“Sustainable Management and Development of Mountainous and Island Areas”


