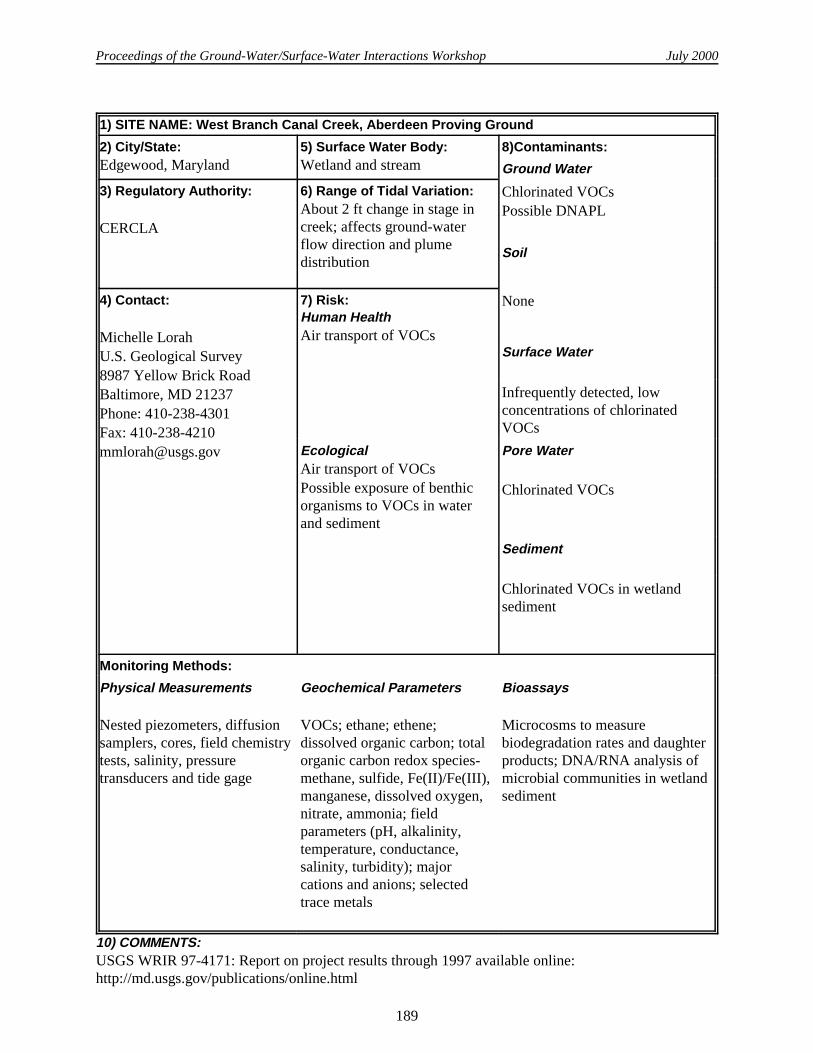
United States Environmental Protection Agency Solid Waste and Emergency Response Washington, DC 20460 (5102G) EPA/542/R-00/007 July 2000 www.epa.gov www.clu-in.org Proceedings of the Ground-Water/ Surface-Water Interactions Workshop
Transcript
����
����
�������
�����
��
��
����
����
���
���
����
���������
����
���
United StatesEnvironmental ProtectionAgency
Solid Waste andEmergency ResponseWashington, DC 20460(5102G)
Use of Multi-Parameter Sensitivity Analysis to Determine Relative Importance of ProcessesInvolved in Transport of Mining ContaminantsJungyill Choi, Judson W. Harvey, and Martha H. Conklin . . . . . . . . . . . . . . . . . . . . . . . . . . 69
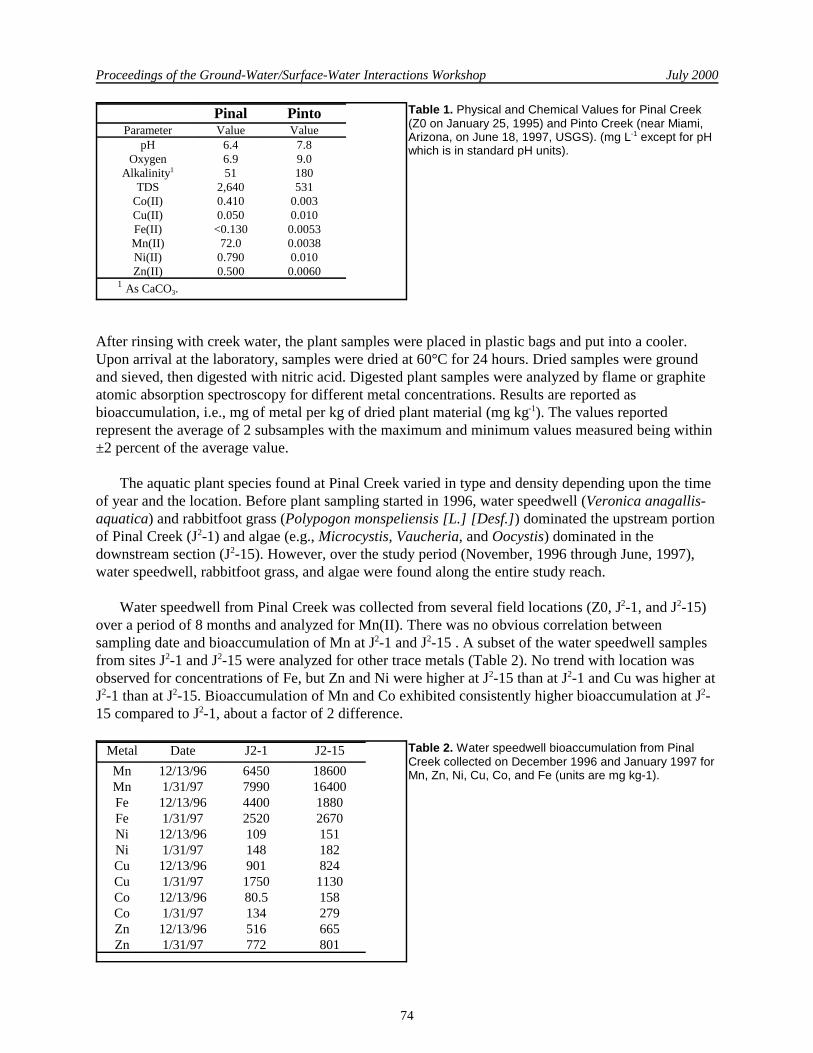
Measurements of Plant and Algal Bioaccumulation of Metals in Pinal and Pinto Creeks, ArizonaJustin C. Marble, Timothy L. Corley, and Martha H. Conklin . . . . . . . . . . . . . . . . . . . . . . . 73
Tracing Groundwater Flow into Surface Waters by Application of Natural and Artificial TracersD. Reide Corbett, William Burnett, Jeffrey Chanton, and Kevin Dillon . . . . . . . . . . . . . . . . 77
Considerations for Calculating the Mass Loading of Metal Contaminants to a MarineEmbayment: ASARCO Superfund Site, Tacoma, WAGayle Garman and ASARCO Sediments/Groundwater Task Force . . . . . . . . . . . . . . . . . . . 81
The Interaction of Ground Water and Surface Water within Fall Chinook Salmon SpawningAreas in the Hanford Reach of the Columbia RiverDavid R. Geist . . . . . . . . . . . . . . . . . . . . . . . . . . . . . . . . . . . . . . . . . . . . . . . . . . . . . . . . . . . . 95
Integrated Acoustic Mapping of Surface Waters: Implications for Ground-Water/Surface-WaterLinkagesChad P. Gubala, Ullrich Krull, Joseph M. Eilers, Mike Montoya, and Jeff Condiotty . . . . . 99
Delineation of VOC-Contaminated Groundwater Discharge Zone, St. Joseph River, Elkhart,IndianaJohn H. Guswa, Jonathan R. Bridge, and Michael J. Jordan . . . . . . . . . . . . . . . . . . . . . . . . 100
Measuring Enhanced Removal of Dissolved Contaminants in Hyporheic Zones andCharacterizing Causes and Consequences for Water QualityJudson W. Harvey, Christopher C. Fuller, and Martha H. Conklin . . . . . . . . . . . . . . . . . . . 103
Factors Controlling Hyporheic Exchange in a Southern Ontario Stream: Modeling Riffle-ScalePatterns in Three Dimensions Using MODFLOW R.G. Storey, D.D. Williams, and K.W.F. Howard . . . . . . . . . . . . . . . . . . . . . . . . . . . . . . . . 148
Solute and Solid Phase Relationships in the Surface Hyporheic Zone of a Metal ContaminatedStream, Silver Bow Creek, MTJohnnie N. Moore and William W. Woessner . . . . . . . . . . . . . . . . . . . . . . . . . . . . . . . . . . . 151
Proceedings of the Ground-Water/Surface-Water Interactions Workshop July 2000
1
EXECUTIVE SUMMARY
Proceedings of the Ground-Water/Surface-Water Interactions Workshop July 2000
1 In these proceedings, the authors may use terms other than “ground-water/surface-water transition zone” toindicate this zone of transition. These terms may be equivalent (e.g., ground-water/surface water interface) or morerestrictive (e.g., hyporheic zone, which refers to the interface between ground water and lotic (moving) surfacewaters.)2 The Ecological Risk Assessment Forum and Ground Water Forum comprise ecological risk assessment andground-water specialists, respectively, from EPA’s Regional Offices, Headquarters, and Office of Research andDevelopment. These forums help the EPA maintain consistency and develop national program guidance.
2
INTRODUCTION
Although ground water and surface water are usually evaluated as separate water masses, they areconnected by the ground-water/surface-water transition zone1 in a hydrologic continuum.Understanding contaminant fate and transport in this zone is important to the U.S. EnvironmentalProtection Agency’s (EPA’s) hazardous waste site cleanup programs across the nation because about75% of RCRA and Superfund sites are located within a half mile of a surface water body, and almosthalf of all Superfund sites have impacted surface water. Investigations of ground water and surfacewater need to be integrated and incorporate recent advances in investigative techniques.
Ecological risk assessments for surface water bodies have all too often focused on the watercolumn (where the ground-water contaminant plumes become extremely diluted), or on the sediments.Typically there has been little or no evaluation of contaminated ground-water discharges. Impacts fromthe discharge of contaminated ground water on the transition zone ecosystem have been ignored, eventhough this ecosystem provides important ecological services and is the most exposed to ground-watercontaminants. Based on these considerations, the need to evaluate the transition zone is clear.
To address the technical concerns related to ecological impacts in the transition zone, the EPA’sOffice of Solid Waste and Emergency Response (OSWER) sponsored a workshop in January 1999,which was planned jointly by the Ecological Risk Assessment Forum and the Ground Water Forum.2
The workshop was organized around answering two fundamental questions:
• How important is the transition zone ecologically?
• How can we measure hydrogeological, chemical, and biological conditions and changes in thiszone?
There was a consensus among workshop participants that protecting this zone is important, andthat there is a need for studies by interdisciplinary teams to ensure that valid data are obtained from thecorrect locations and at the right times so that valid conclusions are reached. Both forums plan to usethe workshop information to submit research recommendations to EPA’s Office of Research andDevelopment, develop a list of suggested tools for investigating hydrogeological fate and transport andecological effects at contaminated sites, develop Agency guidance, and conduct a pilot study using thismethodology. The workshop and these proceedings provide a first step to understanding thefundamentals of evaluating the effects of contaminated ground water discharging through the transitionzone.
WORKSHOP GOALS
The overall goal of the workshop was to provide an opportunity for individuals from variousscientific and technical backgrounds to discuss the importance of the ground-water/surface-watertransition zone and help regulators better understand environmental issues relating to the connections
Proceedings of the Ground-Water/Surface-Water Interactions Workshop July 2000
3
between ground water and surface water. Within this broad goal, the Ecological Risk AssessmentForum and Ground Water Forum had the following additional specific goals:
Ecological Risk Assessment Forum Goals: • Develop a conceptual model for use in ecological risk assessment at sites where contaminated
ground water discharges to surface water. • Integrate structural, functional, and hydrogeological components and methods for evaluating
changes to the ecosystem.
Ground Water Forum Goals: • Increase awareness of new tools used to evaluate fate and transport within the transition zone. • Identify and understand geological, hydrological, and chemical factors that might influence
transition zone dynamics.
WORKSHOP DESIGN
A planning committee from the two forums designed the workshop to promote multidisciplinaryinteraction on a set of focus issues and questions. The workshop included invited platform speakers, aposter session, discussion groups, and an overall report-out from the groups and subsequent discussion.This approach worked well, resulting in fairly uniform agreement on concepts and recommendationsregarding integration and use of investigatory tools.
Multidisciplinary Approach
Invited workshop participants included ecologists, geochemists, and hydrogeologists who workwith the ground-water/surface-water transition zone (Appendix A).
Conceptual Model
A draft illustration of the conceptual model representing the forums’ current understanding ofground-water/surface-water interactions for a river was presented and explained at the beginning of theworkshop. The participants were asked to review the conceptual model and improve it as greaterunderstanding was gained during the course of the workshop. Workshop participants also identified butdid not address the need for research into other transition zone environments, such as those for lakes,estuaries, and wetlands.
Platform Speakers
The planning committee invited seven platform speakers to present topics representing a cross-section of information on ground-water/surface-water interactions; the presentations helped workshopparticipants address focus issues and questions in subsequent discussion groups. The abstracts of thespeakers’ presentations are included in this report:
• A Federal Statutory/Regulatory/Policy Perspective on Remedial Decision-making with Respect toGround-Water/Surface Water Interaction (Guy Tomassoni, EPA’s Office of Solid Waste)
• Interaction of Ground Water and Surface Water (Tom Winter, U.S. Geological Survey)
• Hydrogeology and Biogeochemistry of the Surface Water and Ground Water Interface of aMountain Stream (Cliff Dahm, University of New Mexico)
Proceedings of the Ground-Water/Surface-Water Interactions Workshop July 2000
4
• Ground-Water Plume Behavior Near the Ground-Water/Surface-Water Interface of a River(Brewster Conant, University of Waterloo)
• Assessment Approaches and Issues in Ecological Characterizations (Allen Burton, Wright StateUniversity),
• Delineation, Quantification, and Mitigation of Discharging Plumes (David Lee , AECL ChalkRiver, Ontario), and
• Field Technology and Ecological Characterization of the Hyporheic Zone (Dudley Williams,University of Toronto)
Poster Session
A poster session during the workshop allowed related papers to be presented outside of the formaldiscussion agenda. Abstracts of the posters are included in this report.
Discussion Groups
The topics of the three discussion groups were hydrogeology, chemistry, and biology as they relateto ground-water/surface-water interactions. Three of the platform speakers, Tom Winter, Allen Burton,and Cliff Dahm, and three members of EPA, Joseph Dlugosz, Ned Black, and Bruce Duncan, served asdiscussion group co-chairs to guide discussions along the focus issues listed in Appendix B. To focusthe discussions further, participants were asked to consider first the scenario of ground waterdischarging to a river.
Each workshop participant was assigned to two of the three discussion groups, and each group wasorganized with a balance of hydrogeologists, geochemists, ecologists, and microbiologists to encouragedialogue among people with different academic backgrounds. When the groups rotated for theafternoon session, the co-chairs remained to provide continuity and briefly explain what the morningsession had covered. Some of the focus group issues were not fully addressed due to lack ofinformation or time, however. Discussion group summaries are included in this report.
Report Out and Overall Discussion
The information from the three discussion groups was summarized by the co-chairs and presentedto all of the participants at the close of the workshop. This in turn led to a general group discussion oftopics and future needs for research.
WORKSHOP RESULTS
The workshop brought together representatives from a variety of technical disciplines to focus onthe ground-water/surface-water transition zone. Chemists, microbiologists, hydrogeologists, andecologists from EPA, the U.S. Geological Survey (USGS), the National Oceanic and AtmosphericAdministration (NOAA), state environmental agencies, other government agencies, academia, andindustry discussed the hydrological, chemical, and biological processes that occur in this transitionzone and how to measure and interpret changes in these processes. Discussions highlighted the need torevise the existing conceptual model for ecological risk assessment to evaluate the important structuraland functional aspects of the transition zone. Information was provided about many tools used to
Proceedings of the Ground-Water/Surface-Water Interactions Workshop July 2000
5
evaluate the hydrological, chemical, and ecological aspects of this zone and the spatial and temporalscales at which measurements are needed.
The following is a summary of the key points drawn from the presentations by platform speakers,discussion group dialogues, and revisions to the conceptual model.
Platform Speakers
While providing a common multidisciplinary focus on transition zones, the speakers emphasizedthe following facets of transition zone hydrogeology, chemistry, and ecology:
• Physiography and climate affect the interaction of ground water and surface water across diverselandscapes. For example, movement of water through the transition zone is influenced by theposition of surface water bodies within ground-water flow systems, small-scale geologic featuresbeneath surface water, climate, and hyporheic exchange (the exchange of moving surface waterwith ground water). These seemingly diverse systems may be studied, analyzed, and managedunder a unifying framework based on “hydrologic landscapes.” Transition zones are particularlyimportant ecologically because they store and retain nutrients (and potentially contaminants),transform compounds biologically and chemically, provide refuge to benthic invertebrates, and area base of the aquatic food web. Virtually no research has been conducted on the effects ofcontaminants on hyporheic communities. Research should evaluate indigenous microbial activity,organic matter/nutrient cycling, invertebrate community indices, tissue residues of dominantspecies, in situ toxicity, and in situ physicochemical profiles. Very site-specific research couldinclude novel tools such as ecological food web modeling, semi-permeable membrane devices toevaluate bioaccumulation, toxicity identification evaluations to determine the classes of chemicals(e.g., metals or organic compounds) responsible for observed toxicity, and identification andevaluation of in situ stressors including physical stressors (e.g., flow or suspended solids). It alsowill be critical to establish appropriate uncontaminated reference sites for comparison withcontaminated sites.
• The hydrogeology of the ground-water/surface-water transition zone strongly influences the spatialand temporal distribution of both aerobic and anaerobic microbial processes as well as thechemical form and concentration of nutrients, trace metals, and contaminants in surface andground waters. Major hydrologic events such as spring snowmelt affect biochemical components.Studies that integrate hydrogeology, biogeochemistry, and aquatic ecology are needed tounderstand fully the dynamics and importance of the transition zone.
• Determining the location and magnitude of contaminant discharges to surface waters from ground-water plumes is a complex hydrogeological and biogeochemical problem. Although measurementsof hydraulic gradient may be sufficient to delineate large discharge areas, numerous seepagestudies have shown that areas of significant discharge can be small and easily missed. Even inrelatively homogeneous terrain, flows may be highly focused at shorelines, and solute transportmay be rapid. Geochemical conditions and contaminant concentrations may change drasticallyover intervals of a few centimeters. Closely spaced measurements can be used to determinecontaminant concentrations in and flux from the streambed and to distinguish areas of highattenuation from areas of poor attenuation (e.g., sand stringers, interconnected zones of higherpermeability, or other preferential flow paths).
• Physical and numerical model studies, like seepage studies, indicate surface-water head differencesof a few centimeters between riffles, and pools in streams can produce surface-water exchange
Proceedings of the Ground-Water/Surface-Water Interactions Workshop July 2000
6
flows within permeable alluvial sediments despite net discharge of ground water to the stream.Modeling can be used to reveal interactions between surface water and ground water that areoverlooked by larger scale models but have important chemical and biological consequences forthe ground-water systems, the stream, and the biota.
Discussion Group Summaries
Each discussion group agreed on the importance of the ground-water/surface-water transition zoneand emphasized the need for multidisciplinary approaches to evaluating fate, transport, and effects ofcontaminants in this zone. The main differences among the groups were in discussion of the tools usedby each discipline.
Hydrogeology
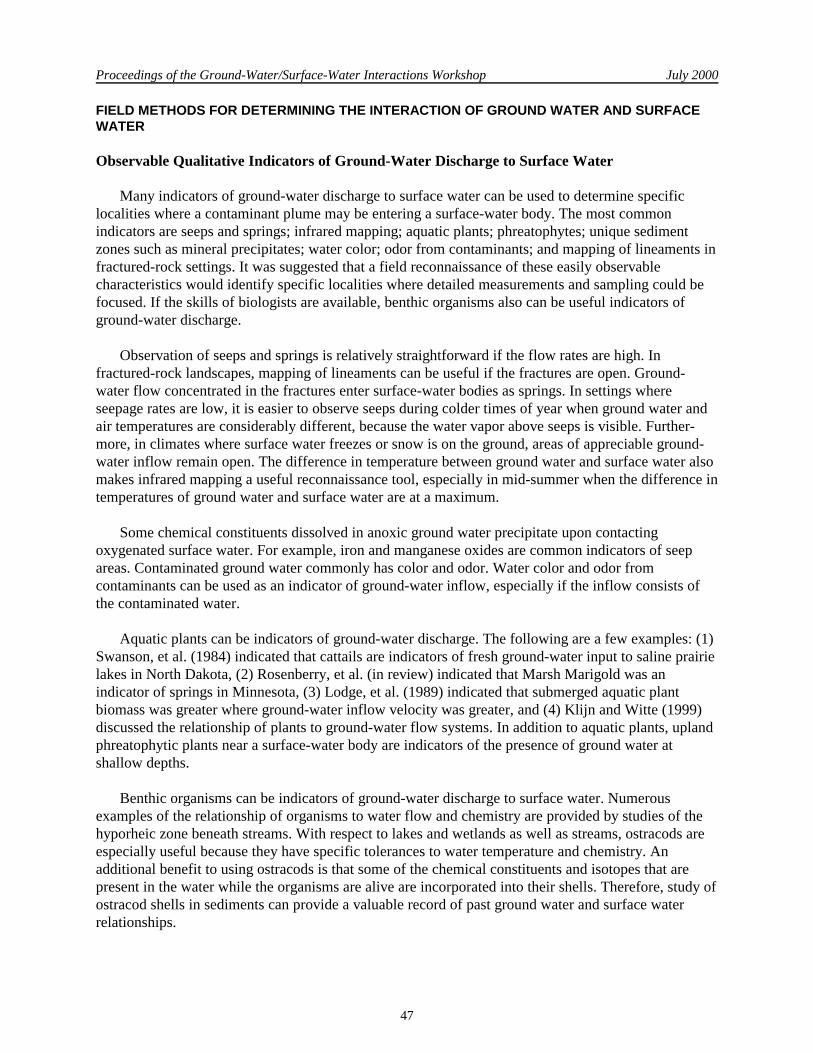
The hydrogeology discussion group focused on using a tiered approach to determine the movementof ground water to surface water. The group recommended starting with a general reconnaissance ofobservable indicators of ground-water discharge and evolve to very detailed and focused sampling ofhydraulics, chemistry, and biology. They recommended the following tiers:
• Use field methods that indicate ground-water discharge to surface water either indirectly (byobservations of qualitative indicators or by chemical data) or directly (by using physical data todirectly measure stage and calculate flow).
• Collect ground-water and surface-water samples over time and during different flow conditions.
• Adjust the field sampling strategy to account for different hydrologic landscapes.
The hydrogeology discussion group also suggested using a generic field design for investigatingthe ground-water/surface-water transition zone that includes use of piezometer nests, wells screenedacross the water table, and devices to measure or calculate the flow of water and chemicals through thetransition zone. To address the interaction of ground water and surface water, the larger-scale (relativeposition of the surface water body within the ground-water flow system) hydrogeologic landscapeprocesses and the smaller-scale (transition zone) processes should be evaluated.
The group recommended selecting field demonstration sites for research of ground-water/surface-water interaction in different geographic regimes that account for variation in hydrogeologiclandscapes and climate. The design and effectiveness of site-characterization methods should be testedand evaluated, and based on the results, the conceptual model and tools for ground-water/surface-watertransition zone characterization should be improved.
Chemistry
The chemistry discussion group emphasized that chemical information is used to evaluatecontaminant chemistry and fate, biological processes, and flow paths. The group recommended thefollowing:
• Develop initial estimates of actual or potential risks to receptors. Collect information on sitegeochemistry and contaminant flow paths—although this might be deferred until after an initialevaluation.
Proceedings of the Ground-Water/Surface-Water Interactions Workshop July 2000
7
• Develop one or more standard conceptual models to identify important questions to ask and thedata to collect at different types and scales of sites. Sampling efforts in the transition zone may bemore costly than standard sampling of surface water or shallow ground water.
• Determine chemical variations in time and space. In the transition zone, chemical and biologicalprocesses occur over many different time scales such as daily cycles (e.g., temperature andtranspiration), short-term weather events, invertebrate and fish life cycles, seasonal changes, andlong-term climatic changes and events (such as extreme weather events). Characterizing the spatialextent of contaminant discharge to surface water is just as important as determining theconcentration distribution in a ground-water plume. In a screening or predictive risk assessment,contaminant concentrations are used for comparisons to toxicity benchmarks. However, the massflux or loading of contaminants is also important and influences both the impact of contaminantson habitats and the physical, chemical, and biological transformations of the contaminants at thetransition zone. The flux of contaminants can change in magnitude and direction with changes insurface water temperature and stage.
Biology
The biology discussion group concluded that the transition zone is ecologically important. Somesurface organisms have a life stage within this zone, and their productivity could be affected bycontaminants in the zone. Less is known of the unique species that permanently inhabit the transitionzone, and many have not been described. Transition zones often provide high quality habitats and aresites of contaminant reduction and nutrient and carbon cycling. Transition zones also can providepreferred habitat, refugia, sites of high biodiversity, habitat for the macrofaunal food base, microbialproduction, and energy transfer.
The group agreed that techniques and methods are available to evaluate the structure and functionof the macrobiota and meiofauna. Methods also exist to sample organisms in the transition zone;however, many of these methods are neither standardized nor well-developed. In particular, there is nostandard method to determine microbial community structure or activity/function. The group made thefollowing recommendations: • Use standard metrics, such as community composition, density, and species richness, to compare
sample results regardless of the specific collection method. Evaluate functional feeding groups.
• Conduct bioaccumulation studies and stable isotope analyses to evaluate food chain relationships.
• Understand the basics of community structure and function at all levels before developing moremethods to conduct toxicity testing.
• Coordinate ecologically related sampling in the transition zone with hydrogeological and chemicalsurveys at ground-water discharge sites. Use these surveys to help define the biological zoneslikely to be affected.
Conceptual Model
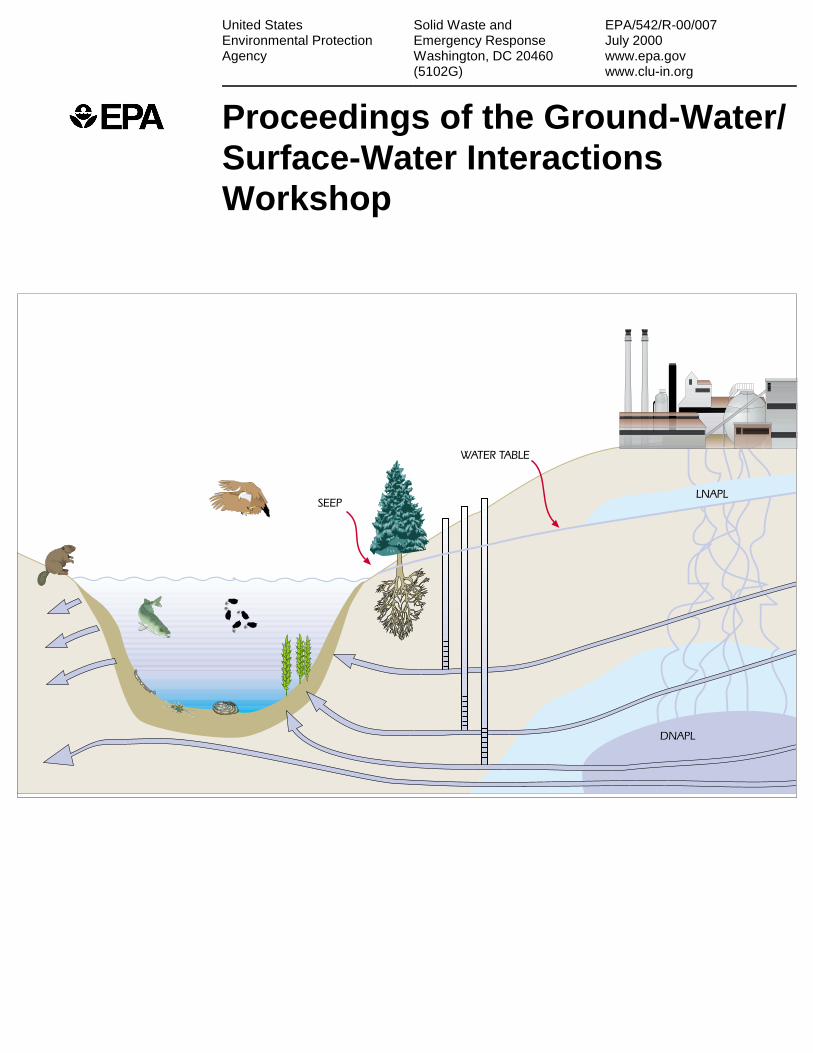
To produce the conceptual model shown in Figure 1, the workshop planning committee presented adraft model at the workshop and revised it from the comments received from participants. This model,drawn for a river, can be adapted to other sites (lake, tidal, estuaries, marshes, etc.). It combines
Proceedings of the Ground-Water/Surface-Water Interactions Workshop July 2000
8
����
����
�������
�����
��
��
����
����
���
���
����
���������
����
���
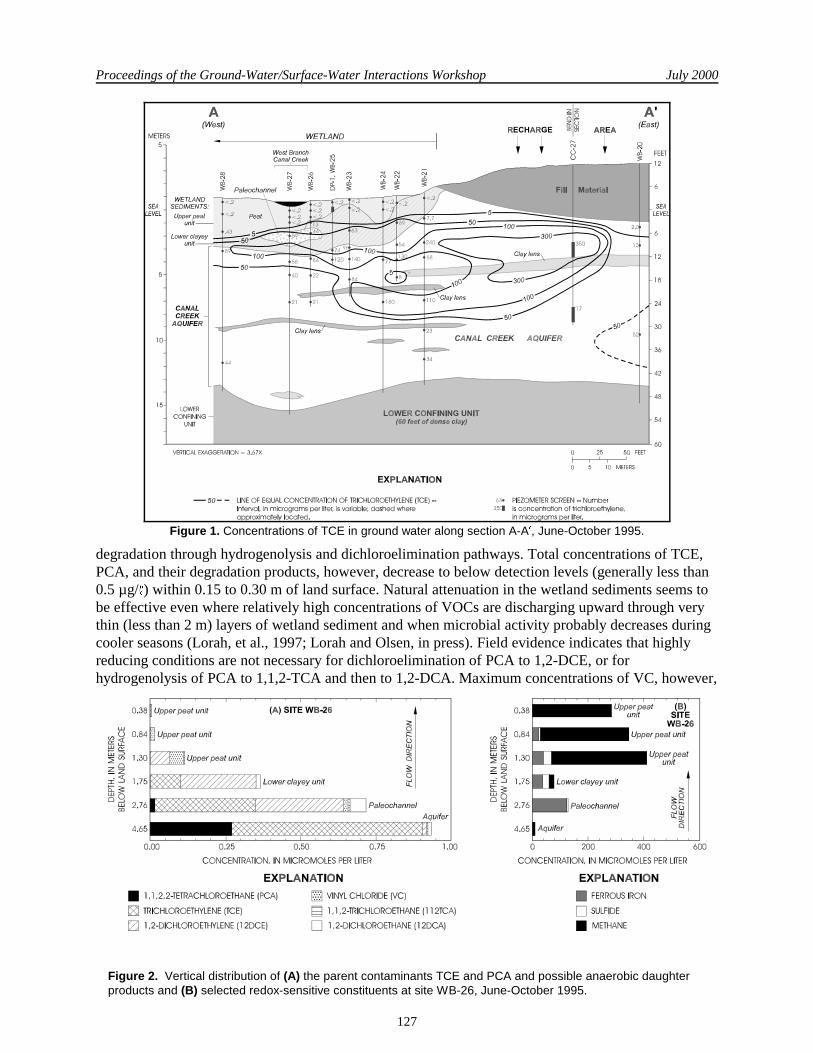
Figure 1. Conceptual model for contaminated ground water discharging to a river illustrating the need tolook beyond surface water and benthic ecological receptors and hydrogeological fate and transport. Such amodel should consider receptor exposure in the transition zone and account for finer-scale fate, transport,and effects from the discharge of contaminated ground water within this zone.
ecological and hydrogeological concepts to focus on ecological processes in the transition zone andtools used to investigate fate, transport, and effects of contaminants in discharging ground water.
CONCLUSIONS
General consensus was reached that protecting the transition zone is important, and there is a needfor interdisciplinary studies to understand and document the changes that occur in it. Conclusionsrelated to the two fundamental organizing questions are discussed below.
How Important is the Transition Zone Ecologically?
The ground-water/surface-water transition zone is an ecological community with importantecosystem functions affecting several trophic levels from microbes to fish. As an ecotone (i.e., atransition from the ground-water ecosystem to the surface-water ecosystem), this zone provides keyecological services to the surface water ecosystem:
• Provides food for benthic macroinvertebrates. The microbial community serves as the food base tothe small organisms within the zone that in turn are food for the benthic macroinvertebrates.
• Provides and maintains unique habitats or refugia, particularly in upwelling zones.
• Cycles nutrients and carbon in aquatic ecosystems.
Proceedings of the Ground-Water/Surface-Water Interactions Workshop July 2000
9
The microbial and biological activity within this zone also may be important for naturalattenuation, because large gradients can be created, which can result in subsurface conditions thatchange from anaerobic to aerobic over short distances. Biodegradation can cause organic contaminantconcentrations to change over several orders of magnitude within this zone.
How Can We Measure Hydrogeological, Chemical, and Biological Conditions and Changes inthis Zone?
Despite many unanswered questions (see next section) there are many tools from each of thedisciplines that can be used to evaluate fate, transport, and effects in the transition zone. It wasrecognized that the types, locations, 0and times of measurements required to characterize this zone canvary depending on the questions being asked. Hydrogeologists and ecologists must work together toobtain information that is useful to both and to efficiently and properly evaluate this zone.
KEY RECOMMENDATIONS FOR RESEARCH
The recommendations presented below were identified during the various phases of the workshop,particularly within the discussion groups and during the report-out discussions on the final day.
Common Key Areas
The major recommendation common to all three discussion groups is that EPA should create aseries of regional study areas of contaminated transition zone sites. Hydrogeologists, chemists, andbiologists together should determine how, where, and what to sample and how to interpret the results.These scientists are obligated to integrate their objectives into a single conceptual model to evaluatetransition zones.
Hydrogeology
EPA should encourage research in areas that increase the basic understanding of the influences ofnearby surface-water bodies on contaminant plume migration. Delineation of plumes can be improvedby more widespread application of the hydrologic landscape concepts in site characterization.Specifically, the following are needed: (1) improved techniques for measuring hydraulic heads, instream and on-shore; (2) improved estimation methods of ground-water flow rates near the surfacewater boundary; and (3) improved methods for delineating plume concentrations near discharge zones.Increased use of tracers to help document and quantify the rate of ground-water discharges (orrecharges) is needed. Better gradient quantitation methods are needed, especially in zones of rapidlyfluctuating surface water stage. Also, there is a need for better assessment and evaluation of theheterogeneity of the ground-water zones adjacent to the surface-water bodies.
Chemistry
EPA should identify a number of regionally representative sites with contaminated transitionzones—along with appropriate uncontaminated reference sites—to be studied by EPA’s regional andOffice of Research and Development (ORD) laboratories and academic grantees. The sites shouldreflect the scales and contaminant problems typical of each region because the transition zonechemistry, biology, and hydrology of small mountain streams impacted by mines in Region 8, forexample, may be very different from those of a zone where chlorinated solvent plumes discharge toone of the Great Lakes in Region 5. The study of ground-water discharge and transition zone flow inestuaries will be further complicated by tidal fluctuations. Members of the chemistry discussion group
Proceedings of the Ground-Water/Surface-Water Interactions Workshop July 2000
10
felt strongly that extrapolating data from small streams to large rivers and lakes is unacceptable. Also,some investigations techniques work well in small streams, but not in areas of high flow. As with anylandscape approach, the chemical species and the dominant chemical and physical processes vary fordifferent landscapes, but some basic processes may be common to some or all of these sites.
Biology
Biological investigations rely heavily on hydrogeological and chemical investigations, particularlyfor identifying discharge zones. The regional study sites recommended by the other two groups shouldbe used to fulfill several biological research needs. The greatest need is for basic biological research,such as life histories, faunal surveys, and organism activity, so that the full importance of the transitionzone can be determined and changes related to contaminants can be quantified. Sampling andevaluation tools for both contaminated and uncontaminated substrates need to be developed andstandardized to determine contaminant effects on species richness, trophic structure, and organismgrowth for macrobiota, meiofauna, and microorganisms in the transition zone ecosystem. Quantitativelinks are needed between site-specific chemical, hydrogeological, and ecological factors and the valuedfunctions of the transition zone (e.g., contaminant degradation, food base for benthic organisms, role asa refuge, and high quality habitat).
NEXT STEPS
This workshop was the first step in creating a multidisciplinary foundation for investigating,monitoring, and evaluating effects in the transition zone from the discharge of contaminated groundwater. Future efforts building on this foundation should take many paths. For example, the conceptualmodel of the transition zone presented here is continually evolving. Conceptual models representingdischarges to water bodies other than rivers need to be considered so that approaches and toolsappropriate to wetlands, estuaries, and lakes—including those influenced by tides—can be identifiedand developed. Similarly, other pathways need to be identified and addressed, such as contaminatedsediments as sources of contamination to ground water and to the transition zone where infiltration ofsurface water occurs.
Based on the workshop, the Ground Water Forum and the Ecological Risk Assessment Forumintend to:
• Submit research recommendations to ORD.
• Develop a list of suggested tools for investigating hydrogeological fate and transport andecological effects at contaminated sites.
• Develop Agency guidance for incorporating the transition zone into risk assessments.
• Conduct a pilot study.
Proceedings of the Ground-Water/Surface-Water Interactions Workshop July 2000
11
ACKNOWLEDGMENTS
The Superfund and RCRA Ground Water Forum and Ecological Risk Assessment Forum wouldlike to thank the following people for their contributions to the Ground-Water/Surface-WaterInteractions Workshop and these proceedings:
OSWER’s Technology Innovation OfficeEPA’s Region 8 office in Denver for providing meeting facilitiesWorkshop organizers and report editors:
Bruce Duncan, U.S. EPA, Region 10, Seattle, WashingtonRené Fuentes, U.S. EPA, Region 10, Seattle, WashingtonRichard Willey, U.S. EPA, Region 1, Boston, Massachusetts
Speakers and Discussion Group Co-Chairs:Ned Black, U.S. EPA, Region 9, San Francisco, CaliforniaG. Allen Burton, Jr., Institute for Environmental Quality, Wright State University, Dayton,OhioBrewster Conant, Jr., Department of Earth Sciences, University of Waterloo, WaterlooOntario, CanadaCliff Dahm, Department of Biology, University of New Mexico, AlbuquerqueJoe Dlugosz, U.S. EPA Environmental Effects Research Laboratory, Mid-Continent EcologyDivision, Duluth, MinnesotaBruce Duncan, U.S. EPA, Region 10, Seattle, WashingtonDavid R. Lee, Environmental Research Branch, AECL, Chalk River, Ontario, CanadaGuy Tomassoni, U.S. EPA, Office of Solid Waste, Washington, DCD. Dudley Williams, Division of Life Sciences, University of Toronto at Scarborough, CanadaThomas C. Winter, U.S. Geological Survey, Denver, Colorado
Proceedings of the Ground-Water/Surface-Water Interactions Workshop July 2000
12
PRESENTATION ABSTRACTS
Proceedings of the Ground-Water/Surface-Water Interactions Workshop July 2000
13
A Federal Statutory/Regulatory/PolicyPerspective on Remedial Decision-making withRespect to Ground-Water/Surface-WaterInteraction
by Guy Tomassoni
The ground water/surface water interaction zone is important because 75% of Superfund and RCRAsites are located within a half mile of a surface water body. Forty-seven percent of Superfund siteshave recorded impacts to surface water. Most RCRA sites are located adjacent to or near surface water(presumably for ease of transportation and manufacturing). Within the last 25 years, the Clean WaterAct has succeeded in cleaning up point sources in the United States, and EPA now needs to considernon-point sources.
“Risk-based decision making” (RBDM) has received a bad reputation within EPA because it has beenequated to “risk-based corrective action” (RBCA). A goal of this workshop is to provide the scientificbasis to convince policy-makers to allow RBDM. EPA supports RBDM, but places more emphasis onsite-specific evaluations based on sound science. RBDM generally requires a multidisciplinaryapproach, an understanding of requirements, and flexibility in applicable statutes, regulations, andpolicies.
There are many technical and policy issues regarding ground-water/surface-water interactions. Goodpolicy is flexible, and good policy comes from good technical information. This workshop thereforemay influence future policy. Superfund and RCRA remediation (“corrective action”) programs. Theselaws mandate protection of human health and environment. The Superfund National Contingency Planoffers greater detail; RCRA relies more on program guidance.
Highlights from “Rules of Thumb for Superfund Remedy Selection” (http://www.epa.gov/superfund/resources/rules/index.htm)
Superfund’s goal is to return usable ground water to beneficial uses (current and future) wherepractical. When this is not practical, Superfund strives to prevent further migration and exposure, andto evaluate opportunities for further risk reduction. Ground water generally is considered “potable” if itis so designated by the state, or considered so under federal drinking water guidelines. Preliminaryremedial goals are set at levels that protect resources—including surface waters—that receivecontaminated ground water, taking into account Clean Water Act requirements or state standards, ifthey are more stringent. Attaining drinking water standards in contaminated ground water is not alwaysenough to protect sensitive ecological receptors. Final clean-up levels should be attained throughoutthe plume and beyond the edge of any wastes left in place. The “point of compliance” for a surfacewater body is where the release enters the surface water. Alternate concentration limits (ACLs) may beconsidered where contaminated ground-water discharges to surface water, where contaminated groundwater does not lead to increased contaminants in surface water, where enforceable measures areavailable to prevent exposure to ground water, or where restoring ground water is “not practicable.”There are about 23 Superfund ACLs nationwide. EPA expects to use treatment to address “principalthreats” posed by site where practical.
Proceedings of the Ground-Water/Surface-Water Interactions Workshop July 2000
14
RCRA Setting, Based Upon the May 1, 1996, Advance Notice of Proposed Rulemaking (http://www.epa.gov/correctiveaction)
RCRA has similar requirements to Superfund with respect to: returning usable ground water tobeneficial uses; points of compliance for ground water and surface water; protection of surface waterfrom contaminated ground water; provisions for ACLs (but without an explicit link to “practicability”);and treatment of principal threats. If current human exposures are under control and no furthermigration of contaminated ground water is expected, primary near-term goals are established using twoenvironmental indicators. Surface water becomes the boundary if the discharge of contaminatedground water is within “protective” limits.
The OSWER Policy Directive on Monitored Natural Attenuation (MNA) was issued in final form, andis pertinent to the ground water/surface water issue. It addresses dilution, dispersion, absorption, anddegradation—all of which occur in ground water/surface water interaction. The directive requirescontrolling sources and monitoring; it stresses the need to look beyond obvious contaminants.
In summary, the majority of contaminated sites have serious potential to affect surface waters. Thefederal framework allows for RBDM with respect to ground water/surface water interaction, but wemust still achieve the expectation of restoring ground water to beneficial use and ensure discharges ofground water to surface water are protective. Key policy issues to ponder—and to pass to seniormanagers—include:
• how to achieve short- and long-term protection; • where, how, and how often to measure compliance; • whether to restore ground water; even if it has no impact to surface water; • the diversity of surface bodies; • the relation of cleanup goals to the Clean Water Act’s National Pollutant Discharge Elimination
System (NPDES) approach; and • how to account for, track, and communicate total loads in watersheds.
AUTHOR INFORMATION
Guy Tomassoni, U.S. EPA, Office of Solid Waste
Proceedings of the Ground-Water/Surface-Water Interactions Workshop July 2000
15
Interaction of Ground Water and Surface Water
By Thomas C. Winter
INTRODUCTION
Surface water bodies are hydraulically connected to ground water in most types of landscapes; as aresult, surface-water bodies are integral parts of ground-water flow systems. Even if a surface waterbody is separated from the ground-water system by an unsaturated zone, seepage from the surfacewater may recharge ground water. Because of the interchange of water between these two componentsof the hydrologic system, development or contamination of one commonly affects the other. Themovement of surface water and ground water is controlled to a large extent by the physiography(land-surface form and geology) of an area. In addition, climate, through the effects of precipitationand evapotranspiration, affects the distribution of water to—and removal from—landscapes.Therefore, it is necessary to understand the effects of physiography and climate on surface waterrunoff and ground-water flow systems in order to understand the interaction of ground water andsurface water.
The purpose of this paper is to: present an overview of how physiography and climate affect theinteraction of ground water and surface water and present the concept of hydrologic landscapes as aunifying framework for study, analysis, and management of seemingly diverse landscapes. Specificallydiscussed are the effects of the following factors on movement of water between ground water andsurface water: (a) position of surface water bodies within ground-water flow systems; (b) small-scalegeologic features in beds of surface water; (c) climate; and (d) hyporheic exchange.
GENERAL HYDROLOGICAL PROCESSES RELATED TO THE INTERACTION OF GROUND WATERAND SURFACE WATER
Position of Surface Water Bodies With Respect to Ground-Water Flow Systems
Ground water moves along flow paths of varying lengths from areas of recharge to areas ofdischarge. The source of water to the water table (ground-water recharge) is infiltration of precipitationthrough the unsaturated zone. Ground-water flow systems can be of greatly different sizes and depths,and they can overlie one another. Local flow systems are recharged at water-table highs and dischargeto adjacent lowlands or surface water. Local flow systems are the most dynamic and the shallowestflow systems; therefore, they have the greatest interchange with surface water. Local flow systems canbe underlain by intermediate and regional flow systems. Water in these deeper flow systems havelonger flow paths, but they also eventually discharge to surface water. Surface water bodies thatreceive discharge from more than one flow system receive that water through different parts of theirbed. Local flow systems discharge in the part nearest shore, and larger-magnitude flow systemsdischarge to surface water further offshore. Because of the different lengths and travel times of waterwithin flow paths, the chemistry of water discharging into the surface water from different flow pathscan be substantially different.
In some landscapes, surface water bodies lie at intermediate altitudes between major recharge anddischarge areas. Surface water bodies in such settings commonly receive ground-water inflow on theupgradient side and have seepage to ground water on the downgradient side. Furthermore, depending
Proceedings of the Ground-Water/Surface-Water Interactions Workshop July 2000
16
on the distribution and magnitude of recharge in the uplands, the hinge line between ground-waterinflow and outflow can move back and forth across part of the surface water bed.
The above characteristics of ground-water flow systems with respect to surface water apply in ageneral regional sense to most landscapes. However, the detailed distribution of seepage to and fromsurface water is controlled by: (a) the slope of the water table with respect to the slope of the surfacewater surface; (b) small-scale geologic features in the beds of surface water; and (c) climate.
Effect of Local Water-Table Configuration and Geologic Conditions on Seepage Distribution inSurface Water Beds
Upward breaks-in-slope of the water table result in upward components of ground-water flowbeneath the area of lower slope and downward breaks-in-slope of the water table result in downwardcomponents of ground-water flow. These flow patterns apply to parts of many landscapes, but they areparticularly relevant to the interaction of ground water with surface water because water tablesgenerally have a steeper slope on both the inflow and outflow sides relative to the flat surface ofsurface water bodies. The ground-water flux through a surface water bed associated with thesebreaks-in-slope, whether the seepage is to or from the surface water, is not uniformly distributedareally. Where ground water moves to or from a surface water body underlain by isotropic andhomogeneous porous media, the flux is greatest near the shoreline, and it decreases approximatelyexponentially away from the shoreline. Anisotropy of the porous media, which is a function of theorientation of sediment particles in the geologic materials, affects this pattern of seepage by causingthe width of areas of equal flux to increase with increasing anisotropy. Yet the decreasing seepageaway from the shoreline remains nonlinear.
Geologic heterogeneity of surface water beds also affects seepage patterns. Small-scale variationsin sediment type can cause the locations and rates of seepage to vary substantially over small distances.For example, highly conductive sand beds within finer-grained porous media that intersect a surfacewater bed results in subaqueous springs. The horizontal and vertical hydraulic conductivity of thestreambed can vary by several orders of magnitude because of the variability of streambed sediments.The complex distribution of seepage patterns caused by the heterogeneous geology of surface waterbeds has been documented by field studies in manysettings.
Effect of Climate on Seepage Distribution in Surface Water Beds
The most dynamic boundary of most ground-water flow systems is the water table. Theconfiguration of the water table changes continually in response to recharge to and discharge from theground-water system. Changing meteorological conditions strongly affect seepage patterns in surfacewater beds, especially near the shoreline. The water table commonly intersects land surface at theshoreline, resulting in no unsaturated zone at this point. Infiltrating precipitation passes rapidly througha thin unsaturated zone adjacent to the shoreline, which causes water-table mounds to form quicklyadjacent to the surface water. This process, termed “focused recharge,” can result in increased ground-water inflow to surface water bodies, or it can cause inflow to surface water bodies that normally haveseepage to ground water. Each precipitation event has the potential to cause this highly transient flowcondition near shorelines as well as at depressions in uplands.
Transpiration by near-shore plants has the opposite effect of focused recharge. Again, because thewater table is near the land surface at edges of surface water bodies, plant roots can penetrate into thesaturated zone, allowing the plants to transpire water directly from the ground-water system.
Proceedings of the Ground-Water/Surface-Water Interactions Workshop July 2000
17
Transpiration of ground water commonly results in a drawdown of the water table much like the effectof a pumped well. This highly variable daily and seasonal transpiration of ground water may reduceground-water discharge to a surface water body significantly or even cause movement of surface waterinto the subsurface. In many places, it is possible to measure diurnal changes in the direction of flowduring seasons of active plant growth: that is, ground water moves into the surface water during thenight, and surface water moves into shallow ground water during the day.
These periodic changes in the direction of flow also can take place on longer time scales. Focusedrecharge from precipitation predominates during wet periods, and drawdown by transpirationpredominates during dry periods. As a result, the two processes—together with the geologic controlson seepage distribution—can cause flow conditions at the beds of surface water bodies to be extremelyvariable. These processes probably affect small surface water bodies more than large surface waterbodies because the ratio of edge length to total volume is greater for small water bodies than it is forlarge ones.
A type of landscape that merits special attention are those areas underlain by limestone anddolomite. These landscapes, which are referred to as karst terrains, commonly have fractures andsolution openings that become larger with time because of dissolution of the rocks. Ground-waterrecharge is very efficient in karst terrain because precipitation readily infiltrates through the rockopenings that intersect the land surface. Water moves at greatly different rates through karst aquifers; itmoves slowly through fine fractures and pores and rapidly through solution-enlarged fractures andconduits. The paths of water movement in karst terrain are especially unpredictable because of themany paths ground water takes through the maze of fractures and solution openings in the rock. Seepsand springs of all sizes are characteristic features of karst terrains. In addition, the location where thestreams emerge can change, depending on the spatial distribution of ground-water recharge in relationto individual precipitation events. Large spring inflows to streams in karst terrain contrast sharply withthe generally more-diffuse ground-water inflow characteristic of streams flowing across sand andgravel aquifers.
Hyporheic Exchange
Streambeds and banks are unique environments because they are where ground water that drainsmuch of the subsurface of landscapes interacts with surface water that drains much of the surface oflandscapes. “Hyporheic exchange” is the term given to the process of water and solute exchange inboth directions across a streambed. The direction of seepage through the bed of streams commonly isrelated to abrupt changes in the slope of the streambed or to meanders in the stream channel. Thisprocess creates subsurface environments that have variable proportions of water from ground waterand surface water. Depending on the type of sediment in the streambed and banks, the variability inslope of the streambed, and the hydraulic gradients in the adjacent ground-water system, the hyporheiczone can be as much as several feet in depth and hundreds of feet in width. The dimensions of thehyporheic zone generally increase with increasing width of the stream and permeability of streambedsediments. Because of this mixing between ground water and surface water in the hyporheic zone, thechemical and biological character of the hyporheic zone may differ markedly from adjacent surfacewater and ground water.
Although most work related to hyporheic-exchange processes has been done on streams, processessimilar to hyporheic exchange also can take place in the beds of some lakes and wetlands because ofthe reversals in flow caused by focused recharge and transpiration from ground water near surfacewater, discussed above. Therefore, it is not enough to know only the relationship of surface water to
Proceedings of the Ground-Water/Surface-Water Interactions Workshop July 2000
18
ground-water flow systems and to small-scale seepage patterns in surface water beds, becausehyporheic-exchange processes also can be important in some types of landscapes.
Hydrologic Landscapes as a Unifying Concept for Diverse Localities and Regions
As indicated above, many geologic and climatic factors affect the movement of water through abasin. The many different types of landforms, geologic settings, and climate variations that make upmany regions of the Earth may make it seem that a unifying conceptual framework is impossible toachieve. Indeed, it is not unusual for scientists and water- and land managers to emphasize theuniqueness and complexity of a given locality rather than the similarities that it might have with otherlocalities. However, with respect to the movement of water and chemicals, many seemingly diverselandscapes have some features in common, and it is these commonalities that need to be identified.Only by evaluating landscapes from a common conceptual framework can processes common to someor all landscapes be distinguished from processes unique to particular landscapes. A commonconceptual framework also would lead to development of field designs of data collection programs thatcould be transferred to other landscapes having similar characteristics.
The concept of hydrologic landscapes is based on the idea that a single, simple physiographicfeature is the basic building block of all landscapes. This feature is termed a “fundamental landscapeunit,” and is defined as an upland adjacent to a lowland separated by a steeper break in slope. Watermoves over the surface of a fundamental landscape unit depending upon the surface slope of theupland, lowland, and intervening steeper slope, and it moves through the subsurface depending uponthe hydraulic characteristics of its internal geologic properties.
All landscapes can be conceived of as variations and multiples of fundamental landscape units.Variations and multiples of fundamental landscape units can be used to define a number of generallandscape configurations; for example: (1) the width of the lowland, valley side or upland can rangefrom narrow to wide; (2) the slopes of the three surfaces can vary; (3) the height of the valley side canrange from small to large—that is, the upland can be only slightly higher than the lowland or it can bemuch higher; or (4) small fundamental landscape units can be superimposed on any or all of thesurfaces of larger-scale fundamental landscape units.
General landscape configurations such as these can be used to define general landscape types thatdescribe major physiographic features of the Earth. For example:
(1) A landscape consisting of narrow lowlands and uplands separated by high and steep valleysides is characteristic of mountainous terrain. This general configuration can be nested intomultiples at different scales within mountainous terrain as one moves from high mountainbasins to larger and larger valleys within a mountain range complex.
• A landscape consisting of very wide lowlands separated from much narrower uplands by steepvalley sides is characteristic of basin and range physiography and basins of interior drainage. Inthis type of terrain, the uplands may range from being slightly higher to much higher than thelowlands.
• A landscape consisting of narrow lowlands separated from very broad uplands by valley sides ofvarious slopes and heights is characteristic of plateaus and high plains.
• A landscape consisting of one or more small fundamental landscape units (terraces) nested withina larger lowland is characteristic of riverine valleys and coastal terrain. A landscape consisting of
Proceedings of the Ground-Water/Surface-Water Interactions Workshop July 2000
19
numerous small fundamental landscape units superimposed on both the uplands and lowlands oflarger fundamental landscape units is characteristic of hummocky glacial and dune terrain.
Common Hydrologic Characteristics of Generalized Hydrologic Landscapes
The movement of water over the surface and through the subsurface of generalized landscapes iscontrolled by common physical principles regardless of the geographic location of the landscapes. Forexample, if a landscape has low land slope and low-permeability soils, surface runoff will be slow andrecharge to ground water will be limited. In contrast, if the soils are permeable in a region of low landslope, surface runoff may be limited but ground-water recharge will be high. In landscapes that have ashallow water table, transpiration directly from ground water may have a substantial effect on ground-water flow systems, and on the movement of ground water to and from surface water.
Landscapes characterized by multiples of fundamental landscape units can have complex ground-water flow systems because small-scale local flow systems associated with each topographic break inthe landscape are superimposed on larger, more regional flow systems associated with largerfundamental landscape units. Two seemingly diverse landscapes, such as riverine and coastal terrain,have many of these types of physiographic characteristics in common, and presumably would havemany hydrologic characteristics in common as well. Ground-water flow conditions in hummockyterrain are even more complex than riverine and coastal terrain because of the numerous smallfundamental landscape units superimposed somewhat randomly on larger and larger fundamentallandscape units. Indeed, in glacial and dune terrain, many multiples of fundamental-landscape-unitscale can be present. Furthermore, generally shallow water tables characteristic of coastal, riverine, andhummocky terrain result in the opportunity for highly transient local ground-water flow systemscaused by focused recharge and transpiration directly from ground water.
Implications for management of water and remediation of contaminated localities
Management of water, and remediation of contaminated localities, requires sound understanding ofhydrological processes. Contaminated ground water and surface water are common in all types oflandscapes. Because of the cost of studies and of remediation, it is nearly impossible to devoteadequate resources to the huge number of sites that need attention. Therefore, it is of great practicalvalue to seek transferability of study design, study results, and remediation techniques. It is suggestedthat the concept of hydrologic landscapes can serve as a foundation for determining the commonalitiesof diverse localities, and sharpen the perspective of their differences. If this can be accomplished, thetransfer value of study designs and remediation methods should substantially reduce the cost of siteremediation.
REFERENCES
The material presented above was abstracted from:
Winter, T.C., Harvey, J.W., Franke, O.L., and W.M. Alley, 1998. Ground water and surface water—asingle resource, U.S. Geological Survey Circular 1139, 79 pp.
Winter, T.C., 1999. Relation of streams, lakes, and wetlands to groundwater flow systems,Hydrogeology Journal, v. 7, pp. 28-45.
Winter, T.C., 2000. The concept of hydrologic landscapes. Submitted to the Journal of the AmericanWater Resources Association, February.
Proceedings of the Ground-Water/Surface-Water Interactions Workshop July 2000
20
AUTHOR INFORMATION
Tom C. Winter, U.S. Geological Society, Denver, CO
Proceedings of the Ground-Water/Surface-Water Interactions Workshop July 2000
21
Hydrogeology and Biogeochemistry of theSurface Water and Ground Water Interface of aMountain Stream
By Cliff Dahm
Our interdisciplinary research group has been studying the hydrogeology, biogeochemistry, andecology of the surface water and ground water interface of the Rio Calaveras in the Jemez Mountainsof northern New Mexico since 1991. Snowmelt is a prominent factor in the hydrogeology of bothsurface discharge and the alluvial ground water of the site. Strong interannual variability in the strengthof the snowmelt signal affects both the biogeochemistry and ecology of the surface water and groundwater. Water table variation in drought years is small, and upwelling and downwelling zones throughthe bed of the channel show a complex spatial pattern, with distinct losing and gaining sections ofstream over a 150-meter reach throughout most of the year. Water table variation in wet years withgood snow pack ranges between 40 to >100 centimeters in the alluvial flood plain, and most of thereach is gaining (upwelling) from March through May. Flow lines are directed towards the stream withboth ground water and saturated overland flow contributing to increased stream discharge. Droughtyears are characterized by discharge increases as little as three times base flow while dischargeincreases during wet years exceed two orders of magnitude above base flow.
Biogeochemical characteristics of the surface water and ground water are strongly influenced bythe hydrogeology. Snowmelt generates water that is rich in nitrate, dissolved organic carbon (DOC),and oxygen. Much of the increase in dissolved organic matter and nutrients is derived from the regionof seasonal saturation (ROSS) that is inundated during snowmelt. Studies on the DOC leached fromthe ROSS have shown that half of this DOC is labile and metabolized within one month. Alluvialground water shows strong vertical structure from the snowmelt inputs with peaks in oxygen, nitrate,DOC, and low molecular weight organic acids in the upper 50 centimeters in the first few weeksfollowing snowmelt. As water table elevations drop, concentrations of oxygen, nitrate, sulfate, DOC,and organic acids decrease, while byproducts of anaerobic metabolism such as ferrous iron,manganous manganese, and methane increase. Surface water inputs of organic matter and nutrientsalso reflect the changing hydrology that occurs from snowmelt to base flow conditions. For example,nitrate and DOC levels are highest during the early stages of snowmelt and low during base flowconditions. Algal primary production shows a nitrogen limitation during low-flow conditions but notduring times of increased stream discharge.
Interactions between surface waters and ground waters at this site also affect the biologicalcommunities of the stream benthos. High discharge during periods of snowmelt scours benthic algaeand reduces chlorophyll concentrations and algal biomass throughout the reach. As snowmeltdischarge decreases, a diatom-dominated benthic algal bloom commonly occurs over much of thestream bottom. As flows return to base flow conditions, a spatially heterogeneous pattern of algalcommunity structure and biomass emerges. Persistent upwelling zones at base flow, where groundwater discharges into surface water, are generally more productive reaches and composed of a complexmix of diatoms, green algae, and cyanobacteria. More focused benthic invertebrate activity appears tooccur in these reaches. Persistent downwelling zones, where surface water recharges the ground water,commonly have lower rates of algal primary production and contain a higher proportion of
Proceedings of the Ground-Water/Surface-Water Interactions Workshop July 2000
22
cyanobacteria in the algal community. Hydrogeology, nutrient availability, and interactions betweengrazers and primary producers all play important roles in structuring the benthic algal community.
Integrative studies that combine hydrogeology, biogeochemistry, and aquatic ecology are needed tofully understand the dynamics and importance of the ground water/surface water interface. Research atRio Calaveras in northern New Mexico has been designed to bring these disciplines together in amultidisciplinary study of a well-instrumented 150-meter reach of mountain stream. This research hasshown the importance of major hydrologic events such as spring snowmelt in the overall hydrology,biogeochemistry, and ecology of this ecosystem. In addition, the distribution of aerobic and anaerobicmicrobial processes in the alluvial ground water system and the chemical form and concentration ofnutrients and trace metals in the surface waters and ground waters are strongly affected by thehydrogeology of the ground water/surface water interface.
AUTHOR INFORMATION
Cliff Dahm, Department of Biology, University of New Mexico, Albuquerque, NM 87131,[email protected].
Proceedings of the Ground-Water/Surface-Water Interactions Workshop July 2000
23
Ground-water Plume Behavior Near The Ground-Water/Surface Water Interface of a River
By Brewster Conant, Jr.
INTRODUCTION
What happens to ground-water contaminant plumes as they discharge through river beds and theground water/surface water interface (GWSI) is not well understood. Relatively few published studiesaddress this issue, even though an estimated 51 percent of National Priority List sites are thought toimpact surface water (U.S. EPA, 1991) and the most common route for the contaminants to migrateinto the surface water was via ground-water transport (U.S. EPA, 1989). Understanding processesoccurring beneath and near rivers becomes particularly relevant when making remediation decisionsthat are risk-based or involve natural attenuation. Such decisions could benefit greatly by identifyingimportant plume transport and fate processes and by conducting detailed hydrogeological studies ofplumes to characterize the spatial and temporal variations of contaminant discharges to rivers.
GROUND-WATER PLUME DEVELOPMENT
Many factors influence the transport and fate of contaminants in the subsurface prior to a ground-water plume discharging to the surface water of a river. To understand the significance of these factors,it is useful to consider the fundamentals of how dissolved-phase contaminant ground-water plumes arecreated. Several factors play important roles in plume development:
• Physical and chemical characteristics of the contaminants • Geometry and temporal variations in the contaminant source zone • Transport mechanisms (advection and dispersion) • Reactions (destructive and non-destructive)
Many of these factors are just as applicable to contaminant behavior near and beneath rivers as they areaway from the river. Knowing the behavior and concentration distribution of plumes, before they enterthe complex conditions near and beneath a river, allows better assessment of what modifying effectsnear river processes have on the plume.
Contaminant Characteristics
A contaminant’s physical and chemical characteristics play an important role in how thecontaminant is transported and redistributed in the subsurface and the hazard it poses to aquatic life.Many types of contaminants are found in the subsurface including; synthetic organics, hydrocarbons,metals, other inorganics (e.g., nitrate), radionuclides, and pathogens (e.g., viruses and bacteria).Contaminants can be present as solids, liquids (e.g., non-aqueous phase liquids [NAPL]), dissolved inwater, or present as gasses. Each contaminant has a different propensity to solubilize, sorb,bioconcentrate, volatilize, or react, and these characteristics affect both their mobility and toxicity.With respect to organic compounds, the strongly hydrophobic organic compounds (e.g., PCBs,pesticides, and PAHs) have higher bioconcentration factors and tend to be more toxic to aquatic lifethan less hydrophobic organics such as chlorinated volatile organic compounds (CVOCs). The stronglyhydrophobic compounds generally have low aqueous solubilities and, when dissolved in water, move
Proceedings of the Ground-Water/Surface-Water Interactions Workshop July 2000
24
much more slowly than ground water (i.e., adsorb and are retarded), whereas, the CVOCs have highersolubilities and are less retarded. Consequently, many of the longer and higher concentrationdissolved-phase organic plumes in ground water are dominated by the more mobile CVOCs, which aregenerally thought to be “less toxic” to aquatic life. However, aquatic biota located in the streambed andat the GWSI (i.e., not in the surface water) may still be adversely affected by CVOCs because theymay be exposed to high concentrations in the discharging ground water prior to any dilution by surfacewater. If ground-water concentrations are higher than freshwater aquatic life standards or guidelines,the locations of these discharge zones may represent a hazard to both the benthic and hyporheic aquaticlife in the streambed, regardless of how these contaminants might later attenuate in the surface watersof the open river channel.
Contaminant Source Zone
At many Superfund and RCRA sites, considerable effort is spent trying to delineate the source ofcontaminants impacting the ground water. These sites, particularly those involving CVOCs, typicallyinvolve so-called “point sources” of ground-water contamination resulting from spills or releaseslimited over relatively discrete release areas. This paper does not address “non-point” sources ofcontamination, such as nitrate and pesticide contamination from large-scale agricultural applications,even though such “source areas” cover more of the watershed area contributing water to the stream.
Each individual contaminant source zone has a particular distribution in the subsurface. Thelocation, mass, and type of contaminants in the subsurface, along with characteristics of the subsurfacegeology and ground-water flow, will influence whether the source produces a ground-water plume witha continuous, variable, or a “slug” input. A source below the water table consisting of dense non-aqueous phase liquid (DNAPL) results in continuous dissolved-phase plumes that can persist for tensto hundreds of years if left to naturally dissolve (Feenstra, et al., 1996). Variable source plumes may becaused by variations in waste stream inputs, or by preferential dissolution and depletion of multi-component contaminant sources over time (Feenstra and Guiguer, 1996). Slug inputs are“instantaneous” or short duration releases that do not persist at the initial release location and movethrough the flow system as a localized mass. Of particular concern for impacts on surface water are thecontinuous and variable sources which represent long term sources of contaminants to a river.Continuous-source plumes may result in areas of the streambed being constantly exposed to highconcentrations of contaminated ground water. Because contaminants enter streambed from the groundwater below, the sediments become contaminated at ground water discharge locations. Even if thosesediments are eroded away and transported down stream, the clean materials redeposited in their placewill be subsequently contaminated by further ground water discharge.
TRANSPORT
Ground-Water Flow
The primary mechanism by which contaminants are transported away from source zones andtoward ultimate points of discharge, such as rivers, is advection (i.e., dissolved phase contaminantsmoving with the ground water). Therefore, the ground-water flow system plays a fundamental role indetermining where a dissolved phase plume from a contaminant source zone will go and whether agiven surface water body may be affected. Many factors affect ground water flow including; climate(particularly precipitation recharge), watershed characteristics, geology, hydraulic conditions (watertable slope and ground-water potential), and hydrogeologic boundary conditions (such as discharge or“no-flow” locations). Characterizing the ground-water flow system at a site can be more large scale orregional when initially conceptualizing potential contaminant plume flow paths. However, when
Proceedings of the Ground-Water/Surface-Water Interactions Workshop July 2000
25
investigating point-source plumes that reach rivers, the focus needs to be on smaller scale flowcharacteristics in order to accurately determine specific locations of contaminated ground waterdischarge to the river.
Several types of significant vertical ground-water flow behavior can occur both on a regional scaleand on a more local scale in the vicinity of streams. Depending on the depth and location of a sourcezone, the plume may be transported through what Toth (1963) termed local, intermediate, regional,ground water flow systems. If the ground water plume develops in a shallow local flow system, it maydischarge to the nearest surface water body. If the plume develops from a deeper source zone (e.g.,DNAPL) or is located within a regional or intermediate flow system, it may travel beneath severallakes or streams before ultimately discharging to one of them. Winter (1999) shows some examples ofvertical cross-sectional views of ground water interactions for streams, lakes, and wetlands. Differenttypes of ground water/river interactions are also shown in Bear (1979, p. 52).
The lateral component ground water flow (i.e., in plan-view) near rivers exhibits a variety ofbehaviors. In a study of rivers in large alluvial aquifers by Larkin and Sharp (1992) showed that groundwater flow could be base flow, under flow, or mixed flow, depending on the slope, sinuosity, anddepth of penetration of the river in the aquifer. Base flow occurs when ground water flows essentiallyperpendicular to the river and discharges to it. Under flow occurs when ground-water flow near theriver is parallel to the river and does not discharge to the river channel (at least not for some greatdistance). Mixed flow is a combination of base flow and under flow where ground water near the riverflows at an angle to the river and discharges to it some distance downstream. Woessner (1998) presentssome other variations in this behavior. One consequence of these possible behaviors is that plumesentering alluvial valleys may not necessarily travel straight across the flood plain toward the river butinstead may travel down valley large distances before discharging through the stream bottom and intothe stream. In such regimes, simply trying to determine the path of a plume near a river becomes achallenge and finding the exact areas of discharge may be very difficult.
Defining and Locating The Ground-Water/Surface-Water Interface
As ground water travels through the subsurface, it eventually reaches the GWSI near the stream orriver. At the GWSI, a transition occurs between the hydraulic, biochemical, thermal, and ecologicalconditions of the surface water and those associated with the ground water. Because changes in theseparameters may be gradational, defining the location of the GWSI is not simple. The location of theGWSI is not static and may change as a result of daily or seasonal fluctuations in river stage andground water flow. The GWSI can be defined as the location where water having some portion ofsurface water is in contact with 100 percent ground water. This contact may occur right at thestreambed-water column interface, or it may exist at some depth within the streambed or stream banks.The contact between the contrasting waters may be reasonably sharp or transitional. The primaryreason that the GWSI may exist within the streambed materials, as opposed to the upper surface ofthem, is due to topographic variations in the streambed and changes in the slope of the river (i.e.,hydraulic potential). Surface water may enter the sediments at downwelling zones and reenter the riverat upwelling zones (Vaux, 1968, and Boulton,1993). Downwelling generally occurs at the head ofriffles and upwelling (along with ground water discharge) occurs at the upstream edge and base ofpools. Figure 1 is a schematic depicting downwelling and upwelling zones (in vertical cross section)and the effect on the location of the GWSI and a discharging ground water plume. The surface watercan also leave the channel laterally and travel several meters or more into the streambanks andeventually reenter the channel down stream (Harvey and Bencala, 1993). Where surface water leavesthe stream channel, ground water can not directly enter the channel; therefore, the GWSI and ground
Proceedings of the Ground-Water/Surface-Water Interactions Workshop July 2000
26
Figure 1. G roundwater/Surface-Water Interface (GW SI) of a Stream and Influence on Plum e Discharge
Downwelling
Sand and
Gravel
Plume Discharge
FLOWSTREAM SURFACE
GroundwaterSurface Water
InterfaceGroundwater
Surface WaterInterface
STREAMBED
PLUME
Upwelling
water plume will be pushed away from those locations and the plume may ultimately dischargeelsewhere (Figure 1).
The GWSI is not synonymous with the term “hyporheic zone.” The hyporheic zone is anecological term that generally refers to an ecotone where both ground water and surface water arepresent in a streambed along with a specific set of biota (i.e., the hyporheos). Hyporheic zones occur asa result of flowing waters (e.g., streams) and so the term is not applicable to quiet waters (e.g., lakes)even though they have GWSIs too. A broader definition of the hyporheic zone has been proposed byWhite (1993) that includes any area impacted by channel (i.e., surface) water, but one set of specificcriteria defining this zone has not yet been agreed upon. Delineating both the GWSI and the hyporheiczone is important when considering ecotoxicological impacts because a unique set of benthic andhyporheic aquatic life have adapted to the stream environment. The hyporheic zone may represent anecological resource needing protection. Other work suggests the GWSI may also be an importantnatural attenuation zone for contaminated ground water discharge.
Dispersion
Dispersion of contaminants in ground water refers to a process by which dissolved phaseconcentrations are reduced by the spreading out of the plume and hydrodynamic mixing of the waterwith cleaner surrounding ground water. Reductions in plume concentrations by dispersion in groundwater flowing in aquifer sands and gravels is a very, very weak process compared to the turbulentmixing processes that occur in the open channel flow of rivers. Because of low lateral dispersion,plumes emanating from discrete source zones (e.g., DNAPL) are generally long thin “snake” likeplumes (Rivett, et al., 1994) rather than wide “fan” shaped plumes. One important implication of lowdispersion is that high concentration “cores” of ground water plumes (Cherry 1996), measured a shortdistance downgradient of the source, may not diminish much before reaching the river. Therefore, it ispossible for very high concentration portions of the plume to reach discharge areas unless otherreactions (e.g., biodegradation) occur along those flow paths to reduce the concentrations.
In locations where surface water enters the streambed, a hyporheic zone “mixing” of surface waterwith ground water may occur. This mixing process will result in what may appear to be quitesubstantial reductions in plume concentrations. The mechanisms causing this type of mixing are notwell understood and result in “apparent” dispersion. Some of the uncertainty may stem from the factthat the hyporheic zone represents primarily a “surface water” flow path as opposed to a “groundwater” flow path. For instance, the “mixing” that supposedly occurs in the hyporheic zone mayactually be the result of ground water mixing with surface water at the base of the water column whichthen reenters the subsurface at a nearby downwelling zone (see the downstream downwelling zone inFigure 1).
Reactions
Two types of reactions canoccur in the subsurface,destructive and non-destructive. Destructivereactions destroy orirreversibly transform thecontaminant into othercompounds. These reactionsinclude biodegradation, abiotic
Proceedings of the Ground-Water/Surface-Water Interactions Workshop July 2000
27
reactions, and radioactive decay. Non-destructive reactions are reversible processes that may result inchanges in contaminant concentrations in the ground water but do not destroy or transform thecompound. These reactions include such things as adsorption, precipitation and dissolution, and ionexchange. A good discussion of these types of reactions as they apply to natural attenuation ofchlorinated solvents can be found in U.S. EPA (1998). The relative importance of these reactions maybe different in the immediate vicinity of the river than in the rest of the aquifer. In the streambed, highorganic carbon content deposits contribute to higher adsorption than is typical for the surroundingaquifer. Adsorption of contaminants slows down (retards the movement of the contaminants relative toground water flow) and sequesters them for later release. Adsorption results in contaminant loading ofthe sediments and in delayed breakthrough of contaminants flowing into the stream channel.Moreover, the high organic carbon and nutrient cycling also sustains a microbiological community thatcontributes to a greater potential for biodegradation. Biodegradation may greatly reduce contaminantconcentrations. In some cases these reactions may be beneficial but in others the transformationproducts may be more toxic than the parent compound. In some instances (particularly petroleumproduct plumes), reactions that transform organic contaminants may also consume all the dissolvedphase oxygen in the ground water and cause the ground water plume to become anaerobic. The adverseeffect of this anaerobic water on the hyporheic and benthic aquatic life (that require oxygen to live)may be even greater than the toxic effects of the contaminants.
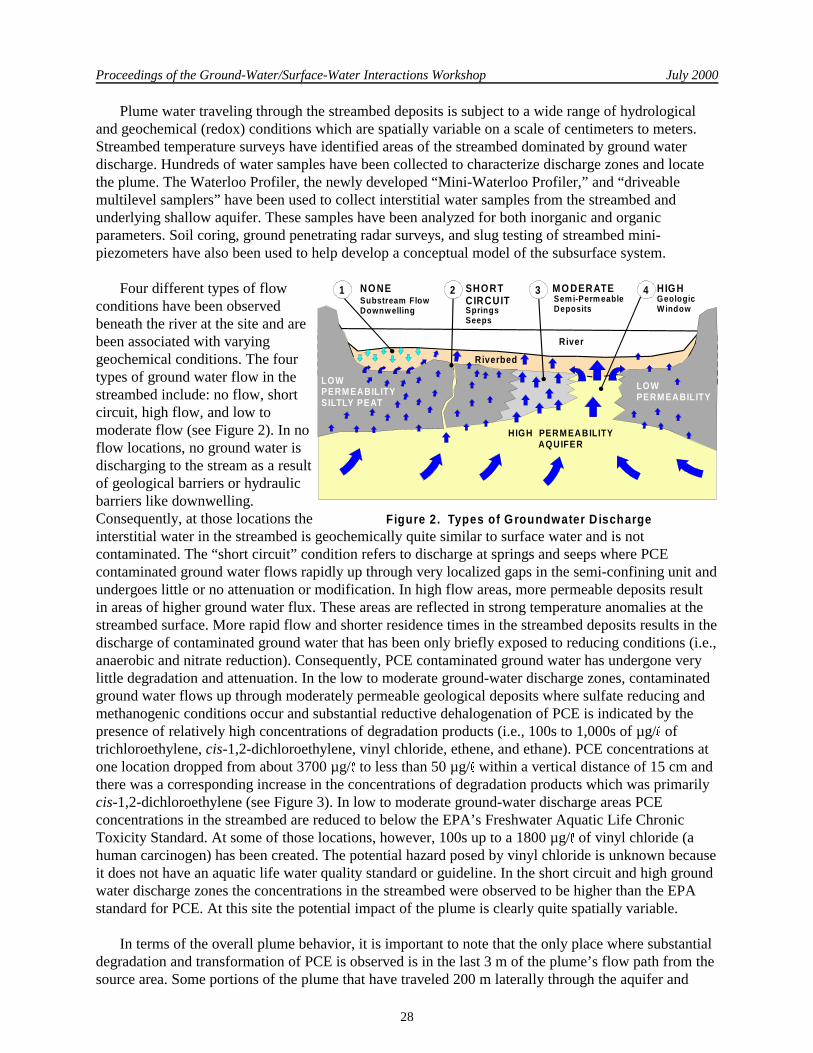
A TETRACHLOROETHYLENE (PCE) GROUND-WATER PLUME DISCHARGING TO A RIVER
To illustrate the importance of some of the above factors, results of investigations are presented fora site located in Angus Ontario, where a dissolved-phase PCE ground water plume from a dry cleaningfacility discharges into the nearby Pine River. Previous subsurface investigations at this site using theWaterloo Profiler (Pitkin, 1994; Writt 1996) and recent work (Conant, unpublished data) havedelineated a dissolved phase ground water plume that emanates from a PCE DNAPL source area. Theplume travels 205 m laterally through a shallow but locally confined aquifer before discharging upwardthrough a silt and peat semi-confining unit and then the sandy streambed deposits underlying the PineRiver. The plume is approximately 50 m wide and has a vertical thickness of 4 to 6 m. Water qualitydata collected with the Waterloo Profiler show that the peak PCE concentrations in the plume at thebank of the river (<5 m from the river) are about 8000 µg/5. Virtually no PCE degradation productswere detected in the aquifer beneath the stream bank. Drivepoint piezometers screened in the aquifer atthe river’s edge show that there is a strong upward hydraulic gradient at the river. These piezometershave water levels approximately 1 m higher than the river stage. Water quality testing beneath theopposite bank of the river shows that the plume does not pass beyond the opposite bank.
Periodic sampling of the river water where the ground water plume discharges has detected nocontamination, or very low PCE concentrations, generally less than 2 µg/5. No PCE degradationproducts have been detected in the surface water. The river is about 14 m wide and during most of theyear is generally less than 0.75 m deep and flows at approximately 1.5 to 2.9 cubic meters per second.The estimated total flux of dissolved PCE contamination traveling within the aquifer ground watertoward the river each year (expressed as equivalent pure phase PCE) is approximately 15 to 40 liters(Writt 1996). In the River channel massive dilution of the discharging PCE ground water plume by thesurface water occurs and the plume does not appear to significantly impact the surface water quality.However, high concentrations of contaminants within the streambed itself represent locations whereadverse ecological impacts may be occurring. At some locations, concentrations in water samplescollected from within the streambed were much higher than EPA’s Freshwater Aquatic Life ChronicToxicity Standard for PCE of 840 µg/5 and the Canadian Water Quality Guideline of 110 µg/5 for theprotection of aquatic life.
Proceedings of the Ground-Water/Surface-Water Interactions Workshop July 2000
28
River
1 2
HIGH PERM EABILITYAQUIFER
LOWPERM EABILITYSILTLY PEAT
NONE MO DERATE HIGHSubstream FlowDownw elling
SHORTCIRCUITSpringsSeeps
GeologicWindow
Sem i-Perm eable Deposits
Riverbed
43
LOW PERM EABILITY
Figure 2. Types of Groundwater D ischarge
Plume water traveling through the streambed deposits is subject to a wide range of hydrologicaland geochemical (redox) conditions which are spatially variable on a scale of centimeters to meters.Streambed temperature surveys have identified areas of the streambed dominated by ground waterdischarge. Hundreds of water samples have been collected to characterize discharge zones and locatethe plume. The Waterloo Profiler, the newly developed “Mini-Waterloo Profiler,” and “driveablemultilevel samplers” have been used to collect interstitial water samples from the streambed andunderlying shallow aquifer. These samples have been analyzed for both inorganic and organicparameters. Soil coring, ground penetrating radar surveys, and slug testing of streambed mini-piezometers have also been used to help develop a conceptual model of the subsurface system.
Four different types of flowconditions have been observedbeneath the river at the site and arebeen associated with varyinggeochemical conditions. The fourtypes of ground water flow in thestreambed include: no flow, shortcircuit, high flow, and low tomoderate flow (see Figure 2). In noflow locations, no ground water isdischarging to the stream as a resultof geological barriers or hydraulicbarriers like downwelling.Consequently, at those locations theinterstitial water in the streambed is geochemically quite similar to surface water and is notcontaminated. The “short circuit” condition refers to discharge at springs and seeps where PCEcontaminated ground water flows rapidly up through very localized gaps in the semi-confining unit andundergoes little or no attenuation or modification. In high flow areas, more permeable deposits resultin areas of higher ground water flux. These areas are reflected in strong temperature anomalies at thestreambed surface. More rapid flow and shorter residence times in the streambed deposits results in thedischarge of contaminated ground water that has been only briefly exposed to reducing conditions (i.e.,anaerobic and nitrate reduction). Consequently, PCE contaminated ground water has undergone verylittle degradation and attenuation. In the low to moderate ground-water discharge zones, contaminatedground water flows up through moderately permeable geological deposits where sulfate reducing andmethanogenic conditions occur and substantial reductive dehalogenation of PCE is indicated by thepresence of relatively high concentrations of degradation products (i.e., 100s to 1,000s of µg/5 oftrichloroethylene, cis-1,2-dichloroethylene, vinyl chloride, ethene, and ethane). PCE concentrations atone location dropped from about 3700 µg/5 to less than 50 µg/5 within a vertical distance of 15 cm andthere was a corresponding increase in the concentrations of degradation products which was primarilycis-1,2-dichloroethylene (see Figure 3). In low to moderate ground-water discharge areas PCEconcentrations in the streambed are reduced to below the EPA’s Freshwater Aquatic Life ChronicToxicity Standard. At some of those locations, however, 100s up to a 1800 µg/5 of vinyl chloride (ahuman carcinogen) has been created. The potential hazard posed by vinyl chloride is unknown becauseit does not have an aquatic life water quality standard or guideline. In the short circuit and high groundwater discharge zones the concentrations in the streambed were observed to be higher than the EPAstandard for PCE. At this site the potential impact of the plume is clearly quite spatially variable.
In terms of the overall plume behavior, it is important to note that the only place where substantialdegradation and transformation of PCE is observed is in the last 3 m of the plume’s flow path from thesource area. Some portions of the plume that have traveled 200 m laterally through the aquifer and
Proceedings of the Ground-Water/Surface-Water Interactions Workshop July 2000
29
Figure 3. Groundwater Concentrations at a Low to M oderate Discharge Zone
0 10 20 30 40
CONCENTRATION mg/L
0
25
50
75
100
125PCE
VC
CisDCE
TCE
0 2000 4000 6000 8000 10000
REDOX PARAMETERSVOCs
Fe
NO
DO
SO
M n
3
4
DE
PTH
CM
TOTAL VO Csas P CE
CONCENTRATION ug/L Larrive at the streambed as PCE, mayend up transforming completely anddischarging to the surface watercolumn as vinyl chloride or cis-1,2-dichloroethylene instead. At this site,water quality monitoring in the aquiferupgradient and immediately adjacent tothe river does not fully characterize thetype or concentration of contaminantsthat ultimately enter the surface water.
SUMMARY
Determining the location andmagnitude of contaminant discharges torivers from ground-water plumes is acomplex hydrogeological andbiogeochemical problem. Determiningspecific ground-water flow paths near a stream and its GWSI is not an easy task. Moreover, the effectof transport and fate processes on the plume near the GWSI and within streambed deposits may bequite different from those observed in the aquifer further away from the stream. Large changes ingeochemical conditions and plume concentrations may occur in the streambed over intervals of onlycentimeters, both vertically and horizontally. Measurements of ground water plume concentrationsmade adjacent to the stream or in the aquifer underlying the stream banks may not accurately reflecteither the concentrations of contaminants in the streambed or the contaminant flux that ultimatelyreaches the surface water. The Angus study shows that a range of different plume discharge behaviorscan occur at a single site and that closely spaced vertical and horizontal water quality sampling isnecessary to detect these behaviors. In some places, reactions in the streambed transformedcontaminants to daughter products and reduced the overall concentration of contaminants dischargingto the river. In other places no attenuation of contaminants occurred and aquatic life in the streambedat these discharge zones had the greatest exposure to the parent compound. Aquatic life in the surfacewater column is typically less at risk from ground water contamination than benthic organisms becauseof dilution with clean surface water. The current challenge for hydrogeologists is to assist ecologists inidentifying potential problem discharge zones so the toxicological impacts on benthic and hyporheicaquatic life can be assessed.
REFERENCES
Bear, J., 1979. Hydraulics of Ground Water. McGraw-Hill Book Company, New York, p. 569.Boulton, J. A., 1993. Stream ecology and surface-hyporheic hydrologic exchange: implications,
techniques and limitations, Australian Journal of Marine and Freshwater Research, v. 44, pp. 553-564.
Cherry, J. A., 1996. “Conceptual models for chlorinated solvent plumes and their relevance to intrinsicremediation,” Symposium on Natural Attenuation of Chlorinated Organics in Ground Water,Dallas Texas, Sept. 11-13. EPA/540/R-96/509, pp. 29-30.
Feenstra, S. and N. Guiguer, 1996. Dissolution of dense non-aqueous phase liquids (DNAPLs) in thesubsurface,” Chapter 7 in Dense Chlorinated Solvents and other DNAPLS in Ground Water, J.F.Pankow and J.A. Cherry Eds., Waterloo Press, Portland Oregon, pp. 203-232.
Proceedings of the Ground-Water/Surface-Water Interactions Workshop July 2000
30
Feenstra, S., J.A. Cherry, and B.L. Parker, 1996. “Conceptual models for the behavior of dense non-aqueous phase liquids (DNAPLS) in the subsurface,” Chapter 2 in Dense Chlorinated Solvents andother DNAPLS in Ground Water, J.F. Pankow and J.A. Cherry Eds., Waterloo Press, PortlandOregon, pp. 53-88.
Harvey, J. W. and K. E. Bencala, 1993. The effect of streambed topography on surface-subsurfacewater exchange in mountain catchments, Water Resources Research, v. 29, no. 1, pp. 89-98.
Larkin, R. G. and J. M. Sharp Jr., 1992. On the relationship between river-basin geomorphology,aquifer hydraulics, and ground-water flow direction in alluvial aquifers, Geological Society ofAmerica Bulletin, v. 104, pp. 1608-1620.
Pitkin, S. E., 1994. A point sample profiling approach to the investigation of ground watercontamination, M.Sc. Thesis, University of Waterloo, Waterloo, Ontario Canada. p. 167.
Rivett, R.O., S. Feenstra, and J. A. Cherry, 1994. Transport of a dissolved-phase plume from a residualsource in a sand aquifer, Journal of Hydrology. v. 159, pp. 27-41.
Toth, J. 1963. A theoretical analysis of ground water flow in a small drainage basins, J. Geophys. Res.,v. 68, pp. 4795-4812.
U.S. EPA, 1989. The Nature and Extent of Ecological Risks at Superfund Sites and RCRA Facilities,EPA-230-03-89-043, U.S. EPA Office of Policy Analysis, Office of Policy, Planning, andEvaluation, U.S. EPA, Washington, DC, p. 212.
U.S. EPA, 1991. National Results of NPL Characterization Project. EPA/540/8-91/069. U.S. EPAOffice of Solid Waste and Emergency Response, Washington DC, p. 108.
U.S. EPA, 1998. Technical Protocol For Evaluating Natural Attenuation of Chlorinated Solvents inGround Water, EPA/600/R-98/128, U.S. EPA Office of Research and Development, WashingtonDC, p.78.
Vaux, W.G. 1968. Intragravel flow and interchange of water in a streambed, Fishery Bulletin, 66, pp.479-489.
White, D. S., 1993. Perspectives on defining and delineating hyporheic zones, Journal of the NorthAmerican Benthological Society, v. 12, no. 1, pp. 61-69.
Winter, T. C., 1999. Relation of streams, lakes, and wetlands to ground water flow systems,Hydrogeology Journal, v. 7, no. 1, pp.28-45.
Woessner, W. W., 1998. Changing views of stream-ground water interaction, Eds. J. Van Brahana, Y.Eckstein, L.K. Ongley, R Schneider and J.E. Moore. Proceedings of the Joint Meeting of theXXVIII Congress of the International Association of Hydrogeologists and the Annual Meeting ofthe American Institute of Hydrogeology: Gambling with Ground water—Physical, Chemical andBiological Aspects of Aquifer-Stream Relations. Las Vegas, Nevada, Sept. 28-Oct. 2, 1998, pp.1-5.
Writt, R.J., 1996. The Angus PCE Plume—Aquifer Sedimentology and Plume Anatomy, MSc. ThesisProject, University of Waterloo, Waterloo, Ontario Canada, p. 200.
AUTHOR INFORMATION
Brewster Conant Jr., Department of Earth Sciences, University of Waterloo, Waterloo Ontario,Canada
Proceedings of the Ground-Water/Surface-Water Interactions Workshop July 2000
31
Assessment Approaches and Issues inEcological Characterizations
By G. Allen Burton, Jr. and Marc S. Greenberg
Ecosystems are extremely complex; consisting of a multitude of species that vary widely in thesensitivity to contaminants and who are dependent on each other to varying degrees. Ecosystems areroutinely impacted by natural disturbances (e.g., high or low flows, habitat alteration, foodavailability), some of which can be quite severe and cover over large areas (e.g., hurricanes, flooding,drought, anoxia, temperature shock, invasive species, disease). These natural disturbance events mustbe considered when trying to ascertain the role of human (anthropogenic) disturbances. Ecosystems arealso dynamic and vary through space (spatially) and time (temporally). These variations can beimportant at the millimeter scale where microenvironments determine nutrient and contaminantavailability. However, distances of kilometers may be more significant for biogeographical issues suchas forest fragmentation, foraging, and migration. Practical time scale issues vary in importance fromminutes to decades. So, when we try and discern whether or not ecosystems are impacted byanthropogenic disturbances, we must do so in the context of these ecosystem complexity issues. Theimportance of an anthropogenic disturbance, such as exposure to chemicals, follows these naturalspatial and temporal processes to a large extent. In other words, the significance of chemical exposureto an organism, population, or community may vary in importance over distances of mm to km andtime periods of minutes to years, depending on the organism’s behavior and the chemical’s fate.However, these somber realities of complexity are not insurmountable. The following discussion willshow effective ways of determining whether ecosystems are significantly impacted and which stressorsare causing the primary problems.
Traditional water quality assessments typically focus on water quality standards, which assume if asingle chemical criteria is exceeded then impairment to the receiving water or its beneficial usedesignation may exist. A limited number of states, such as Ohio and North Carolina, have alsodeveloped biocriteria, which rank indigenous fish and benthic macroinvertebrate communities intoclassifications ranging from poor to excellent. Toxicity testing of surrogate species, such as the fatheadminnow (Pimephales promelas) and water flea (Ceriodaphnia dubia), have been incorporated into theNational Pollutant Discharge Elimination System (NPDES) permit program for wastewater effluents.Toxicity testing requirements are occasionally incorporated into a permit and require testing ofupstream water, effluent, and near- and far-field receiving water samples. More recently, sedimenttoxicity test methods have been developed by the U.S. Environmental Protection Agency (U.S. EPA)(U.S. EPA 1994); however, these have not been incorporated into NPDES permits and have been usedto only a limited extent in assessments of aquatic ecosystem contamination. Each of these approacheshas associated strengths and weaknesses, describing one aspect of contaminant effects under a certainset of exposure assumptions, which may or may not be realistic. These approaches can be used withconfidence in situations where gross contamination exists. However, most of our currentenvironmental concerns are more complex and often of a chronic toxicity nature. Often in remediationprojects one must decide to what point or level clean-up should extend. In complex watersheds, thereoften is a need to decipher to what degree each potential source of pollution is contributing toimpairment. It is now well accepted by those in the field of ecotoxicology that an integrated approachthat combines several traditional assessment approaches, plus other non-standardized methods isnecessary to reduce the uncertainty of whether significant ecosystem contamination exists (e.g., Burton
Proceedings of the Ground-Water/Surface-Water Interactions Workshop July 2000
32
1999, Chapman, et al., 1992). This integrated approach is described below in the context of itsapplication to ground water and surface water transition zones.
All ecosystems and their resident species are stressed at one time or another. We tend to focus onthat subset of ecosystems where anthropogenic stressors are at issue. Since natural and anthropogenicstressors can be physical, chemical, or biological, the assessment process must consider all of them.Ecosystems, their interacting components, and the stressors which affect them are dynamic and not inequilibrium. So the assessment process must also consider organism exposures to stressors from amagnitude, frequency, and duration perspective. These realities dictate that an integrated assessmentcontain the components listed in Table 1.
Table 1. Elements of an Integrated Assessment of Aquatic Ecosystems
Chemistry Drainage area soil, water, sediment, pollutant sources, andtissues of key receptors
Low and highflow
Biota Benthos, fish, and fish-eating wildlife Seasonal
Toxicity Surface water, pore water and sediment (laboratory and insitu)
Low and highflow
Within the four general components of habitat, chemistry, indigenous biota, and toxicity theprimary stressors and receptors can be identified with the proper sampling and test design. Thisapproach can follow the ecological risk assessment paradigm whereby there is a problem formulationstep, followed by field and laboratory assessments of exposure and effects and finally a riskcharacterization via a weight-of-evidence approach.
For assessing potential contamination in ground water/surface water transition zones it is critical toteam hydrologists, hydrogeologists, aquatic biologists/toxicologists, and environmental chemists in theassessment process. A tiered assessment approach is the most cost effective way to conduct anintegrated assessment, eliminating the collection of data which may not be necessary (Table 2). Thespecific measurement methods that are used in these approaches should be optimized for each study,depending on the problem and questions being asked. For example, in freshwater systems this meansoptimizing the indicator species used for toxicity testing and response endpoints (e.g., sublethalbiomarkers, growth, reproduction, tissue residues, mortality), selecting the appropriate exposure in situ(e.g., surficial vs. deep sediments, small mesh to reduce suspended solids, UV blockers to preventphoto-induced toxicity from polycyclic aromatic hydrocarbons), or selecting the appropriate dataanalysis methods for the benthic invertebrates (e.g., metrics like Invertebrate Community Index,orthogonal comparisons).
Assessing the ecological significance of ground water/surface water transition zones will presentsome new challenges. Virtually no contaminant effects research has been conducted on biologicalcommunities which inhabit the hyporheic zones. It will be critical to establish good reference sites as apoint of comparison. These transition zones are particularly important in the storage and retention ofnutrients (and possibly contaminants), biological and chemical transformations, as a refugia forinvertebrates, and a base of the aquatic food web. Therefore, the measurement endpoints should befocused on determining effects on these traits. Appropriate measurement endpoints could include:indigenous microbial activity, organic matter/nutrient cycling (for more advanced studies), invertebrate
Proceedings of the Ground-Water/Surface-Water Interactions Workshop July 2000
33
community indices (meiofaunal and macrofaunal–grab and colonization), tissue residues of dominantspecies, in situ toxicity, and in situ physicochemical profiles (e.g., via peepers, datasondes).
If Tiers 1and 2 indicate that the surface or ground waters are toxic and/or are impacting theindigenous community then Tier 3 may be necessary to tease out which stressors dominate at the site.These are very site-specific based designs, but can include novel, yet proven, tools such as ecologicalfood web modeling, semi-permeable membrane devices (SPMDs) to look at bioaccumulation potential,toxicity identification evaluations (TIEs) which fractionate chemical classes for toxicity testing, andstressor identification evaluations (SIEs) which are in situ based TIEs but incorporate other physicalstressor determinations (Burton et al 1996 and 1998; Greenberg et al 1998), and more detailedcharacterizations of community effects and exposure dynamics.
REFERENCES
Burton, G.A., Jr., 1999. Realistic assessments of ecotoxicity using traditional and novel approaches,Aquatic Ecosystem Health and Management, v. 2, pp.1-8.
Burton, G.A., Jr., Hickey, C.W., DeWitt, T.H., Roper, D.S., Morrisey, D.J., Nipper, M.G. 1996. In situtoxicity testing: teasing out the environmental stressors, SETAC News, v. 16, no.5, pp. 20-22.
Burton, G.A., Jr., Rowland, C., Greenberg, M., Lavoie, D., and J. Brooker, 1998. Determining theeffect of ammonia at complex sites: laboratory and in situ approaches, Abstr. Annu. Meeting Soc.Environ. Toxicol. Chem. Charlotte, NC.
Chapman, P.M., Powers, E., and G.A. Burton, Jr., 1992. Integrative assessments in aquaticecosystems, in Sediment Toxicity Assessment, G.A. Burton, Jr. (ed.), Lewis Publishers, BocaRaton, FL. p. 167.
Greenberg, M., Rowland, C., Burton, G.A., Hickey, C., Stubblefield, W., Clements, W., and P.Landrum,1998. Isolating individual stressor effects at sites with contaminated sediments andwaters, Abstr. Annu. Meeting Soc. Environ. Toxicol. Chem. Charlotte, NC.
U.S. Environmental Protection Agency, 1994. Methods for Measuring the Toxicity andBioaccumulation of Sediment-associated Contaminants with Freshwater Invertebrates, Office ofResearch and Development, Washington, DC, EPA/600/R-94/024.
Table 2. Tiered Assessment Approach for Characterizing Ground water/Surface Water TransitionZone Contamination*
Tier 1a:Hydrological characterization of transition zone locations, upwelling vs. downwelling,rates, surface water dynamics.
Tier 1b:Characterization of benthic invertebrates (sediment surface and hyporheous, grabs,colonization, transplants) and habitat quality.
Tier 2: Toxicity testing of indicator species (sediment (laboratory); surface water (high and lowflow), surficial sediment and pore water (in situ)). Tissue residue analysis of Lumbriculusvariegatas (in situ exposure) and dominant indigenous species.
Tier 3: Site-specific studies to separate physical and chemical stressors with associatedchemical analyses, if needed.
* Assumes initial problem formulation process has identified contamination of ground water or surfacewater with potential transfer to the other.
Proceedings of the Ground-Water/Surface-Water Interactions Workshop July 2000
34
AUTHOR INFORMATION
G. Allen Burton, Jr. and Marc S. Greenberg, Institute for Environmental Quality, Wright StateUniversity, Dayton, Ohio 45435
Proceedings of the Ground-Water/Surface-Water Interactions Workshop July 2000
35
Delineation, Quantification, and Mitigation ofDischarging Plumes
By David R. Lee
INTRODUCTION
Methods have been developed for locating and sampling ground water and solute discharge areason the beds of surface waters. In many settings, these can aid in the assessment of natural attenuationor in estimating the direct flux of ground water contaminants to surface waters. Where plumes are notsufficiently attenuated by natural mechanisms before reaching surface waters, passive subsurfacetreatment methods, as exemplified by the Chalk River wall and curtain, are now demonstrated at fullscale. The purpose of this presentation was to highlight the author’s approach to these problems.
The concept of monitored, natural attenuation sounds good, but putting it into practice will takecareful work. If it has been difficult to monitor natural attenuation in relatively simple, well-characterized hydrogeological settings, then it will be even more difficult to perform such monitoringnear the beds of surface water bodies. Transients in flow and changes in water levels are only a part ofthe difficulty.
Another unappreciated difficulty, is the profound influence of geologic heterogeneity oncontaminant migration. Heterogeneity can result in orders of magnitude variations in flow within arelatively small volume of earth. Many people believe that hydraulic conductivities at a site vary byfactors of 1.2 to 1.5. However, in actual fact at most sites, hydraulic conductivities vary by factors of10 to 300! Since one of the controls on attenuation is ground-water residence time, attenuation mayvary widely across most sites. Therefore, the technical information on which to base an evaluation ofattenuation at real sites depends upon the determination of spatial distributions in flow, particularly onfinding the faster flow areas at each site.
Measurements of hydraulic gradient can indicate large discharge areas. However, the results ofnumerous seepage studies have shown that areas of rapid discharge can be small and easily missed. Ifnot located, zones of contaminant entry will not be assessed. In other words, if flow is focused, as itoften is, the impacts of the discharge and the processes or evidence for attenuation may have to bemonitored within the relatively small, fast-flow areas, which have the greatest potential for poorattenuation and transport of contaminants to surface. If flow rates exceed the required reaction times,the potential for subsurface attenuation may not be realized. High flow areas occur where there arepreferential flow paths, such as sand stringers or interconnected zones of higher permeability. Theareas where these flow paths intersect surface waters may be overlooked without thorough field work.Even in relatively homogeneous terrain, flow may be highly focused at the shorelines and transportmay be rapid.
IS ATTENUATION WISHFUL THINKING OR REALITY?
While it is reasonable to expect some attenuation for many contaminants at most sites, those whoseek to monitor attenuation or to measure impact face many pitfalls. Sampling must include the fasterflow areas in order for measurements of flow and contaminant concentrations to be representative. Ifthe act of sampling dilutes the ground-water concentrations, and this is easy to do near the
Proceedings of the Ground-Water/Surface-Water Interactions Workshop July 2000
36
sediment/water interface, the sample and the resulting chemical analyses may be inappropriate forcontaminant flux calculations. Thus conclusions may be biased and non-conservative as a result ofincomplete or improper sampling. It may be easier to find evidence for attenuation than to establishsufficient attenuation.
DEVELOPMENT OF METHODS TO LOCATE AREAS OF SIGNIFICANT DISCHARGE
There is a growing awareness that the application of existing technologies is key to validmonitoring of natural attenuation. One promising method is the sediment probe, a specifically designedfor the detection of ground water upwelling (Lee ,1985; Lee and Beattie, 1991). Towed behind amoving boat, the sediment probe is in contact with sediments, and it measures sediment properties.Once areas of ground water discharge have been found and delineated, they may be assessed usingtraditional, quantitative methods (Lee and Dal Bianco, 1994; Harvey, et al., 1997; Lee, et al., 1999).Traditional methods such as piezometers (e.g., Lee and Harvey 1996; Geist, et al., 1998) may be usedfor pore water collection and measurement of hydraulic head and conductivity. Under some conditions,seepage meters (e.g., Lee and Cherry, 1978; Lee. 1977; Lee and Hynes 1978) may be appropriate formeasuring the flux of ground water across the sediment/water interface.
The sediment probe has been used to find and confirm discharge areas on the cobble sediments andin the 2m/s currents of the Columbia River (Lee, et al. 1999). In that work, quantitative samplersshowed that, without exception, probe "hot spots" were areas of ground water inflow and some ofthese inflows bore contaminants.
The sediment probe has also been used to locate ground water discharge into the shallow ocean(Vanek and Lee, 1991). Other methods have been developed to aid in demonstrating attenuation nearthe interface (e.g., Lee, 1988; Winters and Lee 1987).
Having been proven in a variety of settings, the sediment-probe method is now ready for use inidentifying areas where it may be necessary to monitor attenuation, or the lack thereof. This isessentially a reconnaissance method, a targeting tool. It requires a slight contrast in dissolved solidsconcentrations between the ground water of interest and the overlying surface water. Where the plumeitself is different in dissolved solids, it can tell us, “No, the contaminant is not here,” or “Yes, it is,and, the signal keeps getting larger as we move in this direction.” By applying such methods, it ispossible to design a monitoring system for contaminant attenuation and to provide a basis for decidingwhether to rely on the process of natural attenuation. Clearly, in order to show that attenuation issufficient, it must be known where discharge occurs, particularly where it is most rapid, and evidenceof acceptable flux of solutes must be obtained.
There is potential for incorporating additional sensors on the sediment probe to make it sensitive toconditions other than electrical conductance.
DEVELOPMENT OF METHODS FOR PLUME MITIGATION
In settings where attenuation is found to be insufficient, subsurface treatment systems, like thosefirst described by McMurty and Elton (1985), can be constructed to enhance natural attenuationmechanisms and therefore minimize impacts on surface waters. An example of such a treatmentsystem is the wall and curtain at the Atomic Energy of Canada, Ltd.’s (AECL) Chalk RiverLaboratories.
Proceedings of the Ground-Water/Surface-Water Interactions Workshop July 2000
37
The wall-and-curtain treatment system was installed in 1998 to mitigate the discharge of astrontium-90 plume. In this system, contaminated ground water is directed through a subsurface,permeable, granular curtain of a natural, ion exchange mineral, called clinoptilolite. Based on theresults of in situ testing, clinoptilolite was highly absorbent for strontium. A bed of clinoptilolite 2 mthick was installed underground. It is predicted to retain the strontium-90 for at least 60 years, duringwhich time its concentration will decay to one-fourth (or less) of the input concentrations. It isexpected that this subsurface facility will operate passively at low cost with no maintenance except forthe required effluent monitoring. Unlike other methods for subsurface treatment, the wall-and-curtainprovides an adjustable capture zone and a single point of flow for checking regulatory compliance(Lee, et al., 1998).
FINAL COMMENT
In the process of exercising these methods at major contaminant sites, I have concluded that twofactors have combined to create a vicious circle. The factors are 1.general lack of understanding ofground water-contaminant seepage to surface water and 2. self interest among plume owners Thevicious circle is as follows: if there is little proof of a problem and little public understanding, there islittle regulatory demand for better information and little funding for developing and applying methods.
Many contaminant plumes have been mapped to the margin of a river, lake, wetland or estuary.But, there is little advantage for a plume owner to map it further unless this is required. Piped effluentsmust meet or exceed drinking water standards, but there is little enforcement of the same water-qualitystandards where it is a ground water contaminant plume, not a pipe-flow, that is entering surfacewaters. Without measurements, there is little understanding and no violations. Or, if measurements at 2or 3 points looked OK, then the discharge was deemed OK. We humans tend not to seek what we fearwe might find. When things are out of sight, they are out of mind.
CONCLUSION
Methods have been developed, applied successfully and have shown the movement of groundwater contaminants to surface waters. It is hoped that this workshop will result in broader applicationof the methods highlighted here and other, equally appropriate, methods that have not been mentioned(my apologies). Hopefully with the issuance of these workshop proceedings, the EPA will begin thetask of requiring site-specific evidence where natural attenuation is claimed to be a remedy, but is notmonitored, and will require mitigation where attenuation is not sufficient.
ACKNOWLEDGMENT
The support and collaboration of colleagues with Atomic Energy of Canada, the University ofWaterloo and the University of North Dakota and the help of several graduate students, was essentialto my work in this field for 30 years.
REFERENCES
U.S. Environmental Protection Agency, 1990. An Annotated Bibliography of the Literature AddressingNon Point Source Contaminated Ground-water Discharge to Surface Water (Draft), Office ofGround-Water Protection, Washington, DC, 302 pp.
Geist, D.R., M.C. Joy, D.R. Lee ,and T. Gonser, 1998. A Method for Installing Piezometers in LargeCobble Bed Rivers, Ground Water Monitoring & Remediation, v. 18, no. 1, pp. 78-82.
Proceedings of the Ground-Water/Surface-Water Interactions Workshop July 2000
38
Harvey, F.E., D.R. Lee, D.L. Rudolph, and S.K. Frape, 1997. Locating Ground water Discharge inLarge Lakes Using Bottom Sediment Electrical Conductivity Mapping, Water Resources Research,v. 33, no. 11, pp. 2609-2615.
Lee, D.R., 1977. A Device for Measuring Seepage Flux in Lakes and Estuaries, Limnology &Oceanography, v. 22, no. 1, pp. 140-147.
Lee, D.R. and J.A. Cherry, 1978. A Field Exercise on Ground water Flow Using Seepage Meters andMini-Piezometers, J. of Geological Education, v. 27, pp. 6-10.
Lee, D.R. and H.B.N. Hynes, 1978. Identification of Ground water Discharge Zones in a Reach ofHillman Creek in Southern Ontario Water, Poll. Res. Canada, v. 13, pp. 121-133.
Lee, D.R. 1985. Method for Locating Sediment Anomalies in Lakebeds that can be Caused by Groundwater Flow, J. of Hydrology, v. 79, pp. 187-193.
Lee, D.R., 1988. Six In Situ Methods for Study of Ground water Discharge, in Proc. of the Int.Symposium on Interaction between Ground water and Surface Water, May 30-June 3, Ystad,Sweden, pp. 556-566.
Lee, D.R. and W.J. Beattie, 1991. Gamma Survey Probe for Use on Ocean, Lake, Estuary and RiverSediments, U.S. Patent #5,050,525.
Lee, D.R. and R. Dal Bianco, 1994. Methodology for Locating and Quantifying Acid Mine Drainage inGround Waters Entering Surface Waters, in Int. Land Reclamation and Mine Drainage Conferenceand Third Int. Conference on the Abatement of Acidic Drainage, Vol. 1, Proceedings of aConference, April 24-29, Pittsburgh, PA, pp. 327-335.
Lee, D.R. and F.E. Harvey, 1996. Installing Piezometers in Deepwater Sediments, Water ResourcesResearch, v. 32, no. 4, pp. 1113-1117.
Lee, D.R., D.J.A. Smyth, S.G. Shikaze, R. Jowett, D.S. Hartwig, and C. Milloy, 1998. Wall-and-Curtain for Passive Collection/Treatment of Contaminant Plumes, in Designing and ApplyingTreatment Technologies (Eds. G.B. Wickramanayake and R.E. Hinchee), 1st Int Conf onRemediation of Chlorinated and Recalcitrant Compounds, May 18-21, Monterey, CA, pp. 77-84 .
Lee, D.R., D.R. Geist, K. Saldi, D. Hartwig, and T. Cooper, 1999. Locating Ground-Water Dischargein the Hanford Reach of the Columbia River, In preparation.
McMurty, D.C. and R.O. Elton III, 1985. New Approach to In-Situ Treatment of ContaminatedGround waters, Environmental Progress, v. 4, no. 3, pp. 168-170.
Vanek, V. and D.R. Lee. 1991. Mapping Submarine Ground water Discharge Areas—An ExampleFrom Laholm Bay, Southwest Sweden, Limnology & Oceanography, v. 36, no. 6, pp. 1250-1262.
Winters, S.L. and D.R. Lee, 1987. In Situ Retardation of Trace Organics in Ground water Discharge toa Sandy Stream Bed, Environmental Science & Technology, v. 21, no. 12, pp. 1182-1186.
AUTHOR INFORMATION
David R. Lee, Environmental Research Branch, AECL, Chalk River, Ontario, Canada
Proceedings of the Ground-Water/Surface-Water Interactions Workshop July 2000
39
Figure 1. Diagrammatic section through a stream channel showing the approximate position of thehyporheic zone during winter, low flow conditions
Field Technology and EcologicalCharacterization of the Hyporheic Zone
By D. Dudley Williams
The hyporheic zone is a 3-dimensional aquatic interstitial ecotone formed within the mixedsubstrate particles that comprise the bed of a natural, running water channel (Figure 1). It is a middlezone bordered by the surface water of the stream or river above, and by the true ground water below.Although it receives water from both of these sources, the relative strengths of input depend on theconfiguration of the bed materials and interstitial flow paths, and on the prevailing hydraulic heads.These heads vary spatially and seasonally to alter hyporheic habitat volume and to produce ragged-edged boundaries to the zone (Williams, 1993). Water that flows across these boundaries is subject tochanges brought about by distinctive, local chemical and physical properties, microbial processes, andmetazoan community dynamics.
Hyporheic research has been progressing at varying rates over the past 30 years, although, recently,progress has been more sustained and intense. Undoubtedly, one of the major factors that limitedprogress in the 1970s and 1980s was the perception that it is very difficult to sample the hyporheic
Proceedings of the Ground-Water/Surface-Water Interactions Workshop July 2000
40
zone in any meaningfully quantitative manner. True, extracting largely soft-bodied invertebrates fromthe interstices among highly heterogeneous and hard lotic bed materials is difficult. However, asufficient number of techniques now exists (some of them old, but with recent modifications) thatmakes ecological characterization of this zone possible.
Many running water invertebrates can be collected from hyporheic sediments. Typically, maximumdensities may occur around 10 to 40 cm below the streambed surface, but densities of 700invertebrates per 1 liter of sediment at 100 cm depths are not uncommon (Williams and Hynes, 1974).The hyporheic fauna itself has two main components (Table 1). Differences in the spatial and temporalresidence profiles of these two components suggest different functional roles for the two groups withinthe zone. Although not conclusively proven, there is evidence to suggest that the hyporheic zone mayact as a refuge from extreme conditions on the streambed surface (Williams and Hynes, 1977). Forexample, spates are known to wash benthic organisms downstream as surface substrates are scoured,and droughts and toxic pollutant plumes kill surface-dwelling animals (Hynes, et al. 1974; Williams,1987). The rapidity with which certain taxa recolonize these denuded substrates has been shown to bedue, at least in part, to vertical migration from the hyporheic zone (Dole-Olivier, et al., 1997). Again,the discovery of diapausing nymphs of the cool water-adapted winter stonefly Allocapnia vivipara inthe hyporheic zone during the summer warm-water phase of temperate streams is further evidence of arefugium (Harper and Hynes, 1970).
Table 1. The two primary components of the hyporheos (after Williams and Hynes 1974).
(1) Species derived from hypogean environments such as ground water, subterranean water bodies, andwaterlogged soil. These have been dubbed “permanent” members of the hyporheos as they completetheir entire life cycles in the interstices. The permanent hyporheos includes rotifers, nematode worms,oligochaetes, mites, copepods, ostracods, cladocerans, tardigrades, and syncarid and peracaridcrustaceans.
(2) Species derived from the streambed benthos—particularly the early-instar larvae of aquatic insects.These spend only part of their life cycles in the hyporheic zone, having to return to the stream surfacein order to metamorphose into a terrestrial, adult stage. These have been dubbed “occasional” membersof the hyporheos, although “transient” members may be a better term.
While the hyporheic zone is a fascinating system for the furthering of purely academic enquiry, italso is emerging as an important site for the transformation and storage of nutrients (Triska, et al.,1994). For example, nitrification, a major chemolithotrophic process, occurs in the hyporheic zone,converting the predominant form of inorganic nitrogen in incoming waters from ammonium to nitrate.Although the amount and rate of production of biomass contributed to the lotic food web by nitrifyingbacteria are typically lower than those generated by heterotrophs, in streams receiving high levels ofnitrogen from riparian agriculture production through nitrification could be quite significant. Similarly,bacterial alkaline phosphatase activity is known to occur in the hyporheic zone, and release ofphosphorus from organic P may supply this important nutrient to surface (benthic) and hyporheic biota.
In addition, there is some evidence that lithological and geochemical processes in the hyporheiczone may mediate the availability of N and P (Storey, et al., 1999). For example, substrate particlesthat have a high cation exchange capacity, as a consequence of their chemical composition and size,will tend to sorb inorganic P and ammonium. In the latter case, hyporheic sediments have the capacityto function as a transient storage pool for dissolved inorganic nitrogen. In these respects, the hyporheic
Proceedings of the Ground-Water/Surface-Water Interactions Workshop July 2000
41
zone should be of interest to water managers and conservationists, as custodians of national waterresources.
Hyporheic sampling techniques roughly fall into four categories (Table 2). Unfortunately, virtuallyall of these samplers have limitations. For example, well digging cannot be used in mid-stream and isnot very quantitative; freeze cores may drive organisms away as they form; mechanical corers mayhave depth or substrate particle size limitations; and artificial substrates may fail to re-establish naturalsediment profiles and/or detrital components. Further, many of these samplers have neither beenevaluated in more than one location, nor evaluated against each other.
Table 2. The four main categories of hyporheic samplers.
(1) digging of small wells in the exposed (above water) areas ofgravel bars and stream margins to reach the water table, and thenstraining the interstitial water so exposed through a fine-meshnet;
(2) freeze cores that use chemicals such as liquid nitrogen,liquid carbon dioxide, or a mixture of “dry ice” (crushed solidcarbon dioxide) and acetone or alcohol to freeze the substratearound a standpipe driven into the bed;
Efford (1960)Stocker and Williams (1972)Danielopol, et al. (1980)Bretschko and Klemens (1986)
(3) mechanical corers that, when driven into the bed, eitherisolate a sample of the surrounding substratum and its fauna forsubsequent removal, or suck up interstitial water and organismsfrom a desired depth;
Bou and Rouch (1967)Husmann (1971)Mundie (1971)Williams and Hynes (1974)
(4) artificial substrate samplers that involve placing a sterilizedportion of natural stream bed into perforated containers that aresunk into the bed and then removed after a desired period ofcolonization.
Moon (1935)Coleman and Hynes (1970)Hynes (1974)Panek (1991)Fraser, et al. (1996)
Recently, we compared the field performance of four hyporheic samplers at a single riffle on theSpeed River, Ontario (Fraser and Williams, 1997). These samplers were: the standpipe corer, thefreeze corer, a pump sampler, and the colonization corer. Each sampler was assessed, at differentsediment depths, for accuracy and precision in terms of total invertebrate density, taxon richness, andinvertebrate size distribution.
Since previous studies have concluded that the standpipe corer and the freeze corer, following insitu electropositioning, provide good estimates of hyporheic density (Williams,1981; Bretschko and Klemens, 1986), the a priori assumption was made to accept their dataas the accuracy standard. Sampler precision was calculated as the coefficient of variation (CV), whichis the standard deviation expressed as the percentage of the mean.
In terms of faunal density (Figure 2), the colonization corer estimates were significantly less thanthose obtained by the other three corers all of which produced very similar results.
In terms of overall taxon richness, there were no detectable differences among the samplers.Further, all of the samplers captured individuals representing greater than 90% of the available taxon
Proceedings of the Ground-Water/Surface-Water Interactions Workshop July 2000
42
pool. For example, all of the samplers captured nematodes, molluscs, ostracods, copepods, mites,mayflies, stoneflies, caddisflies, beetles, and dipterans. However, tardigrades were captured only bythe freeze and pump samplers; cladocerans were not captured by the freeze corer; and amphipods werenot captured by the pump sampler. In terms of the percent insect larvae captured (another measure oftaxon bias), the pump sampler collected the fewest, although this was significantly so only at a depthof 20 cm.
In terms of invertebrate size, as measured by chironomid larval length, there was a decrease withincreasing depth for all of the samplers. The only difference detected among the samplers was that, at20 cm, the pump sampler captured slightly smaller larvae than the other three.
For all four samplers tested and all of the measures compared (density, richness, and size), thelevel of precision was generally between 20 and 40%, but increased with depth. No sampler yielded aconsistently higher level of precision than any other.
The conclusions that may be drawn from this comparative study are:
(1) All four samplers would suffice for collecting purely qualitative data. (2) In terms of removing an exact, representative portion of habitat (to obtain absolute measures),
only the freeze corer qualified. However, and in support of the a priori assumption, nostatistical differences were detected between this sampler and the standpipe corer for any ofthe measured variables, at any depth.
(3) The colonization corer consistently underestimated total invertebrate density. (4) The pump sampler was capture selective both in terms of invertebrate type and size - the bias
towards non-insects and smaller insects probably reflecting a filtering effect of the interstices.
As to recommendations for possible standardization of hyporheic sampling are concerned,pragmatically the goals should determine the means. Some examples are given in Table 3. Regrettably,the holy grail of a perfect hyporheic sampler still seems to evade us and, indeed, may never beattainable. Nevertheless, samplers do exist that allow acceptable levels of sediment description, watersampling, and faunal characterization to be made—although perhaps not through one apparatus alone.Such techniques have the potential, either singly or in combination, to help researchers answer some ofthe sophisticated questions that 30 years of hyporheic study is now demanding.
Table 3. Examples of hyporheic samplers suited to specific information goals
(1) If survey information is required, relatively quickly, on invertebrate densities and types at avariety of depths, then the standpipe corer would be suitable. This corer has been shown to produce amean error density estimate of around 19%, and captures virtually all of the common taxa found in thehyporheic zone (Williams, 1981). Both Cummins (1975) and Elliott (1977) have suggested that thislevel of accuracy is acceptable in estimating benthic densities, and so perhaps the same should beapplied to the hyporheos.
(2) If a larger sample volume, together with a description of invertebrates and the undisturbedsediments in which they live, is required, then the freeze corer (preceded by electropositioning) wouldbe the choice.
(3) If periodic assessment (with moderate precision) of the hyporheos is required from a particularsite, with minimal, long-term habitat disturbance, then the colonization corer would be appropriate -especially if routine hydrogeological and chemical data are needed also.
Proceedings of the Ground-Water/Surface-Water Interactions Workshop July 2000
43
(4) The colonization corer also would be the most suited to manipulative studies of hyporheicdynamics—as it allows different combinations of hyporheic sediments (e.g., particle size and/ororganic content) to be presented for colonization.
ACKNOWLEDGMENTS
I am grateful to Brian Fraser and Richard Storey for allowing me to draw on some of their ideasand data from their respective University of Toronto theses. Their work was supported by grants fromthe Natural Sciences and Engineering Research Council of Canada Research. I would also like to thankBruce Duncan, U.S. EPA Region 10, for inviting me to attend the workshop.
REFERENCES
Bretschko, G. and W.E. Klemens, 1986. Quantitative methods and aspects in the study of theinterstitial fauna of running waters, Stygologia , v. 2, pp. 297-316.
Bou, C. and R. Rouch,1967. Un nouveau champ de recherches sur la faune aquatique souterraine.Compt. rend. hebd. s&inces de l’Acad. Sci., v. 265, pp. 369-370.
Coleman, M.J. and H.B.N. Hynes, 1970. The vertical distribution of the invertebrate fauna in the bedof a stream, Limnol. Oceanogr., v. 15, pp. 31-40.
Danielopol, D.L., Ginner, R. and H. Waidbacher, 1980. Some comments on the freezing core methodof Stocker and Williams (1972), Stygo News, v. 3, pp. 4-5.
Dole-Olivier, M.-J., Marmonier, P., and J.-L. Beffy, 1997. Response of invertebrates to loticdisturbance: is the hyporheic zone a patchy refugium?, Freshwat. Biol., v. 37, pp. 257-276.
Efford, I.E., 1960. A method of studying the vertical distribution of the bottom fauna in shallowwaters, Hydrobiologia, v. 16, pp. 288-292.
Fraser, B.G. and D.D. Williams, 1997. Accuracy and precision in sampling hyporheic fauna, Can. J.Fish. Aquat. Sci., v. 54, pp. 1135-1141.
Fraser, B.G., Williams, D.D. and Howard, K.W.F., 1996. Monitoring biotic and abiotic processesacross the hyporheic/groundwater interface, Hydrogeol. J., v. 4, pp. 36-50.
Harper, P.P. and H.B.N. Hynes, 1970. Diapause in the nymphs of Canadian winter stoneflies, Ecology,v. 51, pp. 925-927.
Husmann, S., 1971. Eine neue Methode zur Entnahme von Interstitialwasser aus subaquatischenLockergesteinen. Arch. Hydrobiol., v. 68, pp. 519-527.
Hynes, H.B.N., 1974. Further studies on the distribution of stream animals within the substratum,Limnol. Oceanogr., v. 19, pp. 92-99.
Hynes, H.B.N., Kaushik, N.K., Lock, M.A., Lush, D.L., Stocker, Z.S.J., Wallace, R.R., and D.D.Williams, 1974. Benthos and allochthonous organic matter in streams, J. Fish. Res. Board Can., v.31, pp. 545-553.
Moon, H.P., 1935. Methods and apparatus suitable for an investigation of the littoral region ofoligotrophic lakes, Int. Revue ges., Hydrobiol., v. 32, pp. 319-333.
Mundie, J.H., 1971. Sampling benthos and substrate materials, down to 50 microns in size, in shallowstreams, J. Fish. Res. Board Can., v. 28, pp. 849-860.
Panek, K.L.J., 1991. Migrations of the macrozoobenthos within the bedsediments of a gravel stream(Ritrodat-Lunz study area, Austria), Verh. Int. Ver. Theor. Angew. Limnol., v. 24, pp. 1944-1947.
Sassuchin, D.N. 1930. Materialien zur Frage uber die Organismen des Flugsandes in derKargisensteppe, Russ. Hydrobiol. Z. saratow v. 9, pp. 121-130.
Schwoerbel, J. 1970. Methods of Hydrobiology, Pergamon Press, Oxford, 200 pp.Stocker, Z.S.J. and D.D. Williams, 1972. A freezing core method for describing the vertical
distribution of sediments in a stream bed, Limnol. Oceanogr., v. 17, pp. 136-138.
Proceedings of the Ground-Water/Surface-Water Interactions Workshop July 2000
44
Storey, R.G., Fulthorpe, R.R. and D.D. Williams, 1999. Perspectives and predictions on the microbialecology of the hyporheic zone. Freshwat. Biol., v. 40.
Triska, F.J., Jackman, A.P., Duff, J.H. and Avanzino, R.J. 1994. Ammonium sorption to channel andriparian sediments. A transient storage pool for dissolved inorganic nitrogen. Biogeochem., v. 26.,pp. 67-83.
Williams, D.D., 1981. Evaluation of a standpipe corer for sampling aquatic interstitial biotopes.Hydrobiologia, v. 83, pp. 257-260.
Williams, D.D., 1987. The Ecology of Temporary Waters. Timber Press, Portland, Oregon, 205 pp.Williams, D.D., 1993. Nutrient and flow vector dynamics at the hyporheic/groundwater interface and
their effects on the interstitial fauna. Hydrobiologia, v. 251, pp. 185-198.Williams, D.D. and H.B.N Hynes, 1974. The occurrence of benthos deep in the substratum of a
stream. Freshwat. Biol., v. 4, pp. 233-256.Williams, D.D. and H.B.N. Hynes, 1977. The ecology of temporary streams II. General remarks on
temporary streams. Int. Revue ges, Hydrobiol., v. 62, pp. 53-61.
AUTHOR INFORMATION
D. Dudley Williams, Surface and Groundwater Ecology Research Group, Division of Life Sciences,University of Toronto at Scarborough, 1265 Military Trail, Scarborough, Ontario, Canada M1C1A4
DISCUSSION GROUP SUMMARIES
Proceedings of the Ground-Water/Surface-Water Interactions Workshop July 2000
46
Hydrogeology Discussion Group Summary
By Thomas C. Winter and Joseph Dlugosz
INTRODUCTION
The great variety of sediment types in the beds of most surface water bodies results in substantialvariability in the location and rates of seepage across the bed. The exchange of water between groundwater and surface water ranges from slow, diffuse seepage to rapid, concentrated flow at specificlocalities. Determining the location, rate, volume, and chemistry of water moving between these twocomponents of the hydrologic system is difficult, expensive, and highly uncertain. Nevertheless, theneed for understanding the hydrologic processes and measuring the interaction of water and dissolvedchemicals between ground water and surface water is fundamental to environmental management. Toaddress these challenges and needs, the hydrogeology discussion group focused on the hydrogeologicaspects of understanding and measuring the interaction of water and dissolved chemicals betweenground water and surface water at sites where ground water has been contaminated.
To focus the discussion on the interface between ground water and surface water, the group madeseveral presumptions: (1) the hydrogeologic framework of a site has been defined; (2) the source areaof the contaminant is known; (3) the flow pathways and plume configuration are reasonably welldefined; (4) the chemical characteristics and decomposition products of the contaminants are known;and (5) the contaminant is a potential threat to the environment. Given this information, it wassuggested that the actual determination of the movement of ground water to the surface water bodycould be accomplished through a tiered approach: A sequence of actions could be followed that beginswith a general reconnaissance of observable indicators of ground-water discharge and evolves to verydetailed and focused sampling of hydraulic head, chemistry, and biology.
This summary of the discussion group presents:
(1) Field methods that can be used for (a) reconnaissance of observable qualitative indicators ofground-water discharge to surface water, (b) direct measurement and calculated flow of waterbetween ground water and surface water using physical data, and (c) indicators of flowbetween ground water and surface water using chemical data;
(2) Considerations for temporal sampling of water flow and chemistry; and
(3) Variations of field sampling strategies that may be needed in different hydrologic landscapes.
The material presented here is considered to be a supplement to another EPA report (U.S. EPA,1991) that presented a review of methods for assessing non-point source contributions of contaminantsto surface water. Some of the information presented briefly in this summary is discussed in much moredetail in the EPA report.
Proceedings of the Ground-Water/Surface-Water Interactions Workshop July 2000
47
FIELD METHODS FOR DETERMINING THE INTERACTION OF GROUND WATER AND SURFACEWATER
Observable Qualitative Indicators of Ground-Water Discharge to Surface Water
Many indicators of ground-water discharge to surface water can be used to determine specificlocalities where a contaminant plume may be entering a surface-water body. The most commonindicators are seeps and springs; infrared mapping; aquatic plants; phreatophytes; unique sedimentzones such as mineral precipitates; water color; odor from contaminants; and mapping of lineaments infractured-rock settings. It was suggested that a field reconnaissance of these easily observablecharacteristics would identify specific localities where detailed measurements and sampling could befocused. If the skills of biologists are available, benthic organisms also can be useful indicators ofground-water discharge.
Observation of seeps and springs is relatively straightforward if the flow rates are high. Infractured-rock landscapes, mapping of lineaments can be useful if the fractures are open. Ground-water flow concentrated in the fractures enter surface-water bodies as springs. In settings whereseepage rates are low, it is easier to observe seeps during colder times of year when ground water andair temperatures are considerably different, because the water vapor above seeps is visible. Further-more, in climates where surface water freezes or snow is on the ground, areas of appreciable ground-water inflow remain open. The difference in temperature between ground water and surface water alsomakes infrared mapping a useful reconnaissance tool, especially in mid-summer when the difference intemperatures of ground water and surface water are at a maximum.
Some chemical constituents dissolved in anoxic ground water precipitate upon contactingoxygenated surface water. For example, iron and manganese oxides are common indicators of seepareas. Contaminated ground water commonly has color and odor. Water color and odor fromcontaminants can be used as an indicator of ground-water inflow, especially if the inflow consists ofthe contaminated water.
Aquatic plants can be indicators of ground-water discharge. The following are a few examples: (1)Swanson, et al. (1984) indicated that cattails are indicators of fresh ground-water input to saline prairielakes in North Dakota, (2) Rosenberry, et al. (in review) indicated that Marsh Marigold was anindicator of springs in Minnesota, (3) Lodge, et al. (1989) indicated that submerged aquatic plantbiomass was greater where ground-water inflow velocity was greater, and (4) Klijn and Witte (1999)discussed the relationship of plants to ground-water flow systems. In addition to aquatic plants, uplandphreatophytic plants near a surface-water body are indicators of the presence of ground water atshallow depths.
Benthic organisms can be indicators of ground-water discharge to surface water. Numerousexamples of the relationship of organisms to water flow and chemistry are provided by studies of thehyporheic zone beneath streams. With respect to lakes and wetlands as well as streams, ostracods areespecially useful because they have specific tolerances to water temperature and chemistry. Anadditional benefit to using ostracods is that some of the chemical constituents and isotopes that arepresent in the water while the organisms are alive are incorporated into their shells. Therefore, study ofostracod shells in sediments can provide a valuable record of past ground water and surface waterrelationships.
Proceedings of the Ground-Water/Surface-Water Interactions Workshop July 2000
48
Direct Measurement and Calculated Flow of Water Between Ground Water and Surface WaterUsing Physical Data
The reconnaissance methods discussed above may be useful for identifying locations of ground-water inflow to surface water, but they do not indicate the quantities of water that move across theinterface. Measurement of water quantity can be done by (1) using instruments that directly measurethe water flux, or a physical or chemical property from which flux can be calculated, at the specificlocality of the instrument (herein referred to as direct measurements); or (2) calculating the flux over abroader area of surface-water bed using streamflow data or ground-water flow nets. A drawback ofdirect measurements is that they sample a point in space, and, because of the great variation insediment types in most surface water beds, measurements need to be taken at many places in the bed.Furthermore, most measurements are taken at a point in time because the devices generally are notequipped with recorders. For these reasons, it also is desirable to calculate the flux through broaderareas of surface-water beds to obtain independent estimates of flux. This approach averages out thespatial variability of flux and it provides a check on values determined by direct measurements.
Direct measurements: Methods for directly measuring the flux of water between ground water andsurface water include the use of seepage meters, mini-piezometers, temperature profiles in thesediments, heat-flow meters, hydraulic properties of sediments determined from cores, and direct-contact resistivity probes. Although these were considered by the discussion group to be methods fordirect measurements, only seepage meters can be used for direct measurements of water flux. Theother methods use devices that make direct measurements of hydraulic head, hydraulic conductivity,temperature, or electrical conductance, and the water flux then needs to be calculated from these data.
Seepage meters are chambers (commonly, cut-off 55-gallon drums) that are set on the bed of asurface water body (Lee, 1977). After the chamber is pushed into and allowed to settle into thesediment, a tube is inserted into an opening in the top or side of the chamber. The tube has a small bagattached at the end and a valve positioned between the chamber and the bag. The bag can be attachedempty if ground water is known to be seeping in, or filled with a known volume of water if thedirection of seepage is unknown or if it is known that surface water is seeping out. To measure theflux, the valve is opened and the change in water volume in the bag over a given period of time is ameasure of flux per that period of time. Seepage meters are perhaps the most commonly used devicesfor measuring water flux between ground water and surface water, and different sizes and types ofchambers other than 55-gallon drums have been used. A number of studies have evaluated theuncertainties in using the seepage-meter method for determining flux through surface-water beds(Shaw and Prepas, 1990; Belanger and Montgomery, 1992). Seepage meters have been used largely tomake discrete measurements at a point in time, but a recording seepage meter was developed recentlyby Paulsen, et al. (unpublished manuscript) using ultrasonic flow technology.
Mini-piezometers are used to determine the hydraulic gradient between a surface-water body andthe ground water beneath it. A small diameter well is inserted into the surface-water bed, and, in themost common design, a flexible tubing is attached from the well to a manometer board. Another pieceof tubing is attached to the other side of the manometer and the other end is placed in the surfacewater. Both ground water and surface water are drawn into the manometer using a hand pump. Afterair is bled back into the manometer and the water levels in each tube stabilized, the difference in headcan be measured directly (Lee and Cherry, 1978; Winter, et al., 1988). The difference in head betweenground water and surface water can also be determined simply by measuring the level of ground waterin the well and the level of surface water outside the well. Mini-piezometers provide data only onhydraulic gradient. To determine water flux, hydraulic conductivity of the sediments need to bedetermined as well as the cross-sectional area of the flux.
Proceedings of the Ground-Water/Surface-Water Interactions Workshop July 2000
49
The transport of heat by flowing water has been used to determine the interaction of ground waterand surface water. By measuring the temperature of surface water and the temperature at shallowdepths in sediments, Silliman and Booth (1993) mapped gaining and losing reaches of a stream inIndiana. Sediment temperatures had little diurnal variability in areas of ground-water inflow because ofthe stability of ground-water temperatures. Sediment temperatures had much more variability in areasof surface water flow to ground water because they reflected the large diurnal variability of the surfacewater. This approach is useful for determining flow direction. Lapham (1989) used sediment-temperature data to determine flow rates and hydraulic conductivity of the sediments based onfundamental properties of heat transport. Heat-flow meters, consisting of a heating element and a ringof temperature sensors, placed at a distance from the heater, have been used to measure the rate anddirection of water movement through sediments. A pulse of heat is applied to a heating device and therate and direction of water movement is determined by measuring the time it takes for the heat pulse tobe sensed by the thermistors in the direction of flow.
Hydraulic properties of sediments can be determined by laboratory studies of sediment cores.These data can then be used to calculate ground-water flux if the hydraulic gradient and area ofsurface-water bed through which the water flux is taking place is known. Probes that measureelectrical resistivity have been used to locate contaminant plumes entering surface water. These probesare most effective if the conductance of the contaminant is substantially different than the conductanceof the ambient ground water.
Calculated from streamflow data and flow nets: The quantity of water moving between groundwater and surface water over scales larger than can be determined by direct measurement usingindividual sensors generally is determined by stream discharge data or by ground-water flow nets. Themost direct method for determining ground-water inflow or stream losses to ground water is to makestream discharge measurements at different locations along a stream. The difference in dischargebetween two localities is the quantity of gain or loss of water for the reach of stream between themeasurement sites. The accuracy of the values is related almost entirely to the accuracy of thedischarge measurements.
The flow-net approach is probably the most common method used for determining the interactionof ground water and surface water. The term flow net is used broadly herein as any calculation ofground-water flux, including simulation models, that makes use of a network of wells for determininghydraulic gradients, estimates of hydraulic conductivity of the geologic units and sediments, and cross-sectional area of the interface of ground water and surface water. The accuracy of the values is relatedto the quantity and quality of the hydrogeologic data, and the grid spacing that is justified by thesedata.
Indicators of Flow Between Ground Water and Surface Water Using Chemical Data
The chemistries of ground water and surface water commonly are different enough—especially atcontaminated sites— that some chemical constituents or isotopic properties of water can be used todetermine the interaction of ground water and surface water. Devices for collection of water samplesfor determination of the chemical characteristics of water passing through sediments consist of twobasic types: (1) collection at the sediment-water interface; and (2) collection at various depths in thesediment by inserting a device into the sediments.
Constituents: Nearly all chemical constituents have the potential to be useful in determining thecontribution of ground water to surface water. By calculating mass balances of the constituents, theflux of water can be quantified. Isotopes of some elements, such as nitrogen and radon, are particularly
Proceedings of the Ground-Water/Surface-Water Interactions Workshop July 2000
50
useful because in some cases a specific contaminant source can be identified. Isotopes of water areamong the most useful because they are part of the water molecule itself and are not subject tomodification by chemical reactions. The age of ground water can be determined by analyzing fortritium and chlorofluorocarbons, which are useful for identifying ground-water flow paths.
Sampling at the sediment-water interface: Devices that have been developed for sampling water atthe sediment-water interface include drag probes, seepage meters, diffusion bags, bubble collectors,and biosensors. Of these devices, seepage meters are the only ones that actually collect a water samplelarge enough to be analyzed in the laboratory for many constituents. Furthermore, by knowing thewater flux, the flux of a constituent or isotope can be calculated. Drag probes, such as used formeasurement of temperature, specific conductance, and radioactivity, are used primarily to locate areasof inflow. Vapor diffusion samplers are placed in the sediments and can collect certain contaminantsthat diffuse into the bag, and they also can measure microbiological activity through the production ofhydrogen. Devices that collect gas bubbles are used to determine the chemical constituents in thebubbles, which are an indication of the gases being produced in the sediments.
Sampling at depth in sediments: Devices that have been developed for sampling or measuringwater chemistry at depth in sediments consist of (1) multi-level samplers that are driven into thesediments; and (2) probes through which individual samples can be drawn from any depth—or aconstituent measured—but can then be driven deeper to collect samples at other specific depths.Examples of the first are pore-water peepers, gel samplers, and multi-level samplers. Pore-waterpeepers are blocks of plastic that have chambers machined into them at specified intervals (Hesslein,1976). A porous membrane is placed over the chambers and held in place by another cover of plasticthat has holes machined at the same intervals. The chambers are filled with deionized water, and thedevice is driven into the sediments. The device is left in place for a period of time for the chemicals todiffuse across the membrane and equilibrate with the ambient pore water (usually weeks). The deviceis then removed and the water in the chamber is extracted and analyzed. Gel samplers are similar, butthe collection device is a thin film of polyacrylamide gel that is placed on a flat Perspex probe, coveredwith a porous membrane, and held in place by a thin plate that has a window cut the full length of theprobe (Krom, et al., 1994). The device also is driven into the sediments and left to equilibrate (usuallyonly minutes to a day). After equilibration, the device is removed and the gel sectioned at any desiredinterval to obtain the samples.
Multi-level samplers are rigid tubes that have ports machined into them at specified intervals.Flexible tubing is attached to each port and brought to the surface. Water samples can then be drawnfrom individual ports using a pump at the surface. Squeezing or centrifuging pore water from segmentsof sediment cores can also be considered multi-level sampling. Of these methods, only rigid-tubemulti-level samplers can be used for repeated sampling of precisely the same location and depthbecause the device can be left in place.
Examples of probes through which water samples can be withdrawn, or a measurement made, froma single depth and then pushed deeper to collect other individual samples include mini-piezometers andGeoprobes.
CONSIDERATIONS FOR TEMPORAL SAMPLING OF WATER FLOW AND CHEMISTRY
The time interval for sampling water flow and chemistry depends on the phase of the program,physical characteristics or chemical constituents of interest, climatic setting, and hydrogeologic setting.In general, more sampling is needed in the initial phases of a program when the extent of a problem isbeing determined, and less sampling is needed for long-term monitoring. For example, it commonly is
Proceedings of the Ground-Water/Surface-Water Interactions Workshop July 2000
51
desirable to continuously monitor water flow and hydraulic head in the initial phases of a study tocharacterize the variability on daily, seasonal, and annual scales. At the same time, sampling forchemical constituents also needs to be done more frequently at this time to relate the concentrationsand mass transport of constituents to flow regime and to climate. Once the relationship of masstransport to flow and climate is reasonably well understood, the frequency of sampling can be reduced.
Hydrogeologic setting comes into play in sampling frequency because some settings are inherentlymore simple, thus easier to characterize and monitor flow and chemistry, than others. Similarly, theclimate that drives the hydrologic system is much less variable, thus easier to characterize and monitor,in some regions than in others. If a sampling program includes biological factors, sampling frequencymay need to include considerations related to the life cycles of the organisms.
An important climate consideration in both initial site characterization and long-term monitoring isthe effect of extreme climatic events. Extreme climatic events, such as droughts and deluges ofprecipitation, can have a greater effect on a site than many years of more normal conditions. Theseeffects include rearrangement of bed sediments, changes in water flow paths, mass-transport ofchemicals, and biological conditions of a surface water bed. One catastrophic event can greatly alterthe perception of how well a hydrologic system is understood, and how it should be managed ormitigated. Although difficult to anticipate, a plan for sampling during catastrophic events should be inplace.
VARIATIONS IN FIELD MONITORING AND SAMPLING STRATEGIES FOR DIFFERENTHYDROLOGIC LANDSCAPES
A generic field design for determining the interaction of surface water with ground water includesthe use of piezometer nests, water-table wells, and devices to measure or calculate the flow of waterand chemicals across the surface-water bed. The conceptual model in Figure 1 of the ExecutiveSummary shows ground-water seepage inflow on one side of the surface-water body and surface-waterseepage out on the other. Actual conditions could be as indicated, have ground-water inflow on bothsides, or have surface-water seepage out on both sides. The important point of the diagram is to stressthat the interaction of ground water and surface water can be reasonably well understood only byaddressing the larger-scale processes related to the position of the surface-water body within ground-water flow systems as well as the smaller-scale processes related to geology of the surface-water bedand climate.
The advantage of having permanent installations, such as wells and piezometers, in the upland isthat they can be easily equipped to obtain continuous records. The disadvantage of having theseinstallations is that they do not indicate the precise location or chemistry of seepage across thesediment-water interface. The advantage of the devices used within the surface-water body is that theycan be used to pinpoint the location, rates, and chemistry of seepage water. The disadvantage of usingthese devices is that few can be used to obtain continuous records. Furthermore, few devices usedwithin the surface-water body can be left in place for long periods of time because of floods, currents,ice, and water safety.
Although the generic field design may be applicable to many actual field settings, it is conceivablethat the design would need to be altered somewhat for different hydrologic landscapes. For example,some landscapes, such as riverine and coastal, have wetlands at the base of terraces in the uplands. If asource of ground-water contamination was located on the terrace, the contaminant plume couldconceivably discharge to the wetlands at the base of the terrace. In this case it would be desirable toplace an additional piezometer nest in the wetland. Other modifications to the field design might be
Proceedings of the Ground-Water/Surface-Water Interactions Workshop July 2000
52
related to the geologic complexity of the site. For example, if the geologic framework has a series ofaquifers and aquitards or lateral geologic discontinuities, it might be necessary to place piezometers inthe different geologic units in order to better understand the ground-water flow paths.
Frequency of sampling for chemical constituents also would depend on hydrologic setting. Forexample, in coastal areas affected by tides, the water flow and chemical transport paths could begreatly affected by the tidal exchange and storm surges. In northern and mountainous areas, runoff andground-water recharge from snow melt can have a substantial effect on ground-water flow paths andchemical transport.
Because of the variety of hydrologic landscapes and the variability of climate, a need exists fordevelopment of type localities that would become benchmarks for the various landscape types. Atthese type localities, design of field installations, effectiveness of various sensors and devices,sampling frequency, and study and site characterization approaches could be tested and evaluated.Such knowledge could lead to efficient and cost effective approaches to dealing with contaminatedsites in the hydrologic landscapes represented by a given type locality.
REFERENCES
Belanger T.V. and M.T. Montgomery,1992, Seepage meter errors: Limnology and Oceanography, v.37, pp. 1787-1795.
Hesslein, R.H., 1976, An in situ sampler for close interval pore water studies: Limnology andOceanography, v. 21, pp. 912-914.
Klijn, F. and J-P. Witte, 1999. Eco-hydrology: groundwater flow and site factors in plant ecology,Hydrogeology Journal, v. 7, pp. 65-77.
Krom, M.D., Davison, P., Zhang, H., and W. Davison, 1994, High-resolution pore-water samplingwith a gel sampler, Limnology and Oceanography, v. 39, no. 8, pp. 1967-1972.
Lapham, W.W., 1989. Use of temperature profiles beneath streams to determine rates of verticalground-water flow and vertical hydraulic conductivity, U.S. Geological Survey Water-SupplyPaper 2337, 35 pp.
Lee, D.R., 1977. A device for measuring seepage flux in lakes and estuaries, Limnology andOceanography, v. 22, p. 155-163.
Lee, D.R. and J.A. Cherry, 1978, A field exercise on groundwater flow using seepage meters and mini-piezometers, Journal of Geological Education, v. 27, p. 6-10.
Lodge, D.M., Krabbenhoft, D.P., and R.G. Striegl, 1989, A positive relationship between groundwatervelocity and submersed macrophyte biomass in Sparkling Lake, Wisconsin, Limnology andOceanography, v. 34, pp. 235-239.
Paulsen, R.J., Smith, C.F., and T-f. Wong. Development and evaluation of an ultrasonic groundwaterseepage meter, unpublished manuscript.
Rosenberry, D.O., Striegl, R.G., and D.C. Hudson. Plants as indicators of rapid ground-waterdischarge to a northern Minnesota lake, unpublished manuscript.
Shaw, R.D. and Prepas, E.E., 1990. Groundwater-lake interactions: I. Accuracy of seepage meterestimates of lake seepage, Journal of Hydrology, v. 119, pp. 105-120.
Silliman, S.E., and D.F. Booth, 1993. Analysis of time series measurements of sediment temperaturefor identification of gaining versus losing portions of Juday Creek, Indiana, Journal of Hydrology,v. 146, pp. 131-148.
Swanson, G.A., Adomaitis, V.A., Lee, F.B., Serie, J.R., and J.A. Shoesmith, 1984. Limnologicalconditions influencing duckling use of saline lakes in south-central North Dakota, Journal ofwildlife Management, v. 48, pp. 340-349.
Proceedings of the Ground-Water/Surface-Water Interactions Workshop July 2000
53
U.S. EPA, 1991. A review of methods for assessing nonpoint source contaminated ground-waterdischarge to surface water; U.S. Environmental Protection Agency Report EPA 570/9-91-010, 99pp.
Winter, T.C., LaBaugh, J.W., and D.O. Rosenberry, 1988. The design and use of a hydraulicpotentiomanometer for direct measurement of differences in hydraulic head between ground waterand surface water, Limnology and Oceanography, v. 33, pp. 1209-1214.
Proceedings of the Ground-Water/Surface-Water Interactions Workshop July 2000
54
Chemistry Discussion Group SummaryBy Allen Burton and Ned Black
INTRODUCTION
The chemistry discussion group agreed to adopt the broad term ground-water/surface-watertransition zone,” unless it was specifically addressing the classical stream hyporheic zone. In thissummary, individual topics that were discussed frequently over the course of the day are summarizedunder single headings. The group’s discussions sometimes veered into issues belonging to the biologydiscussion group, such as the importance of establishing clear reasons for adding the transition zonehabitat to the risk assessments performed at contaminated sites. Some group members expressedconcern that project managers should establish the justification for sampling a transition zone site (e.g.,complete pathways to receptors) prior to extensive use of the sampling and analytic techniques wediscussed.
An obvious—but important—point to remember is that the contaminants in question are the sameones (e.g., dissolved or NAPL chlorinated solvents and petroleum hydrocarbons, pesticides, dissolvedor particle-bound metals) that we encounter in contaminated ground waters and surface waters. Thus,we need to collect information on the same parameters we use to predict the geochemical fate of thesecontaminants in both ground water and surface-water bodies. We also need to collect the chemical andphysical information commonly used in ecological risk assessments and natural attenuation assess-ments to determine the dominant biological processes and the potential confounding factors inbioassays. Finally, we need to collect chemical information which helps locate zones where a ground-water plume or hyporheic flow is entering a surface-water body. There is overlap among theseparameters, but we should remember the three different uses of chemical information:
1. Contaminant chemistry and fate2. Biological processes3. Identification of flow paths
The transport of dissolved contaminants from surface water into the subsurface through hyporheicflow or ground-water recharge from a losing stream was included in our discussion of the transitionzone. With regard to flow paths and sources of contamination, the deposition of contaminatedsediments was excluded from our discussion. Other groups within EPA are addressing the issue ofcontaminated sediments.
It is possible to list many chemical and physical parameters (see below) to measure in order tosatisfy the three information needs listed above. As for any ecological risk assessment, a screeningprocess will determine what level of site chemistry characterization should be performed. In otherwords, it is not necessary to collect the same information at all sites. In order to justify extensive workon a site, a screen must demonstrate the presence of contaminants at levels sufficient to present risk toactual or potential receptors. For the chemistry discussion group, screening information also includedparameters for determining site geochemistry and contaminant flow paths, although collection of thisinformation might be deferred until after a screen.
One or more standard conceptual model should be developed to identify the important questions toask and data to collect at different types and scales of sites. Sampling efforts in the transition zone may
Proceedings of the Ground-Water/Surface-Water Interactions Workshop July 2000
55
be more costly than standard sampling of surface water or shallow ground water. At the very least,project managers and responsible parties familiar with only surface waters or only ground water willhave to be taught to use different tools.
LIST OF PARAMETERS AND TOOLS
Screening Tools
• Semi-permeable membrane devices (SPMDs)—Widely accepted as a presence/absence screening tool. Requires extensive calibration (e.g., ofequilibration times) and sensitivity analysis to determine exact concentrations. EPA researchers, incooperation with other government or academic scientists, should perform sensitivity experimentsto determine if there are situations where SPMDs can be easily used to measure concentrations.
• Drag probes for temperature, conductivity, and gamma anomalies— Useful in lakes, estuaries, and large rivers to determine zones of ground-water discharge.
• Piezometers and mini piezometers—Multiple piezometers with low-flow sampling can provide adequate samples of transition zoneinterstitial water and, of course, ground water. In order to sample just the transition zone, extremecare is required in depth placement of the screens. Piezometers can be placed both on land and instream or lake beds.
• Freeze sampling techniques—Typically used to obtain biological samples, but could also be used to sample water and substratumfor chemical analysis.
• Colonization corers—Also a biological sampler, but can incorporate nested piezometers.
• Bead pipes (ceramic beads).
• Dye tracers of ground-water and stream flow.
• Walk river bed with a hand auger.
• During low flow, note odor and visual observations.
• Photoionization detector (PID).
• Passive diffusion samplers.
• Analyze bubbles of gas (marsh or lake setting).
• Multi-level samplers.
• Seepage meters.
• Cores (solids analysis and visual).
Proceedings of the Ground-Water/Surface-Water Interactions Workshop July 2000
• Cores of trees (For instance, in a mangrove swamp. However, the contaminant may actually bemetabolized in roots so false negatives are possible.).
• Field chemistry with a HACH spectrometer (nitrate, ammonia).
• Chemetrics for sulfides.
• Differential global positioning system (GPS).
• Velocity meter.
• Tidal stage.
Post-Screening Tools
• Multi-level wells.
• Everything on screening tools list.
TIME SCALES
Hyporheic and transition zone chemical and biological processes follow several different timescales. At a minimum, these can be described as daily cycles (e.g., temperature and river stage),normal weather changes, invertebrate and fish life cycles, seasonal changes and long-term climaticchanges and events (such as extreme weather events). The difficulties of meshing the natural timescales of the environment with our schedules for sampling contaminated sites are shared with riskassessments and cleanups at all outdoor sites. Clearly, an environment such as the transition zone withstrong diurnal and seasonal controls on biology and chemistry requires multiple sampling events if wedesire great confidence that all pertinent processes are understood. And just as clearly, constraints onsampling budgets and the desire of regulators to respond to contaminated sites with an appropriatelevel of effort make limited sampling schedules the overwhelming norm. The most protective optionmay be to plan our sampling to coincide with the expected worst-case time of day and season. For thetransition zone in a variety of habitats, the worst case sampling time may not be known. Thus, one ofthe mandates of the Regional study areas recommended below will be to determine the worst (i.e., thebest) times to sample. For some transition zone habitats, recognized international experts will be ableto offer suggestions for sampling schedules.
SPATIAL CONSIDERATIONS
As with a ground-water plume, the spatial extent of contaminants is important information. Forsites with a contaminant plume flowing from the subsurface into a water body, the effect in thetransition zone may be limited to a discrete discharge zone. Also, the discharge zone for a contaminantplume may occur some distance from shore. An effective way to locate a discharge zone is to samplealong a series of transects in the ground water. For a stream, it is also important to sample the bankopposing the discharge area. It must be remembered that a ground-water plume can flow entirely undera stream without any discharge. For classic hyporheic transport parallel to the flow of a stream,discharge can occur anywhere in the bed. For a site with a hard substratum, the impact of the
Proceedings of the Ground-Water/Surface-Water Interactions Workshop July 2000
57
contaminants will be in the open water column. Although contaminants so discharged are anenvironmental problem, the impact on the transition zone, or the exact nature of the transition zoneitself, may be hard to define. In lakes, zones of discharge from and recharge to ground water can occurin complex patterns.
CONCENTRATION AND FLUX
In a screening or predictive risk assessment, contaminant concentrations are used for comparisonsto toxicity benchmarks. However, the flux, or loading, of contaminants is also important informationthat bears on both the impact of the contaminants on the habitat and on the physical, chemical, andbiological transformations of the contaminants at the transition zone. The flux of contaminants canchange in magnitude and direction with changes in surface water temperature and flow stage.
DETECTION LIMITS
The issue of detection limits for transition zone sampling is the same as for all other sites subject torisk assessments. Before a sampling and analysis plan is developed, the exact values of the toxicitybenchmarks to be used for screening purposes must be determined. Otherwise, the sampling budgetmay be used to collect information of no use to the risk assessors.
RECOMMENDATIONS
EPA should create a series of Regional study areas of contaminated transition zone sites, withappropriate uncontaminated reference sites. These would be studied by EPA Regional and ORDlaboratories and academic grantees. The sites should be scaled appropriately to the typical sites for theRegion. For instance, the hyporheic chemistry, biology, and hydrology of small mountain streamsimpacted by mines could be very different than a zone of chlorinated solvent-contaminated ground-water discharge in one of the Great Lakes. Ground-water discharge and hyporheic flow in estuarieswill have the further complicating factor of tides. Sites of all sizes will be encountered by the Agency.Members of the chemistry discussion group felt strongly that extrapolating from small streams to largerivers and lakes is unacceptable. Also, some methods work in small streams, but not in areas of highflow. As with any landscape approach, the species and the dominant chemical and physical processesof the environment change with different landscapes.
Proceedings of the Ground-Water/Surface-Water Interactions Workshop July 2000
1 Risk Assessment Forum. EPA/630-R-95/002F, April 1998. 171 p. http://www.epa.gov/ncea/ecorisk.html.
58
Biological Discussion Group Summary
By Cliff Dahm and Bruce Duncan
This session opened with the following question: “Is the hyporheic zone considered an ecologicalhabitat to be protected or a ‘treatment opportunity’ zone for restoration of contaminated ground-waterdischarges to surface water?”
The group agreed early in the discussion to define the zone of interest (the ground-water/surface-water transition zone) as the “transition zone” rather than use the term “hyporheic zone,” which has amore restricted meaning where surface waters and ground waters are actively mixing. Mixing in thiszone is very important, and in a stream, surface water moving into this zone can return back to surfacewater within a short distance and be “processed” through the transition zone multiple times.
An early question raised by the participants was how the zone can be defined biologically in orderto focus on and demonstrate exposure of organisms. This requires more than a hydrological definition.There also is a need to link the transition zone to valued resources, such as fish. If there is an impact onthe meiofaunal community, does that affect trout? This characterization of food web links, which isneeded to demonstrate risk and answer the question “who cares?,” led to two important points: (1)What are the important services that this zone performs? and (2) if these services are impaired, howcan we make that determination? Superfund managers now accept the importance of benthicmacroinvertebrates to stream ecosystems; there is not the same recognition for organisms such asmeiofauna or microbes in the transition zone.
Scale was another concern. There is a need to look at the spatial extent of impact to assess whetherthe contaminant discharge results in a risk to critical habitat such that action is warranted. Somehydrogeologists expressed frustration that they already know there is contamination in upwelling areas,but biologists countered that: (1) we do not know what the “pristine” state should be; and (2) even ifthe contamination is not cleaned up, there are other communities in other parts of the stream. So wouldanalysis of the transition zone really matter? One attitude was: If someone is discharging without apermit, then they are in violation. “Who cares” is not an issue. Often, “no action” is what happensbecause an adverse impact cannot be demonstrated over a realistic scale.
A concern was raised about the reluctance of managers to invest in studies of transition zones.Given that we are not successful in getting biological measurements in ground water or surface water,how can we convince managers to do biological measurements at the interface? How do you convincesomeone that the transition zone is important when there are competing resources requiring protection?The solution is to demonstrate the functions that occur in the transition zone and what happens whenthose functions are lost.
The Guidelines for Ecological Risk Assessment 1 should be used to evaluate the transition zone:
• Who is present or affected? What do stakeholders care about in the system? What are themanagement goals (some are predefined such as no net loss of wetlands, or meeting AmbientWater Quality Criteria)?
Proceedings of the Ground-Water/Surface-Water Interactions Workshop July 2000
59
• Identify the assessment endpoints (i.e., some biological entity or function that you care about), theexposures, the measurements to be made, and then the effects. The ecoological risk paradigmshould cover everything and help maintain a big picture perspective.
The link between contaminated sediments and contaminated ground water in the transition zonewas another issue. How is the issue of contaminated ground water different from the issue ofcontaminated sediment? The biological definition of the transition zone does not cover this; change inchemical conditions and rates are needed as well.
There are examples where removal of contaminants occurs within the transition zone with noremoval in ground water. Ground-water wells cannot reveal the full story. More thought should be putinto field sampling of mobile contaminants. You cannot just sample sediment. For example, you mighthave sand that appears very clean, but has contaminated ground water moving through it. Sediment andwater are part of a system and need to be dealt with together, not separately nor sequentially. Also,there is a need to consider the contribution from contaminated sediments (top down) into the groundwater. Sources need to be distinguished because of the polluter’s perspective.
During the presentation session on the first day of the workshop, the following questionspredominated:
• Why should we be interested in biology? • Why should the public care or be interested? • What are the services and processes that the transition zone provides? • Why is the transition zone important ecologically? • What biogeochemical measures would be ideal?
Participants were interested in contaminant migration and fate; others were interested in the effectson biological resources (macrobiota, communities, microbial processes) in the transition zone. Whenconsidering applicable biological measures, the biological discussion group had difficulty identifyingmicrobial measurements with broad applicability. There is good success with macroinvertebrateindicators, less so with microbiota and meiofauna. A multidisciplinary approach is needed to providesynergy.
The discussion followed three aspects of the transition zone: (1) Why is the zone importantecologically? (2) What are the methods that can be used to assess ecological structure and function?and (3) What research is needed to better determine the ecological importance of this transition zoneand to develop needed tools for sampling this zone?
WHY IS THE TRANSITION ZONE IMPORTANT ECOLOGICALLY? WHAT ECOLOGICAL SERVICESARE PROVIDED?
These issues led to additional questions: Do all transition zones need to be protected, especially ifyou see no impact to the surface water? Is there intrinsic value to the transition zone itself, apart fromthe surface water? Historically, people study “ecological entities.” The recent trend is to look attransition zones or ecotones. We do not know much about ecotones as an ecosystem entities. Thehyporheic zone is one important ecotone. Some surface organisms have a phase in the hyporheic zone,which implies that productivity could be affected. The hyporheic zone also serves as a “nursery” forsecondary producers. Less is known of the permanent hyporheic zone species—they often can bedistinct, undescribed species.
Proceedings of the Ground-Water/Surface-Water Interactions Workshop July 2000
60
The group discussed the importance of transition-zone function and compared it to wetlands.Regulations require restoration of wetlands if they are destroyed. This concept could be applied to thetransition zone; the goal could be to restore function rather than restore appearance (no net loss). It waspointed out that we need both function and structure (species).
Another question was “why should the public care about the important function of microbiology?”or “what would the environmental effect be from the loss of that function?” Several structural andfunctional elements are extremely important in this system. Transition zones often provide high qualityhabitat and are sites of contaminant reduction and nutrient and carbon cycling. A good example wasmade for fish. Three major biological services are tied to fish: refugia, food sources, and reproductivezones. The links from microbes to macrobiota to fish are essential to the aquatic food web. Trout areknown to seek out transition zones. When a river is contaminated, refugia can sustain the fish. Thetable below summarizes functional values identified for microbiota and macrobiota/fish.
Transition Zone Functional Values Microbiota Macrobiota/Fish
1. Food source2. Preferred habitat for some species (upwelling area)3. Refugia for macro (predator avoidance)(biodiversity)4. Microbially active zone5. Habitat for food base6. Cleaning zone (filters), vegetation, aquatic and riparian7. Energy transfer8. Discharge areas may have high biodiversity
�
�
�
�
�
�
�
�
�
�
(1) High quality habitats/refugia
Discharge zones can provide thermal refugia for anadromous fish both for resting and forspawning. Upwelling areas may be important by providing chemical/olfactory signals to anadromousand migratory fish. The zone provides a microbial food supply to the fish and the upwelling areas canact as incubators. Salmon need high quality water including cool water refugia in otherwise warmstream reaches. Conversely, ground-water discharge environments may be the only areas where it iswarm enough to survive in very cold areas. Snow dimples have been used for years as surfacemanifestations of ground-water discharges. Also, small areas in a lake could provide a large percentageof the trout population with support. These can be unique habitats and important energy sources.Certain fish seek out upwelling areas and shellfish may also live in these zones. Macrophytes (e.g.,shallow eelgrass beds) may also benefit. Macrophytes may establish preferentially in beds related todischarging ground water. Sometimes ground-water discharges into marine areas are the only areaswhere emergent vegetation can grow. Another question is whether some macroinvertebrates and fishavoid contaminated ground-water upwelling areas. Trout have good olfactory sense and will avoidmetals at concentrations well below toxic levels.
These zones also may limit benthic invertebrate exposure to low oxygen and contaminants bycreating oxygenated, clean zones. These zones may also be areas of plant and animal biodiversity.They can be areas of high water quality in alluvial aquifers. Some European countries are interested inidentifying high quality ground-water discharge zones (good quality refugia) in the midst ofcontaminated rivers to preserve as critical habitat.
Proceedings of the Ground-Water/Surface-Water Interactions Workshop July 2000
61
(2) Contaminant attenuation/removal.
The transition zone is important for chemical and biochemical reactions that influence the qualityof the ground water discharged into the surface water. Metals, halogenated organic solvents, polycyclicaromatic hydrocarbons, volatile organic compounds (VOCs), and nutrients can be degraded orremoved from ground water within the transition zone.
Volatile organic compounds (VOCs) were discussed in particular. The issue was whether there areconcentration thresholds of VOCs above which they poison biological communities. Where there is alarge VOC plume, there could also be bioaccumulating contaminants. If the VOCs were then degraded,but the bioaccumulative contaminants (e.g., PCBs, creosote) were not, then bioaccumulation oftoxicants still would occur. This has implications for remedial decisions, especially if contaminants arebrought in through ground water. Some participants expressed the opinion that VOCs are ignoredgenerally because their toxicity thresholds are much greater than those for heavier contaminants, andtherefore they seem to show no risk in the water column. However, risk thresholds based oncontinuous exposure to a hazard such as VOCs are different than those used in water quality criteria.
(3) Cycling of nutrients and carbon
Nutrients and carbon cycle very actively in this zone. Strong redox gradients enhance biogeo-chemical activity and microbial processes. Both aerobic and anaerobic processes often occur withinclose proximity of each other. Microbial biomass can serve as the base of a detrital food chain that canbe important to overall ecoystem productivity.
(4) Food base for benthic organisms
Microbes and fungi can provide food for other transition zone organisms that are more intimatelyinvolved in the benthic food web of the surface water body. Many macroinvertebrates use thetransition zone extensively, and they are food for other organisms. If the zone is contaminated, theresult for invertebrates could be mortality, biomagnification and/or bioaccumulation.
WHAT METHODS CAN BE USED TO ASSESS THIS TRANSITION ZONE ECOSYSTEM?
Current methods for studying transition zones generally are not standardized and sometimes notwell developed. For example, scales may be mismatched (wells are too big to sample over decimeter orcentimeter gradients). Regardless of these difficulties, it is very important that ecologically relatedsampling in the transition zone be coordinated with hydrogeological and chemical surveys at groundwater discharge sites. It was useful in the discussion to distinguish two groups of organisms,microbiota and meiofauna/macrobiota. It was noted that it is difficult (but important) to showcontaminant effects on these groups.
(1) Microbiota
a. Community structure. There is no standard method to determine microbial community structure.Some methods in use include culturing, metabolic profiling, fatty acid fingerprinting, molecularprobes, or nucleic acid characterization. These methods are either limited or time-consuming.Other methods involve 1) collection using ceramic beads or other artificial substrates that collect asample population in the transition zone; 2) artificial cores with natural materials; and 3) artificialhabitats/substrates. Procedures, methods, and equipment are usually designed to answer thespecific questions at hand. A method to evaluate drinking water called UDI (Under Direct
Proceedings of the Ground-Water/Surface-Water Interactions Workshop July 2000
62
Influence) was mentioned. The suggestion was made to focus on the algal community as asurrogate. The algal community and the benthic interface has diagnostic value because there is arich literature of algae as bioindicators. The comment was made that including diatoms would betime consuming and not too practical. A suggestion was made to develop tools to measure activityfirst, then measure structure.
b. Microbial activity/function. Again, there is no single ideal method. Methods in use or proposedinclude bioassays (such as the Microtox bioassay), determination of metabolic rates and pathways,describing the dominant terminal electron accepting process (methanogenesis, sulfate reduction,iron reduction, manganese reduction, denitrification, or aerobic respiration), measuring molecularhydrogen and testing for metal tolerance.
It may be difficult to generate interest in microbial function—microbes in septic tanks that provideorganic degradation are a familiar example. The transition zone is important for carbon cycling,nutrient cycling, and a detrital-based food chain. Contamination should not interfere with theseprocesses and the decomposer community. So, what would be the appropriate method to evaluatedecomposition? Is the desired method to identify the amount of carbon no longer available (tied up inligands or refractory) or metabolized?
Another suggestion was to evaluate biological oxygen demand (BOD) and/or chemical oxygendemand (COD). For example, the presence of soluble reduced metals will result in high COD andaffect interface chemistry. If ground water has high BOD/COD and dissolved oxygen (DO) is present,that observation is important. However, all agreed that BOD and COD are presently impossible toresolve across small scales, although fine-scale characterization of DO is possible.
2. Macrobiota/Meiofauna
a. Community structure. Several methods exist for sampling organisms in the transition zone (see D.Williams’ abstract on page 39 of this report) and various standard metrics can be computed(community composition, density, species richness). Benthic and ground-water taxa can bedistinguished.
b. Function. The following were suggested: bioaccumulation studies and stable isotope analyses (e.g.15N/14N, 13C/12C, and 34S/32S) for food chain relationships. Functional feeding groups can beevaluated.
It was suggested that these basics (community structure and function at all levels) be understoodfirst before developing more methods to conduct toxicity testing.
WHAT RESEARCH IS NEEDED TO BETTER UNDERSTAND THE ECOLOGICAL IMPORTANCE OFAND ASSESS EFFECTS ON THE TRANSITION ZONE?
(1) Basic biological research
Most recommendations centered around basic science needs regarding the transition zone (e.g., lifehistories, faunal surveys, activity measurements) and sampling/evaluation tools. Life historycharacteristics of transition zone organisms are generally lacking. Food chain relationships thatdescribe the linkages among microbial, meiofaunal and macrofaunal organisms also are lacking. Asuggestion was made to develop methods to conduct a subsurface biomass study. Because no largereference databases exist (compared with surface water data), faunal surveys should be done for major
Proceedings of the Ground-Water/Surface-Water Interactions Workshop July 2000
63
riverine ecosystems using a hydroclimatic landscape approach (see T. Winter’s abstract on page 46 ofthis report). These surveys would be used to develop reference conditions in a national database. Ifthere are differences between geographic areas, it may be best to look at functional differences ratherthan community differences so data can be compared across broad regions. The Chemistry Group alsosuggested establishing regional hyporheic study sites.
(2) Macrobiota
Species richness and growth could be evaluated. The physiology of transition zone invertebrates ispoorly known (e.g., O2 uptake rates and mechanisms are often unknown). Respiration studies areneeded as well as information on trophic structure. Stable isotopes of nitrogen might be an effectiveway to determine food chain relationships. Dissolved oxygen availability should be accuratelymeasured. Good biological indicators are as yet uncertain and likely vary for differing flow paths ordischarge zones. One should look at biological impacts but use chemical and hydrologic conditions tohelp define sampling zones.
(3) Indicators of ground-water discharge zones
The Chemistry Group discussed the scenario of a plume entering a stream and how to detecteffects in the subsurface. They suggested looking in four dimensions: vertically, horizontally,temporally, and downstream. In general, a point source will be easier to detect than a diffuse plume.You will need several transects across the river. What biological components should be measured?Potential electron acceptors and dissolved hydrogen are good biogeochemically informativeconstituents to measure. You can characterize the microbial community in many ways. Culturingmethods normally select for small subsets of the total microbial community. Molecular techniques alsocan be used, but presently none of these methods are easily and routinely applied.
Indicator choices depend on the question to be answered. Which attributes are you protecting?Microbial assays need to be used, even if these assays are not yet perfected. Promising techniques arecurrently under development. Morphological measurements in the system are easier to make thanbiological measurements. Intensive sampling near the point of discharge plus additional transectswould be useful. Sampling should include “vertical distributions” through the food chain.
(4) Biological indicators of GW discharge zones
Are there any biological attributes that help define ground-water discharge zones? For example,can you look for benthic algal blooms? Are fish numbers and distributions in context with otherindicators a useful means to locate discharge zones where high quality aerobic ground water is present.Some species may tend to remain in an area even if contaminated. The mechanisms by which fish andother species avoid contaminants is very complicated. Distribution of fish does not necessary followwater quality parameters. Are ostracods good indicators? The consensus was no. It was suggested thatmidge larvae might be better indicators for ground-water discharge zones. One documented indicator isthe presence of high biomass benthic algal mats, but this is limited to zones with enhanced nutrientdischarge. Some discharge zones are dead zones, especially where anaerobic, metal-rich ground watersare discharging. There is an important research need to try and correlate between bottom type andpatchiness with ground-water discharge. In lake ecosystems, these zones may be linked to aggregationsof zooplankton. Acoustic techniques that detect these aggregations may be able to locate ground-waterdischarge points in lakes
Proceedings of the Ground-Water/Surface-Water Interactions Workshop July 2000
64
(5) Chemical/physical indicators of ground-water discharge zones
Temperature and conductivity probes are simple, easily-used, and rugged tools for determiningground water discharge locations. These methods could be routinely used to guide sampling in manyaquatic ecosystems. Bottom drags with temperature and conductivity probes also can be considered ifsite conditions warrant. Protocols are needed to allow better comparisons among sediment samples anddata from temperature and conductivity probes. Although DO probes are somewhat unstable in thefield, investigators could use combined temperature, conductivity, Eh, and DO measuringinstrumentation to look for discharge zones. Oregon State University has a suite of fiber optic sensors/probes that are commercially available and potentially useful in these transition zones. Redoxmeasurements in the field are a problem because of a lack of equilibrium in many samples, and redoxpotential is often dominated by iron biogeochemistry. Tools needed for improved sampling of groundwater discharge zones include:
• Sampling devices to collect organisms effectively and quantitatively along transition zones; • Dependable and cost-effective geophysical and tracer tools to delineate transition zones and guide
biological sampling; and • Routine survey tools to better characterize microbial community structure and activity and assess
water quality and condition.
(6) Scale
Strong gradients in physical and chemical parameters commonly exist in the transition zone. Forexample, the distribution of redox sensitive solutes can be very steep. Sampling often must be at thecentimeter scale or finer resolution. All participants agreed that we need better methods to samplegradients and narrow transition zones. Microcosms or fine-scale bioassays may be approaches toconsider.
(7) Hydrology
Knowledge of hydrologic characteristics of the transition zone is crucial. For example, transpira-tion rates may be very important to the hydrology of these interface zones, but there are large regionaldifferences. Chemical and isotopic tracers may be the best methods to determine the effect of thetransition zone on overall stream quality. Some tracers also are sensitive to in-stream processes. Otherparticipants pointed out the need for subsurface measures in addition to surface water sampling.Unresolved questions include:
• What techniques are available for measuring the volume of water entrained into the hyporheiczone?
• What are biological consequences of remediation (pump and treat) that reverse flows in thetransition zone?
Injecting oxygenated water could change the redox chemistry within the hyporheic zone. Highlyregulated rivers (dammed) affect the hydrology of this interface as well.
(8) Signal-to-noise and partitioning sources
Some practical sampling questions were raised about characterizing the transition zone. How is itdifferent from a place without ground-water recharge or discharge? The responsible party will need toprove that the background contamination “noise” is greater than their contribution. How can you
Proceedings of the Ground-Water/Surface-Water Interactions Workshop July 2000
65
compensate for variability (from the regulator’s perspective)? We need screening tools (inexpensive)to identify the problem and focus the sampling. What methods can distinguish ground water fromsediment sources? Ground-water discharge may become contaminated as it flows through thehyporheic zone, becoming a “fingerprinting” challenge.
(9) Temporal variability
Temporal variability is important: hourly variability in the hydrology, chemistry, and biology of thetransition zone has been noted. When are the best-case and worst-case times for sampling; whichseason or seasons should be sampled? Different life stages have different susceptibilities andexposures. Ecologists and hydrogeologists need to collaborate. Ecologists can specify time of year anddepths of concern; hydrogeologists can determine the hydrologic regime and geochemistry.
(10) Remote sensing
Field studies combined with remote sensing now can be used to better understand theheterogeneity and landscape characteristics of transition zones. Hydrology and food resources forimportant species are not homogeneously distributed but often highly localized. Remote sensingprovides a tool for assessing landscape-scale patterns of hydrology and biotic distributions. Certainpatterns on the landscape (e.g., localized plankton blooms) may be surficial indicators of processesoccurring in the transition zone. Researchers and managers need to combine extensive and intensiveanalyses.
(11) Toxicity testing
Are there any non-lethal endpoints or tools that could be used to determine or screen for toxicity ontransition zone organisms? Growth studies are generally more sensitive than mortality or fecunditystudies. Are there any ground-water toxicity tests or ground-water bioassays? One suggestion was thatElmid beetle larvae in the hyporheic zone may be suitable test species.
(12) Nutrients
The role of transition zones in overall nutrient cycling is still poorly known. Nutrient effects needto be related to species effects, such as effects on sea grasses or corals. The management goal wouldbe to protect “normal” nutrient cycling. Most people live near coasts, and impacts on transition zonesthat affect riverine delivery of nutrients or ground-water discharge of nutrients in estuarine or coastalwaters are critical processes that need to be better understood and monitored. In general, we do notknow the trends in nutrient delivery from these transition zones for rivers, estuaries, or coastal waters.In addition, the rates and locations for nutrient transformations by microbial organisms in transitionzones in coastal regions deserves further study. There have been relatively few attempts at quantifyingthese processes.
Similarly, nutrient cycling processes in the hyporheic zone should be better studied. Hyporheiczones receive dissolved oxygen when surface water recharges ground waters. Oxygen participates inimportant biogeochemical processes such as aerobic respiration, nitrification, metal oxidation, sulfuroxidation, and methane oxidation. For example, if ammonium levels are high in ground waters,nitrification rates can increase and lead to higher concentrations of dissolved nitrate. Where theseprocesses occur and the seasonality of such processes can affect both surface water and ground waterquality. Can the portion of nutrient loading in a surface water body that is derived from ground waterbe distinguished from that derived from surface sources? The U.S. Geological Survey (USGS) has
Proceedings of the Ground-Water/Surface-Water Interactions Workshop July 2000
66
done some related work on this topic in Massachusetts. The contribution from ground water in pollutedareas is at least as great as the contribution from rivers in many coastal areas. Tools exist for toxicitytesting, but comparable tools do not exist for assessing impacts on nutrient cycling. What methodsexist to test whether nitrate is being removed or if that function is impaired? Researchers are workingon these methods, but they are not yet regularly employed in monitoring programs.
(13) Dissolved oxygen
The availability of dissolved oxygen plays a major role in the characteristics of ground waters intransition zones. Not all oxygen depauperate discharge zones are caused by pollution; some arenaturally low in DO due to hydrologic flow paths (residence time) and rates of microbial metabolismon sediment organic matter. Anaerobic ground waters may contain increased concentrations ofdissolved metals, sulfur, and methane. Dissolved oxygen is a master variable in processes andchemical characteristics of transition zones.
(14) Reference comparisons
A disturbed zone needs to be compared to a “normal” reference. How do you identify conditionsfor comparison? How can you identify effects of the contaminants? How can biological conditions beused as a reference? “Acceptable” conditions need to be defined. Some biotic species (e.g., caddisfliesand mayflies) can be used to define reference conditions. Paleontology tools can be used to determineprior conditions. Either reference or gradient comparisons can be used to evaluate changes. The grouprecommended assessments that allow cross-comparison after remediation (monitoring). The groupconsidered how to define reference conditions in ground water for a superfund site. One approachwould be to evaluate current approaches for macroinvertebrates. It would be crucial to locate samplesin ground water outside the area of influence. Defining what is meant by reference or referencecondition always is challenging. The area should have the same ground-water characteristics in termsof hydrology and chemistry, but without the contamination. This is difficult, because the plume may bea small part of the total ground-water discharge and dispersed contamination may be widespread at asite. It may be easy to find nearby discharge locations that apparently are not contaminated, but it willbe critical to carefully assess if these aquifer sediments and ground waters are actually notcontaminated.
(15) Correlations between hydrology, sediment, and biology
There have been some correlations described between hydraulic conductivity and ground-waterdischarge, but not further linked with the biology. Differences in biota occur between upwelling anddownwelling areas. Silty or clayey soils (sediments) can inhibit the ground-water flux. Most freshwatermacroorganisms do not like turbid water. There may be a juxtaposition of preferred soil type anddischarge zones. Adequate characterization of soil structure, porosity and organic matter content arenecessary. Clogging, percent organics, amount of DO, and other variables need to be measured.Organisms often preferentially select substrate, so standard artificial substrates sometimes can be usedas a surrogate for enhanced comparability between sites.
(16) Bioaccumulation
Diffuse flows and low concentrations of contaminants are hard to measure. Measuring biota thatreceive contaminants from multiple sources will increase the problem of documenting that a problemexists only from a single ground water source. Bioaccumulation is not always a problem. Lipid bagsmay not be a very good method for assessing bioaccumulation, because one of the main biological
Proceedings of the Ground-Water/Surface-Water Interactions Workshop July 2000
67
components is accumulation through the food chain. Semi-permeable membrane devices (SPMD) “fatbags” might be a better method. Another possible method would be to look at higher trophic levelssuch as fish. Nitrogen isotope signatures change over time and are dependent on the trophic level of theanimal. Therefore, fish 15N/14N ratios and bioaccumulation analyses can be used in combination todeduce an impact from contaminant delivery through ground waters to surface waters.
WHAT BIOLOGICAL MEASUREMENTS DO YOU WISH YOU HAD AT YOUR SITES?
During this discussion, participants identified key measurements that biologists, chemists, andhydrologists would have liked to have had in studies of transition zones:
• Botanical analysis indicative of natural acidic stream condition for studies consideringanthropogenic acidification. Sediment probes and piezometers have been used, but no biologicaldata have been collected.
• Sediment and interstitial water toxicity data on Daphnia. Toxicity testing in general would bevaluable as we usually get only chemical information. Would the results from those methods beany different than from existing bioassays?
• A test where you can measure impacts on nutrient cycling. • How many replicates can be processed to account for patchiness? How patchy can it get? • Toxicity tests for biota in the hyporheic zone following their reaction to exposure or accumulation
over time. The tests should be analogous to fish indicators (e.g., hiccuping) or integrative tests suchas bee pollen sampling of contamination over a certain radius.
There was general agreement that it would it be useful to develop a suite of toxicity tests formicrobes and invertebrates. Microtox is the only commonly used test (luminescence is the endpoint),usually for screening. Certain contaminants lower luminescence and many microbes thrive oncontaminants. Microbial toxicity tests therefore may not show anything. There is a lot of naturalvariability spatially and temporally in electron accepting process. Results depend on the location andtiming of sampling. Microtox is usually used for sediment toxicity. One needs to design and interpretthe test based on the endpoint of concern.
OTHER QUESTIONS/SUGGESTIONS
• Is organic carbon available to the food-base (labile organic carbon content) a sensitive indicator ofmicrobial activity?
• Can microbiota in the transition zone be thought of as sources of primary productivity likemicrobial communities in estuarine sediments?
• In Europe, invertebrate organisms are sometimes used as indicators of ground-water quality.Transition zone organisms in the U.S. also could be evaluated for their potential as indicators.
• How can adverse ecological impacts in the transition zone be recognized? Would an indication bewhen you do not have the anticipated biodiversity?
• What scale should be used to define adverse impacts? The scale depends on the site’s riskmanagement goal.
• Encourage thinking about the need to better integrate biology, hydrology, and biogeochemistry. • The workshop report should include references to available methods for microbial, epifauna and
meiofauna sampling. There are methods available for many species.
POSTER SESSION ABSTRACTS
Proceedings of the Ground-Water/Surface-Water Interactions Workshop July 2000
69
Transport Model of Contaminantsin Stream-Shallow Groundwater
Biogeochemical Processes•Aquatic chemistry (for example, O2 and pH)•Precipitation/Dissolution•Redox processes•Sorption/Desorption•Microbial activities
Stream-tracerexperiments
Detailed field and laboratory measurements
Figure 1. Coupling MPSA with transport model to identify the relative importance ofphysical and biogeochemical processes.
Use of Multi-Parameter Sensitivity Analysis toDetermine Relative Importance of ProcessesInvolved in Transport of Mining Contaminants
By Jungyill Choi, Judson W. Harvey, and Martha H. Conklin
ABSTRACT
Combining multi-parametric sensitivity analysis (MPSA) with stream transport modeling isproposed to determine the relative importance of physical and biogeochemical processes controllingtransport of mining contaminants in natural stream systems. The MPSA is based on a large number ofMonte-Carlo simulations to identify the sensitive parameters over a broad range of each parameter.This combined approach can provide an integrated view of transport processes of contaminants innatural stream system.
INTRODUCTION
The fate and transport of contaminants in streams and rivers are controlled by a variety of physicaland biogeochemical processes. The physical processes play an important role in determining the fate ofsolutes in surface-water environments. These physical processes include advection, dispersion,hyporheic exchange, and ground-water interaction. In many situations, however, the transport ofcontaminants are also greatly affected by biogeochemical processes, such as sorption/desorption,oxidation/reduction, volatilization, hydrolysis, biodegradation, and other biochemical reactions.Therefore, transport of contaminants in natural streams and rivers is best described by considering allof the relevant physical and biogeochemical processes simultaneously (fig. 1).
To answer the question about relative importance of factors, the sensitivity of a numerical transportmodel needs to be tested for the physical and biogeochemical parameters (processes) that are involvedin the forward transport model. However, traditional parameter-sensitivity analysis pertains to a
Proceedings of the Ground-Water/Surface-Water Interactions Workshop July 2000
70
particular point (localized) in the parameter space, which is defined by all possible combinations ofparameter values. Also, in the localized sensitivity analysis, the importance or sensitivity of a selectedparameter can be affected greatly by the values of other parameters, because the significance of oneselected process is usually dependent on other processes. Typically, the importance of biogeochemicalprocesses are highly dependent on the physical processes, whereas the physical processes are notaffected by the biogeochemical processes. For example, the biogeochemical reactions of solutes in thehyporheic sediments are enhanced by the prolonged retention time of solutes in these sediments.Therefore, to account for parameter interactions, the relative importance of the physical andbiogeochemical processes of the transport model can be evaluated more accurately by a generalized(multi)-parameter sensitivity analysis, which encompasses the entire parameter space (fig. 1).
This paper presents the concepts and procedures of multi-parameter sensitivity analysis (MPSA)that is used to determine the relative importance of transport processes
METHODOLOGY
A numerical transport model may include detailed field measurements as well as ill-definedparameters that cannot be measured with a high degree of accuracy in the field or in the laboratory.These ill-defined parameters will severely limit the accuracy of any single simulation and increase thedifficulty of assessing the relative importance. In an attempt to overcome this difficulty and torecognize the relative significance of parameters involved in the model, the sensitivities of simulationsresults to input parameters need to be evaluated by assigning either a range of variation or a degree ofuncertainty to each parameter and implementing a generalized sensitivity analysis (Hornberger andSpear, 1980; Chang and Delleur, 1992; Choi, et al., 1998; Choi, 1998). This multi-parametricsensitivity analysis (MPSA) followed the procedure proposed by Chang and Delleur (1992) and Choi,et al. (1998). The procedure includes the following steps:
• Select the parameters to be tested.
• Set the range of each parameter to include the variations experienced in the field and laboratorymeasurement.
• For each selected parameter, generate a series of, for example, 500 independent random numberswith a uniform distribution within the design range.
• Run the model using selected 500 parameter sets and calculate the objective function values.
• Determine whether the 500 parameter sets are ‘acceptable’ or ‘unacceptable’ by comparing theobjective function values to a given criterion (R).
• Statistically evaluate parametric sensitivity. For each parameter, compare the distributions of theparameter values associated with the acceptable and unacceptable results. If the two distributionsare not statistically different, the parameter is classified as insensitive; otherwise, the parameter isclassified as sensitive. Relative importance can be evaluated statistically if desired.
The objective function values of the sensitivity analysis usually are calculated from the sum ofsquared errors between observed and modeled values:
f = [x (i) - x (i)]o c2
i= 1
n
∑
Proceedings of the Ground-Water/Surface-Water Interactions Workshop July 2000
71
Select parametersto be analyzed
Make parameterset by random
number generation
OTISimplementation
Calculation ofobjective function
value
Comparison of thedistribution between
acceptable andunacceptable cases
Evaluate thesensitivity of each selected parameter
ic=500(ic:repeating times)
No
Yes
Mon
te-C
arlo
Sim
ulat
ion
Figure 3. Flow chart illustrating theprocedure of multiparametric sensitivityanalysis (MPSA).
“Insensitive”
p2
Cu
mu
lati
vefr
equ
ency
p1
Fre
qu
ency
p2
Fre
qu
ency
“Sensitive”
p1
Cu
mu
lati
vefr
equ
ency
Acceptable
Unacceptable
p1
R
p2
R
Acceptable
Unacceptable
Figure 2. Basic concept of multi-parametric sensitivity analysis (MPSA)using a hypothetical model with only two parameters.
where f is the objective function value and xC(I) and x0(I) are calculated and observed values,respectively. Observed values often are obtained from simulations that used the mid-points of thecharacteristic range for each parameters. The ranges for each parameter are determined from minimumto maximum values that are obtained from parameter estimations and field measurements through thestudy reaches. If the objective function value obtained from the simulation is less than a subjectivecriterion then the result is classified as acceptable, otherwise the result is classified as unacceptable.Three different objective function values often are tested for a subjective criterion. Those valuestypically define the 33, 50 and 66% divisions of 500 sorted objective functions.
The basic concept of MPSA is illustrated by using a hypothetical model with only two parameters(Figure 2). In addition, the modeling procedure of MPSA described above is summarized using aflowchart (Figure 3).
CONCLUSIONS
The combined efforts of forward modeling approach and generalized sensitivity analysis canprovide an integrated view and better understanding of contaminant transport processes in naturalstream systems. The multi- parametric sensitivity analysis especially helps identify the relativeimportance of physical and biogeochemical processes controlling the transport of contaminants.Furthermore, this methodology can provide a guide for future data-collection efforts and to orderresearch priorities.
Proceedings of the Ground-Water/Surface-Water Interactions Workshop July 2000
72
REFERENCES
Chang, F., and J.W. Delleur, 1992. Systematic parameter estimation of watershed acidification model,Hydrological Processes, v. 6, pp. 29-44.
Choi, J, 1998. Transport modeling of metal contaminants in a stream-aquifer system; University ofArizona, Department of Hydrology and Water Resources, unpublished PhD thesis, 225 pp.
Choi, J.Y., Hulseapple, S.M., Conklin, M.H., J.W. Harvey, 1998. Modeling CO2 degassing and pH in astream-aquifer system, Journal of Hydrology, v. 209, pp. 297-310.
Hornberger, G.M. and R.C. Spear, 1980. An approach to the preliminary analysis of environmentalsystem, Journal of Environmental Management, v. 12, pp. 7-18.
Proceedings of the Ground-Water/Surface-Water Interactions Workshop July 2000
73
Figure 1. Study reach and sampling sites at PinalCreek. Median pH values are shown for the study
period.
Measurements of Plant and AlgalBioaccumulation of Metals in Pinal and PintoCreeks, Arizona
By Justin C. Marble, Timothy L. Corley, and Martha H. Conklin
Dissolved Mn is an essential element for higher plant systems and is involved in photosynthesis(the Hill reaction) and activation of different enzyme systems (e.g., superoxide dismutase production)(Mukhopadhyay and Sharma, 1991). Critical deficiency levels of Mn(II) range between 0.01 to 0.02microgram Mn per gram (mg Mn(II) g-1) dry weight in dry mature leaves but vary tremendouslybetween plants (Mukhopadhyay and Sharma, 1991). Vascular plants and algae also require certainamounts of other trace metals for normal plant growth (Zn, Ni, Cu, Fe, Co, Ca, and Mg).
Although Mn(II) supplements can increase growth yields of plants, large amounts of Mn(II) caninterfere with the uptake of other trace metals (Mukhopadhyay and Sharma, 1991). In addition, excessconcentrations of Zn, Ni, Cu, Fe, and Co can trigger an inherent defense mechanism that plants havedeveloped that involves production of phytochelatins—polypeptides that bind metals (Ahner, et al.,1995). Phytochelatin production in response to high metal levels has been identified in land plants,vascular aquatic plants, fungi, and marine and freshwater algae. This mechanism results in anaccumulation of the excess metals within the plants with the final metal concentration often beingsignificantly higher than found in water supplied to the plants.
The work reported in this paper focuses on bioaccumulation of metals by aquatic plants, algae, andmoss in Pinal Creek, an Arizona State Superfund site, near Globe, Arizona, that has been contaminatedby acid-mining activities in the area. The primary purposes of this study were to determine the extentto which metals were taken up by the diverse plant community at Pinal Creek and to determine whichplants were particularly effective at bioaccumulation of metals. To further aid in our assessment of thepotential role of plants as a sink for metal contaminants in Pinal Creek (Figure 1), comparisons ofmetals uptake were made with other measurements reported for similar plants in Pinto Creek, also nearGlobe, Arizona. A comparison of typical surfacewater data for Pinal and Pinto Creeks is given inTable 1.
Plant grab samples were collected from severallocations and rinsed with creek water to remove insects and loosely attached sediment material. AtPinal Creek, plant samples were collected fromsites Z0, J2-1, J2-5, J2-15, and Z11 (Figure 1). AtPinto Creek, grab samples were collected from twoUSGS stream gaging sites 09498501 (belowHaunted Canyon near Miami, Arizona) and09498502 (Pinto Creek near Miami, Arizona).
Proceedings of the Ground-Water/Surface-Water Interactions Workshop July 2000
74
After rinsing with creek water, the plant samples were placed in plastic bags and put into a cooler.Upon arrival at the laboratory, samples were dried at 60°C for 24 hours. Dried samples were groundand sieved, then digested with nitric acid. Digested plant samples were analyzed by flame or graphiteatomic absorption spectroscopy for different metal concentrations. Results are reported asbioaccumulation, i.e., mg of metal per kg of dried plant material (mg kg-1). The values reportedrepresent the average of 2 subsamples with the maximum and minimum values measured being within±2 percent of the average value.
The aquatic plant species found at Pinal Creek varied in type and density depending upon the timeof year and the location. Before plant sampling started in 1996, water speedwell (Veronica anagallis-aquatica) and rabbitfoot grass (Polypogon monspeliensis [L.] [Desf.]) dominated the upstream portionof Pinal Creek (J2-1) and algae (e.g., Microcystis, Vaucheria, and Oocystis) dominated in thedownstream section (J2-15). However, over the study period (November, 1996 through June, 1997),water speedwell, rabbitfoot grass, and algae were found along the entire study reach.
Water speedwell from Pinal Creek was collected from several field locations (Z0, J2-1, and J2-15)over a period of 8 months and analyzed for Mn(II). There was no obvious correlation betweensampling date and bioaccumulation of Mn at J2-1 and J2-15 . A subset of the water speedwell samplesfrom sites J2-1 and J2-15 were analyzed for other trace metals (Table 2). No trend with location wasobserved for concentrations of Fe, but Zn and Ni were higher at J2-15 than at J2-1 and Cu was higher atJ2-1 than at J2-15. Bioaccumulation of Mn and Co exhibited consistently higher bioaccumulation at J2-15 compared to J2-1, about a factor of 2 difference.
Table 1. Physical and Chemical Values for Pinal Creek(Z0 on January 25, 1995) and Pinto Creek (near Miami,Arizona, on June 18, 1997, USGS). (mg L-1 except for pHwhich is in standard pH units).
Table 2. Water speedwell bioaccumulation from PinalCreek collected on December 1996 and January 1997 forMn, Zn, Ni, Cu, Co, and Fe (units are mg kg-1).
Proceedings of the Ground-Water/Surface-Water Interactions Workshop July 2000
75
Rabbitfoot grass samples from J2-1 and J2-15 were also analyzed for Mn, Zn, Ni, Co, and Fe (Table3). Both upstream and downstream sampling sites had similar bioaccumulation values for Zn and Ni,but Mn, Cu, Co, and Fe values were larger at site J2-1 than J2-15. A factor of about 2 between values atJ2-1 and J2-15was observed for Mn, Co, and Cu, and a factor of about 10 for Fe. Bioaccumulation ofMn at both sites was also greater than the other metals. Duckweed (Lemna minor) was less widelydistributed than either water speedwell or rabbitfoot grass, and was typically only found in slowmoving or stagnant water near the banks of the creek. However, a sample collected from J2-5 on June25, 1997 (pH 7.1, Mn(II) concentration 47.0 mg L-1) had an Mn concentration of 10760 mg L-1.
Metal J2-1 J2-15 Table 3. Rabbitfoot grass bioaccumulation in samples from PinalCreek collected on January 31, 1997 (units are mg kg-1).Mn 13600 5240
Algae is prolific at both Pinal Creek and Pinto Creek and grab samples at both sites included the speciesMicrocystis, Vaucheria, and Oocystis. Samples were collected from both creeks to comparebioaccumulation of Mn (Table 4). Although Pinal Creek samples had more bioaccumulation, the ratios ofplant concentration to surface water concentration were greater in the Pinto Creek samples.
Site Date Mn Table 4. Algae samples from Pinal Creek and Pinto Creek:bioaccumulation of Mn (mg kg-1).Pinal, Z11 7/17/96 49700
Water speedwell collected from Pinto Creek had lower bioaccumulation of Mn than samples collectedfrom Pinal Creek (Table 5). However, the ratios of Mn concentrations in water speedwell to the surfacewater concentrations were significantly higher in Pinto Creek than found for Pinal Creek. Similardifferences were apparent from comparisons of the algae samples collected at Pinto and Pinal Creeks
Site Date Mn Table 5. Water speedwell bioaccumulation(mg kg-1) in Pinal and Pinto Creeks.Pinal, J2-1 6/25/97 3870
Pinto, HauntedCanyon
6/18/976/18/97
50597
Pinto, Miami 6/18/97 47
These studies indicate that water speedwell, rabbitfoot grass, and algae bioaccumulate Mn.Bioaccumulation of Zn, Ni, Co, Cu, and Fe was also observed in water speedwell and rabbitfoot grass.Comparisons between water speedwell and algae samples collected from Pinal Creek and Pinto Creeksuggest that at Pinal Creek the plant capacity for metal uptake may have been reached and/or that metaltoxicity effects must be considered. Water speedwell and other aquatic plants are prolific in Pinal Creekand could play a significant role in determining the fate of metal contaminants entering the stream.Additional data concerning the total biomass in the system, and the potential release of metals as plants
Proceedings of the Ground-Water/Surface-Water Interactions Workshop July 2000
76
die and decay, are required to assess the potential and actual contribution of plants to total metals removalin this system.
ACKNOWLEDGMENTS
This publication was made possible by grant number P42 ESO4940 from the National Institute ofEnvironmental Health Science with funding provided by EPA and by grant number EAR-95-23881 fromthe NSF. Its contents are solely the responsibility of the authors and do not necessarily represent theofficial views of the NIEHS, NIH, or EPA, or NSF.
REFERENCES
Ahner, B.A., Kong, S., and F.M.M. Morel, 1995. Phytochelatin production in marine algae—Aninterspecies comparison, Limnology and Oceanography, v. 40, pp. 649-657.
Mukhopadhyay, M.J. and A. Sharma, 1991. Manganese in Cell Metabolism of Higher Plants, TheBotanical Review, v. 57, pp. 17-149.
U.S. Geological Survey, 1997. unpublished data of chemical and physical parameters from Pinto Creeknear Miami, AZ, Station Number 09498502, Lab ID 1830173, June 18.
AUTHOR INFORMATION
Justin C. Marble, Timothy L. Corley, and Martha H. Conklin, The University of Arizona, Departmentof Hydrology & Water Resources, Tucson, Arizona.
Proceedings of the Ground-Water/Surface-Water Interactions Workshop July 2000
77
Shark River Slough
Tayl
or S
loug
h
C-1
11
Miami
Bicayne Bay
Long Key
Big Pine
Key Largo
Florida Bay
Offshore wells
Flamingo
AB
CD
E
F
G
H
Solution Hole
Figure 1. Florida Bay separates the Florida Keys, located off the southern tip ofFlorida, from the mainland. Water samples were collected primarily from north ofLong Key and East of Flamingo. Groundwater samples from offshore wells werecollected where indicated by the circles. Letters refer to locations mentioned inthe text: A. Carysfort Reef; B. Algae Reef; C. French Reef; D. Molasses Reef; E.Rock Harbor; F. Porjoe Key; G. Black Betsy Keys; and H. Tavanier Basin.(Figure from Corbett et al., 1999)
Tracing Groundwater Flow into Surface Watersby Application of Natural and Artificial Tracers
By D. Reide Corbett, William Burnett, Jeffrey Chanton, and Kevin Dillon
Submarine groundwater discharge (SGD) is an often overlooked yet possibly significant process inthe geochemical and nutrient budgets of marine nearshore waters. According to Johannes (1980) “SGDshould occur anywhere that an aquifer is hydraulically connected with the sea through permeable rocksor bottom sediments and where the head is above sea level.” Such conditions are met in most coastalareas. This process may be significant for transport of limiting nutrients in pristine coastal areas or, inthe case of polluted aquifers, could be an important source of contamination to the marineenvironments. The problem is how to assess the extent of the groundwater flow and how to linkenvironmental problems with specific sites of contamination. Due to the extreme temporal and spatialvariability of many of these variables, the exact location of problematic discharges into coastal regionsmay be difficult to determine by monitoring standard water quality constituents (e.g., NOx, turbidity).In this research, subsurface water movement was evaluated with natural and artificial tracers in thekarst limestone of the Florida Keys (Figure 1).
In the Florida Keys, naturaltracers (222Rn and CH4) wereused to locate areas ofincreased groundwater/surfacewater interactions byreconnaissance surveys of theconcentrations of radon andmethane in the bay waters(Corbett, et al., 1999). Thesetrace gases function as naturalindicators of submarinegroundwater discharge intostanding bodies of water due totheir significantly higherconcentrations in groundwaters(Cable, et al., 1996a, b; Bugna,et al., 1996). General trends insurface water concentrationwere established by contouringdata from each tracer surveywith a kriging method by useof the software packageSurfer® (Golden Software).Although kriging interpolatesbetween data points, creatingsome artifacts, the generaltrends described areindependent of the contouring
Proceedings of the Ground-Water/Surface-Water Interactions Workshop July 2000
78
Figure 2. Contours of radon (A) in dpm L-1 and methane (B) in nM forsamples collected in June/July 1997. Solid crosses indicate samplinglocations. Note the darker contours, indicating higher concentrations ofboth parameters, near the upper Keys. (Figure from Corbett et al., 1999)
method or a reasonable changein contouring concentration.Examination of these contourplots showed very littleapparent seasonal variationthroughout the study period.During each period wesampled, high concentrationsof both tracers were observednear the Keys. Plots for 222Rnand CH4 in summer 1997 showthe typical trends observed(Figure 2). Directmeasurements of groundwaterflux via seepage meters werealso made in several differentareas of Florida Bay. Radonand methane concentrations inwater samples collected fromwells, springs, canals, andFlorida Bay showed asignificant correlation, despitethe fact that the two tracegases have independent sourceterms (Figure 3). Naturalabundance of nitrogenisotopes measured on attachedalgae and seagrass also showgreatest 15N enrichment inareas near the keys. Weobserve a strong spatialgradient in 15N of macrophytes(seagrasses and macroalgae)in Florida Bay, with relativelylight (-1 to 4 ‰) macrophytesin western Florida Bay andrelatively heavy (6 to 13 ‰)macrophytes in northeasternFlorida Bay (Figure 4). Thisgradient is likely a function oftwo processes: (1) progressivedenitrification of N broughtinto Florida Bay via tidal exchange with the Gulf of Mexico; and (2) entry of 15N-enriched water fromthe subsurface adjacent to the Keys in northeastern Florida Bay. Collectively, these results indicate agreater flow of groundwater along the inside of the keys. Nutrient flux estimates, based on interstitialnutrient concentrations and groundwater flux measurements, suggest that groundwater in the easternarea of Florida Bay may provide as much nitrogen (110 ± 60 mmol N m-2 y-1) and phosphate (0.21 ±0.11 mmol PO4
3- m-2 y-1) as surface freshwater sources from the Everglades (i.e., Taylor Slough and C-111). However, the inputs are clearly not uniform and areas near solution holes/tidal springs may havea substantially greater nutrient flux into surface waters then these estimates (Corbett, et al., 1999).
Proceedings of the Ground-Water/Surface-Water Interactions Workshop July 2000
79
0
500
1000
1500
2000M
etha
ne (
nM)
0 100 200 300 400 500
Excess Radon (dpm L-1)
Groundwater Average
Porjoe Surface
Porjoe Interstitial
Garden Cove Spring
Garden Cove Surface
Lois Key Spring
Figure 3. Radon and methane concentrations in waterssampled throughout the Keys. The groundwater tracerconcentrations are based on the overall average of allsamples collected. (Figure from Corbett et al., 1999).
Figure 4. Contours of 15N in macroalgae collectedthroughout the study period. Solid crosses indicatesampling locations. Note the darker contours, indicatinghigher enrichment, near the upper Keys. (Figure fromCorbett et al., 1999).
Figure 5. I-131 in surface waters sampled on both sidesof Long Key, Florida Bay (closed square) and theAtlantic via a canal (closed diamonds). Radioactiveiodine was added to a sewage injection well as aconservative tracer to track wastewater movement in thesubsurface. Due to the rapid vertical and horizontalmovement of wastewater in the subsurface, injectedtracers appear in surface waters within 3 days afterinjection.
Artificial tracers (SF6, 131I, 32P) were used to
establish a direct link of contaminated ground-waters to surface waters. Tracers injecteddirectly into sewage injection wells indicaterapid flow of groundwater beneath the keys.Experiments conducted on Long Key indicatetwo different types of transport: (1) rapid flow(0.20–2.20 m/hr), presumably through cracksand conduits present in the limestone; and (2)slow diffusive flow (<0.003-0.14 m/hr),associated with the limestone’s primary porosity(Dillon, et al., 1999). Vertical flow of the wastewater effluent was comparable to horizontal flow dueto the buoyancy of the relatively fresh wastewater compared to the surrounding saline groundwater.These experiments showed that solutes injected into the Key’s subsurface have the potential to reachsurface waters within a few days (Figure 5). Tracer experiments conducted using both a conservativetracer (SF6,
131I) and nutrients of interest (nitrogen and phosphorous) showed that both nitrate andphosphate have some non-conservative behavior. Either through microbial alteration or interactionwith the limestone matrix, water from the wastewater injection appears to be polished as it flowsthrough the subsurface.
In a review of the general subject of SGD, Johannes (1980) stated that “It is...clear that submarinegroundwater discharge is widespread and, in some areas, of greater ecological significance thansurface runoff.” I agree with this appraisal and add that from my review of the available literature, I
Proceedings of the Ground-Water/Surface-Water Interactions Workshop July 2000
80
find that it has been largely the biological community which has recognized the potential importance ofSGD. I maintain that the process of SGD may also be an important and overlooked part of thegeochemical cycles of many elements. In the case of Florida Bay and the Florida Keys, SGD has beencompletely ignored in previous nutrient budgets in the area and has therefore not been considered as apotential threat of contaminants (e.g., sewage effluent) to the ecosystem. It is hoped that one of themain outcomes of this research will be the development of an approach which integrates geochemicaland hydrogeological techniques for assessing directions and rates of subsurface flow and, specifically,how to quantify the flow into surface waters.
REFERENCES
Corbett, D.R., J. Chanton, W.C. Burnett, K. Dillon, C.M. Rutkowski, and J. Fourqurean, 1999.Patterns Of Groundwater Discharge Into Florida Bay, Limnol. Oceanog.
Dillon, K., D.R. Corbett, J.P. Chanton, W.C. Burnett, and L. Kump, 1999. Rapid transport of awastewater plume injected into saline groundwaters of the Florida Keys, USA. Submitted toGroundwater.
Johannes, R.E., 1980. The ecological significance of the submarine discharge of groundwater, Mar.Ecol. Prog., Ser. 3, pp. 365-373.
AUTHOR INFORMATION
D. Reide Corbett, William Burnett, Jeffrey Chanton, and Kevin Dillon, Department of Oceanography,Florida State University, Tallahassee, Florida 32306-4320. email: [email protected]; Tel:850-644-9914, Fax: 850-644-2581
Proceedings of the Ground-Water/Surface-Water Interactions Workshop July 2000
81
Considerations for Calculating the Mass Loadingof Metal Contaminants to a Marine Embayment:ASARCO Superfund Site, Tacoma, WA
By Gayle Garman and ASARCO Sediments/Groundwater Task Force
INTRODUCTION
The Asarco Superfund Site is located along the southern shore of Commencement Bay, anindustrialized marine embayment in southeastern Puget Sound, approximately 30 miles south ofSeattle, WA. The first industries on the site were sawmills that deposited woodwaste along theshoreline. A lead smelter that began operations in 1890, was purchased by Asarco in 1905 to processcopper ore from other locations. By-products of copper smelting were further refined to produceadditional products, including arsenic, sulfuric acid, liquid sulfur dioxide, and slag. Smelter operationsended in 1985 (Hydrometrics, 1996).
Arsenic, cadmium, copper, lead, zinc, and other trace elements were released into soil, air, andsurface water as a result of the smelting and refining operations. There are six upland source areaswhere the highest measured concentrations of contaminants in soils are found: The Stack Hill area,Cooling Pond area, Arsenic Kitchen area, Copper Refinery area, the Fine Ore Bins building, and theSoutheast Plant/DMA area where sulfuric acid spills were frequent. Metals from soil releases and fromslag have migrated to groundwater at the Site (Hydrometrics, 1996).
Many of the smelter buildings and structures are on slag fill. In addition, Asarco extended theexisting shoreline by pouring molten slag into Commencement Bay. The upland area consists of bothgradual and steep slopes extending down to the slag filled shoreline, where slag bluffs extend as muchas 30 ft above the natural sandy substrate. These slag bluffs are very porous, and are subject to twicedaily tides that fluctuate up to 12 ft. vertical (Cross-Section D-D’).
The adjacent 23-acre Breakwater Peninsula is composed of massive and granulated slag that wereplaced into Commencement Bay between 1917 and 1970. An estimated 15 million tons of slag exist atthe smelter property and slag peninsula (Hydrometrics, 1996).
SEDIMENTS/GROUNDWATER EVALUATION
Sediments as far as 1,000 ft from shore exhibit toxicity in bioassays, and are being evaluated forremedial action. The preferred alternative is to place a clean sand cap over the contaminated sedimentto prohibit slag contact with marine organisms (Parametrix 1996). Reviewers of the proposed remedialaction asked whether metal contaminants in site groundwater would recontaminate the clean cap. TheAsarco Sediments Groundwater Task Force (ASGTF) was organized to evaluate this question.
Upland geological cross-sections were extended to the shoreline based on boring logs for nearshoremonitoring wells and offshore cores. These cross-sections indicated that the slag formation did notdischarge through sediment to the Bay, but rather, discharged directly to the Bay surface water. Inorder to assess the influence of the tides on the hydrologic parameters of the site, 15 slag wells weremonitored over four complete tidal cycles in January 1998 and a multi-well pump-test was conducted
Proceedings of the Ground-Water/Surface-Water Interactions Workshop July 2000
1 Editor’s note: Figures follow the text. Figures are not consecutively numbered.
82
at new slag well MW-206. This new data was combined with slug-test data from the upland RemedialInvestigation. The distribution of hydraulic conductivities suggested the slag was characterized by fourcorridors, indicated as A, B, C and D on the Figures. Later, corridor A was subdivided into corridorsA1 and A2 (Figure 1). Discharge rates were calculated for the slag aquifer and the underlying marinesand aquifer in each corridor by using site data and Darcy’s law (ASGTF Group 1, 1998):
K = hydraulic conductivity (ft/day)i = hydraulic gradient (ft/ft)b = aquifer thickness at the shoreline (ft)w = width of groundwater flow path (ft)
APPROACH TO CONTAMINANT FLUX ESTIMATION
The ASGTF recognized that Darcy’s law “provides an estimate of the net groundwater flowdischarging from the site to Commencement Bay.” This net groundwater flow originates as recharge inupgradient water-bearing zones, as infiltration of surface water run-on, and as precipitation onto theslag. While the twice daily tides, with ranges to 12 vertical feet, are known to cause recurrent inflowand outflow of seawater in nearshore areas of both the slag and marine sand aquifers, it is assumed thatthe net tidal flow is zero (ASGTF, Group 1 Memo).
The mass flux of a contaminant is calculated by multiplying the groundwater discharge rate by thecontaminant concentration. However, when (fresh) groundwater mixes with seawater, there arechanges in geochemistry that alter the solubility, and consequently the mobility, of the metalcontaminants of concern at this site.
Arsenic (As) is the primary contaminant of concern in upland areas of the site. Dissolved arsenicconcentrations to 30 mg/5 have been measured in groundwater near the Fine Ore Bins. The chronicmarine AWQC (Ambient Water Quality Criterion) for arsenic is 0.036 mg/5.
DATA AND FIGURES 1
Data are collected at site monitoring wells each Spring and Fall. The ASGTF used data fromMarch 1994 through September 1998, thus, the Figures show the mean of ten measurements for eachparameter. The Figures are taken directly from the ASGTF Group 4 Technical Memorandum,(December 1998) and consequently, are not numbered sequentially in this presentation. Thecontaminant isopleths were drawn by hand.
ARSENIC ATTENUATION
Figure 10 shows the intrusion of seawater (chloride) for hundreds of feet into the slag formationalong the shoreline. Chloride in upland groundwater is negligible. The landward intrusion of seawaterinto the slag is least in corridor D and greatest in corridor A1. The chloride concentrations in both deepand shallow wells on the breakwater peninsula approximate the chloride concentrations inCommencement Bay surface water.
Proceedings of the Ground-Water/Surface-Water Interactions Workshop July 2000
83
Figure 2 shows that the arsenic concentration is an order of magnitude greater in the deeperbreakwater wells (B) than in the shallow breakwater wells (A). The breakwater peninsula is composedentirely of smelter slag. The ASGTF concluded that the lower oxygen exchange capacity for waterdeep within the breakwater peninsula, and the associated lowered redox condition, increase thesolubility of slag arsenic.
Figure 11 shows that dissolved oxygen, in general, diminishes in proportion to distance from theshoreline and more rapidly in the less permeable corridors, e.g., Corridor D. However, it is difficult toget accurate field measurements of dissolved oxygen, so the distribution of manganese, which rapidlyprecipitates in the presence of dissolved oxygen, also was evaluated.
Figure 6 shows the distribution of dissolved manganese which corroborates the mechanism ofarsenic precipitation, described below. Manganese concentrations decline by an order of magnitude assite groundwater approaches the shoreline and mixes with oxygen-rich seawater that has intruded intoshoreline slag.
In upland areas of the site (not the slag peninsula, which is entirely slag), the greatest groundwaterflow occurs in the slag formation, which is above the natural geologic formations. The slag, in turn, istopped by a thin layer of filled soil. Upland groundwater has low oxygen content relative to seawater,so the geochemistry of the upland groundwater is reducing in comparison to the water ofCommencement Bay. At the shoreline, the tides of Commencement Bay enter the porous seaward faceof the slag formation, forcing seawater into the slag. Thus, as the upland reduced groundwater migratestoward the shoreline, it gains oxygen by mixing with tidal seawater within the slag. The solubility ofthe arsenic then decreases, and most of the dissolved arsenic is precipitated as secondary minerals inthe slag and does not discharge to Commencement Bay. The presence of secondary arsenic mineralshas been confirmed by a mineralogic study of material recovered when MW-206 was installed (USEPA, 1998). Thus, the changing redox condition of the groundwater explains the attenuation of theprimary contaminant of concern, arsenic. However, understanding the mechanism that controls arsenicsolubility does not answer the question of how to calculate the mass flux of arsenic to the Bay (ASTGF1998, Group 4).
RELEASE OF COPPER
Figure 3 shows an area in Corridor D where the average dissolved copper concentration ingroundwater is greater than in any other nearshore area. Unlike arsenic, copper is generally moresoluble when there is more dissolved oxygen. However, the shallow (A) wells on the BreakwaterPeninsula, where oxygen is available from seawater and atmospheric exchange, do not have copperconcentrations as great as the wells in Corridor D. The ASGTF concluded there must be anothergeochemical parameter causing copper to dissolve from slag in corridor D (ASGTF 1998, Group 4).
Figure 14 shows that acidity may be controlling copper concentrations in Corridor D. Acidity ismeasured in logarithmic pH units. The pH of Commencement Bay water is about 8.0. Wells in thesoutheast plant/DMA area have average pH values less than 6.0, indicating acid concentrations twoorders of magnitude greater than Commencement Bay. The southeast plant/DMA area is the locationof previous liquid sulfur dioxide and sulfuric acid manufacture. Materials remaining at this locationapparently continue to acidify the groundwater, releasing copper from the slag matrix. Even theintrusion of seawater does not overcome this effect, as the Corridor D well nearest the shoreline has anaverage dissolved copper concentration of 3.6 mg/5, more than an order of magnitude greater than anyother shoreline well. By comparison, the copper acute marine AWQC is 0.0029 mg/5 (a chronic coppermarine AWQC has not been adopted).
Proceedings of the Ground-Water/Surface-Water Interactions Workshop July 2000
84
Figure 13 shows the distribution of dissolved iron in shoreline wells, which helps corroborate themechanism of copper solubility. Like copper, iron is more soluble in a low pH (acid) environment(e.g., landfill leachate). Higher concentrations of iron are found in the Southeast Plant/DMA sourcearea where pH was low and copper was high. Thus, both copper and iron exhibit increased solubilityhere because of the lower pH (higher acidity). However, unlike copper, the average dissolved ironconcentrations are quite similar in all the wells closest to the shoreline (ASGTF 1998, Group 4). Thissuggests that when the dissolved copper and iron in acidified groundwater in corridor D encounterintruding seawater within the shoreline slag, that the reaction of iron with the oxygen and alkalinity ofthe seawater forming an iron precipitate is more rapid than the similar reaction of copper.
CONCLUSIONS
The wells closest to the shoreline have mean dissolved copper concentrations at least three ordersof magnitude greater than the marine acute/chronic AWQC of 0.0029 mg/5. The greatest volume ofgroundwater discharges through the fractured slag into the marine water column rather than throughcontaminated subtidal sediment. Thus, the groundwater process that is having the greatest effect onmarine biota is probably copper discharge to water, not arsenic discharge to sediment.
Mass loading of contaminants in general is a simple calculation that multiplies the averagecontaminant concentration by the corresponding average water (volume) discharge rate. This calcula-tion is valid as long as the contaminant concentration is the concentration in the volume of water that isdischarged. The calculation of contaminant mass loading rates to Commencement Bay is complicatedby the geochemical changes that occur in the shoreline slag as the fresh groundwater mixes withmarine surface water, altering the solubility of the metal contaminants; and by the difficulty indetermining the corresponding volume (discharge rate) of water, which is influenced at the shorelineby the twice daily tidal flux. Wells nearest the shoreline, where contaminant concentrations are mostrepresentative of discharges to the Bay, are affected by the influx and efflux of tidal water, i.e., thevolume of discharging water characterized by the contaminant concentration measured in the shorelinewells, is likely greater than the net groundwater flux from the site.
The ASGTF has not yet found a satisfactory method for resolving this problem.
REFERENCES
ASGTF Group 1, 1998. Draft Technical Memorandum on Groundwater Discharge Estimates,November 1998. 25 pp. plus attachments A and B.
ASGTF Group 4, 1998. Draft Technical Memorandum for the Asarco Sediments/Groundwater TaskForce, December 1998. 30 pp. plus Figures.
US EPA, 1998. Mineralogical Study of Borehole MW-206, Asarco Smelter Site, Tacoma, Washington.US Environmental Protection Agency Region 10, Office of Environmental Assessment, Seattle,WA, 31 pp. plus Appendices A-D.
Hydrometrics, 1996. Tacoma Smelter Post-Remediation Surface Water Evaluation and TechnicalImpracticability Demonstration. Draft Revision 1 for ASARCO, Inc., Tacoma, WA, June 1996.
Parametrix, Inc. 1996. Asarco Sediments Superfund Site Expanded Remedial Investigation andFeasibility Study, Phase 2 Refinement of Options Report, Volume I. For ASARCO, Inc., Tacoma,WA, December 1996.
Proceedings of the Ground-Water/Surface-Water Interactions Workshop July 2000
85
AUTHOR INFORMATION
Gayle Garman, NOAA Office of Response and Restoration, Coastal Protection and RestorationDivision, 7600 Sand Point Way, NE, Seattle, WA 98115-0070. [email protected]
MEMBERS OF THE ASARCO SEDIMENT/GROUNDWATER TASK FORCE (ASGTF)
Marian Abbett, State of Washington, Department of Ecology, Olympia, WAThomas Aldrich, Asarco, Inc., Tacoma, WABruce Cochran, State of Washington, Department of Ecology, Olympia, WA, David Frank, US EPA,Seattle, WAGayle Garman, NOAA, CPRD, Seattle, WAJames Good, Parametrix, Inc., Kirkland, WADouglas Holsten, CH2M-Hill, Inc., Bellevue, WALee Marshall, US EPA, Seattle, WAScott Mason, Hydrometrics, Inc., Kalispell, MTRoger McGinnis, Roy F. Weston, Inc., Seattle, WARobert Miller, Hydrometrics, Inc., Tacoma, WA David Nation, Hydrometrics, Inc., Tacoma, WAKaren Stash, Roy F. Weston, Inc., Seattle, WACarl Stivers, Parametrix, Inc., Kirkland, WADonald Weitkamp, Parametrix, Inc., Kirkland, WABernie Zavala, U.S. EPA, Seattle, WA
Proceedings of the Ground-Water/Surface-Water Interactions Workshop July 2000
86
Conceptual Cross-Section D1 – D1'
Proceedings of the Ground-Water/Surface-Water Interactions Workshop July 2000
87
Figure 1
Proceedings of the Ground-Water/Surface-Water Interactions Workshop July 2000
88
Figure 2
Proceedings of the Ground-Water/Surface-Water Interactions Workshop July 2000
89
Figure 3
Proceedings of the Ground-Water/Surface-Water Interactions Workshop July 2000
90
Figure 6
Proceedings of the Ground-Water/Surface-Water Interactions Workshop July 2000
91
Figure 10
Proceedings of the Ground-Water/Surface-Water Interactions Workshop July 2000
92
Figure 11
Proceedings of the Ground-Water/Surface-Water Interactions Workshop July 2000
93
Figure 13
Proceedings of the Ground-Water/Surface-Water Interactions Workshop July 2000
94
Figure 14
Proceedings of the Ground-Water/Surface-Water Interactions Workshop July 2000
95
The Interaction of Ground Water and SurfaceWater within Fall Chinook Salmon SpawningAreas in the Hanford Reach of the ColumbiaRiver
By David R. Geist
INTRODUCTION
The Hanford Reach is the last unimpounded section of the mainstem Columbia River in the UnitedStates and supports a large run of fall chinook salmon (Oncorhynchus tshawytscha) that returns thereannually to spawn (Dauble and Watson 1997). Previous studies have shown that adult salmonrepeatedly spawn in definite locations within the Reach (Geist 1999; Geist and Dauble 1998; Daubleand Watson 1997), but the physical characteristics associated with these areas are variable and poorlyunderstood. More information on the spawning habitat characteristics of fall chinook salmon thatutilize large rivers is needed to recover stocks listed on the Endangered Species Act.
The association between fall chinook salmon spawning and physical habitat characteristics waspreviously examined in the Hanford Reach at Locke Island and Wooded Island (Geist 1999). Althoughthe physical habitat characteristics, e.g., depth, substrate, and water velocity, at the two sites weresimilar, only the Locke Island site had extensive salmon spawning. Additional measurements weretaken to determine if the interaction of ground water and surface water within the hyporheic zone couldexplain this discrepancy in habitat use between the two sites. Hyporheic discharge was assumed toaffect spawning site selection by providing cues (chemical, temperature, and physical) for pre-spawning adults to locate spawning reaches (usually 2 to 5 km in length). Once these reaches were“discovered,” hyporheic discharge was assumed to correlate with the distribution of redd clusters (500to 800 m in length, 120 m in width; Geist 1999) within these river reaches
METHODS
During the fall chinook salmon spawning seasons (October and November; Dauble and Watson1997) from 1995 to 1997, mini-piezometers (Lee and Cherry 1979) and internal-drive-rod piezometers(Geist, et al. 1998) were installed within the two sites. Piezometers were installed within the riverchannel in groups of three or four, and hyporheic water within the piezometers was sampled 2 to 7times each year for specific conductance (µS/cm at 25(C), water temperature (T, (C), dissolvedoxygen (DO, mg/5), and hydraulic head (h, cm). These same parameters were also measured on acontiguous river sample.
It was assumed that water discharging from the hyporheic zone into the river was a combination ofground water and surface water. Specific conductance was the primary measure used to differentiateundiluted ground water from surface water; specific conductance of undiluted ground water adjacent tothe Hanford Reach averages 300-400 µS/cm while the river water averages ~150 µS/cm. Thedifferences in temperature (T) and hydraulic head (h) were based on the piezometer reading (hyporheicwater) minus the reading from its paired river sample. Differences in hydraulic head between the riverand hyporheic waters were used to calculate a vertical hydraulic gradient (VHG) between the two
Proceedings of the Ground-Water/Surface-Water Interactions Workshop July 2000
96
125.0
150.0
175.0
200.0
225.0
Locke WoodedSpe
cific
con
duc.
(S
/cm
)
B.
River
-0.3
-0.2
-0.1
0.0
0.1
0.2
0.3
Locke Wooded tem
p. (
hypo
r. -
riv
er;
C)
C.
-0.02
0.00
0.02
0.04
0.06
0.08
Locke Wooded
VH
G (
cm/c
m)
A.
Figure 1. Physiochemical data collected frompiezometers installed and monitored at the Locke Islandand Wooded Island study sites during October andNovember, 1995. Bars above and below the pointsrepresent the 95% confidence interval of the mean. (A)Vertical hydraulic gradient (VHG) between hyporheic andsurface waters where positive values indicated potentialupwelling and negative values downwelling, (B) specificconductance of hyporheic and surface waters, and (C)differences in water temperatures of hyporheic andsurface waters.
(VHG = h/depth of piezometer). Slug tests were used to estimate the volume of hyporheic dischargefrom the sediments into the river channel.
RESULTS AND DISCUSSION
The results showed that fall chinook salmonspawning locations were highly correlated withhyporheic discharge that was composed of mostlyriver water and not undiluted ground water.Hyporheic water that discharged into fall chinooksalmon spawning locations was consistentlygreater in magnitude, and had higher dissolvedoxygen and lower specific conductance thandischarge into non-spawning locations. However,there was no significant difference in temperaturebetween hyporheic and river water. These resultswere true when comparisons were performedbetween Locke Island (spawning site) and WoodedIsland (non-spawning site) (Figure 1), and also truewhen spawning and non-spawning clusters withinthe Locke Island site were evaluated (Figure 2).
Slug tests showed that substrate permeabilitydecreased with increasing distance below the riverbed at Wooded Island but did not change over thedepths monitored at Locke Island (Figure 3). Thissuggested the mixing zone where river waterpenetrated into the river bed was greater within thespawning site than within the non-spawning site.Specific discharge calculations gave an averageflux out of the sediments on the order of 9.0 x 10⁻⁴
cm/s at Locke Island and 3.0 x 10⁻⁴ cm/s atWooded Island. Thus, specific discharge ofhyporheic waters was approximately 3 times largerat Locke Island than Wooded Island.
River water was presumed to have enteredhighly permeable riverbed substrate at locationsupstream of spawning areas. Geomorphic bedfeatures (i.e., islands, gravel bars, riffles) ofalluvial rivers are able to create hydraulic gradientssufficient to direct surface water into the bed(Stanford, et al. 1996; Brunke and Gonser 1997).River water is able to penetrate deeper intohyporheic habitats if the riverbed is composed ofalluvium that is highly permeable (Vaux 1962,1968; White 1993). The more permeable thealluvium, the more that the physiochemical characteristics of the hyporheic waters will resemblesurface water rather than ground water. In contrast, the relative proportion of phreatic ground water inhyporheic waters will be greater if the riverbed sediments are of low hydraulic permeability because
Proceedings of the Ground-Water/Surface-Water Interactions Workshop July 2000
97
100.0
125.0
150.0
175.0
200.0
225.0
96 S 96 NS 97 S 97 NSSp
ec
ific
co
nd
uc
. (
S/c
m)
Riv er
B.
-0.5
0.0
0.5
1.0
1.5
2.0
96 S 96 NS 97 S 97 NS
te
mp
. (h
yp
or.
-riv
er;
C)
C.
0.00
0.02
0.04
0.06
0.08
0.10
96 S 96 NS 97 S 97 NS
VH
G (
cm
/cm
)A.
nd nd
Figure 2. Physiochemical data collected frompiezometers installed and monitored within the LockeIsland site at spawning (S) and non-spawning (NS) sitesduring October and November, 1996 and 1997. Barsabove and below the points represent the 95% confidenceinterval of the mean. ND = no data.
0
5
1 0
1 5
2 0
2 5
3 0
3 5
0 5 0 1 0 0 1 5 0 2 0 0
Pie z o m e te r d e p th ( c m )
Rec
over
y tim
e (s
ecs.
)
L o c k e Is la n d
W o o d e d Is la n d
Figure 3. Recovery time to 37% of the initial hydraulic headfollowing a slug-test within piezometers installed at LockeIsland and Wooded Island. The trend line at the WoodedIsland site (dashed line) was significant (P = 0.02, r2=0.78) butnot significant at Locke Island (P = 0.42, r2= 0.08).
river water will not be able to readily enter thesubstrate and dilute the ground water (White 1993;Brunke and Gonser 1997). I concluded river waterthat became entrained into the “hyporheiccorridor” had a strong influence on verticalhydraulic gradients and influenced the use ofsalmon spawning habitat. Knowledge of the three-dimensional connectivity between rivers andground water within the hyporheic zone can beused to improve the definition of fall chinooksalmon spawning habitat.
REFERENCES
Brunke, M. and T. Gonser, 1997. The ecologicalsignificance of exchange processes betweenrivers and groundwater. Freshwater Biology v.37, pp. 1-33.
Dauble, D.D., and D.G. Watson, 1997. Status offall chinook salmon populations in the mid-Columbia River, 1948-1992, North AmericanJournal of Fisheries Management, v. 17, pp.283-300.
Geist, D.R., 1999. Redd site selection andspawning habitat use by fall chinook salmon.Ph.D. Dissertation, Oregon State University,Corvallis, Oregon.
Geist, D.R., and D.D. Dauble, 1998. Redd siteselection and spawning habitat use by fallchinook salmon: the importance of geomorphicfeatures in large rivers, EnvironmentalManagement, v. 22, pp. 655-669.
Geist, D.R., M.C. Joy, D.R. Lee, and T. Gonser,1998. A method for installing piezometers in
large cobble-bed rivers, Ground WaterMonitoring and Remediation, v. 18, pp. 78-82.Lee, D.R., and J.A. Cherry. 1978. A field
exercise on groundwater flow usingseepage meters and mini-piezometers,Journal of Geological Education, v.27,pp. 6-10.
Stanford, J.A., J.V. Ward, W.J. Liss, C.A.Frissell, R.N. Williams, J.A.Lichatowich, and C.C. Coutant, 1996. Ageneral protocol for restoration ofregulated rivers, Regulated Rivers:Research and Management, v. 12, pp.391-413.
Proceedings of the Ground-Water/Surface-Water Interactions Workshop July 2000
98
Vaux, W.G., 1962. Interchange of stream and intragravel water in a salmon spawning riffle. SpecialScientific Report—Fisheries, No. 405. U.S. Fish and Wildlife Service, Bureau of CommercialFisheries, Washington, DC
Vaux, W.G., 1968. Intragravel flow and interchange of water in a streambed. Fishery Bulletin 66:479-489.White, D.S. 1993. Perspectives on defining and delineating hyporheic zones, Journal of theNorth American Benthological Society, v. 12, pp. 61-69.
AUTHOR INFORMATION
David R. Geist, Ecology Group, Pacific Northwest National Laboratory, MS K6-85, Post Office Box999, Richland, Washington, 99352; 509-372-0590; fax: 509/372-3515; [email protected].
Proceedings of the Ground-Water/Surface-Water Interactions Workshop July 2000
99
Integrated Acoustic Mapping of Surface Waters:Implications for Ground-Water/Surface-WaterLinkages
By Chad P. Gubala, Ullrich Krull, Joseph M. Eilers, Mike Montoya, and JeffCondiotty
The study of aquatic systems has historically been approached in a traditional scientific manner.“Representative” sections or components of lakes and rivers have been examined intensively through acombination of laborious sampling methods. Broader assessments of specific aquatic ecosystems havethen been statistically constructed through the assembly of discrete study elements. Changes in aquaticecosystems have then been documented by repeating a similar regimen of sampling at varying timeintervals. Aquatic ecosystem analyses and risk-based management plans have been developed on thebasis of discreet and/or empirical numeric models of aquatic ecosystems, deriving from the originalfield investigations.
The efficacy of aquatic assessments and/or risk-based management plans depends upon thecompleteness and accuracy of the original data collection and analysis scheme. In order to assemble anaccurate model of an entire aquatic ecosystem, data must be collected in a manner that minimizes themajor components of uncertainty: measurement, spatial and temporal. Most researchers have been ableto adequately minimize measurement error throughout intensive, small-scale research studies ormonitoring exercises. However, precise and accurate measurements distributed over a small section ofa large domain frequently lead to inaccurate conclusions. This phenomenon derives from theuncertainty of interpolating the conditions of an unknown domain, such as a river reach or lake region,through interpolation or extrapolation from a limited data-base.
A need exists to develop better monitoring techniques for the dynamic management of aquaticecosystems. Combinations of current and emerging technologies, drawn from a variety of applicationareas may provide for faster, more cost-effective means of acquiring aquatic systems data andinformation. Linking mobile sensors such as hydroacoustic arrays with Global Positioning System(GPS) navigation have already yielded effective methods for rapidly delineating the bathymetric,morphometric and hydrologic features of lakes and rivers. Expansion of the role of acoustics has alsopermitted the spatial analysis of aquatic biological communities within complex spatial domains. Thecoupling of standard aquatic sensor arrays, such as temperature, conductivity or velocity probes, withGPS will provide multiple parameters for a system in a cost-effective manner. Integration of advancedsensor probes, such as real-time DNA detectors for identification of aquatic microorganisms will alsogreatly enhance the ability to detect and manage change in aquatic ecosystems.
AUTHOR INFORMATION
Chad P. Gubala, SATL (The Scientific Assessment Technologies Laboratory),The University ofToronto at Mississauga, 3359 Mississauga Road North, Mississauga, ON L5L 1C6; 905-828-3863(voice); [email protected].
Ullrich Krull, University of Toronto, Joseph M. Eilers, JC Headwaters, Inc.Mike Montoya, Ute Tribal Nation, Jeff Condiotty, Simrad, Inc.
Proceedings of the Ground-Water/Surface-Water Interactions Workshop July 2000
100
Delineation of VOC-Contaminated GroundwaterDischarge Zone, St. Joseph River, Elkhart,Indiana
By John H. Guswa, Jonathan R. Bridge, and Michael J. Jordan
A hydrogeologic study was conducted to locate and delineate the portion of the St. Joseph riverwithin which VOC contaminated groundwater observed in monitoring wells in the study area wasdischarging. The principal groundwater contaminants are trichloroethene (TCE) and carbontetrachloride (CCl4). Water samples were collected at a depth of approximately two to five feet belowthe river bed using a GeoProbe® from a pontoon boat. The samples were analyzed for the purpose ofdelineating VOC concentrations in groundwater directly beneath the river bed. The results of thishydrogeologic study were used to select sampling locations for a benthic macroinvertebrateinvestigation to determine if there were any ecological effects resulting from the discharge of VOC-contaminated groundwater to the river.
Groundwater and surface water samples were initially collected from selected wells and samplingstations on the river and analyzed for the inorganic analytes listed in Table 1. The purpose of thissampling was to identify whether there were inorganic analytes that could be used as “tracers” toensure that the samples collected from beneath the river bed were groundwater samples and notinduced river water. The concentrations of none of the inorganic analytes proved to be consistentlydifferent between the surface water samples and the groundwater samples. Therefore this group ofinorganic analytes could not be used as “tracers.” Other field measured parameters, in particular pH,temperature and specific conductance were more useful in this regard, and were used for that purpose.The pH of the river water was approximately one pH unit higher than the groundwater. The river watertemperature was approximately 8(C higher than the groundwater temperature and the specificconductance of the groundwater was generally higher than the river water.
Table 1. Results of preliminary inorganic analyses, in mg/5.
Proceedings of the Ground-Water/Surface-Water Interactions Workshop July 2000
101
F L O WT H R O U G H
C E L L
P E R I S T A L T I CP U M P
T U R B I D I T YM E T E R
G E O P R O B E S C R E E NP O I N T G R O U N D W A T E R
S A M P L E R
Figure 1. Schematic of sub-riverbed sampling equipment
Groundwater samples were collected from beneath the river bed at 73 locations located along 19transects. The initial sampling locations were based on evaluation of water quality data fromupgradient monitoring wells and evaluation of groundwater flow direction. Subsequent transect andsampling locations were selected by reviewing daily analytical results received from an on-site fieldlaboratory. The water samples were collected by driving a GeoProbe®, from a pontoon boat,approximately two to five feet below the bed of the river. The one foot long GeoProbe® screen wasthen exposed, and water was pumped to the surface using a peristaltic pump. The GeoProbe® was fittedwith a thermocouple to permit in-situ measurement of groundwater temperature. A schematic of theGeoProbe® sampling device is shown on Figure 1. At some locations the GeoProbe® screen becameclogged with fine sediment from the river bed. When this happened the screen was flushed withdeionized water to clear the screen. The sampling then proceeded using a low-flow sampling protocol.
During pumping, the water quality parameters pH, Eh, specific conductance, dissolved oxygen,temperature, and turbidity were measured in the field. The pH, Eh, specific conductance dissolvedoxygen and temperature were measured utilizing a flow through cell with a YSI model 6820 multiparameters instrument. Turbidity was measured using an HF model DRT-15CE turbidity meter. Asurface water sample at each sampling location was also analyzed for the field water qualityparameters. The sampling point was purged until the field water quality parameters stabilized. Afterthe field parameters stabilized the surface water results and the stabilized results from the samplingpoint were compared to be certain that groundwater, and not surface water, was being sampled. Thefield analyses indicated that pH, temperature and specific conductance were good indicator parametersfor this comparison. The collected sub-river bed samples were then analyzed for the nine VOCs listedin Table 2. VOC analyses were performed in the field laboratory using a modification of EPA MethodSW-846 8021.
Proceedings of the Ground-Water/Surface-Water Interactions Workshop July 2000
102
Figure 2. Sampling grid and contaminant discharge area
Table 2. VOC AnalytesTrichloroethene
Carbon Tetrachloride1,1,1-Trichloroethane
ChloroformVinyl Chloride
Tetrachloroethene 1,1-Dichloroethene
Chloromethane1,2-Dichloroethene
The results of the sampling and analyses indicated that TCE contaminated groundwater isdischarging into the river along a 5'500 foot length of the river. The maximum TCE concentrationdetected was 1'600 micrograms per liter (µg/5). Groundwater containing CCL4 is discharging to theriver along a 2'500 foot length of the river, and the CCl4 discharge zone is contained within the TCEdischarge zone. The maximum CCL4 concentration was 940 µg/5. The sampling locations, and the TCEand CCl4 distribution in the sub-riverbed groundwater, are shown on Figure 2. Based on the results ofthis investigation, sampling locations for a benthic macroinvertebrate investigation were selected.
AUTHOR INFORMATION
John H. Guswa, Jonathan R. Bridge, and Michael J. Jordan, HSI GeoTrans, Inc. 6 Lancaster County Road, Harvard, MA 01451
Proceedings of the Ground-Water/Surface-Water Interactions Workshop July 2000
103
Measuring Enhanced Removal of DissolvedContaminants in Hyporheic Zones andCharacterizing Causes and Consequences forWater Quality
By Judson W. Harvey, Christopher C. Fuller, and Martha H. Conklin
ABSTRACT
Characterizing both the causes and consequences of enhanced oxidation of dissolved manganese(Mn) in the hyporheic zone at Pinal Creek basin, AZ required measurements with spatial resolutionvarying across five orders of magnitude. Our measurements ranged in scale from that of thefundamental interactions between surface and ground water (centimeters) to the scale of the perennialstream that receives ground-water discharge from the entire drainage basin (kilometers). Because ofthe lower uncertainty of the stream-tracer approach for estimating the average reaction rate, thatmethod provided the most reliable basin-scale simulation of the effects of enhanced Mn-removal inhyporheic zones. The stream-tracer characterization alone, however, could not determine that theremoval of manganese was pH-dependent, or even that the reaction occurred in hyporheic zones (asopposed to slow-moving zones in surface water). Laboratory and in situ measurements withinhyporheic zones provided the crucial evidence to support interpretations about the causal processes.
INTRODUCTION
Hydrologic exchange of streamwater and ground water back and forth across channel beds ofrivers and streams enhances chemical transformations in shallow groundwater beneath the streambed(hyporheic zone). The hyporheic zone is defined hydrologically by flow paths that route streamwatertemporarily through the subsurface and chemically by subsurface water that can be shown to receivegreater than 10% of its water from the surface (Triska and others, 1993). Steep chemical gradients indissolved oxygen, dissolved organic carbon, and pH in hyporheic zones enhance biogeochemicallymediated transformations of solutes, such as nitrification and denitrification (Grimm and Fisher, 1984;Triska and others, 1993), oxidation of metals (Benner and others, 1995), and biodegradation of volatileorganic compounds (Heekyung and others, 1995). Hyporheic flow paths are typically small in theirspatial dimensions, but if chemical reaction rates are fast enough, and if enough exchange occursbetween flowing water and sediment, then the effects can accumulate downstream and affect waterquality (Harvey and Fuller, 1998).
This short paper considers three types of measurements at different spatial scales of resolution. Thethree measurement types are: (1) laboratory-batch experiments that quantify solute-sedimentinteractions at the millimeter-scale, i.e. the scale of individual sediment grains, (2) in situmeasurements in hyporheic flow paths at the scale of centimeters beneath the streambed, and (3)stream-tracer experiments that quantify removal rates at the scale of experimental subreaches in theperennial stream (approximately 500 meters) or at the scale of the perennial stream that receivesground-water discharge from the entire drainage basin (3 kilometers).
A number of physical and chemical measurements of the hyporheic zone have been made as partof our investigations, including the hyporheic-zone depth, hydrologic residence time in the hyporheic
Proceedings of the Ground-Water/Surface-Water Interactions Workshop July 2000
104
zone, net removal-rate constant for dissolved manganese (Mn), and percent removal of Mn inhyporheic flow paths. Previously, we found good agreement across scales of measurement based on arelatively limited data set (Harvey and Fuller, 1998). In this paper, we update with new data the meansand standard deviations for manganese removal-rate constants and compare them among the threemeasurement types. Field methods, analyses, and modeling calculations for reach-scale and in-situmeasurements are presented in Harvey and Fuller (1998), Fuller and Harvey (1999), and Duff, et al.,(1998). Laboratory methods and analyses are given by Marble and others (1999) and Harvey and Fuller(1998).
COMPARISON OF REMOVAL-RATE CONSTANTS ACROSS SCALES
In situ rate constants (cm-scale) in the hyporheic zone were determined at a total of eleven sites in1994, 1995, and 1997. Rate constants were determined for sub-reaches of the perennial stream (500-mscale) by averaging results from stream-tracer injections in 1994 and 1995. The basin-scale estimates(3-km scale) were computed by averaging the mean rate constant from the four subreaches in 1994with the mean for the five subreaches in 1995. Laboratory rate constants estimates were computedusing data from the subset of unpoisoned experiments conducted between pH 6 and 6.9, whichmatches the range of pH’s that were measured in situ. We chose the coefficient of variation (standarddeviation divided by the mean) as a measure of uncertainty.
The mean rate constant for the three field estimates (e.g. in situ, sub-reach, and basin-scale) wasapproximately 2.3 x 10⁻⁴ per second. The mean rate constant determined in the laboratory wasapproximately 30% lower. An average rate constant of 2.3 x 10⁻⁴ per second for removal of manganesecorresponds to a time constant (inverse of rate constant) of approximately 1.3 hours, which iscomparatively fast in a drainage basin where the hydrologic residence time in surface water of PinalCreek is approximately 1 day. Although the mean estimates for each field technique varied little (4%coefficient of variation), standard deviations varied by approximately a factor of four. The in situestimate of the removal-rate constant was most uncertain with a coefficient of variation of 107%.Estimates made at the kilometer-scale based using the stream-tracer approach were least uncertain,with a coefficient of variation equal to 26%. The coefficient of variation for laboratory and sub-reacheshad intermediate values of 84% and 56%, respectively.
DISCUSSION
Rate constants for removal of manganese differed little between laboratory experiments, in-situfield measurements, and measurements based on stream-tracer experimentation. The advantage oflaboratory experiments was the isolation of the effects of microbial colonies and pH. Marble andothers (1999) discuss pH and other factors affecting Mn-oxidation reactions. One problem of thebatch-laboratory experiments is extrapolating results to sediment-water ratios that more accuratelyapproximate field conditions. Following Harvey and Fuller (1998), we scaled laboratory-rate constantsby multiplying them times the ratio between the average sediment concentration (grams/liter) in thestreambed at Pinal Creek and the sediment concentration used in laboratory experiments. Thatadjustment assumes that grain-size variations, which are likely to affect sediment-surface areaavailable for oxidation of manganese, are the same in laboratory experiments and in the streambed.Another possible problem of the laboratory experiments is controlling for variation in activity levels ofmicrobial colonies. For example, Marble and others (this volume) report a significant time lag beforeremoval in Mn begins in sediment samples that were stored before usage in experiments. Either ofthose possible problems might explain the lower Mn removal-rate constant compared with in-situ andstream-tracer estimates
Proceedings of the Ground-Water/Surface-Water Interactions Workshop July 2000
105
In situ sampling within hyporheic flow paths addresses the problem of realistic field conditions byquantifying rates of removal without disturbing the sediments or natural hydrologic fluxes. But thismethod has practical limitations, however. In situ sampling has the disadvantage that themeasurements are difficult and time consuming to make in the field, which limits sample sizes. Inaddition there is also the problem that ancillary physical and chemical factors cannot be varied exceptthough careful site selection. The principal advantage of in-situ field measurements is that interactionsbetween flow and biogeochemical processes are preserved, which potentially could reveal findings thatwould be difficult to detect in a laboratory setting.
Stream-tracer experiments provided the most reliable reach-averaged rate constants for modelingthe basin-scale consequences of enhanced chemical reactions in hyporheic zones. Nevertheless, thereremains a major disadvantage of the stream-tracer approach for quantifying hyporheic-zone processes.On the basis of stream-tracer experiments alone, we cannot be sure that the removal of reactive solutesactually occurs in hyporheic-zones, or on the leaves of aquatic vegetation in slowly-moving surfacewater at channel margins or behind channel obstructions. Another problem with stream-tracer methodsis that the detection sensitivity for hyporheic zones is not equal across the multiple types of hyporheiczones that may be present in a given system (Harvey and others, 1996). Only direct sampling ofhyporheic zones using in-situ methods can provide the independent confirmation needed to supportphysical interpretations at larger spatial scales.
SUMMARY AND CONCLUSION
Mean rate constants for the removal of dissolved manganese agreed closely between three scales ofresolution in the field, ranging from centimeter-scale field measurements acquired in situ in hyporheiczones to kilometer-scale estimates determined using stream tracers. The laboratory estimate of the Mnremoval-rate constant was approximately 30% lower than field estimates. In situ and laboratory rateconstants had relatively large coefficients of variation (107% and 84%, respectively), which may betoo large to be used reliably in transport simulations. Stream-tracer experiments provided estimates ofthe rate constant with lower uncertainties; 56% when averaged at the reach-scale (approximately 500meters) and 26% when averaged at the basin-scale (3 kilometers). Our experience at Pinal Creek basinleads us to conclude that a multi-scale approach is a necessity for characterizing enhancedbiogeochemical reactions in hyporheic zones.
REFERENCES
Benner, S.G., Smart, E.W., and J. N. Moore, 1995. Metal behavior during surface-groundwaterinteraction, Silver Bow Creek, Montana, Environmental Science and Technology, v. 29, pp. 1789-1795.
Duff, J.H., Murphy, F., Fuller, C.C., Triska, F.J., Harvey, J.W., and A.P. Jackman, 1998. A minidrivepoint sampler for measuring pore water solute concentrations in the hyporheic zone of sand-bottom streams, Limnology and Oceanography, v. 43, no. 6, pp. 1378-1383.
Fuller, C.C. and J.W. Harvey, 1999. The effect of trace-metal reactive uptake in the hyporheic zone onreach-scale metal transport in Pinal Creek, Arizona, in Morganwalp, D.W. and Buxton, H.T., eds.,U.S. Geological Survey Toxic Substances Hydrology Program—Proceedings of the TechnicalMeeting, Charleston, South Carolina, March 8-12, 1999—Volume 1—Contamination from HardRock Mining: U.S. Geological Survey Water-Resources Investigations Report 99-4018A, thisvolume.
Grimm, N.B. and S.G. Fisher, 1984. Exchange between interstitial and surface water: implications forstream metabolism and nutrient cycling, Hydrobiologia, v. 111, pp. 219-228.
Proceedings of the Ground-Water/Surface-Water Interactions Workshop July 2000
106
Harvey, J.W. and C.C. Fuller, 1998. Effect of enhanced manganese oxidation in the hyporheic zone onbasin-scale geochemical mass balance, Water Resources Research, v. 34, pp. 623-636.
Harvey, J.W., Wagner, B.J., and Bencala, K.E., 1996. Evaluating the reliability of the stream-tracerapproach to characterize stream-subsurface water exchange, Water Resources Research, v. 32, no.8, pp. 2441-2451.
Heekyung, K., Hemond, H.F., Krumholz, L.R., and B.A. Cohen, 1995. In-situ biodegradation oftoluene in a contaminated stream, 1, Field Studies, Environmental Sciences and Technology, v. 29,pp. 108-116.
Marble, J.C., Corley, T.L., Conklin, M.H., and C.C. Fuller, 1999. Environmental factors affectingoxidation of manganese in Pinal Creek, Arizona., in Morganwalp, D.W. and Buxton, H.T., eds.,U.S. Geological Survey Toxic Substances Hydrology Program—Proceedings of the TechnicalMeeting, Charleston, South Carolina, March 8-12, 1999—Volume 1—Contamination from HardRock Mining: U.S. Geological Survey Water-Resources Investigations Report 99-4018A, thisvolume.
Marble, J.C., 1998. Biotic contribution of Mn(II) removal at Pinal Creek, Globe, Arizona, unpublishedM.S. thesis, University of Arizona, Department of Hydrology and Water Resources, Tucson. 91pp.
Triska, F.J., Duff, J.H., and R.J. Avanzino, 1993. The role of water exchange between a streamchannel and its hyporheic zone on nitrogen cycling at the terrestrial-aquatic interface,Hydrobiologia, v. 251, pp. 167-184.
Proceedings of the Ground-Water/Surface-Water Interactions Workshop July 2000
107
Bioassessment of Hyporheic MicrobialCommunities Using a Specially-designedSediment Colonization Chamber
By Susan P. Hendricks
Streambed sediments are often very heterogeneous in particle size distribution and permeability,creating mosaics of hyporheic habitats and biotic communities. Biotic patchiness and difficultiessampling the physical environment present challenges for researchers investigating hyporheicmicrobial transformation processes. Heterogeneous sediments may not be conducive to conventionalsampling techniques (Fraser and Williams 1997, Mauclaire, et al. 1998). For example, streambedscomposed of large gravel and cobble are prohibitive to mechanical or hand-coring of sediments.Freeze-core sampling techniques often used in heterogeneous sediments for invertebrates are notappropriate because freezing alters microbial activity (Humpesch and Niederreiter 1993, Claret 1998a,1998b).
Some sampling difficulties may be overcome using artificial chambers. Many investigators havedesigned chambers for various specific monitoring purposes, including water chemistry,macroinvertebrates, and in situ microbial metabolism measurements (Danielopol and Niederreiter1987, Dodds, et al. 1996, Shati, et al. 1997). There also have been several site- and/or question-specificchamber designs, particularly for sediment microbial studies (e.g., Fischer, et al. 1996, Frazer, et al.1996, Eisenmann, et al. 1997, Claret 1998a, 1998b). The purpose of this paper is to describe a multi-purpose sediment microbial colonization chamber that combines attributes of several previous designs.The chamber has been used successfully in heterogeneous cherty western Kentucky and Tennesseestreams and can be used not only for chemical and microbial monitoring, but also for experimentalmanipulations in situ.
DESIGN CONCEPT
Gravel bars are conspicuous geomorphic features of many mid-reach streams (Figure 1).Conservative tracer experiments in the study streams have shown that both gravel bars and thehyporheic zone are important transient storage zones where dissolved organic matter, nutrients andcontaminants may be retained for periods of time and transformed before re-entering the surfacestream environment. Microbial activity within these subsurface regions is important in mediatingnutrient and carbon cycling (Hendricks and White 1991, 1995; Hendricks 1993, 1996) and potentiallyimportant in transforming contaminants.
The chamber was designed for maximum flexibility in placement and function within both thehyporheic zone and within gravel bars lateral to the stream (Figure 1). The design (Figure 2) hasallowed us to 1) collect interstitial water samples for nutrient chemistry and dissolved oxygen, 2) sub-sample sediments for various microbial assays (e.g., bacterial productivity, phosphatase activity), and3) carry out time-course in situ experiments for determining transformation rates of various substances(e.g., respiration rates, nitrification rates). Additionally, the sediment volume within the chamberenables 1) collection of small test-tube sized cores from each of the depth intervals for furtherlaboratory microbial analyses (e.g., microbial diversity studies using amplified rDNA restrictionanalysis, fatty acid analysis, perfusion experiments) and 2) transplant experiments between sites andstreams and monitor subsequent changes in activities and other effects. Our initial experiments have
Proceedings of the Ground-Water/Surface-Water Interactions Workshop July 2000
108
Figure 1. Study sites at Ledbetter and Panther Creeks. Blackarrows indicate groundwater inflow: Gray arrows indicateflowpaths of surface water into gravel bars and hyporheic zonebeneath stream.
been comparisons between anagriculturally impacted third-orderstream (Ledbetter Creek) and a pristinethird-order stream (Panther Creek)with similar sediment heterogeneitiesand watershed characteristics.
METHODS
Sediments collected from eachstream were sieved (£ 3 mm sizefraction), autoclaved, and placed intochamber baskets (Figure 2). Thebaskets were stacked such that eachrepresented a hyporheic depth interval(0-10 cm, 15-25 cm, and 30-40 cm).Chambers were placed just below thetop of the water table along previouslydetermined subsurface flow-pathswithin the gravel bars and below thesediment-water interface withinhyporheic regions (Figure 1). Portsbetween inner and outer cylinders werealigned in the open position to allowinterstitial flow and colonization withmicroflora for approximately 8-10weeks.
Following colonization, thechamber caps were removed andinterstitial water was withdrawn fordissolved O2, nutrients, and DOC fromeach of the stacked sediment baskets by attaching a syringe to the tubing embedded in the basket(Figure 2). Baskets were then retrieved from the inner cylinder by pulling up on the central stem.Sediment sub-samples were collected from each basket, placed into sterile containers, and transportedto the laboratory for phosphatase activity, bacterial productivity and microbial diversity assays.
In situ experiments also were conducted. For example, interstitial dissolved O2 and NO3-N sampleswere collected from each depth interval within the chamber as pre-incubation references (i.e., ports onboth cylinders aligned in the open position). Twisting the inner cylinder in the opposite directionresulted in closing of the ports and isolation of sediments from interstitial flow. Following incubationin the closed position for a chosen period of time (e.g., 24-72 hours), interstitial water was re-sampled.Oxygen consumption (respiration rate) and NO3-N accumulation (nitrification rate) were estimated asthe difference between dissolved O2 or NO3-N concentrations before and after incubation over timeand expressed as change in concentration g-1 wet weight or L-1 sediment h-1.
Proceedings of the Ground-Water/Surface-Water Interactions Workshop July 2000
109
Hyporheic/Gravel Bar Sediment Chamber
CAP
Chambers are buried in
streambed to just below the
sediment surface and in
gravel bars to just below the
top of the water table
Chamber constructed of PVC
pipes - Outer chamber is
casing for inner chamber,
inner chamber contains
sediment baskets made of
screening.
The inner cylinder holding the
sediment baskets can be
turned to align the openings
with outer cylinder exposing
sediments to interstitial flow,
or closed off to isolate
sediments from flow.
Tubing from which interstitial water samples can
be collected from each depth interval.Syringe
Valve
Connector tubingStem to facilitate basket removal
0-10 cm depth
15-25 cm depth
30-40 cm depth
spacers
Spacers for isolating depth interv
OFF
102030405060c20oz
1 ½ ½1
B-D
Figure 2. Schematic of gravel bar/hyporheic chamber design.
RESULTS
Some examples of subsurfacemicrobial activities important in P,N and C cycles are summarized inTables 1-3. The tabulated data aremeans calculated from all depths (3)within replicate chambers (2) withina site (gravel bar=3, hyporheic=2)for each stream. Alkalinephosphatase activity (Sayler, et al.1979) was higher in the gravel barthan in the hyporheic zone atLedbetter Creek during both summerand spring sampling periods, andhigher in general than in PantherCreek (Table 1), indicatingdifferences in phosphorus demandby the microbial communitybetween the two streams and amongsites within the streams.
The Ledbetter Creek gravel bargenerally showed higher bacterialproductivity (methods modifiedfrom Findlay 1993) than the PantherCreek gravel bar (Table 2). Bacterialproductivity was highest whereinteraction between the subsurfacegravel bar and stream surface waterwas greatest as indicated bydissolved O2 gradients in both gravel bars (data not shown) along subsurface flow-paths (Figure 1).
Nitrification rate (methods of Jones, et al. 1995), reported as the increase in µg NO3+NO2 L-1
sediment h-1, was higher in Ledbetter Creek than in Panther Creek (Table 3). The Ledbetter Creeksediment bacterial community is composted of taxa, which appear adapted to high levels of NH4NO3
fertilizer applications.
Table 1. Alkaline phosphatase activity (APA = µm nitro-phenylphosphatereduced g-1 sediment dry wt.) in hyporheic and gravel bar chambers atLedbetter and Panther Creeks. AG = agriculturally impacted, P = pristine.
Stream Site Spring Summer
Ledbetter (AG) Gravel Bar 1020.5 1942.9
Hyporheic 700.9 205.4
Panther (P) Gravel Bar 687.7 370.9
Hyporheic no data no data
Proceedings of the Ground-Water/Surface-Water Interactions Workshop July 2000
110
Table 2. Subsurface gravel bar bacterial productivity (µg C m-2 h-1) at Ledbetter andPanther Creek as estimated from incorporation of 3H-thymidine into bacterial DNA. AG =agriculturally impacted, P = pristine.
Gravel Bar PositionStream Month Upstream Mid-Bar Downstream
Ledbetter (AG) Jan 3.13 11.7 32.3
Jun 64.5 73.6 225.9
Sep 37.7 67.1 67.1
Panther (P) May 72.1 58.6 44.9
Aug 147.0 51.6 48.0
Table 3. Nitrification rates measured as the increase in NO3+NO2 in sediments (µg NO3+NO2
produced L-1 sediment h-1) in Ledbetter and Panther Creek chambers. AG = agriculturallyimpacted, P = pristine.
Stream Site ûNO3 (µg L-1) % Increase
Rate(µg NO3 L
-1 sediment h-1)
Ledbetter(AG) Gravel Bar 801.2 +340 11.13Hyporheic 238 +260 3.30
Panther (P) Gravel Bar 4.5 +5 0.06Hyporheic 8.0 +8 0.11
DISCUSSION
It is well known that agricultural practices increase sedimentation and greatly alter the chemistry ofsurface waters. However, land-use effects on microbial and biogeochemical processes at thegroundwater-surface water interface (hyporheic zone) mediated by increased nutrient, carbon, andsediment loads are largely unknown. Contaminants reaching streams from subsurface sources such asgroundwater are expected to be processed/transformed at the groundwater-surface water interfacedepending on heterogeneity and permeability of sediments and subsurface flow-path complexity.Methods and data presented here have focused primarily on delineating differences in hyporheic zonefunction that mediate agricultural and suburban runoff between and within streams. Results presentedabove are limited examples of data which might be obtained from colonization chambers. It is feasibleto examine other processes which indicate disturbance or alteration of function by other contaminantsentering streams from either point or non-point sources (e.g., contaminated groundwaters).
CONCLUSIONS
The sediment microbial colonization chamber described in this paper appears to be a reasonabledevice for examining microbial activities and biogeochemical transformations within the hyporheiczone or at the groundwater-surface water interface within streambeds.
Advantages of using the sediment colonization chamber described here are 1) constructionmaterials are inexpensive and the design is flexible for a variety of streambed types, 2) chambers aremulti-purpose in that both interstitial water chemistry and sediment sampling can be done, 3) timecourse incubations can be carried out, 4) transplanting of chambers for inter- and intra-site
Proceedings of the Ground-Water/Surface-Water Interactions Workshop July 2000
111
comparisons may be carried out, and 5) either natural sediments or more homogeneous artificialparticles (e.g., glass or ceramic beads) may be used in the chambers, 6) replication is quite good anddata are consistent between replicate chambers.
Some disadvantages may include 1) installation that may require 2 or more people, 2) colonizationperiods may be long (6 weeks minimum, 8-10 weeks preferred), 3) chamber sediments may not reflectactual particle size distributions found in streambeds, 4) chambers may prohibit infiltration of naturalCPOM (microbial fuel), and 5) chambers may alter local subsurface hydraulics. Continued monitoringof the chambers over time and space will help evaluate their ultimate usefulness in stream ecosystems.
REFERENCES
Claret, C., 1998a. A method based on artificial substrates to monitor hyporheic biofilm development,Internat. Rev. Hydrobiol., v. 83, pp. 135-143.
Claret, C., 1998b. Hyporheic biofilm development on artificial substrata, as a tool for assessing trophicstatus of aquatic systems: first results. Annls. Limnol., v. 34, pp. 119-128.
Danielopol, D.L. and R. Niederreiter, 1987. A sampling device for groundwater organisms and oxygenmeasurement in multi-level monitoring wells, Stygologia, v. 3, pp. 252-263.
Dodds, W.K., C.A. Randel, and C.C. Edler, 1996. Microcosms for aquifer research: application tocolonization of various sized particles by ground-water microorganisms, Ground Water, v. 34,pp.756-759.
Eisenmann, H., W. Traunspurger, and E.I. Meyer, 1997. A new device to extract sediment cagescolonized by microfauna from coarse gravel river sediments, Arch. Hydrobiol., v.139, pp. 547-561.
Findlay, S., 1993. Thymidine incorporation into DNA as an estimate of sediment bacterial production,in: Kemp, P., B. Sherr, E. Sherr, and J. Cole (eds), Handbook of methods in aquatic microbialecology, Lewis Publishers, Boca Raton, FL.
Fischer, H., M. Pusch, and J. Schwoerbel, 1997. Spatial distribution and respiration of bacteria instreambed sediments, Arch. Hydrobiol., v.137, pp. 281-300.
Fraser, B.G. and D.D. Williams, 1997. Accuracy and precision in sampling hyporheic fauna, Can. J.Fish. Aquat. Sci., v. 54, pp. 1135-1141.
Fraser, B.G., D.D. Williams, and K.W.F. Howard. 1996. Monitoring biotic and abiotic processesacross the hyporheic/groundwater interface. Hydrogeology Journal, v. 4, pp. 36-50.
Hendricks, S.P. 1996. Bacterial biomass, activity, and production within the hyporheic zone of a north-temperate stream, Archiv für Hydrobiologie, v.135, pp. 467-487.
Hendricks, S.P. and D.S. White, 1995. Seasonal biogeochemical patterns in surface water, subsurfacehyporheic, and riparian groundwater in a temperate stream ecosystem, Archiv für Hydrobiologie, v.134, pp. 459-490.
Hendricks, S.P. and D.S. White, 1991. Physicochemical patterns within a hyporheic zone of a northernMichigan river, with comments on surface water patterns, Can. J. Fish. Aquat. Sci., v.48, pp. 1645-1654.
Hendricks, S.P., 1993. Microbial ecology of the hyporheic zone: a perspective on the integration ofhydrology and biology, J. No. Amer. Benthol. Soc., v. 12, pp. 70-78.
Humpesch, U.H., and R. Niederreiter, 1993. Freeze-core method for sampling the vertical distributionof the macrozoobenthos in the main channel of a large deep river, the River Danube at riverkilometre 1889, Arch. Hydrobiol. Suppl., v. 101, pp. 87-90.
Jones, J.J., S.G. Fisher, and N.B. Grimm, 1995. Nitrification in the hyporheic zone of a desert streamecosystem, J. N. Am. Benthol. Soc., v. 14, pp. 249-258.
Mauclaire, L., P. Marmonier, and J. Gibert, 1998. Sampling water and sediment in interstitial habitats:a comparison of coring and pumping techniques, Arch. Hydrobiol., v.142, pp. 111-123.
Proceedings of the Ground-Water/Surface-Water Interactions Workshop July 2000
112
Sayler, G.S., M. Puziss, and M. Silver, 1979. Alkaline phosphatase assay for freshwater sediments:application to perturbed sediment systems, Appl. Environm. Microbiol., v. 38, pp. 922-927.
Shati, M.R., D. Rönen, and R. Mandelbaum, 1996. Method for in situ study of bacterial activity inaquifers, Environm. Sci. Tech., v. 30, pp. 2646-2653.
AUTHOR INFORMATION
Susan Hendricks, Hancock Biological Station, Murray State University, Murray, KY 42071;[email protected].
Proceedings of the Ground-Water/Surface-Water Interactions Workshop July 2000
113
Figure 1. A standard lipid-containing SPMD with three molecularwelds near each end. Note that low interfacial tension causesintimate contact (i.e., the present of a lipid film on the membraneinterior surface) between the triolein and the membrane evenwhere air bubbles exists.
Fundamentals of SPMD Sampling, Performance,and Comparability to Biomonitoring Organisms
By J.N. Huckins, J.D. Petty, H.F. Prest, J.A. Lebo, C.E. Orazio, J. Eidelberg, W.L.Cranor, R.W. Gale, and R.C. Clark
INTRODUCTION
Passive monitoring devices have long been used by the chemical industry and governmental agencies to ensure compliance to OSHA standards for time-weighted-average (TWA) concentrationsof organic vapors in the work environment. With the recent development of lipid-containingsemipermeable membrane devices (SPMDs) and samplers based on diffusive gradients across thinpolymeric films (DGTs), the passive in situ monitoring approach can now be applied to determiningTWA concentrations of both hydrophobic organics (SPMDs) and heavy metals (DGTs) in aquaticenvironments (1-3). In this work, we focus on the fundamentals of SPMD technology, and the potentialutility of the approach for monitoring organic contaminants in groundwater (includes the hyporheiczone).
SPMD SOURCE, DESIGN AND THEORY
The SPMD technology is the subject of two government patents and the devices are commercially available from Environmental Sampling Technologies, 1717 Commercial Drive, St.Joseph, MO 64503. A standard SPMD consists of a thin walled (75-95 m) layflat tube of low densitypolyethylene (LDPE) containing a thin film of 95% pure triolein (Figure 1). The ends of the LDPE, arewelded by heat-sealing. The length or size of the standard device can be customized to fit aninvestigator’s sampling needs. The membrane surface area-to-lipid-volume ratio of a standard SPMDis 450 cm2/m5 triolein. Because the LDPE membrane is nonporous (i.e., fixed pores do not constitute asignificant portion of the polymer free volume) and transient cavities in the membranes are generally <10 in diameter, only dissolved or readily bioavailable compounds are sampled.
A fundamental characteristic of passive monitors used to estimate TWAs of contaminants is theproportionality of sampler concentrations to ambient environmental concentrations. Also, suchmonitors are typically designed to be an infinite sink for target analytes. This characteristic results in a
Proceedings of the Ground-Water/Surface-Water Interactions Workshop July 2000
114
constant volume of air or water extracted per unit time (i.e., linear uptake of analytes at constantambient concentrations), and the following equation applies
Cw = CSPMD VSPMD/Rs t (1)
where Cw is the TWA analyte concentration in water (ng/5), CSPMD is the concentration in the wholedevice (membrane + lipid) in ng/5, VSPMD is the volume of the SPMD (L), Rs is the sampling rate for achemical in L/d, and t is exposure time in days (d).
Huckins et. al. (4) have shown that Rs values for PAHs and OCs ranged from 1 to 8 L/d (exposureconditions: 10-26 ºC, water velocity < 1cm/sec), when using a standard SPMD with VSPMD = 5mL.Thus, in the linear region of analyte uptake, an SPMD with VSPMD = 1 m5 will daily extract dissolvedcontaminants from 200 to 1,600 m5 of water. If the target compounds have relatively low octanol-waterpartition coefficients (i.e., log Kow < 4), such as VOCs, equilibrium between the device and thesurrounding water is often achieved in < 1 week. In that case, the following simple model can be usedfor water concentration estimates:
Cw = CSPMD/ KSPMD (2)
where KSPMD is the equilibrium SPMD-water partition coefficient. For compounds with log Kow of 4.0and > 4.0, KSPMD is 0.75 Kow and 0.3 Kow, respectively.
APPLICABILITY OF THE APPROACH
Standard SPMDs are designed to sample nonionic hydrophobic compounds. The total volume ofwater extracted by an SPMD at equilibrium is estimated by 0.75 Kow VSPMD (log Kows 4.0) and 0.3 Kow
VSPMD (log Kows > 4.0). For example, if the target analyte has a Kow of 300 the maximum (equilibrium)volume of water extracted by a standard 1 m5 triolein SPMD (VSPMD 5 mL) is only a little more (i.e.,1.1L) than a 1L grab sample. Thus, standard SPMDs are useful only for sampling compounds withKows > 300, unless an adsorbent is dispersed in the triolein (4).
Trace levels of a variety of classes of organic contaminants have been successfully determined inaquatic systems using SPMDs. These include but are not limited to the following: polycyclic aromatichydrocarbons, polychlorinated -biphenyls and -terphenyls, organochlorine pesticides, polychlorinated-dibenzodioxins and -dibenzofurans, chlorinated and brominated diphenyl ethers, chlorinated -benzenes, -anisoles and -veratroles, certain alkylated and chlorinated phenols, heterocyclic aromatics,pyrethroid and nonpolar to moderately polar organophosphate pesticides, and nonionic organometals.
DEPLOYMENT CONSIDERATIONS
Because SPMDs readily sample a broad spectrum of chemicals from air, exposure to organic vapors is minimized by transport to and from the sampling site in clean gas-tight metal cans. Otherprecautions are similar to those used for standard grab sampling methods.
The appropriate exposure duration is dependent on the physicochemical properties (e.g., Kows) ofthe target analytes, analytical sensitivity needed, choice of sampling approach (i.e., integrative orequilibrium), environmental conditions, and the potential for vandalism. When calibration data are
Proceedings of the Ground-Water/Surface-Water Interactions Workshop July 2000
115
available (4,6) or can be estimated for contaminants of concern, the following model can be used todetermine the time required to reach half of the SPMD equilibrium concentration (t1/2):
t1/2 = ln 0.5 KSPMD VSPMD/Rs (3)
Knowledge of these half-times or half-lives is useful because the uptakes of analytes are linear during1 t1/2.
Thus, within 1 t1/2 equation 1 can be used for water concentration estimates. If an equilibriumsampling approach is used, exposure time should be > 4 t1/2s and equation 2 is applicable. SPMDsampling rates are affected by temperature, water velocity, and biofouling. Fortunately, temperature,and to a lesser extent hydraulic conductivity (velocity), are generally more constant in ground watersystems than in surface waters. In surface waters, biofouling impedes analyte uptake, often limiting theutility of long exposure times. However, biofouling is much reduced in groundwater, therebypermitting significantly longer exposures (months instead of weeks) for compounds with high Kows(i.e., 6.0).
Even with the effects of the aforementioned environmental variables on sampling rates, Ellis et. al.(5) have shown that river water concentrations (dissolved phase) of trace organic contaminants can beestimated from SPMD concentrations within two-fold accuracy. Huckins, et al. (1,4) have suggestedthat the use of permeability reference compounds (PRCs) may further reduce errors in waterconcentration estimates. PRCs are analytically noninterfering compounds, such as deuterated PAHswith log Kows < 5.0, that are added to SPMD lipid before deployment. By determining PRC loss rates(Rs/KSPMD VSPMD or k2 ) from SPMDs during an environmental exposure and comparing them to PRCk2s measured during the experimental determination of sampling rates (Rss), the laboratory derived Rssof analytes can be adjusted to account for the effects of field exposure conditions.
COMPARABILITY TO BIOMONITORING ORGANISMS
The accumulations of organic contaminants by SPMDs and aquatic organisms have been comparedin a number of studies (2,4-6). Some studies have shown that the concentration patterns and uptakerates of several classes of chemicals by SPMDs and fishes are similar (6,7). However, it is unrealisticto expect SPMDs to mimic the uptake of all organic contaminants by all aquatic species because largedifferences exist among species in regard to diet/source of energy, metabolic activities (xenobiotics),and lipid composition and percentages. For example, few aquatic organisms contain 20% lipid byweight as SPMDs do. Thus, the capacities of most aquatic organisms to retain accumulated residuesare nearly always less than SPMDs (i.e., organism k2>>SPMD k2), which suggests that organisms usedas biomonitors may not retain detectable levels of some residues several days after an episodiccontaminant release.
GROUNDWATER APPLICATION
Although SPMDs are used extensively in surface waters (2,4) and in the atmosphere (8), theirapplication to ground water systems has been limited to a few studies. This is surprising becauselaboratory studies performed to determine SPMD sampling rates (4) more closely simulate therelatively constant conditions existing in some ground water systems.
Herein, we highlight a pilot study on the use of SPMDs by EPA Region 9 personnel for samplingdieldrin in groundwater at the George Air Force Base, California. The devices were deployed in two
Proceedings of the Ground-Water/Surface-Water Interactions Workshop July 2000
116
ground water monitoring wells where dieldrin residues were previously determined. The exposureperiod was 29 days. Based on laboratory calibration studies (4), each standard SPMD sampled a totalvolume of 58 5 of groundwater during the 29-day exposure. Figure 2 illustrates the results of theanalysis (high resolution gas chromatography-electron capture detection [ECD]) of SPMD extractsfrom well water at one of the sites, and of an associated SPMD control. Microgram quantities ofdieldrin were concentrated in each of two replicate SPMDs and the SPMD-derived TWA waterconcentration was estimated at 69 ng/5 (recovery-corrected). Earlier, a grab sample at the same site wasfound to contain 110 ng/5 of dieldrin (includes sorbed fraction). Much lower levels (140 to 2,800-foldless) of fifteen other chlorinated pesticides (e.g., chlordane components, endrin, endosulfan II andsulfate, etc.) were also detected in the SPMDs. These trace contaminants were not detected usingEPA’s (CLP) low-level pesticide method. In summary, SPMDs appear to be well suited for monitoringtrace hydrophobic organics in ground water systems.
Figure 2. ECD Chromatograms of an SPMD sample extract and a control SPMD. SPMDs were deployed for29 days in a ground water monitoring well at George Air Force Base, CA. Dieldrin and 15 other organo-chlorine pesticides were detected in the sample. The bottom two chromatograms were diluted 100-fold tokeep dieldrin on scale, and octachloronaphthalene (OCN) was used as an instrumental internal standard.
REFERENCES
(1) Huckins, J.N., Manuweera, G.K., Petty, J.D., Mackay, D., and J.A. Lebo, 1993. Environ. Sci.Technology, v. 27, pp. 2489-2496.
(2) Huckins, J.N., Petty, J.D., Lebo, J.A., Orazio, C.E., Prest, H.F., Tillitt, D.E., Ellis, G.S., Johnson,B.T., and G.K. Manuweera, 1996. In Techniques In Aquatic Toxicology; G.K. Ostrander (Ed.),CRC-Lewis Publishers, Boca Raton, FL, pp. 625-655.
(3) Davison, W. and H. Zhang, 1994. Nature, pp. 367,545.(4) Huckins, J.N., Petty, J.D., Prest, H.F., Orazio, C.E., and R.C. Clark, 1999. Guide for the Use of
Semipermeable Membrane Devices (SPMDs) as Samplers of Waterborne Hydrophobic OrganicContaminants, Reports for the American Petroleum Institute (API), API: 1220
(5) Ellis, G.S., Huckins, J.N., Rostad, C.E., Schmitt, C.J., Petty, J.D., and P. MacCarthy, 1995.Environ. Toxicol. Chem., v.14, pp. 1875-1884.
Proceedings of the Ground-Water/Surface-Water Interactions Workshop July 2000
117
(6) Meadows, J.C., Echols, K.R., Huckins, J.N., Borsuk, F.A., Carline, R.F., and D.E. Tillitt, 1998.Environ. Sci. Technol., v. 32, pp. 1847-1852.
(7) Peven, C.S., Uhler, A.D., and F.J. Querzoli, 1996. Environ. Toxicol. Chem., v. 15, pp. 144-149.(8) Ockenden, W.A., Prest, H.F., Thomas, G.O., Sweetman, A., and K.C. Jones, 1998. Environ. Sci.
Technol., v. 32, pp. 1538-1543.
AUTHOR INFORMATION
J.N. Huckins and J.D. Petty, Columbia Environmental Research Center, BRD, USGS, 4200 NewHaven Road, Columbia, MO. 65201.
H.F. Prest, J.A. Lebo, and C.E. Orazio, Institute of Marine Science, Long Marine Laboratory,University of California Santa Cruz, Santa Cruz, CA 95060.
J. Eidelberg, W.L. Cranor, R.W. Gale, and R.C. Clark, U.S. EPA, 75 Hawthorne Street, San Francisco,CA 94105.
Proceedings of the Ground-Water/Surface-Water Interactions Workshop July 2000
118
Acid Mine Drainage—The Role of Science
By Briant Kimball
Thousands of abandoned and inactive mines are located in environmentally sensitive mountainwatersheds. Cost-effective remediation of the effects of metals from mining in these watershedsrequires knowledge of the most significant sources of metals. The significance of a given source notonly depends on the concentration of a toxic metal, but also on the total mass of metal added to thestream. This discussion deals with accounting for the mass of metal that enters the stream, which iscalled the mass loading. It is calculated as the product of metal concentration and stream discharge.
Without discharge measurements, the overall effect of high metal concentrations on streams andaquatic organisms is unclear. A traditional discharge measurement is obtained by dividing a streaminto small sections and measuring cross-sectional area and average water velocity in each section.Because the channel bottom in mountain streams is not smooth and much of the flow is among thestreambed cobbles, accurate discharge measurements are difficult to obtain, even under the bestconditions.
AN APPROACH FOR MOUNTAIN STREAMS
A recent study by the U.S. Geological Survey Toxic Substances Hydrology Program illustrates apractical approach to obtaining and using discharge measurements in mountain streams. Chalk Creek,a tributary of the Arkansas River in Colorado, receives mine drainage from the Golf Tunnel adit.Metal-rich mine drainage from the Golf Tunnel is routed around waste rock and a capped tailings pileinto a constructed wetland. From the wetland, the mine drainage enters Chalk Creek from smallsprings and seeps along the stream. Regulatory and land management agencies have asked three basicquestions about Chalk Creek. First, is there more than one source of mine drainage that affects thestream? Second, does a remediation plan need to account for drainage from more than one source?Finally, have past remediation efforts been successful? To address these questions, we employed atracer-dilution study to determine discharge and synoptic sampling to obtain detailed chemicalcomposition from many locations. The synoptic samples are collected during a short period of time,typically a few hours, providing a “snapshot” of the changes along a stream at a given point in time.
ADDING A TRACER: DISCHARGE BY DILUTION
Discharge in mountain streams can be measured precisely by adding a dye or salt tracer to astream, measuring the dilution of the tracer as it moves downstream, and calculating discharge fromthe amount of dilution. Because we know the concentration of the injected tracer and the rate at whichit is added to the stream, we know the mass added to the stream. By measuring the concentration of thetracer upstream and downstream from the injection point, we can calculate the discharge by dilution ofthe tracer in the stream. To define discharge in Chalk Creek, a sodium chloride tracer was added at aconstant rate for 24 hours at a point upstream from the mine drainage. The chloride injection wasmonitored at several sites downstream from the injection point, documenting the incremental increaseof discharge due to water entering the stream. The difference in discharge between two stream sitesgives the total amount of inflow from surface- and ground-water sources in that small reach.
Proceedings of the Ground-Water/Surface-Water Interactions Workshop July 2000
119
SYNOPTIC SAMPLING: A “SNAPSHOT” IN TIME TO COMPARE METAL LOADING OF SOURCES
Synoptic samples provided metal concentrations, giving a detailed profile of zinc concentrations inboth the stream and inflows along the stream reach. To evaluate these concentrations, a mass-loadingprofile was calculated from the concentrations and the discharge values. The concentrations and themass-loading profile help answer the basic questions about the sources of metals and the effectivenessof remediation. First, there appears to be more than one source of mine drainage, because the highconcentration at 252 meters could not be from the Golf Tunnel. Second, despite the higherconcentration of zinc in water from the second source, the loading profile shows that the high-concentration water only contributes about 8 percent of the zinc load and would not require a separateremediation plan. Finally, there are still effects on metals in the stream where old tailings wereremoved downstream from 300 meters; these effects will likely decrease with time. The example ofChalk Creek shows that the highest inflow concentrations do not always result in the most significantsources of metal loading. Our results show that a site can be investigated in great detail to help makedecisions by using tracer injections and synoptic sampling.
(Mr. Kimball’s article is adapted, by permission, from an article published by the USGS. in January1997. More information on the Toxic Substances Hydrology Program can be obtained athttp://toxics.usgs.gov/toxics.)
Proceedings of the Ground-Water/Surface-Water Interactions Workshop July 2000
120
Temporal and Spatial Trends in BiogeochemicalConditions at a Groundwater-SurfacewaterInterface
By John M. Lendvay and Peter Adriaens
BACKGROUND
The Bendix, Allied Signal National Priority List (NPL) site at St. Joseph, Michigan, has beenextensively characterized for contaminant distribution and biogeochemical conditions between thecontaminant source and zone of emergence in Lake Michigan [Tiedeman and Gorelick, 1993;Semprini, et al., 1995; Lendvay, et al., 1998a; Lendvay, et al., 1998b]. The source of the contaminantplume at the site consists of trichloroethene (TCE) and minor contamination with hydrocarbons.Contaminant hydrocarbons and natural organic matter have stimulated sufficient indigenous microbialactivity in the groundwater to result in anaerobic conditions, predominantly sulfate-reducing andmethanogenic. Under these terminal electron accepting processes (TEAPs), TCE has been reductivelydechlorinated to predominantly cis-1,2-DCE, chloroethene, and ethene with minor production of 1,1-DCE, trans-1,2-DCE, and ethane.
Since the source of contamination is located approximately 750m up-gradient of Lake Michigan,the flow of groundwater toward the lake raised concern about the potential contamination of LakeMichigan with reductive dechlorination products, particularly chloroethene. Between 1994 and 1996,three transects of temporary bore-holes were established on the beach and approximately 100 metersfrom shore under the lake bottom to monitor the contaminant distribution and oxidation-reductionconditions at the GSI [Lendvay, et al., 1998a]. This study of the GSI suggested that the predominantTEAPS under Lake Michigan and in the zone along the beach was sulfate-reduction interspersed withmethanogenic conditions. Furthermore, reductive dechlorination was the predominant contaminanttransformation where these TEAPs predominated. However, in shallow regions of the contaminantplume near the lake shoreline, iron-reducing conditions predominated, which are conducive to eitherdechlorination [McCormick and Adriaens, 1998] or oxidation [Bradley and Chapelle, 1996] reactions.The more oxidized iron-reducing zone along the top of the GSI was hypothesized to result from re-oxygenation of the plume by surface water run-up, infiltration, and wave activity. Furthermore, it washypothesized that re-oxygenation of the aquifer to hypoxic conditions resulting from wave activitymight provide a suitable environment for aerobic commensalic or cometabolic biodegradationprocesses in the shallow zone along the beach.
The goals of this current study were to: i) evaluate the temporal effects of increased wave activity on the TEAPs and contaminant distribution; ii) determine the most likely microbial processesaffecting intrinsic remediation of the contaminants at the GSI; iii) present laboratory data tocorroborate field observations; and iv) determine field oxidative flux of chloroethene at the GSI.
METHODS
Multi-level arrays were placed to capture spatial variations in contaminant distribution andpredominant TEAPs, seasonal changes and effect of wave activity, and spatial infiltration of lake waterinto the GSI [Lendvay, et al., 1998b; Lendvay, et al., 1999b]. The arrays were semi-permanent toevaluate temporal effects of lake-activity on contaminant distribution and TEAPs during a six month
Proceedings of the Ground-Water/Surface-Water Interactions Workshop July 2000
121
Lake Michigan Wave Data(NOAA Buoy 45007)
0.0
0.5
1.0
1.5
2.0
Jun Jul Aug Sep Oct Nov Dec
Month 1996
Avg
. Wav
e H
eig
ht
(m)
Figure 1: Average wave height for Lake Michigan as measured byNOAA buoy 45007 during the sample time study (left). Error barsrepresent one standard deviation. Picture of GSI after a major stormevent (right). Notice the scatering of large debris, not present prior tothe storm.
period (July – December)encompassing seasonal changes inweather and lake activity. Seasonalchanges were evidenced by changes inLake Michigan wave height, asmeasured by National Oceanographicand Atmospheric Administration(NOAA) buoy 45007, averaged 0.53mfor August and September and 1.17 mfor November and December withheight increasing steadily betweenJune and December (Figure 1)[Lendvay, et al., 1998b].
Groundwater was sampled fivetimes, in four to six week intervals,from each sample point between Julyand December [Lendvay, et al.,1998b]. Specifically, temperature, pH, reduction potential (redox), specific conductance, and dissolvedoxygen were measured using a QED flow cell [Ann Arbor, MI]. Dissolved oxygen, aqueous ferrousiron, and aqueous sulfide were determined colorimetrically using a Chemetrics [Calverton, VA] fieldsampling kit. Dissolved hydrogen gas in the groundwater was determined as previously described[Lovley, et al., 1994]. Samples for contaminants, methane, sulfate, and short chain organic acids werecollected, preserved, and analyzed using headspace gas chromatography, ion chromatography, orHPLC as previously described [Lendvay, et al., 1998b].
Biomass was separated from aquifer solids to evaluate transformation potential by indigenousmethane-oxidizing microorganisms as previously described [Lendvay and Adriaens, 1999a]. Theresulting liquid suspension was plated and grown in an atmosphere of 50% methane and 50% air atambient temperature (22( ± 1(C). Methane-oxidizing colonies were washed off the plates and grownin liquid culture. Finally, cells were harvested by centrifugation and washing then resuspended inliquid culture to obtain a cell density of 2.89 mg of cells/m5 of suspension. Aqueous batchtransformation experiments were conducted at ambient temperature to evaluate transformation kineticsof cis-DCE, chloroethene and ethene by resting cells.
To evaluate the impact of oxidation on the flux of chloroethene into Lake Michigan, laboratory andfield results were transformed to an aquifer oxidative flux (Equation 1) as previously described[Lendvay and Adriaens, 1999a].
(1)0Field C
day
]VC[
dtdC λ=∆≈
The temporal change in field concentration of chloroethene (dC/dt) was assumed to equal theobserved rate of change for chloroethene concentration in the field, and the initial concentration ofchloroethene (C0) was assumed to be the average chloroethene concentration upgradient of the GSI[Weaver, et al., 1995]. The first order decay constant (�) was then determined. For this calculation,only the sample points that provided evidence of chloroethene oxidation were considered to contributeto the field oxidative flux.
Proceedings of the Ground-Water/Surface-Water Interactions Workshop July 2000
122
Oxyg en
166
167
168
169
170
171
172
173
0.00 0 .02 0 .04 0 .06 0 .08 0 .10
[O xyg en] (m M )
Ele
va
tio
n (
MA
MS
L)
July S eptember D ecember
S hallow Zone
D eep Zone
B M ethan e
166
167
168
169
170
171
172
173
0.0 0.2 0.4 0.6
[M e tha ne] (m M )
Ele
va
tio
n (
MA
MS
L)
July S eptember D ecember
S hallow Zone
D eep Zone
CChloroeth ene
166
167
168
169
170
171
172
173
0.0 2.0 4.0 6.0
[VC] (µ M )
Ele
va
tio
n (
MA
MS
L)
July S eptember D ecember
S hallow Zone
D eep Zone
A
Figure 2: Vertical concentration profiles for chloroethene (A), oxygen (B), andmethane (C) at ML-3 for three different time periods.
To evaluate the impact of oxidation on the flux of chloroethene into Lake Michigan, laboratory andfield first order decay constants were transformed to an aquifer oxidative flux at the GSI usingEquation 2 [Lendvay and Adriaens, 1999a]. The porosity (n) was assumed to be 0.32, a nominal valuefor sandy aquifers. The horizontal distance of the zone where chloroethene is oxidized (x) is thehorizontal coverage of ML-2 and ML-3. The vertical coverage of the oxidative zone (zshallow) is ratioedto the total depth (ztotal) of 6.3 meters to only consider the oxidative zone. Finally, the storm activity ofthe lake is assumed to be sufficient to oxidize chloroethene for only 180 days/year.
(2)0Field C
day
]VC[
dtdC λ=∆≈
RESULTS AND DISCUSSION
Vertical profiles of contaminants, geochemically relevant species, specific conductance, reductionpotential, and dissolved hydrogen gas concentrations were previously reported [Lendvay, et al., 1998b]with vertical profiles for chloroethene, oxygen and methane presented here (Figure 2). In addition tothese profiles, a lack of quantifiable contaminant concentration, high dissolved oxygen, and specificconductance measurements corresponding to typical lake water values provided direct evidence of lakewater infiltration at the shallowest sample point as wave activity increased suggesting that lake waterpenetrated the top 4 meters of the aquifer. Products of electron acceptor reduction, ferrous iron andsulfide, provided evidence for iron-reducing conditions in the shallow zone and iron- and sulfate-reducing conditions in the deep zone of the plume. The methane concentration profile decreased withtime in the shallow zone as was noticeable for the December sampling (Figure 2C).
Reduction potential measurements increased in value with time at all elevations suggesting re-oxidation occurred across the entire depth profile between August and December [Lendvay, et al.,1998b]. With the caveat that reduction potential measurements are biased towards the iron couple[Barcelona, et al., 1989; Barcelona and Holm, 1991], observed values were indicative of denitrifying toiron-reducing conditions. Dissolved hydrogen values were indicative for iron-reducing to sulfate-reducing conditions in the shallow zone, and iron-reducing to methanogenic in the deep zone [Lendvayet al., 1998b]. Furthermore, a temporal decrease in dissolved hydrogen concentrations (less reducingTEAPs) corroborated temporal trends in redox measurements.
To be able to discern temporal effects in the contaminant plume, selected contaminant andmethane concentrations were compared at the same location in the plume over the time period ofinterest, using quantile-quantile plots (Figure 3) [Lendvay, et al., 1998b]. These plots show that theconcentration of methane waslower for the November andDecember data compared tothe August and Septemberdata (Figure 3A). Additionally,these plots showed thatchloroethene concentrationsdecrease with time only in theshallow zone, and slightlyincreased in the deep zones ofthe plume (Figure 3C). Incontrast, the concentration ofcis-DCE increased in both theshallow and deep zones of thecontaminant plume with time
Proceedings of the Ground-Water/Surface-Water Interactions Workshop July 2000
123
cis-DCE Oxidation
0
2
4
6
8
10
12
0 20 40 60 80
Time (hours)
[cis
-DC
E]
(M
)
Active cis-DCE Ethyne Control
Azide Control
A Ethene Oxidation
y = -2.0E-02x + 9.9E+00
R2 = 9.6E-01
0
2
4
6
8
10
12
0 20 40 60 80
Time (hours)
[Eth
en
e]
(M
)
Active Ethene Ethyne Control
Azide Control
CChloroethene Oxidation
y = -6.2E-02x + 1.1E+01
R2 = 9.9E-01
0
2
4
6
8
10
12
0 20 40 60 80
Time (hours)
[Ch
loro
eth
en
e]
(M
)
Active Chloroethene Ethyne Control
Azide Control
B
Figure 4: Resting Cell Oxidation of cis-DCE (A), chloroethene (B), and ethene (C) by methane oxidizingmicroorganisms.
Te mp oral Var iat ion in M e th an e
0.0
0 .2
0 .4
0 .6
0 .8
1 .0
0 .0 0 .2 0 .4 0 .6 0 .8 1 .0
[M e th an e ] Au g ./S e p . (m M )
[Me
tha
ne
] N
ov
./D
ec
. (m
M)
A
Te mp oral Var iat ion in Ch lo ro e the n e
0.0
1 .0
2 .0
3 .0
4 .0
5 .0
0 .0 1 .0 2 .0 3 .0 4 .0 5 .0
[V C ] A ug ./S e p . (µ M )
[VC
] N
ov
./D
ec
. (
M)
S ha llow D eep
CTe mp oral Var iat ion in cis -DCE
0.0
1 .0
2 .0
3 .0
4 .0
5 .0
0 .0 1 .0 2 .0 3 .0 4 .0 5 .0
[c is -D C E ] Au g ./S e p . (µ M )
[cis
-DC
E]
No
v./
De
c.
(M
)
S ha llow D eep
B
Figure 3: Quantile-quantile plots for the data indicated. Foreach case, all data (ML-2 and ML-3) are considered forNovember and December samples on the ordinate, andAugust and September samples on the abscissa.
(Figure 3B). Combining the results for chloroethene and cis-DCE suggests the decrease inchloroethene concentration in the shallow zone was not a result of dilution by infiltration of lake water.
To elucidate specific field microbial processes responsible for chloroethene transformation,scattergrams comparing chloroethene or methane with oxygen in the shallow zone were evaluated forstatistical correlations [Lendvay, et al., 1998a]. In the case of both chloroethene and methane, peakconcentrations occurred at low oxygenconcentrations and low chloroethene andmethane concentrations occurred at highoxygen concentrations. Combined, these trendssuggest that chloroethene may be co-oxidizedby methane-oxidizing microorganisms in theshallow zone of the GSI as lake activityincreases.
To test this field-derived hypothesis andcorroborate the field measurements, laboratorystudies were conducted using groundwater andaquifer solids collected from the GSI. Themixed cultures were grown on methane as asole source of carbon and energy under aerobicconditions. A resting cell oxidation experimentwas conducted for cis-DCE, chloroethene, andethene in triplicate (Figure 4). Separate controlsof either 220 mg/5 sodium azide or 0.3%(vol./vol. gas phase) ethyne were effective atsuppressing all transformation of contaminants. Considering Figure 4, transformation of bothchloroethene and ethene is evident relative to controls, with the rate of chloroethene oxidation being2.9 nmoles/(day-mg protein) and ethene oxidation being 0.9 nmoles/(day-mg protein). Notransformation of cis-DCE was observed relative to controls. These results support the field findings,that chloroethene and possibly ethene are co-oxidized by methane-oxidizing microorganisms while cis-DCE is not.
To evaluate the impact of chloroethene oxidation on the flux of chloroethene into Lake Michigan,
Proceedings of the Ground-Water/Surface-Water Interactions Workshop July 2000
124
Table 1: Reported value for chloroethene flux at transect-5 (upgradient transect) using a MOD-FLOW model [Weaver, et al., 1995], and values for chloroethene flux at the GSI usingcalculated field and laboratory rates. Percent values represent the percent of chloroethene fluxat transect-5 that is oxidized by the reported value.
Defined Value Flux (g/(year-m2))Chloroethene Flux atTransect-5
0.86
Oxidative Flux ofChloroethene by FieldMeasurement
0.063 (~7%)
Oxidative Flux ofChloroethene by LaboratoryMeasurement
0.0007 (~0.1%of 0.86 or ~1%of Field Flux)
laboratory and field results were transformed to a field oxidative flux [Lendvay and Adriaens, 1999a].Using the calculated field and laboratory chloroethene oxidation rates, field flux calculations werepossible (Equation 2). The calculated oxidation fluxes were compared to the chloroethene fluxupgradient as calculated by a MOD-FLOW model (Table 1) [Wilson, et al., 1994].
Field calculations of the oxidative flux for chloroethene suggest that only about 7% of the annualchloroethene flux into Lake Michigan is mitigated by measurable biogeochemical processes at the GSIas a result of increased storm activity. Of this observed field flux, only 1% could be associated with aparticular microbial culture namely methane-oxidizing microorganisms. The remaining catalyticactivity affecting the contaminant plume may be due to other physiological types in the aquifer solidssuch as non-culturable methane-oxidizing, heterotrophic [Wackett, et al., 1989; Davis and Carpenter,1990], autotrophic [Vannelli et al, 1990], ethene oxidizing [Freedman and Herz, 1996], iron-reducing[Bradley and Chapelle, 1996], or fermentative microorganisms [Bradley, et al., 1998]. This study hascontributed to our understanding of the dynamics of GSIs with respect to microbial activity andgeochemistry, and points towards a possible role of methane-oxidizers in mitigating chloroetheneimparted toxicity.
REFERENCES
Barcelona, M.J. and T.R. Holm, 1991. Oxidation-Reduction Capacities of Aquifer Solids,Environmental Science and Technology, v. 25, pp.1565-1572.
Barcelona, M.J., Holm, T.R., Schock, M.R., and G.K. George, 1989. Spatial and Temporal Gradientsin Aquifer Oxidation-Reduction Conditions, Water Resources Research, v. 25, pp. 991-1003.
Bradley, P.M. and F.H. Chapelle, 1996. Anaerobic Mineralization of Vinyl Chloride in Fe (III)-Reducing, Aquifer Sediments, Environmental Science and Technology, v. 30, pp. 2084-2086.
Bradley, P.M. and F.H. Chapelle, 1998. Effect of Contaminant Concentration on Aerobic MicrobialMineralization of DCE and VC in Stream-Bed Sediments, Environmental Science and Technology,v. 32, pp.553-557.
Davis, J.W. and C.L. Carpenter, 1990. Aerobic Biodegradation of Vinyl Chloride in GroundwaterSamples, Applied and Environmental Microbiology, v. 56, pp. 3878-3880.
Proceedings of the Ground-Water/Surface-Water Interactions Workshop July 2000
125
Freedman, D.L. and S.D. Herz, 1996. Use of Ethylene and Ethane as Primary Substrates for AerobicCometabolism of Vinyl Chloride, Water Environment Research, v. 68, pp. 320-328.
Lendvay, J.M., Sauck, W.A., McCormick, M.L., Barcelona, M.J., Kampbell, D.H., Wilson, J.T., andP. Adriaens, 1998a. Geophysical Characterization, Redox Zonation, and Contaminant Distributionat a Groundwater/Surface Water Interface, Water Resources Research, v. 34, pp. 3545-3559.
Lendvay, J.M., Dean, S.M., and P. Adriaens, 1998b. Temporal and Spatial Trends in BiogeochemicalConditions at a Groundwater-Surface Water Interface: Implications for Natural Bioattenuation,Environmental Science and Technology, v. 32, pp. 3472-3478.
Lendvay, J.M. and P. Adriaens, 1999a. Laboratory evaluation of temporal trends in biogeochemicalconditions at a groundwater–surface water interface, Physics and Chemistry of the Earth.
Lendvay, J.M., Dean, S.M., Barcelona, M., Adriaens, P., and N.D. Katopodes, 1996b. Installing Multi-Level Sampling Arrays to Monitor Groundwater and Contaminant Discharge to a Surface WaterBody, Groundwater Monitoring and Remediation.
Lovley, D.R., Chapelle, F.H., and J.C. Woodward, 1994. Use of Dissolved H2 Concentration toDetermine Distribution of Microbially Catalyzed Redox Reactions in Anoxic Groundwater,Environmental Science and Technology, v. 28, pp. 1205-1210.
McCormick, M.L. and P. Adriaens, 1998. Tetrachloroethylene Transformation in an Iron ReducingEnrichment Culture, Abstract, 98th General Meeting of the American Society for Microbiology,Atlanta, GA, p.453, American Society for Microbiology, Washington, DC, 1998.
Semprini, L., P.K. Kitanidis, D.H. Kampbell, and J.T. Wilson, 1995. Anaerobic Transformation ofChlorinated Aliphatic Hydrocarbons in a Sand Aquifer Based on Spatial Chemical Distributions,Water Resources Research, v. 31, pp.1051-1062.
Tiedeman, C. and S.M. Gorelick, 1993. Analysis of Uncertainty in Optimal Groundwater ContaminantCapture Design, Water Resources Research, v. 29, pp. 2139-2153.
Vannelli, T., Logan, M., Arciero, D.M., and A.B. Hooper, 1990. Degradation of Halogenated AliphaticCompounds by the Ammonia-Oxidizing Bacterium Nirosomonas europaea, Applied andEnvironmental Microbiology, v. 56, pp.1169-1171.
Wackett, L.P., Brusseau, G.A., Householder, S.R., and R.S. Hanson, 1989. Survey of MicrobialOxygenases: Trichloroethylene Degradation by Propane-Oxidizing Bacteria, Applied andEnvironmental Microbiology, v. 55, pp. 2960-2964.
Weaver, J.W., J.T. Wilson, D.H. Kampbell, and M.E. Randolph, 1995. Field Derived TransformationRates for Modeling Natural Bioattenuation or Trichloroethylene and its Degradation Products, inProceedings of the Next Generation Environmental Models and Computational Methods, Bay City,MI.
Wilson, J.T., Weaver, J.W., and D.H. Kampbell, 1994. Intrinsic Bioremediation of TCE in GroundWater at an NPL Site in St. Joseph, Michigan, EPA/540/R-94/515, pp.154-160.
Proceedings of the Ground-Water/Surface-Water Interactions Workshop July 2000
126
Natural Attenuation of Chlorinated Solvents in aFreshwater Tidal Wetland, Aberdeen ProvingGround, Maryland
By Michelle M. Lorah and Lisa D. Olsen
Ground-water contaminant plumes that are flowing toward or currently discharging into wetlandareas present unique remediation problems because of the hydrologic connections between groundwater and surface water and the sensitive habitats in wetlands. Because wetland sediments typicallyhave a large diversity of microorganisms and redox conditions that could enhance biodegradation, theyare ideal environments for natural attenuation of organic contaminants. “Natural attenuation” is ageneral term that includes all naturally occurring physical, chemical, and biological processes that canreduce contaminant concentrations or toxicity without human intervention. Biodegradation generally isconsidered the most important of these processes for ground-water remediation purposes because it is adestructive process, unlike sorption, dilution, or volatilization. Natural attenuation is a treatmentmethod that would leave the ecosystem largely undisturbed and be cost-effective. In this research, thenatural attenuation of chlorinated volatile organic compounds (VOCs) was studied in a contaminantplume that discharges from a sand aquifer to a freshwater tidal wetland at Aberdeen Proving Ground,Maryland (Lorah, et al., 1997).
Biodegradation processes of two of the major contaminants, trichloroethylene (TCE) and 1,1,2,2-tetrachloroethane (PCA), are the focus of this combined field and laboratory study. The fate of PCA inthe wetland is particularly emphasized in this research because the occurrence and dominant pathwaysof PCA degradation in ground water or soil were largely unknown. The few previous studies on PCAdegradation were laboratory experiments that were constructed with anaerobic mineral medium orglass beads and seeded with mixed cultures from municipal sludge waste, or with abiotic aqueousmixtures of transition-metal coenzymes (Lorah, et al., 1997). The general field approach used in thisstudy included (1) installing nested drive-point piezometers to characterize the ground-water chemistryand contaminant distribution along two transects through the wetland (one shown in Figure 1), and (2)using porous membrane sampling devices (peepers) to obtain centimeter-scale resolution ofcontaminant distribution in the wetland porewater. The general laboratory approach includedconducting batch microcosm experiments with wetland sediment and porewater under methanogenic,sulfate-reducing, and aerobic conditions to confirm field evidence of biodegradation pathways,investigate potential controlling factors on biodegradation, and estimate biodegradation rates.
Field evidence collected along the two ground-water flowpaths shows that anaerobicbiodegradation of TCE and PCA is enhanced in the wetland compared to the aquifer sediments (Lorah,et al., 1997; Lorah and Olsen, in press). The enhanced biodegradation is associated with the naturalincrease in dissolved organic carbon concentrations and decrease in redox state of the ground wateralong the upward flow direction in the wetland sediments. The aquifer typically is aerobic. Iron-reducing conditions are predominant in the lower wetland sediment unit composed of clayey sand andsilt, and methanogenesis was predominant in an upper unit composed of peat (Figure 2). A decrease inconcentrations of TCE and PCA and a concomitant increase in concentrations of anaerobic daughterproducts occurs along upward flowpaths through the wetland sediments (Figures 1 and 2). Thedaughter products 1,2-dichloroethylene (1,2-DCE), vinyl chloride (VC), 1,1,2-trichloroethane (1,1,2-TCA), and 1,2-dichloroethane (1,2-DCA) are produced from hydrogenolysis of TCE and from PCA
Proceedings of the Ground-Water/Surface-Water Interactions Workshop July 2000
127
Figure 2. Vertical distribution of (A) the parent contaminants TCE and PCA and possible anaerobic daughterproducts and (B) selected redox-sensitive constituents at site WB-26, June-October 1995.
Figure 1. Concentrations of TCE in ground water along section A-A�, June-October 1995.
degradation through hydrogenolysis and dichloroelimination pathways. Total concentrations of TCE,PCA, and their degradation products, however, decrease to below detection levels (generally less than0.5 µg/5) within 0.15 to 0.30 m of land surface. Natural attenuation in the wetland sediments seems tobe effective even where relatively high concentrations of VOCs are discharging upward through verythin (less than 2 m) layers of wetland sediment and when microbial activity probably decreases duringcooler seasons (Lorah, et al., 1997; Lorah and Olsen, in press). Field evidence indicates that highlyreducing conditions are not necessary for dichloroelimination of PCA to 1,2-DCE, or forhydrogenolysis of PCA to 1,1,2-TCA and then to 1,2-DCA. Maximum concentrations of VC, however,
Proceedings of the Ground-Water/Surface-Water Interactions Workshop July 2000
128
Figure 3. Degradation under methanogenic conditions in microcosms amended with 3.0)mol/L of TCE or 2.9 )mol/L of PCA at day 0: (A) TCE and the daughter products cis-12DCE,trans-12DCE, and VC in the TCE-amended microcosms; (B) PCA and the sum of daughterproducts in the live PCA-amended microcosms and formalin-amended controls; (C) daughterproducts 12DCE (total of the cis and trans isomers), VC, 112TCA, and 12DCA in the PCA-amended microcosms; and (D) cis-12DCE and trans-12DCE in the PCA-amendedmicrocosms. [The concentrations shown are the average measured in duplicate microcosmssacrificed at each time step.]
coincided with the highest concentrations of methane in the wetland porewater, indicating thatcontinued anaerobic degradation of 1,2-DCE to VC and of VC to the non-toxic end-product ofethylene may require the highly reducing conditions of methanogenesis.
Laboratory microcosms that were prepared using wetland sediment and ground water from the siteconfirmed field evidence of biodegradation pathways and allowed estimation of biodegradation rates(Lorah, et al., 1997). TCE biodegradation occurred through hydrogenolysis to 1,2-DCE (predominatelythe cis isomer) and VC under methanogenic (Figure 3) and sulfate-reducing conditions. For PCAdegradation under methanogenic conditions, the cis and trans isomers of 1,2-DCE and VC were thepredominant persistent daughter products in one set of microcosm experiments (Lorah and Olsen,1999) (Figure 3). In two sets of later experiments, however, 1,2-DCA was the predominant persistentdaughter product from PCA and 1,1,2-TCA degradation under methanogenic conditions. Thedifferences between the experiments seemed to result from differing pathways of 1,1,2-TCAdegradation, rather than from differences in the initial PCA degradation pathway. 1,1,2-TCA wasproduced simultaneously with 1,2-DCE early in the time course in all experiments. The 1,1,2-TCAproduced from hydrogenolysis of PCA was degraded by dichloroelimination to VC in the firstexperiment, whereas it was degraded by continued hydrogenolysis to 1,2-DCA in the second and thirdexperiments. Natural temporal or spatial variations in the microbial populations in the wetlandsediments may have caused the differing degradation pathways in these experiments.
In all PCA-amended microcosms, 1,1,2-TCA occurred simultaneously with 1,2-DCE early in thetime course, indicating that hydrogenolysis and dichloroelimination of PCA can occur simultaneously(Lorah and Olsen, 1999). Significantly lower ratios of cis-1,2-DCE to trans-1,2-DCE were producedby dihaloelimination of PCA than by hydrogenolysis of TCE (Figure 3). Only one other study, whichwas conducted in the laboratory using anaerobic municipal sludge, has reported evidence for both of
Proceedings of the Ground-Water/Surface-Water Interactions Workshop July 2000
129
these PCA degradation pathways (Chen, et al., 1996). Recognition of the dichloroelimination pathwayfor PCA is important because TCE is a common co-contaminant with PCA at this site and otherhazardous-waste sites. The 1,2-DCE isomer distribution potentially could assist in determining whetherPCA degradation is occurring at sites where TCE is a co-contaminant. In the PCA-amendedmicrocosms with the wetland sediment, TCE production commonly was less than 5 % of the initialPCA concentration in the live and sterile microcosms, showing that abiotic dehydrochlorination is nota significant degradation pathway for PCA in this environment.
Under methanogenic conditions, first-order biodegradation rates of TCE ranged from 0.30 to 0.37day-1 (half-life of about 2 days), showing extremely rapid biodegradation in these organic-rich wetlandsediments. Although the TCE biodegradation rate was an order of magnitude slower under sulfate-reducing conditions (0.032 day-1) than methanogenic conditions, the rate was still two orders ofmagnitude higher than those reported in the literature for anaerobic TCE biodegradation in microcosmsconstructed with sandy aquifer sediments (Rifai, et al., 1995). The slow production and degradation of1,2-DCE and VC in TCE-amended microcosms that were incubated under sulfate-reducing conditionsor with the addition of an inhibitor of methanogenic activity confirmed field evidence thatmethanogenic activity is important in continued anaerobic degradation of these daughter products.
First-order rate constants for anaerobic degradation of PCA and 1,1,2-TCA ranged from 0.15 to0.58 day-1 (half-lives of 1.2 to 4.6 days), again showing that biodegradation of highly chlorinatedVOCs is extremely rapid in the wetland sediments. Similar PCA degradation rates were observedunder methanogenic and sulfate-reducing conditions, although methane production and sulfatereduction occurred simultaneously during the first 15 days of incubation in the microcosms that wereamended with sulfate to stimulate sulfate-reducing conditions. The addition of an inhibitor ofmethanogenic activity to PCA-amended microcosms decreased the methane production rates by afactor of 10 and caused a nearly 50% decrease in the PCA degradation rate compared to microcosmswithout the inhibitor. In addition, the production and subsequent degradation of the daughter products1,2-DCA, 1,2-DCE, and VC were slower when methanogenic activity was inhibited in the PCA-amended microcosms. Both the TCE-amended and PCA-amended microcosm experiments, therefore,indicate that complete anaerobic degradation of the chlorinated VOCs is most rapid whenmethanogenic activity is high.
Although the wetland sediments have predominantly anaerobic conditions, aerobic conditions maybe present in surficial sediments near the air-water interface and in subsurface sediments near plantroots, providing a suitable environment for methanotrophs that can degrade chlorinated VOCs throughcometabolic oxidation (Lorah, et al., 1997). Although coupling of anaerobic and aerobic degradationprocesses has been suggested as the best possible bioremediation method for chlorinated VOCs such asTCE, few studies have investigated the degradation of TCE under both anaerobic and aerobicconditions for a natural subsurface setting. In aerobic microcosm experiments with the wetlandsediment, biodegradation of cis-1,2-DCE, trans-1,2-DCE, and VC only occurred if methaneconsumption occurred, indicating that methanotrophs were involved. Aerobic biodegradation rates forcis-1,2-DCE, trans-1,2-DCE, and VC were in the same range as those measured for TCE and PCAunder anaerobic conditions. Production of these anaerobic daughter products of TCE and PCA,therefore, could be balanced by their consumption where methanotrophs are active in the wetlandsediment, including near land surface and in the rhizoplane and root tissues of aquatic plants inwetlands (Lorah, et al., 1997).
In summary, biodegradation through both anaerobic and aerobic processes is a significant naturalattenuation mechanism for chlorinated hydrocarbons in these wetland sediments, causing a reduction
Proceedings of the Ground-Water/Surface-Water Interactions Workshop July 2000
130
in contaminant concentrations and toxicity before surface-water receptors are reached. This combinedfield and laboratory study provides a general approach and scientific basis for investigating thefeasibility of natural attenuation as a remediation alternative for other sites where ground-water plumesdischarge to wetlands and similar organic-rich environments at ground-water/surface-water interfaces.Because conditions in the wetland sediments are naturally conducive to biodegradation of thechlorinated VOCs in the discharging ground water, biodegradation could potentially be sustainedindefinitely, unlike many ground-water environments where biodegradation commonly is limited bythe supply of organic substrates. The results of this study also increase our understanding of the fate ofchlorinated VOCs in the environment, providing information beneficial in characterizing contaminantbehavior and in implementing bioremediation systems for other ground-water contaminant plumes.
REFERENCES
Chen, Chun, Puhakka, J. A., and J.F. Ferguson, 1996. Transformations of 1,1,2,2-tetrachloroethaneunder methanogenic conditions, Environmental Science and Technology, v. 30, no. 2, pp. 542-547.
Lorah, M.M., and L.D. Olsen, 1999. Degradation of 1,1,2,2-tetrachloroethane in a freshwater tidalwetland: Field and laboratory evidence, Environmental Science and Technology, v. 33, p. 227-234.
Lorah, M.M., and L.D. Olsen, in press. Natural attenuation of chlorinated volatile organic compoundsin a freshwater tidal wetland: Field evidence of anaerobic biodegradation: Water ResourcesResearch.
Lorah, M.M., Olsen, L.D., Smith, B.L., Johnson, M.A., and W.B. Fleck, 1997. Natural attenuation ofchlorinated volatile organic compounds in a freshwater tidal wetland, Aberdeen Proving Ground,Maryland: U.S. Geological Survey Water-Resources Investigations Report 97-4171, 95 pp.
Rifai, H.S., Borden, R.C., Wilson, J.T., and C.H. Ward, 1995. Intrinsic bioattenuation for subsurfacerestoration, in Intrinsic Bioremediation, R. E. Hinchee and others (eds.), Columbus, Ohio, BattellePress, pp. 1-29.
AUTHOR INFORMATION
Michelle M. Lorah and Lisa D. Olsen, U.S. Geological Survey, 8987 Yellow Brick Road, Baltimore,MD 21237.
Proceedings of the Ground-Water/Surface-Water Interactions Workshop July 2000
131
Discharge of Contaminated Ground Water toSurface Water: An Ecological Risk AssessmentPerspective
By Mary Baker Matta and Tom Dillon
INTRODUCTION/OVERVIEW
The ecological risk associated with the discharge of contaminated ground water to surface watermay be difficult to evaluate at complex hazardous waste sites. However, at many sites, groundwaterdischarges provide a significant pathway for contamination to reach ecological receptors. AlthoughEPA has guidance for generic risk assessment, and has specific guidance for ecological riskassessments at CERCLA sites, specific guidance on how to evaluate ecological risk of groundwaterdischarges is lacking.
The hyporheic zone connects the ecological communities in ground water, sediment, and surfacewater. Although benthic macroinvertebrate communities are often considered in ecological riskassessments (and they may be adversely affected by contamination in the hyporheic zone), microbialcommunities of the hyporheic zone are rarely considered receptors of concern in ecological riskassessments. Because groundwater discharges contribute to sediment and surface water contaminationthey also have the potential to adversely affect fish and other aquatic species, particularly wherebioaccumulative compounds are released or where sensitive life stages are in close proximity togroundwater discharge points.
The nature and extent of the contamination present in groundwater and characteristics of theecosystem will determine what and where to sample, and what tests should be conducted to evaluateecological risk and develop protective cleanup levels if risk is significant. Natural attenuation isincreasingly considered as a remedial option at many sites. Natural attenuation is influenced bymicrobial activity and physico-chemical characteristics of the groundwater and its movement.Therefore, if natural attenuation is to be considered as a viable remedial option, the microbialcommunity in the hyporheic zone should be protected, and its role in chemical fate and transformationshould be assessed. At sites where ecological risk is significant, more active cleanup measures may benecessary to protect natural resources.
NOAA’s experience in aquatic ecological risk assessment is applied in this poster to provide somerecommendations for evaluating ecological risk of groundwater discharge to surface waters. Thisposter focuses on data needs and how to answer them, structured around the EPA risk assessmentprocess.
NOAA prepares Coastal Hazardous Waste Site Reviews using available information to screen sitesbased on:
• proximity of the site to the coast or inland water bodies that support anadromous fish populations
Proceedings of the Ground-Water/Surface-Water Interactions Workshop July 2000
132
• site history, contaminants that are likely to be or have been detected at the site • potential contaminant migration pathways (including groundwater) • presence of sensitive habitats or species near the site
This same information is required in screening level risk assessments.
Maximum contaminant concentrations in groundwater are screened by NOAA using a value tentimes greater than chronic ambient water quality criteria to account for potential dilution whengroundwater enters surface waters and to protect all aquatic species. Therefore, detection limits forchemical analysis of unfiltered groundwater should be less than 10 times chronic ambient water qualitycriteria to conduct this assessment. The most recent edition of Hazardous Waste Site Reviews (NOAA,1997) indicates that groundwater discharges are a widespread problem for natural resources:
• At 10 of the 11 sites evaluated, groundwater is a potential pathway for contaminants to reachnatural resources.
• At 8 of the 11 sites evaluated, concentrations in groundwater exceed screening levels.
Sites Reviewed in December, 1997
Region 1 Beede Waste Oil, Plaistow, NHRegion 2 V&M/Albaladejo Farms, Vega Baja, Puerto RicoRegion 3 Fort George G. Meade, Anne Arundel Co, MD
Norfolk Naval Base, Norfolk, VASalford Quarry, Lower Salford Townshp, PA
Region 4 Brunswick Wood Preserving, Brunswick, GAMRI Corp, Tampa, FL*Terry Creek Dredge Spoil/Hercules, Brunswick, GATyndall Air Force Base, Bay Co, FL
Region 6 Madisonville Creosote Works, Madisonville, LARegion 10 Oeser Company, Bellingham, WA*Groundwater not a significant pathway to natural resources
RISK ASSESSMENT STEP 3: BASELINE RISK ASSESSMENT PROBLEM FORMULATION
Steps: • Refine list of contaminants based on screening • Summarize toxicological effects • Consider likely fate and transport of contaminants • Determine receptors likely to be at risk • Determine complete exposure pathways • Develop conceptual site model with risk questions • Develop assessment endpoints
Considerations specific to sites with groundwater contamination: • Potential biogeochemical alterations of contaminants.
-persistent organic contaminants might be released as an LNAPL or DNAPL and bind to sediments as they are released to surface water.
Proceedings of the Ground-Water/Surface-Water Interactions Workshop July 2000
133
- Metals might be released in dissolved form and complex with other compounds at the discharge point, groundwater discharge to marine water may alter solubility of metals.
- Groundwater discharge may leach metals from sediments.- Organic contaminants released in a solvent plume may be more bioavailable
• Conceptual model for the site should include pathways for exposure and mechanisms of toxicityfor the contaminants and receptors specific to the site
• Consider characteristics of discharge specific to the regime: -groundwater discharge into intertidal zone at marine sites; - discharge into tidal creeks in salt marshes;- hyporheic zone in alluvial rivers as a function of channel morphology, bed
roughness, and permeability (Triska, et al. 1989).
• Consider hyporheos as receptors of concern (macrofauna and microbes)
Assessment Endpoints of General Concern to NOAA (with some specific examples)
• Protection of benthic community structure and function(Protection of stonefly populations from direct toxic effects)
• Protection of aquatic community structure and function(Protection of fish eggs and larvae from direct toxic effects, including ecologically relevantsub-lethal effects)(Protection of hyporheic microbial community from direct toxic effects)
• Protection of fish populations and communities(Protection of fish from reproductive effects)(Protection of fish from immune system disruption)(Protection of fish from reductions in survival and growth)
• Protection of specific habitat functions (for example, nutrient cycling)(Protection of hyporheic microbial community from direct toxic effects)
• Protection of fishery resources from contamination(Protection of human health from exposure to bioaccumulated contaminants)
RISK ASSESSMENT STEPS 4, 5, AND 6: STUDY DESIGN/DATA QUALITY OBJECTIVES/FIELDVERIFICATIONS/SITE INVESTIGATIONS
Steps• Evaluate uncertainty in existing data• Develop measurement endpoints to evaluate assessment endpoints• Develop work plan to evaluate exposure and effects
-methods-statistical considerations-sampling locations, timing, frequency
Proceedings of the Ground-Water/Surface-Water Interactions Workshop July 2000
134
• Verify sampling design• Site investigation• Data analysis
Considerations specific to sites with groundwater contamination:
•Evaluating exposure potential is a major concern; need to determine nature and extent of contamination and factors that may control bioavailability and toxicity:-Discharge locations-Flux of contaminants-Form/speciation of contaminants-Presence of non aqueous phase layers (NAPL)-Potential contaminant interactions, for example enhanced transport of hydrophobic(biomagnifying) contaminants in a dissolved solvent plume
• NOAA recommends a weight of evidence approach based on:-Groundwater models predicting a vector discharge to surface water-Remote sensing and geological analysis: identification of paleochannels using ground-
penetrating radar; location of surface depressions, abandoned meander channels to locatespringbrooks through aerial photography (Stanford and Ward, 1993).
-Developing a water budget - upstream/downstream gauging, tracer studies-Changes in water quality parameters due to groundwater discharge (temperature, pH,
conductance, nutrients, DOC, oxygen (Triska, et al., 1989).-Direct measurements
•Specific effects measurements will be a function of receptors of concern; contaminants; andexposure pathway-Benthic macroinvertebrates-generally a concern for direct toxicity via surface water or
sediment contamination as a result of groundwater discharges-Microbes-generally a concern for direct toxicity of groundwater, pore water, or surface water-Fish- may include a concern for direct toxicity of pore water or surface water to early life
stages (for example, where dissolved metals are discharged) or a concern for indirecttoxicity after contamination of sediment and food organisms.
• Groundwater and NAPL can contaminate sediments and surface water
• Ecological risk associated with sediment contamination is usually evaluated via -chemical analysis of sediment (focus on persistent contaminants)-toxicity testing -benthic community evaluations -chemical analysis of biota for bioaccumulative contaminants-comparisons of tissue concentrations to literature effects thresholds-food web modeling for persistent bioaccumulative contaminants
• Ecological risk associated with water contamination is usually evaluated via-chemical analysis of water (focus on persistent contaminants or continuous releases of less
persistent contaminants)
Proceedings of the Ground-Water/Surface-Water Interactions Workshop July 2000
135
-aquatic toxicity tests -comparisons of water concentrations to literature or AWQC benchmarks.
• Sampling and analysis concerns:-number and locations of samples should be adequate to evaluate exposure potential
and minimize uncertainty (plumes should be characterized, and locations where sensitivereceptors would be exposed should be sampled)
-seasonal considerations affecting groundwater flow or the seasonal presence of sensitive receptors may require multiple sampling events
-analyze filtered and unfiltered water (organisms are exposed to both)-analyze pore water where appropriate for the receptor (fish eggs, for example)-collect ancillary data that can be used to interpret bioavailability, toxicity, and
potential for natural attenuation (sediment grain size, sediment total organic carbon, acidvolatile sulfides, dissolved organic carbon, nutrients, alkalinity, dissolved oxygen).
-use detection limits low enough to compare to benchmarks-consider metal speciation and effects on bioavailability and toxicity-selection of reference sites is critical in evaluating exposure and effects (reference
sites should be similar to the study site, but located away from point sources ofcontamination)
RISK ASSESSMENT STEP 7: RISK CHARACTERIZATION
Steps:• Interpreting data• Tracking sources• Modeling mass flux• Modeling food web effects• Reducing and incorporating uncertainty• Applying protective assumptions • Interpreting the weight of evidence• Developing cleanup levels
Considerations specific to sites with groundwater contamination:• Interpreting data
-agree on interpretive methods before collecting data-compare results to benchmarks, control samples, and reference site results-consider normalizing data to nutrients, grain size, or other factors
• Source tracking (relative contribution of groundwater and surface releases) is important to ensuresuccess of the remedy (in terms of reducing risk to ecological receptors). Consider the potentialfor recontamination through ongoing groundwater discharge.
• Models on groundwater discharge rates and contaminant loading are usuallyhighly uncertain, therefore, to be protective, conservative assumptions must be made untilbetter techniques, data, and models are available.
•Conduct specific studies to determine the potential for natural attenuation, which is driven largelyby microbes and their physico-chemical environment (consider the specific types of microbesrequired to degrade contaminants at the site; some require aerobic).
Proceedings of the Ground-Water/Surface-Water Interactions Workshop July 2000
136
•Water quality and sediment goals for receptors can be empirically derived from toxicity tests butback calculating for groundwater quality goals requires a good model
Examples:
At the Metal Bank of America site in Philadelphia, PA, the primary pathway for contaminants toreach natural resources was through discharge of contaminated groundwater and non-aqueous phaselayer. PCBs accumulated in sediment, clams, and fish near the site to concentrations that weredetermined to pose significant risk.
RISK ASSESSMENT STEP 8: RISK MANAGEMENT
Considerations specific to sites with groundwater contamination:•Potential for recontamination- uncontrolled groundwater discharges have the
potential to interfere with a sediment remedy•Monitoring-the effects that drove the selection of the remedy should be incorporated into
monitoring, significant ongoing exposures should be monitored over time and re-evaluated
CONCLUSIONS/RECOMMENDATIONS
• Potential for groundwater to provide a contaminant pathway to aquatic species should beconsidered, it seems to be a problem throughout the country in all regions examined.
• NOAA screens GW for potential concern using 10 times chronic AWQC values• Detection limits for unfiltered groundwater should be low enough to conduct this screening• Consider potential biogeochemical alterations and complex interactions between contaminants.• Consider characteristics of discharge specific to the regime: • Consider hyporheos as receptors of concern (macrofauna and microbes)• Use multiple methods and a weight of evidence to evaluate exposure potential (discharge
locations and contaminant fluxes)• Evaluate potential for bioaccumulation and food web effects
• Specific sampling and analysis methods will depend on characteristics of contaminants andreceptors at the site (but consider seasonal variations and sample in such a way as to provideinformation relevant for the behavior of the organisms at the site)
• A critical need is to reduce uncertainty in risk conclusions: better methods are needed tolocate and quantify contaminant flux from groundwater to surface water
• Until better data is available, protective assumptions should be used to evaluate risk to naturalresources
REFERENCES
NOAA, 1997. Coastal hazardous waste site reviews, December 1997, Seattle, WA, 109 pp.Stanford, J.A. and J.V. Ward., 1993. An ecosystem perspective of alluvial rivers: connectivity and the
hyporheic corridor, Journal of the North American Benthological Society, v. 12, pp. 48-60.
Proceedings of the Ground-Water/Surface-Water Interactions Workshop July 2000
137
Triska, F.J., V.C. Kennedy, R.J. Avanzino, G.W. Zellweger, and K.E. Bencala, 1989. Retention andtransport of nutrients in a third order stream: Hyporheic processes. Ecology, v. 70, pp. 1893-1905.
U.S. EPA, 1997. Ecological Risk Assessment Guidance for Superfund: Process for Designing andConducting Ecological Risk Assessments. Interim Final, Edison, NJ, EPA 540-R-97-006.
U.S. EPA, 1992. Framework for Ecological Risk Assessment, Washington, DC, EPA/630/R-92/001.
AUTHOR INFORMATION
Mary Baker Matta and Tom Dillon, NOAA Coastal Protection and Restoration Division, Seattle,Washington.
(NOAA Hazardous Waste Site Reviews are available from John Kaperick, NOAA Office of Responseand Restoration Bin C15700 Seattle, WA 98115).
Proceedings of the Ground-Water/Surface-Water Interactions Workshop July 2000
138
Defining Groundwater Outcrops in West NeckBay, Shelter Island, New York Using DirectContact Resistivity Measurements and TransientUnderflow Measurements
By Ronald Paulsen
ABSTRACT
Mapping out groundwater discharge zones can be a formidable task due to the highly variable nature ofthe discharge zone, temporal and spatial variability of seepage rates within the zone, and complicationsfrom tidal loading. An integrated approach incorporating direct contact resistivity logging and transientseepage rate measurements was undertaken to delineate the seepage zone and monitor discharge on abay-wide scale. Conductivity values for the saturated sediments ranged from 280 S/cm in freshwaterzones to 12,800 S/cm in zones with high salinity. The discharge zone at West Neck Bay, Shelter Islandwas observed to extend to 10-75 feet offshore. The groundwater seepage within the discharge zone wasmeasured using a time transient seepage meter that was developed with ultrasonic technology. Seepagevelocities in the study area ranged from 1.27 x 10⁻³ cm/s to 3.94 x 10⁻⁵ cm/s, equivalent to a mean valueof 16 5/m2/d. Integrating over the horizontal extent of the seepage zone, the total daily discharge wasestimated to be 1.72 x 10⁶ 5/day for the north-east section of West Neck Bay. This estimate of the totaldischarge due to underflow is comparable to the recharge in the contributing area, estimated to be 1.50x 10⁶ 5/day for this section of the bay.
DIRECT CONTACT RESISTIVITY MEASUREMENTS
To characterize near-shore sediments in a simple and rapid manner, we used geophysical loggingto determine the electrical resistivity of surface sediments off-shore. Electrical measurements havebeen used for some time to characterize the lithology and hydraulic characteristics of geologicalstructures. The basic concept of resistivity logging dates back to 1927 when C.M. Schlumberger madethe first well log near Paris (Goldberg, 1997). Conductivity generally increases with increasingporosity (Gueguen and Palciauskas, 1994). Archie (1942) invoked laboratory measurement ofconductivity to infer amounts of water and hydrocarbons in the pore space. The electrical conductivityof saturated sediment is commonly analyzed in terms of the formation factor F as a function of theporosity where s is the electrical conductivity of the saturated bulk sediment, w is that of the interstitialsolution, and the Archie exponent n ~ 1-2. Archie’s law is applicable when the conductivity of theinterstitial solution is much higher than that of the sediment particles, so those surface conductionphenomena are insignificant.
At off-shore locations where groundwater discharge is negligible, resistivity measurements of thesea water and sediments saturated by water of identical salinity can be used to determine the formationfactor and infer the porosity from Archie’s law (Aller 1982). In sediments where freshening of the porespaces has occurred due to groundwater discharge, the measurements usually show a decrease ofelectrical resistivity with depth, which provides important qualitative constraints on the increase ofsalinity in the pore fluid and the depth range over which the transition from fresh to sea water occurs.
Proceedings of the Ground-Water/Surface-Water Interactions Workshop July 2000
139
Several different electrode configurations are commonly used to measure electrical resistivity. Ourproject employs a direct contact probe (Figure 1) arranged in a Wenner array, which is a non-lineararray with the potential electrodes placed close together and evenly spaced. This configurationprovides discrete measurements even if good contact is not always maintained. Electrode A and B arethe positive and negative electrodes that measure the current I, and M and N are the electrodes thatmeasure the voltage drop V (Figure 2).
Figure 1.
Tapered enhance soil
Contact Electrode B Electrode N
Electrode M Electrode A
Engineering type provides mechanical and electrical
1” (25mm) O.D. steel
Shielded cable signal
Figure 2.
The off-shore horizontal extent of the interface was delineated by direct contact resistivitymeasurements. The resistivity probe was driven manually into the bay bottom by scuba divers at six-inch increments. The unit’s string pot (that was originally designed for use with a Geoprobe percussiondrill keeps track of the depth measurement automatically and also trigger the electrical measurement)had to be modified accordingly. The string pot was mounted on a jig and manually moved along adisplacement that would coincide with the depth that the probe was being driven into the bottomsediments. Resistivity measurements were also simultaneously triggered manually. After the resistivitywas logged, the diver then drove the probe to the next six-inch level. This continued until a freshwaterzone was contacted or the probe had been driven to a maximum depth of 4 ft. The diver then moved onto the next off-shore position at a horizontal spacing of ~30 feet, and the manual probing and loggingoperations were repeated.
Cross-sectional plots as shown in Figure 3 where prepared from the field measured resistivity ofbay bottom sediments off shore. The blue (dark) areas indicate the location of fresh water outcrops off-shore and the red (light) areas indicate only saltwater is present.
DESCRIPTION OF GROUNDWATER UNDERFLOW DEVICE
In recent years ultrasonic flow meters have been developed and used to measure relatively lowflow rates in a variety of water and wastewater industries. In this study we take advantage of thisadvancement in ultrasonic technology to develop a seepage meter for continuous measurement ofsubmarine groundwater discharge.
Proceedings of the Ground-Water/Surface-Water Interactions Workshop July 2000
140
F resh / S a lt W ater In terfa ce a t W est N eck B ay :cross-sectio na l p rofile fro m electrica l lo gg in g
D IS T AN C E F R O M M E AN T ID E M AR K , ft
t
sea level
105 00
840 0
300 0160 0
e lec trica l con du c ta nce o fsea w a te r: ~ 3 3 ,0 00 µ S /cm
data co lle c tion a t h o rizon ta l s pac ingo f 2 5 ’ and de pth in te rv a l o f 0 .5 ’
120 00
120 00160 0
Figure 3.
Flow Inlet Flow Outlet
FlowIntegralTransducer
IntegralTransducer
Bi-Directional Sonic Beam Path(faster from left due to flow)
Figure 4.
A transient-time flow meter uses the effect of the flow on the travel time of an ultrasonic signal asthe bases for determining the flow rate. Figure 4 shows a cross section of the meter with the path of theflow tube sonic beam and non-intrusive transducers. A multi-pulse sonic signal is transmitted throughthe flow tube in both directions by transducers located at opposite ends. When there is no flow thesignal will arrive at each transducer at the same time. However, when there is flow in the tube theupstream flow will cause the signal to arrive ahead of the signal traveling downstream. The differencein transit times (t) between the two signals is proportional to the liquid’s flow velocity Vf. The constantof proportionality depends on the average of the upstream and downstream transit times and length Lof the tube. The specific discharge from theseepage surface q is inferred from the flowvelocity by multiplying Vf by the ratio betweenthe areas of the flow tube and the collectionfunnel.
Our seepage meter system is based on thewidely used technique of placing a funnel (24” x24”) into the seepage surface on the seabed tocapture submarine groundwater discharge (Figure 5). This seepage flow is then directed via tubingthrough the ultrasonic meter, which is connected to a data logger. The sampling frequency and durationare programmed into the logger by the investigator. This meter can resolve seepage rates on the orderof 10-6 cm/s, detect reversals in flow, and it includes a totalizer which acquires data on cumulativevolume of water passing through the meter which (when after normalized by the collection funnel area)provides the specific discharge.
CONCLUSION
This study has demonstrated the feasibility of using a methodology that integrates geophysicallogging and transient seepage measurement to map out the spatial distribution of seepage and measurethe underflow discharge in real time. Conductivity values for the saturated sediments were observed torange from 280 �S/cm in freshwater zones to 12,800 �S/cm in zones with high salinity. The dischargezone at West Neck Bay, Shelter Island was observed to extend to 10-75 feet offshore. Electrical
Proceedings of the Ground-Water/Surface-Water Interactions Workshop July 2000
141
Figure 6.
CAPTUREFUNNELANDFLOWTUBE
DATALOGGER
Figure 5.
conductivity profiles of the coastal system obtained by direct-contact resistivity logging delineates in cross-section the subsetof pore water that has been subjected to significant freshening,and in turn they provide important constraints on the geometryof the fresh/salt water interface and the mechanisms of mixing.
While the resistivity logging is very effective in identifying keyareas with pronounced seepage, continuous measurements usingthe ultrasonic seepage meter provide high-resolution data on thedischarge in real time. Relatively high seepage velocitiesranging from 1.27 x 10⁻³ cm/s to 3.94 x 10⁻⁵ cm/s (with a meanvalue equivalent to 16 "/m2/d) were measured in the study area(Figure 6). The input of underflow to the hydrological budgetwas evaluated. Integrating over the projected area of theseepage zone, the total daily discharge was estimated to be 1.72x 106 "/day for the northeast section of West Neck Bay. Thisestimate of underflow discharge is comparable to the rechargein the contributing area, estimated to be 1.50 x 106 "/day for thissection of the bay (Schubert,1998).
The techniques used for thisinvestigation were effective in definingthe spatial extent of the off shoregroundwater seepage zone and inmeasuring the flux within that zone(Shaw and Prepas, 1989). Theinvestigator working within thisdynamic and spatially variable zone areadvised to use extreme caution in theirinterpretation of any field measure-ments. Adequate numbers andreplications of groundwater seepagemeasurements need to be taken in orderto in order to address the spatialvariability of the bay bottom andchanges in near shore hydraulic gradients associated with tidal flux and precipitation.
REFERENCES
Aller, R.C., ,1982. Diffusion coefficients in near shore marine sediments, Limnol. Oceanogr., v. 27 no.3, pp. 552-556.
Archie, G.E., 1942. The electrical resistivity log as an aid in determining some reservoircharacteristics, Trans. Am. Inst. Min. Metall. Pct. Eng., v. 146, pp. 54-62.
Gueguen, Y. and V. Palciauskas, 1994. Introduction to the physics of rocks, Princeton Univ. Press,Chapter 8.
Paulsen, R.J., C.F. Smith, and T.-f. Wong, 1997. Development and evaluation of an ultrasonicgroundwater seepage meter, in Geology of Long Island and Metropolitan New York, pp. 88-97.
Proceedings of the Ground-Water/Surface-Water Interactions Workshop July 2000
142
Shaw, R.D. and E.E. Prepas, 1989. Anomalous short term influx of water into seepage meters,Limnology and Oceanography, v. 34, no. 7, pp. 1343-1351.
Shaw, R.D. and E.E. Prepas, 1990. Groundwater-lake interactions: I. Accuracy of seepage meterestimates of lake seepage, Journal of Hydrology, v. 119, pp. 105-120.
Schubert, S. E., 1998. Areas contributing groundwater to the Peconic estuary and groundwater budgetsfor North and South Forks and Shelter Island, Eastern Suffolk County, New York, U.S. GeologicalSurvey Water Resources Investigation ,97-4136.
Proceedings of the Ground-Water/Surface-Water Interactions Workshop July 2000
1The use of tradenames does not imply endorsement by the U.S. Geological Survey.
143
Influence of Stream Orientation on ContaminatedGround-Water Discharge
By Don A. Vroblesky
The discharge zones of contaminated ground water are often beneath surface-water bodies. Suchdischarge zones have been identified by using analyses of bottom-sediment gas bubbles (Vrobleskyand Lorah, 1991) and have been mapped using diffusion samplers in shallow Coastal Plain aquifers(Vroblesky and others, 1991; 1992) and in a fractured-rock aquifer (Vroblesky and others, 1996). Inthis paper, analyses of diffusion samplers buried beneath a gaining stream were used to investigate therelation between stream orientation and ground-water contaminant discharge.
Many environmental factors have the potential to influence the locations of contaminant dischargeto surface water. These factors include preferential ground-water flow from one side of the creek,channeling of contaminants by fractures or other permeability heterogeneities, or capture ofcontaminants by vegetation near the stream. The purpose of this report is to present preliminary datasuggesting that stream-channel orientation relative to the ground-water flow direction also is aninfluential factor affecting contaminant discharge from ground water to surface water.
The approach used to delineate areas of contaminated ground-water discharge to surface waterinvolved the installation of diffusion samplers in the bottom sediment of Huntington Downs Creek, inGreenville, South Carolina. The diffusion samplers consisted of 40-m5 (milliliter) glass vials enclosedin sealable polyethylene bags. Preparation, burial, recovery, and analysis of the diffusion samplers isdescribed in an earlier study (Vroblesky and others, 1996). Samplers were buried approximately 1 ft(0.3 m) deep in the creek-bottom sediment, which consisted of sand or weathered rock. The originpoint of the diffusion-sampler array in Huntington Downs Creek was a spring at the origin of the creek(Figure 1). The total length of the array was approximately 400 ft (122 m), ending at the dischargeculvert to Huntington Downs Pond. The distance between samplers in each line was approximately 10ft (3.048 m). The site identification numbers for the diffusion-sampler locations were the distance, infeet, along the creek channel downstream from the spring at the origin of the creek.
The diffusion samplers were installed in the creek bottom sediment on May 25, 1994, andrecovered on June 1, 1994. Immediately upon removal of each diffusion sampler from the bottomsediment, the outer polyethylene membrane covering the vial opening was cut open, leaving the innerpolyethylene membrane intact. A cap was screwed onto the diffusion sampler over the innerpolyethylene membrane (the polyethylene was between the glass vial and the Teflon1 septum of thecap). The samples were analyzed for volatile organic compound (VOC) content within 48 hours ofsample collection. A 50-µL vapor sample was slowly withdrawn and immediately analyzed on aPhotovac1 10S55 field gas chromatograph (GC), equipped with a capillary and a packed column. Thetotal VOC analysis was accomplished by calibrating the GC against a 10-ppm vapor standard oftrichloroethene (TCE). In this investigation, the difference between total VOC concentrations detectedin diffusion samplers and their respective replicates ranged from 5 to 21 percent.
Proceedings of the Ground-Water/Surface-Water Interactions Workshop July 2000
144
Water-level measurements from an observation well near the source of the creek and anobservation well downgradient from Huntington Downs Pond, and extrapolation of water-tablecontours based on measurements made in wells approximately 350 to 550 ft south of the creek (RustEnvironment and Infrastructure, 1995) show that ground water near the creek moves generally north tonorthwestwardly, discharging to ponds and streams (Figure 1). The water-table distribution derivedfrom these measurements is used in this investigation to show the probable dominant directions ofground-water flow in the vicinity of Huntington Downs Creek (Figure 2).
The shallow aquifer is composed of a silty clay saprolite containing relict metamorphic structuresand rock fabrics. Estimates of hydraulic conductivity in the saprolite aquifer in the study area rangefrom less than 2 ft/d (Rust Environment and Infrastructure, 1995) to about 3.2 ft/d Kubal-Furr andAssociates, 1996). The estimated rate of ground-water flow in the saprolite aquifer (average thicknessof approximately 40 ft) is about 76 ft/yr (Kubal-Furr and Associates, 1996). Steeply dipping relict
fractures and foliation planes are present in the saprolite and appear to influence the direction ofcontaminant transport (Rust Environment and Infrastructure, 1995). Based on lithologic observationsmade during an excavation of the spring in August 1994, the spring appears to be the discharge zone ofwater-bearing relict fractures in the saprolite.
Analysis of the vapor in the diffusion samplers for total VOCs showed that the concentrations, asvapor, ranged from 0.3 to 21.2 ppm relative to TCE. Analysis of the vapor in diffusion samplers from
Proceedings of the Ground-Water/Surface-Water Interactions Workshop July 2000
145
locations 21, 72, 110, 200, and 270 ft downstream from the spring, using the gas chromatographcoupled to a capillary column, indicated the presence of TCE and tetrachloroethene (PCE). A similaranalysis on the vapor in the diffusion sampler from 349 ft downstream from the spring showed nodetectable concentrations of TCE or PCE. Because the only known source for VOC contamination issouth of the creek, the TCE and PCE detected in the diffusion samplers are considered to representcontaminated ground-water discharge from the southern side of the stream.
The highest concentrations of VOCs (16.6 to 21.2 ppm) detected in the diffusion samplers beneaththe stream were found near the origin of the creek, approximately 16 ft downstream from the spring(Figure 2). The presence of a spring indicates that there is an upward hydraulic gradient from theground water into the surface water. Therefore, the relatively high concentration of total VOCs in theground water beneath the stream immediately downstream from the spring implies that contaminantdischarge to the creek involved seepage of contaminated ground water upward through the stream bedas well as movement of contaminants into the stream via the spring.
The distribution of VOC concentrations in the diffusion samplers beneath the stream showed ageneral downstream decrease in the maximum concentrations detected (Figure 2). The concentrationsof TCE and PCE in diffusion samplers also decreased downstream. Thus, the downstream decrease in
Proceedings of the Ground-Water/Surface-Water Interactions Workshop July 2000
146
maximum detected concentrations of total VOCs probably reflects a decrease in concentrations ofground-water contaminants along a flowpath away from the source. The overall distribution of VOCconcentrations in the diffusion samplers, however, showed an irregular pattern, with areas of relativelylow concentrations between areas of relatively high concentrations (Figure 2). For example, theconcentrations of total VOCs in diffusion samplers in the reach between sampling points 140 and 190were consistently less than 3 ppm; however, concentrations of total VOCs in diffusion samplersimmediately upstream and downstream from that reach were greater than 10 ppm. In fact,concentrations of total VOCs in diffusion samplers between sampling points 140 and 180 were belowthe apparent background concentration measured at location 349, implying that there was nosubstantial discharge of chlorinated VOCs to the creek in that reach. A unique feature of the creekreach between sampling points 140 and 180 is that it is oriented approximately parallel to the probabledominant direction of ground-water flow. In contrast, the creek reach encompassing sampling points50 to 90 and 200 to 250 are oriented at a sharper angle to the probable dominant direction of ground-water flow (Figure 2B). VOC concentrations in most diffusion samplers from those reaches werehigher than in the reach encompassing sampling points 140 to 180 (Figure 2A).
A variety of factors potentially affect the distribution of contaminant discharge to a stream. Not allof the factors were identified in this preliminary investigation. For example, potential influencesinclude bed-sediment heterogeneities, relict fractures, vegetation, and hyporheic zones. However, theuniformly low concentrations of total VOCs in the channel reach oriented approximately parallel to theprobable dominant direction of ground-water flow (between diffusion samplers 140 and 190)compared to adjacent reaches oriented at a sharper angle to ground-water flow, strongly suggest thatorientation of the creek exerts a major influence on contaminant discharge. Reaches of the creek thattransect the axis of the contamination plume receive greater contaminant and ground-water dischargethan the reach oriented along the axis of contaminant transport.
In conclusion, diffusion samplers placed beneath creek-bed sediments were used to detect thedistribution of VOC contamination discharging from ground water to Huntington Downs Creek, inGreenville, South Carolina. The uniformly low concentrations of total VOCs in the channel reachoriented approximately parallel to the probable dominant direction of ground-water flow, betweendiffusion samplers 140 and 190, compared to adjacent reaches oriented at a sharper angle to ground-water flow, strongly suggest that orientation of the creek is a major influence on contaminantdischarge. Reaches of the creek that transect the axis of the contamination plume appear to receivegreater contaminant discharge than a reach oriented along the axis of contaminant transport. These dataimply that site investigators attempting to locate zones of ground-water contaminant discharge tosurface water in meandering streams should put particular emphasis on reaches transecting thedominant direction of contaminated-ground-water transport.
REFERENCES
Kuball-Furr and Associates, 1996. 1995 Annual ground-water monitoring report, Consultants report toGeneral Electric Company, Greenville, South Carolina, 35 pp.
Rust Environment and Infrastructure, 1993. Analyses of surface water samples from the North End,October 12, 1993 through April 6, 1994, Consultant's data reported to the General ElectricCompany, Greenville, South Carolina.
Rust Environment and Infrastructure, 1994. Data from the April 1, 1994 sampling of the North End,Consultant's data reported to the General Electric Company, Greenville, South Carolina.
Rust Environment and Infrastructure, 1995. North end off-site area environmental investigation report,Consultant's report to the General Electric Company, March 1995, 25 pp.
Proceedings of the Ground-Water/Surface-Water Interactions Workshop July 2000
147
Vroblesky, D.A. and M.M. Lorah, 1991. Prospecting for zones of contaminated ground-waterdischarge to streams using bottom-sediment gas bubbles, Ground Water, v. 29, no. 3, pp. 333-340.
Vroblesky, D.A., M.M. Lorah, and S.P. Trimble, 1991. Mapping zones of contaminated ground-waterdischarge using creek-bottom- sediment vapor samplers, Aberdeen Proving Ground, Maryland,Ground Water, v. 29, no. 1, pp. 7-12.
Vroblesky, D.A., J.F. Robertson, Mario Fernandez, and C.M. Aelion, 1992. The permeable-membranemethod of passive soil-gas collection, in Proceedings of the Sixth National Outdoor ActionConference: National Water Well Assoc., May 5-13, 1992, Las Vegas, NV, pp. 3-16.
Vroblesky, D.A., L.C. Rhodes, J.F. Robertson, and J.A. Harrigan, 1996. Locating VOC contaminationin a fractured-rock aquifer at the ground-water/surface-water interface using passive vaporcollectors:, Ground Water, v. 34, no. 2, pp. 223-230.
AUTHOR INFORMATION
Don A. Vroblesky, U.S. Geological Survey, Columbia, S.C.
Proceedings of the Ground-Water/Surface-Water Interactions Workshop July 2000
148
Factors Controlling Hyporheic Exchange in aSouthern Ontario Stream: Modeling Riffle-ScalePatterns in Three Dimensions Using MODFLOW
By R.G. Storey, D.D. Williams, and K.W.F. Howard
INTRODUCTION
The general pattern of exchange flow between stream surface waters and their hyporheic zones(Fig.1) has been observed in numerous field situations (e.g., Valett, et al., 1994), and in laboratoryflume studies (e.g., Thibodeaux and Boyle, 1987). These latter studies have shown that thedownwelling/upwelling sequence is produced by a rise in hydraulic head of the surface water as it risesover the surface of a riffle, and a rapid drop in head as surface water flows down the downstream slopeof the riffle. Thus from a surface water point of view, the forces controlling the riffle-scale pattern ofexchange flow have been adequately explained.
However, in the field situation hyporheic zones are subject not only to the forces applied bysurface waters, but also to hydraulic gradients associated with the underlying aquifer. Stream reachesare rarely hydraulically neutral, but either receive net ground water inflow or export water to the
aquifer. How then do riffle-scale exchange flows persist without being overwhelmed by net groundwater movements?
The aims of this study were first to determine the local geological and hydrogeological conditionsnecessary to produce riffle-scale exchange flows within a given regional hydrogeological environment.
Proceedings of the Ground-Water/Surface-Water Interactions Workshop July 2000
149
A secondary aim was to determine how hyporheic exchange flows would be affected by naturalchanges or artificial disruptions to aspects of the aquifer, stream flow or stream bed.
METHODS
The Speed River, in Southwestern Ontario, is a low-gradient stream, approximately 6 m wide and0.15-0.35 m deep at the study site. The primary aquifer, a dolomite bedrock, is overlain by 20 m of lowpermeability glacial kame deposits. The stream itself lies in a bed of modern alluvium 1-1.5 m deep,and extending 30-40 m wide on each side of the stream, which has a very high permeability.
An area of the river catchment, 1,000 m x 500 m, was modeled using MODFLOW (USGS), athree-dimensional finite difference ground water flow model. The two lateral boundaries of the modelwere defined by the Speed River catchment boundaries, and the upper and lower boundaries followedground water flowlines. The model focused on a single riffle of the stream, a 10 m long section.Stream stage was defined by constant head boundaries in the top layer of the model, with a rise and fallof a few cm over the length of the riffle site.
RESULTS AND DISCUSSION
Initially the model was run without inserting the high conductivity alluvial deposits. In these runshyporheic flows everywhere were upwelling, and towards the stream laterally, even when aquiferheads were low in summer.
When the zone of high permeability, representing alluvial deposits, was inserted around the stream,flow patterns changed dramatically. Hydraulic gradients within the near-stream zone became very low(<1 cm per m) and small differences of <3 cm in surface hydraulic head between upstream anddownstream ends of the riffle produced downwelling and lateral exchange flows in the subsurface.This occurred even though hydraulic gradients in the material surrounding the alluvium were stronglytowards the stream.
These results show that in a low gradient stream system with strong hydraulic gradients from thecatchment towards the stream, exchange flows can still occur in a zone of high- permeability alluvium.The essential feature of this alluvium was that it lowered hydraulic gradients within the hyporheic zoneto within the range of variation shown by the stream surface heads as they flowed between pools andriffles. Thus these variations were able to alter flow paths up to 1.5 m deep in the stream bed.
In reducing the vertical hydraulic gradient, the alluvium changed the dominant hydraulic gradientbeneath the stream bed from almost vertical to almost horizontal. This meant that flows within thealluvium were driven by hydraulic heads downstream rather than by those in the underlying aquiferand surrounding catchment. The large flux of water flowing downstream within the alluvial sedimentswas able to supply or withdraw sufficient water to support lateral and vertical exchange flows betweenthe stream and alluvial sediments, independently of hydraulic heads beneath and to the sides of thealluvium.
Sensitivity of exchange flows to changes in system conditions
In this simulation, the highly permeable alluvial sediments allowed exchange flows in thehyporheic zone to operate somewhat independently of the heads in the aquifer. Thus exchange flowswere relatively insensitive to changes in aquifer heads; however field data showed that a large increase
Proceedings of the Ground-Water/Surface-Water Interactions Workshop July 2000
150
of several meters in aquifer heads from summer to fall did result in loss of exchange flows. Exchangeflows are sensitive, however, to a decrease in permeability of the alluvium, as may result from siltationof the river bed.
Importance of alluvial sediments to exchange flows in other stream systems
Do all streams that receive net input of ground water from their catchments, require a zone of highconductivity alluvium in order for exchange flows to occur? This depends on the steepness of thestream, which determines the hydraulic gradient between upstream and downstream ends of a riffle,and the hydraulic gradient in the aquifer. In a steeper stream, or one with weaker hydraulic gradientsbetween aquifer and stream, exchange flows can occur in less permeable near- stream sediments.
CONCLUSIONS
Modeling on a small scale has shown that surface water head differences of a few centimetersbetween riffles and pools can produce exchange flows within permeable alluvial sediments, despite netdischarge of ground water to the stream. This model reveals local interactions between surface waterand ground water which would not be predicted by larger scale models, but which have importantchemical and biological consequences for the stream and ground water systems.
REFERENCES
Thibodeaux, L.J. and J.D. Boyle, 1987. Bedform-generated convective transport in bottom sediment,Nature, v. 325, pp. 341-343.
Valett, H.M., Fisher, S.G., Grimm, N.B., and P. Camill, 1994. Vertical hydrologic exchange andecological stability of a desert stream ecosystem, Ecology, v. 75, pp. 548-560.
AUTHOR INFORMATION
R.G. Storey and D.D. Williams, Division of Life Sciences, University of Toronto at Scarborough, 1265Military Trail, Scarborough Ontario, M1C 1A4, Canada.
K.W.F. Howard, Division of Physical Sciences, University of Toronto at Scarborough, 1265 MilitaryTrail, Scarborough Ontario, M1C 1A4, Canada.
Proceedings of the Ground-Water/Surface-Water Interactions Workshop July 2000
151
Solute and Solid Phase Relationships in theSurface Hyporheic Zone of a Metal ContaminatedStream, Silver Bow Creek, MT
By Johnnie N. Moore and William W. Woessner
INTRODUCTION
Transformations occurring within the hyporheic zone impact the chemistry of both the overlyingsurface waters and the underlying ground water systems. The hyporheic zone is a key ecological nichecrucial to the health of stream biota, as well as a major site of exchange, metabolism, and storage ofparticulates and solutes in rivers. There is, therefore, a critical need to understand the nature of thegeochemistry that governs the transformation of materials through the hyporheic zone, especiallymetals and metalloids that are toxic to aquatic organisms utilizing the hyporheic zone.
The complexities of the substrate in most streams/rivers make determining the relationshipsbetween solute and solid phases difficult. To address this issue we have used ceramic beads as anartificial substrate to examine what solid phases are in equilibrium within the shallow hyporheic zone.Combined with “mini-tube wells,” this inexpensive and rapid method can be used to examine soluteand solid phase components in essentially any stream/river.
Site Conditions
Silver Bow Creek , at the headwaters of the Clark Fork River, has received contaminated surfacewater and sediments from the Butte gold, silver and base metal mining and processing region for overa century (Moore and Luoma, 1991). Over 100 million tons of tailings and mining wastes werereleased into Silver Bow Creek, a portion of which were deposited at the Miles Crossing Research Sitelocated 18 Km down stream (Figure 1).
At the Miles Crossing Site, Silver Bow Creek has an average discharge of 850 L/s. Its water is nearneutral, high in dissolved oxygen and relative low in dissolved metals (Table 1). The fluvial plan iscovered with up to 2 m of metal rich mine tailings highly elevated in arsenic, cadmium, copper, iron,lead, manganese and zinc.
Groundwater flow is generally in the direction of the sloping fluvial plain (Woessner, 1998; Smart,1995; Shay, 1997) (Figure 1). Groundwater within the fluvial plan is acidic and contaminated (Table1). On the large scale, groundwater exchange with the creek occurs as the stream stage falls below thefluvial plain water table. In the study area reaches of flow through channel (Site 1 and 3) and zeroexchange (parallel flow)(Site 2) were observed.
Proceedings of the Ground-Water/Surface-Water Interactions Workshop July 2000
Figure 1. Location map of the Miles Crossing Research Site including Silver Bow Creekand the associated fluvial plain (zone of stream deposited higher hydraulic conductivitysediments. Groundwater flow is parallel to the fluvial plain and down valley. Bed tubesand mini tube wells were installed in three portions of the stream bed, Sites 1, 2 and 3.
Definition of the Hyporheic Zone
The hyporheic zone is generally defined as the saturated zone beneath and associated with thestream channel that shares some biological, chemical or physical characteristics with the surface waterWilliams, Triska, et al., 1989; Valett, et al., 1990; Hendricks and White, 1991; Valett, 1993). Our workuses geochemistry to define this transition zone between 100 % surface water and 100% groundwater.We further focus part of our effort on the “surface” hyporheic zone defined as the transition zonewithin 30 cm of the streambed at our site. Benner (1995) and Benner, et al. (1995) described ageochemical transition zone extending to a depth of one or more meters at Site 1. Nagorski (1997)continued work at the Site 1 and two additional sites focusing her effort on conditions within 30 cm ofthe streambed.
Proceedings of the Ground-Water/Surface-Water Interactions Workshop July 2000
153
Table 1.
Water Quality Silver Bow Creek(Nagorski, 1997)
Fluvial PlainGroundwater (Benner,
1995; Shay, 1997)Constituent Std. Units and mg/5 Std. Units and mg/5
Bead tube samplers are 40-175 cm long polycarbonate tubing (1cm OD, 0.6 cm ID) slotted with a1 mm width ban sawed on two sides at 3 mm intervals were filled with aluminosilicate beads (2 mmaverage diameter). Plastic dividers were inserted into the columns at 10-cm intervals to minimizevertical migration of water in the samplers. Completed bead tubes were then acid cleaned in 20%reagent grade HCl for two hours and rinsed repeatedly with sterilized deionized water until a pH of 5was reached.
Bead tube samplers were inserted into the bed by driving a dual tube steel rod into the streamsediments, removing the center solid rod, inserting the bead tube and then removing the outer steeltube. Sediments were allowed to collapse around the sampler. The tubes were installed so that about 10cm of the sampler extended above the stream bed. Bead tubes were retrieved after 42 to 52 days.
Retrieved tubes were rinsed in the field to remove excess sediment, labeled, photographed,wrapped in plastic and stored. In the laboratory, columns were oven dried at 70 C and sectioned into 4to 7 segments, depending on the amount of visible coating. Approximately one gram of beads wereplaced in an acid-washed centrifuge tube to which 10 m5 of 40% metal-grade HCl was added. Thesample was shaken for 1 hour and centrifuged for 10 minutes. Solutions were analyzed for majormetals using ICAPES using standard procedures.
Proceedings of the Ground-Water/Surface-Water Interactions Workshop July 2000
154
“Mini Tube Wells”
Small diameter tube wells were constructed using 0.95 cm diameter polyethylene with 5 cm of thetip slotted and covered with a nylon mesh screen. These groundwater sampling devices were installedas single instruments or nests using the same driven dual tube method used to install the bead tubes.
These small diameter tubes were sampled using a 60 cc acid-washed syringe after purging at leaseone tube volume and one syringe volume. Tubes were then tightly capped to keep them full of bedwater. The syringe-collected samples were pushed through a 0.45 um acid-washed filter and into twoacid washed sample bottle. Bed water samples for cation analyses were preserved with trace metalgrade HNO3 and samples for anion analyses were untreated. Samples were placed on ice and returnedto the lab for standard IC and ICAPES analyses. DO, pH, specific conductance and alkalinity weredetermined in the field.
RESULTS
At Site 1, surface water is alkaline, oxygenated and contains relatively high concentrations ofnitrate and low concentrations of sulfate; ground water is acid and has low concentrations of oxygen,and high sulfate. The bead tube data allows for a higher resolution of the complexities of the hyporheiczone (transition zone) than tube wells as interfaces can be resolved by examining the continuous beadtube. Iron is a major control due to the precipitation of Fe-oxyhydroxides at the interfaces between thesurface water and ground water with the hyporheic zone. Solute Fe concentrations are relatively low inthe surface water and hyporheic zone water, with a concomitant elevation in the solid phase Fe on thebeads. Two sets of bead tube sections show that Fe precipitates at the surface water-hyporheic zoneboundary and at the ground water-hyporheic zone boundary. High values of solid phase Fe seen in thesurface water beads resulted from fine sediment particles attached to the bead surfaces, not from Fe-oxyhydroxides precipitates.
Certain elements (As, Cu, Mo, P, Pb, Sr) are strongly related to Fe precipitation, but others areoffset (e.g., Mn and Zn). Surface water and ground water contain relatively low concentrations of Asand Fe, however, the surface hyporheic zone has elevated concentrations of As and Fe. We believethese elevated concentrations result from the dissolution of Fe-oxyhydroxides that contain As at the pHand dissolved oxygen levels found only in the surface hyporheic zone. At some sampling points Feprecipitates were either absent of showed a complex interfingering.
CONCLUSIONS
Bead tubes and tube wells provided detailed geochemical data in the near surface hyporheic zone(30 cm). The presence of iron hydroxides and co precipitating As and metals was observed andquantified. The bead tubes provided continuous sampling of the hyporheic zone and were useful inestablishing the presence of geochemical interfaces. These instruments are best suited for sampling ofgroundwater and surface water systems with geochemical contrasts.
We can identify relationships at the 1-2 cm scale in the solid phase and at the 10 cm scale in thesolute phase using these methods. We think that improvements in resolution could be obtained byconstructing bead samplers with smaller beads and using high-resolution “peepers” (dialysis membranesamplers) for solute sampling. This modification should resolve changes within the hyporheic zone atthe cm or possibly the sub-cm scale. However, the use of peepers would increase the cost and
Proceedings of the Ground-Water/Surface-Water Interactions Workshop July 2000
155
complexity of the technique. For many problems the method we present should offer a rapid andrelatively easy technique to examine the fine scale relationships within the hyporheic zone.
REFERENCES
Benner, S.G., 1995. Geochemical processes in a transition zone between surface water and acidic,metal-rich groundwater. M.S. Thesis, Univ. of Montana, Dept. of Geology, Missoula, 71 pp.
Benner, S.G., Moore, J.N., and E. Smart, 1995. Geochemical processes in a transitions zone betweensurface water and acidic, metal-rich groundwater. ES&T, v. 29, pp. 1789-1795.
Moore, J.N. and Luoma, S.N., 1991. Hazardous wastes from large-scale metal extraction. ES&T, 24,pp. 1279-1284.
Hendricks, S.P. and D.S. White, 1991. Physiochemical patterns within a hyporheic zone of a northernMichigan river, with comments on surface water patterns. Can. J. Fish. Aquat. Sci., v. 48, pp.1645-1654.
Nagorski, S.A., 1997. Impacts by acidic, metals-rich groundwater on the hyporheic zone of anintermontane stream. M.S. Thesis, Univ. of Montana, Dept. of Geology, Missoula, 137 pp.
Shay, D.T., 1997. An Investigation of the hydrogeology and geochemistry of a floodplain aquifersystem impacted by mine tailings, Silver Bow Creek, Montana. M.S. Thesis, University ofMontana, Dept. of Geology, Missoula, 147 pp.
Smart, E.W., 1995. Surface water and groundwater interaction in a shallow unconfined alluvial aquiferand small mountain stream Silver Bow Creek, Montana. M.S. Thesis, University of Montana,Dept. of Geology, Missoula, 170 pp.
Triska, F.J., Kennedy, V.C., Avanzino, R.J., Zellweger, G.W., and K.E. Bencala, 1989. Retention andtransport of nutrients in a third-order stream in northwestern California: hyporheic processes.Ecology, v. 70, pp. 1893-1905.
Valett, H.M., 1993. Surface-hyporheic interactions in a Sonoran Desert stream: Hydrologic exchangeand diel periodicity. Hydrobio., v. 259, pp. 133-144.
Valett, H. M., Fisher, S. G. and E.H. Stanley, 1990. Physical and chemical characteristics of thehyporheic zone of a Sonoran Desert stream. J. N. Am. Benthol. Soc., v. 9, no. 3, pp. 201-205.
Williams, D.D. and H.B.N. Hynes, 1974. The occurrence of benthos deep in the substratum of astream. Freshwat. Biol., v. 4, pp. 233-256.
Woessner, W.W., 1998. Changing views of stream-groundwater interaction. Eds. J. Van Brahana, U.Eckstein, L. K. Ongley, R. Schneider and J. E. Moore. Proceedings of the Joint Meeting of theXXVIII Congress of the International Association of Hydrogeologists and the Annual Meeting ofthe American Institute of Hydrology: Gambling With Groundwater, Las Vegas, Nevada, Sept. 28-October 2, 1998, AIH, St. Paul, MN., p. 1-6.
AUTHOR INFORMATION
Johnnie N. Moore and William W. Woessner, Department of Geology, University of Montana,Missoula, MT 59801.
Proceedings of the Ground-Water/Surface-Water Interactions Workshop July 2000
156
APPENDICES
Proceedings of the Ground-Water/Surface-Water Interactions Workshop July 2000
157
Appendix A: Workshop Participants List
Tom AaltoU.S. EPA, Region 8999 18th St.Mail Code: 8P2-HWDenver, CO 80202-2413Phone: (303) 312-6949Fax: (303) [email protected]
James BartolinoU.S. Geological Survey4501 Indian School Rd., Ste 200Albuquerque, NM 87110-3929Phone: (505) 262-5336Fax: (505) 262-5398 [email protected]
Katherine BaylorU.S. EPA, Region 9RCRA Corrective Action Office75 Hawthorne St.Mail Code: WST-5San Francisco, CA 94105Phone: (415) 744-2028Fax: (415) [email protected]
Ned BlackU.S. EPA, Region 975 Hawthorne St.Mail Code: SFD-8BSan Francisco, CA 94105Phone: (415) 744-2354Fax: (415) [email protected]
Randy BreedenU.S. EPA, Region 8999 18th St., Suite 500 Mail Code: 8P2-HWDenver, CO 80202-2466Phone: (303) 312-6522
David BurrisAir Force Research Laboratory139 Barnes Dr.Mail Code: AFRL/MLQRTyndall AFB, FL 32403Phone: (850) 283-6035Fax: (850) [email protected]
Allen BurtonWright State UniversityInst. for Environmental Quality3640 Colonel Glenn Hwy. Dayton, OH 45435-0001Phone: (937) 775-2201Fax: (937) [email protected]
Judy CanovaSouth Carolina Dept. of Environ-mental Health and Conservation2600 Bull St. Columbia, SC 29201Phone: (803) 896-4046Fax: (803) [email protected]
Lisa CapronU.S. EPA , Region 577 W. Jackson Blvd.Mail Code: DE-9JChicago, IL 60604-3507Phone: (312) 886-0878Fax: (312) [email protected]
David ChartersU.S. EPA, EnvironmentalResponse Team
Jungyill ChoiU.S. Geological Survey430 National Center12201 Sunrise Valley Dr. Mail Code: MS-431Reston, VA 20192Phone: (703) 648-5472Fax: (703) [email protected]
Chad GubalaUniversity of Toronto The Scientific AssessmentTechnologies Laboratory3359 Mississauga Rd. North Mississauga, Ontario, Canada L5L 1C6Phone: (905) 828-3863Fax: (905) [email protected]
Jack GuswaHSI GeoTrans6 Lancaster County Rd. Harvard, MA 01451Phone: (918) 772-7557Fax: (918) [email protected]
Mark HartlePennsylvania Fish and BoatCommission, Division ofEnvironmental Services450 Robinson Ln. Bellefonte, PA 16823Phone: (814) 359-5116Fax: (814) [email protected]
S.M. HarrisonWyoming State Department ofHealthHathaway Bldg.Cheyenne, WY 82002Phone: (307) [email protected]
Proceedings of the Ground-Water/Surface-Water Interactions Workshop July 2000
159
Judson HarveyU.S. Geological Survey12201 Sunrise Valley Dr.Mail Code: MS 430Reston, VA 20192Phone: (703) 648-5876Fax: (703) [email protected]
Susan HendricksMurray State University206 Hancock Biological StationMurray, KY 42071Phone: (502) 474-2272Fax: (502) [email protected]
James HuckinsU.S. Geological Survey4200 New Haven Rd.Columbia, MO 65201Phone: (573) 875-5399, [email protected]
Richard JackWyoming Department ofEnvironmental Quality, SolidWaste Permitting and CorrectiveAction, Solid and HazardousWaste Division250 Lincoln St.Lander, WY 82520Phone: (307) [email protected]
Jeff JohnsonU.S. EPA, Region 7726 Minnesota Ave.Mail Code: ARTD/RCAPKansas City, KS 66101Phone: (913) 551-7849Fax: (913) [email protected]
Briant KimballU.S. Geological Survey1745 W. 1700 S., Rm. 1016Salt Lake City, UT 84104Phone: (801) 975-3384Fax: (801) [email protected]
David LeeAtomic Energy of Canada, Ltd.Environmental Research BranchMail Code: 51AChalk River, Ontario K0J1P0Phone: (613) 584-8811, x 4710Fax: (613) [email protected]
John LendvayUniversity of Michigan219 EWRE BuildingEnvironmental Engineering1351 Beal Ave.Ann Arbor, MI 48109-2125Phone: (734) 764-6350Fax: (734) [email protected]
Vince MalottU.S. EPA, Region 61445 Ross Ave.Mail Code: 6SF-APDallas, TX 75202Phone: (214) 665-8313Fax: (214) [email protected]
Mary MattaNational Oceanic andAtmospheric Administration7600 Sand Point Way, NEMail Code: Bin C15700Seattle, WA 98115Phone: (206) 526-6315Fax: (206) [email protected]
Gayle MillerWyoming Department of Health2300 Capitol Ave., Rm. 427Cheyenne, WY 82002Phone: (307) 777-5596Fax: (307) [email protected]
Scott MillerWyoming Department ofEnvironmental Quality, SolidWaste Permitting and CorrectiveAction, Solid and HazardousWaste Division250 Lincoln St.Lander, WY 82520Phone: (307) [email protected]
Johnnie MooreUniversity of MontanaDepartment of GeologyMissoula, MT 59812-1019Phone: (406) 243-6807Fax: (406) [email protected]
Proceedings of the Ground-Water/Surface-Water Interactions Workshop July 2000
160
Mike MontoyaUte and Ouray Indian ReservationP.O. Box 190Fort Duchesne, UT 84066Phone: (435) 722-0885Fax: (435) [email protected]
Rich MuzaU.S. EPA, Region 8999 18th St., Suite 500Mail Code: 8EPR-EPDenver, CO 80202-2466Phone: (303) 312-6595Fax: (303) [email protected]
Paul S. OsborneU.S. EPA, Region 8999 18th St., Suite 500Mail Code: 8P-W-GWDenver, CO 80202-2466Phone: (303) [email protected]
Ronald PaulsenCornell University/SuffolkCounty Health Services3059 Sound Ave.Riverhead, NY 11901Phone: (516) 727-3910Fax: (516) 369-5944
Dave PetrovskiU.S. EPA, Region 577 W. Jackson Blvd. Chicago, IL 60604Phone: (312) 886-0997Fax: (312) [email protected]
Alan PolonskyDenver Department ofEnvironmental Health
1391 Speer Blvd., Suite 700Denver, CO 80204Phone: (303) 285-4060Fax: (303) [email protected]
Lisa RosmanNational Oceanic andAtmospheric Administration290 Broadway, Rm. 1831New York, NY 10007Phone: (212) 637-3259Fax: (212) [email protected] &[email protected]
Stephen SchmellingU.S. EPA, Robert S. KerrEnvironmental Research CenterAda, OK 74821-1198Phone: (580) [email protected]
Henry SchuverU.S. EPA1200 Pennsylvania Avenue, NWMail Code: 5303WWashington, DC 20460Phone: (703) 308-8656Fax: (703) [email protected]
Debbie ShererU.S. EPA, Region 8999 18th St., Suite 500Mail Code: 8P-HWDenver, CO 80202-2466Phone: (303) [email protected]
Christopher SmithCornell Cooperative Extension3059 Sound Ave.Riverhead, NY 11901
Ernie WatermanU.S. EPA, Region 11 Congress St., Suite 1100Mail Code: HBTBoston, MA 02114-2023Phone: (617) 918-1369Fax: (617) [email protected]
Lynn WellmanU.S. EPA, Region 461 Forsyth St.Atlanta, GA 30303-3415Phone: (404) 562-8647Fax: (404) [email protected]
Steve WhartonU.S. EPA, Region 7726 Minnesota Ave.Mail Code: SUPR/FFSKansas City, KS 66101Phone: (913) [email protected]
Richard WilleyU.S. EPA, Region 11 Congress St., Suite 1100Mail Code: HBSBoston, MA 02114-2023Phone: (617) 918-1266Fax: (617) [email protected]
Dudley WilliamsUniversity of TorontoSurface and GroundwaterEcology Research Group,Division of Life Sciences1265 Military TrailScarborough, Ontario, Canada Phone: (416) 287-7423Fax: (416) [email protected]
Tom WinterU.S. Geological SurveyDenver Federal CenterBox 25046Mail Code: MS 413Denver, CO 80225-0046Phone: (303) [email protected]
Kay WischkaemperU.S. EPA, Region 461 Forsyth St.Mail Code: OTSAtlanta, GA 30303-3415Phone: (404) 562-8641Fax: (404) [email protected]
Carol Witt-SmithU.S. EPA, Region 577 W. Jackson BlvdMail Code: DW-8JChicago, IL 60604Phone (312) [email protected]
William WoessnerUniversity of Montana Department of GeologyMissoula, MT 59812Phone: (406) 243-2341Fax: (406) [email protected]
Proceedings of the Ground-Water/Surface-Water Interactions Workshop July 2000
162
Appendix B: Discussion Group Focus Issues
A. Hydrogeologic Data Collection
1. What data are needed to estimate or document temporal changes in ground-water discharges tovarious surface water bodies? When and at what frequency should the data be collected?
2. How do the methods of measuring ground-water discharge to surface water depend onhydrogeologic setting and surface water regime?
3. What are the best methods of measuring ground-water discharges to various surface water bodies?
a. How should measurements be made?b. Where should measurement be made?c. Over what area should measurements be made?d. When should measurements be made?
4. How do we determine the relative proportion of contaminated ground-water flux as a proportion ofthe total ground-water flux and/or mass balance for a given area?
B. Chemical Data Collection
1. What are the relevant chemical processes?
2. How should chemical concentrations be measured when determining the flux of contaminatedground water to a surface water body?
a. Where should the measurements be taken?b. How should samples be obtained?c. Over what area should measurements be taken?d. Over what time period and at what frequency should samples be taken?
3. What are the data quality objectives needed to support an ecological impacts assessment? What are
the proper methods of collecting water and sediment samples to determine ecological impacts?What is the role of moisture and organic carbon data?
4. How should samples be collected to determine contaminant retention in the biologically active
zone? 5. How should contaminant retention be evaluated in the hyporheic zone and bottom sediments?
Proceedings of the Ground-Water/Surface-Water Interactions Workshop July 2000
* Asterisks represent priority issues for the biology discussion group.
163
C. Biological Data Collection
1. Is the hyporheic zone considered an ecological habitat to be protected or a “treatment opportunity”zone for restoration of contaminated ground water discharging into surface water?
a. How can the hyporheic zone be defined biologically? *
b. What are the ecological endpoints in the discharge or hyporheic zones? What ecosystemfunctions occur in these zones? *
c. What are the appropriate scales to measure adverse effects to ecological endpoints in riverine,estuarine, and lacustrine hyporheic systems? *
d. What modifications to existing Guidance or creation of new Guidance are needed to accountfor the unique ecological and hydrological aspects (receptors, functions, and routes ofexposure) of the hyporheic zone? *
2. What is the appropriate biological information (data) needed to assess ecological impacts?
a. What should be the structure for evaluating adverse impacts to key ecological endpoints?
(1) What biological monitoring should be performed? Which ecological structures andfunctions should be evaluated and why? *
(2) Should it be phased and if so how should priorities be set for the data gathering?
b. How can screening numbers be developed for the hyporheic zone that are protective ofecological endpoints of concern? Are AWQC and NOAA Sediment Effects Criteria (ER-L andER-M data) sufficient as screening numbers for protection of ecological endpoints; or, shouldother levels be used or developed for hyporheic zone screening for protection of ecologicalendpoints?
3. How should physical biological data be collected?
a. What are the best sampling methods to characterize the biological endpoints and then measurethese for unacceptable impacts? Under what circumstances should filtered or unfiltered watersamples (groundwater and surface water) be taken for environmental purposes? *
b. What sampling locations are appropriate for biological data collection?
c. When should interstitial water samples from sediment (using semi-permeable membranedevices or other techniques) or whole sediment samples be collected for environmentalpurposes? Is there a role for sediment elutriate to be sampled?
Proceedings of the Ground-Water/Surface-Water Interactions Workshop July 2000
164
4. Which ecological endpoints are at risk within the ground water/surface water mixing zone fordifferent surface water regimes?
D. Monitoring Goals and Objectives
1. Identify and characterize zones of interest associated with surface water bodies susceptible toimpact by contaminated groundwater.
2. Determine if discharge of contaminated groundwater is impacting surface water quality or biota inthe zones of interest.
a. Characterize existing impacts.b. Evaluate the effect of contaminant loading (including seasonal and temporal variations) on
water quality and ecology.c. Absent current impact on water quality, determine if long-term contaminant loading within a
discharge zone poses a threat to future surface water quality and/or biota.
3. Determine the impact that different hydrogeologic settings and surface water regimes have on theselection of monitoring methods.
4. Identify prescriptive standards that must be attained.
a. Evaluate the applicability of applicability of a ‘mixing zone’ to the surface water bodyb. Establish regulatory-based (chemical) and/or biota-based compliance standards.
5. Determine the sources of impacts.
Proceedings of the Ground-Water/Surface-Water Interactions Workshop July 2000
165
Appendix C: Case Study Summaries
Workshop participants submitted 14 case study summaries of ground water/surface waterinvestigations for inclusion in this report. The purpose of providing these summaries is two-fold. First,to provide a resource for further information on the various monitoring methods. The case studysummaries represent a range of contaminated media and contaminants within different hydrogeologiclandscapes. Contact names are provided for further information on the use of such monitoring methodsand their utility in obtaining the desired site data. The case studies are also provided as part of aninformal assessment of what techniques are and are not commonly used. The following four tablesprovide this assessment.
Table 1 lists the case study sites and the main contaminant types present as well as the type ofmonitoring done at each site (physical, geochemical, or biological). Tables 2, 3, and 4 expand on thetype of physical, geochemical, and biological monitoring being done, to summarize in some detail thetype and number of sites using a given monitoring procedure. The tables include a total for the types ofmethods used and the number of total different places all the methods have been used at. They showthat physical and geochemical methods are about equally distributed in use, but bioassays (and relatedbiological monitoring) are much less widely used at the sites.
This appendix is not meant to be a comprehensive list of sites having ground water/surface waterinteraction and contamination problems, but simply a tabulation of the types of sites which wererepresented through those attending the Workshop, and also a listing of the types of methods whichhave been used in the field when dealing with this type of complex ground water/surface waterinteraction and contamination sites. It is interesting to note that while the most used monitoringmethods are wells and piezometers, that there are many other monitoring options that have been usedat sites where there is a ground water to surface water transition zone.
Proceedings of the Ground-Water/Surface-Water Interactions Workshop July 2000
166
Table 1GW/SW Case Studies Summary:
Contaminants Studied and Monitoring Methods UsedContaminants Monitored Monitoring Methods
Site Name Eco
Ris
k
VO
Cs
NO
3
Met
als
PA
Hs
PCB
s
Pes
ticid
es o
rH
erbi
cide
s
Phy
sica
l
Geo
chem
ical
Bio
assa
y
Alcoa/Lavaca Bay � � � � �
Angus, Ontario � � � �
Everglades NationalPark
� � � � � �
Hertel Landfill � � � � � �
I-85 Manufacturing � � �
BMI Complex ? � �
Ledbetter Cr. � � � � � �
Peconic Estuary � � � � � � �
Pinal Creek � � � �
St. Joseph � � � � �
Union Pacific � � � � � �
Wyckoff Eagle Harbor � � � � � � �
Proceedings of the Ground-Water/Surface-Water Interactions Workshop July 2000
167
Table 2Case Studies Summary of Data Collection Techniques Used
Data Collection Techniques Total Site Names
Current meters 2 Everglades National ParkPinal Creek
Diffusion sampler 1 I-85 Manufacturing
Direct Push Samples 2 I-85 ManufacturingWyckoff Eagle Harbor
10) COMMENTS: Contributions of contaminated groundwater appear to be responsible for maintaining Hg and PAHconcentrations in surficial bay sediment above risk based levels of concern. Also, this appears to be thecase for maintaining tissue concentration at levels of concern. The remedy (CERCLA) is expected tocurtail the GW release, remove some sediment and stabilize sources.
Proceedings of the Ground-Water/Surface-Water Interactions Workshop July 2000
173
1) SITE NAME: Angus Ontario
2) City/State: Angus, Ontario, Canada
5) Surface Water Body: Pine River
8)Contaminants:
Ground Water
3) Regulatory Authority: Ontario Ministry ofEnvironment and Energy
6) Range of Tidal Variation:
Not applicable
Chlorinated VOC-tetrachloroethylene
Soil
4) Contact:
Brewster Conant Jr.HydrogeologistDepartment of Earth SciencesUniversity of WaterlooWaterloo, Ontario N2L 3G1Phone: 519-885-1211 x [email protected]
Dr. John A. CherryProfessor of Earth SciencesUniversity of WaterlooWaterloo, Ontario N2L 3G1Phone: 519-885-1211 [email protected]
7) Risk:Human HealthDrinking water (groundwater)Sediment contact
tetrachloroethylene
Surface Water
Rare detections of very lowtetrachloroethylene concentrations
Drivepoint wells, mini-piezometers,Waterloo Profiler and mini-profiler,multilevel GW samplingdevices, soil cores (on and offshore), ground penetratingradar (GPR), time domainreflectometry (TDR),sediment probe (conductance),streambed temperature surveys,water level surveys,potentiomanometer
Geochemical Parameters
Field parameters, dissolvedoxygen, sulfide, cations/anions,ammonia,dissolved organic carbon,chlorinated VOCs (PCE, TCE,DCEs, and VC), ethene,ethane, methane
Bioassays
None
Proceedings of the Ground-Water/Surface-Water Interactions Workshop July 2000
174
10) COMMENTS: Data collected primarily as part of Mr. Conant’s PhD research. Pine River typically flows at 1.5 to 2.9cubic meters per second.
Proceedings of the Ground-Water/Surface-Water Interactions Workshop July 2000
175
1) SITE NAME: Everglades National Park/ Florida Bay
2) City/State:South Florida
5) Surface Water Body: Wetland, estuary, bay
8)Contaminants:
Ground Water
3) Regulatory Authority: 6) Range of Tidal Variation:
<10 cm
NutrientsMetals?
Soil
4) Contact:
Dr. Peter W. SwarzenskiUSGS-GD600 4th Street SouthPetersburg, FL 33701Phone: 727-803-8747 x3072
Dr. Judson W. HarveyUSGS-WRD (NRP)12201 Sunrise Valley DriveMS 430Reston, VA 20192Phone: 703-648-5876
7) Risk:Human HealthInjection wells? Surface Water
10) COMMENTS: Capping of this 13-acre municipal landfill was completed in the fall of 1998. At this time the primaryCOCs are metals in the groundwater and surface. The 1991 ROD remedy included a pump-and-treatcomponent for groundwater which has been put on hold pending post-cap data evaluation.
Proceedings of the Ground-Water/Surface-Water Interactions Workshop July 2000
178
1) SITE NAME: I-85 Manufacturing and Distribution Center
2) City/State: Spartanburg, South Carolina
5) Surface Water Body: Tributary to Fairforest Creek
Diffusion samplers, direct pushsamplers, grab samples
Geochemical Parameters
None
Bioassays
None
10) COMMENTS: The unusual characteristic of this site is the high concentration of tetrachloroethylene observed insurficial samples from the tributary - up to 10 ppm. It is suspected that NAPL is discharging to the baseof the stream based on groundwater quality data. At the location of highest contamination within thestream, there is no visible aquatic life, vertebrate or invertebrate. Contamination persists above ambientwater quality criteria for over half a mile. The length of the discharge coupled with extremetopographic variation reduces possible remedial options for the stream.
Proceedings of the Ground-Water/Surface-Water Interactions Workshop July 2000
179
1) SITE NAME: Kerr-McGee Chemical/ BMI Complex
2) City/State: Henderson, Nevada
5) Surface Water Body: Lake Mead, Colorado River
8)Contaminants:
Ground Water
3) Regulatory Authority:State
6) Range of Tidal Variation:
Not applicable
Ammonium perchlorate
Soil
4) Contact:
Mitch KaplanEnvironmental ScientistU.S. EPA, Region 975 Hawthorne StreetSan Francisco, CA 94105Phone: 415- [email protected]
Doug ZimmermanChief, Bureau of CorrectiveActionNevada Dept. of EnvironmentalProtectionPhone: 775- 687-4670 x3127
7) Risk:Human HealthIngestion
Not analyzed
Surface Water
Ammonium perchlorate
EcologicalUnknown (under investigation)
Pore Water
Not analyzed
Sediment
Not analyzed
9) Monitoring Methods:
Physical Measurements
Monitoring wells, surface watermonitoring
Geochemical Parameters
Field parameters
Bioassays
None
10) COMMENTS:
Proceedings of the Ground-Water/Surface-Water Interactions Workshop July 2000
180
1) SITE NAME: Ledbetter Creek
2) City/State: Murray, Kentucky
5) Surface Water Body: Kentucky Lake Reservoir
8)Contaminants:
Ground Water
3) Regulatory Authority:State of Kentucky
6) Range of Tidal Variation:
Hydroelectric/Flood ControlDam operations result in 2-6 ftchange in water depth at streamsite.
Nitrates, herbicides, pesticides,fecal coliforms
Soil
4) Contact:
Susan P. HendricksHancock Biological Station561 Emma DriveMurray, KY 42071Phone: [email protected]
David S. WhiteHancock Biological Station561 Emma DriveMurray, KY 42071Phone: [email protected]
7) Risk:Human HealthContact
Nitrates, herbicides, pesticides
Surface Water
Nitrates, herbicides, pesticides,fecal coliforms
EcologicalSurface-subsurface microbialcommunitiesSurface-subsurface macroin-vertebrate communitiesFish communityHabitat degradation from highsedimentation/siltation, reducedsurface-subsurface exchange
Pore Water
Nitrates, herbicides, pesticides,fecal coliforms
Sediment
Nitrates, herbicides, pesticides,fecal coliforms
9) Monitoring Methods:
Physical Measurements
Monitoring wells, water tableheights, mini-piezometers,sediment temperature probes,seepage meters
Geochemical Parameters
Dissolved oxygen, turbidity,pH,ORP, specific conductance,NO3+NO2,NH4,SRP, Total N,Total P,SO4,CO2, CH4
Proceedings of the Ground-Water/Surface-Water Interactions Workshop July 2000
181
1) SITE NAME: Peconic Estuary System
2) City/State: Suffolk County, New York
5) Surface Water Body: EPA National Estuary Program-Peconic Estuary System
8)Contaminants:
Ground Water
3) Regulatory Authority: National Estuary Program-Peconic Bay Estuary, SuffolkCounty, New York
6) Range of Tidal Variation:
Approximately 2.5-3.5 ft
VOCs, nitrates, pesticides
Soil
4) Contact:
Ron PaulsenHydrogeologistSuffolk County HealthServices-Bureau of WaterResourcesPhone: 516-853-2220Ronald.paulsen@
co.suffolk.ny.us
Christopher SmithCornell UniversityCooperative Extension MarineProgram LeaderPhone: [email protected]
7) Risk:Human HealthEstuary is receiving water bodyfor groundwater discharges thatcontains pesticides, VOCs andelevated nitrates
Surface Water
VOCs, nitrates, pesticides
EcologicalThe Peconic Estuary Systemhas been subjected to theharmful alga blooms. The HABknown as brown tide(Aureococcus anophaefferens)has plagued the estuary since1985. Excessive nutrients,metals, and possibly pesticidesfrom groundwater seepage arethought to contribute to theonset and proliferation ofHABs in the System
.Pore Water
Nitrates, VOCs
Sediment
9) Monitoring Methods:
Physical Measurements
Installation of monitoring welland mini-piezometers withpercussion drill and hollowaugers; geophysicalmeasurements using loggingtechniques including naturalgamma, induction andresistivity logging; directcontact resistivitymeasurements of bay bottom tomap out groundwater seepagefaces; groundwater seepagemeasurements using time
Geochemical Parameters
Field parameters (conductivity,temperature, dissolved oxygen,chlorophyll, pH); nutrientspecies including inorganic andorganic forms of nitrogen;metals; volatile organic compounds; pesticides
Bioassays
Brown tide (Aureococcusanophaefferens) cell counts
Proceedings of the Ground-Water/Surface-Water Interactions Workshop July 2000
182
10) COMMENTS: The Peconic Estuary System is a large estuary system on Long Island, New York that receivedNational Estuary Status in 1994. Associated with the estuary program are numerous ongoinginvestigations and studies. These investigations include studies on the ecological, chemical andphysical properties of the Peconic Bay Estuary. One property being studied is the effect ofgroundwater seepage on the chemical and biological conditions in the bay. Direct measurements ofgroundwater seepage along with the chemical analysis of coastal groundwater and bay bottom porewater in the estuary are being made. This information is being used to develop a surface water modeland a groundwater model for the estuary system. The modelling results are being used to developedguidelines for nutrient loading to the bay especially as they pertain to chlorophyll and dissolved oxygenlevels in the bay.
Proceedings of the Ground-Water/Surface-Water Interactions Workshop July 2000
183
1) SITE NAME: Pinal Creek Basin, Arizona
2) City/State:Globe, Arizona
5) Surface Water Body: Pinal Creek, Salt River,Roosevelt Lake (reservoir forPhoenix)
Dissolved iron, aluminum, copper,manganese, cobalt, nickel, zincpH<4 in some portions of groundwater contamination plume
Soil
4) Contact:Judson HarveyUSGS430 National CenterReston, VA 20192Phone: [email protected]
Martha ConklinDept. of HydrologyUniversity of ArizonaHarshbarger BldgP.O. Box 210011Tucson, AZ, 85721Phone: [email protected]
Christopher C. FullerUSGS345 Middlefield Road, MS465Menlo Park, CA 94025Phone: [email protected]
James Brown USGS520 N. Park AvenueTucson, AZ 85719Phone: 520-670-6671x280 [email protected]
7) Risk:Human HealthProbably minimal. The majorconcern is for the small numberof families living in the northernpart of the basin that withdrawtheir water from wells emplacedin the aquifer. For the most partthe affected wells were movedaway from contaminated areasyears ago. There continues to beconcern about downstreameffects of metal pollution in thebasin on water quality in theSalt River and Roosevelt Lake,although studies to date suggestthat metals are not reaching theLake in appreciable quantities.Remedial actions are beingundertaken to intercept thegroundwater plume.EcologicalLargely unstudied at thislocation and therefore unknown.However, the perennial iswithin the Tonto NationalForest with abundant wildlife.Poor in-stream water qualityand manganese oxide depositson the stream bed doubtless areaffecting aquatic and terrestrialorganisms that use the streamand riparian zone.
Surface Water
Manganese, nickel, cobalt, zinc,aluminumpH generally > 6 in surface water.
Pore Water
Sediment
Proceedings of the Ground-Water/Surface-Water Interactions Workshop July 2000
184
9) Monitoring Methods:
Physical Measurements
Velocity and tracer-dilutiongaging of stream discharge; in-stream solute-tracerexperiments to determinesurface and hyporheic-zonewater exchange; in-streamauto-samplers; USGS minidrivepoint sampler; seepagemeters; stainless-steeldrivepoints; conventionalwells; identification of groundwater source areas using waterstable isotopes; age-dating ofground water using CFCs.
10) COMMENTS: USGS and the University of Arizona have identified natural attenuation processes that remove metalcontaminants due to interactions between surface water and ground water. Hydrologic exchangebetween the stream that receives the contaminated ground water and the hyporheic zone beneath thestream delays the downstream movement of contaminants, and also exposes the contaminants tounique microbial processes that enhance removal of contaminants in the hyporheic zone. USGS andthe University of Arizona have published more than fifteen journal papers and reports on this topic.Interested readers are encouraged to contact the lead scientists listed above for reprints and moreinformation.
Proceedings of the Ground-Water/Surface-Water Interactions Workshop July 2000
Marisa LatadyWyoming Department ofEnvironmental Quality/Soil &Hazardous Waste122 West 25th StreetCheyenne, WY 82002Phone: [email protected]
Felix FlechasUS EPARegion VIII999 18th StreetDenver, CO 80202Phone: [email protected]
7) Risk:Human HealthDermal contactIncidental ingestionInhalation of particulates
PAHs, PCP, dioxin, furans
Surface Water
Not applicable
EcologicalDirect exposures via soilingestionDirect exposures via dermalcontact with soilIndirect exposures via ingestionof contaminated food itemsInhalation of particulate dust(considered less significant theothers described above)
Monitoring wells; piezometers;sediment sampling; monitoringof the containment systems forhydraulic control; DNAPLthickness
Geochemical Parameters
Field parameters
Bioassays
WET testing of the water treatmentplant effluent under an NPDESpermit
Proceedings of the Ground-Water/Surface-Water Interactions Workshop July 2000
187
10) COMMENTS: UPRR operated the Laramie Tie Plant Site for the treatment of railroad ties and other wood preservingoperations on an intermittent basis from 1886 to 1983.The site borders the Laramie River just south ofthe city of Laramie, Wyoming. Waste management practices, such as allowing treated ties to drip dryonto the ground and discharging wastewater generated in the treating process to an unlined surfaceimpoundment, are believed to be the causes of contaminated soils and ground water at the site. Theprimary contaminants identified at the site include creosote, pentachlorophenol and other residuumoils.
Contamination at the site was discovered in 1981, and in 1983 the Environmental Protection Agency(EPA) and UPRR signed a CERCLA Administrative Order on Consent (AOC) to continue theremedial investigation already in progress and to conduct site cleanup. The investigation identifiedcontamination in surface soils and ground water contamination, including the presence of oil in thesubsurface [i.e., Dense Non-Aqueous Phase Liquid (DNAPL)].Some of the early activities conductedby UPRR to address the contamination identified include: 1.In 1983, UPRR decommissioned the facility, including demolition of on-site buildings and
shipment of unused wood treatment materials to another facility. 2.In 1984, UPRR partially closed the unlined Surface Impoundment that received wastewater. The
Surface Impoundment is a regulated unit as defined by the WDEQ/HWRR Chapter 10, Section6(a) .
3.In 1987, UPRR installed the Contaminant Isolation System (CIS) to prevent migration ofcontaminants to the Laramie River. The CIS consists ofrelocation of the Laramie River to anuncontaminated channel; construction of a cutoff wall; installation of a water management systemconsisting of horizontal drain lines along the exterior and interior of the cutoff wall to maintain aninward hydraulic gradient; construction of a water treatment plant to remove dissolvedcontaminants and implementation of a monitoring program to ensure the effectiveness of the CIS.
4.In 1988, UPRR installed ground water extraction wells, referred to as the Morrison ContaminantWithdrawal System (MCWS), outside the western site boundary to address a small area ofcontaminated ground water in Morrison bedrock.
In 1991, EPA and UPRR entered into an AOC under RCRA that required UPRR to conduct aCorrective Measure Study (CMS) to identify long-term remedies for implementation at the site,including pilot tests of various techniques to remove DNAPL from the subsurface.
In 1994, EPA selected the remedy to address contamination at the site. The remedy included continuedoperation of the CIS and MCWS systems, removal of DNAPL using the waterflood oil recoverymethod, covering a portion of the site with topsoil to address contaminated surface soils, installing aRCRA cap over the former Surface Impoundment area, and maintaining restricted access to the site.Nine criteria were selected to evaluate the performance of the final remedy. Detailed descriptions ofthese criteria can be found in EPA's September, 1994, "Final Decision and Response to Comments.
In 1995, the RCRA AOC was amended to require UPRR to submit an application for a RCRA Permitfor post-closure care and corrective action by September 1, 1995. UPRR submitted an application for apost-closure care and corrective action permit on September 1, 1995, and revised that application inMay 1996, August 1997 and March 1998.The amendment to the AOC also required UPRR toimplement the final remedy selected by EPA in 1994. The final remedy was amended in 1995 toinclude the use of a Corrective Action Management Unit (CAMU) to consolidate contaminated
Proceedings of the Ground-Water/Surface-Water Interactions Workshop July 2000
188
concrete debris and soils in the partially closed unlined Surface Impoundment. The CAMU currentlyhas an interim soil cover of six inches.
That portion of the final remedy that requires closure (i.e., installation of a RCRA cap) and post-closure care of the Surface Impoundment, as described in Section A of this Fact Sheet, is deferred toallow implementation and evaluation of phytoremediation, an innovative technology, designed for in-situ remediation of waste, contaminated soils and contaminated ground water. Phytoremediation testplots will be established over a portion of the Surface Impoundment and the western portion of thefacility to determine the effectiveness of this technology. Review of this corrective action program willbe conducted every five (5) years as part of the technical impracticability (TI) determination. The TIdetermination is made when ground water restoration to applicable cleanup standards is unattainablefrom an engineering perspective. If WDEQ determines, based on the five (5) year review process, thatphytoremediation does not meet the remediation criteria specified in the Permit, UPRR will berequired to implement the closure and post-closure care requirements established in the Permit. Thoseportions of the final remedy that are not deferred include continued oil recovery operations in theSurface Impoundment area until all recovery units have achieved the endpoint criteria, andimplementation of the ground water corrective action program.
As of December 1998 UPRR has recovered approximately 1,500,000 gallons of oil from thesubsurface through the waterflood oil recovery method.
Proceedings of the Ground-Water/Surface-Water Interactions Workshop July 2000
189
1) SITE NAME: West Branch Canal Creek, Aberdeen Proving Ground
2) City/State:Edgewood, Maryland
5) Surface Water Body: Wetland and stream
8)Contaminants:
Ground Water
3) Regulatory Authority: CERCLA
6) Range of Tidal Variation:About 2 ft change in stage increek; affects ground-waterflow direction and plumedistribution
René FuentesHydrogeologistU.S. EPA, Region 101200 Sixth AvenueSeattle, WA 98101Phone: [email protected]
Hahn GoldRemedial Project ManagerU.S. EPA, Region 101200 Sixth AvenueSeattle, WA 98101Phone: [email protected]
7) Risk:Human HealthContactInhalation Fish consumption
Creosote compounds, PAHs,pentachlorophenol
Surface Water
Rarely detected
EcologicalFish Shell fishDNAPL contact
Pore Water
Creosote compounds, PAHs,
Sediment
Creosote compounds, PAHs,DNAPL
9) Monitoring Methods:
Physical Measurements
Monitoring wells, mini-piezometers, sediment probe(temperature and electricalconductivity), seepage meter,off-shore cores, diver surveys(NAPL), water level surveys,LNAPL and DNAPL studies
Geochemical Parameters
Field parameters, LNAPL andDNAPL studies, salinity
Bioassays
Biomonitoring of treatment planteffluent
10) COMMENTS:
Proceedings of the Ground-Water/Surface-Water Interactions Workshop July 2000
* Editor’s Note: Mark Henry presented this material at a meeting of the Ground Water Forum in April 2000.
191
Appendix D: MHE Push Point Sampling Tools
by Mark A. Henry*
A new tool and sampling methodology have been devised for collecting pore water samples frombeneath beaches and surface water bodies. The use of this technology enables a single investigator orsmall team to rapidly gather pore water samples at or near the interface between groundwater andreceiving bodies of water. From a research perspective, the information gained in analyzing thesesamples may be very helpful in understanding the geochemical nature of this transition zone and thebiological processes at work.
This methodology has been used very successfully to locate the expression of contaminatedgroundwater venting into several lakes in Michigan. The technique involves the use of an MHE 27-inch push-point sampling device (PP27), ¼-inch outer diameter by F-inch inner diameter Tygontubing, and 50 m5, 100% polyethylene syringes or a peristaltic pump. The PP27 is a rigid F-inchdiameter stainless steel probe that is screened at one end and ported at the other to allow the collectionof pore water with a syringe or peristaltic pump. In this method’s simplest form, the investigator wouldwalk along a beach or in shallow water paralleling the beach, and at periodic intervals push (by hand) adecontaminated PP27 into the sand or sediments with a twisting motion until refusal (usually 6-18-inches). Then the screened zone is exposed and pore water samples are withdrawn at “low-flowsampling” collection rates using a disposable syringe connected by a length of Tygon tubing. Usually,only 30-50 m5 of water withdrawal is necessary to develop this miniature well; this equates toapproximately 20-35 volume exchanges through the PP27 . Subsequently drawn water is usually non-turbid and suitable for dispensing directly into sample containers or instruments. A 3-dimensionalsampling array is possible within the sediments and the water column. The PP27 is easilydecontaminated in the field but if the investigator has several of the inexpensive sampling devices on-hand, sample collection along a transect can be very rapid. When 100% polyethylene syringes areemployed, samples may be collected and stored temporarily within the syringe by placing the full,sealed syringe in a cooler. Once the sample collection has been completed, the investigator can processthe samples in a controlled environment. As an added benefit, it is possible to use the sample-filledsyringes for on-site headspace analysis of VOC’s using a field GC—information that be used to directan investigation in real time. If the syringe is half-dispensed and refilled with air, resealed, andagitated, the headspace in the syringe above a known volume of water can be quickly analyzed.
The Michigan Department of Environmental Quality (MDEQ) uses an enhanced variation of thismethod. As samples are being collected, some of the pore water is immediately dispensed into fieldanalytical equipment for measurement of “stabilization parameters” such as dissolved oxygen, pH,conductivity, redox, and temperature, or analytes such as dissolved iron, sulfide, etc. The MDEQinvestigators were able identify and map the expression of a groundwater plume venting into LakeMichigan and several inland lakes using this methodology and/or these techniques and SCUBA gear.Furthermore, the MDEQ couples its sampling with location information obtained using sub-meteraccuracy global positioning system (GPS) equipment. Plotting the geochemical data onto an accurateGPS representation of the sampling locations and predominant local features produces a precise plumeexpression map. GPS technology allows investigators to reliably relocate previous sampling locationsfor additional study and accurately combine and compare data from multiple sampling events.
Proceedings of the Ground-Water/Surface-Water Interactions Workshop July 2000
192
What follows is found in the MHE PP-27 sampler instruction manual. It is presented as additionalinformation about the sampler and to provide a few practical hints.
The groundwater/surface water interface has been a research interest of mine for the past decade.This transitional zone is usually rich in biomass and may play a predominant role in the bioattenuationof contaminated groundwater entering surface water bodies. Usually these biologic processes havelimited effectiveness in attenuating highly contaminated groundwater, leaving a plume of parentcontamination and metabolic byproducts that eventually expresses itself in receiving waters—usuallyclassified as non-point sources of pollution because of the uncertainty of the discharge area. Part of theproblem in the detection and study of these plumes is that there were no devices on the market for therapid, discrete collection of pore water samples. Reliance on conventional technology and techniquesto perform a detailed investigation required extensive effort and burdensome equipment.
Through several iterations, I have evolved a simple device for collecting pore water samples frombeneath surface water bodies or the beach areas surrounding them. Pore water sampling using the PP27becomes a simple and efficient process, generating a wealth of information and very little waste. Theeffective working depth is up to 26 inches below the land or sediment surface. If one collectsgroundwater samples in a transect perpendicular to groundwater flow in the suspected area of plumedischarge to an open water body, their analysis yields information about the areal extent ofcontaminant discharge to the water body. At this point, additional sampling can complement the initialdata and provide the information necessary to map the plume expression in both magnitude and arealdistribution. This is becoming increasingly important to regulators as they decide the ecologicalimpacts of discharging contaminant plumes.
Sampling at each location usually takes five minutes, allowing a small crew to collect dozens ofsamples in an afternoon. These samples can be analyzed in the field for real-time information useful indirecting field investigations and research. The work that I have conducted at several contaminationsites indicates that many groundwater plumes discharge in surface water bodies in 2-3 feet of waterdepth—accessible to investigators wearing hip boots or waders. Many plumes, especially light non-aqueous phase liquid (LNAPL) plumes can be delineated by collection of samples in very shallowwater or from under beaches. My initial experience has shown that dense non-aqueous phase liquid(DNAPL) contaminant plumes express themselves in the shallow, near-shore water as well, eventhough the onshore depth of the contaminant mass was deep in the aquifer.
DIRECTIONS
As shown in Figure 1, the PP27 device is a very simple, precisely machined tool consisting of atubular body fashioned with a screened zone at one end and a sampling port at the other. The bore ofthe PP27 body is fitted with a guard rod that gives structural support to the PP27 and prevents pluggingand deformation of the screened zone during insertion into sediments. The PP27 is made of 316stainless steel assuring compatibility with most sampling environments. The screened zone consists ofa series of interlaced machined slots which form a short screened zone with approximately 20% openarea.
Proceedings of the Ground-Water/Surface-Water Interactions Workshop July 2000
193
Operation of the PP27 is not difficult. Simply hold the device in a manner that squeezes the twohandles towards each other to maintain the guard rod fully inserted in the PP27 body during theinsertion process (as shown in Figure 2). Holding the device in this manner, push the PP27 into thesediments or beach to the desired depth using a gentle twisting motion. When the desired depth orrefusal is reached remove the guard rod from the PP27 body without disturbing the position of thedeployed sampler. Once the guard rod has been removed from the PP27, it SHOULD NOT bereinserted into the device until the bore of the PP27 has been thoroughly cleansed of all sand, silt, etc.
Attach a syringe or (peristaltic) pump to the PP27 sample port (see Figure 3) and withdraw water ata low-flow sampling rate (50-200 m5/min.). Once non-turbid aliquots have been withdrawn,representative samples can be collected for on-site and off-site analysis.
HELPFUL HINTS, INFORMATION, AND CAUTIONS
• Multiple depths can be sampled in one hole if samples are collected from deepest to shallowest.Insert the sampler using a twisting motion until you reach refusal. Remove the guard rod. Do notpush the sampler further into the sediments once the guard rod has been removed as thismay damage the screened zone and plug the PP27 with sediment. Once sampling has beencompleted at this deepest depth, the PP27 can be partially pulled from the hole to a new samplingelevation. Remember not to insert the PP27 into the sediments without the guard rod inserted toprevent screened zone damage. Alternately, multiple holes can be used to collect samples frommultiple depths at a particular sampling location. It is recommended that some type be device beused to prevent lateral movement and slippage of the PP27 as sampling is conducted near the topof the hole (see Figure 3). This offsets the leverage of the instrument and reduces holedegeneration. MHE offers an 8-inch diameter., heavy-duty steel sampling platform engineered forprecise sampling depth requirements of field research. A plate of steel with a 3/16-inch diameter.hole through its center would serve the fundamental purpose of maintaining a rigid hole opening .If repeated shallow sampling is to be conducted, it may be more convenient to use a shortersampler (MHE - PP15”).
• If you wish to reuse the PP27 sampler at a particular sampling location and want to clean the borequickly while you’re there so that the guard rod may be safely reinserted, you can use a syringefilled with surface water or deionized water to backflush the bore several times before reinsertingthe guard rod. Use at least 100 m5 of water. If you have too much trouble reinserting the guard rod(e.g., due to grit), it will be necessary to use the standard cleaning procedures with cleaning rodand soap solution.
• If the screened zone of the PP27 becomes plugged while inserted in the sediments, it is frequentlypossible to hydraulically/pneumatically shock the screened zone free of adhering material while itis inserted into the sediments. Attach a large-volume syringe to the sampling port. In a quickmotion, pull the syringe plunger most of the way back (creating a vacuum) and then immediatelyrelease the plunger—the plunger will slam to a neutral position, sending a shock wave through thebore of the PP27 and may alleviate the problem.
• The PP27 can be used as a piezometer to determine the static head of the groundwater and hence,the potential direction of groundwater movement. To do this, a tube is connected to the sample portas shown in Figure 5. A continuous stream of water is established from the syringe (or pump) tothe screened zone by pumping out any air remaining in the PP27and tubing. When the tube is
Proceedings of the Ground-Water/Surface-Water Interactions Workshop July 2000
194
disconnected from the syringe, the static water level in the tube will represent the static water levelat the depth that the screened zone occupies.
• It is frequently possible to push the PP27 through thin lenses of low-permeability material andcollect samples from below them and gather valuable geochemical samples. At many of the siteswhere the PP27 has been used, sampling from just below a layer of fine sand, silt, or clay, oneoccasionally encounters seemingly large pockets of gas that seem to have coalesced and collectedunder this less permeable stratum. Analysis of these pockets may provide additional insight topredominant biological processes. It may true that the concentration of volatile organic compounds(VOCs) in the groundwater has equilibrated with these bubbles (i.e., steady state), which meansthat their presence in a sampling stream or syringe would not significantly affect the concentrationof dissolved VOCs. In fact, if one assumes that steady-state conditions exist, the concentration ofVOCs in the bubbles is directly related the concentration in the surrounding groundwater. Analternate condition may exist if the groundwater is supersaturated with bacterial metabolic wastegases and the negative pressure exerted by the pump (or syringe) is initiating a degassing ofdissolved gases from the groundwater. In this instance, VOCs would partition from thegroundwater to the bubbles as they are formed in the sampling tubing (this is fairly evident ifoccurring). The consequence is that part of the dissolved contaminant mass has partitioned into thegas phase; unless the gas-phase is captured, quantified, and accounted for, the native VOCconcentration of the groundwater is not reflected by analysis of the groundwater alone. If thiscondition exists, the degassing effect can be minimized by decreasing the sampling rate to a ratemore easily yielded by the sampled formation. With experience, it is easy to distinguish which ofthese conditions (or combination of conditions) exist and to what extent they affect sample quality.
• The internal volume of a PP27 is approximately 1.5 m5. A 50 m5 syringe full of distilled water,decontamination water, methanol, etc. will push about 33 volumes through the bore.
• When straightening the screened zone it is sometimes helpful to wash out the bore of the deviceand then insert the guard rod or the cleaning rod to the area of the bend in the screened zone.Gently unbend the portion of the screened zone nearest the rod and carefully advance the rod to thenext bend. After the rod has been fully inserted into the screened zone perform the final screenedzone straightening fine-tuning until the guard rod slides freely through it.
• If the sampling port of the PP27 is above the static level of the water body, each time you removethe syringe or pump from the PP27 sampling port, air will fill the bore of the PP27 allowing thewater level in the bore to reach its static head. To avoid this plug of air from entering thesubsequent syringe, attach a clamp adapter and or a three-way valve between the sampling port andthe syringe or pump inlet as shown in Figure 7.
• I have conducted dye tests by injecting concentrated uradine dye under a perforated 1.5-footdiameter disk through which the PP27 was inserted 3-12-inches into sediments. The goal of thesetests was to determine whether or not surface water and dye is drawn into samples collected in nearsurface sediments (i.e., whether a cone of depression is formed). The results indicated that nosurface water is drawn into samples even though sampling was conducted with a peristaltic pumpat a rate of 600 m5/min.
• I usually couple my field investigations with GPS location of the sampling point. If conditionspermit, a pin flag can be placed at the sampling point for later location by GPS. I usually use sub-
Proceedings of the Ground-Water/Surface-Water Interactions Workshop July 2000
195
meter grade GPS for this surveying; GPS can then be used to relocate previously sampled pointeven if certain site physical characteristics have changed (eroding shorelines, etc.).
• Sampling by syringe has many advantages. This is my preferred field method due to its simplicityand versatility. It is useful to be able to collect several 50 m5 syringes full of groundwater, storethem on ice, and perform the sample transfer to a VOA vial, etc. under more controlled conditions.To transfer sample to a VOA vial, place the end of the transfer tube (Figure 8) to the bottom of theVOA vial. Dispense sample into the VOA vial and slowly withdraw the transfer tube from the vialmaintaining the mouth of the transfer tube just below the sample surface. When the transfer tube isalmost out of the vial, continue to dispense sample and leave an “anti-meniscus” of sample abovethe rim of the vial. Add several drops of HCl (which will displace a few drops of sample) and cap.If VOC samples are to be collected and stored temporarily in a syringe, I recommend using 100%polyethylene (“two piece”) syringes such as those made by Henke Sass Wolf GMBH (NormJect,50 m5)) configured as shown in Figure 8. From personal experience I have found that smallamounts of aromatic compounds (BTEX) can leach from the rubber parts of the rubber-tippedplunger found in common medical syringes. Rubber-tipped plunger syringes have less side-wallresistance and work much smoother than the 100% polyethylene syringes so I use medical syringesfor “development” of the PP27. Standard medical syringes also work well for collecting samplesfor non-VOC analysis. I utilize handheld meters for pH, conductivity, redox, dissolved oxygen, etc.One can dispense sample from the syringe into these types of instruments for field measurements.
• The 50 m5, 100% polyethylene syringes mentioned above can be purchased directly from MHE,configured with tubing as was the example syringe included with your order, or customized to suityour individual needs. If you would to make your own, the syringes that I am currently using arepurchased from National Scientific Company. The tubing is Tygon ¼-inch outer diameter and F-inch inner diameter. Be sure to use some type of clamp at the tubing mouth to ensure a good seal atthe sampler port.
• Headspace GC analysis of VOCs can be easily accomplished using 100% polyethylene syringes.Dispense all but 20 m5 of the sampled groundwater from the syringe. Refill the syringe to the 40m5 mark with ambient air (and heat the syringe in a water bath if desired) as shown in Figure 9.Insert a GC syringe needle through the transfer tube into the syringe headspace and withdraw asample for GC analysis.
• Occasionally a small amount of sand and silt is withdrawn into the syringe or pump samplingstream, even after proper development of the PP27. This may be due to the nature of the geologicformation. This fine material is probably already at equilibrium with the surrounding groundwaterand should not influence analysis of VOCs in the groundwater sample. The sample can betransferred to its shipping container without this silt if the syringe is dispensed in a way that letsthe solid material settle out in the syringe and not carry over to the shipping vial.
• The PP27 has been used very successfully for underwater investigations using SCUBA equipmentand a series of 100% polyethylene syringes. Once again, GPS equipment was used for location ofthe position that the divers collected groundwater samples of contaminant plume expression in thelake. Underwater notes (temperature, depth, observations, etc.) can be written directly on thesample syringes if they are pre-prepared with a strip of Scotch Magic Transparent Tape applieddown the syringe body and writing is done with a soft pencil.
Proceedings of the Ground-Water/Surface-Water Interactions Workshop July 2000
196
• The PP27 may be used to inject nutrients or dyes into the sediments for field trials of biologic orgeochemical testing or tracing groundwater paths. Simply insert the PP27 to the desired depth andafter the guard rod has been removed, connect a syringe or pump and slowly inject the desiredfluid into the sediments, perhaps followed by a small amount of native groundwater to flush theinstrument.
• These devices can be dedicated as semi-permanent underwater monitoring devices. If a PP-27 isinserted to the desired depth through a plate (such as the sampling platform mentioned earlier) thatcan lock the sampler at the correct insertion depth, a vinyl cap can be placed over the mouth of thesampler, and the sampler can be dedicated to that location so that future samples can be withdrawnwhen desired.
• It has been useful to carry several samplers in “quivers” made of 2-inch PVC tubing: one tube for10-15 clean and assembled samplers, and one tube for used samplers and their separated guardrods. This arrangement protects both the investigators and the instruments.
I hope that users will find many useful and innovative uses for this device. If you have other helpfulinformation, uses, and advice concerning these samplers, please write or e-mail suggestions to me forinclusion in future manual revisions. I will be forming a website soon, and posting much of my GSIresearch with links to as much GSI field research and related topics as I can find.Thanks.
Mark HenryMHE Products3371 Sherman Rd.East Tawas, MI 48730Phone: 517-362-5179 or 517-393-0948e-mail: [email protected]
Proceedings of the Ground-Water/Surface-Water Interactions Workshop July 2000
197
Proceedings of the Ground-Water/Surface-Water Interactions Workshop July 2000
198
Proceedings of the Ground-Water/Surface-Water Interactions Workshop July 2000
199
Proceedings of the Ground-Water/Surface-Water Interactions Workshop July 2000