101
Water Saving Practices inRice Paddy Cultivation14-15 September 2006, Kuala Lumpur, Malaysia
Editor : Dr. Ragab Ragab
Chairman, ICID Working Group on Sustainable Use of Natural Resources for Crop Production (WG-CROP)
Centre for Ecology & Hydrology, CEH, Wallingford, UK
ENTER EXIT
Designed by : M
adhu Mohanan, IC
ID C
entral Office
PROCEEDINGSof the
International Workshop on

Workshop held during 57th IEC, 3rd Asian Regional Conference and 7th InternationalMicro Irrigation Congress, Kuala Lumpur, Malaysia, 10-15 September 2006.
International Commission on Irrigation and Drainage (ICID) was established in 1950as a Scientific, Technical, Non-commercial, Non-Governmental InternationalOrganisation (NGO) with headquarters at New Delhi, India. The Commission isdedicated to enhancing the worldwide supply of food and fiber by improving waterand land management, especially the productivity of irrigated and drained lands.The mission of ICID is to stimulate and promote the development and application ofthe arts, sciences and techniques and engineering, agriculture, economics, ecologicaland social sciences in managing water and land resources for irrigation, drainageand flood management using research and development, and capacity building.ICID aims to achieve sustainable irrigated agriculture through integrated waterresources development and management (IWRDM). ICID network spreads over105 countries in the world.
September, 2006
ISBN : 81-89610-06-6
Price : US$ 20
ICID accepts no responsibility for the statements made and opinions expressed inthese proceedings.
BACK NEXT
HOME

INTERNATIONAL WORKSHOP ONWATER SAVING PRACTICES IN RICE PADDY CULTIVATION
14-15 September 2006Kuala Lumpur, Malaysia
Workshop Themes
Field measurements for water saving in rice cultivation• Methods for measuring rice water consumption• Precise measurements of the water balance components in rice paddy fields
The role of water authorities and institution• The role and activities of the water management associations for water
saving in rice cultivation
Operational control of water supplies for water saving in rice cultivation• Operational control of the main channel for water saving. and closed
pipeline type system• Supplier-led and user-led water control system for water saving
Water management for water saving in rice cultivation at farm level• Farm level water management for water saving• Farm water depth control• Farmers’ expert water management system
Re-use and cyclic use for water saving in rice cultivation• Cyclic water use system for water saving• Reuse system of return flow for irrigation
Computer support, modelling and decision support systems for rice cultivation• Computer support for water saving in rice cultivation• Computer models/programs for rice water management• Rice water management information system for water saving
Venue
The workshop will be held in Kuala Lumpur, September 14, 2006, during the 57th
meeting of the International Executive Council (IEC) of the International Commissionon Irrigation and Drainage (ICID). It is part of the activities of the ICID “Work Groupon the Sustainable Use of Natural Resources for Crop Production.
BACK NEXT
HOME

The workshop is organized by:
• ICID “Work Group on the Sustainable Use of Natural Resources for CropProduction (WG-CROP)”
• Malaysian National Committee of ICID (MANCID)• ICID British Section (ICID.UK)
Organizing Committee:
Dr. R. Ragab, Chairman, Work Group on Sustainable Use of Natural Resourcesfor Crop Production (WG-CROP), CEH-Wallingford, UKProf. Dr. Yoshisuke NAKANO, Faculty of Agriculture, Kyushu University, JapanProf André Mermoud, Swiss Federal Inst. Technology, Lausanne, Switzerland
Scientific Committee:
Dr. Ragab Ragab, Centre for Ecology & Hydrology, CEH, Wallingford, UK(Chairman, WG-CROP)Dr. Cai Lingen, Dept. of Irrigation and Drainage, China Institute of Water Resourcesand Hydropower Research (IWHR)Dr. Masaharu KURODA, Faculty of Engineering, Kyushu-Kyouritsu University,Kitakyushu, Fukuoka, JapanProf. Dr. Yoshisuke NAKANO, Faculty of Agriculture, Kyushu University, Fukuoka,JapanProf. Dr. Tai-Cheol KIM, College of Agriculture, Chungnam National University,Gung-dong, Yuseong-gu, Daejeon, Korea.Prof. Dr. Budi Indra SETIAWAN, Faculty of Agricultural Technology, BogorAgricultural University, Bogor 16002, Indonesia.Prof. Dr. Koji INOSAKO, Faculty of Agricultural, Tottori University, JapanProf Atef Hamdy, CIHEAM/MAI.B, Bari, ItalyProf. Daniele De Wrachien, Instituto di Idraulica Agraria, University of Milan, ItalyProf. André Mermoud, Swiss Federal Inst. Technol., Lausanne, Switzerland
BACK NEXT
HOME

Preface : Water Saving Practices in Rice Paddy Cultivation (R. Ragab)
Rice Cultivation : Environmental Issues and Water Saving Approaches (R. Ragab)
Water Saving for Paddy Cultivation by Intermittent Irrigation Under the System ofRice Intensification (SRI) in Eastern Indonesia (Shuichi Sato)
Water Productivity of Rice as Influenced by Intermittent Ponding and Intensity ofPuddling (S. Sarkar and A. Chakraborty)
Efficient Use of Rainwater in Rainfed Rice-based Cropping System in EasternIndia (L. P. Pholane, Sudhindra N. Panda and Laxmi N. Sethi)
Effect of Conventional and Furrow Planting Methods on Radiation, Interception,Growth and Yield Of Rice Paddy (L.K. Dhaliwal, S.S. Hundal S.K. Chahal and A.Aneja)
Shallow Groundwater as Subsurface Irrigation for Rice Cultivation in SedataniPaddy Field (Satyanto Krido Saptomo, Budi Indra Setiawan, Yoshisuke Nakano,Masaharu Kuroda and Rudiyanto)
In-Situ Soil and Moisture Conservation Model (Five Percent Model) For SustainablePaddy Cultivation in High Rainfall Area in Semi AridTropical India (P. Vamshi Krishna, G. Srinivas, L.V. Prasad)
A System Harmonisation Framework to Achieve Sustainable Water Savings in RiceBased Systems (Shahbaz Khan)
Perceptions of Rice Growers in Adopting Water Conservation Techniques in SindhProvince of Pakistan (Y. Memon, M. Mirani, F. M. Marri, F. Qureshi, K. Bibi and E. M.Rajpar)
Practical Application of Rotational Irrigation Scheduling System (RISS) for WaterSaving to Donghwa Irrigation District in Korea (Kim, Tai-cheol, Jae-myun, Lee,Dae-sik, Kim and Jong-pil Moon)
CONTENTS
BACK NEXT
HOME

PREFACE : Water Saving Practices in Rice PaddyCultivation
The world's population is expected to grow from 6 billion today to at least8 billion by the year 2025, with about 90 per cent of the increase beingadded to the developing world. In many regions, population growth,urbanization and industrialization are imposing rapidly growing demandsand pressures on the water resources and causing in many casesimbalance between supply and demand. This growing imbalance has ledto shortages, competition, rising pollution and other environmentalpressures.
Achieving food security and improving the quality of life, while preserving the environment,will continue to pose major challenger to Scientists, Decision makers and Technicians inthe next few decades. Irrigation requires relatively large amounts of water. This water is acommodity that is becoming increasingly scarce. On the other hand, Rice cultivationcompared with other field crops requires huge amount of water. Therefore, any watersaving in rice cultivation will be significant and valuable.
Rice is known to be a high water consuming crop. In Asia, irrigated rice consumes 150billion m3 of water. It has been estimated that a 10% decrease in the water use for irrigatedrice could lead to water saving of approximately 150,000 million m3, almost one-fourth ofall the fresh water used world-wide for non-agricultural activities.
The main difficulty with saving water is that the water is not priced properly, especially inschemes where they charge the user by irrigated area and not by volume of water used.With such schemes, there is no economic incentive to save water.
Agricultural activity is considered by many as the main user and abuser of naturalresources. Irrigated rice production is particularly known for the excessive use of irrigationwater, pesticides and inefficient use of fertilizers. Rice is a suspected to be a largecontributor of carbon dioxide, methane, nitrous oxide and ammonia emissions.
Integrated water resources management is vital for producing more rice with less water.There is a range of options to increase the productivity and efficiency of water consumptionin surface irrigated rice. With economic incentives and adequate production tools andirrigation services, farmers can adopt substantial changes in their water managementpractices.
Dr. Ragab RagabCentre for Ecology & Hydrology, CEH, Wallingford, UK
Chairman, Working Group on Sustainable Use of Natural Resources for Crop Production(WG-CROP)
E-mail : [email protected]
BACK NEXT
HOME

RICE CULTIVATION: ENVIRONMENTAL ISSUES AND WATER SAVING APPROACHES
Ragab Ragab1
Introduction
Globally, rice is the most important food crop with more than 90% produced in Asia. In most of Asian countries, rice is not only the staple food, but also a source of employment and income for the rural communities. In several Asian countries, rice provides 50 to 70% of the energy and protein dietary requirements. Moreover, rice is also a staple food in many Latin American and Caribbean countries and is the most rapid growing food source in some African countries with Nigeria as a major importer of rice. Rice represents about 45 percent of all irrigated crop areas in Asia where 59 percent of the rice is irrigated (FAO, 2002).
Rice demand in year 2030 is projected to be around 533 million ton of milled rice. With water being the most important component for rice production, producing more rice with less water is therefore a formidable challenge. There will be great difficulties to increase the rice area due to growing competition for land and water from both industrialization and urbanization activities.
Due to its high productivity, irrigated rice makes up approximately 75% of the total rice production. Rice is known to be a high water consuming crop. In Asia, irrigated rice consumes 150 billion m3 of water. This high water consumption results in a low water use efficiency of approximately 20,000 m3/ha. Assuming an average yield of 5 t/ha, the water productivity of irrigated rice is only 0.15 kg of milled rice/m3of water (FAO, 2002). This low productivity of irrigated rice makes the crop non-competitive with other uses of water.
Rice irrigation
Surface irrigation is by far the most widespread irrigation technique in Asia. It includes all paddy rice cultivation and most of the other crops. The total area for rice cultivation in Asia is 111,495,121 ha of which 65,321,714 ha are irrigated (59% of the total area) and 46,173,407 ha are rainfed (41% of the total area). The total area of rice cultivation worldwide is estimated to be 153,783,818 ha. In India only 47 percent of the total harvested area for paddy rice is irrigated, while more that 92 percent of the harvested paddy rice in China is irrigated (AQUASTAT, FAO, 2006).
1 Dr. Ragab Ragab, Head, Water, Soils and Landscapes, Centre for Ecology & Hydrology, CEH, Wallingford, Oxon, Ox 10 8 BB, UK. [email protected] Chairman of the Work Group on the Sustainable use of natural resources for crop production, International Commission on Irrigation & Drainage, ICID, Chairman of the Work Group of Water Quality, International Commission on Irrigation & Drainage, ICID.
5

The most common system of lowland rice cultivation in Asia is transplanting or direct seeding in a field that is kept continuously flooded with 10±5 cm throughout the growing season. Land preparation includes soaking, ploughing and puddling, i.e. harrowing until a soft muddy layer of 15±10 cm is formed in saturated conditions. The water requirement for land preparation is estimated at 200 ±150mm, but can reach as high as 900± 650 mm for long duration, i.e. 48±24 days. Field water application during crop growth periods varies from 500 to 800 mm to more than 3000 mm. Most wet season rice irrigation is by gravity (cascades from plot to plot) while dry season rice cultivation would require pumping in some places (Bouman and Tuong, 2000).
In most of Asia, drainage is usually linked to irrigation. In traditional terraced paddy cultivation, water flows from one plot to another and it is difficult to draw a line between irrigation and drainage. In addition, in several humid countries of the region, large parts of lowland or wetland are used for paddy cultivation.
Rice water requirements and productivity
The average total water requirements (m3/ha) and specific water use (m3/kg) for rice production under different conditions can be roughly estimated based on an evapotranspiration, which is the water actually consumed by the plant, of 550 to 950 mm/crop and any additional water used. Following figures were obtained by Facon (2000):
rainfed upland rice: 5500 m3/ha (evapotranspiration only) for 1.25 t/ha, specific water use: 6.5 m3/kg
rainfed lowland rice: 10,000 m3/ha (evapotranspiration + impounded rainwater) for 2.5 t/ha, specific water use: 4.0 m3/kg
irrigated upland rice: 10,000 m3/ha (evapotranspiration + supplementary irrigation) for 2.5 t/ha, specific water use: 4.0 m3/kg
irrigated lowland/deepwater rice: 16,500 m3/ha (evapotranspiration and full irrigation) for 4.5 t/ha, specific water use: 3.7 m3/kg
Irrigated lowland is the dominant system. It is the most productive system in terms
of yield and it produces the highest yield per m3 of water but, it is also the least efficient if one considers water use per ha or the amount of water required for evapotranspiration divided by the amount of water diverted into the system.
The average rice yield for 2004 for the world and Asia was 3.97 and 4.08 t/ha, respectively. World rice production in 2004 was just under 610 Mt. At least 114 countries grow rice and Asian farmers produce 90% of the total with India and China growing more than half of the total crop (IRRI, 2006).
Water productivity in continuous flooded rice was typically 0.4±0.2 g grain per kg water in India and 1.1 ±0.3g grain per kg water in the Philippines. Total rice production can be increased by using water saved in one location to irrigate new land in another.
6

Environmental issues
Agricultural activity is considered by many as the main user and abuser of natural resources. Irrigated rice production is particularly known for the excessive use of irrigation water, pesticides and inefficient use of fertilizers. Rice is a suspected to be a large contributor of carbon dioxide, methane, nitrous oxide and ammonia emissions (FAO, 2002).
Carbon dioxide is emitted especially during the burning of crop residue which is a standard practice in much of the world. Methane emission is associated with irrigated rice due to the long periods of flooding and the decomposition of incorporated organic matter under anaerobic condition. It is estimated that irrigated rice contributes around 20% of the global emission of methane. Methane is considered to be approximately 20-fold more potent as a greenhouse gas when compared with carbon dioxide. However, it seems possible to reduce methane by introducing a short dry fallow period or by including rice cultivation in rotation with an upland crop to allow the organic matter to decompose under aerobic conditions before subjecting the soil to anaerobic conditions for irrigated rice cultivation.
Nitrous oxide can be emitted in irrigated rice when soils were allowed to dry then flooded after application of urea. Continuous water application following the applications of urea on dry soil can significantly reduce nitrous oxide emissions. In irrigated rice, ammonia emission is a direct result of inefficient use of urea. The application of urea in water or on mud can lead to approximately 70% of the urea volatilizing as ammonia. This loss can be reduced by at least 30 to 50% without affecting yield by efficient and simple methods of fertilizer management.
Water saving
It has been estimated that a 10% decrease in the water use for irrigated rice could lead to water saving of approximately 150,000 million m3, almost one-fourth of all the fresh water used world-wide for non-agricultural activities. Several studies have indicated that irrigated rice can be easily cultivated using 8,000 to 10,000 m3/ha, which is approximately 50% of current use, without affecting yield. The main difficulty with saving water is that the water is not priced properly, especially in schemes where they charge the user by irrigated area and not by volume of water used. With such schemes, there is no economic incentive to save water.
There are several ways to reduce irrigated rice water consumption including:
limiting rice cultivation to only the rainy season, using and developing more water efficient varieties (C4 type plants), promoting upland rice, developing drought tolerance rice, changing the crop planting date and making more effective use of rainfall, changing rice planting practices, wet seeding of rice uses about 20-25 percent
less water than in traditional transplanted rice methods and drastically reduces
7

labor for establishing the crop from 30-person days per ha for transplanting to 1-2 person days,
replacing transplanting by direct seeding (dry seeded rice saves even more water, especially during land preparation),
reducing water use during crop growth: Intermittent flooding, maintaining the soil in sub-saturated condition, alternate drying and wetting can reduce water applied to the field by more than 40 percent compared with continuous submergence methods without affecting yields,
supplementary irrigation either for crop establishment or at critical growth stages, particularly flowering, can improve yield,
water recycling and conjunctive use to enable farmers to reuse seepage, percolation losses from canals and fields as well as groundwater (to compensate for the lack of reliability, inequities in distribution, and rigidity of canal water distribution systems),
using alternatives to flooding techniques, e.g. use of overhead sprinklers, furrows, etc. with newly developed aerobic varieties,
adopting simple conservation; that is, maintaining only supersaturated soil conditions during cultivation of the crop, significantly reducing land preparation in water (puddling) and keeping water within the field by reducing outflow discharges.
The farmer’s acceptance to the above practices depends on economic and other factors. Farmers will need technical support in upgrading irrigation systems for efficient water distribution and agricultural support in adapting agricultural practices such as modified irrigation methods, using new varieties and new water management practices.
In order to compete with alternative uses of water, improved efficiency of rice production is crucial.
Conclusions
Integrated water resources management is vital for producing more rice with less water. There is a range of options to increase the productivity and efficiency of water consumption in surface irrigated rice. With economic incentives and adequate production tools and irrigation services, farmers can adopt substantial changes in their water management practices.
References AQUASTAT, FAO. 2006. FAO-Database http://www.fao.org Bouman, B.A.M. and Tuong T.P. 2000. Field water management to save water and increase its productivity in irrigated lowland rice. Agric. Water Manage. 1615, 1-20. Facon, T. 2000. Water management in rice in Asia: some issues for the future. Food and Agriculture Organisation, Bangkok, Thailand.
8

FAO. 2000. Issues and challenges in rice technological development for sustainable food security. Keynote Address at: The International Rice Commission (IRC) 02/05. 20th Session. Bangkok, Thailand, 23-26 July 2002. IRRI. 2006. International Rice Research Institute. http://www.irri.org
9

WATER SAVING FOR PADDY CULTIVATION BY INTERMITTENT IRRIGATION
UNDER THE SYSTEM OF RICE INTENSIFICATION (SRI) IN EASTERN INDONESIA
Shuichi Sato1
Abstract
Over the past three years, a major donor-funded irrigation project in Eastern Indonesia has evaluated the System of Rice Intensification to assess its potential to reduce demand for irrigation water while rewarding farmers with higher production and incomes. This paper reports the results and conclusions from this assessment. In summary, comparison trials managed by 1,849 farmers on 1,363 ha and supervised by project staff have given an average SRI yield of 7.23 t/ha compared to 3.92 t/ha with conventional methods, an 84% increase. Water saving has been assessed to be around 40%, accompanied by an average reduction in costs of production per hectare of >25%. An analysis of costs and benefits in the 2005 dry season in West Nusa Tenggara province calculated that the net returns per hectare with SRI methods was 6.2 million rupiah compared with 1.2 million rupiah using conventional methods. So the economic attractiveness of SRI methods is very great, giving farmers strong incentive to accept water-saving as new norm for irrigated rice production. I. Project Background
Since 1990, in accordance with the Government of Indonesia’s (GOI) policy to prioritize development in eastern Indonesia, where water resources are limited and the economy is depressed, a Small Scale Irrigation Management Project (SSIMP) has been undertaken with financial assistance from the Japan Bank for International Cooperation (JBIC). The executing agency for the project is the Directorate General of Water Resources (DGWR), Ministry of Public Works (PU) in Indonesia. The fourth phase of this project (SSIMP-IV) started in 2003, when its name was changed to the Decentralized Irrigation System Improvement Project in Eastern Region of Indonesia (DISIMP). This series of four SSIMPs has been under continuous management by the same consultant (Nippon Koei, NK) for over 15 years. Data on these projects are given in the following pages and locations where SRI methods have been evaluated are shown on the map. In SSIMP-DISIMP, sustainable development for poverty alleviation has been a key project objective, emphasizing quick-yielding, bottom-up, and beneficiary-participation approaches. SSIMP has been implemented with unique approaches that are expected to contribute to improving project sustainability, namely (a) comprehensive
1 Team Leader for Nippon Koei Consultant for JBIC ODA Loan Project Decentralized Irrigation System Improvement Project in Eastern Region of Indonesia
10

project management to cover the whole project cycle, (b) flexible project formulation to meet local needs, (c) good quality control, (d) capacity building among officials and engineers, (e) intensive guidance for beneficiaries and operators, and (f) continuous learning made possible by the project continuity provided by GOI and JBIC.
SSIMP-I (1990-1994):
3 sub-projects in 2 provinces; 3,100 ha of new irrigation, water from 2 dams and 248 wells.
SSIMP-II (1995-1998):
11 sub-projects in 3 provinces; 15,600 ha of new irrigation and water supply for 10,000 people; supply from 3 dams, 6 weirs, and 192 wells.
SSIMP-III (1998-2003):
40 sub-projects in 6 provinces; 60,342 ha of new/improved irrigation and water supply for 240,000 people, from 3 dams, 12 weirs, and 310 wells.
DISIMP (2003-2008): 27 sub-projects in 8 provinces; 130,000 ha of new/improved irrigation and water supply for 50,000 people, from 9 dams, 15 weirs, 250 wells
The quantitative results of this series of SSIMPs by 2004 amounted to new and/or improved irrigation systems for about 80,000 ha, with water supply for 250,000 people, served by 8 dams, 18 diversion weirs, 750 groundwater tube wells, and 570 km of canal networks. The number of direct beneficiaries assisted by SSIMP has reached 1.3 million.
11

II. SRI activities in SSIMP-DISIMP schemes Since 2002, SRI methods have been tested and demonstrated in irrigation schemes completed under SSIMP as a specific measure to help promote irrigation improvements and to strengthen farmer groups. The first SRI locations were selected at the Awo weir irrigation scheme (SSIMP-II) in South Sulawesi, and the Tiu Kulit dam irrigation scheme (SSIMP-I) in West Nusa Tenggara. Owing to the great success of the SRI trials in SSIMP schemes, SRI areas are continuing to expand to cover ever larger areas and more irrigation schemes as follows:
Year 2002: 1.9 ha (6 farmers) in 4 schemes in 2 provinces Year 2003: 15.3 ha (32 farmers) in 6 schemes in 2 provinces Year 2004: 364.5 ha (347 farmers) in 12 schemes in 2 provinces Year 2005: 981.9 ha (1,464 farmers) in 15 schemes in 3 provinces
By the end of 2005, SRI has been introduced in SSIMP-DISIMP scheme areas on 1,363.6 ha by a total of 1,849 farmers. In 2006, SRI is expected to be expanded to >4,000 ha in 8 provinces in eastern Indonesia. The SRI practices followed in SSIMP-DISIMP schemes have been, in general, as follows:
Farm plots: Plot-to-plot irrigation within SSIMP-DISIMP schemes; this is not ideal for proper water control, but it reflects the existing infrastructure conditions. If existing infrastructure is reconfigured to achieve better water control at the individual field level, further reductions in water use should be achievable.
Rice varieties: IR-64, Ciliwung, Ciherang, and Mamberamo
Transplanting: Single planting of young seedlings (7-14 days after seeding) with wide spacing. This is usually 30 cm x 30 cm, but 27 cm x 27 cm in some locations.
Water management: a) Vegetative growth stage: Intermittent irrigation without standing water (< 2 cm) in the field. The wet-dry cycle differs by location, reflecting differences in soil type, shape and size of plot, rainfall pattern, and availability of irrigation water;
b) Reproductive stage: Continuous irrigation with shallow standing water (+ 2 cm)
c) Drainage: 20 days before harvest
Land preparation: Common practices are used for puddling and leveling the plots. Small ditches are dug by farmers along the bunds and in the centers of their plots, if necessary, as this facilitates smooth irrigation and drainage operations to realize efficient intermittent irrigation.
12

Fertilization: Chemical fertilizer has been applied but with a 50% reduction in quantity; also application of organic matter as available.
Weeding: Weeding with a rotary hoe 2 or 3 times per crop season. III. Comparison of SRI vs. non-SRI paddy yield results to date From 2002 until now, SRI methods have been tested, demonstrated and expanded. SRI paddy yields have been measured on site and then are converted, by adjusting for moisture content, to standard ‘dried unhusked rice’ condition, with 14% moisture content. For comparison, the yields of non-SRI paddy cultivated adjacent to SRI plots -- same variety of rice but with full irrigation -- are carefully measured by the same method and procedures as used with SRI at the same time. Records of SRI paddy yields compared with non-SRI paddy yields since the beginning of evaluation to the present are shown in Table 1. Previous reports of these data have been of harvested paddy, not adjusted for moisture content. This adjustment does not change the ratios of reported yield difference, only absolute levels. For farmers, ratio is more important than yield (how much increase is obtained). Actually, the most important consideration is impact on net income (profitability), discussed in Section IV. The yield-enhancing results of SRI cultivation methods have been highly impressive, achieving an average paddy yield (dried un-husked rice) of 7.8 t/ha in South Sulawesi province, 6.6 t/ha in West Nusa Tenggara province, and 7.1 t/ha in Central Sulawesi province. The yield increment ratio of SRI compared with non-SRI is about 84% on average, ranging between 45% and 175%. As seen from the 2002-2005 data, average paddy yield for the wet-season crop is higher than that of dry-season crop. However, the yield increment ratio, comparing SRI with non-SRI paddy yields, is higher in dry season as seen below:
Wet season paddy: 7.63 t/ha for SRI, while 4.21 t/ha for non-SRI (81.4% increase)
Dry season paddy: 6.96 t/ha for SRI, while 3.75 t/ha for non-SRI (85.5% increase)
The variety of rice shows almost no correlation with yield increment ratio (SRI vs. non-SRI). So far we have found that all varieties responding positively to SRI management methods, although some varieties respond more strongly than others. IV. Comparison of net benefits using SRI methods To clarify the benefits of SRI versus non-SRI cultivation, a calculation of crop budgets was made for the 2005 dry-season crop, taking data from Lombok in West Nusa Tenggara as an example. This was done without considering differences in irrigation cost.
13

Table 1. Average paddy yields (dried un-husked rice) with SRI and without SRI practices, shown by SSIMP-DISIMP scheme from 2002 to 2005
SRI Area Paddy Yield (t/ha) Name of Irrigation Scheme
Area (ha) FarmersCropping Season Variety of
Rice SRI Non-SRI Ratio South Sulawesi 1 Awo-1 0.20 3 DS 02/03 Ciliwung 7.15 4.35 164% Awo-2 5.00 18 DS 03/04 Ciliwung 6.29 3.61 174%
2 Salomekko-1 0.20 1 DS 02/03 Ciliwung 7.92 3.32 239% Salomekko-2 5.00 7 WS 2003 Ciliwung 6.19 3.66 169% Salomekko-3 5.00 10 DS 04/05 Ciliwung 6.69 3.48 192%
3 Kelara Karalloe-1 4.30 6 WS 03/04 Mamberamo 7.45 4.41 169% Kelara Karalloe-2 2.00 1 DS 2004 Mamberamo 8.18 4.17 196% Kelara Karalloe-3 217.90 145 WS 04/05 Mamberamo 7.65 3.83 200%
4 Kiru Kiru-1 1.00 1 WS 03/04 Ciliwung 8.76 3.19 275% Kiru Kiru-2 1.00 1 WS 04/05 Ciliwung 6.80 3.53 193%
5 Sadang-1 5.00 12 WS 2004 Ciliwung 8.11 4.55 178% Sadang-2 77.79 106 DS 04/05 Ciliwung 8.99 4.80 187% Sadang-3 164.89 183 WS 2005 Ciliwung 7.57 4.59 165%
6 Lanrae-1 3.00 4 DS 04/05 Ciliwung 6.80 4.08 167% Lanrae-2 10.00 10 WS 2005 Ciliwung 7.65 4.47 171%
Total/Weighted average 502.28 508 7.79 4.25 184% West Nusa Tenggara 1 Jurang Sate (Lombok) -1 4.37 11 WS 04/05 Ciherang 8.48 5.58 152% Jurang Sate (Lombok) -2 74.95 216 DS 2005 Ciherang 6.44 3.94 164%
2 Jurang Batu (Lombok) -1 5.06 12 WS 04/05 Ciliwung 6.66 4.98 134% Jurang Batu (Lombok) -2 103.42 241 DS 2005 Ciliwung 5.59 2.62 213%
3 Lombok (other 8 sites) 41.24 123 DS 2005 Ciherang 5.56 3.95 141% 4 Tiu Kulit (Sumbawa) -1 1.50 2 WS 02/03 IR-64 7.37 5.10 145% Tiu Kulit (Sumbawa) -2 2.62 10 WS 04/05 Ciherang 9.00 4.49 200% Tiu Kulit (Sumbawa) -2 5.07 5 DS 2005 Ciherang 7.20 4.06 177%
5 Batu Bulan (Sumbawa) -1 0.16 1 DS 2004 IR-64 8.02 4.51 178% Batu Bulan (Sumbawa) -2 11.38 42 WS 04/05 Ciherang 8.45 4.73 179% Batu Bulan (Sumbawa) -3 61.55 128 DS 2005 Ciherang 8.30 3.95 210%
Total/Weighted average 311.32 791 6.55 3.59 183% Cenral Sulawesi 1 Karaopa -1 37.00 37 DS 04/05 Ciliwung 8.10 4.02 203% Karaopa -1 493.00 493 DS 2005 Ciliwung 6.90 3.70 187%
2 Sinorang -1 8.00 8 DS 04/05 Ciherang 6.10 4.10 149% Sinorang -2 12.00 12 DS 2005 Ciherang 5.60 3.60 156%
Total/Weighted average 555.00 555 7.10 3.81 186% Grand Total/Weighted average 1,363.6 1,849 7.23 3.92 184%
Note: WS= Wet Season, DS=Dry Season * = Dried un-husked rice (moisture content 14%)
If irrigation reductions and savings are incorporated into this calculation, the favorability of SRI would be further increased. As seen in Table 2, the production cost for paddy cultivation under SRI is about 24% less than that for non-SRI cultivation mainly due to a decrease in material costs, i.e., 90% reduction for seeds and 50% reduction for chemical fertilizers and pesticides. Net returns increased by about 5.1 times for SRI compared to non-SRI methods.
14

Table 2. Crop budget analysis of SRI versus non-SRI paddy cultivation in dry-season cropping in West Nusa Tenggara Province, 2005
Non-SRI SRI Item Unit
Qt’y Unit Price
(Rp) Quantity Amount(Rp)) Quantity Amount(Rp)Increase
(%) A Inputs (per ha)
1. Labor 1.1 Human m-d 20,000 166 3,320,000 125 2,500,000 75.3% 1.2 Animal a-d 20,000 16 400,000 16 400,000 100.0% 2. Transportation (paddy)
kg 20 3,940 78,800 6,440 128,000 163.5%
3. Material 3.1 Seeds kg 3,500 50 175,000 5 17,500 10.0% 3.2 Chemical fertilizer
- Urea kg 1,200 250 300,000 140 168,000 56.0% - TSP/SP36 kg 1,600 100 160,000 50 80,000 50.0% 3.3 Pesticides lit 112,000 2 224,000 1 112,000 50.0% 4. Others L.S. 40,000 1 40,000 1 40,000 100.0% Total for A 4,697,800 3,446,300 73.4%
B Output (per ha) Crop production value kg 1,500 3,940 5,910,000 6,440 9,660,000 163.5%
C Benefits (per ha) Net Return (=B-A) 1,212,200 6,213,700 512.6%
Note: Conversion rate: US$ 1 = Rp. 9,000 as of end 2005 To see the potential for increase in income, we note that in the Batu Bulan scheme in the 2005 dry season, the net return for SRI against non-SRI increased by 7.3 times. In general, we calculate that a 50% paddy yield increase with SRI can generate more than 4 times higher net return in comparison with non-SRI cultivation under current East Indonesia economic conditions. V. Irrigation methods for SRI in SSIMP-DISIMP schemes The recommended irrigation method for SRI is intermittent irrigation with a wet-dry cycle that does not maintain standing water (maximum depth of 2 cm). The length of the dry period for SRI paddy fields differs from location to location according to soil conditions (permeability, water-holding capacity, etc.), plot size and shape, availability of irrigation water, rainfall condition, and so forth. In SSIMP-DISIMP schemes, dry period for intermittent irrigation has been determined through trial-and-error. The indicator for restarting irrigation delivery is the size of cracks appearing on the soil surface of paddy fields, especially for clay or loamy soils. Actual practice for intermittent irrigation with SRI at present is quite variable by scheme as shown in Table 3. In order to determine the irrigation intervals that will optimize both high paddy yields and water saving simultaneously, the project has established a research program with controlled field testing, starting in 2005, as reported in the next section.
15

Table 3. Intermittent irrigation with SRI in SSIMP-DISIMP schemes, 2005 dry-season cropping
Intermittent Irrigation Type Moist (days) Dry (days)
Name of SSIMP-DISIMP Schemes
A 10 4 Salomekko, Awo, Kiru Kiru, Lanrae B 8 7 Sadang C 4 3 Kelara Karalloe D 4 10 Tiu Kulit, Batu Bulan E 3 7 Jurang Sate, Jurang Batu,
VI. Experiment assessing irrigation water requirements In order to obtain precise measurements of water use when using SRI cultivation methods in comparison with non-SRI practice, a SRI experimental station was established during June-September 2005. The water management testing program is being implemented for two years through 2007. The general features of the station are as follows:
Name of station: Sambelia SRI Experimental Station, DISIMP Location: East Lombok district, West Nusa Tenggara province Soil condition Sandy loam Irrigation system: Supply water to each plot by buried pipeline from
overhead tank (5 m3 capacity) pumping up from groundwater tubewell
Test plot: 24 plots, each 5 m x 5 m (25 m2) in area
The first measurement of water consumption for SRI versus non-SRI was started in test plots in the Sambelia station in October 2005. To compare the effects of irrigation interval on paddy yields between SRI and non-SRI cultivation, conditions of both SRI and non-SRI lots were arranged to be equal. Applications of chemical fertilizers were at the same level for both plots (200 kg/ha of urea, 36 kg/ha of TSP, and 50 kg/ha of KCl).
An outline of the observation program for the first set of tests is shown in Table 4.
16

Table 4. Field tests of intermittent irrigation for SRI and non-SRI practices at Sambelia Experimental Station, 2005/2006
SRI Non-SRI Item
Case-1 Case-2 Case-3 Case-4 Transplanting method
Variety of rice Ciherang Ciherang Ciherang Ciherang Seedlings (age after seeding) 10 days 10 days 25 days 25 days Number of plants/hill 1 1 4 4 Spacing 30 x 30 cm 30 x 30 cm 20 x 25 cm 20 x 25 cm
Planting schedule Date of transplanting 11 Oct. 2005 11 Oct. 2005 26 Oct. 2005 26 Oct. 2005 Date of harvest 3 Feb. 2006 4 Feb. 2006 3 Feb. 2006 4 Feb. 2006
Results of measurement Total amount of irrigation water
816 mm 1,152 mm 1,368 mm 1,136 mm
Paddy yield (dry un-husked rice)
5.12 t/ha 4.46 t/ha 2.95 t/ha 3.40 t/ha
The following figures show the facility and the growing crops:
Irrigation supply measuring tank 21 days after transplanting (SRI) 110 days after transplanting (SRI)
Irrigation schedule during the vegetative growth stage for each case was set as follows.
Case-1 (Sri transplanting) : Intermittent irrigation with 5-day wet and 10-day dry cycle
Case-2 (Sri transplanting) : Intermittent irrigation with 10-day wet and 5-day dry cycle
Case-3 (non-Sri transplanting) : Continuous irrigation Case-4 (non-Sri transplanting) : Intermittent irrigation with 10-day wet and 5-
day dry cycle
For all cases, continuous irrigation was applied during the reproductive stage. Irrigation water supply for all cases was stopped on 1 January 2006, or 20 days earlier than the schedule, owing to ample rainfall in January 2006.Irrigation pattern for each case is illustrated below.
17

Oct. 2005 Nov. 2005 Dec. 2005 Jan. 2006 Feb. 2006
Transplanting Harvest3 Feb. 11 Oct. Case-1
Case-2 Case-3 Case-4
11 Oct. 4 Feb.
26 Oct. 3 Feb.
26 Oct. 4 Feb.
Total amount of water supplied are 816 mm for Case-1, 1,152 mm for Case-2, 1,368 mm for Case-3 and 1,136 mm for Case-4.
Although the observation data are limited and further observations are being conducted, the following findings can be reported from the first trial results above.
1. The SRI method can definitely offer higher paddy yields than non-SRI practices; there was a 75% increase with SRI in these trials.
2. SRI paddy yields decrease when the dry periods are shorter, and they increase when the dry periods are longer.
3. If intermittent irrigation is applied to non-SRI plots, paddy yield can be increased by 15% compared with continuous flow irrigation. (compare case-3 with case-4)
4. Higher paddy yields by SRI over non-SRI cultivation may be the result of the combined effects of (a) SRI transplanting practices, and (b) intermittent irrigation with sufficient dry periods.
5. The water-saving potential of SRI (intermittent irrigation during the vegetative growth stage) versus non-SRI cultivation (continuous irrigation) will justify ~40% reduction in water consumption at the field level during the growing stage.
6. Further savings may be found possible if experiments show that continuing some form of reduced irrigation during the reproductive stage is feasible.
VII. Water-saving effects of SRI According to the observations on irrigation water use with SRI cultivation in SSIMP-DISIMP schemes and considering the test results reported above, it can be suggested that the SRI water-saving effects are achieved by a combination of the following three factors.
(1) Water-saving during land preparation Land preparation (LP) is usually performed twice for both methods. The first LP
method and amount of irrigation water supplied shows no difference between SRI and non-SRI. However, the second LP operation (puddling) uses more water for non-SRI paddy fields due to the practice of keeping standing water 5 to 10 cm deep. With SRI cultivation, standing water after the second LP is not
18

necessary. The total amount of water savings at this stage is estimated to be about 800 - 1,000 m3 per ha.
(2) Water-saving during nursery preparation For non-SRI transplanting, mature seedlings of 25-30 days age are used. Nursery
beds are commonly set at the corner of the main paddy field for easy transportation of large-sized seedlings. To supply water to nursery beds for one month, it is necessary to supply irrigation water to the whole paddy field continuously. The total amount of irrigation water supplied during nursery preparation is estimated to be 2,000-3,000 m3 per ha. Only a small fraction of this amount of water is necessary for SRI nursery management.
(3) Water-saving by intermittent irrigation Water consumption during the rice plants’ growing season after transplanting is
much less for SRI than for non-SRI practices. Through field tests and observations, the reduction is about 40%. In general, dry periods for intermittent irrigation should be shorter for permeable soils due to their lesser moisture-holding capacity. On the other hand, it is possible to extend dry periods longer with less permeable soils or with soils that have greater moisture-holding capacities. There can be more water-saving on such soils compared with permeable soils. As the application of organic fertilizer (compost) can improve the moisture- holding capacity of soils, this can also contribute to more water-saving. With the better plant root systems established by SRI methods, we may find it possible to extend intermittent irrigation beyond panicle initiation without sacrifice in yield thereby achieving further water-saving.
VIII. Lessons learned The main lessons learned from three years of experience with SRI cultivation in SSIMP-DISIMP schemes in eastern Indonesia are as follow:
1. SRI methods can offer higher paddy yields with lower production costs (seeds, chemical fertilizers, pesticides), therefore generating higher profits to farmers.
2. The labor burden is increased with SRI, at least initially. However, farmers are willing to overcome this disincentive by considering the positive incentives arising from the much higher productivity of SRI paddy cultivation (see Section IV).
3. Higher paddy yields can be obtained with SRI methods without using organic fertilizers, i.e., just with reduced chemical fertilizer use. While the use of organic sources of nutrients is preferable, this is not a necessary component of SRI. Biomass for composting or mulching is often not available, so if the use of organic fertilizers is made a requirement for SRI, its expansion under current conditions is limited. Organic fertilization should be regarded as a desirable option but not as a prerequisite to practice SRI.
4. SRI cultivation saves water lowering crop water consumption requirements by 40% (variable by soil and field conditions) by applying intermittent irrigation. However, farmers will never agree to let their fields dry out without having
19

reliable, assured access to water sources. Therefore, the introduction of SRI at the initial stage should be within irrigation areas that are in relatively good operating conditions so that SRI extension can proceed smoothly.
5. For successful introduction of SRI, the involvement of local government offices as well as of experts (consultants) is necessary for giving good technical support and advice.
The water-saving effects of SRI cultivation -- more or less 40% vs. non-SRI practices -- has been confirmed by field tests as well as by field observations in many SSIMP-DISIMP schemes sites. Unfortunately, SRI paddy plots and non-SRI paddy plots are mixed within these scheme areas like “patch work.” This makes it difficult for farmers to control – and to minimize – their water applications as recommended. If all the paddy fields served by a single off-take were to be cultivated with SRI methods, it should be possible to reduce the amount of water distribution considerably more than achieved this far.
Until entire command areas practice SRI, the following measures are preferable for introduction to realize equitable water distribution and more efficient use of valuable water resources within irrigation schemes.
1. Many irrigation systems have a common problem of inequitable water distribution, i.e. the over-tapping of channel flows by upstream users resulting in water shortages downstream. The introduction and expansion of SRI in the upstream areas of schemes has the potential to generate irrigation benefits for downstream users by decreasing the water consumption of upstream farmers, and thus increasing the amount of water available for downstream areas. Thus, more sustainable and equitable water distribution within irrigation schemes can be achieved through farmers’ participation in SRI, what can be called a “sustainable participatory water-saving approach.”
2. The expansion of SRI should be particularly attractive with groundwater irrigation. Since such water is relatively more expensive, the reduction in irrigation water requirements that SRI practices permit will be more significant economically. At the same time that pump irrigation technology makes possible more precise water control and application, SRI is creating incentives to reduce water use. This will be important where groundwater extraction is currently excessive and is lowering water tables.
3. For dam or pond irrigation schemes, palawija (non-rice) crops are usually recommended during the dry season to obtain more efficient use of the limited, expensive water. However, farmers have a predisposition to plant paddy during the dry season anyway, even though extension offices advise them otherwise. Due to the fact that water consumption under SRI is much less than for non-SRI cultivation, farmers can be allowed to plant paddy even in the dry season on condition that SRI methods are utilized.
The possibilities that SRI is opening up to raise the production of land, labor, capital and especially water used in irrigated rice cultivation should enable farmers, planners, technicians and policy-makers to refashion this sector in ways that are more beneficial, equitable and sustainable.
20

Achieving this potential will require further improvements in irrigation infrastructure and management capacities, to give farmers and water managers the ability to utilize smaller but reliable amounts of water as needed for the sustainability of crops and beneficial soil organisms. It will also require rethinking and strengthened capacities for research and extension programs and for appropriate policy formulation and implementation in the agricultural sector.
The environmental implications of such changes and redirections have not been addressed here, but one can foresee only advantages, and no disadvantages, for the conservation of natural ecosystems and biodiversity from reducing the ‘thirstiness’ of irrigated rice cultivation. References Sato, Shuichi. 2005. System of rice intensification (SRI): 3 years’ experience of SRI practice under DISIMP: Paper for ADB Workshop of Integrated Citarum Water Management Project, 4-5 July 2005, Jakarta. Subbaidah, S.V., Kumar, K. Mahendra and Bentur, J.B. 2006. DRR’s Experience of SRI method of rice cultivation in India: Paper for International Dialogue on Rice and Water: Exploring options for food security and sustainable environment, IRRI, Los Bańos, Philippines, March 7-8, 2006. Uphoff, N., Koma Saing Yang, Gypmantasiri, P., Prinz, K. and Kabir, H. 2000. The System of Rice Intensification (SRI) and its relevance for food security and natural resources management in Southeast Asia: Paper for the International Symposium on Sustaining Food Security and Managing Natural Resources in Southeast Asia: challenges for the 21st Century, Chiang Mai, Thailand, January 8-11, 2000. Uphoff, N. and Randriamiharisoa, R. 2002. Reducing water use in irrigated rice production with the Madagascar System of Rice Intensification: Water-Wise Rice Production: Proceedings of the International Workshop on Water-Wise Rice Production, 8-11, 2002. Uphoff, N. 2004. SRI - System of Rice Intensification: An Opportunity for Raising Productivity in the 21st Century: Paper for International Year of Rice Conference, FAO, Rome. February 12-13, 2004. Uphoff, N. 2006. The System of Rice Intensification (SRI) as a methodology for reducing water requirements in irrigated rice production: Paper for International Dialogue on Rice and Water: Exploring Options for Food Security and Sustainable Environment, IRRI, Los Bańos, Philippines, March 7-8, 2006.
21

WATER PRODUCTIVITY OF RICE AS INFLUENCED BY INTERMITTENT PONDING AND INTENSITY OF PUDDLING
S. Sarkar1 and A. Chakraborty2
Abstract In Lower Gangetic Plain of India-Bangladesh cultivation of irrigated rice during January-end to April-end coupled with low water price (40 US$ ha-1 per cropping season) is responsible for 3-9 m depletion (within a period of 10 years) in aquifer water level as well as concentration of arsenic above the critical level (> 0.05 mg l-1). This has become a severe problem in the tube well commands of the plain. Thus to conserve the ground water resource through enhancement of water productivity of rice, two sets of field experiments were carried out during 1997 to 1999. Under experiment one, irrigation period of rice was divided into three stages as: early (S1, 10 – 35 days after transplanting, DAT); middle (S2, 36 –60 DAT) and late (S3, 61 – 85 DAT). Intermittent ponding (IP) was imposed either at single: early (I2), middle (I3) or late (I4) stage or at two stages as: early plus middle (I5), early plus late (I6) or middle plus late (I7) stages. Besides, there were two other irrigation regimes, i.e., Continuous ponding (CP, I1) or IP (I8) monitored through out the irrigation period. Though highest grain yield (6.71 Mg ha-1) was obtained under I1, but this regime was responsible for the lowest water productivity (WPIP). In contrast, WPIP touched the maximum point (0.541 Kg m-3) under I8 regime but this regime recorded lowest (5.18 Mg ha-1) grain yield. That way I2 resulted in higher (0.529 kg m-3) WP along with insignificant reduction in yield over I1. In the second experiment, three types of puddling practices were evaluated as: i) High intensity puddling (HIP) –puddling was done with power tiller rotavetor; ii) moderate intensity puddling (MIP) – tractor drawn cultivator with cage wheel was used for puddling operation; and iii) Low intensity puddling (LIP) – puddling was done by bullock drawn wooden plough. On an average, HIP resulted in lowest value (6.5 mm d-
1) of percolation rate. The same increased by 19% and 36.5% respectively under moderate and low intensity puddlings. Both grain yield (6.93 Mg ha-1) and WP (0.597 kg m-3) attained highest value under HIP. Decrease in puddling intensity under MIP and LIP lowered down the yield by 2.97 and 17.75% respectively. In case of WPIP the reduction was 16.27 and 54.66%. A regression analysis amalgamating results of both the experiments showed actual water expense in relationship with grain yield (R2 = 0.35) and water productivity (R2 = 0.60). Keywords: Intermittent ponding, puddling, percolation, rice (Oryza sativa L.), water productivity.
1Department of Agricultural Meteorology and Physics, 2Department of Agronomy, Bidhan Chandra Krishi Viswavidyalaya, Mohanpur, India, 741252. Email: [email protected]
22

Introduction The Lower Gangetic Plain (LGP), which spread over eastern India and Bangladesh, is a major rice growing area. Around 1.5 times more yield motivates the farmers of this region to grow irrigated rice during dry season (known as summer rice) at a time (middle of January to end of April) when the atmospheric evaporative demand is high (3-5.5 mm d-1). In the state of West Bengal, India, since last 35 years cultivated area of summer rice increased by 822 percent. To meet up the higher irrigation need with low cost (US$ 40 ha-1) water, farmers are overexploiting the ground water resource. As a result aquifer water level depleted by 3-9 m and arsenic concentration in ground water of 85 blocks of the state crossed the critical limit (>0.05 mg l-1) affected 14-16 million people (Sanyal and Nasar, 2002). This is happening at a time when, Toung and Bouman (2003) have estimated that by 2025, 2 million ha of dry season irrigated area of Asia may experience physical water scarcity.
Introduction of intermittent ponding in place of continuous ponding can reduce the demand of irrigation water by rice (Bouman and Toung, 2001; Belder et al., 2004). It has been reported (Mishra et al. 1990; Sarkar 2001) that, in India intermittent ponding (IP) resulted in an insignificant reduction in yield and saved 15-20 cm of irrigation water over continuous ponding(CP). However in subtropical areas of China, IP has not affected yield level or even increased it as compared to CP (Li, 2001). Percolation loss of water from rice fields is a major reason for lower water use efficiency (WUE) of rice. Sharma and Bhagat (1993) recorded linear relationship between vertical soil water flux with depth of puddling. Variation in puddling intensity decreased percolation loss to the tune of 54-58% (Kukal and Aggarwal, 2002). With this background the present study was carried out to maximize the use efficiency of water input by i) identification of stress allowable stage(s) of rice crop where intermittent ponding can be practiced in place of continuous ponding and ii) reduction in percolation loss by suitable puddling operation.
Materials and Methods Two sets of field studies were carried out during 28th January to 17th April of 1997 to 1999 at the Central Research Farm of Bidhan Chandra Krishi Viswavidyalaya (Latitude 22o 58/ N, Longitude 88o 31/ E, altitude 9.75 m amsl) Gayeshpur, India. Soil was sandy loam Aeric Haplaquept. Hydro-physical properties of the soil are presented in Table 1. Atmospheric evaporative demand during crop growing period of each experimental year is presented in Fig. 1. Rice (Oryza sativa L.) variety Satabdi was taken as a test crop. In each year crop was transplanted on 28th January. Fertilizer dose for the crop was 100:60:40 kg per ha as N:P2O5:K2O. Individual plot size was 10 x 10 m2.
23

Table 1. Textural status, bulk density and saturated hydraulic conductivity of different horizons of the soil profile
Textural groups (per cent) Soil layers,
mm Sand Silt Clay B.D.,
Mg m-3 Saturate hydraulic
conductivity, cm hr-1 0.0-17 50.14 17.23 32.63 1.42 4.3 17-31 36.32 28.64 35.04 1.48 1.8 31-44 32.26 26.37 41.37 1.51 1.5
44 – 62 42.13 22.18 35.69 1.49 2.8 62 -120 66.85 10.42 22.73 1.47 7.2
In the first experiment, irrigation period of rice was divided into three stages as: early (S1, 10 – 35 days after transplanting, DAT); middle (S2, 36 –60 DAT) and late (S3, 61 – 85 DAT). A depth of 3 ± 2 cm water was maintained under continuous ponding (CP). In
01234567
1 3 5 7 9 11 13 15
Weeks after transplanting
E pan
(mm
)
1997 1998 1999
Fig. 1. Pan evaporation status during the crop growing period
case of intermittent ponding (IP), irrigation was given when soil matric potential (Ψm) at 0.15 m depth reaches to – 0.02 M Pa. IP was imposed either at single: early (I2), middle (I3) or late (I4) stage or at two stages: early plus middle (I5), early plus late (I6) and middle plus late (I7) stages. Besides there were two other irrigation regimes, i.e., CP (I1) or IP (I8) monitored throughout the irrigation period. Eight sets of treatments were laid out in randomized block design with three replications. In this study puddling was done by tractor drawn cultivator with cage wheel, which is practiced by the local farmers.
In case of the second experiment performance of three types of puddling
practices were evaluated viz.: i) High Intensity Puddling (HIP) – puddling was done with power tiller rotavetor with 9 cm depth of puddling; ii) Moderate Intensity Puddling (MIP) – tractor drawn cultivator with cage wheel was used for puddling operation where the puddling depth was 15 cm; and iii) Light Intensity Puddling (LIP) –puddling was done by bullock drawn wooden plough with 9 cm depth of puddling. Each treatment was replicated eight times and was laid out in randomized block design. At the time of puddling soil-water mixture was collected with the help of a glass tube (both side opened) to measure the puddling index (PI). The mixture was kept in a 50 ml
24

measuring cylinder. From each plot sampling was done from 6 to 7 points. Cylinders were kept on tables for three days and the top of the cylinder was covered with polyethylene sheet to check the evaporation loss. After three days total volume of liquid plus solid and total volume of solid were recorded.
Puddling index = Volume of soil solids / Total volume (1)
In the plots two types of drums (40 cm diameter and 45 cm depth) were placed in one case the bottom was opened and in the other bottom was closed. At the center of each drum three rice plants were transplanted. Hydrological environment in the drums were maintained like that of the plots. Percolation rate was measured by deducting the fall of water depth from closed bottom drum from the fall of water level in open bottom drum in a day. Depth of irrigation was calculated by following the formula of Chaudhary (1997) as:
Di = (θs - θi) Dr + Ds (2)
Where, Di is depth of irrigation (mm); Dr is depth of root zone (mm); Ds is the depth of submergence required (mm), which was 50 mm; θs is average volumetric soil water content (m3 m-3) of the root zone at saturation and θi is the average volumetric soil water content (m3 m-3) at the time of irrigation. The term (θs - θI) gives the volume of water required to raise the water content of a unit volume of soil to saturation.
Temporal variation in percolation loss and grain yield of rice was recorded. Total water applied was computed by adding total rainfall and amount of water used for irrigation during the cropping period.
Water productivity (WPIP, kg m-3) was calculated as grain yield per unit total water input (irrigation and precipitation) and expressed as:
WPIP = k x AWIGY (3)
where GY is grain yield (Mg ha-1), AWI (mm) is actual water inflow (irrigation applied + rainfall) during the crop growing period, k is a unit constant equal to 100.
Statistical analysis consisted of analysis of variance (ANOVA) with different treatments. During the entire cropping period total rainfall amount was 292.7, 292.65 and 12.3 mm respectively during 1997, 1998 and 1999. Water productivity WPIP
Results and Discussion Under I1 regime crop never exposed to water stressed situation and thus resulted in maximum (6.71 Mg ha-1) average yield (Table 2). When crop was exposed to IP during stage 1 (I2) an insignificant decrease in yield was observed. Non-stress water environment in subsequent stages (S2 and S3) probably helped the crop to over come the ill effect of water stress that was imposed in stage1. Intermittent ponding reduced the
25

unproductive water outflow like percolation loss but does not have any significant impact on transpiration rate, as a result yield remains unchanged. This logic can be supported by the findings of Bouman et al. (2006). Imposition of IP during stage 2 (I3) reduced the yield by 13.5 percent over I1, which proves that maximum tillering to grain formation is the most critical crop stage in response to soil water stress. Yield reduced by 16 – 22 percent under I5, I6 and I7 regimes, where IP imposed during two growth stages. In spite of highest grain yield under I1, highest amount (1366 mm) of water inflow made this regime most inefficient (0.493 kg m-3) in terms of water productivity (WPIP). Values of WPIP follows similar trend like that of grain yield. In case of I2 higher grain yield with moderate irrigation water use resulted in higher (0.53 kg m-3) magnitude of WPIP. IP at a single stage helps in cutting one-tenth irrigation requirements of the crop. Comparison of data over the years shows that moisture stress had grater impact on productivity and water requirement when crop received nominal rainfall (Table 2).
Table 2. Impact of intermittent ponding on irrigation requirement, grain yield (GY), water productivity (WPIP) and percent irrigation saved (PIS) for rice
Irrigation* (mm)
GY ( Mg ha-1) WPIP (Kg m-3) Treatments
1997 1998 1999 1997 1998 1999 1997 1998 1999
PIS over I1
I1 (C-C-C) 1050 1000 1450 6.71 6.87 6.56 0.511 0.524 0.449
I2 (I-C-C) 950 850 1300 6.48 6.72 6.23 0.534 0.579 0.475 10.92
I3 (C-I-C) 900 850 1300 5.93 6.05 5.75 0.510 0.521 0.438 12.38
I4 (C-C-I) 950 900 1300 6.21 6.31 5.94 0.512 0.521 0.453 9.40
I5 (I-I-C) 750 700 1150 5.73 5.87 5.38 0.526 0.580 0.463 28.27
I6 (I-C-I) 800 750 1150 5.85 6.13 5.43 0.551 0.578 0.467 24.40
I7 (C-I-I) 750 750 1150 5.61 5.63 5.28 0.554 0.530 0.454 26.36
I8 (I-I-I) 700 600 1000 5.41 5.32 4.82 0.562 0.584 0.476 41.62
LSD (p = 0.05)** Year (Y) = NS***, Irrigation (I) = 0.2404, Y X I = 0.3398 *100 mm water was used for puddling operation, which includes in irrigation **LSD: Least significant difference, ***NS: Non significant
In the second experiment, highest (78.8) value of puddling index (PI) obtained when puddling was done by two passes of power tiller rotovetor (HIP) (Table 3). With the decrease in intensity of puddling, magnitudes of PI decreased by 23 and 112 percent
26

Table 3. Impact of puddling intensity on puddling index, irrigation requirement and percent irrigation saved or overused (PISO) as compared to medium intensity puddling (MIP) for summer rice
Puddling index Irrigation applied (mm) Treatments
1997 1998 1999 1997 1998 1999 PISO (%)
HIP 77.8 80.5 78.0 900 850 1150 - 17.24 MIP 64.2 64.0 63.5 1050 1000 1350 0.00 LIP 36.7 37.2 37.5 1250 1200 1600 + 19.19
LSD (p = 0.05) Year (Y) = Non Significant Puddling (P) = 12.85 Y X P = 4.72
respectively under MIP and LIP treatments. These observations supported the findings of Tripathi et al. (2005). Throughout the crop growing period percolation rate was lowest (5.6 to 7.1 mm d-1) under HIP (Fig. 2). In the beginning (15 DAT) percolation rates under MIP and LIP were 21 and 64 percent higher respectively over HIP (Fig. 2.). Better orientation of soil particles under HIP resulted in elimination of large pores and thereby decreasing hydraulic conductivity to the maximum extent (Sarkar and Rana, 1999). With the
0
5
10
15
0 20 40 60 80
Days after transplanting
Perc
olat
ion
rate
(mm
day
-1)
HIP MIP LIP
Fig. 2. Impact of puddling intensities on temporal changes of percolation rate
advancement of time (75 DAT) variation in PI under different treatments narrowed down to 3 to 14 percent. Such trend confirms the findings of Kukal and Aggarwal (2002). Formation of root mass, swelling and shrinkage of soil reduced the impact of puddling intensity at the later part of the crop as a result, irrespective of treatments magnitude of percolation rate lowered down with the advancement of cropping period. Highest grain yield (6.93 Mg ha-1) was obtained under HIP (Table 3). Adoption of HIP in place of
27

Table 4. Impact of puddling intensity on grain yield and water productivity of summer rice
Grain yield (Mg ha-1) Water productivity (Kg m-3) Treatments 1997 1998 1999 1997 1998 1999
HIP 6.94 7.02 6.85 0.597 0.604 0.590
MIP 6.73 6.79 6.67 0.513 0.518 0.490
LIP 5.92 6.11 5.87 0.391 0.404 0.364
LSD (p = 0.05) Year (Y) = NS Puddling (P) = 0.2821 Y X P = 0.4128
conventional puddling (MIP) though enhanced yield only by 3 percent, but resulted in 17 percent increase in WPIP. Both grain yield and WPIP receded by 13 and 19 percent respectively under LIP as compared to MIP. Three years database of AWE, yield and WPIP evolved from both the experiments have been coupled together for regression analysis. Quadratic relationship (Eq. 4) has been found between grain yield and AWE (Fig. 3). The nature of the curve is downward concave. This means at low AWE values: Grain yield = -7E-06 AWE2 + 0.0191AWE - 6.4277 R2 = 0.35 (4)
4
5
6
7
8
800 1000 1200 1400 1600 1800
Actual water inflow (mm)
Yiel
d (M
g ha
-1)
Fig. 3. Actual water inflow and grain yield relationship under different irrigation management and puddling practices
WPIP = -3E-07 AWE2 + 0.0005AWE + 0.356 R2 = 0.60 (5)
grain yield increases with the increase in ASW. However after attaining the maximum yield point the grain yield declines even with the increase in AWE. However the
28

relationship between WPIP and AWE is linear (Eq. 5). In the entire range of AWE, WPIP decreased linearly with the increase in AWE (Fig. 4).
0.30.350.4
0.450.5
0.550.6
0.65
800 1000 1200 1400 1600 1800
Actual water inflow (mm)
WP I
P (k
g m
-3)
Fig. 4. Actual water inflow and water productivity (WPPI) relationship under different irrigation management and puddling practices
Summary 1. Imposition of intermittent ponding in early crop stage only can improve water productivity factor without significant decrease in yield. 2. In Bengal basin maximum tillering to grain filling is the most sensitive stage of summer rice to water stress. 3. High intense puddling by power tiller rotavetor can improve both water productivity and grain yield. 4. Adoption of intermittent ponding at early stage saved 260 mm of water. In case of intense puddling, the saving was 150 to 350 mm.
Conclusion
An amount of 150 mm of irrigation water can be saved for irrigated summer rice in the Lower Gangetic Plain of eastern India either by imposition of intermittent ponding at early vegetative stage or by intense puddling through power tiller rotovetor. References Belder, P., Bouman, B.A.M., Cabangon, R., Guoan, Lu., Quilang, E.J.P., Yuanhua, Li., Spiertz, J.H.J. and Toung, T.P. 2004. Effect of water saving irrigation on rice yield and water use in typical lowland conditions in Asia. Agricultural Water Management. 65:193-210.
29

Bouman, B.A.M. and Toung, T.P. 2001. Field water management to save water and increase its productivity in irrigated lowland rice. Agricultural Water Management. 49:11-30. Bouman, B.A.M., Peng, S., Castaeda, A.R. and Vispears, R.M. 2006. Yield and water use of irrigated tropical aerobic rice systems. Agricultural Water Management. 74:87-105.
Chaudhary, T. N. 1997. Water management for rice for efficient production. Bulletin. Directorate of Water Management Research, Patna, India, pp 63. Kukal, S.S. and Aggarwal, G. C. 2002. Percolation losses of water in relation to puddling intensity and depth in a sandy loam rice (Oryza sativa) field. Agricultural Water Management. 57:49-59. Li, Y.H. 2001. Research and practice water saving irrigation for rice in Chaina. In: Barker, R., R. Loeve, Y. Li and t.P. Toung. (Eds.), Proceedings of an International Workshop on Water Saving Irrigation for Rice. 23-25 March, Wuhan, China, pp. 25-53. Mishra, H. S., Rathore, T.R. and Pant, R. C. 1990. Effect of intermittent irrigation on ground water table contribution, irrigation requirements and yield of rice in Mollisols of Tarai region. Agricultural Water Management. 18:231-241. Sanyal, S. K. and Nasar, S.K.T. 2002. Arsenic contamination in ground water of West Bengal (India): Build-up in soil-crop systems. In: Analysis and Practice in Water Resources Engineering of Disaster Mitigation. New Age International (P) Publishers, New Delhi, pp. 216-222. Sarkar, S. 2001. Effect of water stress on growth, productivity and water expense efficiency of summer rice. Indian Journal of Agricultural Science. 71:153-158. Sarkar, S. and Rana, S.K. 1999. Role of tillage on productivity and water use pattern of rice-wheat cropping system. Journal of Indian Society of Soil Science. 47:532-534. Sharma, P. K. and Bhagat, R. M. 1993. Puddling and compaction effects on water permeability of texturally different soils. Journal of Indian Society of Soil Science. 41:1-6. Tuong, T.P. and Bouman, B.A.M. 2003. Rice production in water scarce environments. In Kinje, J.W., Barker, R. and Molden, D. (Eds.) water productivity in agriculture:Limits and Oppertunities for Improvement. CABI Publishing, UK, pp. 53-67. Tripathi, R.P., Sharma, P. and Singh, S. 2005. Tilth index: an approach to optimize tillage in rice-wheat system. Soil and Tillage Research. 80:125-137.
30

EFFICIENT USE OF RAINWATER IN RAINFED RICE-BASED CROPPING SYSTEM IN EASTERN INDIA
L. P. Pholane1, Sudhindra N. Panda2* and Laxmi N. Sethi1
Abstract
About 70 % of the total cultivable land in eastern India is under rainfed agriculture. Two-third of the total annual rainfall (1500 mm) is concentrated in monsoon season (June to September). Yearly variation of the rainfall distribution pattern, uncertainty in onset and withdrawal of monsoon and the intra-seasonal moisture stress greatly influence the agricultural production system in this region. In addition, the rolling topography and inadequate dike heights in the rice field without rainwater storage structures have affected the rainfed crops in upland areas whereas lowlands suffer from prolonged land submergence during monsoon season. In rice fields, the major loss of water occurs by surface runoff, lateral seepage through dikes, and the vertical deep percolation. So, it is imperative to have the on-farm reservoirs (OFR) for rainwater harvesting and recycling for supplemental irrigation to upland rainfed rice and for cultivating non-rice crops in winter season and simultaneously growing fish in the OFR water. In the present study, lined (low density polyethylene sheets) and unlined OFRs were used to compare the water saving measures by minimizing seepage and percolation losses. Optimum water requirement for sustainable production of rice is determined by the variation of weir heights, which controls runoff from the field to the OFRs leads to different soil water regimes in the crop fields. The availability of water in the OFR depends on the storage capacity of the reservoir as affected by lining or without lining of the reservoir and weir heights. The field experimental study was carried out during 2003-04 at the Agricultural and Food Engineering Departmental farm of the Indian Institute of Technology, Kharagpur, India. The experiment comprises six treatments; consisting of two main factors lined (L1) with low density polyethylene and unlined (L2) OFRs with three weir heights (H1 = 0 cm, H2 = 5 cm, H3 = 10 cm) in split-plot design with three replications. The area occupied by the OFR is 10% of the each plot (40 × 20 m2) with 30 cm dike height around the plot. The depth and side slope of the OFR are 2.4 m from the ground surface and 1:1, respectively. Supplemental irrigation depth of 5 cm at the critical growth stage of rainfed monsoon rice and winter mustard (Brassica campestris L.) of duration 101 and 87 days, respectively, was provided from the OFR when the soil moisture content falls 20% below available soil moisture content. The OFRs were stocked at 15625 fingerlings ha-1 with three different fish species viz. rohu (Labeo rohita), catla (Catla catla) and mrigal (Cirrhinus mrigala) in the month of July. The cost incurred for the construction of each lined and unlined OFRs was Rs. 6048 (US $1= Rs.44) and Rs. 2100, respectively. The highest yield of rice (3030 kg ha-1) was obtained from the plot with lined OFR having 10 cm weir height,
1Research Scholar, Department of Agricultural and Food Engineering, Indian Institute of Technology, Kharagpur-721302, India 2 Professor, Department of Agricultural and Food Engineering, Indian Institute of Technology, Kharagpur-721302, India (*Corresponding author: Email: [email protected] )
31

which is 65% more than the plot without the OFR. The highest yield of mustard grown with the supplemental irrigation from the lined OFRs with 0 cm weir height was 1102 kg ha-1. The water quantity and quality in the OFRs were also monitored from time to time for the sustainable fish production. The average yields of fish obtained from the lined and unlined OFRs were 3018 and 2270 kg ha-1, respectively. The benefit-cost analysis of rice-mustard-fish culture was used to assess the various economic criteria of the OFR system. For the economic analysis, 10 % bank interest rate and the economic life of the lined and unlined OFR were assumed as 20 and 15 years, respectively. The highest benefit-cost ratios observed were 1.59 in the crop field with the lined OFR (0 cm weir height) and the lowest was 1.4 with the unlined OFR (in all the three weir heights) over the buffer plots (without OFR). The payback periods were found to be 4 and 3 years for the lined and unlined OFRs, respectively. Keywords: Rainwater harvesting, on-farm reservoir, supplemental irrigation, agricultural productivity, economic analysis, benefit-cost ratio. Introduction Eastern India is bestowed with an annual rainfall ranging from 1200 to1700 mm, two-third of which occurring during the monsoon season (June to September). About 50% of the annual rainfall occurs through a few intense storms. The spatial heterogeneity and temporal variability of rainfall leads to differential surface flooding, runoff, erosion and nutrient losses on one hand and water scarcity at the critical crop growth stages on the other hand (Widawsky and O'Toole, 1990; Panigrahi et al., 2003). In rice fields the major loss of water occurs by surface runoff, lateral seepage through dikes, and vertical deep percolation (Walker and Rushton, 1984). The major challenge of the rainfed agriculture is the sustainable management of rainwater so that a favourable environment is created for crop growth. In situ conservation of rainwater in the cropped field, harvesting of excess rainwater in the on-farm reservoirs (OFRs), use of harvested water for supplemental irrigation (SI) to rainfed rice during dry spells and low duty winter crops such as mustard and also rearing fish are some of the rainwater management strategies for increasing the overall agricultural productivity of rainfed eco-system in the region. Rice–fish farming is an age-old practice in India. However, it has not flourished due to several technical and social constraints. Out of 42 million ha of rice-cultivated land in India, about 20 million ha is suitable for adoption of rice-fish integration system and only 0.23 million ha is presently under rice-fish culture (Mohanty et al., 2002). If the area under integrated rice-fish system (Srivastava et al., 2004; Mishra and Mohanty, 2004) and rice-vegetable as well as fish production (Syamsiah et al., 1994) increased, it would help to compensate the economic losses in rice production brought about by natural calamities and also enhance the use of land and water resources without bringing about environmental degradation (Likangmin, 1988). On slopping land, rainwater is usefully conserved by erecting dikes and harvesting runoff water from the field in the OFRs. Variation in weir heights, which controls runoff leads to different soil water regimes in rice fields and storage of water in the OFRs. Rainwater harvested in the OFR is utilized for rearing fish and cultivating non-rice crops in dry winter season. Thus, in order to maximize the water use efficiency
32

of rainfed rice-based cropping system, an in-depth knowledge is required on water dynamics as affected by runoff and the OFR irrigation induced soil water regimes. The availability of water in the OFR depends on the storage capacity of the reservoir as affected by lining of the reservoir and weir heights. However, depending on the storage capacity of the OFRs the non-rice crop is differentially irrigated leading to seasonal variation in soil water regime, which in turn control the availability of water under the crop. The present investigation has, therefore, been undertaken to assess the influence of runoff and OFR irrigation induced soil water regimes on water dynamics under rainfed rice (Oryza sativa L.) and irrigated mustard (Brassica campestris L.) along with fish rearing. Although the impact of soil water regimes on the productivity of rice based cropping system is well conceived, its variation under changing conditions of rainfall distribution, runoff and irrigation from the OFR as well as their impact on the dynamics of water is scarcely understood. It is hardly known for the lateritic tract of eastern India where rice is traditionally adopted as a rainfed crop during monsoon season and a low duty crop like mustard during the post-monsoon dry winter season. Materials and Methods 1. Study Area The site selected for the present study is an agricultural farm of the Department of Agriculture and Food Engineering, Indian Institute of Technology, Kharagpur, West Bengal State of Eastern India. It is located at a latitude of 22o 19' N, longitude of 87o 19' E with an altitude of 48 m above mean sea level. It receives average annual rainfall of 1500 mm; 80% of which occurs in monsoon season . The mean minimum and maximum temperatures are 12oC in January and 40oC in May, respectively. The mean relative humidity ranges from 35.5 to 90.5%. Average size of farm holding of the farmers in the region is 0.8 ha. The dominant soil group is sandy loam (light textured), acid lateritic with pH ranging from 4.8 to 5.6, and poor in organic matter. Average measured values (average over 45 cm depth) of permanent wilting point, field capacity, and saturation moisture content of the soil are 9.3, 26.7, and 37.7 cm m-1, respectively. The soils have very low water holding capacity and dry up quickly after cessation of rainfall. Hence, cultivation of crops on residual moisture is difficult. Rice is the major crop grown in the region during monsoon season covering about 90% of total cultivated area. 2. Experimental Design The present study is undertaken with the main objective of effectively utilizing the rainfall for raising agricultural production in rainfed lands of this region through the OFRs with assured supplemental irrigation (SI) facilities. The field experiment was conducted during year 2002-03, with six treatments, consisting of two main factor low density polyethylene lined (L1) and unlined (L2) OFR with three weir heights( H1 = 0 cm, H2 = 5 cm, H3 = 10 cm) as sub factor in split-plot design with three replications. Each plot 40m×20m size with 30 cm dike height around is considered for the study. Initially square shaped pyramidal 9 lined and 9 unlined OFRs were constructed at one
33

corner of each plot in an area of 10% of the plot size with 1:1 side slope and 2 .4 m depth. One inlet pipe fitted with mechanical water meter is placed in each OFR to quantity the runoff water to the OFR. A staff gauge of 3.0 m long is installed at one corner of each OFR to compute the volume of storage. In addition, piezometers, tensiometers and access tubes are installed in the experimental plots to measure vertical and lateral fluxes components and the soil moisture measurement. 3. Field experiments During the monsoon season, rice of duration 101days, winter season mustard of 87 days duration were grown in the experimental sites. Rice seed at 100 kg ha-1with 20 cm spacing between the rows was sown at the onset day of monsoon. Farmyard manure was applied at 5 ton ha-1with basal dose of 30:45:45 kg ha-1 of N, P2O5 and K2O adjusted through urea, single super phosphate and muriate of potash at the time of sowing. Remaining 30 kg N was applied 30 days after sowing. Mustard seed at 5 kg ha-
1 was sown in line with 20 cm spacing 15 days after harvest of rice with fertilizer dose of 40:20:20 kg ha-1 of N, P2O5 and K2O at the time of sowing. All cultural operations for the crops were followed as recommended. Water balance parameters of the cropped field and the OFR were measured on daily basis throughout the experimental periods. SI was provided from the OFRs when the soil moisture content in the effective root zone of crop was 20% below the available moisture content during critical growth stages. The OFRs were pretreated with lime at 250 kg/ha and recommended doze of fresh FYM, urea and triple super phosphate as proposed by Azim et al. (2001) before fish fingerlings were left in it. The OFRs were stocked at 15625 fingerlings/ha with four different species viz. rohu (Labeo rohita) 40%, catla (Catla catla) 35 % and mrigal (Cirrhinus mrigala) 25%. Yields of the rice grains including the straw yield and that of mustard seeds and its stover were measured at their harvest time for all the treatments. Moreover, the yields of fish of the OFRs were recorded at harvest time, i.e. 5th November, 2003 in unlined OFRs and 3rd January, 2004 in lined OFRs. These data were used for economic evaluation of the OFR irrigation system used in the study. 4. Economic Analysis
In the economic analysis, following items were considered: (i) initial investment (ii) the OFR maintenance cost (iii) irrigation cost (iv) land lease cost for construction of the OFR (v) cost of growing fish in the OFRs and (vi) returns from the OFR system. As proposed by Samra et al. (2002), a present worth analysis is used to evaluate the economics of the OFR. For the economic analysis, 10% interest rate and the economic life of the lined and unlined OFR are assumed 20 and 15 years, respectively. 4.1. Present worth of cost (PWc)
acinvc PWIPW += (1)
34

Where, Iinv is Initial investment and PWac is the present worth of annual cost
∑= +
=n
tac r
APW tt
1 )1( (2)
Where, A is Annual cost, r is interest rate and t is the life span of OFR 4.2. Present worth of benefit (PWb)
∑= +
=n
tb r
PPW tt
1 )1( (3)
Where, P is benefit and t is the life span of OFR
4.3. Net present value of the OFR The net present value (NP) of the OFR is calculated as: cb PWPWNP −= (4) Where, PWb is present worth of benefit and PWc is the present worth of cost. 4.4. Benefit – Cost Ratio of the OFR systems Benefit cost ratio (BCR) is the present worth of benefits divided by present worth of costs.
c
b
PWPWBCR = (5)
Results and Discussion 1. Water level fluctuations in the OFRs Due to stochastic nature of the inflow and outflow components of the field and the OFR water balance, the OFR water level is susceptible to fluctuations. The variation of water level in the OFR with the rainfall during rice growing period was in between range 0.5 to 1.9 m in lined OFR and 0.43 to 1.28 m with unlined OFR (Fig. 1). The corresponding values during mustard growing period were 0.52 to 2.61 m and 0.8 to 2.47 m, respectively (Fig. 2).
35

0
15
30
45
60
75
9023
-Jun
30-Ju
n
7-Ju
l14
-Jul
21-Ju
l
28-Ju
l4-
Aug
11-A
ug18
-Aug
25-A
ug
1-Se
p
8-Se
p15
-Sep
22-S
ep29
-Sep
Date
Rai
nfal
l (m
m)
0.0
0.5
1.0
1.5
2.0
2.5
Wat
er d
epth
(m)
Rainfall (mm) L1H1 (0 cm) L1H2 (5 cm) L1H3 (10 cm)L2H1 (0 cm) L2H2 (5 cm) L2H3 (10 cm)
Fig. 1. The daily variation of water depth in the OFR (lined and unlined) with rainfall during rice growing period 2003-04
0
20
40
60
80
100
120
1-Oc
t
8-Oc
t15
-Oct
22-O
ct29
-Oct
5-No
v12
-Nov
19-N
ov26
-Nov
3-De
c10
-Dec
17-D
ec24
-Dec
31-D
ec
7-Ja
n
14-Ja
n
Date
Rai
nfal
l (m
m)
0.00
0.50
1.00
1.50
2.00
2.50
Wat
er d
epth
(m)
Rainfall (mm) Irrigation (Unlined OFR) Irrigation (Lined OFR)L1H1 (0 cm) L1H2 (5 cm) L1H3 (10 cm)L2H1 (0 cm) L2H2 (5 cm) L2H3 (10 cm)
Fig. 2. The daily variation of water depth in the OFR (lined and unlined) with rainfall during mustard growing period 2003-04
2. Crop and Fish yields Under the rainfed conditions the common parameters of water balance were studied for rice and mustard under both rainfed and supplemental irrigated condition. From the field experiment the variation of yield obtained from the field with lined and unlined OFRs at different weir height treatments was presented in Fig. 3. Based on the cropping, the rice yield was highest (3030 kg ha-1) in the plot with the lined OFR and 10 cm weir height, which is 65% higher than the buffer plot (1833 kg ha-1). The mustard yield was highest (1102 kg ha-1) in the plot with the lined OFR and 0 cm weir height,
36

which is 337% higher than the buffer plot (252 kg ha-1). Because of the higher water storage, the average growth of fish in the lined OFR was 3018.33 kg ha-1 where as in the unlined OFR it was observed as 2270 kg ha-1.
0500
100015002000250030003500
L1H1
L1H2
L1H3
L2H1
L2H2
L2H3
Buffer
Plot
Treatment
Yie
ld (k
g ha
-1)
Rice Mustard
Fig. 3. Yield of rice and mustard at various treatments during 2003-04
3. Economic study The study determined cost-benefit analysis for rice-mustard-fish cropping system to assess the various economic criteria of the lined and unlined OFRs at different weir heights (Table 1). The initial (Iinv) cost of the OFR irrigation system consisted of the construction cost of the OFR and material cost for lining the OFR. Thus, the value of Iinv in the present study for lined and unlined OFR comes to Rs.6048.00 and 2100.00, respectively. The annual cost comprised of repair and maintenance cost, land lease cost for construction of the OFR, irrigation costs and cost incurred for fish growing. Repair and maintenance cost was assumed to be 2% of Iinv. Land lease cost for construction of the OFR was taken Rs.3000 ha-1 year-1. Irrigation cost depends on the amount of supplemental irrigation (SI) applied to the crop, area served by SI as well as the hire charge of pump set. The hiring charge of 5 HP diesel pump set in the region was Rs.300 for providing 5 cm SI to one hectare area. Thus to provide SI to mustard covering an area of 720 m2 each, irrigation costs incurred was highest (Rs. 54) with lined OFR and 0 cm weir height and lowest (Rs.21.60) with unlined OFR and 10 cm weir height. Fish rearing cost includes cost of fingerlings (Rs. 50 kg-1), stocking and feed (Rs. 7 kg-1). The average total annual cost for fish rearing in lined and unlined OFRs were estimated as Rs. 436. Average present worth of this annual cost for the lined and unlined OFR was estimated as Rs. 4223.25 and 2202.25, respectively. Thus, the average total costs were Rs. 10271.24 and 4302.25 for the lined and unlined OFRs, respectively.
37

The minimum government support price per 100 kg of rice grains and mustard seeds is taken as Rs. 450 and 1500, respectively. The price of rice straw and mustard stover in the study area were taken as Rs. 30 and Rs 15 per 100 kg, respectively. The price of fish was taken as Rs. 50 kg-1. The average returns obtained from the increased yields of rice, mustard including its byproduct and harvesting of fish in the lined and unlined OFRs were found Rs. 2365.53 and Rs. 1411.90, respectively; the present worth values of which were Rs. 15914.06 and 6033.62, respectively.
Table 1. Economic viability study of the OFR for a farm area of 800m2
Lined OFR Unlined OFR Weir Heights Weir Heights
Particulars
0 cm 5 cm 10 cm 0 cm 5 cm 10 cm
Cost incurred
Construction cost (Rs.) 2168 2168 2168 2100 2100 2100
Lining material cost (Rs.) 3680 3680 3680 0 0 0
Labour cost for lining 200 200 200 0 0 0
Initial investment (Rs.) 6048 6048 6048 2100 2100 2100
Maintenance cost (Rs.) 120.96 120.96 120.96 42.00 42.00 42.00
Irrigation cost (Rs.) 54.00 43.20 43.20 32.40 21.60 21.60
Land lease cost (Rs.) 24.00 24.00 24.00 24.00 24.00 24.00
Fish production cost (Rs.) 436.00 436.00 436.00 436.00 436.00 436.00
Total annual cost (Rs.) 634.96 624.16 624.16 534.40 523.60 523.60
Present worth of annual cost (Rs.) 4271.68 4199.03 4199.03 2232.32 2187.21 2187.21
Total cost (Rs.) 10319.68 10247.03 10247.03 4332.32 4287.21 4287.21
Returns obtained, (Rs.)
Increase of rice grain (Rs.) 221.62 277.99 387.83 170.42 234.58 301.97
Increase of mustard seeds (Rs.) 956.25 814.50 680.63 301.50 238.50 180.00
Increase of rice straw (Rs.) 22.15 27.79 38.77 17.03 23.45 30.19
Increase of mustard stover (Rs.) 18.36 15.64 13.07 5.79 4.58 3.46
Fish yield (Rs.) 1224 1206 1192 920 908 896
Total returns (Rs.) 2442.38 2341.92 2312.29 1414.74 1409.10 1411.61
Present worth of returns (Rs.) 16431.05 15755.22 15555.91 6046.12 6022.01 6032.73
Net present value (Rs.) 6111.37 5508.19 5308.89 1713.80 1734.80 1745.52
Benefit-cost ratio 1.59 1.54 1.52 1.40 1.40 1.41
38

The economic viability of the OFR system for the integrated farming system was evaluated in terms of net profit (NP) and benefit cost ratio (BCR). The average values of NP and BCR for rice fish integration under the OFR system were found Rs. 5642.81 and 1.55 for lined and Rs. 1731.37 and 1.40 for unlined OFRs, respectively. Summary and conclusions The study reveals that in eastern India, rainwater harvesting and supplemental irrigation-cum-fish farming has a great scope over the rainfed farming system. Field experiments with rice and mustard cropping systems along with growing fish in the OFRs under rainfed and supplemental irrigated conditions, reveal that there is an average net present value of Rs. 5642.81 and 1731.37 from the lined and unlined OFRs, respectively. For the lined and unlined OFR irrigation system, the average benefit-cost ratios are 1.55 and 1.40, respectively. Since, the values of BCR are more than 1.0, the investment in setting up the OFR irrigation system for crop-fish integration system in eastern India is economically viable. Acknowledgements. The writers gratefully acknowledge the financial support from the National Agricultural Technology Project (Indian Council of Agricultural Research, New Delhi, India) for conducting the research at the Department of Agricultural and Food Engineering, Indian Institute of Technology, Kharagpur, India. References Azim, M.F., Waheb, M.A., Van Dam, A.A., Beveridge, M.C.M., Huisman, E.A., Verdegem, M.C.J. 2001. Optimazation of stocking ratios of two Indian major carps, rohu (labeo rohitaham) and Catla (Catla catla ham) in a periphyton-based aquaculture system. Aquaculture. 203:33-49. Likangmin. 1988. Rice-fish culture in China: a review. Aquaculture. 71:173-186. Mishra, A. and Mohanty, R. K., 2004. Productivity enhancement through rice–fish farming using a two-stage rainwater conservation technique. Agric. Water Manage. 67(2):119-131. Mohanty, R., Mishra, A., Verma, H. N. and Brahmanand, P. S. 2002. Rainwater conservation and rice-fish integration for enhancing land and water productivity. Research Bull. Publ. No. 11. Water Technology Center for Eastern Region, Bhubabewwar, India. Panigrahi, B., Panda, S. N. and Agrawal, A. 2003. Optimal sizing on-farm reservoir for supplemental irrigation. I. simulation study. J. of Irrig. & Drain. Engg.(ASCE).129:117-128. Samra, J. S., Sharda, V. N. and Sikka, A. K.. 2002. Water harvesting and recycling Indian experiences. New Delhi: Indian Council Agricultural Research.
39

Srivastava, R. C., Singhandhupe, R. B. and Mohanty, R. K. 2004. Integrated farming approach for runoff recycling systems in humid plateau areas of eastern India. Agric. Water Manage. 64(2):197-212. Syamsiah, I., Fagi, S. A. M. and Bhuiyan, S. I. 1994. Collecting and conserving rainwater to alleviate drought in rainfed ricelandss of Indonesia. In: S. I. Bhuiyan (Ed.): On-farm Reservoir Systems for Rainfed Ricelands. International Rice Research Institute, Manila, Philippines. pp142-152. Walker, S.H. and Rushton, K.R. 1984. Verification of lateral percolation losses from irrigated rice fields by a numerical model. J. Hydrol. 71:335-351. Widawsky, D.A. and O'Toole, J.C. 1990. Priortizing the rice biotechnology research agenda for eastern India. The Rockefeller Foundation, New York, USA.
40

EFFECT OF CONVENTIONAL AND FURROW PLANTING METHODS ON RADIATION`INTERCEPTION, GROWTH AND
YIELD OF RICE PADDY
L.K. Dhaliwal1, S.S. Hundal2, S.K. Chahal3 and A. Aneja3
Abstract
Field studies were conducted at Punjab Agricultural University, Ludhiana (Punjab) to study the effect of two planting methods on radiation interception, crop growth and yield. Two crop varieties PR-118 and PR-115 were transplanted under conventional method (with puddling) and in between furrows (without puddling) on three different dates viz. 25 May, 10 June and 25 June during 2004 and 2005. Plant population was 33 hills per square meter in both the methods. Observations were made on radiation interception, number of tillers per plant, 1000-grain weight, grains per panicle, plant height, biomass and grain yield. The photosynthetically active radiation interception measured at different growth stages of rice crop, was comparatively higher (up to 5%) in furrow planting method as compared to the conventional method. The periodic numbers of tillers for both varieties were higher in furrow transplanted crop as compared to conventional transplanted crop during both crop years due to more radiation interception observed in furrow planted crop. The yield contributing characteristics viz. 1000- grain weight, number of grains per panicle, plant height, biomass and grain yield were higher in furrow planting method as compared to conventional method in both the varieties during both the years. Conventional method gave mean grain yield of 5.86 t/ha as compared to 6.61 t/ha in the furrow planting method. Introduction Rice is grown in all continents of the world due to its wide adaptability to diverse agroclimatic conditions. In India, the rice-wheat production system covers nearly 12 million ha area in the Indo-Gangetic plains in states of Punjab, Haryana, Uttar Pradesh, Bihar and West Bengal. This system contributes about 25 percent to the total food grain production of the country. The rice crop in India accounts for about 24 per cent of the total cropped area under food grains. In Punjab, rice cultivation has increased considerably with the availability of high yielding varieties, irrigation facilities and market price. It dominates the agricultural scene of the state in kharif season having an area of 2.489 million ha with the highest state level average yield of 3545 kg/ha in comparison to national average yield of 2910 kg/ha (Anonymous, 2003). On an average, more than 4000 litres of the water is used to produce one kilogram of rice (Anonymous, 1992). In Punjab, rice-wheat system owing to its high water demand has caused a severe 1 Associate Professor of Agrometeorology 2 Professor of Agrometeorology (Retired) 3 Research Fellow, Agrometeorology Section, Department of Agronomy and Agrometeorology Punjab Agricultural University, Ludhiana (Punjab)- India
41

problem of ground water table, which is declining at an alarming rate of 23 cm per year and has depleted about more than four meters since 1982 (Anonymous, 2002). Transplanting in puddled field is the common method of rice crop establishment, which results in formation of a hard pan and damages the soil structure. The traditional practice of continuous ponding of water results in considerable deep percolation losses and over irrigation than the crop requirements. As a result nearly 80 per cent area of the Punjab state is experiencing a fall in water table. So other practices for rice growing need to be explored to solve this problem in future. There is need to study alternative rice growing methods such as transplanting in furrows without puddling the soil which require less water. In this method the seedlings are transplanted in between the furrows and the water is applied only in furrows, which leads to 30-35% saving of water. There is also a need to study the changes in crop micro climate environment under various planting methods and their effect on yield. Keeping this in view, field studies were conducted to study the effect of two planting methods on radiation interception, growth and yield of rice crop Materials and Methods Field experiments were conducted during kharif season of 2004 and 2005 with paddy at Punjab Agricultural University Research Farm, Ludhiana. It is situated at 30o54’N latitude and 75o48’E longitude and is 247 m above mean sea level. The area experiences an average annual rainfall of 705 mm of which about 80 per cent is received during June to September. Two varieties of paddy, PR-118 and PR-115 were transplanted under conventional method (with soil puddling) and in between furrows (without puddling) on three different dates viz. 25 May, 10 June and 25 June in both the crop seasons. Seedlings were transplanted at a spacing of 20 cm x 15 cm in conventional method and 30 cm x 10 cm in furrow planting method. Thus, plant population was 33 hills per square meter in both the methods. The experiment was laid out in the factorial split plot design keeping date of sowing as main treatment, method of transplanting as sub treatment and varieties as sub-sub treatment. Each treatment was replicated four times. Fertilizers (Nitrogen N and Phosphorus P) were applied as per the recommendations by Punjab Agricultural University, Ludhiana. Two sprays of weedicides namely Butachlor at 3l/ha and metsulfuron at 75g/ha were used to control the grassy and broad leaf weeds. One spray of monocrotophos at 1.4l litre/ha was given to control the rice stem borer and leaf folder. The photosynthetically active radiation interception was measured with quantum sensor at different growth stages of rice crop. The number of tillers/plant were counted at weekly intervals while the 1000-grain weight, grains per panicle, plant height, biomass and grain yield were also recorded at harvest.
42

Results and Discussion PAR interception
The photosynthetically active radiation (PAR) was observed to be comparatively higher (up to 5%) in furrow planting method as compared to the conventional method (Figs.1 to 6). Light of the optimum intensity, quality and duration is essential for normal photosynthesis, plant growth and development. It governs the distribution of photosynthates among different organs of plants. The rate of photosynthesis is dependent upon the availability of photosynthetically active radiation intercepted by the leaves.
On all the dates of sowing the radiation interception by the canopy was
maximum at noon and it decreased after that. PAR interception measured at flowering stage of rice crop in all the three dates of sowing was found to be more in second date of sowing (10 June) as compared to first and third date of sowing. Similar trend was also observed by Sastri et al. (2000) in radiation interception.
Fig. 1. PAR interception in rice (D1) at flowering stage during 2004
40.0 45.0 50.0 55.0 60.0 65.0 70.0 75.0 80.0
PAR(%)
M1V1M1V2M2V1M2V2
09:00 10:00 11:00 05:00 12:00 01:00 02:00 03:00 04:00TIME
Fig. 2. PAR interception in rice (D2) at flowering stage during 2004
30.0 35.0 40.0 45.0 50.0 55.0 60.0 65.0 70.0 75.0 80.0
PAR (%) M1V1M1V2
M2V2
10:00 04:00 05:00 09:00 11:00 12:00 01:00 02:00 03:00TIME
43

80.0 75.0 70.0 65.0 PAR (%) 60.0 55.0 M1V1
M1V250.0 M2V1
M2V245.0 40.0
09:00 10:00 04:00 05:00 11:00 12:00 01:00 02:00 03:00
TIME
Fig. 3. PAR interception in rice (D3) at flowering stage during 2004
Fig. 4. PAR interception in rice (D1) at flowering stage during 2005
40.00 45.00 50.00 55.00 60.00 65.00 70.00 75.00 80.00 85.00 90.00
PAR (%)
M1V1M1V2M2V1M2V2
09:00 10:00 04:00 11:00 12:00 01:00 02:00 03:00TIME
Fig. 5. PAR interception in rice (D2) at flowering stage during 2005
40.00 45.00 50.00 55.00 60.00 65.00 70.00 75.00 80.00 85.00 90.00
PAR (%)
M1V1M1V2M2V1M2V2
09:00 10:00 03:00 04:00 11:00 12:00 01:00 02:00TIME
44

Tiller number
The periodic numbers of tillers for both varieties were higher in furrow transplanted crop as compared to conventional transplanted crop during both crop years (Tables 1 and 2). This may be due to the more radiation interception, favourable soil temperature, and more water use efficiency of furrow transplanted paddy as compared to conventional transplanted paddy. Narasimharao et al. (1999) reported that increased temperature increased the tiller numbers. The prevailing microclimate conditions influence the number of tillers, which ultimately determine the yield by influencing the number of panicles per unit area.
Table 1. Comparison of periodic tiller count for two crop varieties in different planting methods during 2004
Transplanting method and variety
Date of observation Conventional PR118
Furrow PR118
Conventional PR115
Furrow PR115
27 Jul-04 18 21 16 21 3 Aug-04 20 20 17 18
10 Aug-04 19 21 20 25 17 Aug-04 19 21 18 21 24 Aug-04 18 21 22 30 31 Aug-04 19 22 21 23 8 Sep-04 19 23 21 23
Mean 19 22 19 23
Fig. 6. PAR interception in rice (D3) at flowering stage during 2005
40.00 45.00 50.00 55.00 60.00 65.00 70.00 75.00 80.00 85.00 90.00
PAR (%)
M1V1M1V2M2V1M2V2
10:00 03:00 04:00 09:00 11:00 12:00 01:00 02:00TIME
45

Table 2. Comparison of periodic tiller count for two crop varieties in different planting methods during 2005
Date of observation Transplanting method and variety
PR118
Furrow Conventional PR118
PR115
PR115
5 7 5 9
13-Jul-05 8 10 7 11 20-Jul-05 11 13 9 13 27-Jul-05 12 15 11 13 3- Aug-05 15 17 13 16 10-Aug-05 18 19 16 18 17-Aug-05 17 18 16 17 24-Aug-05 17 18 15 17 31-Aug-05 16 17 14 16 8-Sep-05 15 17 13 15
14-Sep-05 14 16 13 15 Mean 13 15 12 14
Conventional Furrow
6- Jul- 05
ffect of date of sowing
The yield contributing characteristics viz. 1000-grain weight, number of grains per pan
was
d
E
icle, plant height and biomass were higher in crop transplanted on June 10 (normal sown crop) than early and late transplanted crop. Similarly, the grain yieldmore in normal transplanted crop than early and late transplanted crop (Table 3) .The mean grain yield was 6.76 t/ha in crop transplanted on normal time (June 10) compareto 5.53 and 6.47 t/ha in early and late transplanted crops, respectively during 2004. The normal sown crop gave 22.2 and 21.5 % more grain yield than early sown crop during 2004 and 2005, whereas it was 4.3 and 3.8 per cent higher in normal transplanted crop than early and late transplanted crop during 2004 and 2005, respectively (Table 3).
46

Table 3. Comparison of yield contributing characteristics and yield of rice under different transplanting dates during kharif 2004 and 2005 (Pooled data for two varieties)
Kharif 2004
Transplating date
1000 grain weight(g)
Effective tillers/hill
No. of grains/ panicle
Plant height(cm)
Biomass (q/ha)
Yield (t/ha)
25 May (D1) 26.0 9 100 83 17.7 5.53 10 June (D2) 27.5 12 104 93 18.7 6.76 25 June (D3) 23.0 10 110 73 18.4 6.47 CD (P=0.05) 1.38 1.07 6.57 2.68 NS 0.15
Kharif 2005
25 May (D1) 26.0 12 102 86 20.6 5.52 10 June (D2) 29.0 13 115 99 20.7 6.71 25 June (D3) 24.0 11 110 75 19.1 6.46 CD (P=0.05) 0.81 1.04 7.03 NS 0.24 2.43
Effect of planting methods The yield contributing characteristics viz. 1000-grain weight, number of grains per panicle, plant height and biomass were higher in furrow planting method as compared to conventional method during both the years (Table 4) while there was no major difference in the number of effective tillers. The grain yield was significantly higher in furrow planting method compared to conventional planting method during both the crop years. The conventional method gave mean grain yield of 5.87 and 5.86 t/ha in 2004 and 2005 respectively while the corresponding grain yield for the furrow planting method was 6.63 and 6.60 t/ha. The mean grain yield was 12.9 and 12.6 per cent higher in furrow transplanted crop than conventional transplanted method during 2004 and 2005 respectively. Similar results were also reported by Singh (2003), Singh et al. (2002).
Conclusions Overall the periodic numbers of tillers were higher in furrow transplanted crop as compared to conventional transplanted crop. The photosynthetically active radiation (PAR) was 5 per cent higher in furrow transplanted crop than conventional transplanted crop. The yield contributing characters and yield was also higher in transplanted crop. As there is 30 per cent saving of water, so this new technique can be used to save the water in state.
47

Table 4. Comparison of yield and yield contributing characteristics and yield of rice crop under conventional and furrow transplanting methods during Kharif 2004 & 2005 (Pooled data of 3 dates and two varieties)
Kharif 2004
Planting method
1000 - grain weight (g)
No. of effective tillers/hill
No. of grains/ panicle
Plant height (cm)
Biomass (t/ha)
Grain yield (t/ha)
Conventional 24 9 100 70 17.9 5.87 Furrow 26 9 109 75 18.7 6.63 CD (p=0.05) 1.6 NS 5.8 1.60 NS 0.10
Kharif 2005
Conventional 25.9 11 105 85.6 16.4 5.86 Furrow 27.5 12 114 88.7 20.6 6.60 CD (p=0.05) 0.97 NS 4.78 2.92 0.72 0.07
References
Anonymous. 2003. Package of practices for kharif crops. Punjab Agricultural University, Ludhiana, India, pp.1. Anonymous. 1992. IRRI programme report, pp.21-22. Anonymous. 2002. Statistical Abstract of Punjab, Ministry of Agriculture, Govt. of India: 175-176. Narasimharao, S B S, Reddy, D.R. and Lalitha, K. 1999. Influence of temperature and sunshine hours on tiller production in low land rice varieties. J of Agrometeorology 1(1): 187-190. Sastri, C.V.S., Rao, T.R. and Mukherjee, J. 2000. PAR distribution in mustard (Brassica juncea L. var. Pusa bold) crop canopy. J. Agrometeorol.2 (1):15-20. Singh Devinder. 2003. Evaluation of different planting techniques for yield optimization and water saving in paddy (Oryza Sativa. L). M.Sc. Thesis, Punjab Agricultural University, Ludhiana. Singh, S., Yadav, A., Malik, R. K. and Singh, H. 2002. Rice transplanting on raised beds - A new technique in rice-wheat sequence. Proceeding of international workshop on herbicide resistance management and zero tillage in rice-wheat cropping system, held at CCS Haryana Agricultural University, Hissar March 4-6, 2002.
48

SHALLOW GROUNDWATER AS SUBSURFACE IRRIGATION FOR RICE CULTIVATION IN SEDATANI PADDY FIELD
Satyanto Krido Saptomo1, Budi Indra Setiawan2,
Yoshisuke Nakano3, Masaharu Kuroda4 and Rudiyanto5 Abstract Sedatani paddy field is known to have sufficient water supply even in drought period. Evapo-transpiration of this area was reported varying with the existence of different planting stages. The shallow groundwater level were observed at some points, including wells at the mountain foot and a one meter depth measuring pit that was prepared in the middle of paddy area. Functionality of the shallow groundwater as sub-surface irrigation is studied using combination of models of vertical water movement in soil, water uptake by root and evapo-transpiration. The approach is based on the condition of the paddy field, which is only ponded for about two weeks with its current traditional water management. Capillary rise is expected to occur to bring up soil moisture from the water saturated zone near the water table to the root zone, and is approached by using vertical soil water movement equation. The balance between capillary rise, plant water demand and recharge to the water table shows how the shallow groundwater functions as subsurface irrigation in the area. Keywords: capillary rise, modflow, hydrus, water balance Introduction Cidanau watershed is the most important watershed in Banten Province Indonesia. The watershed provides water for industrial use in the city of Cilegon and also domestic use in the surrounding area. The watershed has a unique natural reserve called Rawa Dano swamp. The upstream of the river is an ancient caldera that was drained to create rice production fields. Mountainous swamp environment and shallow groundwater level has made an interesting rice field area for research, especially in the development and sustainability of the environment.
The studied paddy field is located in Sedatani area, Cidanau Watershed, Banten, Indonesia. Mountain streams and spring-fed ponds are the sources of irrigation water for the paddy field. The water catchment is located in mountain site, having area of 180ha and the paddy plot itself is 6ha. Intake water from streams and pond is supplied through small irrigation ditches to the field, and flows plot-to-plot. The water is drained through
1 Department of Agricultural Engineering, Faculty of Agricultural Technology, Bogor Agricultural University (IPB),
[email protected] 2 Department of Agricultural Engineering, Faculty of Agricultural Technology, Bogor Agricultural University (IPB),
[email protected] 3 Faculty of Agriculture, Kyushu University, [email protected] 4 Faculty of Engineering, Kyushu-Kyoritsu University, [email protected] 5 Department of Agricultural Engineering Science, Graduate School, Bogor Agricultural University
49

drainage canals to the Cidanau River. As reported by Torise et al. (2002), the run-off of flow is kept at 8.0 l/sec, which is remarkably stable for paddy field irrigation during drought period. Evapo-transpiration of this area was reported varying about 5 mm/day (drought period), 4.5 mm/day (normal period), 4.0 mm/day (rainy period). In addition, it is estimated that the base discharge of inflow to this area is about 4.3 mm/d in the dry season. Cracks at the soil surface which appears as the surface turns dry may contribute to the increase of evaporation.
With limited supply of surface water, the paddy field is irrigated using plot to plot irrigation system. This practice of water management lead to the existence of multi-stage of cultivation of rice fields in the same period. Fukuda et al. (2003) concluded that the water balance in this field is very stable even in drought period, and irrigation efficiency of the system is reasonable in traditional irrigation system without any control facilities. The area has the sufficient and stable water supply system to satisfy the water demand for paddy irrigation. The paddy field is ponded for only two weeks after the rice transplanting. The ponding is repeated consecutively to the next field. The root of the paddy rice is developed and reaches length of about 30 cm, with which the rice paddy reach the subsurface water. After this short soils submerging period, the rice continues growing by consuming soil moisture that is kept sufficient with the occurrence of capillary rise of water from the water table. This paper aims to present the function of the shallow groundwater as subsurface irrigation in the absence of surface irrigation. Materials and Methods 1. The Study Area The studied paddy field is located in Sedatani area, Cidanau Watershed, Banten Indonesia. Mountain streams and spring-fed ponds are the sources of irrigation water for the paddy field. Various stages of paddy cultivation can be seen in Fig. 1. There are 2 sub-catchments at the upstream of this field; the location is shown in Fig. 2. The water catchments are located in mountain site; having area of 180ha and the paddy plots itself is 6ha.
50

Fig. 1. Pictures of the paddy field, taken in July 2005.
Ciriung sub-catchmentCiriung sub-catchment
Cikutu sub-catchmentCikutu sub-catchment
Paddy FieldPaddy Field
N
Ciriung sub-catchmentCiriung sub-catchment
Cikutu sub-catchmentCikutu sub-catchment
Paddy FieldPaddy Field
N
Fig. 2. The study area
0
20
40
60
80
100
2006/12/9 2006/12/29 2007/1/18 2007/2/7 2007/2/27 2007/3/19
D ate
Water level (cm)
W ell I W ell II
Fig. 3. Wells water level fluctuation (soil surface at 100 cm)
Groundwater observation points were set in the paddy field. Two points are the wells at the mountain foot, and one measuring pit with groundwater level recorder. The
51
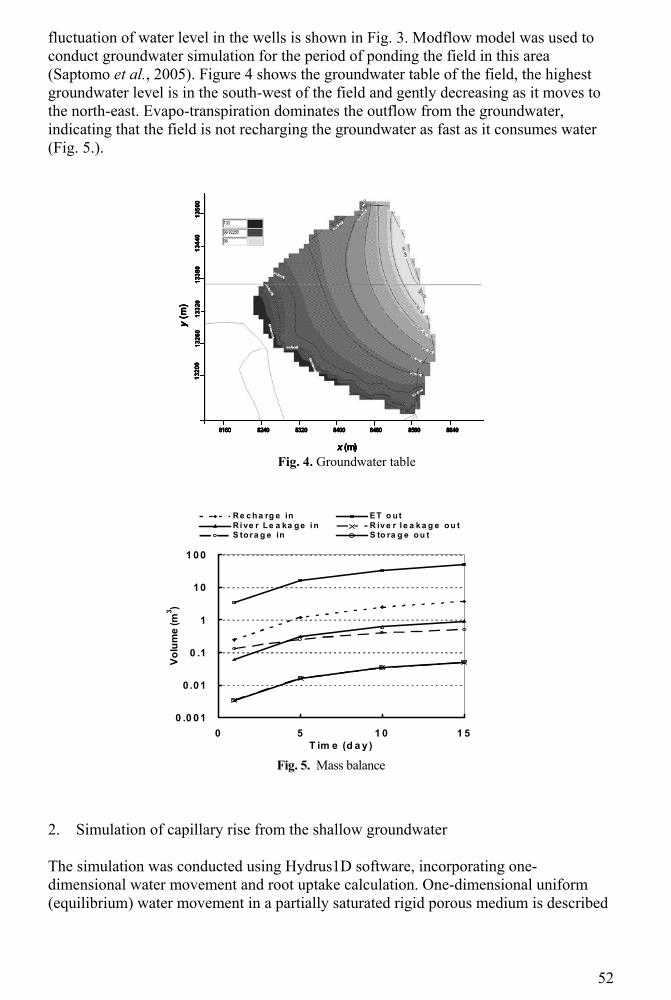
fluctuation of water level in the wells is shown in Fig. 3. Modflow model was used to conduct groundwater simulation for the period of ponding the field in this area (Saptomo et al., 2005). Figure 4 shows the groundwater table of the field, the highest groundwater level is in the south-west of the field and gently decreasing as it moves to the north-east. Evapo-transpiration dominates the outflow from the groundwater, indicating that the field is not recharging the groundwater as fast as it consumes water (Fig. 5.).
8160 8240 8320 8400 8480 8560 8640
1350
013
440
1332
013
260
1320
013
380
x (m)
y(m
)
8160 8240 8320 8400 8480 8560 8640
1350
013
440
1332
013
260
1320
013
380
x (m)
y(m
)
8160 8240 8320 8400 8480 8560 8640
1350
013
440
1332
013
260
1320
013
380
x (m)
y(m
)
Fig. 4. Groundwater table
0 .0 01
0 .01
0 .1
1
10
1 00
0 5 1 0 1 5T im e (d a y )
Vol
ume
(m3 )
Re c h a rg e in ET o u tRi ve r Le a ka g e i n R iv e r l e a k a g e o u tS tora g e in S to ra g e o u t
Fig. 5. Mass balance
2. Simulation of capillary rise from the shallow groundwater The simulation was conducted using Hydrus1D software, incorporating one-dimensional water movement and root uptake calculation. One-dimensional uniform (equilibrium) water movement in a partially saturated rigid porous medium is described
52

by a modified form of the Richards' equation using the assumptions that the air phase plays an insignificant role in the liquid flow process and that water flow due to thermal gradients can be neglected, used in hydrus program (Simunek et al., 1998). The sink term of the equation is the volume of water removed from a unit volume of soil per unit time due to plant water uptake, according to Feddes et al. (1978). The field is dominated by heavy clay soil, which water retention curve and soil hydraulics conductivity were derived using van Genuchten (1980) Eqs.(1) and (2) using parameters of α=0.004 cm-1, n=1.62, m=0.38, θs=0.54, θr=0.26, and saturated hydraulic conductivity Ks =10-6cm s-1 or 0.0864 cm day-1. The soil column used for the simulation is 50 cm depth and discretized into to 100 compartments.
( )
≥
<+
++
=
ss
smn
sr
hh
hhh
r
θα
θθθ
θ 1 (1)
[ ]2/15.0 )1(1)( mmees SSKhK −−= (2)
5
4 Model Data 3pF
2
1
0 0.00 0.20 0.40 0.60
Water Content
Fig. 6. Water content – pF curve
53

0
0.1
0.2
0.3
0.4
0.5
0.6
0.7
0.8
0 3 6 9 12 15 18 21 24Time (Hour)
Eva
pora
tion
(mm
)
barepaddy
Fig. 7. Hourly evaporation
As for the upper boundary, the soil surface is assumed to be submerged by 5cm water level on the first 15 days. The soil is given pF 0 on the 16th day, and left the pressure as it is resulted from the rest of simulation time. Evapotranspiration takes part as surface flux from the soil. The hourly evapotranspiration (Fig. 7) was calculated using local climate data, using energy balance analysis for paddy field environment proposed by Saptomo et al. (2004). The daily amount of evapotranspiration is equal to 5 mmday-1, and this value is used as potential evaporation parameter for Hydrus program. There is no precipitation assumed to occur in this simulation. At the bottom of the column, the soil is also given pF 0 as the shallow groundwater is expected to be stable at this level. The root of the rice paddy can grow up to 35 cm in length, extending deep into the soil column to extract water from about this depth. Root water uptake is simulated until the 125th day where the rice is being harvested. Results and Discussion Simulation was run for 150 days, which is the common length of rice cultivation period in the study area. The soil water content, hydraulic conductivity and water flux profile resulted from simulation are presented in Figs. 8, 9 and 10 for day 0, 75 and 150. Day 0 is the initial condition of the soil column and day 15 is the end of the cultivation season before starting the next rice transplanting. Day 75 is when the rice has grown for about 75 days with its root is developed and extracting subsurface water. With the presence of root, it is generally seen that water content, hydraulic conductivity and water flux is decreased at the closer depth to the soil surface. After submerging water was drained, the surface water content decreased and the surface turned very dry. In this condition evaporation might decrease or stop and cracks starts to appear as it was observed in the field. Figure 10 shows that more water flux occurs in the root zone (10 to 30 cm depth), indicating the root water uptake process. In this zone the pressure ranges from -100 to - 300 cm and provide the moisture that is available for plant.
54

The fluctuation of root water uptake along with the evaporation and the flux came from the shallow groundwater is presented in Fig. 11. Root uptake reached maximum value of about 0.24 cm day-1. The evaporation rate decreased and stopped or became very small after 40 days. Summation of these does not reach the potential evapo-transpiration which is 0.5 cm day-1. This condition is because the simulation was only one dimensional and contribution of cracks to evaporation was not taken into account.
-50
-40
-30
-20
-10
0
0.25 0.30 0.35 0.40 0.45 0.50 0.55Water content
Day 150Day 75
Day 0
Profile Information: Water Content
Fig. 8. Soil water content (mm3 mm-3) profile
-50
-40
-30
-20
-10
0
0.00 0.02 0.04 0.06 0.08 0.10K [cm/days]
Day 150
Day 75
Day 0
Hydraulic Conductivity
Fig. 9. Soil hydraulic conductivity profile
55

-50
-40
-30
-20
-10
0
-0.10 -0.05 0.00 0.05 0.10 0.15 0.20Water flux [cm/days]
Day 150
Day 75
Day 0
Water Flux
Fig. 10. Water flux profile in the soil column
-0.1
-0.0
0.1
0.2
0.3
0.4
0.5
0 30 60 90 120 150Time [days]
Water flux from bottom
Root uptake water
Evaporation from soil top
Fig. 11. Bottom flux, root uptake and evaporation
-5.0
0.0
5.0
10.0
15.0
20.0
0 30 60 90 120 150Time [days]
Water flux from bottomRoot uptake
Evaporation from soil surface
Fig. 12. Cumulative of bottom flux, root uptake and evaporation
The water flux from shallow groundwater reach about 0.2 cm day-1 in maximum with its total is about 19 cm for 150 days (Fig.12). In average for this soil column, the capillary rise flux from the ground water is only about 0.1 cm day-1. Also in Fig. 12, it is seen that the difference between total root uptake, which is then being transpired by the
56

rice plant and the total bottom flux is very small. In this case some amount of water is saved from being evaporated from the surface of this soil column. These results show that the water retains in the soil column and provide available moisture for rice paddy. These results however still need to be confirmed. Root development and root uptake model might have not been optimally parameterized, and effort to find the optimum parameters is required. Also the real condition of the paddy field with cracks and some extend of compaction are not yet taken into account and one-dimensional simulation model is arguably adequate. Without the common practice of soil submerging in paddy irrigation, the field is having benefit from the shallow groundwater by capillary rise that preserve subsurface water. In this paper the rice production under limited surface irrigation, with the help of the natural resource of shallow groundwater which functions as subsurface irrigation is clearly seen. This kind of water management is a smart practice to survive the rice production, but it seems to be practiced driven by the nature of the area and not fully realized by the local inhabitants. With the method that is used in this study, the amount of soil water that can be provided by capillary rise from groundwater table can be estimated and the information can be used to estimate whether the water is sufficient for rice cultivation for a certain period. It seems important for the farmers to have access to this information, and to be introduced simple and practical procedure to estimate the water availability and to decide the best period of cultivation. Conclusions Capillary rise from shallow groundwater has been simulated for the paddy field in Sedatani, Cidanau Watershed. The simulation shows the contribution of the groundwater to rice cultivation as subsurface irrigation. The condition of the shallow groundwater and the soil physical and hydraulics properties created an interesting condition that survives the rice production in the absence of soil submerging and the continuous surface irrigation. The soil retains water in its column and provides moisture that is available to be extracted by rice root, while less evaporation from its surface saves water. The simulation is however in need to be improved, taking into account the influence of cracks in the soil and the finding of optimum parameters for rice to be used in the simulation models. Summary The studied paddy field is located in Sedatani area, Cidanau Watershed, Banten Indonesia. Mountain streams and spring-fed ponds are the sources of irrigation water for the paddy field. The water catchment is located in mountain site, having area of 180ha and the paddy plots itself is 6ha. With limited supply of surface water, the paddy field is irrigated using plot to plot irrigation system that leads to the existence of multi-stage of cultivation of rice fields in the same period. The paddy field is ponded for only two
57

weeks after the rice transplanting. Shallow groundwater level is known to exist in the area. The function of the shallow groundwater as subsurface irrigation in the absence of surface irrigation through capillary rise from shallow groundwater is presented in this paper. The subsurface water movement, root growth and water uptake were simulated using Hydrus program. The soil physical properties and shallow groundwater retains and provide water in soil to be extracted by rice root and less evaporation from its surface saves water. Acknowledgement. This research is a part of JSPS-DGHE Core University Project in Applied Bioscience, between The University of Tokyo and Bogor Agricultural University, the authors express their gratitude to JSPS and all member of Group I, for all supports and cooperation. References Feddes, R. A., Kowalik, P. J. and Zaradny H. 1978. Simulation of Field Water Use and Crop Yield,John Wiley & Sons, New York, NY. Fukuda, T., Kuroda, M., Nakano, Y. and Takeuchi, S. 2003. Water System Management and Irrigation Practices of Traditional Paddy Farming - Utilization of Small Stream Runoff for Irrigation, Sustainable Agriculture in Rural Indonesia, Gadjah Mada Univ. Press, pp. 57-63. Saptomo, S.K., Nakano, Y., Yuge, K. and Haraguchi T. 2004. Observation and Simulation of Thermal Environment in a Paddy Field. Paddy and Water Environment 2004(2):73-82. Saptomo, S.K., Setiawan, B. I., Nakano, Y., Kuroda, M., Fukuda, T. and Takeuchi, S. 2005. Regional Water and Heat Balance in Sedatani Paddy Field Cidanau Watershed. Proceeding PAWEES Internationan Conference, Kyoto, September 7th-8th, pp. 65-70. Simunek, J., Sejna, M..and van Genuchten, M. Th, . 1998. The HYDRUS-1D software package for simulating the one-dimensional movement of water, heat, and multiple solutes in variably-saturated media, Version 2.0. IGWMC - TPS - 70, International Ground Water Modeling Center, Colorado School of Mines, Golden, Colorado, 162pp. van Genuchten, M. Th. 1980. A closed-form equation for predicting the hydraulic conductivity of unsaturated soils, Soil Sci. Soc. Am. J. 44:892-898. Torise, K., Fukuda, T., Nakano, Y., Kuroda M. and Takeuchi S. 2002. Water Management of Paddy Area in Cidanau Watershed, Indonesia (in Japanese). Sci. Bull. Fac. Agr., Kyushu Univ, 57(1), pp. 143-152.
58

IN-SITU SOIL AND MOISTURE CONSERVATION MODEL (FIVE PERCENT MODEL) FOR SUSTAINABLE PADDY CULTIVATION IN HIGH RAINFALL
AREA IN SEMI ARID TROPICAL INDIA
P. Vamshi Krishna1, G. Srinivas1, L.V. Prasad2 Abstract
Addatheegala, a tribal area in high attitude region of the Andhra Pradesh state in India receives comparatively high rainfall (1000mm). The farmers in this area cultivate paddy. This area is vulnerable not only to the dry conditions, but also to the excessive rainfall during the crop growth period. Hence, the farmers adopted an in-situ moisture conservation model called “Five percent model”, to overcome the irregularity. This model is adopted to maximize the available runoff rainwater, store the water for the life saving irrigation and to increase the moisture in the subsurface area to improve the crop yield. The experiment plot size is normally taken as 0.25 acres (25 cents), out of which 5%, i.e., 50 m2 pits are dug. However, few sample farmers dug different size of pits ranging from 2% to 4.5 %, depending on the location, soil type and shape of plot. A study is conducted on the model adopted to work out suitable modification for effective resource efficiency model for extensive replication. The model is adopted in sandy loam and loamy soils with the two popular rice varieties “Chaithanya” and “MTU 1001”. The pits are formed on the upstream side of the plot to receive inflows from upper fields. The pits, hence, conserve rainwater, help in percolation of water locally and augment the crop water needs during the period of dry spells and in the critical periods. To study the impact, base line data comprising crop yield, rain fall, cost of cultivation, rainfall data, topography, drainage of area, soil profile are collected. During the study, the daily water levels in the pits, soil moisture retention days, soil moisture retention depth, growth parameters of paddy and yield are recorded for analysis. The study also focused on social aspects, apart from hydrological, agricultural and economic aspects, as paddy is an integral part of life. For the analysis, the various sizes of plots are standardized by taking the range of sizes. All the plots are categorized in to three groups, based on their size. The control plots are also taken to compare the economic viability of the model. The size varying from 3% to 3.5 % is shown as the best and acceptable model by the farmers. The paddy crop duration is 140 days, nearly 5 months, where as south west season (major rainfall season) consists hardly four months. As the model paddy fields are rain fed, this experiment has shown many positive results. Experiment fields can survive in the dry spells also. The survival rate in model plots after transplantation is 90%, which is only 70% in control plots. Chaffy grains are very low (6.67%), and 120 -248 grains per spike are recorded, where as in control plot it is only 96 -172 grains per spike. The average yield in experiment plot is 16.86 Q per acre (42.15 Q per Ha), where as it is only 10.27 Q per acre (25.675 Q per Ha) in Chaithanya variety. It means 64.21 % increase in the yield is recorded in experiment plot. In other variety (MTU 1001), increase in the yield is recorded as 73.17%. The fodder yield also increased to 22.67% and 11.49% in Chaithanya and MTU 1001 respectively. Moisture retention is
1 Action for Food Production (AFPRO) 2 Centre for World Solidarity
59

increased enormously, as the moisture is available in the field even at the time of harvest also. The benefit cost ratio is 3.17 in experiment plot, where as it is only 2.18 in control plot. Introduction Drought and floods resulting from erratic rainfall distribution are the major cause for wide variation in agricultural production. When rainfall during the crop-growing season is not sufficient to meet crop need, the crop production is adversely affected. Excessive rainfall during the crop growth period may also decrease production as considerable portion of rainwater is lost as runoff during the rainy season. The options available to balance falling ground water include: recharging of the ground water through rainwater conservation, diversification from high water demanding crops like paddy, increasing efficiency of water use, adopting mulching such as zero tillage, furrow irrigated, seeded rice and laser leveling (Mangal Rai, 2005). The in-situ moisture conservation practices recommended in India are through tillage (shallow, deep), mulching, and high density plantation (close transplantation) small beds making, bed bunds strengthening, dead furrow etc. There are a few inherent problems in the above alternatives, a few of which are general and a few of which are specific, however they are leagued, and presented to portray the general picture. They are as follows:
Availability of space and feasibility of application Requirement of high technical skills and knowledge of the local area High cost Effect on environment Requires regular maintenance Benefit sharing
Hence, 5% model, a modified version of farm ponds was developed by farmers of Purulia, West Bengal of India, with the support of an NGO called PRADAN. 5% model is one of the effective Soil and Water Conservation Models which have been adopted in the recent past. The areas where the model has been successful are generally prone to vagaries of monsoon, erratic rainfall and inadequate water available for the crop during critical stages. The present research study is taken up to work out suitable modification for effective and extensive replication. The study is also focused to find out suitability of model for various varieties of paddy under different soil conditions. Methodology The model derives its name from the area of the pit dug in a plot equivalent to 5% of the area of the plot. The plot size is normally taken as 0.25 acre (25 cents) out of which the pit size would be 5%, i.e., 50m2. The depth of the pit is generally taken as 1.0 to 1.1m. The pit is dug on the up field side from where the water can flow by gravity to the entire plot. The pit so formed receives its inflows from the upland fields and hence
60

is connected to another pit down slope. The pits hence conserve rainwater, help in percolation of water locally and augment the crop water needs during the periods of dry spells and critical stages. The study is conducted in two villages, in the high altitude climatic zone of Andhra Pradesh, India. This study is conducted in collaboration with a local NGO, LAYA in a programme mode. The broad method adopted for the study is given bellow: • Collection of base line information on socio, economic, agro, climatic, hydrological
and geographical factors through primary and secondary sources by using well prepared formats
• Identification of experimental and control plots in two villages based on soil factors • Comparison of growth and output factors in the control and experimental plots • Data analysis on economic, agro and hydrological features to ascertain the impact of
the model The major types of soils in the two villages are sandy loam, loamy soil and heavy loam soil. Hence, for the purpose of the study, a total of 254 pits covering 22.73 acres were taken for primary study. The mean average rainfall in the study area is 1300 mm per annum ranging from 1100 mm to 1500 mm. The slope of the cultivated land is around 1 degree gradient. The mean average rainfall during the study period is around 1294.5 mm. Twelve experiments and twelve control plots were selected. The plots were selected randomly for different soil types viz sandy loams (SL), loamy (L) and heavy loam (HL). The two crop varieties were selected i.e., Chaithanya and MTU 1001. Total 254 pits were dug, out of which two plots of each soil type is selected per village for different pit sizes of 2.5%, 3%, 3.5% and 4%. The plots were randomly selected based on the placement of plots, and availability of information. A similar classification based on the soil types. An attempt is made to bring commonality of parameters in both the paddy varieties for experimental and control plots. Hence, only twelve plots were selected to analyze the impact of the model. The details of plots were given in Table 1 and Table 2. Results and Discussion The study is focused on water retention period in the pit, its impact on physiological growth of plant like plant growth, stalk growth, number of tillers, yield and net income from the crop. Water was noticed in 5 out of 12 pits in the experimental plots even at the time of harvesting. Out of these 5, one pit is of 2.5% size, three of 3% size and another one is of 4% size as given in Table 3. Hence, the size of pit does not seem to be appropriate bench mark for deciding the size of the model. Similarly, water stored in all soil types
61

viz sandy loam, loamy and heavy loam. A more in depth study over a period of time is necessary to ascertain the impact of this model on hydrological aspects.
Table 1. Model adopted and crops cultivated in experimental plots.
Plot Code Crop Variety Model Adopted (% )
RSL1 Chaithanya 2.5 RSL2 Chaithanya 4.0 RL 1 MTU1001 2.5 RL2 MTU 1001 3.5 RHL1 Chaithanya 2. RHL 2 Chaithanya 2.5 TSL 1 MTU 1001 3.0 TSL2 MTU 1001 4.0 TL1 Chaithanya 3.5 TL2 Chaithanya 3.5 THL1 Chaithanya 3.0 THL2 Chaithanya 4.0
R & T stands for the name of the village, where the plots are located. SL, L & HL represent the texture of soil.
Table 2. Crops cultivated in control plots.
Plot Code Crop Variety CRSL1 Chaithanya CRSL2 Chaithanya CRL 1 MTU1001 CRL2 MTU 1001 CRHL1 Chaithanya CRHL 2 Chaithanya CTSL 1 MTU 1001 CTSL2 MTU 1001 CTL1 Chaithanya CTL2 Chaithanya CTHL1 Chaithanya CTHL2 Chaithanya C stands to represent control plot.
It was observed that there is a significant impact on the plant height, stalk girth, and shoots per hill. However, there is no significant difference in tillers per shoot. In the first week after transplantation plants in control plots had an average height of 33.08 cm as compared to 32.25 cm in experimental plots. However, after the second week, the
62

average plant height in the experimental plots has clearly overtaken the average plant height in control plots and the advantage in the height is maintained till the harvesting time .The average plant height at the time of harvesting in experimental plots is around 91.96 cm, while the average plant height in the control plots is around 79.17 cm.
Table 3. Water retention in experimental plot.
Plot code Volume of pits (m3) Water volume in pits at the time of harvesting (L)
RSL1 8.16 1305.6 RSL2 8.74 0 RL1 5.76 0 RL2 7.68 0 RHL1 7.00 0 RHL2 6.15 0 TSL1 14.09 1009.58 TSL2 14.62 0 Tl1 12.59 2644.82 Tl2 37.59 0 THL1 8.5 3517.8 THL2 20.16 14112.0 The average stalk girth is more in control plots till the 6th week, but later, the average stalk girth in experimental plots is more than the average stalk girth in control plots and is again maintained till harvest time. The average stalk girth in experimental plots is 3.08 cm compared with 2.48 in control plots at the time of harvesting. The average shoots per hill is again a clear benefit of the model is ascertained in terms of shoots per hill, right from more by 106% in the first week after transplantation and goes up to 148% by 10th week and is maintained till harvest time (14th week) in experimental plots when compared to control plots.
Tillers per shoot are more or less consistent in both the activities in both the experimental and control and control plots. There is an average difference of around 1.2% by tillers in control plots having 6.33 against 6.25 tillers per experimental plot. Hence it can be concluded that, more physiological activity like translocation of water root setting and plant setting is possible in fields, where this model is adopted.
There is significant difference observed in the yield (both grain and stalk), between the experimental and control plots. In spite of different crop varieties sown in experimental plots and control plots, some similarities were identified. The survival rate in the both experimental and control plots are same i.e., 90%, and has no significant difference. However, the yield parameters are significantly different in both the models.
63

The percentage of filled grains is marginally better in experimental plots (79.42%), when compared to control plots (77.52%). While trying to understand yield difference
Table 4. Plant height in cm in experimental and control plots.
Plot No. 1st WAT 2nd WAT At Harvesting RSL1 32 34 76.5 RSL2 27 32 85 RL1 31.5 33.5 86 RL2 24.5 26 71.5 RHL1 42 52 98 RHL2 24 35 81 TSL1 28 43 101 TSL2 42 55 96.5 Tl1 33 50 97 Tl2 32 41 88 THL1 43 52 135 THL2 28 36 88 Average 32.5 40.79 91.96 Control Plots CRSL1 34 35 74 CRSL2 28 29 75 CRL 1 34 36 79 CRL2 41 43.5 67 CRHL1 33 35 73 CRHL 2 32 35 65 CTSL 1 28 31 81.5 CTSL2 26 30 82 CTL1 27 30 85 CTL2 30 33 87 CTHL1 40 43 89 CTHL2 44 47 92.5 Average 33.08 35.63 79.17
WAT: Weeks after transplantation
between the experimental and control plots, calculations were based on the average pit size of 3%. This is calculated, as average pit size used for experimental plot is around 3.16%, hence, 3% is selected, which is nearest to the average model and is easier to explain it to the farmer. The cost of cultivation (COC), net income and net rate of returns (ROR) were calculated. In this region, cultivation practices are almost similar and within a village, cultivation practices are almost identical. The cost of pit digging is also added to the experimental plots, which comes around Rs.3000.00 per acre and the depreciation
64

amount is calculated at the rate of 10% per annum. The rate of return in experimental plots is 3.17, where as it is 2.18 in control plots.
Table 5. Impact of model on yield parameters.
Plot Code Crop Variety
Wt. of filled grains (g/m2)
% o filled grains
Stalk Wt.
RSL1 Chaithanya 545 71.83 690 RSL2 Chaithanya 365 69.56 725 RL 1 MTU1001 245 85.92 525 RL2 MTU 1001 275 79.72 655 RHL1 Chaithanya 340 84.57 320 RHL 2 Chaithanya 465 69.93 595 TSL 1 MTU 1001 465 79.15 843 TSL2 MTU 1001 623 75 875 TL1 Chaithanya 490 87.38 513 TL2 Chaithanya 423 88.78 525 THL1 Chaithanya 503 91.75 662 THL2 Chaithanya 477 69.4 455 Average 434.67 79.42 615.25 Control Plots CRSL1 Chaithanya 372 84.44 463 CRSL2 Chaithanya 218 80.18 335 CRL 1 MTU1001 132 74.62 377 CRL2 MTU 1001 173 90.42 298 CRHL1 Chaithanya 245 79 537 CRHL 2 Chaithanya 320 70.75 645 CTSL 1 MTU 1001 170 78.19 413 CTSL2 MTU 1001 273 69.56 515 CTL1 Chaithanya 315 79.63 575 CTL2 Chaithanya 227 64.98 577 CTHL1 Chaithanya 368 75.48 763 CTHL2 Chaithanya 268 83 340 Average 256.75 77.52 486.50
65

Table 6. Economic parameters.
Plot Code Crop Variety
COC Gross Returns
(Rs.)
ROR
RSL1 Chaithanya 2600 11052.6 4.25 RSL2 Chaithanya 2600 7288.32 2.8 RL 1 MTU1001 2600 4968.6 1.91 RL2 MTU 1001 2600 5519.79 2.12 RHL1 Chaithanya 2600 6895.20 2.65 RHL 2 Chaithanya 2600 9430.2 3.63 TSL 1 MTU 1001 2900 9381.84 3.24 TSL2 MTU 1001 2900 12440.06 4.29 TL1 Chaithanya 2900 9835.27 3.39 TL2 Chaithanya 2900 8490.45 2.93 THL1 Chaithanya 2900 10148.52 3.5 THL2 Chaithanya 2900 9524.73 3.28 Average 2750.00 8747.97 3.17 Control Plots CRSL1 Chaithanya 2300 7737.6 3.36 CRSL2 Chaithanya 2300 4534.39 1.97 CRL 1 MTU1001 2300 2745.6 1.19 CRL2 MTU 1001 2300 3598.39 1.56 CRHL1 Chaithanya 2300 5095.99 2.22 CRHL 2 Chaithanya 2300 6655.99 2.89 CTSL 1 MTU 1001 2600 3535.90 1.36 CTSL2 MTU 1001 2600 5678.4 2.18 CTL1 Chaithanya 2600 6552 2.52 CTL2 Chaithanya 2600 4721.59 1.82 CTHL1 Chaithanya 2600 7654.39 2.94 CTHL2 Chaithanya 2600 5574.39 2.14 Average 2450.00 5340.39 2.18
Conclusion
The study has clearly shown that the model is useful for dryland farmers, with slope gradient, by increasing the grain yield by up to 40%, particularly in paddy. This is due to significant impact on the physiological characters of the plant. If adopted in a large area this is also going to have the hydrological impact, as moisture was noticed for a longer duration. This model also has shown that the economical returns are more in experimental plots, even after loosing 5% of area for moisture conservation. The farmers also expressed their satisfaction, as this model could be easily adopted and couldn’t disturb their routine farming operations, unlike the dead furrow and other moisture conservation methods. This model also can be integrated with the alternative income generation like fish farming in pits, duck rearing in pits etc.
66

However, the replication of model requires intensive study, especially on hydrological aspects and impact of model on ground water resources. The study was conducted in farmer’s fields; hence, it could become difficult to maintain the statistical design to explain the results. However, the results and experiences can be used to conduct more research to bring out optimum model for a specific location, soil type and soil slope. The model also can be tried by agronomists by making different permutations with the improved technology like SRI (System of Rice Intensification) and organic farming. References Mangal Rai. 2005. Internalising synergies. The Hindu Survey of Indian Agriculture.
67

A SYSTEM HARMONISATION FRAMEWORK TO ACHIEVE SUSTAINABLE WATER SAVINGS
IN RICE BASED SYSTEMS
Shahbaz Khan1 Abstract Irrigation and environmental sustainability in rice based systems have to date been managed as two competing enterprises under separate and divergent control. In Australia there is increasing support for a “Harmonised” business approach to sustainable use of land and water resources in rice cultivation areas in the Murrumbidgee and the Murray Catchments to achieve real water savings. A good understanding of system wide harmonisation can be gained from how irrigation systems are linked with the catchment water cycle. The irrigation system involves many subsystems, all which are intrinsically linked to one another, not only physically, but also with the environment and to the society within which they exist. In addition to establishing the base physical, economic and social position of the region some of the key pressure points in the system and the constraints they impose can be identified. In particular, these relate to the capacity to optimise on farm and near farm irrigation system performance and water demand patterns to deliver productive and environmental dividends. It should be noted that the key pressure points in a system are not necessarily physical or biophysical. They can also be of an economic, social, environmental or institutional nature as well. It is the changes in these key pressure points that need to be assessed in a comprehensive and systematic way that is the focus of system harmonisation. The System Harmonisation initiative seeks to identify business opportunities for irrigators to become part of an expanding environmental services industry and in so doing support a truly sustainable and diversified irrigation business environment. Introduction
A new initiative called System Harmonisation for Applied Regional Planning (SHARP) under the Cooperative Centre for Irrigation Futures (CRC-IF) in Australia aims to “improve the business of regional irrigation by seeking to “set up enduring business arrangements” that “connect irrigators with environmental services as well as increasing water productivity”. The CRC-IF “will help facilitate these business
1 Program Leader Cooperative Research Centre for Irrigation Futures, Australia, Regional Coordinator, UNESCO IHP-HELP Senior Principal Scientist and Professor CSIRO Land and Water and Charles Sturt University, Locked Bag 588, Wagga Wagga 2678 Phone: +61-2-6933 2927 Fax: +61-2-6933 2647 Email: [email protected]
68

arrangements and will identify and provide the research needed to connect and improve.” System wide harmonisation is defined as “a strategy to improve cross-organisational communication and system-wide management and improve production and environmental outcomes.” The key objective of this research program is to establish Regional Irrigation Business Partnerships (RIBPs) to capture the production and environmental gains from research improving regional irrigation systems management and to market these benefits through a regional business plan or investment prospectus. Elements of System Harmonisation Using a conceptual-operational analysis a five way System Harmonisation for Applied Regional Planning (SHARP) feasibility template (Fig. 1 and 2) has been developed to generate new science and knowledge for harmonising rice based irrigation systems with their operating environments through agronomic, economic, technological and institutional improvements in water management. Each feasibility step will involve a Conceptual-Operational-Monitoring (COM) cycle (Fig. 3) to determine the “business opportunities” and “key pressure points” as listed below: Conceptual Assessment: This will involve selection/development of conceptual assessment framework and a wide ranging biophysical, environmental, economic, social, cultural and institutional assessment to identify “business opportunities” and “most relevant variables”. Operational Analysis: This means focussing at an operational level on the “most relevant variables” that represent the key pressure points which can be adjusted to achieve selected “system harmonisation opportunities”. Monitoring and Evaluation: This will involve designing smart monitoring systems for monitoring key variables that can capture progress towards “harmonised irrigation systems”. Summaries of key research hypothesis, questions and methodologies for each of the feasibility steps are presented in the following sections.
69

Fig. 1. Five way feasibility leading to SHARP implementation
This approach builds on the triple bottom line (social, economic and biophysical) integration approach presented by Khan (2004). Key challenges and opportunities of water savings and sustainability of rice based irrigated agriculture are give by Khan (2005) and Khan et al. (2006). This paper describes a five way feasibility to achieve real water savings and better environmental outcomes in rice based systems.
Analysis and Characterisation of Hydrologic Systems
Water Productivity, Markets & Environmental Dividends
Mechanisms and Processes for Change
Business Plan
Delivery Mechanisms
Total Water Cycle Management Optimising Operating Systems at the River System, Near-Farm and On-Farm Levels
Business Opportunities
TBL Harmonisation Opportunities
At a range of scales
Embedded Adoption
Implementation in Partnership Sites
Fig. 2. Knowledge generation during the SHARP feasibility
70

Operational AnalysisSHARPCon
cept
ual A
ssessm
ent
SHARP
Monitoring and EvaluationO
perational AnalysisSHARPConce
ptua
l Asse
ssmen
t
SHARP
Monitoring and Evaluation
Fig. 3. The COM research cycle for SHARP feasibility
Analysis and Characterisation of Hydrologic Systems This feasibility step will involve hydrological characteristics of the region and seeks to build an interactive “Water Balance and Residual Waste Statement of the Water Cycle” as shown in Fig. 4. In addition to establishing the base position of the region this feasibility stage will also identify some of the key pressure points in the system (shown as hexagons) – in particular the capacity to optimise on farm and near farm irrigation system performance and water demand patterns to deliver productive and environmental dividends.
CLIMATE VARIABILITY and CHANGERainfall
CATCHMENTIRRIGATION
GROUNDWATER
WETLAND
RIVER
ESTUARY
SEADAM
CLIMATE VARIABILITY and CHANGERainfall
CATCHMENTIRRIGATION
GROUNDWATER
WETLAND
RIVER
ESTUARY
SEADAM
Fig. 4. Identification of key pressure points in the irrigated catchment water cycle
71
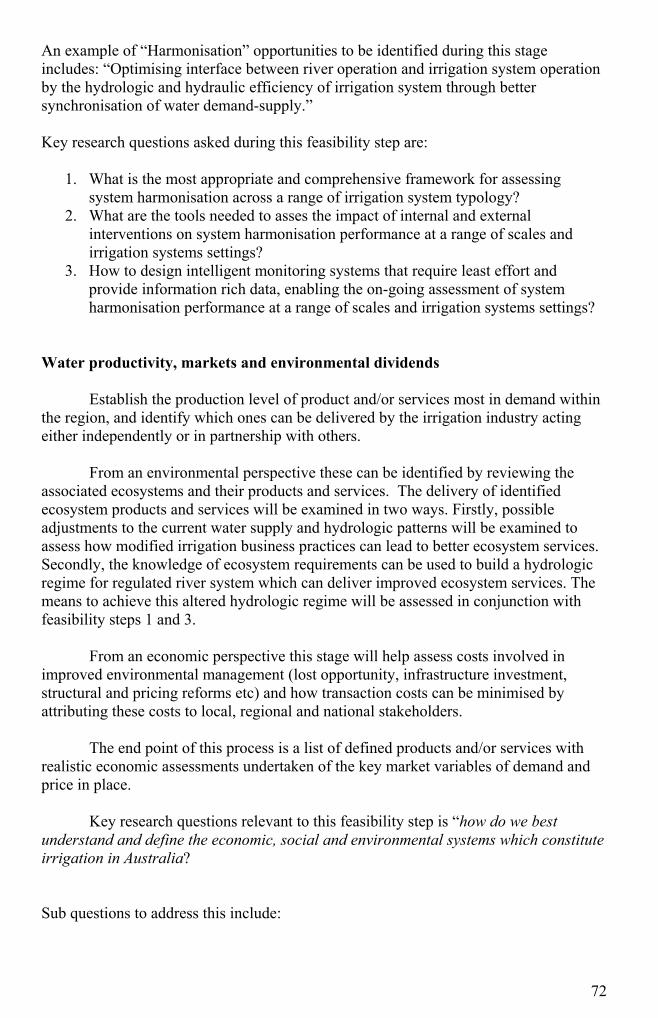
An example of “Harmonisation” opportunities to be identified during this stage includes: “Optimising interface between river operation and irrigation system operation by the hydrologic and hydraulic efficiency of irrigation system through better synchronisation of water demand-supply.” Key research questions asked during this feasibility step are:
1. What is the most appropriate and comprehensive framework for assessing system harmonisation across a range of irrigation system typology?
2. What are the tools needed to asses the impact of internal and external interventions on system harmonisation performance at a range of scales and irrigation systems settings?
3. How to design intelligent monitoring systems that require least effort and provide information rich data, enabling the on-going assessment of system harmonisation performance at a range of scales and irrigation systems settings?
Water productivity, markets and environmental dividends Establish the production level of product and/or services most in demand within the region, and identify which ones can be delivered by the irrigation industry acting either independently or in partnership with others. From an environmental perspective these can be identified by reviewing the associated ecosystems and their products and services. The delivery of identified ecosystem products and services will be examined in two ways. Firstly, possible adjustments to the current water supply and hydrologic patterns will be examined to assess how modified irrigation business practices can lead to better ecosystem services. Secondly, the knowledge of ecosystem requirements can be used to build a hydrologic regime for regulated river system which can deliver improved ecosystem services. The means to achieve this altered hydrologic regime will be assessed in conjunction with feasibility steps 1 and 3. From an economic perspective this stage will help assess costs involved in improved environmental management (lost opportunity, infrastructure investment, structural and pricing reforms etc) and how transaction costs can be minimised by attributing these costs to local, regional and national stakeholders. The end point of this process is a list of defined products and/or services with realistic economic assessments undertaken of the key market variables of demand and price in place. Key research questions relevant to this feasibility step is “how do we best understand and define the economic, social and environmental systems which constitute irrigation in Australia? Sub questions to address this include:
72

• What are the most appropriate approaches for understanding the irrigation
schemes? • What are the most appropriate methods of establishing the importance of
irrigation and water resources within a region with respect to the economic, environmental and social performance of the region?
• What outcomes, (environmental, economic and social) are acceptable/sought following any change in hydrological flows?
• What is the current status of water productivity, the environmental systems, and the social values of the region under study?
• What are the transaction cost issues, how might they impact on the cost/benefit (triple bottom line version) of investments and what are the best ways of reducing these and dealing with any transaction cost impact issues?
• What environmental outcomes or regional values are primarily affected by irrigation practice?
• What is the value of individual ecosystem services that can be affected by irrigation management
• What are the risks and uncertainties that govern water use in the sector? What options are available to minimise risks?
• By changing practices what could the irrigation operators do to improve environmental, social and economic outcomes (individually and collectively)?
• Is there a ‘critical mass’ or minimum level (e.g. number of irrigators) of practice change among individuals that is necessary to bring about these outcomes?
Mechanisms and processes for change An understanding of the most appropriate change management strategies and institutional and policy settings is needed to facilitate movement towards a more productive and sustainable irrigation environment. This process involves a comprehensive scan of the business environment to identify the social, cultural, legislative and institutional barriers and opportunities. At the operation level the provision of “harmonisation services” within a market context is new and as such it will be necessary to identify and/or establish mechanisms and processes to enter new markets and trading facilities. Triple bottom line monitoring and evaluation of “progress” towards “system harmonisation” will be developed as part of the implementation process.
• What are the regulatory issues (spanning government, industry or other code and self-regulation) involved in irrigation investments/systems, how might these impact on irrigation investments and outcomes, and how can the cost-effectiveness of these be optimised for a given situation or project.
• What are the risks to social, economic, environmental or commercial outcomes, and what mechanisms (financial, managerial, political, and economic) are best suited to minimise these?
• What are the system resilience issues (social, economic, environmental and commercial) of importance in irrigation systems and communities, what are the
73

relevant contingencies that might impact, and how can the resilience values be optimised through business plans developed?
• What are the issues of divergence of perspective, or different visions that are relevant to irrigation systems and communities? How might this impact on outcomes? How can they be best addressed? How can a shared vision and commitment be achieved?
• What political issues and processes are most relevant to irrigation systems and communities, and what impacts might these have? How can irrigation systems be designed (in terms of inputs, processes and outputs) to best harness and maintain political support? What political strategies are needed? How can they/should they be implemented?
Developing a business model The research outputs associated with the above three main areas run the risk of delivering only dry academic tomes if not utilised in a meaningful fashion – hence the strict relationship between the System Harmonisation Research Program and the development of a business plan for improved water management within a particular area and its subsequent implementation by our partners or others within the region. The research will involve key stakeholder as partners to help define region specific issues and deliver relevant solutions ready for adoption. Having identified the market, defined the product and established a legislatively and institutionally acceptable route to market the feasibility process begins in earnest. During this phase detailed biophysical and socio/cultural analysis of the feasibility of providing the products and/or services required at the market defined price/volume relationships previously identified will be undertaken in conjunction with feasibility stages 1, 2 and 3. The questions addressed during this stage include:
• Is it possible to develop generic investment models for system harmonisation opportunities?
• How can we integrate Value Chain Management/Value Management and System Harmonisation?
• How can we generate a template for Harmonised Irrigation Businesses and Environments?
The CRC-IF is aware of various business feasibility models used in both the public and private sectors, which continue to evolve in economic, financial, social and environmental terms. From a business and investment perspective such models include ‘public-private partnerships’; those commonly used and measured in private enterprise; economic modelling and others established in government legislation. These models will be assessed with the RIBPs.
74

Implementation challenges Like any feasibility study successful execution occurs when a business entity has been established to meet the market demand in a profitable and sustainable fashion. Ultimately the success of the project is best evaluated by the liquidity of this entity and the growth in shareholder value. A key feature of this market place will be the need to create a business model which manages to convert the largely public good nature of individually positive actions into a collective output which can be privately implemented and traded. This will require not only a sound understanding and demonstration of the biophysical realities of the region but the establishment of robust cooperative business structures and regional investment partnerships. The CRC-IF is keen to implement system harmonisation sites by developing “Regional Irrigation Business Partnerships” with groups of irrigators wishing to explore an alternative approach to securing their long term future. The first and most important characteristic of an RIBP site is that it is fully and enthusiastically endorsed by our industry partners. The CRC-IF’s mandate is to deliver improved productivity, profitability and sustainability to irrigation Australia wide, but in this instance we wish to focus our activities very strongly around specific industry partner needs. Other vital characteristics for an RIBP would include:
• There is enough surface and ground water data to enable a clear understanding of key water management issues;
• There is a demonstrated need to change or recognisable opportunity for improved productive and/or environmental outcomes through improved water management;
• There are clearly identified biophysical, social, economic and institutional issues which are likely to respond to the coordinated alignment which is suggested within the System Harmonisation program;
• An existing organisation or individual represents a potential champion for the process;
• Clear business opportunities have are likely to be identified with potential funding partners available;
• The scale of the overall project is commensurate with the combined CRC-IF and RIBP resources; and
• The time scale for change is in line with CRC-IF objectives to deliver real change within a 4 year time frame.
The key rice based RIBP selected for System Harmonisation program is the Coleambally Irrigation Area in the Murrumbidgee Catchment. Currently researchers and stakeholders are exploring business based opportunities for reducing peak summer water demand by options such as:
• Construction of en-route storages
75

• Better management of channels • Conjunctive use of surface and ground water • Improved winter and summer cropping mixes
References Khan, S. 2004. Integrating hydrology with environment, livelihood and policy issues – the Murrumbidgee Model. Special Volume on Hydrology for the Environment Life and Policy. Water Resources Development Vol. 20(3):415-429. Khan, S. 2005. Improving on-farm vs regional water use efficiency – who pays and owns the losses. Irrigation Association of Australia Conference Townsville 18-19 May 2005. http://www.irrigation.org.au/Irrig2005/papers/Shahbaz%20Khan%20Onfarm%20vs%20regional%20WUE.pdf Khan, S., Rana, T., Yuanli, C. and Blackwell, J. 2006. Can irrigation be sustainable? Agricultural Water Management. 80:87–99.
76

PERCEPTIONS OF RICE GROWERS IN ADOPTING WATER CONSERVATION TECHNIQUES IN SINDH PROVINCE OF
PAKISTAN
Y. Memon1, M. Mirani2, F. M. Marri3, F. Qureshi4, K. Bibi5 and E. M. Rajpar6
Abstract Agriculture is the main contributor to Pakistan’s economy. Pakistan’s economic development is therefore directly linked to the progress of agriculture sector. Agriculture contributes about 25% to the Gross Domestic Product (GDP) of the country. Sindh is the second largest province of Pakistan on the basis of population and also on the basis of its contribution to agricultural production of the country. About 40% of the area of the Sindh is arable land and 5% is rangelands. Total cultivated area of Sindh is 5.88 million hectares and net area sown is 2.39 million hectares. Agricultural progress of Sindh province is linked with the supply of irrigation water from the river Indus. Severe drought recurs in Sindh. Drought has badly affected the surface irrigation water flows in the Indus River system. The cropped area has, therefore, reduced quite considerably. Availability of proper and reliable irrigation water is the main constrain in agriculture development. Agriculture is the major user of fresh water but water use efficiency is low for a variety of reasons. In addition to huge water conveyance losses from canal head to farm gate, significant water losses also occur during field applications due to unleveled fields, flood irrigation system, and improper sizing of plots. Unleveled fields not only result in wastage of scarce water resource but also reduce fertilizer use efficiency and crop yields due to over and under irrigation in different parts of the same field. These losses can be saved through lining of watercourses, precision land leveling (PLL) and adoption of water saving techniques. Other water saving techniques include bed and furrow plantation system, and high efficiency irrigation system like sprinkler, and trickle/drip. In addition to the above measures, it may also require adjusting the crop rotations and crop varieties that suit water availability while considering soil, climate and other relevant factors.
This paper highlights the perceptions of the rice growers in Sindh, identifying the issues and possible measures for water conservation.
1 Yameen Memon, Chief Executive, Management & Development Center, Hyderabad, Sindh Pakistan. 2 Mushtaq Mirani, Associate Professor, Mehran University of Engineering & Technology, Jamshoro, Sindh, Pakistan, 3 Fateh Muhammad Marri, Assistant Professor Agricultural Economics, Sindh Agriculture University, Tandojam, Sindh, Pakistan. 4 Fiza Qureshi, Program Manager, Sindh Rural Support Program (SRSP), Hyderabad, Sindh Pakistan. 5 Kulsoom Bibi, District Coordinator Training, National Commission for Human Development (NCHD), Hyderabad, Sindh, Pakistan. 6 Erum Maria Rajpar, Program Manager, Natural Resources Management, SAFWCO, Hyderabad, Sindh, Pakistan.
77

Introduction The agrarian economy of Pakistan is mainly based on four major crops including rice, wheat, sugarcane and cotton. All these crops depend on irrigation water. The irrigation system of Pakistan is the largest integrated irrigation network in the world. Pakistan ranks fifth in the world and third in Asia in terms of irrigated area. There are three major storage reservoirs, namely, Tarbela and Chashma on River Indus and Mangla on Jhelum River. The irrigation system has 19 barrages; 12 inter-river link canals; 43 independent irrigation canal commands; about 4,000 distributaries/minors and over 107,000 watercourses (Government of Pakistan, 2004,2005). In Pakistan, irrigated agriculture mostly produces food items by allocating 55% of the cultivated area to the wheat, rice and other crops (Government of Pakistan 2005). At present, about 83% of water used in Pakistan is being used for agricultural purposes to produce food as well as cash crops; while the remaining 17% is being used by the industries and municipalities. It is estimated that the water needed for household consumption and industry will increase in next 25 years; therefore availability of water for agriculture will be reduced from 83 to 70%, while the urban and industrial use will be increased considerably. The availability of irrigation water would emerge as a critical bottleneck for food security and poverty alleviation in Pakistan. Therefore, efficient use of irrigation water is a major concern for the policy makers and researchers so that the country is not only able to meet the food demand of the growing population but can earn foreign currency by exporting a number of agricultural commodities. Rice is an important food crop of Pakistan. Rice export from Pakistan is expected to exceed $750 million during the current financial year (2005-2006). Rice varieties of Basmati and Irri-6 would contribute over 70 percent in total exports from the country (EPB, 2006). Rice is produced in different agro ecological zones of the country. It is not only a source of income to the farmers of these areas but in many agro ecological zones, rice has no alternative crop. Rice is considered a high delta crop, so it does not only consume more water, but also causes the problem of water logging and salinity in these agro ecological zones. The excessive use of water can be reduced by cultivating varieties requiring relatively less water and adopt such technologies which can save water. The perceptions of farmers are fed back to the researchers and used for improvement in technology, extension and support services to the farming communities for adoption of water saving technologies. The paper aims to present the status of rice production and water availability in Pakistan, and analyzes the perceptions of rice growers in Sindh. The paper further aims to deduce from the problems of water saving technologies adoption and extension needs and makes policy recommendations for the efficient use of irrigation water and development of water saving technologies in rice growing areas in the country. The area devoted to produce rice in Pakistan is increasing over time. The area under rice has increased from 2.07 to 2.46 million hectares in the year 2003-2004. The rice production in Pakistan has increased from 3.49 million metric tones in 1989-90 to 4.85 million metric tones in the year 2003-2004 (Government of Pakistan 2004). Figure 1 presents the details of the area and production of rice in the country. The figure further
78

shows the trend of rice yield per hectare in Pakistan. The rice yields in Pakistan have slightly increased. The data further shows that the rice area in Sindh has decreased from 0.72 in 1989-90 to 0.55 million hectares in 2003-04, while the production has also decreased from 5.15 to 1.43 million metric tones for the same period. The yields of rice across provinces indicate that Sindh leads in rice yields followed by Balochistan, NWFP and Punjab provinces.
0
1000
2000
3000
4000
5000
6000
1989
-90
1990
-91
1991
-92
1988
-89
1992
-93
1994
-95
1987
-88
1986
-87
1993
-94
1995
-96
2001
-02
1997
-98
1996
-97
1998
-99
2003
-04
2002
-03
2000
-01
1999
-00
2000
-01
2001
-02
2002
-03
2003
-04
Area Production Yield/ha kgs
Fig. 1. Area, Production and Yield of Rice in Pakistan from 1989-90 to 2003-04 Source: Government of Pakistan. 2004. Agricultural Statistics of Pakistan 2003-04. Economic Wing, Ministry of Food Agriculture and Livestock, Islamabad. Note: The area is in thousand hectares, production in thousand tones and yield in kilograms per hectare. Materials and Methods A survey was conducted for this paper to collect data from rice growers by using a detailed and pre-tested questionnaire. The data was collected by conducting personal interviews of rice growers at their places of residence or at crop fields. A 1-5 point response scale was used to record the expressed perceptions of farmers for water saving technologies in rice production. The number one in the scale was representing the lowest side and five represented the higher side. The sample of 175 farmers was adopted for the district Badin of Sindh province through random sampling technique. Secondary data of the area and production of rice as well as the availability of water was also used in this paper. The results of the survey are presented in the following sections.
79

Results and Discussion 1. Educational Level of Respondents The education of the respondents has a significant role in crop production practices and decision making. The status of education of the sample respondents is presented in Table 1.
Table 1. Farmer’s educational level
Sr. No Educational Level Number Percentage 1 None 33 19 2 Primary 72 41 3 Secondary 26 15 4 High School 28 16 5 College/University 16 9 Total 175 100
The results reveal that 19 percent of the rice growers in the study area are illiterate, while 41 percent has received primary education. A small number of farmers totaling 9 percent got college or university level education, while 16 percent had high school level and 15 percent had secondary school level education. 2. Farming experience Farming experience is other important indicator for efficient use of resources including labor and capital inputs and irrigation application. Experience enables one to use the technology more efficiently. Table 2 presents the results showing the years of farming experiences of rice growers.
Table 2. Farming experience
Sr. No Farming Experience (Years) Number Percentage 1 1—10 25 14 2 11—20 90 51 3 21—30 25 14 4 31—over 35 20 Total 175 100
Table 2 shows that a majority of farmers (51%) possessed 11 to 20 years of experience. Twenty percent of rice farmers had more than 31 years of experience, 14 percent had either 1-10 years or 21-30 years of experience. 3. Farm size Farm size is considered an important indicator of technology use in the literature of agriculture economics. The big farms size faces less problems of liquidity and has more access to the resources including technologies and support services.
80

Table 3. Rice farm size
Sr. No Farm Size Number Percentage 1 Small 43 25 2 Medium 93 53 3 Large 39 22 Total 175 100
Table 3 demonstrates the farm size of the rice growers in the study area. The results show that 53 percent of sample rice farmers had medium size of farms, while 25 percent had small farms. The large size farmers were only 22 percent of the selected sample. Small, medium and large farms define as: less than 12.5, between 12.5 to 25 and greater than 25 ha respectively. 4. Extension needs of rice growers The analysis of rice growers perceptions about their needs of water related extension advice/guidance were undertaken for the following 15 items. The results of these items are presented in Table 4. The rice growers’ perceptions presented in Table 4 show that farmers ranked the need of information for less water requiring varieties highest followed by the knowledge about soil and its deficiencies and fertilizer requirements. The results further reveal that farmers perceived the need of knowledge about appropriate water saving techniques very important and ranked on number three. The control of zink deficiencies in soils was perceived as least significant by the rice growers in the study area. The results further reveal that farmers perceived a number of training needs starting from touching on different issues to operational and applied trainings.
Conclusions The results show that the majority of farmers have primary education or no education and have less than ten years experience of farming. The results further show that majority of rice farmers are medium size farmers. The results further reveal that farmers perceived number of training needs starting from touching on different issues to operational and applied trainings.
Recommendations Based on the survey results, this paper recommends that: • Water efficient rice varieties be produced • Efficient irrigation system be developed for rice growing • High yield giving rice varieties be produced • Farmers be trained in modern rice growing methods • Farmers be trained to get maximum profits from marketing of exportable rice
varieties
81

Table 4. Needs of sample rice growers
Sr. No Need Mean STD Rank1 Guidance about proper time, number, depth and method
of plowings 2.22 0.79 11
2 Guidance about proper leveling practices 1.92 0.829 143 Guidance on cleaning of channels and fixing rodent holes 2 1.161 134 Knowledge about less water requiring varieties and their
seed rate 4.32 0.653 1
5 Guidance about proper time of nursery raising 2.54 1.092 96 Information on proper size of nursery seed bed 2.32 0.913 107 Guidance on seed bed preparations 2.02 1 128 Knowledge about nursery irrigation 3.8 1.01 49 Knowledge about proper fertilizer, manure and its doze
and method of application to the nursery 2.66 0.917 7
10 Knowledge about nursery protection measures 2.78 0.815 511 Knowledge about soil deficiencies and fertilizer requirement 4.1 0.789 212 Symptoms and measures to control zinc deficiencies 1.9 1.165 1513 Knowledge about appropriate water saving techniques 3.92 0.9 314 Guidance about water irrigation requirement 2.98 0.845 615 Effect of low and higher water levels on rice crop 2.54 0.92 8
References Export Promotion Bureau, FPB. 2006. www.epb.org. website of Export Promotion Bureau accessed in the month of March 2006. Government of Pakistan. 2004. Agricultural Statistics of Pakistan 2003-04. Economic Wing, Ministry of Food Agriculture and Livestock, Islamabad. Government of Pakistan, 2005. Pakistan Economic Survey 2004-2005. Finance Division, Economic Advisor’s Wing, Islamabad.
82

PRACTICAL APPLICATION OF ROTATIONAL IRRIGATION SCHEDULING SYSTEM (RISS) FOR WATER
SAVING TO DONGHWA IRRIGATION DISTRICT IN KOREA
Kim, Tai-cheol1, Jae-myun, Lee2, Dae-sik, Kim3 and Jong-pil Moon4
Abstract The principle management rule of irrigation reservoirs is to accelerate the water supply fully, if reservoir storage is sufficient, and to restrict the water supply otherwise. The traditional irrigation method, which distributes equally and simultaneously irrigation water to all paddy fields within an irrigation district, however, has been adopted even in drought periods. In order to supply irrigation water effectively in spite of drought periods, a rotational irrigation method, which considers rotation of water supply between several irrigation units within an irrigation district, should by systemized practically. There were no proper operational rules of irrigation reservoirs for the rotational irrigation scheduling system, water managers have difficulty knowing when to restrict the irrigation water supply and how to reduce the amount of irrigation water during a serious drought period. With the help of information from the weekly rainfall forecasting and restriction ratio in the operation rule curve, the rotational irrigation scheduling system has been proposed and applied to mitigate the serious damage of drought more reasonably and practically.
The rotational irrigation scheduling system in paddy with the operation rule curve and weekly rainfall forecasting was developed and can be utilized as a software program to install tele-metering and tele-control systems for irrigation water supply. The rotational irrigation scheduling system is now being practically installed in the Donghwa automation project.
Introduction Tele-metering and tele-control (TM/TC) technology for irrigation water is to save irrigation water through systematic water management of irrigation reservoir. In Korea, TM/TC projects have been performed to do on-off control of water gates in irrigation reservoirs for conventional irrigation methods, not to save irrigation water through control of reservoir's gate for restricted irrigation methods considering drought season, such as a rotational irrigation method. Kim et al. (2003) showed new system, rotational irrigation scheduling system (RISS).In the rotational irrigation system one
1 Prof. Dept. of Agricultural Engg., Chungnam National Univ., Daejeon, Korea, 305-764 [email protected] 2 Researcher, Institute of Agricultural Science and Technology, Chungnam National Univ., Daejeon, Korea, 305-764 3 Assistant Prof. Dept. of Agricultural Engg., Chungnam National Univ., Daejeon, Korea, 305-764 4 Researcher, Institute of Agricultural Science and Technology, Chungnam National Univ., Daejeon, Korea, 305-764
83

should consider water depth in the reservoir, weather forecasting from the internet, soil moisture condition in watershed of the reservoir, and drought scenarios for the future in short period. From the present storage ratio of reservoir and an operation rule curve (ORC) as a guideline for releasing irrigation water, reservoir operators could determine the appropriate time when the irrigation water supply should be restricted, including methods how to calculate the deficient amount of irrigation water.
RISS applied to real irrigation district, Donghwa dam area in Korea, in order to control the release amount of the irrigation water at drought season, not to open and close the water gate just remotely. Thus this study is to verify the effectiveness of the new system and also to test some applicability of rotational irrigation methods with several scenarios. The purpose of this study is practically to apply a RISS in paddy with the ORC for irrigation reservoir, Donghwa dam district. Concept of RISS One irrigation reservoir has generally two components of a watershed and an irrigation district as shown in Fig. 1, so that reservoir operators have to consider simultaneously both the inflow from the watershed and the release to the irrigation district, in order to effectively manage the storage water in the reservoir during drought season. In the three components including a reservoir, several existing studies have developed rainfall-runoff models for watersheds, reservoir operation models for reservoirs, and water requirement models for irrigation districts, respectively (Kim, 1992; MAF, 1999; Senga, 1985; Senga, 1989; Votruba and Broza, 1989). In drought season, however, a new approach, which can save the reservoir storage for the longer drought duration, should be developed by interfacing effectively the three types of models in the three components, including new concept for drought evaluation in irrigation district. As a new approach, this study developed a conceptual diagram, as shown in Fig. 1. The diagram consists of five steps: Step 1 for operation rule generation in an irrigation reservoir, Step 2 for drought evaluation and definition of irrigation methods in each drought state, Step 3 for gross duty of water (GDW) in irrigation district considering weather forecasting information, Step 4 for effective rainfall and runoff in watershed considering the expected rainfall, and Step 5 for determining irrigation method and release rate by interfacing operation rule curve, GDW, and the expected storage ratio.
84

Fig. 1. Conceptual diagram of the RISS
Generation of operation rule curve (ORC)
The ORC, includes a reference storage curve and a restricted release curve, it is a guideline for the time schedule when to restrict the supply and for the calculation methods on how to decide the release amount of deficient irrigation water (Kim et al., 2003).
Reference storage curve (RSC)
The amount of deficit or surplus water in either a day or period in the equation (1) can be calculated by subtracting the gross of duty water from the inflow (Senga, 1989). Let’s consider that the reservoir at the end day of irrigation season will be empty if the reservoir can be operated the most effectively. Storage volume needed to meet the water deficit can be added up from the end to the beginning of irrigation season in a reversed order as shown in equation (2). In this case, the storage volume is assumed as “0” if it is below “0” (equation (3)). In this manner, daily sequence data (STV(1)10,,, STV(i)10,,, STV(n)10, where subscripts mean return period and n denotes the end day of irrigation season)of storage volume for certain return period (herein 10 years) can be obtained by frequency analysis from available data series (STV(i)1,,,,, STV(i)30, where superscripts mean each year) for the last 30 years, as shown specifically in Step 1 of Fig. 2. Thus each irrigation reservoir can have a reference storage curve connecting values of daily reference storage volume, which has 10-year frequency value for every day.
DEF_SUR(i) = INF(i) - GDW(i) (1)
STV(i) = STV(i+1) – DEF_SUR(i) (2)
if STV(i) < 0, then STV(i) = 0 (3)
85

where i denotes time (day), INF Inflow (m3), GDW Gross duty of water (m3), DEF_SUR deficit or surplus water (m3), and STV Storage volume(m3).
Restricted release curve (RRC)
Water supply in a day should be restricted if the reservoir storage value of the day is less than the reference storage volume in order to keep the reservoir storage not to be empty during the irrigation season. The ratio of restriction (S) can be determined by present reservoir storage volume and water requirement in irrigation district with regards to the rice growing stage. Thus, the equation (1) can be written as equation (4) if the restricted release ratio, S. Then the equations (2) and (3) can be also derived as equations (5) and (6).
DEFS(i) = INF(i) - ( 1 - S ) GDW(i) (4)
STV(i) = STV(i+1) - DEFS(i) (5)
if STV(i) < 0, then STV(i) = 0 (6)
where DEFS means DEF_SUR with restricted release ratio, S. Determining irrigation method and release rate
Reservoir operators, in Step 5 of Fig. 1, can compare the RSC with the storage ratio from Step 4 and evaluate drought state for the next 6 days considering the forecasted rainfall, GDW, and effective rainfall in paddy. As the next step, operators can also select an irrigation method according to the drought state as shown in Fig. 4, which shows that an irrigation method for each drought state has time schedule of release and irrigated amount for the irrigation district. If GDW in paddy is 100%/day in Fig. 2, the restricted irrigation methods to save water in reservoir mean that the reservoir supply water below 100%/day such as 90%/day, 80%/day, 60%/day, and 40%/day, as the unit irrigation rate for the total area, must be maintained in order to save water of 10%, 20%, 40%, and 60%. The irrigation blocks of "on-irrigation state" receive 120%/day for all rotational irrigation methods of the severe, extreme, and exceptional drought states, as shown in the calculation method of Fig 2. The rest of the water 20%/day (120%/day-100%/day) can be considered for various purposes, such as the surge effect in the irrigation canal at the drought state, or the water retention for the day before and after the "on-irrigation". In these restricted irrigation methods, it is assumed that there are no any damage in paddy due to deficient irrigation water.
86

Re a e
A: the total irrigation area, 120%/day = (A*80%/day)/(2*A/3), (A*60%/day)/(A/2), (A*40%/day)/(A/3)
Fig. 2. Detail process of the RISS for each irrigation method in Step 5
If GDW = 100%/dayDrought state & irrigation method
Normal state Moderate drought
Severe drought Extreme drought Exceptional drought
Storage ratio expected Operation rule curve
40%/day
60%/day
80%/day
90%/day Release amount from reservoir
Block
Block
Block
Irrigated amount
100%/day
igation type Normal supply 10% save 20% save 40% save 60% save
Drought state
pectation of servoir storage
nd drought valuation
100%/day, A/3 100%/day, A/3 100%/day, A/3
90%/day, A/3 90%/day, A/3 90%/day, A/3
120%/day, A/3 120%/day, A/3 120%/day, A/3
120%/day, A/2 A/2, 120%/day
120%/day, A/3 120%/day, A/3 A/3, 120%/day
Ex
Irr
Effectiveness of RISS Simulation of ponding depth In order to analyze the effectiveness of the rotational irrigation system, this study simulated the ponding depth in paddy field for six days by the conventional method and the new method. As boundary condition of the simulation, this study assumed that initial ponding depth is 30mm, maintained by the conventional method before application of the rotational irrigation method, allowable ponding depth is 60mm, and average ponding depth is 30mm. The equation used for the simulation is:
PD(i) = PD(i-1) + R - ET - P (7) where PD is ponding depth (mm), R rainfall (mm), ET evaportranspiration (mm), and P infiltration rate (mm). For the actual simulation, this study used the data set of Yedang reservoir and irrigation district of Korea studied by Kim et al. (2003). The water requirement from June 5th to June 10th 2003 is calculated as 10.6, 10.2, 9.9, 6.1, 7.4, 7.6 mm per day by considering modified Penman equation (Doorenbos and Pruitt, 1977) and infiltration rate 3mm/day. In this case, although conventional irrigation method irrigates daily water requirement, the rotational irrigation method supplies 80% of the water requirement by the 20% restricted irrigation scheduling method with each block's characteristics. This simulation shows the ponding depth in Table 1 and Fig. 3.
87

88
As shown in Fig. 3, the ponding depth by the conventional irrigation method is maintained as 30mm, if the reservoir irrigates fully as much as water requirement, while the ponding depth by the rotational irrigation method with 20% restricted condition is decreased until 19.6mm. In the case of the rotational irrigation method, meanwhile, each irrigation block has the ponding depth of 21.4mm, 16.6mm, and 20.4mm for the first, the second, and the third blocks respectively. On the 6th day, most of all ponding depth by the two methods show same results about 20mm as shown in Fig. 3. Compared with total amount of irrigation water, the conventional method used 3.574×10⁷m3 for total irrigation district 6,900ha, while the rotational method irrigated 1.069, 0.077 and 0.102×10⁷m3 for the first, the second, and the third blocks respectively, as total water amount 2.859×10⁷m3. Simulation of water depth in irrigation canal
Another effectiveness of rotational irrigation system is surge effect due to higher water depth in irrigation canal, 120% of conventional irrigation water amount in rotational irrigation method for each block, than that in the case of the simple restricted irrigation method for whole district, for example, the 20% restricted irrigation method will maintain water depth of 80%. In the case of 60% restricted irrigation method, the water depth will be 40% of normal water depth, so that the surge effect of water flow is 1/3 of the rotational irrigation method, 120% water depth. This low surge effect will derive some problem such as low water velocity itself, evaporation and infiltration for long time in the canal due to the low velocity, and time consumed for irrigation scheduling (Fig. 4).
The on-blocks for rotational irrigation have 120% of irrigation water more than normal irrigation method, while the off-blocks can have zero depth for 2 days, which is lower than the restricted irrigation method for whole district. One research report of Thailand says that the zero depth for a few days can give oxygen to root of rice, so that growth and production of rice can be better. This term shows that the RISS is not bad even zero depth for several days in off-blocks and this system can be also applied to real control of irrigation reservoirs. In irrigation canal, the water depth by RISS has the surge effect with 120% of water depth in on-blocks, containing irrigation scheduling with sufficient water velocity and low water loss in the canal due to the velocity.

89
Table 1. Comparison of ponding depth by irrigation methods (unit : mm)
Irrigation method Area Date Evapo-
transpiration PercolationPonding depth of previous
day
Water requirement
Actual water supply
Ponding depth of each day
2003. 6. 5 7.6 3 30.00 10.6 10.6 30.00
2003. 6. 6 7.2 3 30.00 10.2 10.2 30.00 2003. 6. 7 6.9 3 30.00 9.9 9.9 30.00 2003. 6. 8 3.1 3 30.00 6.1 6.1 30.00 2003. 6. 9 4.4 3 30.00 7.4 7.4 30.00
Customary irrigation
Whole area
(6,900ha)
2003. 6.10 4.6 3 30.00 7.6 7.6 30.00
2003. 6. 5 7.6 3 30.00 10.6 8.48 27.88
2003. 6. 6 7.2 3 27.88 10.2 8.16 25.84 2003. 6. 7 6.9 3 25.84 9.9 7.92 23.86 2003. 6. 8 3.1 3 23.86 6.1 4.88 22.64 2003. 6. 9 4.4 3 22.64 7.4 5.92 21.16
20% Restricted irrigation
Whole area
(6,900ha)
2003. 6.10 4.6 3 21.16 7.6 6.08 19.64
2003. 6. 5 7.6 3 30.00 10.6 11.95 31.35
2003. 6. 6 7.2 3 31.35 10.2 11.50 32.66 2003. 6. 7 6.9 3 32.66 9.9 12.20 34.95 2003. 6. 8 3.1 3 34.95 6.1 7.52 36.37 2003. 6. 9 4.4 3 36.37 7.4 0 28.97
Block #1 (2,475ha)
2003. 6.10 4.6 3 28.97 7.6 0 21.37
2003. 6. 5 7.6 3 30.0 10.6 0 19.4
2003. 6. 6 7.2 3 19.4 10.2 0 9.2 2003. 6. 7 6.9 3 9.20 9.9 12.20 11.50 2003. 6. 8 3.1 3 11.50 6.1 7.52 12.91 2003. 6. 9 4.4 3 12.91 7.4 9.23 14.75
Block #2 (2,005ha)
2003. 6.10 4.6 3 14.75 7.6 9.48 16.63
2003. 6. 5 7.6 3 30.00 10.6 11.95 31.35
2003. 6. 6 7.2 3 31.35 10.2 11.50 32.66 2003. 6. 7 6.9 3 32.66 9.9 0 22.76 2003. 6. 8 3.1 3 22.76 6.1 0 16.66 2003. 6. 9 4.4 3 16.66 7.4 9.23 18.49
Rotational irrigation
Block #3 (2,420ha)
2003. 6.10 4.6 3 18.49 7.6 9.48 20.37

05
10152025303540
2003- 06- 04 2003- 06- 05 2003- 06- 06 2003- 06- 07 2003- 06- 08 2003- 06- 09 2003- 06- 10Date
Pond
ing
dept
h(m
mCus tomary Bloc k #1 Block #2 Bloc k #3 20% Res tric ted
Fig. 3. Comparison of ponding depth by customary and rotational irrigation
020406080
100120140
2003- 06- 05 2003- 06- 06 2003- 06- 07 2003- 06- 08 2003- 06- 09 2003- 06- 10Date
Dep
th o
f ch
anne
l(%
Customary Block #1 Block #2 Block #3 20% Restricted
Fig. 4. Comparison of channel's depth by irrigation method
Application of RISS to Donghwa district Description of test area This study tried to apply RISS to Donghwa dam district, which located on Jangsoo-county, Cheonbuk-province, Korea, as shown in Fig. 5. Data set of Donghwa dam and its corresponding irrigation district are shown in Table 2. The data set says that the ratio of watershed to the irrigation area is 2.47:1, and this value means that the water storage in the reservoir is not sufficient, compared with general irrigation reservoirs (about 5:1). Thus, this district needs to apply RISS for control and saving the irrigation water against drought season.
90
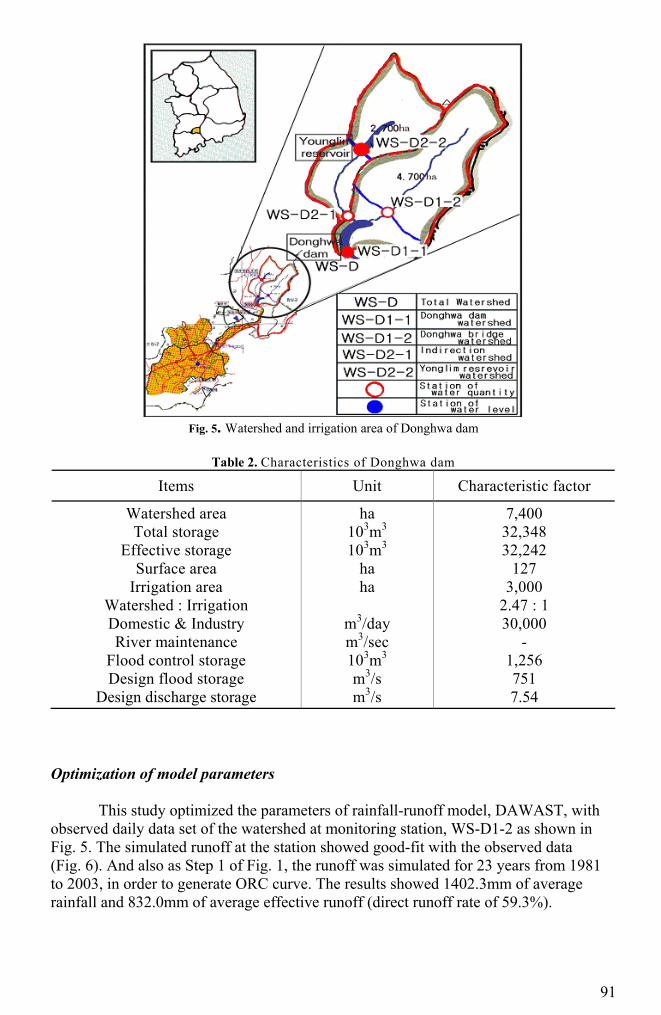
Fig. 5. Watershed and irrigation area of Donghwa dam
Table 2. Characteristics of Donghwa dam
Items Unit Characteristic factor
Watershed area Total storage
Effective storage Surface area
Irrigation area Watershed : Irrigation Domestic & Industry River maintenance
Flood control storage Design flood storage
Design discharge storage
ha 103m3 103m3
ha ha
m3/day m3/sec 103m3 m3/s m3/s
7,400 32,348 32,242
127 3,000
2.47 : 1 30,000
- 1,256 751 7.54
Optimization of model parameters
This study optimized the parameters of rainfall-runoff model, DAWAST, with observed daily data set of the watershed at monitoring station, WS-D1-2 as shown in Fig. 5. The simulated runoff at the station showed good-fit with the observed data (Fig. 6). And also as Step 1 of Fig. 1, the runoff was simulated for 23 years from 1981 to 2003, in order to generate ORC curve. The results showed 1402.3mm of average rainfall and 832.0mm of average effective runoff (direct runoff rate of 59.3%).
91

Fig. 6. Comparison of observed and estimated streamflow
Separation of sub-district for RISS Donghwa irrigation district has three main channel of Donghwa, Songdong, and Bojeul , and also 23 RTU(Remote Terminal Unit) points, which is to receive the monitoring data from sensors and to send them to the main system, as shown in Fig. 7. This study divided the irrigation network into two and three block systems, which are two block systems of 1/2 and 2/2 blocks and three block systems of 1/3, 2/3 and 3/3 blocks, as shown in Fig. 7, considering RTU points, three kinds of main channels, and irrigation area, and control probability remotely (Table 3). Application of RISS
In order to test the system, this study took June 5th as the start day for irrigation scheduling. As shown in Fig. 9, according to the weather condition of no rainfall, temperature 12.7 C°, pan evaporation 6.1mm, relative humidity 56.4%, wind speed 2.1 m/s, and sunshine duration 11 hour, the water requirement is calculated as 4.28 m3/s. In reservoir condition, storage rate is 68% with water elevation +313.62 m, higher than 57.8%, the bottom line of normal range in ORC, as shown in Fig. 10. From these results, RISS displays "normal supply" for whole irrigation areas for irrigation scheduling during six days, which supplies 4.28 m3/s from the reservoir. This study simulates irrigation scheduling for different conditions that were assumed as severe drought at same day. If the reservoir has severe condition of water elevation +306m, storage rate 46.16%, lower than the bottom line 57.8% of normal supply, the reservoir is in "severe" state as shown in Fig. 10, and RISS lead "4 days-on, 2 days-off" for three block system. The three blocks have different irrigation areas. Considering the irrigation area, RISS displays that irrigation rate for each block is 1.28 m3/s from June 5th to 8th for 1/3 Block, 2.11 m3/s from June 7th to 10th for 2/3 Block,
92

93
and 1.76 m3/s from June 5th to 6th and from June 9th to 10th for 3/3 Block, as shown in Figs. 11 and 12. Simulation of storage rate in reservoir In order to analyze how long the reservoir can irrigate during drought season without rainfall, this study simulated storage rate in reservoir, in the case of applying RISS as well as conventional irrigation method, with assumption of no inflow from watershed to the reservoir, starting at April 1, 2002. If the total water requirement to be released for whole irrigation area, the conventional irrigation method can maintain the irrigation scheduling until August 8, while RISS until August 24. Thus RISS can irrigate for 16 days or more over during drought season, and this is very important effect of the RISS approach.

94
Table 3. Irrigation channel system of Donghwa district
Division Main channel Irrigation channel Quantity of water
supply (㎥/s)
Irrigation area (ha) Division
No.1 sub main Outlet No.2 sub main Outlet Outlet No.5 sub main Outlet Outlet No.6 sub main Outlet No.8 sub main Outlet No.9 sub main Outlet Outlet No.10 sub main Outlet SikJung sub main
0.69 -
0.107 - -
0.0465 - -
0.08 -
0.0393 -
0.625 - -
0.0942 -
0.018
2.3 3.03
16.48 7.80
32.43 20.7 2.16 3.85
35.86 0.94
17.53 14.54
280.27 2.94
20.05 42.25 0.98 72.8
Block #1/2
Donghwa main
channel
GalChi sub main 0.0112 21.4
Block #1/3
BoJeol main channel BoJeol sub main 0.1696 281.4
Block #2/3
Donghwa main
channel
DaeOh sub main DaeKuan sub main GoJuk sub main Outlet Outlet NaeHwa sub main DaeYoul sub main HwaJeong sub main InHwa sub main GeySeo sub main Outlet Outlet DaeGok sub main Outlet PungRyung sub main NakDong sub main Outlet
0.611 0.487 0.107
- -
0.361 0.177 0.09
0.155 0.183
- -
0.135 -
0.223 0.026
-
239.9 238.9 17.72 0.79
36.11 167.3 74.2 5.13 54.9 74.7
37.71 37.44 39.2 4.57
100.0 32.3
165.35
Block #2/2
Block #3/3
SongDong main
channel
SongDong No.1 sub main Outlet SongDong No.2 sub main Outlet SongDong No.3 sub main Outlet Outlet SongDong No.5-1 sub main Outlet Outlet SongDong P.S. Outlet SongDong No.6 sub main Outlet SongDong No.7 sub main Outlet
0.1022 -
0.0382 -
0.2191 - -
0.0206 - -
1.715 -
0.0766 -
0.0772 -
45.82 1.00
17.14 26.46 98.29 57.98 31.67 9.26 54.0 2.16
769.12 120.6 34.34 6.64
34.62 60.85
Block #1/2
Channel, P.S. : Pumping station

Fig. 7. Irrigation system of Donghwa dam
95

Fig. 8. Input screen Fig. 9. Restricted release quantity and rotational irrigation system
Fig. 10. Restricted release quantity and rotational irrigation system
96

Fig. 11. Daily schedule of 4 days-on and 2 days-off irrigation system and canal discharge from June 6 to
June 10 of Donghwa dam
Fig. 12. Daily schedule on blocks and sub channels
97

.
0
10
20
30
40
50
60
70
80
90
100
02-0
4-01
02-0
4-08
02-0
4-15
02-0
4-22
02-0
4-29
02-0
5-06
02-0
5-13
02-0
5-20
02-0
5-27
02-0
6-03
02-0
6-10
02-0
6-17
02-0
6-24
02-0
7-01
02-0
7-08
02-0
7-15
02-0
7-22
02-0
7-29
02-0
8-05
02-0
8-12
02-0
8-19
02-0
8-26
02-0
9-02
02-0
9-09
02-0
9-16
02-0
9-23
02-0
9-30
Date
Stor
age
ratio
(%)
Rotational irrigation Customory irrigation
Fig. 13. Comparison of storage ratio by customary and rotational irrigation
Summary and Conclusion This study tried to apply the rotational irrigation scheduling system (RISS) for Donghwa dam district in order to save irrigation water during drought season. Compared with conventional method, RISS have several advantages such as not only higher ponding depth, but also better surge effect in irrigated blocks (on-blocks), due to 120% of water depth in irrigation canal. Thus RISS can maintain the irrigation scheduling against severe drought for longer periods more than the conventional method. As final result, the RISS method can irrigate for at least 16 days more, after zero water depth of reservoir by the conventional irrigation method. This approach saves irrigation water, maintain the reservoir storage during severe drought season, and also can be connected with TM/TC(Tele-metering and tele-control) technology for automation of irrigation water in Korea. References Doorenbos, J. and Pruitt, W. O. 1977. Crop water requirements. Irrigation and Drainage Paper 24. U. N. Food and Agriculture Organization, Rome, Italy. Kim, Tai-Cheol. 1992. Manual of the DAWAST model. Chungnam National University MAF. 1999. (Ministry of Agriculture and Forestry). Management rules of irrigation reservoir for drought and flood control. Research Report. (in Korean) Kim, Tai-cheol, Jae-myun, Lee and Dae-sik, Kim. 2003. Decision support system for reservoir operation considering rotational supply over irrigation blocks. Journal of the International Society of Paddy and Water Environment Engineering. 1(3):139-147. Senga, Yutaro. 1985. A Study on the safe yield and the operation of irrigation reservoir. Journal of the Japanese Society of Irrigation, Drainage, and Reclamation Engineering. 53(3):5-12. (in Japanese)
98

99
Senga, Yutaro. 1989. Soft science of water resources. pp.45-75. Sika Sima Publication Co.,Tokyo, Japan.(in Japanese) Votruba, L. and Broza, V. 1989. Water management in reservoirs, pp.330-340. Elsevier.


