114

ENGINEERING RESEARCH INSTITUTE VENTSPILS INTERNATIONAL RADIOASTRONOMY CENTRE
OF THE VENTSPILS UNIVERSITY COLLEGE
PROCEEDINGSof the Project
“SMART METERING”

SMART METERING
Proceedings of the Project Published by Engineering Research Institute
„ Ventspils International Radio Astronomy Centre”
Vol. 3, 2013
Editors: Anatolijs Zabasta,
Maris Elerts
Project Manager: Liene Resele
EDITORIAL OFFICE ADDRESS:
Inzenieru 101A, LV-3601, Ventspils, Latvia
Telephone: +371 636 29657
Fax: +371 636 29660
E-mail: [email protected]
Publisher: Ventspils University College
Printed copies: 200
Front cover design: Inga Vanaga
Technical Editor: Maris Elerts
Printed in SIA Zelta Rudens
© Engineering Research Institute
„ Ventspils International Radio Astronomy Centre”
of Ventspils University College

UDK 628.1:654:004
PROCEEDINGS
Of the Project (LLIV-312)
“SMART METERING”
ENGINEERING RESEARCH INSTITUTE
VENTSPILS INTERNATIONAL RADIO ASTRONOMY CENTRE
OF THE VENTSPILS UNIVERSITY COLLEGE
VOLUME 3
2013

Proceedings of the project SMART METERING, Vol. 3, 2013
2
This publication reflects research performed in the field of both wired and
wireless sensor systems in municipal utilities networks. Sensor systems for fast
identification of leakage locations in water supply networks and district heating
networks, and data processing and communication to corresponding management
systems were developed, installed and tested at water supply grid of the Ventspils
municipal water company “ŪDEKA” and district heating system in Kaunas.
Research and publication were financially supported by the European Union.
Ventspils University College is responsible for the content of this document and it
can not be regarded as the European Union's official position.
The publication is developed under framework of the Latvia–Lithuania
Cross Border Cooperation Program under European Territorial Cooperation
Objective 2007–2013. The ultimate aim of the project is to encourage socio-
economic development and competitiveness of the region by creating a framework
for technology development and accommodation for regional needs in the field of
automated meter reading - smart metering. The project provides public utility
companies and entrepreneurs the opportunity to significantly reduce the risks of
new technical solutions, save money and time.
The program website: http://www.latlit.eu
The project website: http://www.smartmeteringproject.eu
©Copyright
This publication is Copyright by the Engineering Research Institute
“Ventspils International Radio Astronomy Centre” of Ventspils University College.
No part of it may in any form or by any means (electronic, mechanical,
microcopying, photocopying, electronic recording or otherwise) be reproduced,
stored in a retrieval system or transmitted without the prior written permission
from the Engineering Research Institute “Ventspils International Radio Astronomy
Centre” of Ventspils University College.
SMART METERING Proceedings Online
Smart Metering Proceedings is available online at
http://www.smartmeteringproject.eu
Acknowledgments
We would like to thank Mr. Viesturs Otomers, Technical Director of the
municipal company SIA “ŪDEKA” for time and efforts devoted for support of
experimental testing of the new solutions at the water supply network of ŪDEKA.
Subscription information
Engineering Research Institute “Ventspils International Radio Astronomy
Centre” of Ventspils University College, Inzenieru street 101A, LV-3601,
Ventspils, Latvia.
E-mail: [email protected]

Proceedings of the project SMART METERING, Vol. 3, 2013
3
Authors
Anatolijs Zabašta(1)*, Vilius Dambrauskas(2), Justas Deksnys(2),
Vytautas Deksnys(2)*, Ina Gudele(3), Kaspars Kondratjevs(1)*, Alenas
Kriaučeliūnas(2), Nadežda Kunicina(1), Kristina Navalinskaitė(2), Andris
Nolendorfs(1), Viesturs Šeļmanovs-Plešs(3)*
1 - Ventspils University College, Inzenieru 101A, LV-3601, Ventspils,
Latvia; 2 - Kaunas University of Technology, Studentų g. 50, LT-51368
Kaunas, Lithuania; 3 - Latvia Internet Association, Brivibas str. 214m, room
206, Riga, LV-1039, Latvia
e-mails: [email protected], [email protected],
[email protected], [email protected]
Journal Policy
Engineering Research Institute “ Ventspils International Radio Astronomy
Centre” of Ventspils University College assumes no responsibility for views,
statements and opinions expressed by contributors. Any reference to content,
prototype or other commercial or propietary product does not constitute a
recommendation or an endorsment of its use by the author(s), their institution or
any person connected with preparation, publication or distribution of this Journal.
Registration No 90000362426 Registration certificate No. 321011
ISBN – 978-9984-648-43-9 UDK 628.1:654:004
Printed by “ Zelta Rudens” LTD, t. +371 67624955; www.zr.lv

Proceedings of the project SMART METERING, Vol. 3, 2013
4
Content 1. Introduction: Characteristics of the Water and Heat Utility Industry in Latvia
and Lithuania.............................................................................................................. 6
1.1. Characteristic of Water Distribution Networks in Municipalities………..…….. 6
1.2. Characteristic of District Heating in Municipalities …….. ……… … 9
2. Smart Metering Application Areas in EU Countries ............................................ 11
2.1. Smart Meter Application in EU Countries…………………………………….…..11
2.1.1. The European Commission a benchmark report on the costs and benefits of
smart meters ..................................................................................................... 11
2.1.2. European Parliament support for Smart Metering ........................................... 12
2.2. Enabling Smart Meter Application and Benefits………………………………….13
2.3. Technologies Used for Smart Meters……………………………………...............15
2.4. Strategic Research Agenda of the European Technology Platform on Smart
Systems Integration………………………………………………………………..16
2.4.1. Smart Systems for Information and Telecommunication ................................. 17
2.4.1.1. Technical objectives and their impact ............................................ 20
2.4.2. The Water Supply and Sanitation Technology Platform .................................. 24
2.4.3. Smart Grids: from innovation to deployment ................................................... 27
2.4.3.1. Developing common European Smart Grids standards ................. 28
2.4.3.2. The role of Electricity Industry ...................................................... 29
2.4.3.3. Electrical energy market content ................................................... 31
2.4.3.4. Development of advanced metering infrastructure ........................ 32
2.4.3.5. Need for advanced smart grid security .......................................... 33
3. Summary of Research on Opportunities for Smart Meter Tools Introduction in
Latvia and Lithuania Markets ................................................................................ 37
3.1. Task for Research on Water Pressure and Flow Meters Products in Latvia and
Lithuania……………………………………………………………………...……37
3.1.1. Used methods ................................................................................................... 37
3.1.2. Most popular companies and products in Latvia and Lithuania ....................... 37
3.1.3. Range of more popular pressure transmitters used in Latvia and Lithuania .... 40
3.1.4. Water flow meters ............................................................................................ 41
3.1.4.1. Advantages and disadvantages ...................................................... 41
3.1.5. Conclusions about existing water pressure and flow meters market in Latvia
and Lithuania ................................................................................................... 42
Proceedings of the project SMART METERING, Vol. 3, 2013
5
3.1.6. Task for research about e-services for customers and used methods ................ 42
3.1.7. Existing services description and examples ...................................................... 43
3.1.7.1. SWOT of existing e-services. .......................................................... 43
3.1.7.2. Proposal for future services development. ...................................... 45
3.1.7.3. Conclusions about e-services .......................................................... 45
3.2. Models and methods of heat losses evaluation due to moisture penetration in
insulation layer of the pipe……………………………………….………………..46
3.2.1. Calculation of heat losses ................................................................................. 46
3.2.2. Simulation results ............................................................................................. 56
3.2.3. Conclusions....................................................................................................... 63
4. Development of Smart Meter solutions ................................................................... 64
4.1. Development a solution for metering data reading and delivery to a data
base………………………………………………………………..……………….64
4.2. Active transmission component base and design…………………….……………65
4.3. Common trial network in Ventspils: selection of the scope of trial
network…………………………………………………………………...………..66
4.4. Forward transfer – repeater node principle……………………………..…...…….68
4.5. Custom antenna designs for urban environments…………………………..….…72
4.6. Ethernet gateway – concentrator…………………………………………………..74
4.6.1. Pibox Ethernet gateway development stages………………………………….74
4.6.2. Ethernet gateway – Aquamon services………………………………………..77
4.7. Final trial network layout………………………………………………………….78
4.8. Smart Meter Information System architecture…………………………………….79
4.9. Selection of practical methods for leaks detection in WDN using metering data
base and analytics approach……………………………………………………….83
4.10. E-services for users………………………………………………………..………87
4.11. Data storage for KTU measurements of district heating networks……………….88
4.12. Experimental evaluation of technical characteristics of defects monitoring device
prototype…………………………………………………………...........................89
4.13. The structure of monitoring system, functioning methods and issues to be
addressed in the next project stage………………………………………….……100
4.14. Initial suggestions to carry out the classification of defects in the pipe
net……………………………………………………………………………..….104
4.15. The problem issues for the future research………………………………………105
References…………………………………………………………………………..…108

Proceedings of the project SMART METERING, Vol. 3, 2013
6
Introduction: Characteristics of the Water and
Heat Utility Industry in Latvia and Lithuania
1.1. Characteristic of Water Distribution Networks
in Municipalities
The Latvian Water Supply and Sewerage Enterprises Association [1] unite
27 enterprises, located mostly in former regional centres. An average amount of
water supplied to a customer in 2010 was about 215 thousand cubic meters (t.m3)
per day, but the average amount of wastewater exceeded 260 t. m3 per day. The
total length of water distribution pipe was 2965 km; the total length of sewer pipe
was 2560 km. The members of the Association comprise 90% of the Latvian water
utility market, but the remaining 10% is divided among small private companies.
Seventy one per cent of water services are consumed by residents living in
apartment buildings and individual houses, but the remaining 29% is used by
different industries and the public sector.
Table 1 indicates the large differences in water production among water
utilities; therefore the water volume processed by the Riga Water exceeds 60% of
the total association contribution, while the contribution of 14 water utilities is less
than 1%.
Table 1. Supplied water and wastewater volumes distribution among
Association’s enterprises in year 2009 (G. Krauze, 2011)
NN. City Water supply
t.m3/day
Wastewater
treatment
t.m3/day
W + WW
t.m3/day
W+WW %
From total
volume
1. Rīga 140851 160381 301232 60,54
2. Liepāja 10654 26760 37414 7,52
3. Daugavpils 15604 13898 29502 5,93
4. Jūrmala 10160 9832 19992 4,02
5. Jelgava 11500 7900 19400 3,90
6. Ventspils 7632 10342 17974 3,61
7. Rēzekne 4520 7297 11817 2,38
8. Valmiera 3821 4545 8366 1,68
9. Cēsis 3017 3805 6822 1,37
10. Jēkabpils 3179 3436 6615 1,33
11. Tukums 1851 2915 4766 0,96
12. Talsi 1930 2108 4038 0,81
13. Bauska 1609 2228 3837 0,77

Proceedings of the project SMART METERING, Vol. 3, 2013
7
14. Saldus 1411 2083 3494 0,70
15. Sigulda 1647 1750 3397 0,68
16. Aizkraukle 1398 1986 3384 0,68
17. Kuldīga 1095 2059 3154 0,63
18. Dobele 1301 1481 2782 0,56
19. Gulbene 711 1429 2140 0,43
20. Līvāni 901 1217 2118 0,42
21. Madona 930 791 1721 0,35
22. Alūksne 766 903 1669 0,34
23. Vangaži 500 500 1000 0,20
24. Limbaži 320 623 943 0,19
Total 227309 270268 497577 100.00
Since former USSR economics collapsed in the beginning of 90th water
consumption reduced dramatically (see Fig.1).
Figure 1. The forecast of company "Rust VA-Projekt" (upper line) and
“Sweden water” (middle line) of produced drinking water amount in Riga city and
actual delivered water to the city (lowest line)
In 2009 Latvia moved from a two-level local governmental (regions,
municipalities and cities comprised the first level, but parish councils comprised
the second-level of local government) structure to a local level - 110 counties and 9
cities (Daugavpils, Jelgava, Riga, Jurmala, Liepaja, Rezekne, Riga, Valmiera and
Ventspils). Before the administrative reform (ATRL, 2008) water management
had been operating in each parish or town. Water infrastructure ownership has
100
200
300
400
500
1990 1995 2000 2005 2010 2015 Pro
du
ce x
10
00
m3
/d
Year

Proceedings of the project SMART METERING, Vol. 3, 2013
8
been shifted from the parish level to county and municipal ownership. Therefore
counties have faced an important problem on how to organize water services
throughout the county area. It has been found that when each parish administration
deals with the problem itself, (in rare cases getting contributions of budget and
resources from the county), water quality is unacceptable, and financial and human
resources are not used optimally. The majority of parishes does not have sufficient
competence and lack the resources to maintain adequate water supply infrastructure
even when built with the support of EU Funds. Therefore the various county
governments have started creating a single system for providing water services
across the jurisdiction.
A study carried out by the authors covering three counties in the Kurzeme
region revealed common problems [2]. Each parish independently performed
water accounting and obtained payments from customers, so that the county
administration did not have correct information concerning the overall situation in
the county. Since each parish maintained its own customer billing and property
accounting system, the county administration was not able to provide a common
policy in relation to clients and debtors, due to a lack of timely information. A
significant part of the municipal property was not equipped with water meters at
the entrance to the building, thus water consumption in many cases was determined
by the consumption standards per person and sometimes by the number of animals
owned by landlord. Different water tariffs were applied, which were not
determined on the basis of actual costs. As a result of privatization formerly public
water supply and sewerage infrastructure, in many parishes, ended up in private
hands and the new owners were able to charge at any level they desired, because
the actual cost burden was not corroborated in the Land Register.
In many cases water supply facilities and the trunk network (pumping
stations, iron removal plants, water main, sewer pump stations, etc.) in parishes are
not equipped with water supply monitoring and record keeping equipment; as a
result leaks are detected with delay. In some counties water supply network
depreciation has reached 70%. (A. Zabašta, 2010).
There are several problems that are specific to both the county and urban
water industry. Starting in 1990 both residential and industrial water consumption
has been steadily decreasing. In the last twenty years water consumption has
decreased significantly increasing the cost of supplied water per 1m3
[1]. Another
problem is customers growing debt; however current legislation does not permit
disconnecting water, even if a subscriber does not pay their water bill. The
existing legislation affecting water supply and sewer facilities regarding financing
and construction is not conducive to the use of high-quality materials and advanced
technologies, because only construction costs is taken into account and operating
costs and facility life are neglected.
Since Latvian and Lithuanian and Estonian water utilities have encountered
similar problems, the two countries have joined efforts in order to introduce ICT
solution for monitoring and controlling water distribution networks. For example in
2010 four Latvian and one Lithuanian county initiated a project “Innovative e-
services for water supply management” [3].

Proceedings of the project SMART METERING, Vol. 3, 2013
9
Kraslava, Preili and Livani district councils with Utena district
administration, together with utilities "Krāslavas Water", "Livani Housing
Management", "Preili Housing Management", "Utena Water" and "Utena Heat" in
October of 2010 launched the Latvia -Lithuania Cross Border Cooperation
Programme project LLIII-127 "Innovative e-services for water supply
management."
The project objective is to develop and implement an automated metering
data reading system, which can control the cold and warm water consumption. The
project envisaged to install new or to replace obsolete water meters, to install the
hardware aiming to read and transmit metering data to a single data centre. This
equipment will not only help better track water consumption, but will ensure
quicker to find the water emergency cases, to analyse why in particular home water
consumption is higher than in the other one. The new system will help to find small
but lasting leaks that are difficult to find by other methods.
Referred system had to cover all Kraslava city, but in Utena one of two large
water districts. To verify the performance of the system in smaller amounts and
under different conditions, the small pilot projects have been implemented in
Livani and Preiļi.
The Project was finished in 2012, six month later then it was planned;
however the project targets has been achieved, except targets set by Utena
municipality. Due to two tenders for metering equipment have been finished
without results, it was decided to reduce the number of buildings connected to the
new automated data collection system.
1.2. Characteristic of District Heating in Municipalities
District heating is a technology that transfers energy in the form of hot water
or steam from a central heat plant to customers, used mainly for the supply of
collective central heating in high density residential areas. District heating
(hereinafter referred to as DH) is distributed over heating pipes that are designed
for the transfer of heat energy from the source of its origin (cogeneration heat and
power plants, boiler houses and other facilities) to buildings [4]. This DH supply
model is deployed also in Latvia.
District heating satisfies the demand of the greatest part of customers, both
residential and industrial clients. According to the Lithuanian District Heating
Association around 10 TWh of heat energy per year is generated in the district
heating supply sector. The key consumers of the said energy are apartment
dwellers who consume 73% of the total heat energy consumed in the country. The
total length of heat transmission networks (double pipes) of various diameters, used
currently by Lithuania, constitute around 2500 km. [5]. The Latvian DH
consumption structure is similar to the Lithuanian structure: nearly three quarters
of DH is consumed by residents [6].
The most fundamental problem related to heat energy transfer is known to be
loss of heat occurring during the heat transfer process, which is mainly due to

Proceedings of the project SMART METERING, Vol. 3, 2013
10
insufficient insulation of distribution pipes, and as there are leaks in heating
substations, which occur due to use of defective pipes and equipment. Therefore
application of smart methods and tools for monitoring and measure of the state of
insulation of the pipes is crutial for reduction of heat losses.

Proceedings of the project SMART METERING, Vol. 3, 2013
11
2. Smart Metering Application Areas in EU
Countries
2.1. Smart Meter Application in EU Countries
2.1.1. The European Commission benchmark report on
the costs and benefits of smart meters
The European Commission is likely to draw a benchmark report on the costs
and benefits of smart meters by middle of 2013 and urge member states to inform it
as soon as possible of their assessments and roll-out plans. Therefore the middle of
2013 would be the first fixed date for EU countries to report to the Commission on
whether they think smart meters should be deployed in their country. For this, they
will have had to carry out a cost-benefit analysis showing whether deploying the
technology makes sense economically. This leaves member states less than a year
to finish their analyses and leaves the Commission even less time to centralise all
the results, examine them and draw up a benchmark report.
Member states had to undertake a national cost-benefit analysis on smart
metering technologies by 3 September 2012, as required by the 2009 directives on
electricity and gas liberalisation. Marlene Holzner, the Commission's energy
spokeswoman, told EurActiv that the EU executive would "proceed with a
comparative evaluation of the respective cost-benefit analyses and the member
states' roll-out plans". The Commission is “monitoring the exercise in an informal
manner” in close collaboration with member states, Holzner said. The aim is to
align the methodologies for the cost-benefit analysis, she added.
As a first step, the Commission is due to publish a progress report on the
internal energy market. The document, it is foreseen, urges members stated to
increase the number of smart meters from some 45 million at present to at least 240
million by 2020. If the roll-out of smart meters is found to be cost-effective, at least
80% of consumers will be required to be equipped with intelligent metering
systems by 2020. But who exactly will bear the costs for the smart meters, their
installation, management and maintenance is not known yet.
Industry claims it is waiting for the national regulating authorities to decide
how costs will be spread amongst distribution networks, suppliers and
consumers, said John Harris, of Swiss company Landys+Gyr, which produces and
distributes smart meters. The expectation is that consumers' energy bills will rise as
a result to cover the costs of deploying the technology.
Krzysztof Gierulski of the European Commission's energy efficiency unit,
speaking at a smart meter workshop in Brussels, admitted that energy suppliers
will, of course, try to push any cost they have on final customers. “Companies need
to be sure they will make a profit in order to invest,” said Gunnar Lorenz of trade

Proceedings of the project SMART METERING, Vol. 3, 2013
12
group Eurelectric, which represents large power suppliers. He said that power
suppliers have to explain to customers “what this box is and what it does so that
they trust it and feel comfortable with it and do not feel like they are monitored by
a big brother.”
The European consumers' organisation BEUC is critical of the
"socialisation" of cost – in other words, spreading the costs of rolling out smart
meters in 80% of households in an even manner amongst all of their clients.
Monika Stajnarova, an expert on smart meters at BEUC expressed her opinion that
there should be a fair sharing of costs for all investments required, but also between
all actors that could potentially benefit from the new meters: the different
functionalities and benefits that they bring to different actors need to be analysed
and thus determine the distribution of costs amongst those actors.
A study commissioned by the United Kingdom's Department of Energy and
Climate Change [7] recently revealed that over half the population is unaware of
the existence of smart meters. Over 51% of the 2,396 energy bill-payers
interviewed by the Ipsos Mori research team in Britain said they had never heard of
smart meters. Only one in four said they knew at least a fair amount about the
meters, 24% had heard of them but knew nothing about them, while just 2%
claimed to know "a great deal". The study comes has to support plans to roll-out
smart meters in all of Britain's 30 million households from year 2014 to 2019.
The roll-out of smart meters could potentially transform the way energy
markets operate in the EU, with customers expected to become more actively
engaged in controlling their energy consumption, with the help of demand-
response systems.
2.1.2. European Parliament support for Smart Metering
In two votes the European Parliament expresses its broad support
for Smart Metering: Every household in the EU to be fitted with Smart Meters by
2022.
On 22 April 2009, the European Parliament approved an agreement reached
by the EU Institutions on a package of legislation to liberalise EU energy markets.
The package includes Electricity and Gas Directives which require the EU Member
States to “ensure the implementation of intelligent metering systems.”
The Electricity Directive foresees full deployment by 2022 at the latest,
with 80% of consumers equipped with Smart Metering systems by 2020. There
are no deadlines in the Gas Directive. In the debate preceding the vote, the
rapporteur on the Electricity Directive, Eluned Morgan, Labour, UK, said that
legislation will also ensure that every household in the EU will be fitted with
Directive on Smart Meters by 2022 and that Smart Meters will enable customers to
better control their energy use and increase energy efficiency, helping to cut energy
costs and reduce carbon emissions.
In his statement to the Parliament on the Energy Package, Energy
Commissioner, Andris Piebalgs said: “Parliament’s call for stronger consumer

Proceedings of the project SMART METERING, Vol. 3, 2013
13
protection and the fight against energy poverty is now enshrined in the legislative
texts. Smart Meters, allowing for consumers to be precisely informed of their
consumption and promoting energy efficiency, are provided with a target of 80%
of consumers to be reached by 2020.”
On 23 April 2009, the European Parliament, in its first reading of the Energy
Performance of Buildings Directive (EPBD), voted to expedite the implementation
by requiring that all new buildings and buildings undergoing renovation be
equipped with Smart Meters. In an amendment to the EPBD,
the European Parliament inserted the following: “Member States shall ensure
that Smart Meters are installed in all new buildings and all buildings undergoing a
major renovation and whenever a meter is replaced, and shall encourage the
installation of active control systems such as automation, control and monitoring
systems, where appropriate.”
Welcoming the decisions, Andreas Umbach, President of ESMIG, said: “The
members of the European Parliament are to be congratulated on their forward-
looking approach and commitment to making the EU’s 20-20-20 goals a reality.
This is a milestone decision which paves the way for a more efficient, sustainable
and consumer friendly energy market in Europe. Smart Metering is revolutionising
the way we live, providing a state of the art yet democratic means to achieve a high
and environmentally conscious standard of living for each and every one of us.”
2.2. Enabling Smart Meter Application and Benefits
Smart meters display household's energy consumption in real-time, giving
users the possibility to monitor fluctuations in their energy consumption both
locally and remotely – through wireless systems, the internet and smart phones.
Since households are responsible for 40% of total energy consumption, the
European Commission believes smart meters will be a key element in reducing
energy demand and cutting associated carbon-dioxide emissions.
Smart homes – Smart Metering technologies can function as an interface for
smart homes devices. This would allow comprehensive home energy management,
linking the heating and appliance controls and giving customers the tools to
monitor their operation. This could enable the provision of buildings
communications systems – with knock on effects for controlling heating, lighting,
ventilation and appliance use.
Smart grids – Energy supply networks face huge challenges in the future
with an urgent need to improve their operation and efficiency and fit them for our
future energy needs. They will need to accept much higher levels of distributed and
renewable generation. Smart Metering will be a key element of this transformation.
Smart Metering will also allow the transmission and distribution of more energy
within existing network capacity due to optimisation and better energy
management. Demand management facilities will also give the network operators
valuable tools to manage load on their networks.

Proceedings of the project SMART METERING, Vol. 3, 2013
14
Electric vehicles – Smart Metering will be an important element of any
future use of smart electric vehicles. They will present a major load for the grid that
must be managed when they are each charged or perhaps used as a power storage
and source. Finally, electric vehicles also raise several new issues and create
opportunities, namely how and when to charge or give energy back to the network
independently of the location or time.
This is likely to change the way energy is consumed, measured and
managed, and will affect energy supply contracts as well as stimulate new added
value services.
Consumer benefits
Consumers can be informed remotely (historical data) or locally (real-time
data) on:
Current energy costs and related carbon emission data;
Energy consumption of household gas, electrical and water
equipment can be displayed on the appliance or on displays;
Multi tariff functions can be added to allow demand response
techniques allowing electrical appliances to be automatically controlled or
allowing the consumer to reduce costs by increasing energy consumption
during off-peak cheaper tariff periods.
Utilities benefits
Smart Metering allows to gain first-class data influence the energy
consumption of their users improve profitability of the technology once Smart
Metering is also used for gas, water and heat readings.
In addition, utility companies will benefit from the following
advantages:
A reduction in ‘costs to serve’;
Open gateways for the delivery of energy services;
Assistance in the development of liberalised energy markets;
Help for revenue protection;
Monitoring of the generation from building renewable;
Support in demand response techniques;
More effective grid management;
A new communication channel to customers.
For both the EU and the national governments
Smart Metering will
Prove to be the tool to entice consumers to manage their
consumption better and reduce usage leading the way to improved service
levels through richer billing information;
Be a key weapon in the fight on climate change;
Help governments implement liberalisation of energy markets;
Allow the full realisation of the Energy Services Directive.

Proceedings of the project SMART METERING, Vol. 3, 2013
15
The EU’s 20-20-20 goals (20% increase in energy efficiency, 20% reduction
of CO2 emissions, and 20% renewables by 2020) all depend on the re-
configuration of the European electricity grid into a “smart grid”. These ambitious
European targets mean that we must change; not only must our energy
infrastructure change, but also consumer behaviour. Smart Metering is an essential
building block for the education and empowerment of customers, an essential
development if we are to make real energy savings.
We cannot meet the environmental and energy challenges of the 21st century
with metering technology from the 19th century. Thus, Smart Metering is the first
essential step in this transition towards a smart grid. Finally, Smart Metering
technologies are already at our disposal.
2.3. Technologies Used for Smart Meters
Generally, Smart Metering technologies consist of several different technical
components which may vary according to the specific market conditions in
different Member States, but the majority include the following features:
1. Accurate measurement and transmission of electricity, gas, water or heat
consumption data.
2. Provision of a two-way information gateway and communication
infrastructure between the metering systems and relevant parties and their systems.
The two-way information gateway is necessary for raising awareness and
empowering the consumer through delivery of actual consumption data improving
Customer Relationship Management (CRM) and services, including automated
billing/invoicing based on detailed metering data managing energy networks/grids
better by shifting or reducing energy consumption, e.g. through Demand Side
Management (DSM)enabling new energy services for improving energy efficiency
encouraging decentralised, micro-generation of energy, thus transforming the
consumer into an energy producer (“Prosumer”).
Smart Metering systems feature a number of innovations: digital technology,
communications, control and better operation of networks. Smart Metering
technologies will change the way that metering works completely. They provide
customers with much more information on how they use energy and enable those
customers to reduce their usage.
An essential requirement for the successful deployment of Smart Metering is
the standardisation of the new technologies and systems with manufacturers and
users co-operating to enable the effective integration of each individual component.
ESMIG’s standardisation work will support the introduction of European
standards into each and every Member State and thus help to avoid go-it-alone
solutions. Furthermore, the aim is to establish standardised communication
protocols and interoperable systems that can be used across national borders,
regardless of restrictions.
Probably the most important standardisation activity in recent years is
related to mandate 441 [8]

Proceedings of the project SMART METERING, Vol. 3, 2013
16
(http://www.cen.eu/cen/Sectors/Sectors/Measurement/Documents /M441. pdf)
initiated by the European Commission and accepted by CEN, CENELEC and
ETSI. In this context ESMIG is strongly involved in the mandate 441 work though
the so-called Smart Metering Coordination Group (SMCG):
http://www.cen.eu/cen/Sectors/Sectors/Measurement/Smart%20meters/Page
s/default.aspx (see [9]).
2.4. Strategic Research Agenda of the European
Technology Platform on Smart Systems Integration
A European Technology Platform on Smart Systems Integration (EPoSS)
[10] focuses on Smart Systems, defined as intelligent, often miniaturised, technical
subsystems with their own and independent functionality evolving from
microsystems technology. Smart Systems are able to sense and diagnose complex
situations. They are “predictive”; they have the capability to decide and help to
decide as well as to interact with the environment. They may also be energy
autonomous and networked. Utilising a functional design approach, Smart Systems
use properties of devices and materials in completely new ways. Smart Systems are
or will be indispensable for the competitiveness of future products and even entire
European industry and business sectors.
Smart Systems can be described as integrated systems, which
Are able to sense and diagnose a situation and to describe it;
Mutually address and identify each other;
Are predictive and are able to decide and help to decide;
Operate in a discreet, ubiquitous and quasi invisible manner;
Utilise properties of materials, components or processes in an
innovative way to achieve more performance and new functionalities;
Are able to interface, interact and communicate with the envi-
ronment and with other Smart Systems and which are able to act, perform
multiple tasks and assist the user in different activities.
Such systems are often networked, energy autonomous, miniaturised, re-
liable and in some cases even implantable. They are becoming increasingly
complex, and they involve different technology disciplines and principles.
Notwithstanding their capability and complexity, the implementation of novel
innovative user-friendly human-machine interfaces will make products using Smart
Systems easier and more convenient to use.
New features like ubiquitous connectivity, security, ease-of-use and the
integration of mechanical, optical, electronic, biological or other properties through
various innovative technologies have yet to be fully realised (see Fig.2).

Proceedings of the project SMART METERING, Vol. 3, 2013
17
Figure 2. Continuing Revolution of Smart Systems Integration
2.4.1. Smart Systems for Information and
Telecommunication
Smart Systems will create:
A single personal multifunctional gateway to connect the
individual with the machine world;
An invisible, zero-carbon-footprint communications infrastructure;
Miniaturised, long-life devices for “one-touch installable”, smart,
scalable machine-to-machine networks.
Miniaturised, autonomous smart systems will unlock key bottlenecks in the
expansion of existing personal communication services. They will also enable new
applications that require extensive machine-to-machine communications. Any
future vision of personal communications must consider both the end-to-end
system and components, both hardware and software, both user devices and
infrastructure.
The communications needs of end users are becoming ever more complex,
interacting with an ever-wider range of remotely controlled products and services
and interacting with other users with ever-richer modes of communications. The
challenge is therefore to create a single multifunctional personal gateway device to
interface the individual with a multi-faceted machine world and to connect the
individual with others. This device must be tailored to the needs of the individual
and be easy to use. It must be permanently connected with low-cost, high-
performance network access and have a high degree of energy self-sufficiency.

Proceedings of the project SMART METERING, Vol. 3, 2013
18
The other key component of personal communications is that of the wireless
access infrastructure with which the users’ devices communicate. The
infrastructure of the future will be low in cost, visually unobtrusive and energy
efficient, all while delivering ever increasing bandwidths.
European industry has played a leading role in the roll-out of second-and
third-generation cellular communications, with European system suppliers and
components punching well above their weight in world markets. Maintain that this
position depends on two key European addressed developments: affordable,
ubiquitous access to high-bandwidth wireless infrastructure with low-carbon
footprint and the continuing downward pressure on component costs. Smart
systems are the solution for both.
The last link of personal communications is fast becoming the sole preserve
of wireless communications. But applications are ever increasing in their demand
for affordable bandwidth and the demand of bandwidth per user will increase too.
Forward-looking standardisation efforts such as ITU-ADV are considering the
supply of 100Mb/s and more of data to end-users over long ranges. Such advances
will open up new applications with positive impact on society, such as remote
video streaming in disaster scenarios, ubiquitous connectivity for health monitors
in body area networks, and wireless broadband for rural areas.
Secure communications are also a concern of end users. In the meantime,
operators are looking beyond the capital expenditure costs of running networks to
minimising operational costs such as power consumption and site costs.
To address spectrum scarcity, frequency agile and multiband RF transceiver
solutions will provide the required bandwidth to deliver data rates in excess of
100Mbit/s. Advances in filtering, matching, and analogue RF processing tech-
niques, along with their integration of heterogeneous technologies, will be needed
for tuneable and switchable multi-band operation. To more efficiently use existing
spectrum, active antenna arrays will trigger the widespread adoption of MIMO and
beam steering.
To minimise handset size, ultra-compact passive subsystems combined with
radio processing (e.g. mixing, passive and active filters) will be achieved through
advances in SIP (system-in-package) integration of heterogeneous technologies
such as MEMS, active and passive electronics, acoustic-wave filters, and bio-
electronics.
To minimise power consumption in base stations, highly efficient switched-
mode power amplifier modules will improve power efficiency, while innovative
thermal management subsystems such as smart fan trays will minimise the energy
cost of waste heat removal.
To minimise base station site costs, miniaturisation in high-power RF
subsystems will be used in low-profile smart remote radio heads.
Hardware solutions for transceivers form the necessary “layer 0” in the
communications protocol stack. Hence, the above solutions require more than just
software or new algorithms or innovative architectures: advances in heterogeneous
hardware solutions, at the core of smart system solutions, are the only way to see

Proceedings of the project SMART METERING, Vol. 3, 2013
19
real improvements. Achieving hardware which is adaptable and provides high
performance requires a close integration in the one package of micro-scale
mechanical, digital and active plus passive RF technologies.
Smart systems technology will help European component manufacturers to
maintain and increase market share and profit margins in the face of increasing
competition from low-cost regions of the world. Increasing the intelligence and
autonomous adaptability of previously “dumb” subsystems will enable the
European RF and mixed-signal component industry to move up the supply chain,
capturing more of the value of the end products.
Machine-to-machine and sensor network communications are the next big
opportunity for the communications industry. Large financial and societal benefits
will arise from the invention and realization of miniaturised, long-life devices
connected using machine-to-machine and sensor networks. These networks must
be “one-touch installable”, dynamic in operation, and scalable up to millions of
devices.
In a wide range of smart systems, such as medical and lifestyle devices for
assisted living, in-vehicle diagnostics, environment monitoring systems, etc.,
connectivity between smart devices is a critical facility needed to achieve the
desired ends. This is because:
Smart devices often have limited local information and cognitive
capabilities. Networking the devices results in a better informed, more
intelligent overall system.
Most smart systems have some level of human and/or central
supervision and control. Connectivity is therefore required to gather
information and to distribute commands.
Thus machine-to-machine (and in the case of body-area networks,
man-to-machine) connectivity is a necessary underlying component of
many smart systems.
Delivering that connectivity in an affordable, effective manner
requires major improvements in many dimensions:
Advances in RF antenna and filter design, packaging and module
integration will enable miniaturisation of transceiver solutions. Particularly
critical are novel radio solutions for the low-GHz (less than 2GHz) bands.
New circuit design techniques and micro- generation techniques
for power will extend the operational life of remote devices.
Integration of NEMS, MEMS, BAW and SAW devices, and
classical integrated circuitry, both active and passive, will also drive down
the size of transceivers.
Co-simulation of the various technical domains, electrical,
mechanical, and acoustic, will be required for optimised solutions and low
time-to-market.
New scalable architectures designed specifically for the machine-
to-machine communications will allow for networks of millions of devices.
Proceedings of the project SMART METERING, Vol. 3, 2013
20
Improvements in techniques for secure and reliable machine-to-
machine communications will enable mission-critical applications for
sensor networks.
Smart devices enhanced with inter-device communication will result in
smart systems with a much higher degree of intelligence and autonomy. This will
enable the more rapid deployment of smart systems discussed elsewhere in this
Strategic Research Agenda, with all the benefits accruing to European society as
listed. For example, vehicle-to-vehicle and vehicle-to-infrastructure
communications will significantly advance Intelligent Transportation Systems
(ITS) applications such as vehicle safety services and traffic management.
Unobtrusive man-to-machine communication will be instrumental for
enabling the wide deployment of policies such as e-Health, e-Inclusion and e-
Accessibility, helping ageing society with assistant devices, improving the
participation of people with disabilities in the Information Society, and generally
aiding natural, intuitive interfaces to information technology.
2.4.1.1. Technical objectives and their impact
This section specifically addresses the needs of smart systems that enable
ubiquitous high-speed connectivity. There are two main drivers. One is the on-
going demand for shrinking size and reducing cost. A key challenge with respect to
form factor reduction is to find new approaches to overcome the large physical
dimensions dictated by the long wavelengths at frequencies below 1 GHz. From a
communications perspective, frequencies below 1 GHz have the greatest range and
coverage and hence continue to attract much business interest, despite the lower
capacities achievable.
In addition, there is a need for new functionality and new subsystem
architectural approaches that are not feasible today. Integration of heterogeneous
technologies (a core objective of EPoSS) plays a key role here as it enables new
architectures.
Technological advances are needed at both component and
subsystem/module levels, to facilitate the new functionality at a smaller size and at
lower cost.
Component level
High-linearity, low-loss, tuneable components: New high-performance
variable components with low loss, high linearity, and large tuning ranges are
needed. Applications would include sub-circuits like tuneable matching networks
with low loss to match power amplifiers and antennas over a wide frequency range.
Useful component technologies include ferroelectric varactors (variable
capacitances) made from barium strontium titanate and variometers (variable
inductances), from tuneable magnetic materials (e.g. ferromagnetics or
multiferroics). Further flexible components are of the MEMS (micro
electromechanical systems) type. These are components that are heterogeneous in
themselves, with moving mechanical parts at a microscopic scale altering electrical
properties.
Proceedings of the project SMART METERING, Vol. 3, 2013
21
High-power RF handling: for some specific applications such as high RF
power transmitters, components have to withstand large RF voltages and currents.
Research is needed to reduce losses in linearity at high RF power levels, when
often component properties become a function of the applied signal. New design
tools are needed where electromagnetic properties are analysed in conjunction with
thermal distributions and mechanical stress conditions. The challenge is to have an
integrated simulation tool, spanning both component and circuit levels and
covering electromagnetic, thermal, acoustical and mechanical properties in one
environment.
Artificial materials for tune ability and miniaturization: New RF artificial
materials are expected to deliver solutions to shrink the size and increase tune
ability, while maintaining performance. One example here would be meta-
materials created out of periodic structures comprising switches, varactors and
variometers. Besides such materials created out of passive structures, one can
conceive of artificial materials incorporating active non-linear devices. Artificial
materials provide a large degree of freedom in shaping frequency characteristics
and are expected to open a wide new range of applications such as compact flexible
filters and antennas and components like phase shifters and couplers with wide
frequency agility. Other concepts such as defected ground and defected micro strip
structures with high slow wave factor will shrink the size of line transformations.
Integrated MEMS circuits: To achieve the desired flexibility in functionality
without compromising on performance, integration of MEMS devices with other
MEMS devices (often using different processes) and the integration of MEMS with
RFICs is needed. Advances are needed in hybrid integration through system-in-
package (SIP) technology to avoid losses in performance arising from leading
signals on and off chips. However the package might lead to Q-factor degradations
or unwanted couplings which have to be properly controlled. The challenge for the
future will be to find a platform technology for SiP that allows for the most flexible
combination of devices of different type without degrading performance. Hence,
SiP technology will be the key to enable new functionality. Besides performance
gain and form-factor improvements, there are also cost advantages and higher
system reliability from a shared package.
Module/subsystem level
Increased integration, improved packaging and new compact architectures to
reduce size and increase reliability: Increased integration delivers smaller form
factors (important for multifunction handsets and for reducing base station physical
footprint) and higher reliability. At the module level, there is a need for new
techniques for the integration and packaging of a bewildering array of
technologies: high-speed digital FPGAs, GaNand, GaAs, MMICs, LTCC, CMOS,
RFICs, YIG isolators, acoustic filters (SAW, BAW), high-Q discrete passives,
LTCC, multilayer laminates, etc. Critical in this will be the development of a new
generation of SAW and BAW filters with respect to substrate materials and
packaging, e.g. GBAW filters and band VII duplexers. More broadly, the challenge
for research is to satisfy the requirements of different domains simultaneously, e.g.

Proceedings of the project SMART METERING, Vol. 3, 2013
22
the heat transfer must be managed without sacrificing RFperformance; mounting
techniques of MMICs should not introduce massive RFparasitics, and so on.
At an architectural level, smart integration will provide more flexibility in
partitioning functionality between the enclosed subsystems. This will allow the
exploitation of new technologies for low-cost, miniaturised RF systems. One
example is the use of metalized plastic component in active antenna arrays – this
enables architectures which are cost effective where multiple transmit chains are
needed, e.g. for beam-steering and MIMO.
Smart/flexible RF modules with digital control: From a system architecture
perspective, a further big challenge is that of frequency agility. As the frequency
spectrum for wireless communication becomes more and more fragmented,
flexibility at subsystem level must be increased to take maximum benefit from the
scattered spectrum resources available. In wireless transceivers, frequency agility
has to be implemented throughout the whole RF chain, from antennas to filters to
power amplifiers to radios, where their flexibility is obtained from using tuneable
components in conjunction with RF detectors.
In this context, bridging circuits between the control chips and the
components to be controlled are also needed. In digital control, there is a trend
towards lower voltages (e.g. 2.7V), whereas at the component level there is a trend
towards higher tuning voltages (e.g. 150V), as this brings higher component
linearity. Novel integrated solutions for charge pumps incorporating digital-to-
analog converters are needed for turning digital control words at low voltages into
high tuning voltages. At a higher level, new concepts for controlling these new
flexible RF subsystems are needed to address built-in self-test, health monitoring,
and, critically, built-in self-calibration.
Smart subsystems for the RF transceivers of the future will rely on adaptable
components to give flexibility in functionality and on intelligent control to steer
those components in a coordinated fashion.
Technologies for lower carbon footprint: In radio access systems the great
consumer of power is the RF transmit chain. Therefore reducing the carbon
footprint of radio networks requires improvements in the efficiency of RFtransmit
power amplifier solutions. One promising research direction is to revisiting the
analog-digital divide with direct-to-RFDACs and RFswitched-mode power
amplifiers.
Finding efficient solutions for removing or scavenging the waste heat
generated is also critically important. Smart fan trays can bring additional power
reductions (and improved reliability) for communications systems with forced-air
cooling, through the deployment of smart algorithms to optimise the air flow.
Improvements in heat sink and heat pipe technology will benefit smaller systems
such as femtocell base stations, access points, and the larger handsets.
Machine-to-machine connectivity
The ability to communicate with either other nodes or the main network
infrastructure is an essential characteristic shared by many smart systems. This
holds across a wide range of applications, from health monitoring to remote water

Proceedings of the project SMART METERING, Vol. 3, 2013
23
quality sensors, from automobile corner control units to smart utility meters. The
requirements on the communications transceivers needed are similar across a wide
range of smart system applications:
A high degree of miniaturization;
Extreme power efficiency;
High spectral efficiency;
Secure communications;
Low cost;
A high degree of scalability across aggregations of very large num-
bers of devices.
These requirements are different from those of personal communications
transceivers – the power efficiency requirements are more demanding, the need for
high data rates is lower, etc. Thus existing technology will not fully unlock the
potential of smart systems – further advances are needed for feasible machine-to-
machine communications.
Hardware level
Advances in RF antenna and filter design for miniature, low-power designs:
Applications such as body area network nodes and “smart dust” sensor
networks for structural integrity monitoring call for unobtrusive antenna and radio
solutions that fit within ultra-small volumes and consume ultra-low power for
frequencies up to 11GHz are expected. Today, antenna and radio technologies are
developed separately, leading to non-optimal solutions in terms of size, power and
performance.
Furthermore, the physics of ultra-small antennas make them suffer from
impedance shifts, selectivity artefacts and gain losses which impact the
communication link negatively. Therefore research should address the integrated
radio hardware as a single antenna-radio microsystem, rather than as separate
components. The approaches used to achieve this would be antenna and radio co-
design, research into smart adaptive matching schemes, and the development of in-
telligent close-loop antenna and radio configuration algorithms. Research is also
needed for miniaturised beam-steering antennas arrays implemented using
MEMS/CMOS technologies, for improving range and reducing required RF power
levels.
Advances in low-GHz radio IC technology: The low-GHz (300MHz - 2GHz
range) presents significant advantages for applications such as body-area-networks,
man-to-machine and machine-to-machine applications. Firstly, the propagation
characteristics have much lower attenuation than with multi-GHz (5GHz – tens of
GHz) bands, resulting in longer ranges. Secondly, unlike multi-GHz radios, low-
GHz radios can have low-current operation (mA-level) at low voltages (1V level).
The challenge is to achieve miniaturization of low-GHz radio technology. The
approaches to reach this would include research on low-frequency, 1V RF MEMS
technologies, on ultra-low power design in ultra-deep-submicron RF CMOS
technology, and on high-efficiency DC-DC power-management solution.
Proceedings of the project SMART METERING, Vol. 3, 2013
24
Power supply and power management are critical components of the
transceiver solutions for any smart system. This is particularly the case for widely
deployed aggregations of wireless sensor nodes with a high degree of autonomous
operation and ultra-small physical form factors. Radio circuits and architectures
must be developed with low-power standby solutions and with minimum energy
per transmitted bit as a key design metric. Research is also needed into exploiting
point-of-use renewable power sources for the transceiver section.
For more complex systems, it is critical that there is research into modelling,
simulation and prediction of energy use for improved energy efficiency and
automatic configuration algorithms for optimization. Research also is needed into
simulation packages and design tools which have close coupling of the underlying
physical phenomena: electromagnetic propagation, circuit-level behaviour, and
acoustics, mechanical and thermal properties.
System level
All of the existing solutions for machine-to-machine communications are
severely limited in their scalability. Cellular systems have good coverage and
range, but have high transceiver costs and power requirements. Other solutions,
such as Zigbee, lack in capacity and coverage. Research is required for
communication architectures and protocols which smoothly scale over a variety of
data rates, communication duty cycles, power availability, and allowable
transceiver form factors. The goal would be solutions that can address a
multiplicity of applications and connect the estimated tens of billions of smart
systems that require (mostly wireless) connectivity. Approaches would include
long-range, cellular-like systems, hierarchical approaches and flat-architecture
mesh-based solutions, using a range of frequency bands up to 11 GHz.
Many smart systems are deployed in safety-critical environments such as
cars, aircraft, and medical environments. Hence the communications require (a) an
assured level of internal reliability in harsh environments, (b) reliability in external
connectivity in the presence of interference and finally (c) fault tolerance in the
event of failure. Solutions will emerge from the creation of proper safety assurance
and graceful degradation methods. Multilevel approaches will be needed,
addressing the challenges at the hardware, radio-interface, and networking levels.
This will include the design and invention of new error detection and correction
methods suitable for the low duty cycles and stringent power requirements of many
smart systems. Also, in order to create fault tolerant smart systems, advances in
data fusion will be needed, with data streams coming from multiple networks
including wireless communication, localisation and sensor networks.
2.4.2. The Water Supply and Sanitation Technology
Platform
In January 2004 the European Commission adopted the European
Environmental Technology Action Plan (ETAP) whose objective is to remove
obstacles and to release the full potential of environmental technologies for

Proceedings of the project SMART METERING, Vol. 3, 2013
25
environmental protection, while contributing to competitiveness and economic
growth.
The European water sector is highly fragmented: water resources, water
supply and sanitation/wastewater are often managed locally. This fragmentation is
an obstacle for developing a common research strategy for a competitive water
sector. Overcoming this obstacle is one of the important aims of The Water Supply
and Sanitation Technology Platform (WSSTP) [11], whose objective is to federate
the vast and diverse amount of the European resources in the water sector. This
will enable the development and deployment of global water resource solutions for
Europe and provide the potential to significantly contribute to the MDGs.
Worldwide the Water Sector is currently facing a dramatic change. Three
main drivers trigger this development:
Climate change is predicted to cause significant changes in
precipitation patterns and their variability, affecting the availability of
water for people and also for agriculture and industry.
There is a technological and financial challenge of maintaining
and upgrading the infrastructure assets to deliver water to all sectors,
while restoring the quality of water distributed to the various communities
of users.
Globalisation is forcing rapid changes (migration, urbanization,
industrial activities and food production processes) leading in some
areas to a dramatic increase in water consumption. In addition, this demand
for water cannot always be satisfied by the locally available and
conventional water resources. Moreover, increasing wastewater discharges
can have adverse environmental impacts on aquatic systems as well as
affecting the costs for downstream users.
The key issues and challenges identified for the European water sector to
be addressed by WSSTP are:
Integrated and participatory approach to water management that
cuts across individual sectors and disciplines and founded on strong public
awareness;
Balance in demand and supply by demand management and
rational exploitation of alternative resources;
Insurance of water quality and security through management of the
water cycle, including risk management, use of more efficient treatment
technologies for all water resources, comprehensive water quality
monitoring and use of emergency supply systems.
Reduction of the environmental impact of water supply and
sanitation services through management of water as a self-sustaining cycle,
reduction of water-based emissions, valuation of waste water and sludge
components via useable commercial products, reduction of energy
consumption and customization of global water solutions for local
conditions in compliance with environmental constraints and regulations.

Proceedings of the project SMART METERING, Vol. 3, 2013
26
Cost efficient asset management through better understanding and
minimization of all costs components, risk analysis based maintenance and
replacement of assets and use of better materials and technologies taking
into account economic, environmental and societal impacts.
The core of the WSSTP vision is a sustainable, efficient, integrated
management of water resources by all water consuming sectors (people, industry
and agriculture) in harmony with the bearing capacity of nature. A joint goal for all
sectors is the use of alternative water resources; more efficient use through
conservation and re-use of water and energy consumption reduction; production of
valuable products from waste water, and provision for quality water ( fit for
purpose) for emergency situations.
The Strategic Research Agenda is based on four major challenges and gaps
in knowledge that exist in the various different parts of the water sector:
Increasing water stress and water costs;
Increasing urbanisation;
Increasing occurrence of extreme events;
Serving rural and underdeveloped areas in need.
Five research areas have been identified that all rely on a fundamental
common strategy based on Integrated Water Resources Management (IWRM)
which will facilitate the management of water resources to meet societal needs
within environmental constraints.
Research area 1: Balancing demand and supply
Goal: All users of water (people, agriculture, industry and nature) will make
sustainable use of water resources, by not using more water that is necessary or
using water of a higher quality than needed.
Research area 2: Ensuring appropriate quality and security
Goal: Ensure the quality and security of water supply and sewerage services.
Research area 3: Reducing negative environmental impacts
Goal: European water systems to be seen as a self-sustaining cycle of a
valuable renewable natural resource, and a source of beneficial products.
Research area 4: Novel approaches to design, construction and operation
of water infrastructure assets
Goal: To ensure that the performance and whole-life costs of water service
infrastructure is optimized and takes full account of their social impact during
construction, repair, rehabilitation and operation.
Research area 5: Establishment of an enabling framework
Goal: To enable the safe provision of water services to people, industry and
agriculture in diverse environments by the implementation of sound socio-
economic, socio-cultural and legal frameworks, respecting linguistic and cultural
diversity and cultural heritage.

Proceedings of the project SMART METERING, Vol. 3, 2013
27
2.4.3. Smart Grids: from innovation to deployment
The EU 2020 agenda comes across with a clear message for Europe. The
EU’s future economic growth and jobs will increasingly have to come from
innovation in products and services for Europe’s citizens and businesses.
Innovation will also contribute to tackling one of the most critical challenges
Europe is facing today, namely ensuring the efficient and sustainable use of natural
resources. The development of our future energy infrastructure must reflect this
thinking. Without serious upgrading of existing grids and metering, renewable
energy generation will be put on hold, security of the networks will be
compromised, opportunities for energy saving and energy efficiency will be
missed, and the internal energy market will develop at a much slower pace.
Smart Grids [12] could be described as an upgraded electricity network to
which two-way digital communication between supplier and consumer, intelligent
metering and monitoring systems have been added. Intelligent metering is usually
an inherent part of Smart Grids. To advise on policy and regulatory directions for
the deployment of Smart Grids in Europe, the Commission has set up a Smart
Grids Task Force, which has issued a report outlining expected services,
functionalities and benefits. These are largely agreed by industry, public authorities
and consumer organisations and are described in the attached Staff Working Paper.
The benefits of Smart Grids are widely acknowledged. Smart Grids can
manage direct interaction and communication among consumers, households or
companies, other grid users and energy suppliers. It opens up unprecedented
possibilities for consumers to directly control and manage their individual
consumption patterns, providing, in turn, strong incentives for efficient energy use
if combined with time-dependent electricity prices. Improved and more targeted
management of the grid translates into a grid that is more secure and cheaper to
operate. Smart Grids will be the backbone of the future decarbonised power
system. They will enable the integration of vast amounts of both on-shore and off-
shore renewable energy and electric vehicles while maintaining availability for
conventional power generation and power system adequacy.
These challenges need to be tackled as soon as possible in order to accelerate
Smart Grid deployment. The Commission proposes to focus on:
1. Developing technical standards;
2. Ensuring data protection for consumers;
3. Establishing a regulatory framework to provide incentives
for Smart Grid deployment;
4. Guaranteeing an open and competitive retail market in the
interest of consumers;
5. Providing continued support to innovation for technology
and systems

Proceedings of the project SMART METERING, Vol. 3, 2013
28
2.4.3.1. Developing common European Smart Grids
standards
The conclusions of the European Council of 4 February 2011 confirm the
urgent need to adopt European standards for Smart Grids. The work already started
in March 2009, when, based on the Measuring Instruments Directive (2004/22/EC)
and the Energy Service Directive, the Commission issued a mandate (M441) [13]
to the European standardisation organisations CEN, CENELEC and ETSI (ESOSs)
to establish European standards for the interoperability of smart utility meters
(electricity, gas, water and heat), involving communication protocols and
additional functionalities, such as assuring interoperability between systems to
provide secure communication with consumer's interfaces and improve the
consumer's awareness to adapt its actual consumption. The ESOSs were to provide
European standards for communication in March 2010 and complete harmonised
solutions for additional functions by December 2011, but the deliverables are
accumulating almost one year of delay. The Commission has since intervened to
clarify the scope of the mandate in line with intermediate findings by the Smart
Grid Task Force and to avoid further delays. The first deliverables for European
standards for smart meters are expected by the end of 2012.
Addressing data privacy and security issues
Developing legal and regulatory regimes that respect consumer privacy in
cooperation with the data protection authorities, in particular with the European
Data Protection Supervisor, and facilitating consumer access to and control over
their energy data processed by third parties is essential for the broad acceptance of
Smart Grids by consumers. Any data exchange must also protect the sensitive
business data of grid operators and other players, and enable companies to share
Smart Grids data in a secure way.
Directive 95/46/EC on the protection of personal data constitutes the core
legislation governing the processing of personal data. The Directive is technology-
neutral and the data processing principles apply to the processing of personal data
in any sector, so also cover some Smart Grids aspects. The definition of personal
data is particularly relevant, as the distinction between personal and non-personal
data is of outmost importance for further Smart Grids deployment. If the data
processed are technical and do not relate to an identified or identifiable natural
person, then Distributed System Operators (DSOs), smart meter operators and
energy service companies could process such data without needing to seek prior
consent from grid users. While the European data framework is appropriate and
does not need to be extended, some adaptations might be needed in the specific
national legal frameworks in order to accommodate some Smart Grids foreseen
functionalities. With the wide deployment of Smart Grids, the obligation to notify
national data protection authorities of the processing of personal data is naturally
likely to increase. Member States will have to ensure, when setting up Smart Grids
and more particularly when deciding on the division of roles and responsibilities
regarding ownership, possession and access to data, that this is done in full
compliance with the EU and national data protection legislation.

Proceedings of the project SMART METERING, Vol. 3, 2013
29
2.4.3.2. The role of Electricity Industry
The Union of the Electricity Industry – EURELECTRIC [14] is the sector
association representing the common interests of the electricity industry at pan-
European level, plus its affiliates and associates on several other continents.
EURELECTRIC has indicated its support for further actions along these lines.
With the 3rd EU Electricity Directive, a clear timeline for a European Union
Smart Metering roll‐out has been set. It stipulates indeed that “Member States shall
ensure the implementation of intelligent metering systems” which “may be subject
to an economic assessment of all the long-term costs and benefits to the market and
the individual consumer or which form of intelligent metering is economically
reasonable and cost‐effective and which timeframe is feasible for their
distribution”. The Directive also states that the mentioned assessment shall be
conducted by 3rd September 2012 and that “where roll‐out of smart meters is
assessed positively, at least 80 % of consumers shall be equipped with intelligent
metering systems by 2020”.
EURELECTRIC views Smart Metering as a very promising technology that
can substantially empower electricity customers to become active managers of their
consumption. Smart Meters will improve ‐ through accurate billing ‐ the
customer’s knowledge about his/her electricity consumption thereby increasing
customer awareness of energy end‐use. Besides, Smart Meters will allow an
optimization of the customer processes, making them more efficient and more
reliable, thus leading to enhanced supplier switching and higher customer
satisfaction.
Since Smart Meters will not only bring benefits to the whole length of the
electricity value chain, and will also carry externalities to society as a whole,
EURELECTRIC calls on EU Member States’ National Regulatory Agencies to
make the commitment that Smart Meter roll‐out will be tariff financed.
With regard to the functionalities of Smart Meters, EURELECTRIC
considers it of utmost importance that the number of Smart Metering
functionalities remains limited to essential requirements in the view of customers.
This would keep costs down without hindering the proportion of customers
interested in actively managing their electricity consumption ‐ e.g. through
information portals ‐ from using additional functionalities.
By the same token, considering the constant improvements in Smart
Metering technologies, EURELECTRIC believes that rolled‐out Smart Meters
should be able to be remotely upgraded to keep costs down.
EURELECTRIC calls on the European Commission to issue a parallel
mandate to the European standardisation bodies. Its objective would be to reach
standardised data protocols and data structure so that Distribution System
Operators (DSOs) can improve customer data transfer from one supplier to the
other (both inter & intra DSO areas).
Ensuring a fair regulatory environment
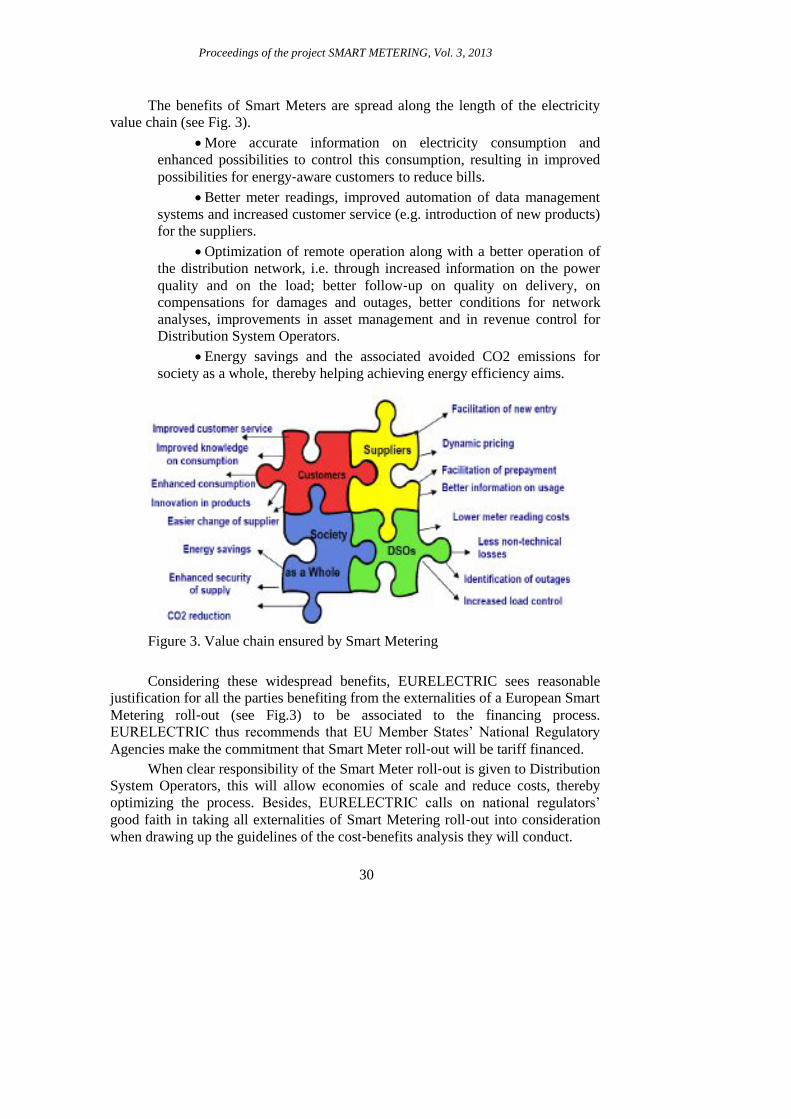
Proceedings of the project SMART METERING, Vol. 3, 2013
30
The benefits of Smart Meters are spread along the length of the electricity
value chain (see Fig. 3).
More accurate information on electricity consumption and
enhanced possibilities to control this consumption, resulting in improved
possibilities for energy‐aware customers to reduce bills.
Better meter readings, improved automation of data management
systems and increased customer service (e.g. introduction of new products)
for the suppliers.
Optimization of remote operation along with a better operation of
the distribution network, i.e. through increased information on the power
quality and on the load; better follow‐up on quality on delivery, on
compensations for damages and outages, better conditions for network
analyses, improvements in asset management and in revenue control for
Distribution System Operators.
Energy savings and the associated avoided CO2 emissions for
society as a whole, thereby helping achieving energy efficiency aims.
Figure 3. Value chain ensured by Smart Metering
Considering these widespread benefits, EURELECTRIC sees reasonable
justification for all the parties benefiting from the externalities of a European Smart
Metering roll‐out (see Fig.3) to be associated to the financing process.
EURELECTRIC thus recommends that EU Member States’ National Regulatory
Agencies make the commitment that Smart Meter roll‐out will be tariff financed.
When clear responsibility of the Smart Meter roll‐out is given to Distribution
System Operators, this will allow economies of scale and reduce costs, thereby
optimizing the process. Besides, EURELECTRIC calls on national regulators’
good faith in taking all externalities of Smart Metering roll‐out into consideration
when drawing up the guidelines of the cost‐benefits analysis they will conduct.

Proceedings of the project SMART METERING, Vol. 3, 2013
31
In order to optimize Smart Meter roll‐out in Europe, EURELECTRIC calls
on policy makers and national Energy regulators to consider the following 6 main
recommendations both when implementing and enforcing the 3rd Electricity
Directive:
1. The EU Smart Meter roll‐out should be optimized. It
should occur on a geographical basis so as to maximize economies of scale
and reduce costs. Likewise, only essential functionalities should be put in
the meter installed by DSOs. Customised services could be added by
interested consumers (directly or indirectly through retailers or energy
service providers).
2. National Regulatory Agencies should clearly indicate that
Smart Meter roll‐out will be tariff‐financed. Smart Meters will not only
bring benefits to the whole length of the electricity value chain, they will
also carry externalities to society as a whole.
3. Smart Meters should provide frequent and precise
information to maximize benefits in terms of billing,
demand‐side‐management, grid load planning and interruption
management. They should also be equipped with a bi‐directional
communication functionality.
4. Considering the constant improvements in Smart Metering
technologies, rolled‐out Smart Meters should be able to be remotely
upgraded to keep costs down.
5. Electricity retailers and energy service companies should
be put in a position to enable customers in making use of Smart Meter
information to reduce peak consumption and CO2 emissions. In the areas
where DSOs are responsible for managing metered data, they will share
relevant energy market data transparently with licensed market
participants.
6. Following the 441 Mandate issued by the European
Commission, EURELECTRIC welcomes the on‐going standardisation
efforts at the European Union level to set up open communication
interfaces. However, in order to reach full inter‐operability of Smart
Meters, EURELECTRIC calls on the European Commission to issue
another mandate to the European standardisation bodies: its objective
would be to reach standardised data exchange protocols so that
Distribution System Operators (DSOs) can improve verified customer data
transfer to the service providers of the customer’s choice.
2.4.3.3. Electrical energy market content
An expanding world population, wanting the best possible living quality is
putting increasing demands on the world’s energy resources. Rising energy sources
costs, combined with climate change, motivate people to improve energy
efficiency. Energy consumption by sectors, are distributed as follows (Fig. 4). Most
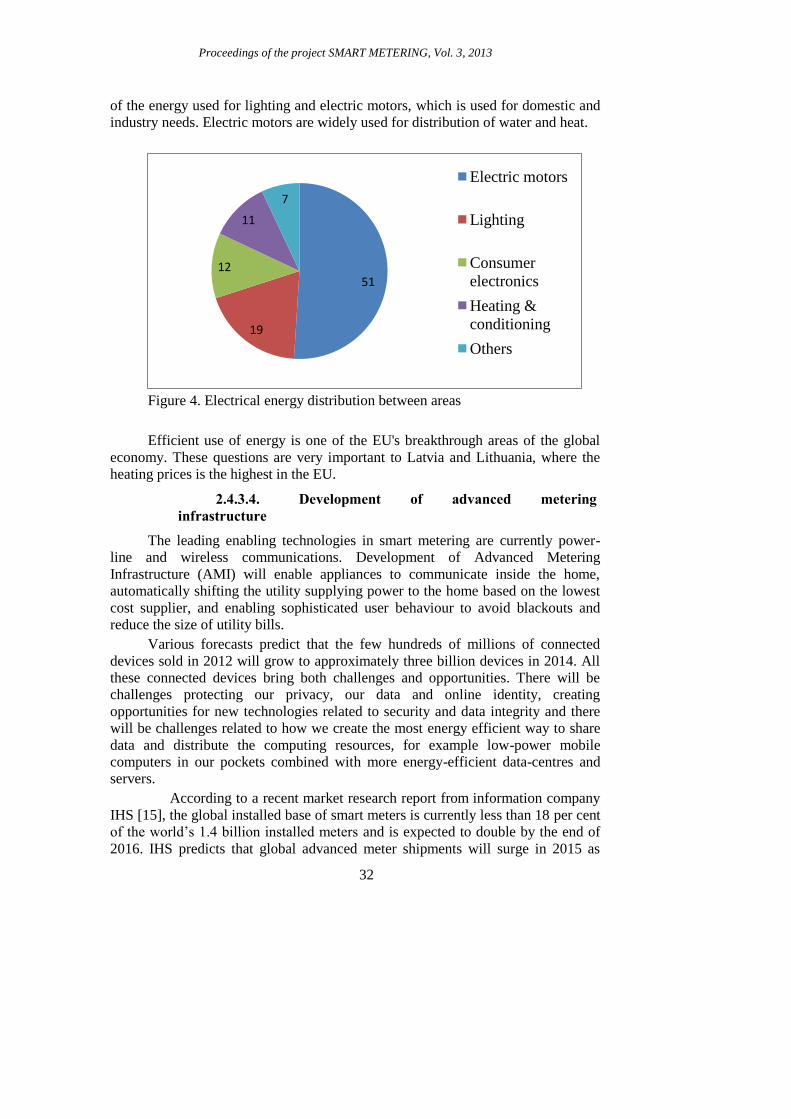
Proceedings of the project SMART METERING, Vol. 3, 2013
32
of the energy used for lighting and electric motors, which is used for domestic and
industry needs. Electric motors are widely used for distribution of water and heat.
Figure 4. Electrical energy distribution between areas
Efficient use of energy is one of the EU's breakthrough areas of the global
economy. These questions are very important to Latvia and Lithuania, where the
heating prices is the highest in the EU.
2.4.3.4. Development of advanced metering
infrastructure
The leading enabling technologies in smart metering are currently power-
line and wireless communications. Development of Advanced Metering
Infrastructure (AMI) will enable appliances to communicate inside the home,
automatically shifting the utility supplying power to the home based on the lowest
cost supplier, and enabling sophisticated user behaviour to avoid blackouts and
reduce the size of utility bills.
Various forecasts predict that the few hundreds of millions of connected
devices sold in 2012 will grow to approximately three billion devices in 2014. All
these connected devices bring both challenges and opportunities. There will be
challenges protecting our privacy, our data and online identity, creating
opportunities for new technologies related to security and data integrity and there
will be challenges related to how we create the most energy efficient way to share
data and distribute the computing resources, for example low-power mobile
computers in our pockets combined with more energy-efficient data-centres and
servers.
According to a recent market research report from information company
IHS [15], the global installed base of smart meters is currently less than 18 per cent
of the world’s 1.4 billion installed meters and is expected to double by the end of
2016. IHS predicts that global advanced meter shipments will surge in 2015 as
51
19
12
11
7
Electric motors
Lighting
Consumer
electronics
Heating &
conditioning
Others

Proceedings of the project SMART METERING, Vol. 3, 2013
33
advanced metering projects come on line in Europe and in developing economies,
with China being the most significant market for advanced meters.
2.4.3.5. Need for advanced smart grid security
Attacks on computer systems from viruses, root kits, trojans, worms,
keyloggers, bots and other malicious software have been the focus of hackers and
cyber security experts for many years. With historically isolated industrial controls
such as Supervisory Control and Data Acquisition (SCADA) systems and
programmable logic controllers (PLCs) connected to the same networks, loss of
service and physical damage can be caused from unauthorized access.
In fact, the goal of the smart grid is network connectivity, so network
security is fundamental to its successful implementation. However, the global
electricity grid infrastructure has experienced a rapid increase in the number of
vulnerabilities since 2000, and the occurrences are growing. As one of the key
assets of any nation, protection from the increasing number of attempted and
successful attacks on the grid and its metering systems is (or should be) a national
priority for all industrialized countries. Increasingly, more dangerous attacks have
occurred from sophisticated attackers, including foreign governments, as well as
state run and financed attacks, hackers, cyber terrorists, organized crime, industrial
competitors, disgruntled employees and careless or poorly trained employees.
The motivation on security for stakeholders varies as it can be seen in Table
2 below:
Table 2. Motivation on security for stakeholders
Asset Stakeholder Attack
Content Content owner Piracy
Service access Service provider Fraud
Intellectual
property
Manufacturer Espionage
Personal data End user Privacy breach
As a result, governments around the world have taken steps to provide
increased security and reduce the cost of cyber crime. United States government
organizations active in standards and other areas include the North American
Electricity Reliability Corporation (NERC)[16] and the National Institute of
Standards and Technology (NIST)[17].
Designed to ensure the reliability of bulk electric systems in North America,
NERC’s Critical Infrastructure Protection (CIP) includes standards development,
compliance enforcement, assessments of risk and preparedness. NIST developed
and issued NISTIR 7628, Guidelines for Smart Grid Cyber Security and NIST
Special Publication 1108: NIST Framework and Roadmap for Smart Grid
Interoperability Standards, Release 1.0.

Proceedings of the project SMART METERING, Vol. 3, 2013
34
NERC’s CIP Reliability Standards require compliance with specific
requirements to safeguard critical cyber assets. CIP-002 through CIP-009 address
physical as well as cyber security requirements for responsible grid entities. They
provide the benchmarks for utility companies’ measurements and certifications.
Cyber aspects include the following:
• Identifying critical assets;
• Identifying and training cyber security personnel;
• Developing and implementing security management;
• Defining methods, processes and procedures;
• Securing the systems identified as critical cyber assets;
• Reporting and response planning;
• Establishing recovery plans.
The basis of the interactions are the Internet, enterprise buses, wide area
networks (WANs), substation local area networks (LANs), field area networks and
premises networks. While confidentiality is least critical for power system
reliability, it is increasingly important with the availability of online customer
information and privacy laws that impose strict penalties for breach of privacy. The
integrity for power system operation addresses requirements of the following:
• Authentication of the data;
• No modification of the data without authorization;
• Implementation of NISTIR 7628;
• Known and authenticated time stamping and quality of data.
In addition to establishing the requirements, NIST existing and developed
standards identify critical security aspects such as data encryption and definitions
for common understanding and implementation of solutions.
The fundamental step towards establishing a secure or trusted component or
entry point to a network is a root of trust (RoT). The RoT verifies that the
component is performing in an expected manner in the initial operation or
engagement of the component or system. This established trust provides the first
step towards improving security. In the Aberdeen Group report, “Endpoint
Security: Hardware Roots of Trust” [18] the analyst notes that over a 12-month
period, companies that utilized a hardware RoT in their approach to security had 50
percent fewer security related incidents and 47 percent fewer compliance/audit
deficiencies.
Other terms that may be unfamiliar to those addressing highly secure
computer operation for the first time include:
• Anti-cloning provides a unique device ID and digital signing support and
encryption;
• High assurance boot is a security library embedded in tamper-proof on-chip
ROM that prevents unauthorized software execution;
• Secure clock provides reliable time source;
• Secure communications ensure the integrity of data and information;
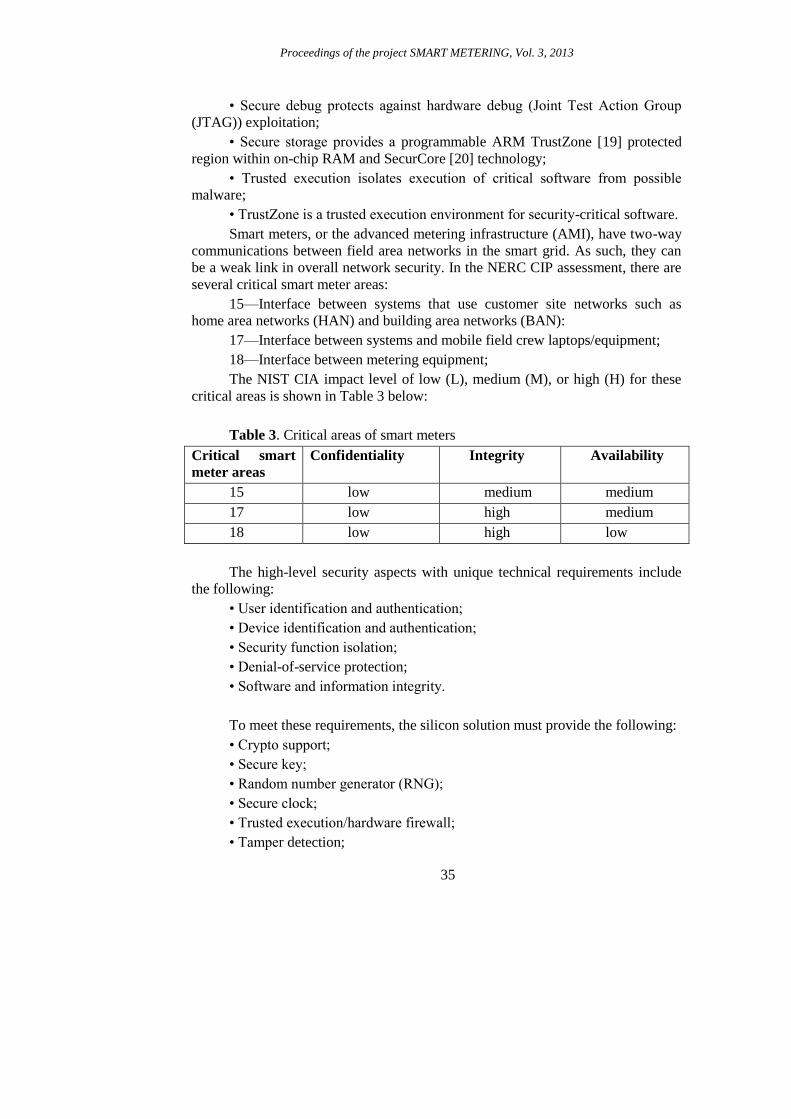
Proceedings of the project SMART METERING, Vol. 3, 2013
35
• Secure debug protects against hardware debug (Joint Test Action Group
(JTAG)) exploitation;
• Secure storage provides a programmable ARM TrustZone [19] protected
region within on-chip RAM and SecurCore [20] technology;
• Trusted execution isolates execution of critical software from possible
malware;
• TrustZone is a trusted execution environment for security-critical software.
Smart meters, or the advanced metering infrastructure (AMI), have two-way
communications between field area networks in the smart grid. As such, they can
be a weak link in overall network security. In the NERC CIP assessment, there are
several critical smart meter areas:
15—Interface between systems that use customer site networks such as
home area networks (HAN) and building area networks (BAN):
17—Interface between systems and mobile field crew laptops/equipment;
18—Interface between metering equipment;
The NIST CIA impact level of low (L), medium (M), or high (H) for these
critical areas is shown in Table 3 below:
Table 3. Critical areas of smart meters
Critical smart
meter areas
Confidentiality Integrity Availability
15 low medium medium
17 low high medium
18 low high low
The high-level security aspects with unique technical requirements include
the following:
• User identification and authentication;
• Device identification and authentication;
• Security function isolation;
• Denial-of-service protection;
• Software and information integrity.
To meet these requirements, the silicon solution must provide the following:
• Crypto support;
• Secure key;
• Random number generator (RNG);
• Secure clock;
• Trusted execution/hardware firewall;
• Tamper detection;

Proceedings of the project SMART METERING, Vol. 3, 2013
36
• Secure debug.
AMI system functions include measuring, communicating and using the
data. Encryption techniques are defined for specific aspects of these functions.
Smart meter encryption techniques include Advanced Encryption Standard (AES)
and Elliptic Curve Cryptography (ECC) that are even more stringent than
techniques used in the banking sector. NIST applies additional requirements for
smart meters, including unique credentials, a key management system (KMS) that
supports an appropriate lifecycle of periodic rekeying and revocation and more.
The successful implementation of smart meter security is based on a hardware root
of trust.

Proceedings of the project SMART METERING, Vol. 3, 2013
37
3. Summary of Research on Opportunities for
Smart Meter Tools Introduction in Latvia and
Lithuania Markets
3.1. Task for Research on Water Pressure and Flow
Meters Products in Latvia and Lithuania
The task for research is to find out most popular companies providing water
pressures and flow meters in Latvia and Lithuania.
During the research time it was necessary to find out:
The most popular companies;
The range of product in defined market niche;
The degree of competition between companies and products.
3.1.1. Used methods
During the research to find all necessary information was used several
investigation methods:
To find out companies providing defined equipment was used
internet search in Latvian and Lithuanian internet environment, like Google
search, used Latvian and Lithuanian versions and languages
Studies of companies web pages,
To find out must popular products in Latvian and Lithuanian
market, it was used telephone interviews with managers of water supplying
and heating companies,
To understand usage of products, it was used telephone interviews
with companies providing designing and integration of solutions for water
supplying and heating networks.
3.1.2. Most popular companies and products in Latvia
and Lithuania
To find out most popular companies providing water pressure and flow
meters, it was done research in Internet to find out companies selling and installing
defined products to water supplying companies. It was done search in Latvian and
Lithuanian Google web in both languages.
During the research period it was checked more than 30 different web pages,
especially looking for water pressure and flow meters products, companies selling
this kind of products, providing system design and installation works for water
supply companies.

Proceedings of the project SMART METERING, Vol. 3, 2013
38
Inducont
The INDUCONT was founded on February 2004. Director of the Company
is Mr. Maris Dizgalvis. As for now, one of the company’s major directives is to
focus on INDUSTRIAL solution servicing companies that operate in industrial
environment. The general client of the INDUCONT Company is a producer or
contractor who is associated with the heat and water supply (new system
installations or current system improvement) as well as food production industry.
The INDUCONT is an official representative of several DANFOSS (Denmark)
product divisions, such as DANFOSS INDUSTRIAL, DANFOSS SOCLA and
SAUER – DANFOSS. In Latvia the company also represents German
manufacturers, such as KROHNE, HACH LANGE, GESTRA, ARI ARMAUREN,
A+R as well as the Danish manufacturer MJK.
Klīva
KLIVA- Company has operated on the market of the Baltic states and EU
for more than fifteen years arranging supplies of laboratory equipment, measuring
instruments and labware. The main customers are oil, food, meat, bakery, dairy
industry enterprises, water purification stations, sanitary control laboratories,
medical, veterinary diagnostic laboratories and etc. Part of company’s products is
water pressure and flow meters from Denmark – JUMA.
Lasma
LASMA Ltd was established in 1992. Basic activity is automation of
production processes, control and measurements of technological processes,
industrial sensors, manufacturing and development of switchboards and self-
adjustment, switchboard mounting and service. Some original self-manufactured
products, for example, level regulators, reactive power compensation controller,
phase selection relay, data registration system, are still being produced and
successfully competes with foreign analogues.
At the moment in company are employed 14 employees, 10 of them are
qualified engineers, who help customers find the most appropriate solution for
technical problems: inspects the object, develops technological task or project then
installs and sets the necessary control devices and systems.
Company is well-known in Latvia by its wide thermal process control offer,
especially with the choice of temperature sensors. Collaboration partners are
chosen not by the principle of cheapest prices but by the quality, professional
technical support and delivery quickness principle.
Good connection with many international manufacturing companies and
established stock for mostly demanded automation components provides maximum
short delivery terms and competitive prices. Successful long term cooperation
results let company continue to improve its product and service range, offering new
and up-to-date technologies. The company cooperates with many well-known
companies in Latvia – product integrators, retailers and planners-manufacturers.
Will Sensors
WILL Sensors is a company that offers products and solutions for industrial
and process automation. Company provides sensors for measurement, detecting,

Proceedings of the project SMART METERING, Vol. 3, 2013
39
counting, warning, safety to control and monitor processes. As well they offer
connectors and fieldbus products, interfaces and controllers, wireless modems and
lighting products.
Company represents its partners: HANS TURCK, BANNER
ENGINEERING, BD SENSORS, TC LTD., UWT, ASCON TECHNOLOGIC and
PIZZATO.
Interautomatika
UAB „Interautomatika“- operates in a field of measurement instrumentation,
services and solutions for industrial process engineering. The customer support
comes in the form of an application kit with variety of industry control products
and its mounting or/and commissioning solutions which finally helps to our
customer to solve specific industry oriented OEM or production installation
problems. Company works in Latvia and in Lithuania.
Table 4. Most popular companies in Latvia and Lithuania
Latvia Lithuania
Interautomatika.lv
Inducont
Will Sensors
Kliva
Lasma
Interautomatika.lt
Endoterma
Will Sensors
PAK
As one con see some companies have business in both countries, which
giving bigger market and more possibilities to work with potential customers and
to provide bigger range of products. One of the problems is that companies usually
work just with one or two different producers of measuring equipment and for
customers is no choice.
Table 4. Most popular brands used in Latvia and Lithuania
Pressure transmitters Water flow meters
Siemens
Danfoss
Juma (DE)
Aplisens (PL)
Nivelco (HU)
BD Sensors (CZ)
TURK (US)
Krohne (DE)
Danfoss
Siemens
Meatest (CZ)

Proceedings of the project SMART METERING, Vol. 3, 2013
40
In both countries very popular and required are the global brands like
Siemens and Danfoss. However more and more popular become Eastern Europe
brands like Aplisens or Meatest, which are more suitable with price level and
competitive with price. Main requirements for equipment from customer point of
view are price, quality and reputation of producer (link with quality).
3.1.3. Range of more popular pressure transmitters
used in Latvia and Lithuania
EMP 2, Box-type pressure transmitters
The ship of approved pressure transmitter EMP 2 is designed for use in
almost all marine and industrial applications, and offers a reliable pressure
measurement, even under harsh environmental conditions. The pressure transmitter
programed in box design is approved according to LR, DNV, GL, RINA, ABS,
BV, NKK, PRS, MRS, KRS requirements, and covers a 4-20 mA output signal,
gauge (relative) versions, measuring ranges from 0-1 to 0-400 bar, zero point and
span adjustment, Pg 13,5 cable entry and different pressure connections. A robust
construction enables the pressure transmitter to meet the strictest requirements.
PRESSURE TRANSMITTERS MBS 32/33
MBS 32 pressure transmitters are designed for use in almost all industrial
applications, and offer a reliable pressure measurement, even under harsh
environmental conditions. The flexible pressure transmitter programed covers all
standard voltage outputs, absolute and gauge (relative) versions, measuring ranges
from 0-1 to 0-600 bar and a wide range of pressure and electrical connections.
Excellent vibration stability, robust construction, and a high degree of EMC/EMI
protection equip the pressure transmitter to meet the most stringent industrial
requirements.
Pressure transmitter MBS 33 is designed for use in almost all industrial
applications, and offers a reliable pressure measurement, even under harsh
environmental conditions. The flexible pressure transmitter programed covers a 4-
20 mA output signal, absolute and gauge (relative) versions, measuring ranges
from 0-1 to 0-600 bar and a wide range of pressure and electrical connections.
PRESSURE TRANSMITTERS MBS 5100/5150
The ship approved high accuracy pressure transmitter MBS 5100 is designed
for use in almost all marine applications, and offers a reliable pressure
measurement, even under harsh environmental conditions. The pressure transmitter
programme in block design is approved according to LR, DNV, GL, RINA, ABS,
BV, NKK, PRS, MRS, KRS requirements, and covers a 4-20 mA output signal,
absolute and gauge (relative) versions, measuring ranges from 0-1 to 0-600 bar,
zero point and span adjustment, plug connection and female/flange pressure
connections. Excellent vibration stability, robust construction, and a high degree of
EMC/EMI protection equip the pressure transmitter to meet the most stringent
industrial requirements.

Proceedings of the project SMART METERING, Vol. 3, 2013
41
The ship approved high accuracy pressure transmitter MBS 5150 is designed
for use in marine applications with severe medium influences like cavitation, liquid
hammer or pressure peaks, and offers a reliable pressure measurement, even under
harsh environmental conditions. The pressure transmitter programme in block
design is approved according to LR, DNV, GL, RINA, ABS, BV, NKK, PRS,
MRS, KRS requirements, and covers a 4-20 mA output signal, absolute and gauge
(relative) versions, measuring ranges from 0-1 to 0-600 bar, zero point and span
adjustment, plug connection and female/flange pressure connections.
3.1.4. Water flow meters
3.1.4.1. Advantages and disadvantages
One of the main advantages is that Latvian and Lithuanian companies
providing quite offer a wide range of products, therefore customers – utilities can
find the products with a suitable price, quality and level of service. Also it is
positive that sellers not just sell equipment but also provide a range of services for
designing of systems and consultancies about better usage of equipment and are
able to provide installations works.
Table 5. Advantages and disadvantages of products and services providers
Advantages Disadvantages
Wide range of products and
companies
Wide prices levels
Services for consultancies and
integrations of products
Break down of products in
companies by producers
Lack of integrators
No unified information about
possible solutions
One of the biggest problem for customers in both – Latvian and Lithuanian
markets is, that companies are focused to one or two different brands and for this
reason customers have no full information about possibilities to build up better
solutions for water supply network monitoring.
In both countries we find out just a few companies offering integration
services to customers - design of solutions, consultancies for better equipment,
installation of equipment and software, development of services and maintenance
of system and services. At least is no real competition between existing integration
companies in Latvia and Lithuania. In Lithuania it is one big full range integration
company – Axis Industry, mostly focusing on providing services for heating
companies. In Latvia it is Citrus Solution and in start-up stage – Smart Meter.
Other companies do not provide full range of services, just selling or developing
equipment or focusing just on one niche of the market.

Proceedings of the project SMART METERING, Vol. 3, 2013
42
For this reason we would like to make a conclusion that in both countries it
is still lack of integrators, who could provide wide range of services to utilities and
it is free space to build up new business possibilities.
A problem for customers (utilities) is a lack of unified source of information
about solutions for water utilities network monitoring. As companies sell different
brands of equipment focusing just to one or two of them, they are not interesting to
provide customers the full range of information about possible solutions. This is a
task for professional organizations, like Water Supply Companies Association in
Latvia, to provide information about different possible solutions and to organize
education and information seminars for utilities.
3.1.5. Conclusions about existing water pressure and
flow meters market in Latvia and Lithuania
1. In both countries companies provide enough wide range of
water pressure and flow meters equipment to satisfy potential customers –
water and heating utilities.
2. The different price level gives a possibility for customers
to choose necessary quality and price level for used products.
3. In this market competition does not appear between
solution integration companies, who provide consultancies and
development of network monitoring systems.
4. Information level for possibilities to use different
equipment for network monitoring and efficiency is not available for
potential users – utilities. It is still necessary to educate potential
customers, how to improve efficiency of water and heating networks.
5. It is recommended that academic and professional
organizations would undertake an initiative to organize unify source of
information about possible solutions for increasing networks efficiency and
monitoring.
3.1.6. Task for research about e-services for customers
and used methods
A research has been done with a target to understand, what kind of electronic
services is available in Latvian and Lithuanian water supplying and heating market
and to define future development ways.
The method was used:
Telephone interviews with potential customer groups.
Analysis of web pages of companies providing e-services in Baltic
States.
During the research we defined tree potential customer groups for usage of
smart metering e-services:

Proceedings of the project SMART METERING, Vol. 3, 2013
43
1. Utilities- water supply and heating companies providing
water and heating to companies and private persons.
2. Building management companies – providing management
services to companies and private persons.
3. Tenants – taking services from utilities or building
management companies.
3.1.7. Existing services description and examples
During the research we found out several types of electronic services for
different type of customers. Mostly it is availability of different type of data from
meters on internal or external water supply or heating networks.
Information in web – is receiving different information on web
environment. Usually this kind of services is available via computer or
other IT devices. User, having access to service has user name and
password and can see data from meters. In some cases it is possible to see
data analysis and comparison in different time periods.
As value added services there are several information services
receiving to customer mobile devices. These kinds of services usually
are on customer demand sending data with regular time period to user
mobile device with data or data analysis from different meters. In some
cases this is emergency information about situation analysing data from
system coming from a network meters or other equipment.
Services free of charge- usually it is basic meters data providing
in Internet environment without any analyses.
Surcharge services providing more deep and precise analyse of
collected data from different meters. In this kind of services usually are
used data from system in different time periods and necessary to organize
collecting and storage of big amount of data
Enterprise internal services- providing for different departments
and specialists inside of utilities or building management enterprises like
technical department, help desk, customer service department or finance
department. Those data or services are used to improve enterprises internal
processes and company efficiency.
External services usually providing for end users- tenants or
building management companies to receive data from meters, automatic
bills and regular information.
3.1.7.1. SWOT of existing e-services.
Analysing existing e-services in Latvia and Lithuania and comparing with
future possibilities in Western Europe we find out that this market niche just
starting to develop in Baltic countries. There are a lot of potential for e-service

Proceedings of the project SMART METERING, Vol. 3, 2013
44
development especially that in Western Europe e-service development it is in
beginning stage as well.
The main users of e-services are utilities enterprises, counting water
consumption in buildings and on some special industrial territories. With the same
success they are using remote control and data reading from different equipment
installed on water supply and heating supply systems. If some services for
enterprises are on development and in nearest future 2-3 years most of big water
and heating users will be customers of different e-services. However services for
private consumers are not will be so popular.
Expenses for implementation (costs of equipment) in private apartments and
private houses are too high. In most cases in Latvia and Lithuania it is necessary to
install new generation, more precise water meters. There is a big investment for
water and heating supply enterprises and tenants, which are not ready to pay for
additionally to existing expenses for water and heating. This is a main reason why
e-services for tenants are not popular and are not developing.
Table 6. SWOT of existing e-services
Strength Weakness
• Improvement of
effectiveness of enterprises
(HR, finance)
• Reducing of reaction time in
case of network damage
(leakages)
• Decreasing of expenditures
• Easy and operative
information for users
• Comfort for tenants
• Additional expenses
• Lack of information about e-
services
• Lack of trust
• Lack of electronic devices in
part of tenants
Opportunities Threats
• Increase effectiveness for
enterprises
• Increase level of service for
tenants
• Effective cooperation
between utility companies
• Effectiveness between
different departments inside
of companies
• Cooperation between
services providers and users
• Expenses for introducing of
e- services
• Lack of users
• Lack of information about e-
services and advantages of
them
•

Proceedings of the project SMART METERING, Vol. 3, 2013
45
In the same time looking for some results of pilot projects in Latvia and
Lithuania, we can see that perspectives for this kind of services development for
enterprises needs are very big. Water and heating supply companies find out a lot
of benefits for saving existing expenses for human resources, monitoring
consumption, administrative expenses on transportation. The are several indirect
benefits, like monitoring of network and saving electricity, management of
leakages, saving natural recourses, effectiveness of enterprises.
In some cases it is necessary to work on legislation and normative
documents for development electronic services, because still there are several
unclear questions especially in sector of private water and heating customers. For
example it is not clear, who is owner of measurement equipment- municipality
enterprise (water or heating supply enterprise) or private person? It is necessary at
state and municipal level to develop legislation in order to prepare more clear rules.
3.1.7.2. Proposal for future services development.
As electronic services for different type of customers- enterprises and private
users of natural resources just become popular in Latvia and Lithuania, it is a big
potential for development of several new types of services. In one sense it is easy
to implement existing services from other Europe countries, but from the other
point of view it is possible for Baltic scientists and enterprises to become leaders in
development of new services for measurement of different parameters of water and
heating networks, making work of those networks more effective and economic.
One group of services should be a smart metering for wide range of meters
and different sensors giving possibilities to enterprises and end users to better
monitor consumption of natural resources.
The second group of services could be analysis of received data from sensors
and meters, giving to specialists of utilities a wide range of data relevant to
organize effective administration of network, to prepare information for customers
(bills), to ensure information for technical specialists about potential leakages and
technical situation of network.
The third group of services could be information services on different mobile
devices, giving information to utilities specialists and to end users (enterprises and
private customers). It could be information about unusual usage of water, possible
leakages, level of bills and other unexpected situations.
It is possible to develop all of those services using smart metering, data
reading and remote control methods applied on water and heat distribution
networks in municipalities.
3.1.7.3. Conclusions about e-services
Smart metering services in Latvia and Lithuania are still on the beginning
stage. It is not a lot of equipment and ready solutions for utilities to use all
possibilities of those new methods of network management.
Target groups for smart metering services do not have sufficient
knowledge about possibilities to improve work of utilities enterprises, organizing

Proceedings of the project SMART METERING, Vol. 3, 2013
46
better administration, more effective work and usage of human and technical
resources.
It is necessary to educate staff of utilities and municipalities and also end
users, how to organize usage of natural resources in more effective and economical
way in long-term period.
It is a big challenge for Latvian and Lithuanian R&D enterprises and
institutions to become leaders in some smart metering niches and to distribute
knowledge and technologies in European and Eastern countries - Russia, Ukraine
and others.
3.2. Models and methods of heat losses evaluation
due to moisture penetration in insulation layer of the pipe
3.2.1. Calculation of heat losses
To calculate heat flux passing through a pipe with an insulation layer, it is
necessary to calculate the thermal resistances of all insulation layer components.
For pipes this parameter varies not only from insulation thickness and thermal
conductivity, but also from the pipe outer diameter and a heat water temperature.
The thermal resistance of each insulation layer is calculated using
equation [21]:
, (1)
where is the radius of outer insulation i layer in [m], is the inner
radius of insulation i layer in [m], is the thermal conductivity of i insulation
layer in [W/mK].

Proceedings of the project SMART METERING, Vol. 3, 2013
47
Figure 5. Pipes without and with insulation
The total thermal resistance of a pipe with n coating layers can be calculated
using this equation:
, (2)
where - inner surface heat transfer resistance between hot water and
steel pipe, - outer surface heat transfer resistance between hot water and steel
pipe in [ ]. R=1/h, where h is heat transfer coefficient. Typical values of
it are presented in [22].
Typical insulated pipe has three layers – steel, polyurethane foam and
polyethylene cover.

Proceedings of the project SMART METERING, Vol. 3, 2013
48
Table 6. Heat transfer coefficients
Type h [ ] Example
Free convection gas - free
convection gas 1 - 2 W/m
2K Room window to
outside air
Free convection gas -
forced flowing water 5 - 15 W/m
2K Radiator with
water for central
heating
Free convection gas -
condensing water steam 5 - 20 W/m
2K Radiator with
steam for central
heating
Forced convection
flowing gas - condensing vapour
water
10 - 50 W/m2K Air heaters
Liquid free convection -
free convection liquid 25 - 500 W/m
2K Oil bath for
heating
Liquid free convection -
forced liquid flowing water
50 - 100 W/m2K Heating coil in
vessel water,
water without
steering
500 - 2000 W/m2K Heating coil in
water
Forced liquid flowing water
- forced liquid flowing water 900 - 2500 W/m
2K Heat exchanger
water/water
Forced liquid flowing water
- condensing vapours water 1000 - 4000 W/m
2K Condensers
steam water
Inner steel pipe surface -
inner flowing water 2000 W/m
2K
Outer steel pipe surface -
polyurethane 8 W/m
2K
1 W/(m.K) = 1 W/(m.oC) = 0.85984 kcal/(hr.m.
oC).
Usually for pipes the steel is used, according to the standards - EN 10216-2,
EN 10217-1, EN 10217-2, EN 10217-5 (steel types P235GH, P235TRI or
P235TR2) [4]. The thermal conductivity of steel (carbon 1%) is 43 W/m per ˚C.
The thermal conductivity of water (steam) is 0.016 W/m per ˚C.
In the market there are many types of insulation materials that have
different thermal characteristics handling properties, moisture penetration and fire
safety. The most important parameter of insulation thermal performance is thermal
conductivity.

Proceedings of the project SMART METERING, Vol. 3, 2013
49
Commonly used materials and its characteristics are presented in the Table 7
[21, 22, 23]:
Table 7. Insulation materials and its characteristics
Material Density
[kg/m3]
Thermal
conductivity
[W/m per ˚C]
Polyethylene 930 0.42–0.51
Polyurethane foam 30-60 0.022 - 0.026
Glass fibre mineral
wool 16-48 0.047 – 0.035
Rock mineral wool 100-190 0.037 - 0.055
Polyisocyanurate foam 50 0.023
Magnesia 190 0.055
Another important characteristic that influences thermal performance is
surface properties which affect heat losses due to radiation. Radiation losses can be
reduced by the addition of a shiny shield over the insulating layer. The benefit of
the implementation of this shield can roughly reduce overall heat loss.
In the Table 8 there are presented main parameters of insulated pipes,
produced in company „Nepriklausomos energijos paslaugos” [3]. The graph below
provides its graphical representations.
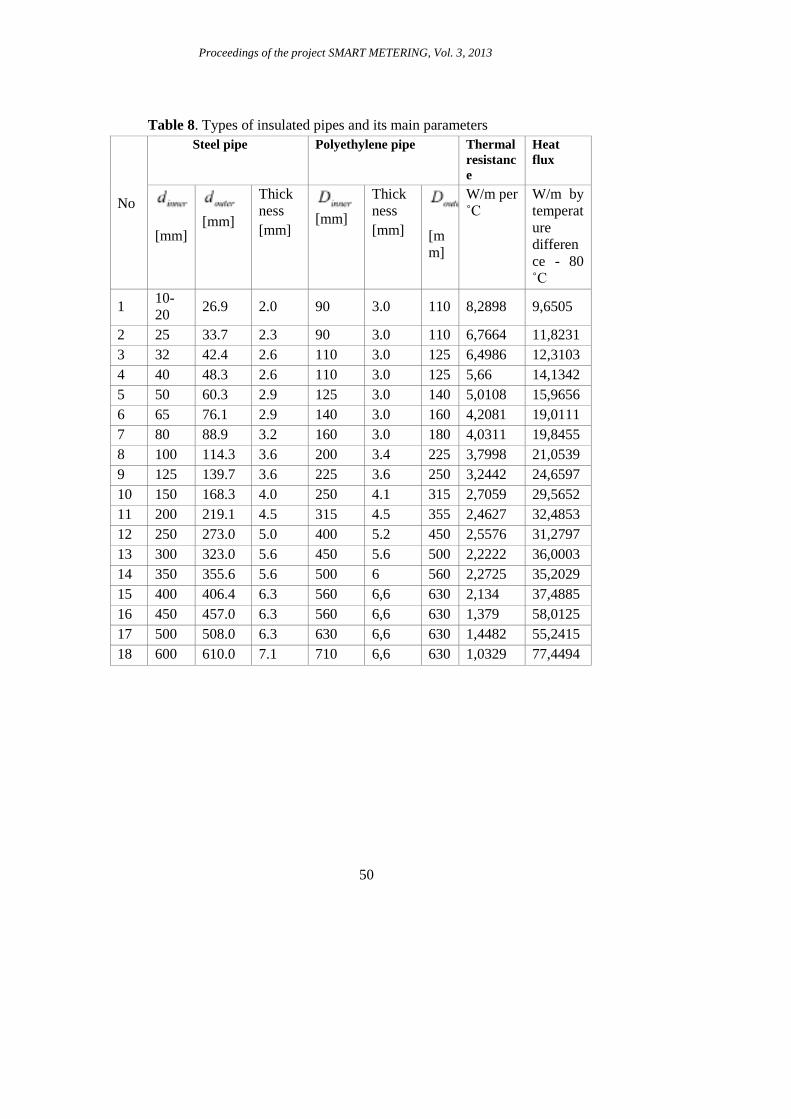
Proceedings of the project SMART METERING, Vol. 3, 2013
50
Table 8. Types of insulated pipes and its main parameters
No
Steel pipe Polyethylene pipe Thermal
resistanc
e
Heat
flux
[mm]
[mm]
Thick
ness
[mm]
[mm]
Thick
ness
[mm]
[m
m]
W/m per
˚C
W/m by
temperat
ure
differen
ce - 80
˚C
1 10-
20 26.9 2.0 90 3.0 110 8,2898 9,6505
2 25 33.7 2.3 90 3.0 110 6,7664 11,8231
3 32 42.4 2.6 110 3.0 125 6,4986 12,3103
4 40 48.3 2.6 110 3.0 125 5,66 14,1342
5 50 60.3 2.9 125 3.0 140 5,0108 15,9656
6 65 76.1 2.9 140 3.0 160 4,2081 19,0111
7 80 88.9 3.2 160 3.0 180 4,0311 19,8455
8 100 114.3 3.6 200 3.4 225 3,7998 21,0539
9 125 139.7 3.6 225 3.6 250 3,2442 24,6597
10 150 168.3 4.0 250 4.1 315 2,7059 29,5652
11 200 219.1 4.5 315 4.5 355 2,4627 32,4853
12 250 273.0 5.0 400 5.2 450 2,5576 31,2797
13 300 323.0 5.6 450 5.6 500 2,2222 36,0003
14 350 355.6 5.6 500 6 560 2,2725 35,2029
15 400 406.4 6.3 560 6,6 630 2,134 37,4885
16 450 457.0 6.3 560 6,6 630 1,379 58,0125
17 500 508.0 6.3 630 6,6 630 1,4482 55,2415
18 600 610.0 7.1 710 6,6 630 1,0329 77,4494
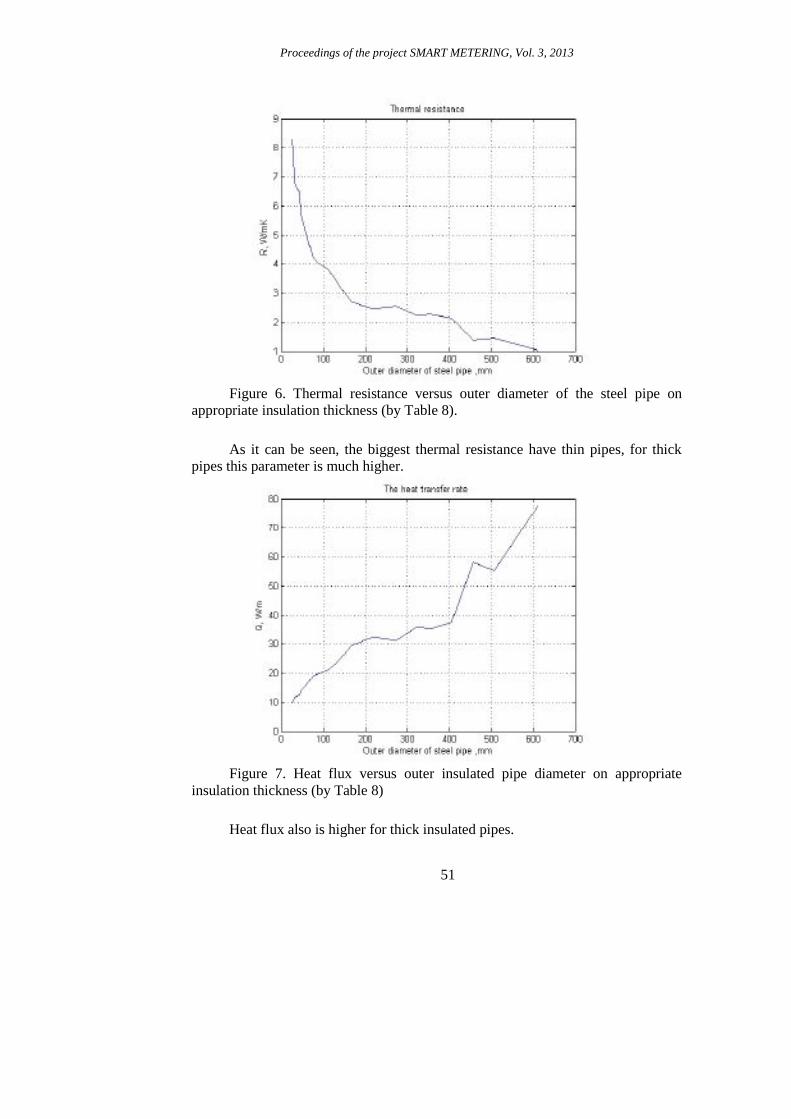
Proceedings of the project SMART METERING, Vol. 3, 2013
51
Figure 6. Thermal resistance versus outer diameter of the steel pipe on
appropriate insulation thickness (by Table 8).
As it can be seen, the biggest thermal resistance have thin pipes, for thick
pipes this parameter is much higher.
Figure 7. Heat flux versus outer insulated pipe diameter on appropriate
insulation thickness (by Table 8)
Heat flux also is higher for thick insulated pipes.
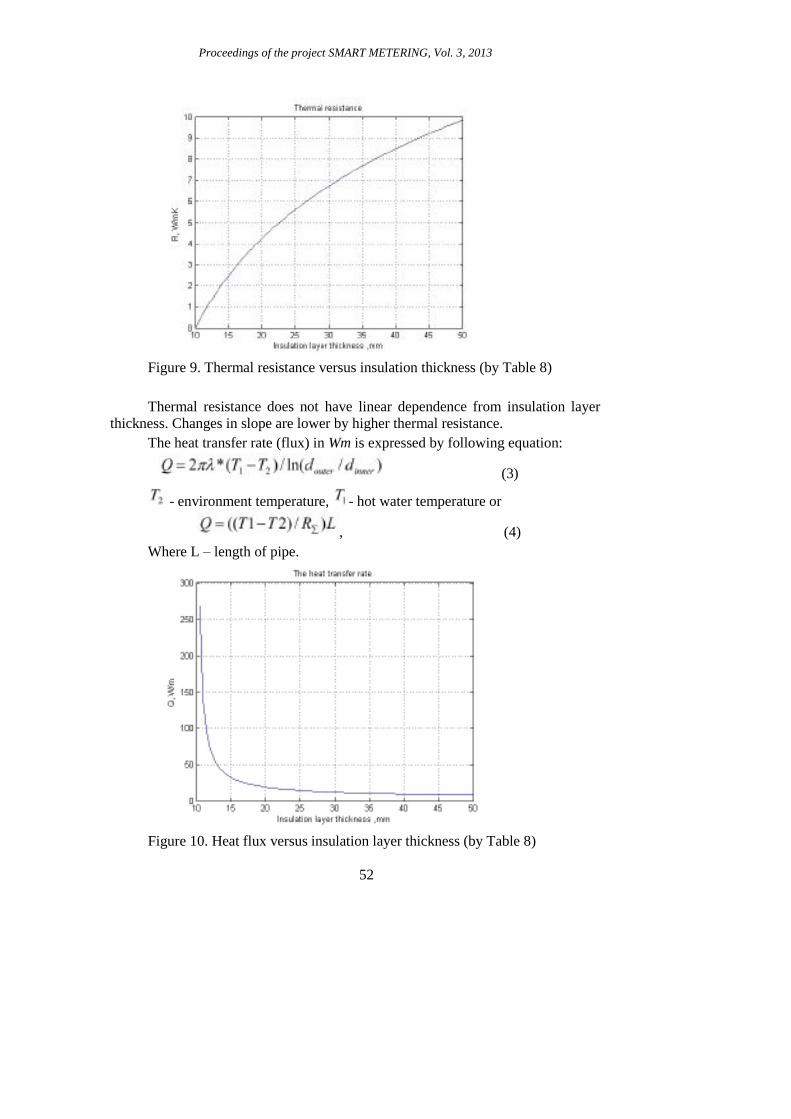
Proceedings of the project SMART METERING, Vol. 3, 2013
52
Figure 9. Thermal resistance versus insulation thickness (by Table 8)
Thermal resistance does not have linear dependence from insulation layer
thickness. Changes in slope are lower by higher thermal resistance.
The heat transfer rate (flux) in Wm is expressed by following equation:
(3)
- environment temperature, - hot water temperature or
, (4)
Where L – length of pipe.
Figure 10. Heat flux versus insulation layer thickness (by Table 8)

Proceedings of the project SMART METERING, Vol. 3, 2013
53
Heat flux drastically decreases by increasing insulation layer thickness up to
20-35 mm. Further the flux decreases very slightly.
Figure 11. Heat flux versus insulation layer thickness in pipe volume
When inner and outer temperatures are known, temperature on each point of
insulation layer can be calculated using following equation:
, (5)
In the figures 12-29 are presented temperature distribution from 100 ˚C (heat
water temperature) to 20 ˚C (external environment temperature) in insulation layer
for all diameters of pipes, produced in company „Nepriklausomos energijos
paslaugos“.
Figure 12. Pipe type No.1, thermal
view
Figure 13. Pipe type No.2, thermal
view

Proceedings of the project SMART METERING, Vol. 3, 2013
54
Figure14. Pipe type No.3, thermal
view
Figure 15. Pipe type No.4, thermal
view
Figure 16. Pipe type No.5, thermal
view
Figure 17. Pipe type No.6,
thermal view
Figure18. Pipe type No.7, thermal
view
Figure 19. Pipe type No.8, thermal
view

Proceedings of the project SMART METERING, Vol. 3, 2013
55
Figure 20. Pipe type No.9, thermal
view
Figure 21. Pipe type No.10, thermal
view
Figure 22. Pipe type No.17, thermal
view
Figure 23. Pipe type No.12, thermal
view
Figure 24. Pipe type No.13, thermal
view
Figure 25. Pipe type No.14, thermal
view
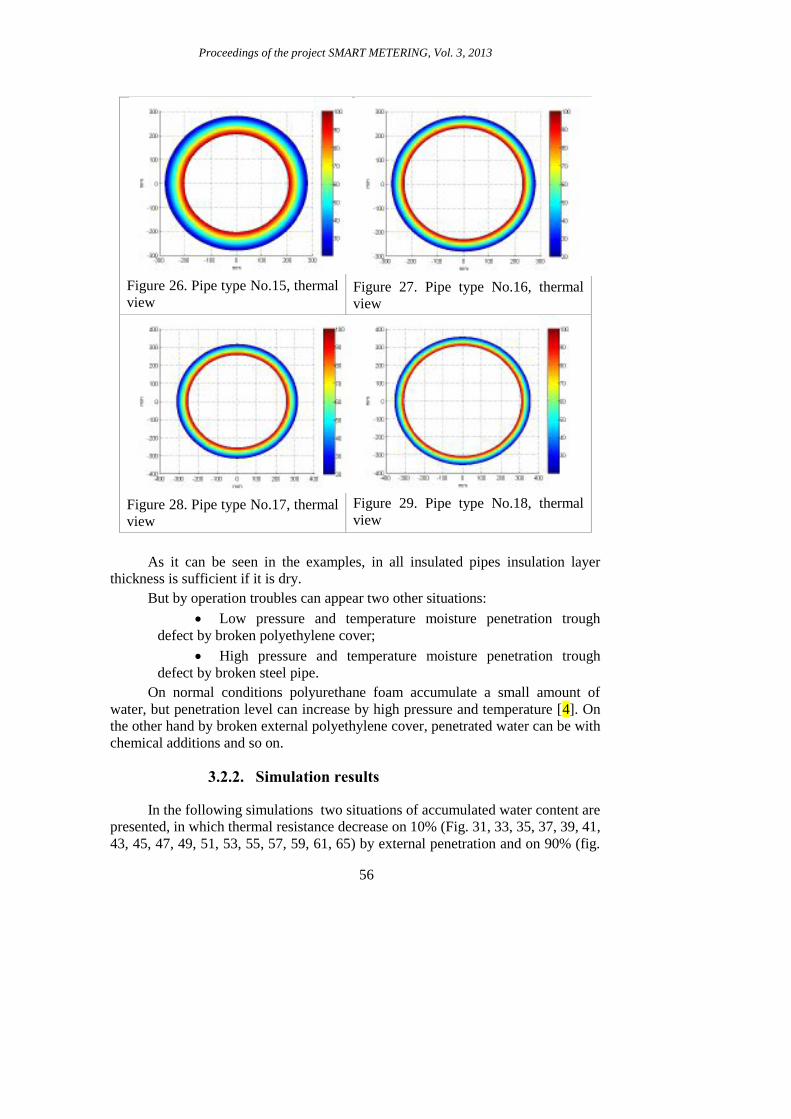
Proceedings of the project SMART METERING, Vol. 3, 2013
56
Figure 26. Pipe type No.15, thermal
view
Figure 27. Pipe type No.16, thermal
view
Figure 28. Pipe type No.17, thermal
view
Figure 29. Pipe type No.18, thermal
view
As it can be seen in the examples, in all insulated pipes insulation layer
thickness is sufficient if it is dry.
But by operation troubles can appear two other situations:
Low pressure and temperature moisture penetration trough
defect by broken polyethylene cover;
High pressure and temperature moisture penetration trough
defect by broken steel pipe.
On normal conditions polyurethane foam accumulate a small amount of
water, but penetration level can increase by high pressure and temperature [4]. On
the other hand by broken external polyethylene cover, penetrated water can be with
chemical additions and so on.
3.2.2. Simulation results
In the following simulations two situations of accumulated water content are
presented, in which thermal resistance decrease on 10% (Fig. 31, 33, 35, 37, 39, 41,
43, 45, 47, 49, 51, 53, 55, 57, 59, 61, 65) by external penetration and on 90% (fig.
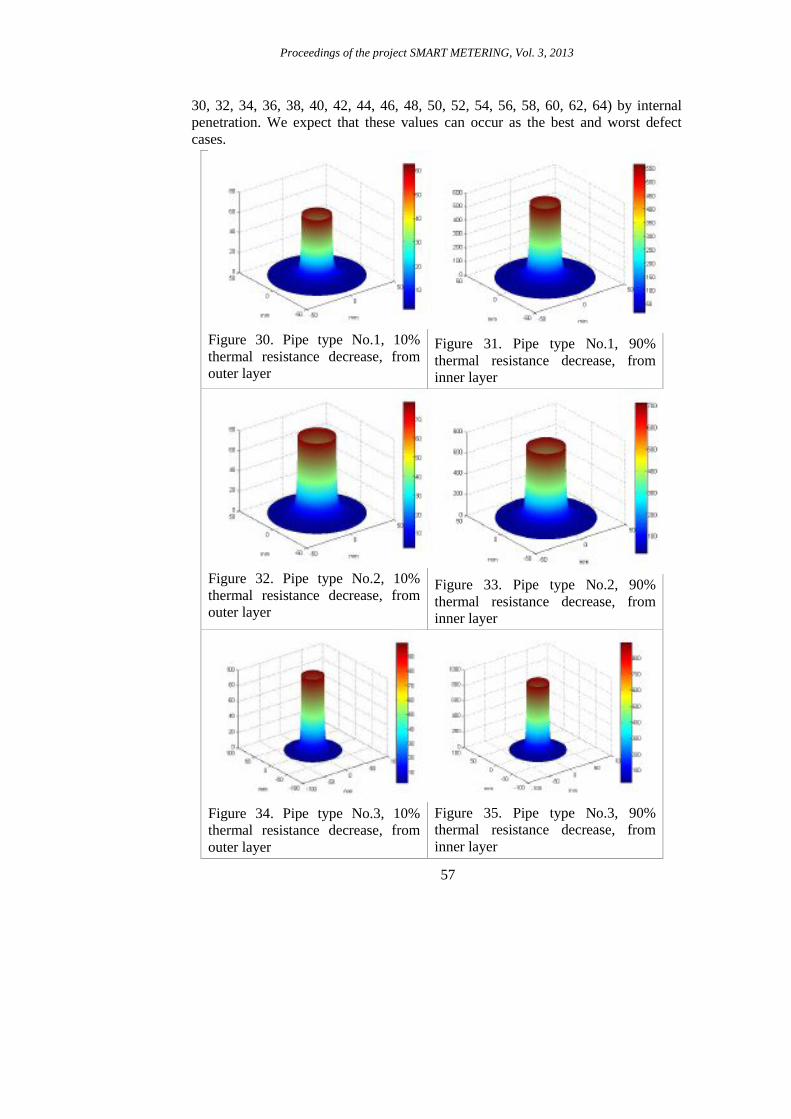
Proceedings of the project SMART METERING, Vol. 3, 2013
57
30, 32, 34, 36, 38, 40, 42, 44, 46, 48, 50, 52, 54, 56, 58, 60, 62, 64) by internal
penetration. We expect that these values can occur as the best and worst defect
cases.
Figure 30. Pipe type No.1, 10%
thermal resistance decrease, from
outer layer
Figure 31. Pipe type No.1, 90%
thermal resistance decrease, from
inner layer
Figure 32. Pipe type No.2, 10%
thermal resistance decrease, from
outer layer
Figure 33. Pipe type No.2, 90%
thermal resistance decrease, from
inner layer
Figure 34. Pipe type No.3, 10%
thermal resistance decrease, from
outer layer
Figure 35. Pipe type No.3, 90%
thermal resistance decrease, from
inner layer
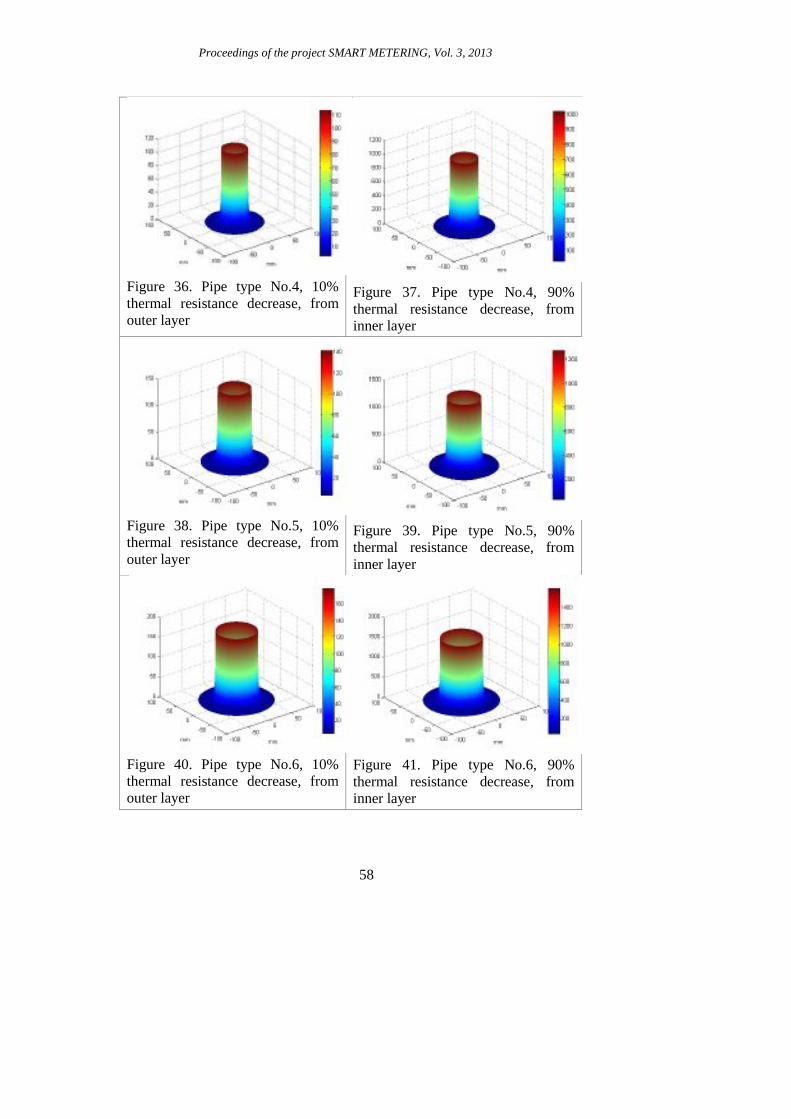
Proceedings of the project SMART METERING, Vol. 3, 2013
58
Figure 36. Pipe type No.4, 10%
thermal resistance decrease, from
outer layer
Figure 37. Pipe type No.4, 90%
thermal resistance decrease, from
inner layer
Figure 38. Pipe type No.5, 10%
thermal resistance decrease, from
outer layer
Figure 39. Pipe type No.5, 90%
thermal resistance decrease, from
inner layer
Figure 40. Pipe type No.6, 10%
thermal resistance decrease, from
outer layer
Figure 41. Pipe type No.6, 90%
thermal resistance decrease, from
inner layer

Proceedings of the project SMART METERING, Vol. 3, 2013
59
Figure 42. Pipe type No.7, 10%
thermal resistance decrease, from
outer layer
Figure 43. Pipe type No.7, 90%
thermal resistance decrease, from
inner layer
Figure 44. Pipe type No.8, 10%
thermal resistance decrease, from
outer layer
Figure 45. Pipe type No.8, 90%
thermal resistance decrease, from
inner layer
Figure 46. Pipe type No.9, 10%
thermal resistance decrease, from
outer layer
Figure 47. Pipe type No.9, 90%
thermal resistance decrease, from
inner layer

Proceedings of the project SMART METERING, Vol. 3, 2013
60
Figure 48. Pipe type No.10, 10%
thermal resistance decrease, from
outer layer
Figure 49. Pipe type No.10, 90%
thermal resistance decrease, from
inner layer
Figure 50. Pipe type No.11, 10%
thermal resistance decrease, from
outer layer
Figure 51. Pipe type No.11, 90%
thermal resistance decrease, from
inner layer
Figure 52. Pipe type No.12, 10%
thermal resistance decrease, from
outer layer
Figure 53. Pipe type No.12, 90%
thermal resistance decrease, from
inner layer

Proceedings of the project SMART METERING, Vol. 3, 2013
61
Figure 54. Pipe type No.13, 10%
thermal resistance decrease, from
outer layer
Figure 55. Pipe type No.13, 90%
thermal resistance decrease, from
inner layer
Figure 56. Pipe type No.14, 10%
thermal resistance decrease, from
outer layer
Figure 57. Pipe type No.14, 90%
thermal resistance decrease, from
inner layer
Figure 58. Pipe type No.15, 10%
thermal resistance decrease, from
outer layer
Figure 59. Pipe type No.15, 90%
thermal resistance decrease, from
inner layer

Proceedings of the project SMART METERING, Vol. 3, 2013
62
Figure 60. Pipe type No.16, 10%
thermal resistance decrease, from
outer layer
Figure 61. Pipe type No.16, 90%
thermal resistance decrease, from
inner layer
Figure 62. Pipe type No.17, 10%
thermal resistance decrease, from
outer layer
Figure 63. Pipe type No.17, 90%
thermal resistance decrease, from
inner layer
Figure 64. Pipe type No.18, 10%
thermal resistance decrease, from
outer layer
Figure 65. Pipe type No.18, 90%
thermal resistance decrease, from
inner layer
In the next stage of the project development we are planning to perform
experimental investigations with such tasks:

Proceedings of the project SMART METERING, Vol. 3, 2013
63
To find important features in reflectogram for estimation of
accumulated water content in insulation layer;
To find appropriate methods for signal processing for evaluation
of heat losses due to moisture penetration.
3.2.3. Conclusions
The main characteristic of insulated pipes produced in Lithuanian company
„Nepriklausomos energijos paslaugos” for heat distribution where analysed in this
part of the project. These pipes are produced by standards EN 10216-2, EN 10217-
1, EN 10217-2, EN 10217-5 and have similar characteristics as in other EU and
USA companies.
Our goal was to find mathematical equations and its adequacy to the
simulation results for future experimental estimation of heat losses on distributed
pipes net using reflected signal parameters from distributed nonhomogeneities.

Proceedings of the project SMART METERING, Vol. 3, 2013
64
4. Development of Smart Meter solutions
4.1. Development a solution for metering data
reading and delivery to a data base
Typical municipal automated meters reading system for water distribution
networks usually utilises mobile network broadband communications (like
GSM/GPRS/UMTS etc.). Short range transmission systems, which use in drive-by
scenarios to acquire the needed sensor grid metering data for further analysis
(mainly for billing), are still very popular among water utilities. All these solutions
incur fixed cost – payment to communication companies for service, or in the case
of drive-by scenario – constant fuel expenses.
An alternative way of communication is wired or wireless core infrastructure
from the service provider or MAN (Metropolitan Area Networks), WAN (Wide
Area Networks) that suits the needs of data transport. Unfortunately these kinds of
complex infrastructures are:
Not available in small municipalities;
Are hard to integrate;
Are costly to provide as leased services based on existing
infrastructure.
The main benefits of systems are the stability of usage as described by
MTBF (Mean Time between Failures) (see Fig.66) and MTTR (Mean Time to
Repair).
Figure 66. Description of Mean Time between Failures
[25]
As the provided services are often time critical, for example billing, the
service guarantees to be applied, otherwise inability to locate and repair faults in an
acceptable time interval may cause serious problems. These systems in the case of

Proceedings of the project SMART METERING, Vol. 3, 2013
65
consumer are really homogenous; the technological complexities are hidden from
the service provider device functionality – like in the case of GPRS.
To overcome the main unwanted pitfalls, the research team developed and
adapted a range of hardware and technological solutions. The end result is a
comprehensive base for further studies and engineering to advance these solutions
for a wider market as long-term alternative to the existing solutions with potential
better cost-effective parameters and easier to maintain.
4.2. Active transmission component base and design
For easier prototyping and cheaper radio frequency integrated circuit
selection the HopeRF Electronics (http://www.hoperf.com/) radio frequency (RF)
modules where chosen as they contain a fair amount of usable modulation schemes
– diversified transmission modes in hardware level: transceiver, transmitter and
receiver. The possibility for easy integration with Atmel series (ATmega48,
ATmega88, ATmega168, ATmega328) microchips is an additional benefit to low
costs, power efficiency and fairly good multi-path propagation fading. Different
Atmel chips can be chosen depending on the sensor networks components
computational power requirements.
RF (22B/23B) module features:
Frequency range: 433/470/868/915 ISM bands;
Sensitivity = -121dBm;
Output power range +13 dBm, +20 dBm Max;
Low power consumption: 18.5 mA receive, 30 mA @ +13
dBm transmit, 85 mA @ +20 dBm transmit;
Data rate: 0.123 to 256 kbps;
FSK, GFSK, and OOK modulation;
Digital RSSI;
Low power shutdown mode;
Wake-up timer;
Auto-frequency calibration;
Power-on-reset;
Antenna diversity and TR switch control;
Configurable packet handler;
Preamble detector;
TX and RX 64 byte FIFOs;
Integrated voltage regulators;
Frequency hopping capability.
Built-in antenna diversity and support for frequency hopping can be used to
further extend range and enhance performance.
RFM applications:
Remote control, home security and alarm, telemetry, personal data logging,
toy control, tire pressure monitoring, wireless pc peripherals, remote meter reading,
Proceedings of the project SMART METERING, Vol. 3, 2013
66
remote keyless entry home automation, industrial control, sensor networks, health
monitors, tag headers [26].
The microcontroller communication with the radio module is done using the
SPI (Serial Peripheral Interface Bus) which is a synchronous serial data link
standard named by Motorola and operates in full duplex mode.
For the modulation scheme GFSK (Gaussian Frequency-Shift Keying) was
chosen as it have been adapted in common wireless technologies like Bluetooth,
DECT etc. GFSK is based on FSK, but GFSK uses a Gaussian filter as well. In a
GFSK modulator everything is the same as a FSK modulator except that before the
baseband pulses (-1, 1) go into the FSK modulator, it is passed through a Gaussian
filter to make the pulse smoother so to limit its spectral width, so GFSK has a
better spectral efficiency.
Additional to GFSK modulation the Manchester encoding scheme [27] is
used in the communication process. Manchester coding is one of the most common
data coding methods and similar to BiPhase coding and overcomes the clocking
problems associated with coding schemes like NRZ (Not Return to Zero) where
long data string of “1”s will produce a long high period in the message signal.
Transitions only occur in the message when there is a logical bit change. This is a
very easy method to implement on the encoding side but requires the data rate to be
known exactly on the receiving side in order to be decoded. Any mismatch in data
clock timings will result in erroneous data that is only detectable with some error
detection such as a checksum or CRC. Also errors from the communication
channel or interference will not be detected without some form of data integrity
checks.
4.3. Common trial network in Ventspils: selection of
the scope of trial network
One of the main tasks of creation a trial network, used for sensor network
deployment, is a selection of a suitable region. The selected location has to have all
the characteristics needed to cover maximum of all experimental situations for
further analysis and development (see Fig.67):
• Isolated network segment with a limited amount of subscribers,
because less subscribers is affected during meter installation;
• Low traffic area – less problems with installation;
• High buildings for signal reception;
• Easily accessible manholes;
• Enough branches for data analysis and modelling;
• Existing city infrastructure (SELGA old people’s home) for
receiver/transmission installations, power supply;
• Existing high buildings for alternate signal reception points;
• Almost all segments can be equipped with meters;
• The disadvantage: no loop – closed main branch.

Proceedings of the project SMART METERING, Vol. 3, 2013
67
Figure 67. Experimental trial network “Selga”
Therefore a water supply network segment in the outer region of the city was
selected, because it was a closed segment with multiple branches and it suited the
amount of available budget to be used for sensor installation. The main network
water input is monitored by SCADA, which provides input pressure and flow
measurements as a reference for overall network monitoring and data verification.
All segments and branches of the trial network have been equipped with at least
one meter. Moreover long distribution lines of trial network are relevant for fluid
dynamics simulation (wave propagation).
Technical problems to be resolved concerning metering data transmission
from the water networks wells:
Power supply for pressure meters;
Existing flow, pressure reader adaption for 868MHz RF
transmission instead of GPRS;
Transmission signal strength – obstacles;
Signal transmission from manholes;
Data packet retransmission using Ethernet;
Physical meter installation in the network;
Software adaption for data processing and visualization
(AquaMet).
The block diagram of Smart Metering system is shown at Fig. 68. The
system comprises:
Water flow and pressure meters;
Sensors – data transmission devices 868 MHz;
Ethernet gateways that convert signals from sensors into
TCP/IP;

Proceedings of the project SMART METERING, Vol. 3, 2013
68
5 GHz Bridge for ensuring data traffic to municipality Wi-
Fi network;
GSM message gateways;
System events and leaks monitoring and detection system;
Central data base;
Technical solution for the data storage for Kaunas TU
measurements.
A comprehensive description of Smart Metering system and is provided
in the following chapters.
Figure 68. The block diagram of Smart Metering system
4.4. Forward transfer – repeater node principle
For the overall municipal situation a limited number of usable data sinks
(internet or intranet enables central network access points in range to create a
connection to the backend processing services). As the installation of such network
extensions is difficult and expensive the number is kept to minimum. In the photos
below are depicted the main 5GHz networks bridges used to create the base

Proceedings of the project SMART METERING, Vol. 3, 2013
69
network and provide network access for the Ethernet gateways that collect the
sensor data using 868MHz antennas (see Fig. 69).
Figure 69. 5GHz networks bridges used to create the base network
In order to overcome the limitations of the sensor range and the
unavailability of data sink node and forward transfer, a repeater board was
developed that ensures a feasible solution. The idea is to provide multi-layered one
way data forwarding infrastructure. As common in networking the problems arise
regarding handling collisions and loops. Due to communication is only one-way
there are no hidden nodes etc. problems. For simplification in terms of energy a
computationally cheap solution was designed (see Fig. 70), which comprises:
1. All sensor node messages are transmitted blindly with no
address information in context of forward transfer – repeater node
information.
2. If the sensor node is in the range of the data sink, the data
are received, decoded, and then message is encoded for further
transmission to the processing backend.

Proceedings of the project SMART METERING, Vol. 3, 2013
70
3. If the sensor node is out of range of a data sink additional
forward transfer – repeater nodes are installed, so that the repeater
nodes can receive the signal of the sensor nodes.
4. Forward transfer – repeater nodes have better antennas (in
terms of sensitivity) and provide stronger transmission signals, as are
connected to permanent power sources, so compared with the amount
of sensor nodes only a small amount repeater nodes is necessary. The
problem of power sourcing still persists – solution like solar panel
charging and night powering from battery where taken into account,
but were recognised as not cost-effective in the project geographical
location.
5. As new sensor message blocks are received by the sensor,
they are queued for retransmission. Before retransmission an
additional identification byte is added to identify, which forward
transfer – repeater layer did receive the message first.
6. After the addition of the layer identifier the message is
broadcasted – the receiving nodes can be the data sink node or another
repeater node.
a. If the receiver is a data sink it removes the layer
byte and decodes the message.
b. If the receiver is another repeater node, it checks
for the layer byte and compares it with the layer identifier of
itself:
i. if the layer identifier is larger of equal the
message is dropped;
ii. if the layer identifier is smaller the
messages layer byte is overwritten by the identifier of
the receiving repeater and is broadcasted.
7. The layer identifiers have to be correctly assigned to create
an “onion like” structure by checking the repeater layer visibility to
the nearby layers N+1 and N-1 by using tester equipment.
8. As the data sinks (Ethernet gateways) are capable to
analyse messages with or without the layer byte, the forward transfer –
repeater can be used as “normal” repeaters.
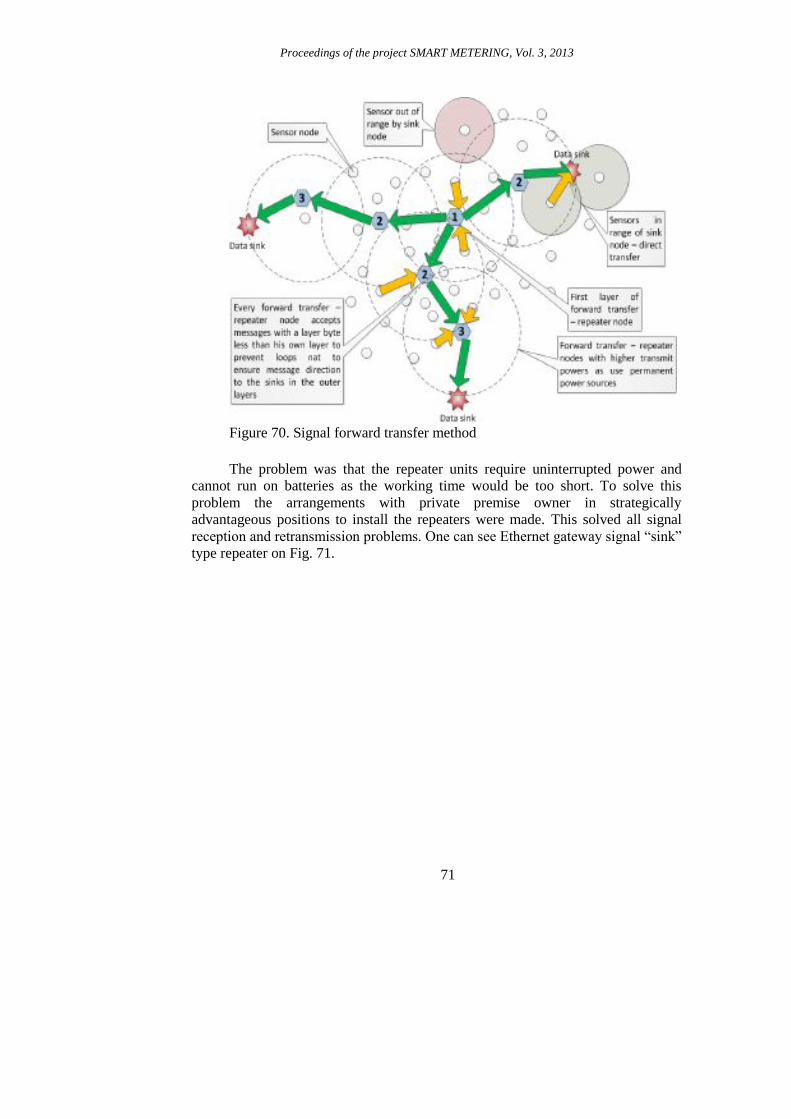
Proceedings of the project SMART METERING, Vol. 3, 2013
71
Figure 70. Signal forward transfer method
The problem was that the repeater units require uninterrupted power and
cannot run on batteries as the working time would be too short. To solve this
problem the arrangements with private premise owner in strategically
advantageous positions to install the repeaters were made. This solved all signal
reception and retransmission problems. One can see Ethernet gateway signal “sink”
type repeater on Fig. 71.

Proceedings of the project SMART METERING, Vol. 3, 2013
72
Figure 71. Ethernet gateway signal “sink” type repeater
4.5. Custom antenna designs for urban environments
For leak detection it is necessary that water pressure and water flow sensors
have to be installed at water distribution networks. To ensure sensor reading
transmission from inside manholes special antennas have to be used, unfortunately
the supply of this kind of special antennas is difficult – unavailable or costly.
During the project different antenna concepts have been analysed and
developed for both omnidirectional and directional scenario. Two ways of
installation were considered: for attaching to ground level man holes and for fire
hydrants. All prototypes where intended to be casted in polyurethane as a tamper
resistive material with good durability properties and low radio signal attenuation.
The main problem with the directional antenna design is the complex mechanical
structure that makes it hard to produce and increases per unit cost. Another
problem is the transmitting antenna has to be calibrated in laboratory environment
in order to show good transmission parameters (see Fig. 72).
Figure 72. Examples of directional antennas, tested in the project

Proceedings of the project SMART METERING, Vol. 3, 2013
73
As the production prototypes have to be calibrated for correct frequency, a
tuning process takes enormous time for verification and failure correction; it was
decided to use ready-made 868MHz ¼ wave antennas as the base of the design (see
Fig. 73 and 74).
Figure 73. Examples of ready-made 868MHz ¼ wave antennas
Figure 74. Examples of ready-made 868MHz ¼ wave antennas installation
in manhole
Different experiments with moulding material where performed to find the
optimal price-performance ratio for directional and omnidirectional antennas
covering. The first prototypes where created to understand necessary mechanical
properties of the material and the manhole fittings. The most suitable material
appeared TASK 16 urethane, as it has very high tear strength, impact resistant and
wear resistant. It showed exceptional performance characteristics and dimensional
stability. TASK 16 can be coloured by choosing the best colour to fit in the

Proceedings of the project SMART METERING, Vol. 3, 2013
74
deployment environment. Tested for radio property verification, TASK 16 urethane
appeared any considerable attenuation for the 868MHz radio frequency.
During the final project stages the remaining problematic pressure
transmitters were installed. As some of the antennas are allocated on sidewalks – a
special micro antenna for 868 MHz was introduced. It is very small, only a quarter
of the range of the urethane antennas, but ideal for scenarios, where large antenna
deployment is not possible (see Fig.75). Another interesting side effect of the
urethane antennas is the natural UV decay, where the antenna outer layer changes
its colour to light grey, concrete like colouring, which makes it almost invisible
from the sidewalks.
For sidewalks a more miniature version of an antenna is needed or and direct
antenna profile mill in the manhole.
Figure 75. Sidewalks miniature version of an antenna
4.6. Ethernet gateway - concentrator
4.6.1. Pibox Ethernet gateway development stages
The functions of Ethernet gateway shortly are as follows. Sensors measuring
equipment acquired readings are sent to the gateway - concentrator, which
collected data prepares for further transport to processing systems. The recovered
messages are checked and stored in the internal memory of gateway. The unit is
connected with a microcomputer (using a USB serial interface). The Raspberry
Pi is a credit-card-sized single-board computer developed in the UK by
the Raspberry Pi Foundation is used as microcomputer. Microcomputer control
software sends a special service commands to set up and captured sensor data
reading from the concentrator's internal memory. Unlike water meter sensors
operation of gateways equipment requires an independent power source due to
larger power consumption.

Proceedings of the project SMART METERING, Vol. 3, 2013
75
The initial prototyping platform of gateway - concentrator was based on
open source networking equipment used for proof of a concept. The Ethernet
gateway service used for data serialization and delivery to the backend servers was
implemented using C and Python programming languages for easy porting to other
future platforms.
The base equipment used as reference is Mazzy GPRS flow meters. The
radio part was isolated and integrated into the new 868MHz design. All
development was done by keeping the backward compatibility with the old design
in cases of 868MHz signal transmission problems caused by sites with long
distances or difficult accessibility – so GPRS solution can be still used without
problems.
The first version of 868MHz sensor reception hardware was based on a
testing device that is used by the installation personnel to diagnose sensors
operations by displaying real time transmission data values on a LCD display. This
device was expanded with a USB serial interface port that can be connected to an
embedded Ethernet gateway controller or just to an ordinary PC using standard
USB interface. The USB device is recognized as a generic serial port. Using
standard Terminal application software key stroke commands can be sent and the
readouts can be received as plain text information.
The second Ethernet gateway version was moved to a generic embedded
platform. The popular Raspberry Pi ARM7 platform was selected, as it provides
enough computing power and has got a composite video output. So the device can
be used also with a display for onsite diagnostics. The main system process
monitoring of meter reading delivery to the backend servers was written in Python
and supplemented with additional support services. The service ensures virtual
private networking support for remote site setups, service automatic monitoring,
failure notification and system level watchdog function, if some kind of errors
occur, the CPU is automatically reset.
The main developments of the second gateway version:
Aquamon multithreaded daemon to parse USB data and prepare
for delivery to server;
MONIT service notification and Aquamon service control (e-mail
notification, problem detection, service recovery);
VPN support (tinc, PPTP, OpenVPN);
Watchdog: Broadcom BCM2708 watchdog support (gateway
monitoring, overload, «data pipe lost» - reboot);
Wear out Prevention of SD card memory (RAMLOG).
The last Raspberry Pi based Ethernet gateway has 868MHz meter reception
RF daughter board. It is equipped with heartbeat indication, wireless network
adapter and a safe-shutdown button. Also the composite output is used for easy
diagnostics and monitoring (see Fig. 76).
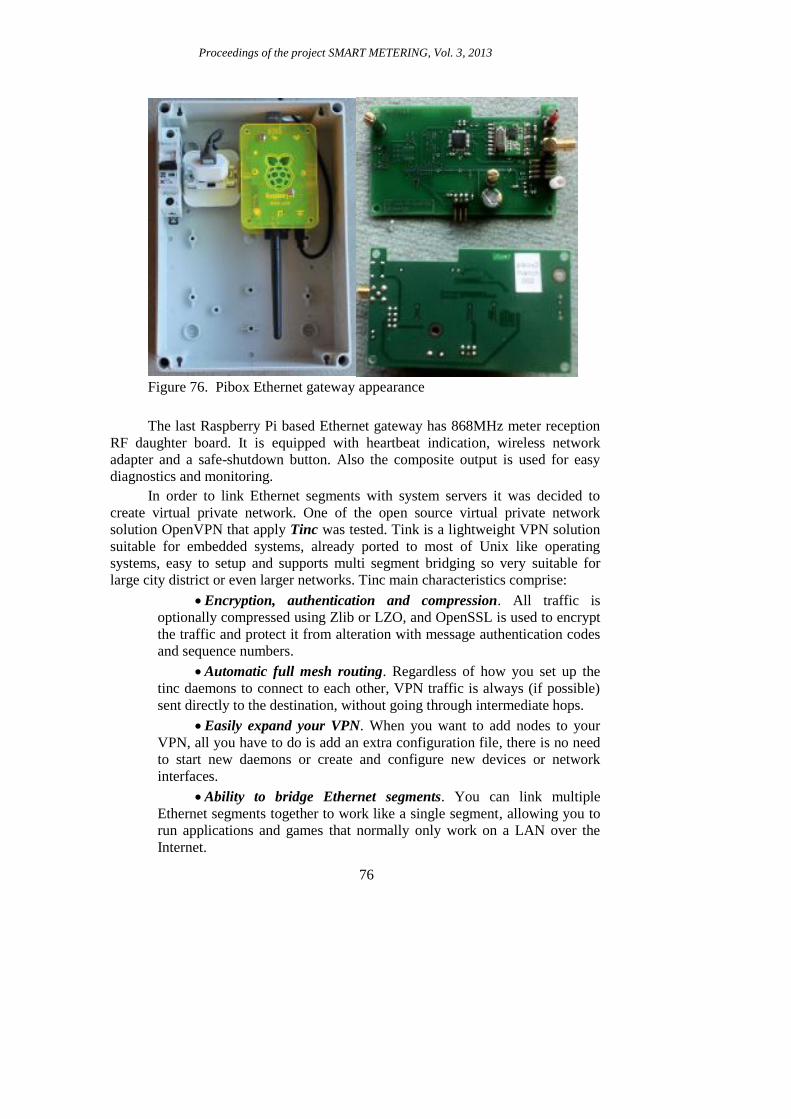
Proceedings of the project SMART METERING, Vol. 3, 2013
76
Figure 76. Pibox Ethernet gateway appearance
The last Raspberry Pi based Ethernet gateway has 868MHz meter reception
RF daughter board. It is equipped with heartbeat indication, wireless network
adapter and a safe-shutdown button. Also the composite output is used for easy
diagnostics and monitoring.
In order to link Ethernet segments with system servers it was decided to
create virtual private network. One of the open source virtual private network
solution OpenVPN that apply Tinc was tested. Tink is a lightweight VPN solution
suitable for embedded systems, already ported to most of Unix like operating
systems, easy to setup and supports multi segment bridging so very suitable for
large city district or even larger networks. Tinc main characteristics comprise:
Encryption, authentication and compression. All traffic is
optionally compressed using Zlib or LZO, and OpenSSL is used to encrypt
the traffic and protect it from alteration with message authentication codes
and sequence numbers.
Automatic full mesh routing. Regardless of how you set up the
tinc daemons to connect to each other, VPN traffic is always (if possible)
sent directly to the destination, without going through intermediate hops.
Easily expand your VPN. When you want to add nodes to your
VPN, all you have to do is add an extra configuration file, there is no need
to start new daemons or create and configure new devices or network
interfaces.
Ability to bridge Ethernet segments. You can link multiple
Ethernet segments together to work like a single segment, allowing you to
run applications and games that normally only work on a LAN over the
Internet.

Proceedings of the project SMART METERING, Vol. 3, 2013
77
Runs on many operating systems and supports IPv6. Currently
Linux, FreeBSD, OpenBSD, NetBSD, MacOS/X, Solaris, Windows 2000,
XP, Vista and Windows 7 platforms are supported. Tinc has also full
support for IPv6, providing both the possibility of tunnelling IPv6 traffic
over its tunnels and of creating tunnels over existing IPv6 networks.
4.6.2. Ethernet gateway – Aquamon services
The service architecture is designed for autonomous service recovery and
event logging for gateway monitoring from a central service centre.
The main processing is done in the Aquamon service daemon: “In
multitasking computer operating systems, a daemon is a computer program that
runs as a background process, rather than being under the direct control of an
interactive user”. Additional helper services provide supplementary functionality
(see Fig. 77)
Aquamon service existence checking and restarting on failure;
Failure and internal event monitoring an logging;
Update service to provide automatic service updates from the
central management interface;
Networking a host configuration to enable multiple Ethernet
gateway co-existence in the same network segment and networking
functionality.
Figure 77. Aquamon services flowchart
The image of a screen below shows the automatic Ethernet gateway software
update publishing system, integrated into the monitoring information systems web
interface. The monitoring system provides automatic reinstallation of all Ethernet
gateway core software without accessing them manually (see Fig. 78).
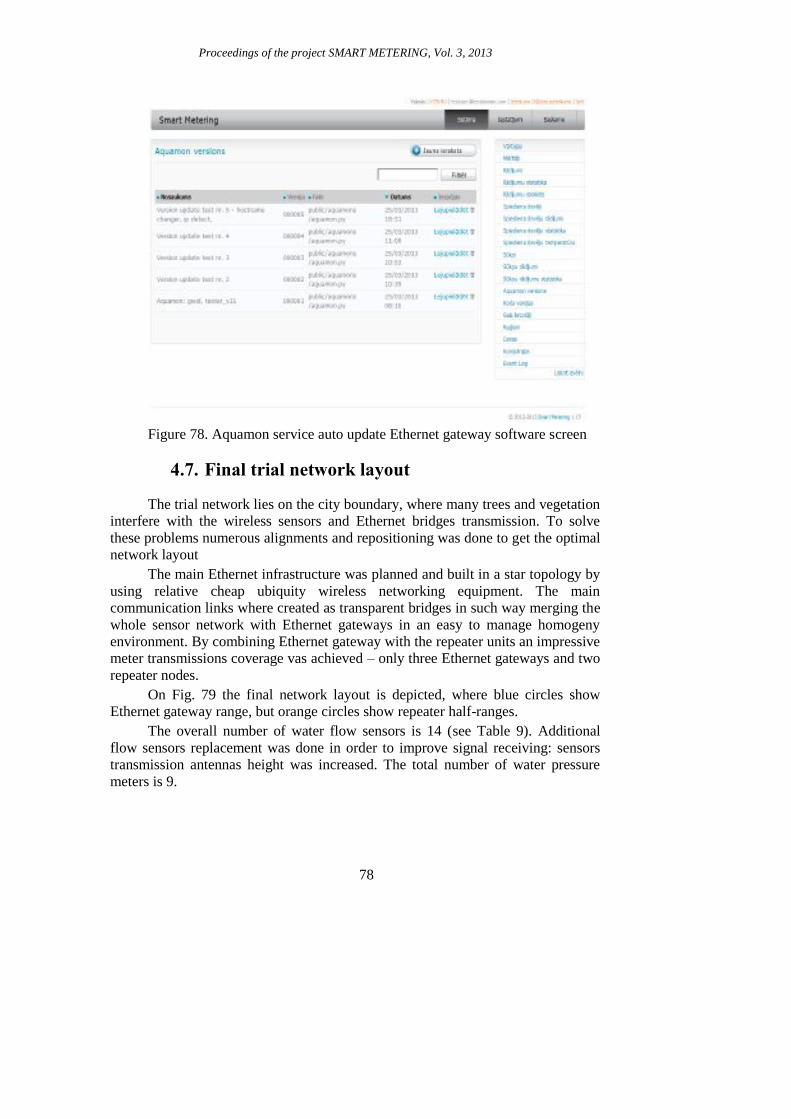
Proceedings of the project SMART METERING, Vol. 3, 2013
78
Figure 78. Aquamon service auto update Ethernet gateway software screen
4.7. Final trial network layout
The trial network lies on the city boundary, where many trees and vegetation
interfere with the wireless sensors and Ethernet bridges transmission. To solve
these problems numerous alignments and repositioning was done to get the optimal
network layout
The main Ethernet infrastructure was planned and built in a star topology by
using relative cheap ubiquity wireless networking equipment. The main
communication links where created as transparent bridges in such way merging the
whole sensor network with Ethernet gateways in an easy to manage homogeny
environment. By combining Ethernet gateway with the repeater units an impressive
meter transmissions coverage vas achieved – only three Ethernet gateways and two
repeater nodes.
On Fig. 79 the final network layout is depicted, where blue circles show
Ethernet gateway range, but orange circles show repeater half-ranges.
The overall number of water flow sensors is 14 (see Table 9). Additional
flow sensors replacement was done in order to improve signal receiving: sensors
transmission antennas height was increased. The total number of water pressure
meters is 9.

Proceedings of the project SMART METERING, Vol. 3, 2013
79
Figure 79. Final network layout
Table 9. The final list of water flow sensors
The tests provided in order to access the quality of measurement receiving
by central server showed that all data have been received with maximal delay of 2
hours (lost transmission). Transmission lost depended on weather, but this was the
worst case observed (rainy and vegetation max).
4.8. Smart Meter Information System architecture
Smart System software utilises open source and Unix/Linux compatibility:
• ScicosLab – continued Scilab: the most complete alternative to
commercial packages for dynamical system modelling and simulation
packages such as MATLAB/Simulink and MATRIXx/SystemBuild;
• EPANET 2;
• MySQL for network definition.

Proceedings of the project SMART METERING, Vol. 3, 2013
80
The developed system not only consists of an overall water distribution
network pressure and flow monitoring system but also an interface for users where
the monthly water usage and consumption/time graphs can be viewed and also an
estimate of the water costs is computed. One of the problems with all kind of
information systems with a large user base and data flow from sensor devices is
availability. MTFB (mean time between failure) has to be minimized so and high
availability server backend concept is offered, where real time storage
synchronization and network load balancing is provided. This minimizes the
possible down time and raises user e-service satisfaction.
All application specific infrastructures are based on open source products. So
no licensing costs for the full deployment a variety of possible virtualization
systems depending on the application and customer needs. Easy disaster recovery
and backup strategy management from a generic web application based interface
(see Fig. 80).
Figure 80. Smart Meter servers’ architecture
The Smart Meter system consists of four base components:
Meter reading reception gateway
This component receives HTTP encrypted POST generated by the Ethernet
gateways which accumulate and preprocess the sensor readings and performs a
HTTP POST to the SmartMeter WEB server (Apache) based on a DNS name.
Apache web server redirects the requests to the specific gateway processing
application – gateway daemon (i. e. http://exec.bitdev.lv). The gateway script (PHP

Proceedings of the project SMART METERING, Vol. 3, 2013
81
language) validates the POST data for corruption and authenticity. If data is
accepted it is stored in the systems MySQL data base.
Smart Meter monitoring, statistics and data visualization
interface and backend
The SmartMeter system is built upon Ruby on Rails framework using MVC
(Model, View, and Controller) architecture. MVC is a software architecture pattern
which separates the representation of information from the user's interaction with
it. The model consists of application data, business rules, logic, and functions. A
view can be any output representation of data, such as a chart or a diagram.
Multiple views of the same data are possible, such as a bar chart for management
and a tabular view for accountants. The controller mediates input, converting it to
commands for the model or view. The central ideas behind MVC are code
reusability and separation of concerns [28]. A controller can send commands to its
associated view to change the view's presentation of the model (e.g., by scrolling
through a document). It can also send commands to the model to update the
model's state (e.g., editing a document).
o A model notifies its associated views and controllers, when
there has been a change in its state. This notification allows the views to
produce updated output, and the controllers to change the available set of
commands. A passive implementation of MVC omits these notifications,
because the application does not require them or the software platform
does not support them.
o A view requests from the model the information that it
needs to generate an output representation to the user.
All other functions that depend on external non Ruby scripts are exchanged
using RPC (Remote Procedure Call). This is the main principle of communication
with the reception gateway and other standalone services like statistics generation,
SCADA simulation applications and the solver, water network structure generation
and processing engine.
SmartMeter customer statistics for consumption and billing
This component runs on a separate server thread and is also based on Ruby
on Rails. It provides the web interface for the customers. If desired the customers
can see their water consumption the visualization of this data for a selected period.
Also it is possible to get water consumption limit alerts via e-mails and automatic
bill generation.
SmartMeter leak detection module
The leak detection module consists of multiple separate applications that
perform periodic recalculations based on systems sensor input data. There are
separate components as SCADA system simulation service that provides a
homogenic interface for the existing flow and pressure meter function logic -
middleware. Also and development interfaces for automatic network data
generation and parameterization for EPANET solver where all available data is
processed to suit the solver compatible input format and execution control.

Proceedings of the project SMART METERING, Vol. 3, 2013
82
The SmartMeter system is hosted on Ubuntu Linux operating system
optimized for automatic service recovery. This is done using Monit daemon. Monit
is a free open source utility for managing and monitoring, processes, programs,
files, directories and file systems on a UNIX system. Monit conducts automatic
maintenance and repair and can execute meaningful causal actions in error
situations. Monit service also provides event log generation and delivery using
Syslog services or e-mail notifications.
The base system is configured for easy deployment into Kernel-based
Virtual Machine or OpenVZ operating system-level virtualization containers.
These systems are the standard virtualization techniques used by modern data
centers to guarantee and expandable system for high load systems which is relevant
as the user base grows in a larger sensor network deployment scenarios. The
virtualization and the overall architecture guarantee easy virtualization, scalability
and performance by adaption of load balancing and failover technologies as:
Heartbeat, LVS, DRBD, Pacemaker, Corosync, RabbidMQ HA, Ultra Monkey.
This is provided by the layered separation where individual components that are
causing bottlenecks can be extracted and deployed to isolated or clustered servers
and all communication is still possible via a shared data base or RPC system.
Smart Meter Information System architecture is depicted at Fig. 81.
Presentation Layer
Operating system
MySQL server Main system
database Network definitions Network elements Phpmyadmin
database management
Database Layer
Ubuntu Linux Kernel-based Virtual Machine Open Source Automatic updates Automatic system snapshots
Transport Layer
Development environment based on WEBrick web server
Production environment based on Apache web server
Reverse proxy for multi-application integration
Virtual host based isolation Virtual host Domain Name
service management by BIND server
Request logging and debugging
Application Layer
PHP 5 sensor gateway script
PHP preprocessing logic PHP postprocessing logic Ruby on Rails web
application framework RubyGems package
management Sendmail e-mail server
for notification and messaging services
EPANET solver
OpenLayers dynamic map visualization
DHTML, XML user interface and data processing
jQuery library AJAX processing
Figure 81. Smart Meter Information System architecture
Initially Smart Meter system’s has been developed using Ventspils Digital
Centre servers infrastructure, but at the end of the project SM system’s data centre
migrated to own data centre, which is located in nursing home “Selga” (see Fig
82).

Proceedings of the project SMART METERING, Vol. 3, 2013
83
Figure 82. Smart Meter system servers located in nursing home “Selga”
4.9. Selection of practical methods for leaks detection
in WDN using metering data base and analytics approach
Water network leak detection is essential for municipalities as water leakage
is a degradation of the service provided and undiscovered leaks can cause long
term loss. There are different causes of leaks or water loss in general which might
be divided into four main categories:
Leakages:
o leakage through the crevice of the pipelines;
o uncontrolled overflow of the accumulation tanks;
o leakage of the hydrant shaft;
o leakage of the fittings (valves, connections);
Authorized unmeasured water consumption:
o fire department;
o municipal connection;
o hydrant’s network;
o street washing and sewer cleaning;
o processing water in water plant;
Errors:
o human factor (wrong reading of the water gauge
and/or, calculated consumption);
o faulty individual water gauge of the consumer;
o faulty main water gauge of the utilities;
Unauthorized unmeasured water consumption:
o unauthorized connection to the pipelines;
o connections without water gauge;
o unauthorized uses of hydrants;
o bypassing the water gauges;
Systematic control of pipelines in water utilities indicate that the pipeline
damages arise from many reasons from which the most frequent are:

Proceedings of the project SMART METERING, Vol. 3, 2013
84
Application of improper pipes – nominal pressure lower
than requested;
Placing the pipes in the canal without sand bed –allowing
the pipeline dilatations;
Contact of the pipes with hard and harsh places – polymers
are sensible to the local stresses;
Ground deformations – shear stress caused by ground
cracking during long and hard drought;
Corrosion and/or erosion of the inner wall of the pipes –
the allowed pressure is diminished;
Polymer materials aging – during exploitation allowed
pressure of the polymer pipelines;
(PEHD, PVC) is diminished.
The water leakage can be apparent and hidden. In the case of apparent
leakage, water penetrates through the ground layers above damaged place and
emerges at the ground surface.
This time is between several seconds and several days. Apparent leakage is
very simple to detect – it is sufficient that the water utilities controller, during
regular patrol along the pipelines trace, visually establishes that water emerges.
Water utilities have severe difficulties with hidden leakages because they are
not visually detectable. In some cases such a leakage can last many years.
Professional knowledge and sophisticated equipment are necessary for the hidden
leakages detection.
Initially 5 methods and simulation were considered for experiments,
however due to the lack of resources it was decided to experiment only two first
one.
1. Simulation of leaks with fire hydrants.
2. Theoretical vs. solver simulation.
3. Genetic algorithms.
4. Kalman filter: already used in different pipeline leak
detection systems.
5. Neural network.
The Theoretical vs. solver simulation method was investigated by the project
team (see Fig.83). The method appeared good perspectives; however application of
this method requires historical data comparison with actual measures. Since
historical data about water pressure at network segments are not available, further
development of this method to be postponed to the future projects.

Proceedings of the project SMART METERING, Vol. 3, 2013
85
Figure 83. Simulation process for the method Theoretical vs. solver
simulation
The practical method - Simulation of leaks with fire hydrants, was
implemented at the trial network. The real pressure metering data have been
analysed in the simulation (Fig.84 and 85).
To simplify the process of leak detection an approach was chosen where
minimum costs of maintenance and setup would compromise with the leak
detection speed rate – in terms of low power battery powered sensors where
transmit frequency is far from real-time constrains.
All pipe network and water network components are stored in a relational
database management system, easily expandable and processed using SQL
language. This is the base to generate network visualization and also solver input
model definitions. MySQL has been used for easier integration with Aquamet
system. This approach enables easy graph traversing and model input file
generation.
The basic water network components for future expansion in case of more
dynamic networks containing active components like controlled valves, pumps etc.
were implemented. If further research is continued, also water quality monitoring
and modelling can be implemented and analysed. This is useful not only for the
current situation evaluation but also for future network expansion planning.
Components of the water distribution network used in Smart Metering
system are presented below:
Junction Pump Reservoir
Valve Pipe Meter
Tank
The leak detection metrics are divided into two main categories:

Proceedings of the project SMART METERING, Vol. 3, 2013
86
1. Sensor level readout behaviour events.
2. Sensor network hydrodynamic model.
In the project sensor level readout behaviour events metrics have been
developed and successfully tested:
Pressure average value negative fluctuation leak detector;
Water consumption minimum flow leak detector;
Flow average positive fluctuation leak detector;
Equipment idle detector.
Pressure average value negative fluctuation leak detector – measures the
average value of a given pressure sensor for a user defined period in days. If the
pressure drops under a given (user defined) percentage of the average value in the
defined period and keeps under the threshold for a user defined period, a leak
detection event will be triggered (see Fig. 84, 85)
Water consumption minimum flow leak detector – measures the domestic
water consumption in a daily user defined time range where the water consumption
should be minimal or zero. An increased consumption would be an indicator for
continuous water leakage in the customer’s premises (like water closet flush tank
sealing defects). A user defined minimum flow can be defined to replace the
default of zero, as also in night hours water usage can appear or is desired.
Default parameters of the leaks detection methods:
• Pressure average value negative fluctuation leak detector;
– Averaging period (2days);
– Negative fluctuation percentage (20%);
– Activation period (7200s = 2h);
• Water consumption minimum flow leak detector:
– Minimum flow threshold (0);
– Idle flow monitoring start time (01:00);
– Idle flow monitoring end time (05:00);
– Non zero devices (separated by comma) – devices
where no idle night consumption rules apply;
– Activation period (2 days).
• Flow average positive fluctuation leak detector:
– Averaging period (2 days);
– Positive fluctuation percentage (30%);
– Activation period (7200s = 2h);
• Equipment idle detector:
– Idle time (24h) – when no signal is received.

Proceedings of the project SMART METERING, Vol. 3, 2013
87
Figure 84. Pressure average value negative fluctuation leak detector
Figure 85. Smart Meter systems water pressure readout during simulation
4.10. E-services for users
Two e-services have been developed on behalf Smart System users:
The 1st one enables metering data export from the System as Excel file. In
such way the data related clients water consumption can be selected and retrieved
according to predefined parameters (see Fig. 86). Therefore ŪDEKA staff and
clients are able to skip manual monthly procedure aiming to collect measurement
from water consumption meters, to deliver them to Customer department and to
record manually into billing system. Furthermore Customer department can request
consumption data as “ad hock” export.

Proceedings of the project SMART METERING, Vol. 3, 2013
88
Figure 86. Data export from the system as Excel file
The 2nd
e-service provides opportunity of sending e-mail to ŪDEKA staff
and to clients about deviations from the usual pattern in water consumption. The
thresholds for alarming in case of deviation can be defined by user depended on
consumption habits and object importance. Further the thresholds can be adjusted
due to user “real life” experience.
4.11. Data storage for KTU measurements of
district heating networks
One of cross border cooperation advantages is joining of recourses for
achieving common goals. KTU created a technical solution for the data storage
used by the mobile measurement terminals operated by KTU for heating network
leak detection. Different solutions were proposed by using new types of data
serialization and querying - NoSLQ. A NoSQL database provides a mechanism for
storage and retrieval of data that uses loose consistency models rather than
traditional relational databases. Motivations for this approach include simplicity of
design, horizontal scaling and finer control over availability. NoSQL databases are
often highly optimized key–value stores intended for simple retrieval and
appending operations, with the goal being significant performance benefits in terms
of latency and throughput. NoSQL databases are finding significant and growing
industry use in big data and real-time web applications. NoSQL systems are also
referred to as "Not only SQL" to emphasize that they do in fact allow SQL-like
query languages to be used.
The final system was a combination of CIFS network file system and Virtual
Private Network stored on an automatic versioning backend file system. The
recommended MongoDB NoSQL storage system provides an easy to use API that
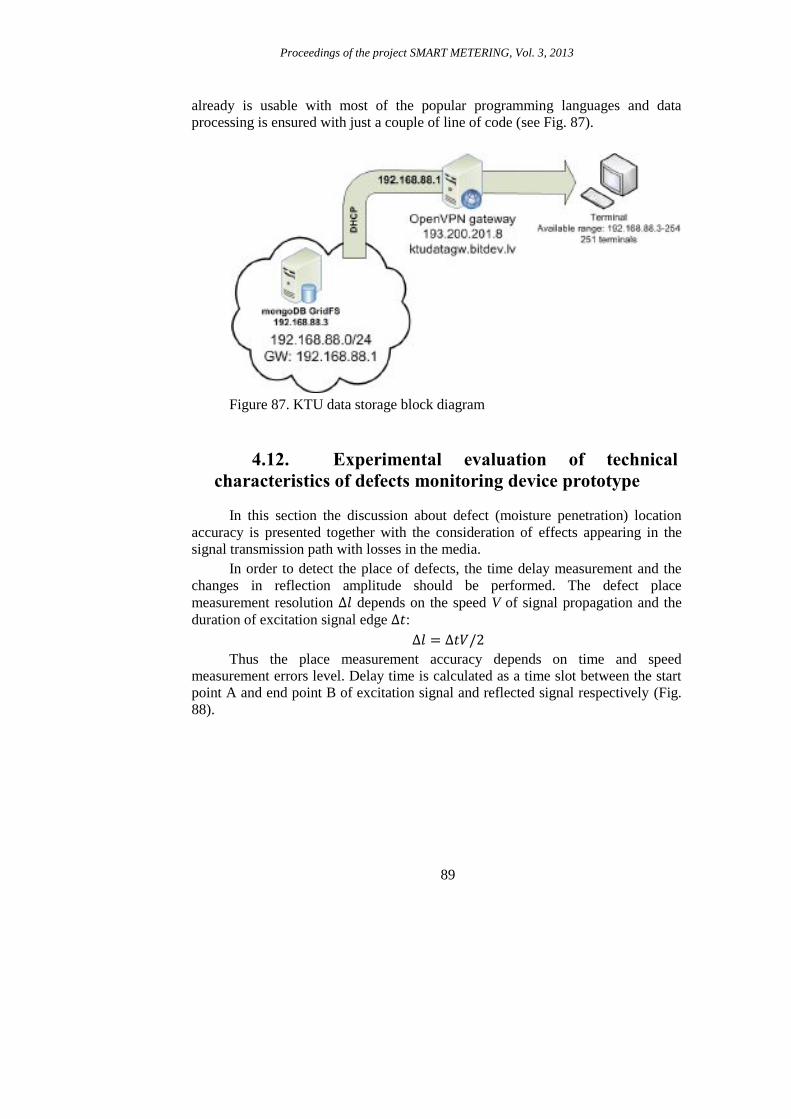
Proceedings of the project SMART METERING, Vol. 3, 2013
89
already is usable with most of the popular programming languages and data
processing is ensured with just a couple of line of code (see Fig. 87).
Figure 87. KTU data storage block diagram
4.12. Experimental evaluation of technical
characteristics of defects monitoring device prototype
In this section the discussion about defect (moisture penetration) location
accuracy is presented together with the consideration of effects appearing in the
signal transmission path with losses in the media.
In order to detect the place of defects, the time delay measurement and the
changes in reflection amplitude should be performed. The defect place
measurement resolution depends on the speed V of signal propagation and the
duration of excitation signal edge :
Thus the place measurement accuracy depends on time and speed
measurement errors level. Delay time is calculated as a time slot between the start
point A and end point B of excitation signal and reflected signal respectively (Fig.
88).

Proceedings of the project SMART METERING, Vol. 3, 2013
90
A B
t
Figure 88. Delay time measurement
In this case delay time error components are:
An error of signal propagation speed evaluation ;
An error caused by mismatch of excitation and reflected signal
forms ;
Random error of points A and B determination inaccuracy due
to additive noise influence.
can be eliminated by using calibration procedure with standard object,
thus it might be compensated.
Delay time error consists of two parts:
The reference point A position can be defined by deriving the tangent in the
pulse edge where the velocity has maximum value (Fig. 89).
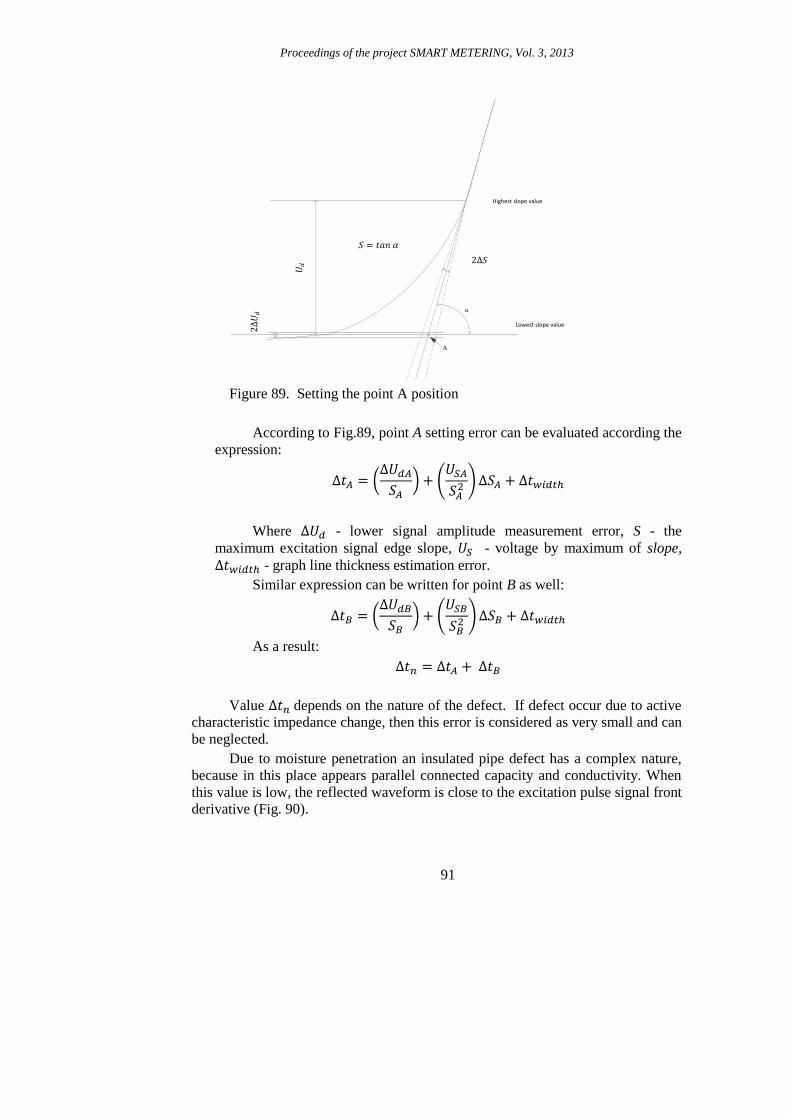
Proceedings of the project SMART METERING, Vol. 3, 2013
91
Lowest slope value
A
a
2 𝑆 2 𝑈𝑑
𝑈𝑑
𝑆 = 𝑎𝑛 𝛼
Highest slope value
Figure 89. Setting the point A position
According to Fig.89, point A setting error can be evaluated according the
expression:
𝑈 𝑆
𝑈
𝑆 𝑆
Where 𝑈 - lower signal amplitude measurement error, S - the
maximum excitation signal edge slope, 𝑈 - voltage by maximum of slope,
- graph line thickness estimation error.
Similar expression can be written for point B as well:
𝑈 𝑆
𝑈
𝑆 𝑆
As a result:
Value depends on the nature of the defect. If defect occur due to active
characteristic impedance change, then this error is considered as very small and can
be neglected.
Due to moisture penetration an insulated pipe defect has a complex nature,
because in this place appears parallel connected capacity and conductivity. When
this value is low, the reflected waveform is close to the excitation pulse signal front
derivative (Fig. 90).

Proceedings of the project SMART METERING, Vol. 3, 2013
92
AB
𝑛𝑜
𝑈𝑟𝑒𝑓
𝑈𝑒𝑥𝑐
t
U
Figure 90. Setting point B by reflection from capacitive type fault
In this case, the delay time can be obtained using the previous method and
the measurement error is equal to half of excitation pulse edge. These errors
can be partially avoided if the reference point A will be fixed in the middle of the
excitation pulse edge, and reflected point B - at maximum or minimum pulse edge
depending on the type of reflection. Fig. 91 shows the existence of parallel capacity
where point B is captured in local minimum place.
B
Figure 91. Setting of point B in the presence of capacitive type (110 pF)
nonhomogenity
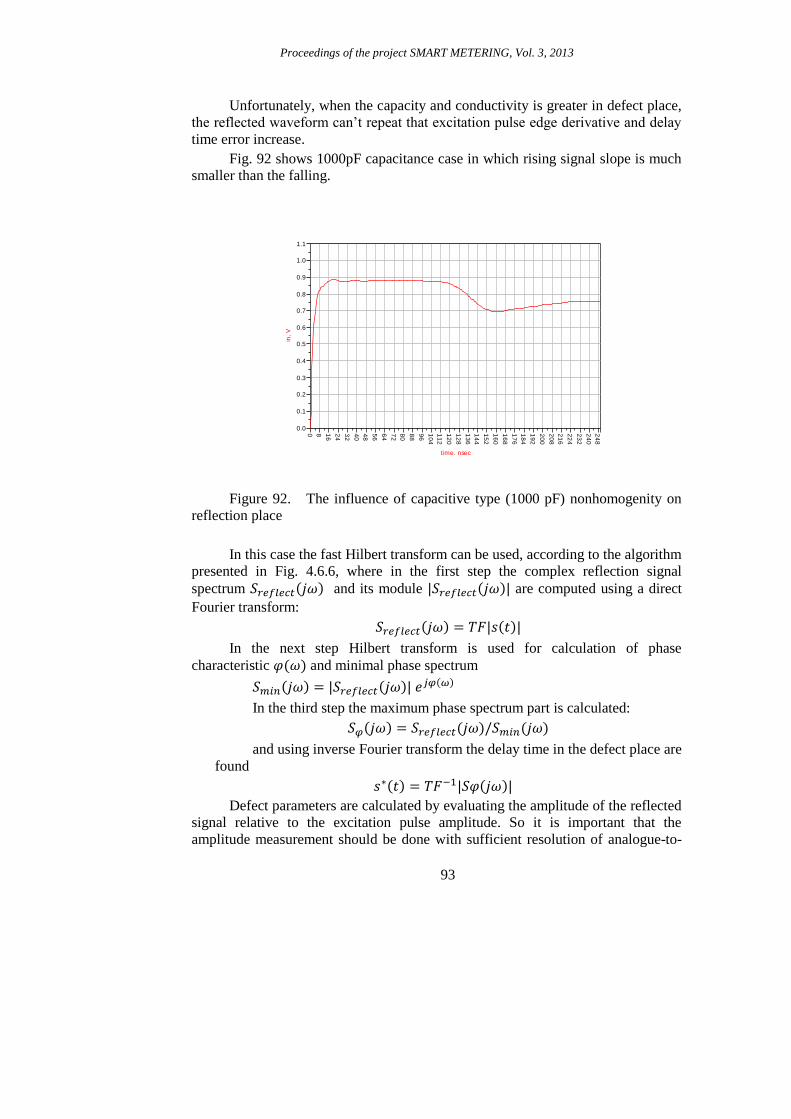
Proceedings of the project SMART METERING, Vol. 3, 2013
93
Unfortunately, when the capacity and conductivity is greater in defect place,
the reflected waveform can’t repeat that excitation pulse edge derivative and delay
time error increase.
Fig. 92 shows 1000pF capacitance case in which rising signal slope is much
smaller than the falling.
Figure 92. The influence of capacitive type (1000 pF) nonhomogenity on
reflection place
In this case the fast Hilbert transform can be used, according to the algorithm
presented in Fig. 4.6.6, where in the first step the complex reflection signal
spectrum 𝑆 and its module 𝑆 are computed using a direct
Fourier transform:
𝑆
In the next step Hilbert transform is used for calculation of phase
characteristic and minimal phase spectrum
𝑆 𝑆 𝑒
In the third step the maximum phase spectrum part is calculated:
𝑆 𝑆 𝑆
and using inverse Fourier transform the delay time in the defect place are
found
𝑆
Defect parameters are calculated by evaluating the amplitude of the reflected
signal relative to the excitation pulse amplitude. So it is important that the
amplitude measurement should be done with sufficient resolution of analogue-to-
8 16
24
32
40
48
56
64
72
80
88
96
10
4
11
2
12
0
12
8
13
6
14
4
15
2
16
0
16
8
17
6
18
4
19
2
20
0
20
8
21
6
22
4
23
2
24
0
0 24
8
0.1
0.2
0.3
0.4
0.5
0.6
0.7
0.8
0.9
1.0
0.0
1.1
time, nsec
in,
V

Proceedings of the project SMART METERING, Vol. 3, 2013
94
digital converter (ADC) using stable reference voltage source, stable amplifier with
the high signal to noise ratio (SNR).
Delay pint location
Complex and power spectrum calculation of
reflected signal
Calculation of Hilbert
transform
Calculation complex
spectrum of minimal phase
part
Calculation complex
spectrum of maximal
phase part
Inverse Fourier transform
calculation of maximal
phase part
Setting of delay time
End
𝑆𝑟𝑒𝑓 𝑒𝑐 = | |
𝑆𝑚𝑖𝑛 = |𝑆𝑟𝑒𝑓 𝑒𝑐 | 𝑒 ( )
𝑆𝑚𝑖𝑛 = |𝑆𝑟𝑒𝑓 𝑒𝑐 | 𝑒 ( )
𝑆 = 𝑆𝑟𝑒𝑓 𝑒𝑐 ( )/𝑆𝑚𝑖𝑛 ( )
= −1|𝑆 |
Figure 93. Hilbert transform algorithm for finding delay time on reactive
type defects
In our device is used programmable amplifier in which amplification
coefficient can be selected within the range from -24 to +48 dB with repeatability
of +-0.5dB. Excitation pulse amplitude can be varied within the range [1-100] V.
The device dynamic range can be varied within [-24, +88] dB interval. ADC
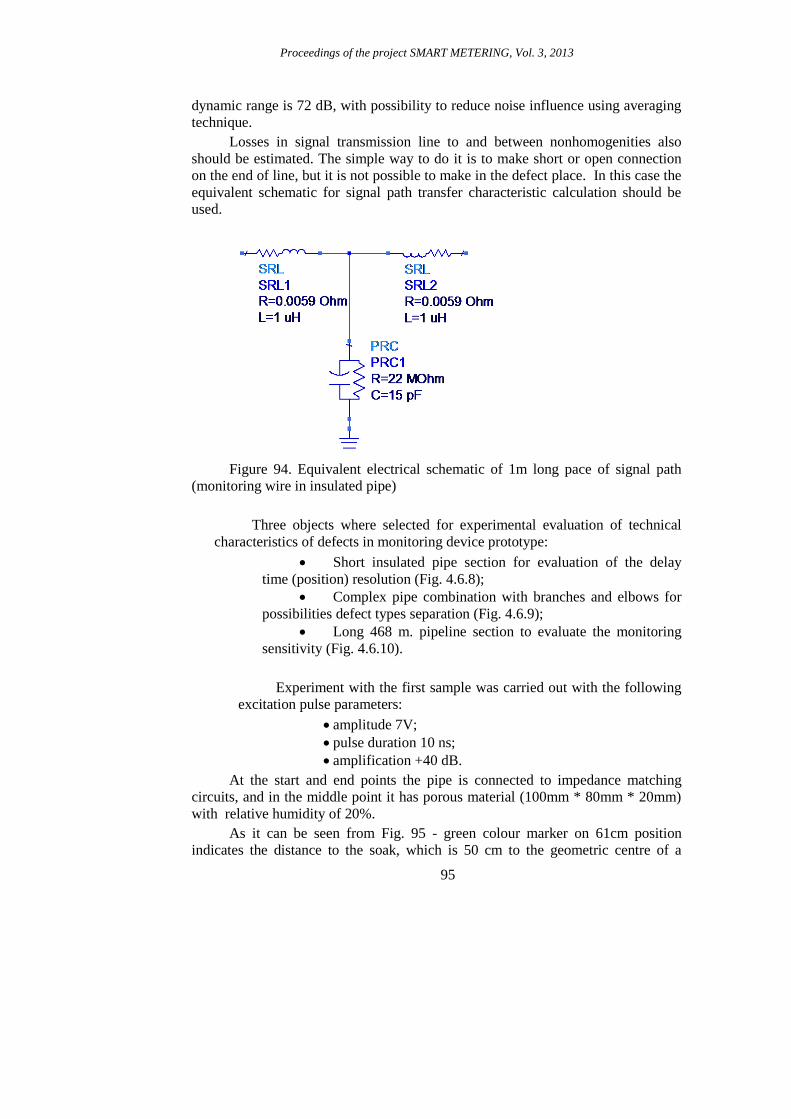
Proceedings of the project SMART METERING, Vol. 3, 2013
95
dynamic range is 72 dB, with possibility to reduce noise influence using averaging
technique.
Losses in signal transmission line to and between nonhomogenities also
should be estimated. The simple way to do it is to make short or open connection
on the end of line, but it is not possible to make in the defect place. In this case the
equivalent schematic for signal path transfer characteristic calculation should be
used.
Figure 94. Equivalent electrical schematic of 1m long pace of signal path
(monitoring wire in insulated pipe)
Three objects where selected for experimental evaluation of technical
characteristics of defects in monitoring device prototype:
Short insulated pipe section for evaluation of the delay
time (position) resolution (Fig. 4.6.8);
Complex pipe combination with branches and elbows for
possibilities defect types separation (Fig. 4.6.9);
Long 468 m. pipeline section to evaluate the monitoring
sensitivity (Fig. 4.6.10).
Experiment with the first sample was carried out with the following
excitation pulse parameters:
amplitude 7V;
pulse duration 10 ns;
amplification +40 dB.
At the start and end points the pipe is connected to impedance matching
circuits, and in the middle point it has porous material (100mm * 80mm * 20mm)
with relative humidity of 20%.
As it can be seen from Fig. 95 - green colour marker on 61cm position
indicates the distance to the soak, which is 50 cm to the geometric centre of a

Proceedings of the project SMART METERING, Vol. 3, 2013
96
porous material plus the impedance matching circuit connection cable length of 11
cm.
120
1100
60
1010
11
0
57
505
Place for moisture
insertion
Connection cable 10m
PFT 02
Impedance matching circuits
Figure 95. Reflections location graph in 1,1 m long piece of insulated pipe
Experiment with the second sample was carried out with the following
excitation pulse parameters:
amplitude 7V;
pulse duration 10 ns;
amplification +30 dB.
At the start and end points the pipe is connected to the impedance matching
circuits, and on the non-insulated part - 20% relative humidity porous material
(100mm * 80mm * 20mm) piece.
As it can be seen from the graph Fig. 96 a), the red colour marker indicates
199 cm distance from the connection point, i.e. device indicates even that part of
the pipe section, which is not isolated, since it has a characteristic impedance

Proceedings of the project SMART METERING, Vol. 3, 2013
97
change because of change of dielectric constant. When the moisture is inserted
(blue colour marker), the higher characteristic impedance change is observed.
Graph b) shows the case when the humidity is inserted at the point number 2.
In this case, the red colour marker shows the 913 cm distance to the soak and the
green colour marker - the end of the pipe.
Tee
Elbow1300
500950
25
0
80
0
1300
450
300
Connection
cable 10m
PFT 02
Coupling 1
Coupling 2
Non insulated
piece
Impedance matching circuits
1
2
Moisture
insertion points
Red – graph without moisture Blue – graph with moisture
a)

Proceedings of the project SMART METERING, Vol. 3, 2013
98
Blue – graph without moistureYellow – graph with moisture
b)
Figure 96. Reflections location graphs of a) - moisture inserted in the 1 place
and b) - moisture inserted in the 2 place of 5,6 m long piece of insulated pipe with
elbow and tee.
Experiment with the third sample was carried out with the following
excitation pulse parameters:
amplitude 7V;
pulse duration 10 ns;
amplification +44 dB.
In Fig. 97 the red colour marker shows the wet pipe piece location place on
466 m. position. It means that small and far-off defects can be captured, though
that excitation pulse amplitude was only 7V (the maximum possible is 100V).
The given examples illustrate the device capabilities and quantitative
characteristics, which confirms the correctness of selected technical parameters in
the concept development phase. Also the qualitative assessment and the ability to
distinguish the nature of the defect require extensive experience and intuition. The
graphics are not enough helpful to determine the nature of the defect, because the
higher order reflections can occur in the object. They may overlap with reflections
from the wet areas and from the technological defects as well.
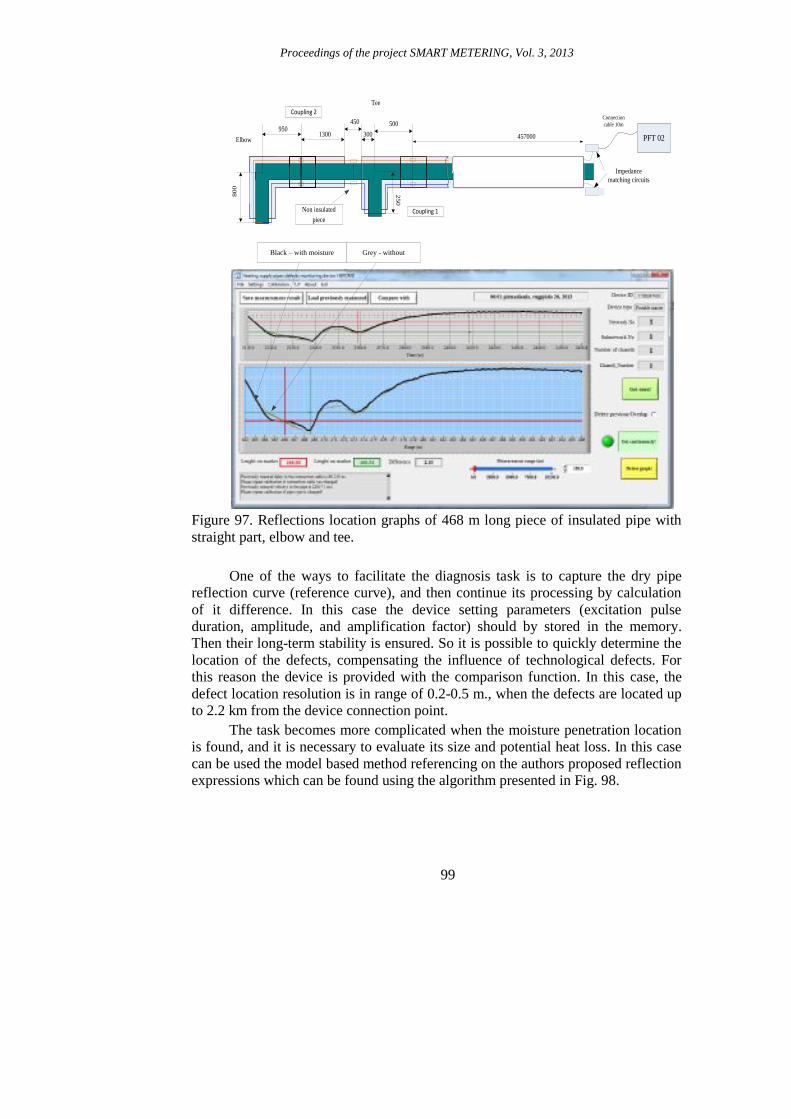
Proceedings of the project SMART METERING, Vol. 3, 2013
99
Tee
Elbow 457000
500950
250
800
1300
450
300
Impedance
matching circuits
Connection
cable 10m
PFT 02
Coupling 1
Coupling 2
Non insulated
piece
Black – with moisture Grey - without
Figure 97. Reflections location graphs of 468 m long piece of insulated pipe with
straight part, elbow and tee.
One of the ways to facilitate the diagnosis task is to capture the dry pipe
reflection curve (reference curve), and then continue its processing by calculation
of it difference. In this case the device setting parameters (excitation pulse
duration, amplitude, and amplification factor) should by stored in the memory.
Then their long-term stability is ensured. So it is possible to quickly determine the
location of the defects, compensating the influence of technological defects. For
this reason the device is provided with the comparison function. In this case, the
defect location resolution is in range of 0.2-0.5 m., when the defects are located up
to 2.2 km from the device connection point.
The task becomes more complicated when the moisture penetration location
is found, and it is necessary to evaluate its size and potential heat loss. In this case
can be used the model based method referencing on the authors proposed reflection
expressions which can be found using the algorithm presented in Fig. 98.

Proceedings of the project SMART METERING, Vol. 3, 2013
100
Object
Analytical
model
Comparing
Adjustment of model parameters
Measurement results
Equivalent schematic
Figure 98. Algorithm of model based object parameters estimation
Now it is possible to evaluate penetrated moisture parameters - parallel
capacity and conductivity, and then the volume of wet penetration and heat loss in
it.
4.13. The structure of monitoring system,
functioning methods and issues to be addressed in the
next project stage
The developed device is a part of the system (Fig. 99), used for heat supply
pipeline monitoring. In the sections of the pipeline the one master and many slave
devices can operate. Each unit works independently and covers length up to 2.4
km. Master collects data from each slave and transmits them to the server. Master
also controls the slave mode of operations, i.e., measurement, battery charging and
data transfer. The most useful place to install the master is the boiler house and
slaves heating distribution points or collectors. Slave can work autonomously
powered by own lithium-ion battery. Periodically master connects all slaves to the
battery for charging or switches on the data transfer mode. Data exchange does not
take place if there is no change of reflection measurement results. Measurement
period is programmable and can be selected for any period with 10 sec resolution.
In addition to the measuring of reflection curve, slave can transmit data to
the master consisting of the temperature and pressure at a given point of the
pipeline.

Proceedings of the project SMART METERING, Vol. 3, 2013
101
Header DLE, STX 2*(unsigned char)
Command (unsigned char)
Command_Data[8] (unsigned short)
256 bit user key for validation
CRC32 (unsigned int)
Header DLE, STX 2*(unsigned char)
Command mirror (unsigned char)
Device_ID (unsigned int)
Network_number (unsigned short)
Sub_Network_No (unsigned short)
CRC32 (unsigned int)
Request
Answer
Number of chanells (unsigned short)
Device type (unsigned short)
Data[8192] (float)
Excitation voltage (float)
Amplification (float)
Status (unsigned int)
Revision number (unsigned int)
Monitoring device (MD4)slave
Monitoring device (MD2)slave
Monitoring device (MD3)slave
Other smart sensors
(temperature,
pressure, flow, heat)
Pulse width (float)
Other smart sensors
(temperature,
pressure, flow, heat)
Other smart sensors
(temperature,
pressure, flow, heat
meter)
Boiler house
Data base server
WEB
Service for storage,
authorized access and
diagnostic results
presentation
Emergency
messages
Temperature (float)
Heat (float)
Pressure_Dynamic[1024]
Crypted
using AES
algorithm
Master
Open
VP
N tu
nell
VP
N t
un
ell
Yield (float)
PC program revision No
Date
Time
Start point (ns)
Wave velocity (m/s)
A
B
C
Figure 99. Structure of the system for continuous monitoring of heat supply
pipe net
Fig. 100 provides the structure of faults detector. If it works in master mode,
then it will require an external AC/DC converter from 220 VAC to 12VDC. The
device has the secondary power supply unit, which forms a +3V3, +5 V and-5V
power supply voltages.

Proceedings of the project SMART METERING, Vol. 3, 2013
102
3.1
Excitation pulse
generator with
regulated amplitude and
pulse width
(9)
Programmable
attenuator/amplifier
(-24 - +44) dB (5)
4.1 Mixer (6)5.1LF amplifier
(7)6.1 7.1
ARM
Cortex M3
based SoC
(11)
CPLD
(10)10.1
Power supply (3V3, +5V,-5V) with accumulator (Li-Ion) and charging circuit
(2)
Tablet PC
(8)11.5
USB 2.0
Programmable voltage source
(1-100) VAC
(13)
13
.1
11.1
11.4
2.5
2.4
2.7
2.9
2.6
2.2
Communication
interface
(14)
11.3
14
.1
External SPI
connections
Input circuit (4)
9.1
Incremental encoder
for pipe length
measurement
(12)
11.4
12.1
12.2
Pip
e l
ength
measure
ment
sensor
2.1
0
2.1
1
External AC-DC
converter (1)1.1220 VAC
1. 2
10
HF analog signal path
Power supply path
Digital control signal path
12.3
3
External switch
for expanding
number of
channels &
connecting to
other devices
(3)
3.3
3.4
3.5
3.6
3.7
3.8
3.9
3.10
2.3
2.1
LF analog signal path
Communications signal path
11.2
3.2
2.8
Figure 100. Structure of faults detector
The main part of the device is a digitally controlled delay line (Fig. 101)
with resolution of 2.5 ns. Delays time various within [2.5 – 20480] ns interval. The
part consist of 50 MHz quartz controlled oscillator with 20 ppm stability, PLL
frequency multiplier, two serially connected 13 bit synchronous binary counters
and 13 bit digital comparator, which output signal is used as sampling signal in
high speed track and hold circuit. It samples signal obtained from circulator
(reflected part of the signal), amplitude limiter (used for overvoltage protection)
and programmable amplifier. These samples are going to ADC and are stored in
memory.
The excitation pulse is formed simultaneously with the programmable
duration of 2.5 ns resolution. The pulse amplitude can be increased up to 100V.
The SoC with 168MHz clocking frequency, and Cortex-M3 ARM type
microprocessor is used in the device. It controls all the processes and data
exchange. Tablet PC can be connected via USB interface as well. SoC
automatically carries all the calibration and measurement procedures. Tablet PC
performs visualization of measurement results and their transfer to the server. Wi-
Fi interface is used for internet connection and authenticated data exchange with
the server.

Proceedings of the project SMART METERING, Vol. 3, 2013
103
13 bit synchronous
counter
13 bit synchronous
counter
PLL frequency multiplier
400 MHz
13 bit digital comparator Overflow20.48 mks
Scanning frame 167.772 ms.
Delay range (2.5 – 20480) ns.
Pulse width former
Width programming code
Pulse position
50MHz signal source
Width
(10, 15, 20, 25)
ns
Excitation signal
amplifier
Amplitude (1-100) V
Amplitude programming code
High speed
S&H
circuit
Circulator
Programmable
HF attenuator/
amplifier
To the object under test
Amplitude
limiter
To ADC
(Sampling rate 20.48 mks)
Figure 101. Digital delay line and high speed track and hold circuit
Fig. 102 shows the data structure in server. It stores the names of the country
and the city, where the monitoring was made, also network and subnet numbers,
device settings, electrical schematic, audio-visual material, the defect and repair
procedure description and history files of periodically measurements.

Proceedings of the project SMART METERING, Vol. 3, 2013
104
WEBWEB
Data baseData base
Heating faults Heating faults
Net IDNet ID
Subnet IDSubnet ID
CountryCountry
PlacePlace
Net connected
PC’s Registered users
SettingsSettings DrawingsDrawings Photo &
Video
Photo &
VideoDescriptionDescription Measurements
results
history
Measurements
results
history
VPN tunnel
VPN tunnel
Connected FT02
masters
Connected FT02
slaves
VPN
tunnel
Figure 102. Structure of data stored in server
The objectives of next project stage can be pointed to the following issues:
Obtained currently system solutions should be adopted to
the big pipe nets and also for their separate parts solving
communication problems between them;
Hardware solutions should be adopted for insulated pipes
with steel cover used for over ground heat distribution;
Software solutions should be expanded for automatic faults
location without operator intervention for complex nearly located
nonhomogenities.
4.14. Initial suggestions to carry out the
classification of defects in the pipe net
Stable device parameters (duration of excitation pulse, low time jitter and
amplitude, amplification factor, 88 dB dynamic range), and also qualitative
recording of reference reflection curve, ensures reliable and sufficiently accurate
localization of simultaneous several defects localization. The ability to measure the
relative reflection amplitude deviations allows obtaining the assessment of
penetrating moisture volume and the potential heat loss.

Proceedings of the project SMART METERING, Vol. 3, 2013
105
But the task becomes much more complicated when the defects are close to
each other yielding the reflections to be very different. In this case high reflections
masks become smaller, and it can be invisible. On the other hand the second and
even third-type reflections occur that interfere with real defects because of
moisture penetration.
The system overcomes these difficulties providing the opportunity to make
measurements from two directions in the same pipe. This creates additional
measures from both ends of pipe to adjust the measurement results, but if the
defects are big enough, this opportunity not solve a problem.
In this case, the continuous monitoring of the pipeline is a good choice,
because many defects are not appears at the same time. When the single defect
appeared it can be detected and promptly removed.
As shown in the theoretical part of the project, moisture penetration is
equivalent to the parallel connection of conductivity and capacity. In this case, the
reflection characteristic such as a negative Gaussian pulse shape has increasing
duration in the rising front. The increased value is proportional to the amount of
penetrated moisture, and the place of the derivative peak value – delay time to fault
location.
The largest object identification accuracy can be achieved by using a model
based method, by algorithm presented in Fig. 98, the result of which is an
equivalent object electrical schematic, from which can be performed classification
of its components. Classification goal is to distinguish true moisture penetration
defects beginning from the second and higher orders of reflections.
It should be noted that the implementation of this algorithm is fairly
complicated when the defect amount is large (over 4-5), because it is needed to
randomly resample all equivalent circuit parameters to match the experimental and
simulated reflection characteristics.
Experiments have shown that even in the case of 5 defects the computation
performed on PC with i7 core microprocessor takes 24 sec. It is therefore necessary
for further improvement of the algorithm in order to adapt it to the device SoC to
reach the possibility for device operator to quickly and objectively assess object
functionality, separating secondary reflections, monitoring wiring connections
(with dominating inductive part of impedance) and technological defect from real
moisture penetration defects, when the quantity of defects in pipe net exceeds 3 - 4.
4.15. The problem issues for the future research
4.15.1. The main problematic factors for development of
wireless sensor networks on water and district
heating networks
The main restrictions and problematic factors summarized as a
referencing guide for the following technological framework:

Proceedings of the project SMART METERING, Vol. 3, 2013
106
1. Limited or no power source access – the private premises
are unable to provide a usable energy source for the transmitting equipment
as there are juridical conflicts which are hard to regulate on municipal
basis:
a. The power source has to be self-contained in the device –
the sensor. It has to be able to transit without maintenance for a long
time (relatively to the usage of the sensor) – according to the context
of maintenance costs to replace the power source or the device itself;
b. The power source has to be easily replaceable and the costs
cloud the an optimum between costs and effective running time;
c. The power source has to be safe to handle and should not
be a risk in the private premises (fire, noise, electrical shock);
2. Communication systems:
a. A mesh based system (see Fig. 103) has to be available to
maximize the coverage are and to minimize the transmission
equipment costs (for this purpose a sink node type data delivery
concept was chosen combined with a forward transfer – repeater node)
[29].
b. Transmission signal blocking and weakening by house
walls – positioning and transmission power of the sensors;
c. Transmission signal blocking below ground by manhole
concrete walls and manhole covers – suitable directional and
omnidirectional rugged antenna design for harsh environmental
conditions and tamper safe installations.
Figure 103. Mesh based system for metering data transmission
3. Sensors:
a. Sensors transmitter interface has to be universal and cover
most of available market sensors (pressure, flow).
4. Installation procedure:

Proceedings of the project SMART METERING, Vol. 3, 2013
107
a. The device has to be fool proof to install so the risk of false
installation, damaging while installing or failing to install is minimal;
b. Manhole, concrete covers have to be drilled, so suitable
fittings and assembly equipment has to be provided;
c. Easily attachable core network transmission equipment
brackets have to be designed;
d. Core network access systems have to be chosen or created
to effectively manage signal delivery by minimizing the access point
count.
5. Diagnostics procedures:
a. There should be a testing device for installer of the sensor
to verify the correctness and functionality of the installed device
without the need of backend system querying;
6. Further development of practical methods for leaks
detection in water distribution networks.
a. Due to project restriction only one method for leaks
detection has been developed and tested in real conditions: events
metrics and event registration, however other methods should be
acquired and tested in future projects.
4.15.2. Heating pipeline faults location system future
development perspective
Developed heat pipeline faults location device is a part of a system
ensuring operative finding pipelines defects place excluding technological
defects. Stand-alone different system devices have 8 channels and cover 2,4
km pipeline length. If pipeline length is more than 2,4 km, serial coupling of
devices is provided. Thus investigating pipeline length is unlimited. Further,
the possibility to connect and use other devices (temperature, flow, pressure
sensors) using monitoring conductor as data transmission medium is
provided. Since the master device ensures charging slave devices batteries
the latter can be installed in the places where the mains do not exist. Eight
channels which can be connected to the device. This ensures the possibility
to monitor 8 or 4 pipeline branches when is necessary to monitor from
different pipelines sides. This gives additional merit increasing faults
location reliability. This is convenient in the cases when some defects arise
in pipeline insulation layer and the first of them is bigger and suppresses
monitoring system signal blocking it‘s propagation to the second smaller
defect. Monitoring data are saved in the server. Only authorized users, i.e.
specialists of energetic companies can used them.
At this time the technical documentation, i.e. firmware for MCU and
CPLD, printed circuit board production, assembling, manual tuning and

Proceedings of the project SMART METERING, Vol. 3, 2013
108
testing documentation for production of devices is prepared. The adjustment
of device is complicated because it consists of supply units, broadband
amplifiers, testing pulses source, strobe converter and high frequency
circulator. The adjustment requires special measuring instruments:
broadband scope, network and spectrum analizers and qualified specialists.
For further development of the system is necessary:
To perform the long-time testing of developed prototypes using
different pipeline lengths;
To perform device tests according applicable EU directives and to
get CE approbation;
To develop public access terminal which could be used by ordinary
heat users for control of heat suppliers work expedition and quality.
The information about the state of heat pipelines and losses could be
placed in the terminal. Maintaining personal could perform FW
restoring procedures of the device, program the schedule of system
devices operation, and perform remote diagnostics of devices.
To develop computer-assisted adjustment and testing system for
device manufacturing company to minimize manufacturing cost and
ensure stable and reiterating devices parameters;
To expand device FW on purpose to ensure the possibility to
sinchronously accumulate external pressure sensors data for
estimating of water debit in the case of pipeline breaking or
unauthorized taping the heat supplying route.
References
1. G. Krauze. (2011). Latvian Water Supply and Sewerage
Enterprises Association. Presentation at International Conference Baltic States
in Transition, Jurmala, Latvia, 16th September 2011, unpublished, p.13.
2. Zabasta A., Kunicina N., Chaiko Y., Ribickis L. (2011).
“Automatic Meters Reading for Water Distribution Network in Talsi City”.
Proceeding of EUROCON 2011, April 2011, Lisbon, Portugal, IEEE, 2011.
p.1-6.
3. A project “Innovative e-services for water supply management”
(E-Water), Project application form, Latvian – Lithuanian Cross-border
cooperation program, unpublished.
4. http://en.wikipedia.org/wiki/District_heating.

Proceedings of the project SMART METERING, Vol. 3, 2013
109
5. A.Janukonis, Lithuanian District Heating Association, “Lithuanian
heat sector: today based on imported fossil fuel, tomorrow – on local bio fuel
and wastes”, http://www.worldenergy.org/documents/congresspapers/239.pdf
6. Latvia District Heating Association, “Heat supply in Latvia”,
2010, http://www.lsua.lv/en/index.php?option=com
_content&task=view&id=4&Itemid=5 ,
7. Study in UK: http://www.euractiv.com/consumers-unaware-smart-
meters-a-news-514432
8. M441 on 12 March 2009,
http://www.cen.eu/cen/Sectors/Sectors/Measurement/ Pages/default.aspx.
9. COMMISSION RECOMMENDATION of 9 March 2012 on
preparations for the roll-out of smart metering systems (2012/148/EU)
10. Strategic Research Agenda of European Technology Platform on
Smart Systems Integration, Version 2, 2009, p. 1 – 76.
11. Implementation Plan on Water Supply and Sanitation Technology
Platform, April 2007, p.1-32.
12. The European Smart Grid Task Force.
http://ec.europa.eu/energy/gas_electricity /smartgrids/doc/expert_group1.pdf .
13. M441 on 12 March 2009,
http://www.cen.eu/cen/Sectors/Sectors/Measurement/ Pages/default.aspx.
14. EURELECTRIC Policy Statement on Smart Meters WG
Distribution Customers & Operation Dépôt légal: D/2010/12.205/10, April
2010, p.6.
15. http://www.ihs.com/ 15
16. http://www.nerc.com/
17. http://www.nist.gov/public-safety-security-portal.cfm
18. http://www.aberdeen.com/Aberdeen-Library/7080/RA-trusted-
computing-security.aspx
19. http://www.arm.com/products/processors/technologies/trustzone.p
hp
20. http://www.arm.com/products/processors/securcore/index.php
21. Z. K. Morvay, D. D. Gvozdenac, “APPLIED INDUSTRIAL
ENERGY AND ENVIRONMENTAL MANAGEMENT”,
http://www.downws.com/ebooks/214-applied-industrial-energy-and-
environmental-management.html
22. http://www.engineeringtoolbox.com/convective-heat-transfer-
d_430.html
http://www.nep.lt/out_data/NEP%20zinynas.pdf
23. “Permeability of open-cell foams under compressive strain”, M.A.
Dawsona, J.T. Germaine,L.J. Gibson.
24. www.sciencedirect.com/science/article/pii/S0020768306005518

Proceedings of the project SMART METERING, Vol. 3, 2013
110
25. http://upload.wikimedia.org/wikipedia/commons/thumb/9/92/Time
_between_failures.svg/725px-Time_between_failures.svg.png) 25
26. https://www.sparkfun.com/datasheets/Wireless/General/RFM22B.
pdf) 26
27. http://en.wikipedia.org/wiki/Manchester_code) 27
28. http://en.wikipedia.org/wiki/Model%E2%80%93view%E2%80%9
3controller) 28
29. http://www.intechopen.com/books/sustainable-wireless-sensor-
networks/a-sink-node-allocation-scheme-in-wireless-sensor-networks-using-
suppression-particle-swarm-optimizat

This edition is published by the financial support of Latvia - Lithuania cross border cooperation pro-gramme 2007 - 2013 project “Smart Metering”, No. LLIV-312, being implemented in Engineering Research Institute “Ventspils International Radio Astronomy Centre” of Ventspils University College
(VIRAC).
This document has been produced with the financial assistance of the European Union. The contents of this document are the sole responsibility of Ventspils University College and can under no circumstances be regarded as reflecting the position of the European Union.

ISBN: 978-9984-648-43-9
SMART METERING


