80
Proceedings

P R O C E E D I N G S 1
Proceedings

S Y M P O S I U M C O M M I T E E
Andy Durham (Liphook Equine Hospital, UK)Nicholas Frank (Tufts University, USA)
Catherine McGowan (University of Liverpool, UK)Harold Schott (Michigan State University, USA)
Allison Stewart (University of Queensland, AUS)Melody de Laat (Queensland University of Technology, AUS)
H O S T E D B Y

P R O C E E D I N G S 3
F O R E W O R D
Dear Delegate,
We are very happy to welcome you to the fourth Global Equine Endocrine Symposium at Gut Ising
(Germany), hosted by Boehringer Ingelheim.
As a community within the equine world, we are dedicated to raising awareness, to better
understandingandtodevelopingastandardofcareforhorsessufferingfromEMS,PPIDand
other misunderstood endocrinopathies to all equine stakeholders.
Our program this year will focus on a number of areas:
• Epidemiology of equine endocrine diseases;
• Aetiopathogenesisofpituitaryparsintermediadysfunction(PPID)andequine
metabolic syndrome (EMS);
• Diagnosisofendocrinediseases;
• TreatmentandmonitoringofPPID,
• Management of obesity and EMS, and
• Endocrinopathic laminitis and insulin dysregulation.
Wehopethatthesymposiumwillsucceedatbringingthescientificcommunitytogetherandfurther
drive research and knowledge about endocrine diseases.
Finally yet importantly, we hope that you enjoy this symposium.
Sincerely,
Boehringer Ingelheim and the Scientific Committee

4 4th Global Equine Endocrine Symposium 2020
C O N T E N T S
Symposium Commitee ................................................................................................................................................................2
Foreword .......................................................................................................................................................................................3
Contents ...................................................................................................................................................................................4 / 5
�Tatum:Across-sectionalstudyofhorsesdiagnosedwithPPIDintheUnitedKingdom: Demographics,managementandhealthcare .................................................................................................................6
Schott: SteroidhormoneprofilesofhorseswithPPID ..................................................................................................7
Meyer: A systematic review and meta-analysis on the diagnostic accuracy of baseline ACTHforthediagnosisofPPIDinadulthorsesandponies ..........................................................................................8
Durham:Temporally-specificdiagnosticthresholdsforplasmaACTHinthehorse ..............................................10
Bailey: Seasonal variation in ACTH concentrations and dexamethasone suppression tests in ponies and andalusian horses compared with standardbreds .....................................................................12
Haffner:Theeffectoftraileringanddentistryonrestingacthconcentrationinhorses .....................................13
Bamford: Comparison of autumnal ACTH concentrations between apparently healthy horses and ponies .....14
Potier: TheeffectoflatitudeandbreedoncircannualACTHconcentrationsintheUK ......................................15
Bertin: Theeffectoffreeze-thawcyclesonthedeterminationofimmunoreactiveACTH ..................................18
Banse:ACTHstabilityinfrozenequineplasma ............................................................................................................19
Grubbs:DevelopmentandevaluationofaclinicalsignscoringsystemforPPIDinhorses ...................................20
Banse:ComparisonofmusclemassandskeletalmuscleproteolysisinagedhorseswithandwithoutPPID ...21
Bertin: TherepeatabilityoftheTRHstimulationtestforthediagnosisofPPID ...................................................22
Hoffman: TheTRHprocedureproducesrepeatableACTHconcentrationsinPPID-negative andPPID-positivehorses ....................................................................................................................................................23
Sanchez-Londoño:EvaluationofdifferentdosesofTRHinminiaturehorses ......................................................24
Schorn:ComparisonoftwoTRHdosesinPPIDpatients ............................................................................................25
Haffner:Durationofeffectivenessoffrozen/thawedTRHtostimulateACTHreleaseinhorses ......................26
Gough: Is there merit in utilising the TRH stimulation test in horses with an equivocal ACTH ............................27
Stewart: ACTHconcentrationsfollowingTRHstimulationinhorses:effectofsamplehandling on ACTH following TRH stimulation in horses ...............................................................................................................28
Knowles:ElutionofendogenousCLIPfromanACTHassaycaptureantibody .......................................................29
Potier: Circannual pattern of ACTH, insulin and glucose concentrations in horses and ponies ..........................31
�Pollard:InvestigatingtheepidemiologyofPPIDinhorses/poniesenrolledinalaminitiscohort study in Great Britain ........................................................................................................................................................33
Steel:ManagementofequinePPIDinveterinarypractice:aclinicalaudit .............................................................34
Menzies-Gow:TheeffectofpergolidedosingcomplianceonthelaboratorycontrolofPPID ..........................36
Tatum:Across-sectionalstudyofhorsesdiagnosedwithPPIDintheUnitedKingdom: Treatment practices and factors associated with quality of life ................................................................................39
Hart:Pharmacokineticsofpergolidemesylateindonkeys .....................................................................................40
P R O C E E D I N G S 5
Schorn:ACTHafterTRHstimulationinPPIDpatientstreatedwithpergolidefor6-8weeks ...............................41
Schott:Ownerassessmentoflong-termtreatmentofPPID ......................................................................................42
Carslake:EquinemetabolicsyndromeinnativeUnitedKingdomponiesandcobs:Prevalenceandriskfactors ...43
Warnken: Theeffectoffastingversusno-fastingonresultsoforaltestingforinsulin dysregulation with glycemic carbohydrates ..................................................................................................................44
De Laat: GlucosestimulatesGLP-2secretionfromequinesmallintestine .............................................................45
Vaughn: Associations between systemic oxidative stress and endocrine parameters in horses and ponies .....46
Coleman:Fecalextractfromobesehorsesinducesinflammationinvitro...............................................................47
Morgan: The equine pancreas in chronic hyperinsulinaemia .....................................................................................48
Macon: Insulinemic responses to non-structural carbohydrates and crude protein in varying concentrates in healthy and insulin dysregulated horses ...........................................................................................49
Macon:Insulindysregulatedhorses:responsestovaryingoralsugarandfastingtotheoralsugartest ...........51
�Frers: Insulin signaling of liver and adipose tissue in insulin-dysregulated horses after oral glucose administration ..............................................................................................................................................52
Brojer: Comparisons of basal insulin concentrations, oral sugar test results and euglycemic-hyperinsulinemic clamp measurements in horses ...................................................................................53
Delarocque:Plasmametabolomeofhorsesduringoralglucosetests ...................................................................54
Carslake: Evaluation of three dynamic oral carbohydrate tests for insulin dysregulation in ponies ..................55
�Warnken:Nationwidecomparisonofdifferentmethodsusedformeasurementofinsulin in veterinary laboratories in Germany .............................................................................................................................56
Ireland:Translatingresearchintopractice:adoptionofendocrinediagnostictestingincasesoflaminitis .....57
Winter: Is the magnesium metabolism altered in horses with insulin dysregulation .............................................59
Toribio: Dynamicsofincretinsandinsulininhospitalizedfoals ................................................................................60
Karikoski: Effectsofalpha2-adrenoceptoragonismandantagonismonbloodglucose concentration in horses with normal insulin regulation ..............................................................................................61
Stewart:Factorsassociatedwithcriticalillnessrelatedcorticosteroidinsufficiency(CIRCI)inadulthorses .......62
Toribio: Sexhormoneconcentrationsdifferbetweenhealthyandcriticallyillfoals ............................................63
Harris: Comparisonofthreerestrictedgrazingpracticesforequinebodyweightmanagement during the United Kingdom grass growing season ......................................................................................................64
�McGowan: EffectofmanagementofinsulindysregulationinhorsesandponieswithorwithoutconcurrentPPID ... 66
Menzies-Gow: Theeffectofstripgrazingonphysicalactivityinponies .................................................................67
Morgan: Straw-feeding to induce weight loss in native ponies .................................................................................69
Delarocque:Weightlossincombinationwithphysicalactivityishighlyeffectiveagainstinsulindysregulation ....70
Pollard:Investigatingtheepidemiologyofequinemetabolicsyndromeinhorses/ponies enrolled in a laminitis cohort study in Great Britain .....................................................................................................71
Sillence: Theinsulin-likegrowthfactor-1receptor:apotentialtargettotreatequineendocrinopathiclaminitis ...72
Coleman: Obesity as a risk factor for the development of equine asthma .............................................................73
De Laat: Endocrinopathic laminitis and the epidermal growth factor system .......................................................74
Sillence: Theapplicationofanew‘modifiedObel’methodtomonitorrecoveryfrom endocrinopathic laminitis in a clinical setting ................................................................................................................75
Potier: Association between ACTH, insulin glucose and TGs with laminitis in horses and ponies in the UK .....77

A cross-sectional study of horses diagnosed with pituitary pars intermedia dysfunction in the United
Kingdom: Demographics, management and healthcare
1,2Tatum R C,
1McGowan C M and
1Ireland J L
1University of Liverpool, Institute of Veterinary Science, Leahurst Campus, Neston, CH64 7TE;
2Animal Health
Trust, Centre for Preventive Medicine, Newmarket, CB8 7UU.
Presenting author: Rebecca C Tatum, [email protected]
This study did not include animal participants, therefore international, national, or institutional guidelines for
humane animal treatment are not applicable. This study was granted institutional ethical approval from the
University of Liverpool. Return of a completed questionnaire was taken as informed owner consent.
This research has not been presented or published previously.
Word count: 500
Aim: To describe the demographics, management and preventive healthcare practices undertaken by owners of
horses with pituitary pars intermedia dysfunction (PPID) in the UK.
Methods: A cross-sectional questionnaire was distributed both online and via post to owners of horses
diagnosed with PPID in the UK. Information was gathered on management practices such as stabling/turnout
routine, feed, exercise, preventive healthcare and general health. Body condition score (BCS) was assessed
using a scale of 0-5 (very thin - very fat) with descriptions for each rating level.
Results: In total 377 completed questionnaires met inclusion criteria. The median age of the study population
was 23 years (range 7-40) and the median duration of ownership was 12 years (range 0.25-35). Geldings
comprised 54.7 % (n=205/375) and ponies (≤147cm) 52.1% (n=195/374) of the population. Where reported,
nearly all horses received turnout (99.7%; n=327/328), of these 24% (n=80/328) had year round turnout while
the reminder had reduced turnout during autumn and winter months. Horses with a history of laminitis spent
significantly fewer hours turned out throughout the year compared to horses without a history of laminitis
(p=0.003). Turnout was generally at pasture (81.6% n=271/332) in a <1 acre paddock (43.4% n=145/334) with
at least one companion (75.0% n=252/336). The majority of owners restricted their horse’s access to grass
(77.0%; n=248/322) and the most frequently used method was strip grazing (22.0% n=83/322).
Over 95% of the study population received daily forage (n=318/334), which was most frequently dry hay
(49.7%; n=158/318) fed on an ad-lib basis (34.3%; n=109/318). The majority also received ‘concentrate’ feed
(94.6%; n=306/325), the most frequently reported feeds were chaff/chop (64.4%; n=197/306), balancers and
sugar/fibre beet (both 33.7%; n=103/306). Supplements most frequently fed were; joint supplements (41.3%;
n=88/213, multi-vitamins (39%; n=83/213) and turmeric (21.2%; n=45/213). Half of horses received some form
of regular exercise (50.8%; n=169/333), which was mainly low-intensity hacking/pleasure riding (91.7%;
n=155/169). Horses in work were significantly younger than those not it work (p<0.001). Horses were most
frequently reported to be in average body condition with an owner-reported BCS of 2 (60.0%; n=201/335).
Horses reportedly had ≥1 dental examinations per year (91.0% n=302/332) and were most frequently wormed
based on faecal egg counts (50.1%; n=170/339). Within the last 12 months, horses had received a median of 2
(IQR 1-3) routine veterinary visits and a median of 1 (IQR 0-2) non-routine visit. Non-routine veterinary visits
(48.5%; n=183/377) were most frequently reported for non-specific disorders (such as viruses/weight loss)
(31.1%; n=57/183), lameness and laminitis (both 26.8%; n=49/183). Over half (56.8%; n=214/377) of horses
were reported to have ≥1 concurrent health condition, the most frequently reported were osteoarthritis (38.3%;
n=82/214), equine metabolic syndrome (24.8%; n=53/214) and respiratory disorders (7.0%; n=15/214).
Conclusion: This study provides valuable information on the demographics, management and healthcare of
horses with PPID. These results will inform and improve management strategies where there are opportunities
for owner education or a need for increased veterinary involvement.
Acknowledgements: We gratefully acknowledged all participating horse owners. This project was generously
part funded by Boehringer Ingelheim Ltd.
6 4th Global Equine Endocrine Symposium 2020
Steroid hormone profiles of horses with PPID H.C. Schott II,1 M. Aleman,2 M. Chigerwe2, J.E. Madigan2, N. Dybdal3
1Michigan State University, East Lansing, MI; 2University of California, Davis, CA; and 3Genentech Inc., South San Francisco, CA
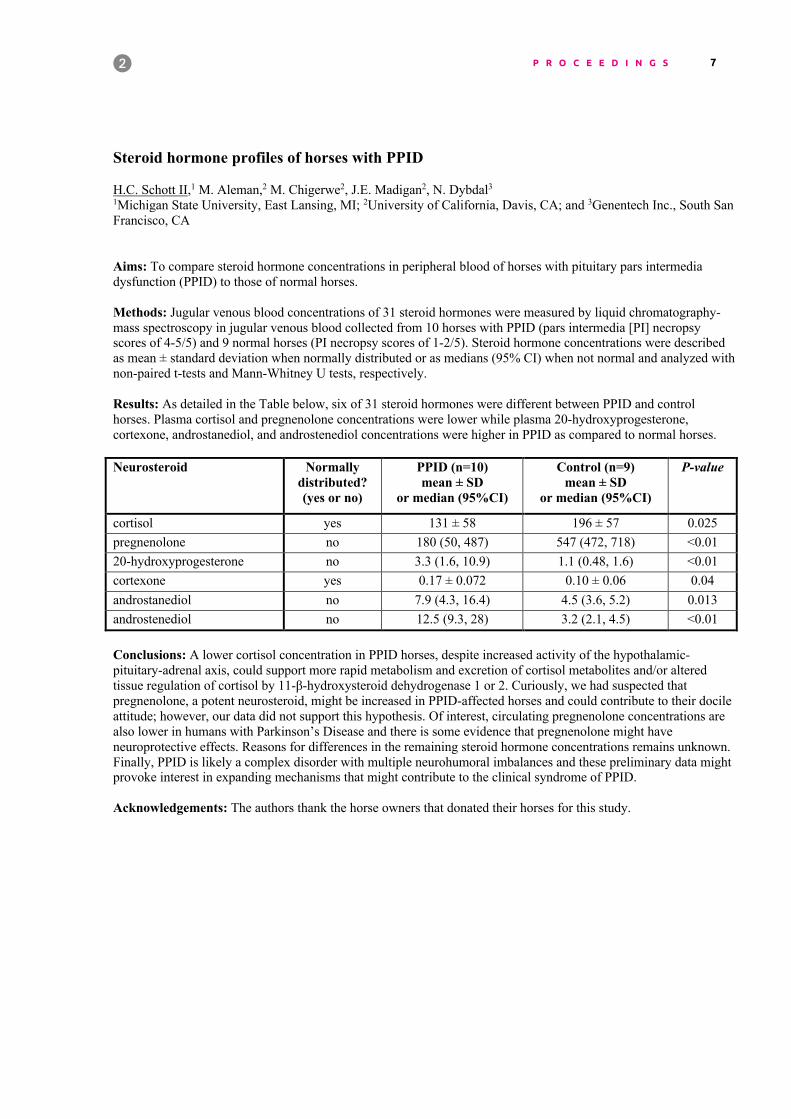
Aims: To compare steroid hormone concentrations in peripheral blood of horses with pituitary pars intermedia dysfunction (PPID) to those of normal horses. Methods: Jugular venous blood concentrations of 31 steroid hormones were measured by liquid chromatography-mass spectroscopy in jugular venous blood collected from 10 horses with PPID (pars intermedia [PI] necropsy scores of 4-5/5) and 9 normal horses (PI necropsy scores of 1-2/5). Steroid hormone concentrations were described as mean ± standard deviation when normally distributed or as medians (95% CI) when not normal and analyzed with non-paired t-tests and Mann-Whitney U tests, respectively. Results: As detailed in the Table below, six of 31 steroid hormones were different between PPID and control horses. Plasma cortisol and pregnenolone concentrations were lower while plasma 20-hydroxyprogesterone, cortexone, androstanediol, and androstenediol concentrations were higher in PPID as compared to normal horses. Neurosteroid Normally
distributed? (yes or no)
PPID (n=10) mean ± SD
or median (95%CI)
Control (n=9) mean ± SD
or median (95%CI)
P-value
cortisol yes 131 ± 58 196 ± 57 0.025 pregnenolone no 180 (50, 487) 547 (472, 718) <0.01 20-hydroxyprogesterone no 3.3 (1.6, 10.9) 1.1 (0.48, 1.6) <0.01 cortexone yes 0.17 ± 0.072 0.10 ± 0.06 0.04 androstanediol no 7.9 (4.3, 16.4) 4.5 (3.6, 5.2) 0.013 androstenediol no 12.5 (9.3, 28) 3.2 (2.1, 4.5) <0.01 Conclusions: A lower cortisol concentration in PPID horses, despite increased activity of the hypothalamic-pituitary-adrenal axis, could support more rapid metabolism and excretion of cortisol metabolites and/or altered tissue regulation of cortisol by 11-β-hydroxysteroid dehydrogenase 1 or 2. Curiously, we had suspected that pregnenolone, a potent neurosteroid, might be increased in PPID-affected horses and could contribute to their docile attitude; however, our data did not support this hypothesis. Of interest, circulating pregnenolone concentrations are also lower in humans with Parkinson’s Disease and there is some evidence that pregnenolone might have neuroprotective effects. Reasons for differences in the remaining steroid hormone concentrations remains unknown. Finally, PPID is likely a complex disorder with multiple neurohumoral imbalances and these preliminary data might provoke interest in expanding mechanisms that might contribute to the clinical syndrome of PPID. Acknowledgements: The authors thank the horse owners that donated their horses for this study.
P R O C E E D I N G S 7

Aims, Methods, Results, Conclusions, Acknowledgements.
A Systematic Review and Meta-analysis on the diagnostic accuracy of baseline ACTH for the diagnosis of PPID in adult horses and ponies.
James C Meyer DVM DACVIM, University of Oxford [email protected]
Aims: The primary objective of this study was to determine the ability of endogenous ACTH (adrenocorticotropic hormone) to differentiate horses with PPID (Pituitary pars intermedia dysfunction) from those without PPID. A secondary objective was to determine the optimal role of endogenous ACTH in the diagnostic approach to PPID.
Methods: A search of four databases (Medline, Scopus, CABI abstracts and Web of Science) for eligible studies was completed. Citations from included studies were searched for eligible studies as well. Inclusion criteria were English language articles which allowed the extraction of numbers of true and false positive and negative results. The included studies measured endogenous ACTH by either radio or chemiluminescence immunoassay. PPID was ascertained using different methods across studies. These included histopathology (4 studies), clinical signs (3 studies) and dynamic endocrine testing (3 studies). Studies were evaluated for methodologic quality using the QUADAS-2 checklist of signaling questions relevant to diagnostic accuracy studies. Pooled sensitivity and specificity were calculated with a bivariate generalized linear mixed model using the exact binomial distribution which accounts for the correlation between sensitivity and specificity as well as the variability of these measures across studies. An SROC (summary receiver operating characteristic) plot of sensitivity vs specificity was produced. Subgroup analysis according to method of PPID ascertainment was performed.
Results: A total of ten studies were eligible for meta-analysis. Study quality was quite variable with more than half the studies at high risk of bias due to the method patient selection for the study. The main risks were due to case control design or selection of patients based upon clinical characteristics. The overall pooled estimates of sensitivity, specificity, positive likelihood ratio (PLR), and negative likelihood ratio (NLR) of baseline ACTH against all reference standards (10 studies) were 68% (95% confidence interval [CI], 57 to 77%), 86% (95% CI, 74 to 93%), 4.9 (95% CI, 2.5 to 9.6), and 0.37 (95% CI, 0.27 to 0.51), respectively. The pooled sensitivity, specificity, PLR, and NLR of baseline ACTH against histopathology (4 studies) were 56% (95% CI, 45 to 67%), 89% (95% CI, 73 to 96%), 5.2 (95% CI, 1.9 to 13.7), and 0.49 (95% CI, 0.38 to 0.64), respectively. The SROC plot and prediction interval demonstrate noticeable heterogeneity of included studies.
Conclusions: The high risk of bias in a number of studies as well as the apparent heterogeneity of studies should lead to a cautious approach in applying the results of this meta-analysis to other equine populations. However, the overall results and those in the reference standard subgroup of histopathology suggest that the specificity of baseline ACTH for the diagnosis of PPID is good while the sensitivity is marginal (lower CI 57%). This would corroborate the current recommendation that baseline ACTH be used as a triage test for PPID with further diagnostics being recommended in patients that test negative.
8 4th Global Equine Endocrine Symposium 2020
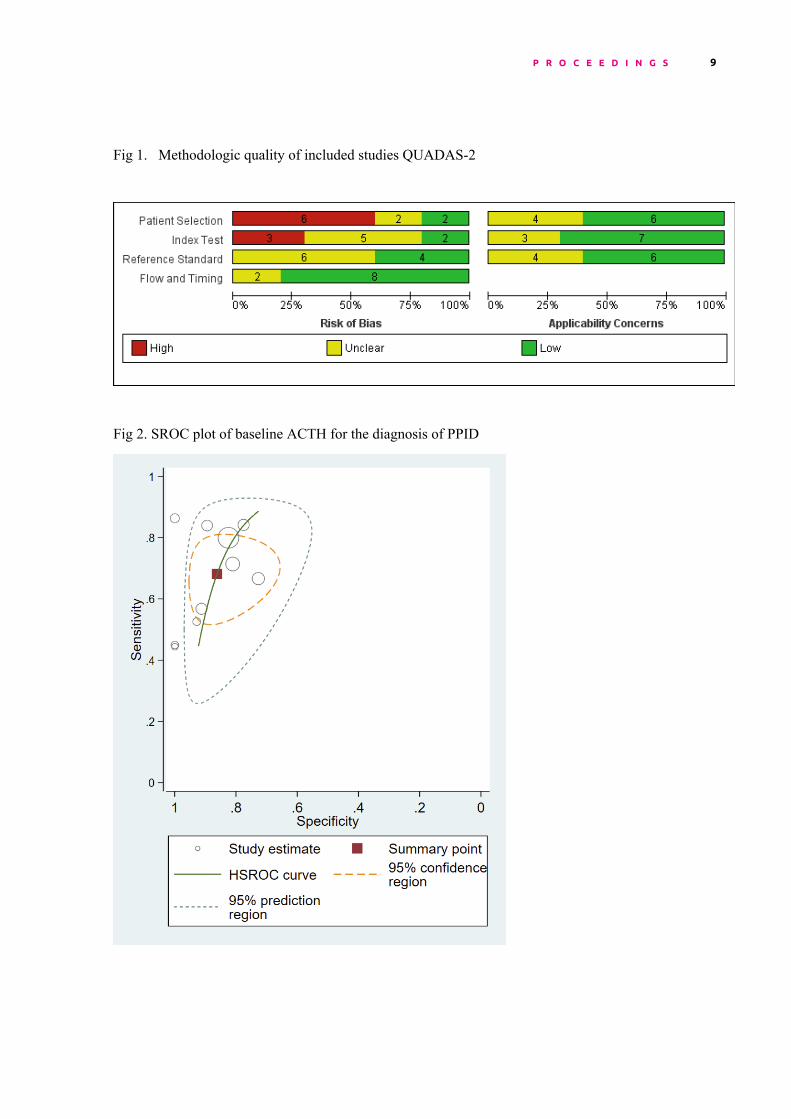
Fig 1. Methodologic quality of included studies QUADAS-2
Fig 2. SROC plot of baseline ACTH for the diagnosis of PPID
Aims, Methods, Results, Conclusions, Acknowledgements.
A Systematic Review and Meta-analysis on the diagnostic accuracy of baseline ACTH for the diagnosis of PPID in adult horses and ponies.
James C Meyer DVM DACVIM, University of Oxford [email protected]
Aims: The primary objective of this study was to determine the ability of endogenous ACTH (adrenocorticotropic hormone) to differentiate horses with PPID (Pituitary pars intermedia dysfunction) from those without PPID. A secondary objective was to determine the optimal role of endogenous ACTH in the diagnostic approach to PPID.
Methods: A search of four databases (Medline, Scopus, CABI abstracts and Web of Science) for eligible studies was completed. Citations from included studies were searched for eligible studies as well. Inclusion criteria were English language articles which allowed the extraction of numbers of true and false positive and negative results. The included studies measured endogenous ACTH by either radio or chemiluminescence immunoassay. PPID was ascertained using different methods across studies. These included histopathology (4 studies), clinical signs (3 studies) and dynamic endocrine testing (3 studies). Studies were evaluated for methodologic quality using the QUADAS-2 checklist of signaling questions relevant to diagnostic accuracy studies. Pooled sensitivity and specificity were calculated with a bivariate generalized linear mixed model using the exact binomial distribution which accounts for the correlation between sensitivity and specificity as well as the variability of these measures across studies. An SROC (summary receiver operating characteristic) plot of sensitivity vs specificity was produced. Subgroup analysis according to method of PPID ascertainment was performed.
Results: A total of ten studies were eligible for meta-analysis. Study quality was quite variable with more than half the studies at high risk of bias due to the method patient selection for the study. The main risks were due to case control design or selection of patients based upon clinical characteristics. The overall pooled estimates of sensitivity, specificity, positive likelihood ratio (PLR), and negative likelihood ratio (NLR) of baseline ACTH against all reference standards (10 studies) were 68% (95% confidence interval [CI], 57 to 77%), 86% (95% CI, 74 to 93%), 4.9 (95% CI, 2.5 to 9.6), and 0.37 (95% CI, 0.27 to 0.51), respectively. The pooled sensitivity, specificity, PLR, and NLR of baseline ACTH against histopathology (4 studies) were 56% (95% CI, 45 to 67%), 89% (95% CI, 73 to 96%), 5.2 (95% CI, 1.9 to 13.7), and 0.49 (95% CI, 0.38 to 0.64), respectively. The SROC plot and prediction interval demonstrate noticeable heterogeneity of included studies.
Conclusions: The high risk of bias in a number of studies as well as the apparent heterogeneity of studies should lead to a cautious approach in applying the results of this meta-analysis to other equine populations. However, the overall results and those in the reference standard subgroup of histopathology suggest that the specificity of baseline ACTH for the diagnosis of PPID is good while the sensitivity is marginal (lower CI 57%). This would corroborate the current recommendation that baseline ACTH be used as a triage test for PPID with further diagnostics being recommended in patients that test negative.
P R O C E E D I N G S 9
Temporally-specific diagnostic thresholds for plasma ACTH in the horse.
Andy Durham1, Brenton Clarke2, Julie Potier1 and Robert Hammerstrand2
1The Liphook Equine Hospital, Liphook, Hampshire, GU30 7JG, UK; 2College of Science, Health, Engineering and Education, Murdoch University, WA 6150, Australia.
Work conducted at both institutions
The work follows international, national, and/or institutional guidelines for humane animal treatment and complies with relevant legislation in the country in which the study was conducted.
The abstract has not been presented previously
Aims
To derive temporally specific diagnostic thresholds for equine plasma ACTH concentration applicable throughout the entire year and applicable to different clinical scenarios.
Methods
Laboratory submissions requesting ACTH analysis between 2012 and 2018 were screened to remove cases where no history was given, where previous ACTH analysis had been performed or where cases were currently being medicated for PPID. Natural logarithms of plasma ACTH concentrations from included cases were examined using robust 𝐿𝐿" estimation of mixtures of two normal distributions to generate means and standard deviations of 2 separate populations (non-PPID and PPID). These were examined further in weekly categories and thresholds were calculated dividing the two populations of subjects using two graphs-receiver operating characteristic (TG-ROC) analysis yielding thresholds with high (95%) sensitivity, high (95%) specificity and balanced sensitivity and specificity.
Results
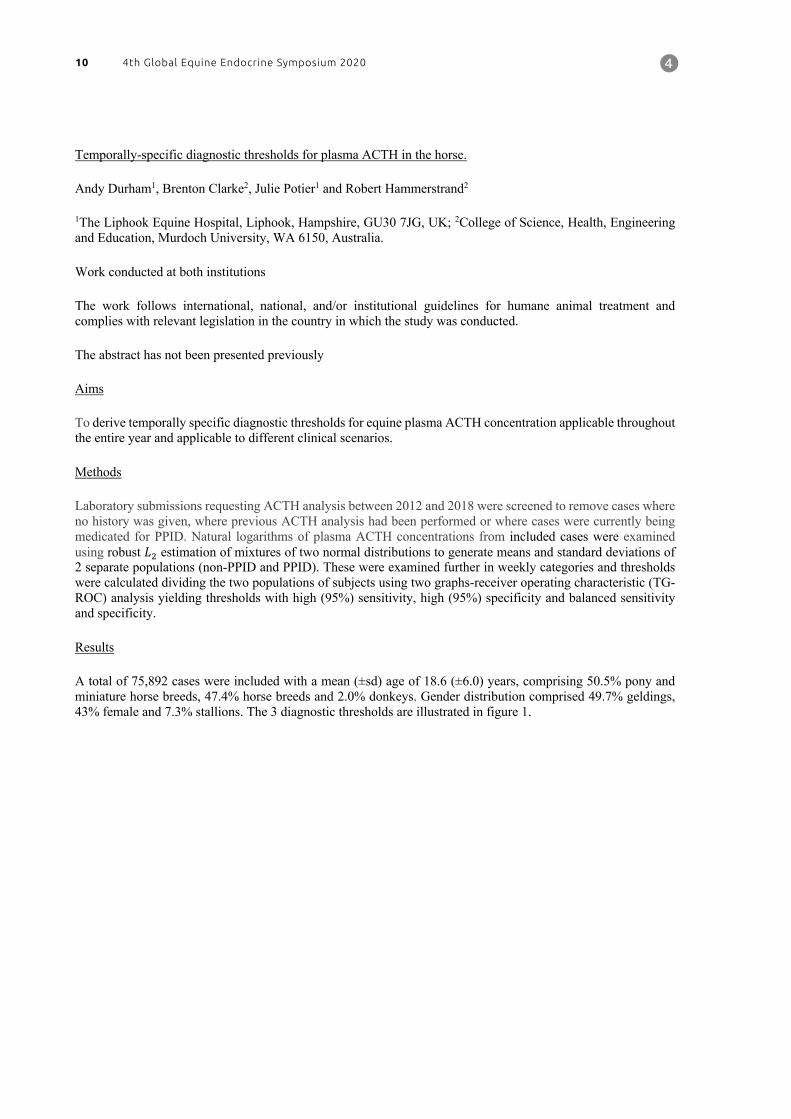
A total of 75,892 cases were included with a mean (±sd) age of 18.6 (±6.0) years, comprising 50.5% pony and miniature horse breeds, 47.4% horse breeds and 2.0% donkeys. Gender distribution comprised 49.7% geldings, 43% female and 7.3% stallions. The 3 diagnostic thresholds are illustrated in figure 1.
0,0
10,0
20,0
30,0
40,0
50,0
60,0
70,0
80,0
90,0
100,0
110,0
120,0
1 2 3 4 5 6 7 8 9 10111213141516171819202122232425262728293031323334353637383940414243444546474849505152
plas
ma
ACTH
pg/
mL
week
10 4th Global Equine Endocrine Symposium 2020
Temporally-specific diagnostic thresholds for plasma ACTH in the horse.
Andy Durham1, Brenton Clarke2, Julie Potier1 and Robert Hammerstrand2
1The Liphook Equine Hospital, Liphook, Hampshire, GU30 7JG, UK; 2College of Science, Health, Engineering and Education, Murdoch University, WA 6150, Australia.
Work conducted at both institutions
The work follows international, national, and/or institutional guidelines for humane animal treatment and complies with relevant legislation in the country in which the study was conducted.
The abstract has not been presented previously
Aims
To derive temporally specific diagnostic thresholds for equine plasma ACTH concentration applicable throughout the entire year and applicable to different clinical scenarios.
Methods
Laboratory submissions requesting ACTH analysis between 2012 and 2018 were screened to remove cases where no history was given, where previous ACTH analysis had been performed or where cases were currently being medicated for PPID. Natural logarithms of plasma ACTH concentrations from included cases were examined using robust 𝐿𝐿" estimation of mixtures of two normal distributions to generate means and standard deviations of 2 separate populations (non-PPID and PPID). These were examined further in weekly categories and thresholds were calculated dividing the two populations of subjects using two graphs-receiver operating characteristic (TG-ROC) analysis yielding thresholds with high (95%) sensitivity, high (95%) specificity and balanced sensitivity and specificity.
Results
A total of 75,892 cases were included with a mean (±sd) age of 18.6 (±6.0) years, comprising 50.5% pony and miniature horse breeds, 47.4% horse breeds and 2.0% donkeys. Gender distribution comprised 49.7% geldings, 43% female and 7.3% stallions. The 3 diagnostic thresholds are illustrated in figure 1.
0,0
10,0
20,0
30,0
40,0
50,0
60,0
70,0
80,0
90,0
100,0
110,0
120,0
1 2 3 4 5 6 7 8 9 10111213141516171819202122232425262728293031323334353637383940414243444546474849505152
plas
ma
ACTH
pg/
mL
week
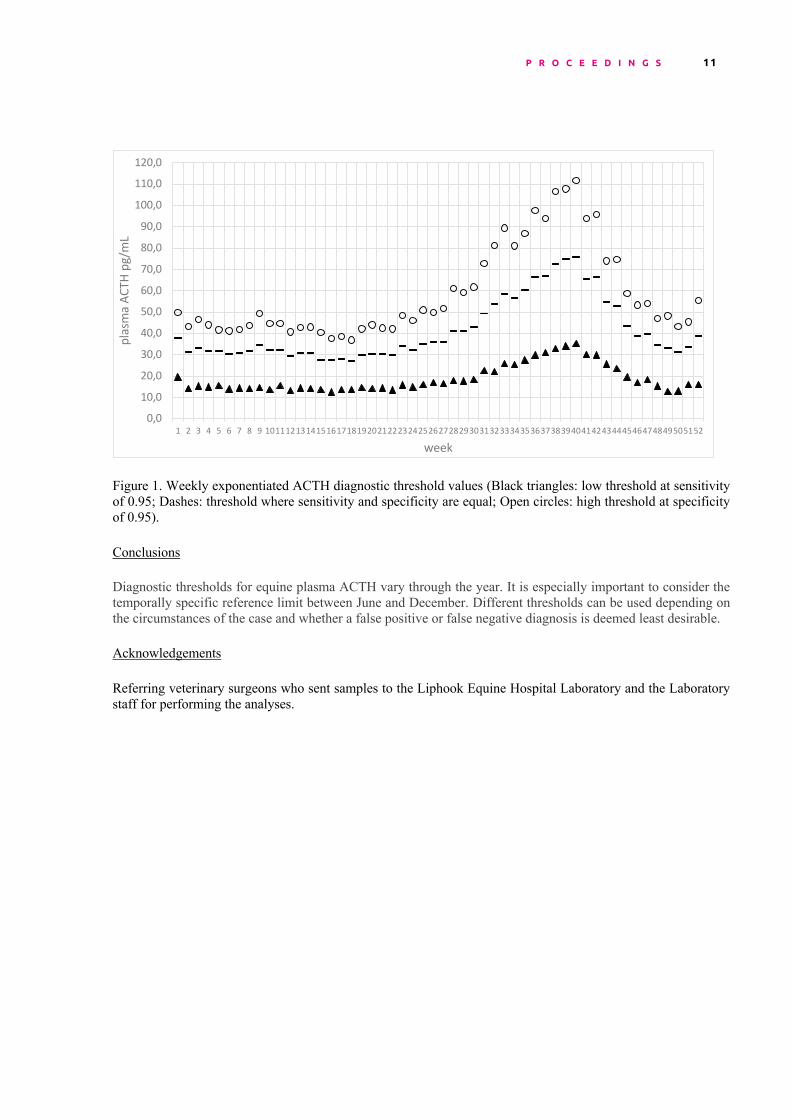
Figure 1. Weekly exponentiated ACTH diagnostic threshold values (Black triangles: low threshold at sensitivity of 0.95; Dashes: threshold where sensitivity and specificity are equal; Open circles: high threshold at specificity of 0.95).
Conclusions
Diagnostic thresholds for equine plasma ACTH vary through the year. It is especially important to consider the temporally specific reference limit between June and December. Different thresholds can be used depending on the circumstances of the case and whether a false positive or false negative diagnosis is deemed least desirable.
Acknowledgements
Referring veterinary surgeons who sent samples to the Liphook Equine Hospital Laboratory and the Laboratory staff for performing the analyses.
P R O C E E D I N G S 11

Seasonal variation in adrenocorticotropic hormone (ACTH) concentrations and dexamethasone suppression tests in ponies and Andalusian horses compared with Standardbreds NJ Bamford,a PA Harris,b SR Baileya aMelbourne Veterinary School, The University of Melbourne, Parkville, Victoria, Australia. bEquine Studies Group, WALTHAM Centre for Pet Nutrition,Melton Mowbray, Leicestershire, UK. Presenting author: Simon Bailey; [email protected] Aims: This study aimed to determine the seasonal changes in adrenocorticotropic hormone (ACTH) and responses to dexamethasone suppression tests in Andalusian horses (EMS-prone breed) compared with ponies and Standardbred horses (control group). Methods: The study involved healthy adult animals (5-15 years old) showing no signs of PPID. Six ponies (mixed breed), six Andalusian horses and six Standardbred horses were sampled on 10 occasions over an 18 month period for ACTH analysis (EDTA blood samples placed on ice, centrifuged within 1 hour and plasma stored at -80°C; measured by chemiluminescent immunoassay [Immulite 1000]). A standard 19hr overnight low-dose dexamethasone suppression test (0.04 mg/kg dexamethasone IM) was performed in spring, summer autumn and winter. Suppression of plasma cortisol to below 25 nmol/L was considered a normal result. Results: Seasonal changes in ACTH were observed in all 3 groups, with the greatest changes observed in ponies and Andalusian horses (autumnal median of 73.1 pg/mL for ponies [range 45.5-146] and 63.5 pg/mL in Andalusians [range 38.7-84.8], compared to 35.8 pg/mL [29.4-67.6] in Standardbreds; P<0.05, ponies vs Standardbreds). One normal pony had an ACTH of 146 pg/mL in March (autumn) and returned to 17.9 pg/mL in May. Breed differences appeared to be most marked in the autumn sampling period. The results of the dexamethasone tests suggested that dexamethasone failed to suppress cortisol to below 25 nmol/L in 3 out of 6 ponies and 5 out of 6 Andalusian horses during March (autumn), while all 6 Standardbreds suppressed normally. All animals responded normally in the spring, summer and winter. Conclusions: There may be breed differences in ACTH levels in normal animals and in the response to dexamethasone suppression tests and these differences are more marked during the autumn. Care should be taken when evaluating the results of ACTH tests in ponies and EMS-prone horse breeds in the autumn months, and the dexamethasone suppression test may not be robust for diagnosing PPID particularly in these groups of equids during the autumn. Acknowledgements: Funded by the Australian Research Council and the WALTHAM Centre for Pet Nutrition.
12 4th Global Equine Endocrine Symposium 2020
The Effect of Trailering and Dentistry on Resting Adrenocorticotropic Hormone
Concentration in Horses
1J.C. Haffner, 1R.M. Hoffman and 2S.T. Grubbs 1Middle Tennessee State University, Murfreesboro, TN,
2 Boehringer Ingelheim Animal Health USA, Inc., Duluth, GA
Aims:
Pituitary pars intermedia dysfunction (PPID) may affect >20% of horses aged ≥15 years. The measurement of
adrenocorticotropic hormone (ACTH) is the most commonly used diagnostic test used for the diagnosis of horses
with PPID. The diagnosis of PPID is supported by a plasma ACTH concentration greater than the seasonally
adjusted reference range. However, several studies have concluded that pain, stress and concurrent illness were only
likely to affect diagnostic usefulness of resting ACTH when severe. The objective of this study was to identify if
trailering or teeth floating (common stressful situations/procedures) increased plasma ACTH concentrations in
horses.
Methods:
Twelve horses were enrolled and randomized into 3 groups of 4 horses/group. Each horse group was randomly
assigned to the initial treatment group, dentistry (DN), trailered (TR) or stabled controls (CN). Following initial
treatment, each horse group was randomly assigned to each of the two remaining treatment groups; therefore, each
horse group underwent all 3 treatments. Plasma was collected from all horses prior to each treatment (baseline). The
DN horses were placed in stocks, sedated with 0.1 to 0.3 mg/lb xylazine IV and following mouth speculum
placement, teeth were floated with a PowerFloat®. The TR group was loaded on a six-horse slant trailer and hauled
for 40 minutes. Immediately following the dental procedure and trailer ride, post-procedure (P0) plasma samples
were collected. Plasma samples were then collected from all horses at 15, 30, 60 and 120 minutes post-procedure.
Plasma samples from the CN horses were taken when the trailered horses returned. Plasma samples were frozen (-
80C) until analysis at Cornell Animal Health Diagnostic Center. Data were analyzed using a mixed model with
repeated measures (i.e., each horse as its own control), with main effects of treatment (CN, DN, TR) and time, and
day × time as the repeated effect. Statistical significance was designated at P < 0.05, and 0.05 < P < 0.10 was
considered a trend. Data were summarized as mean ± SE.
Results:
No change occurred in ACTH over time in the CN or DN horses (P = 0.14). ACTH was higher in TR compared to
CN (P = 0.026) and DN (P = 0.016) horses. In TR horses, ACTH was higher than baseline (PRE) immediately after
(T0; P = 0.0003) and tended to be higher (P = 0.066) at 15 min after trailering. By 30 min post-trailering, there were
no differences in mean resting ACTH compared to PRE concentrations (P = 0.55).
Conclusions:
No significant difference in resting ACTH concentrations over time was observed in horses undergoing dentistry
procedure compared to baseline. A forty-minute trailer ride resulted in significantly increased resting ACTH
concentrations in horses up to 30 min post-unloading. Based on results of this study, collecting blood from horses
within 30 minutes from trailer unloading may result in elevated resting ACTH concentrations.
Acknowledgments: The authors would like to acknowledge Boehringer Ingelheim Animal Health and Middle Tennessee State
University Horse Science Center for supporting this work.
Presenting author:
John C. Haffner DVM
314 W. Thompson Lane
Murfreesboro, TN. USA
email: [email protected]
This study was conducted at the Middle Tennessee State University Horse Science Center in Murfreesboro,
Tennessee USA. It was approved by the MTSU Institutional Animal Care and Use Committee under protocol #19-
2008.
This material has not been presented elsewhere.
P R O C E E D I N G S 13

Comparison of autumnal adrenocorticotropic hormone (ACTH) concentrations between apparently
healthy horses and ponies
NJ Bamford,a FR Bertin,
b CM El-Hage,
a AJ Stewart,
b SR Bailey
a
aMelbourne Veterinary School, The University of Melbourne, Parkville, Victoria, Australia.
bSchool of Veterinary Science, The University of Queensland, Gatton, Queensland, Australia.
Presenting author: Nicholas Bamford; [email protected]
Aims: This study aimed to determine whether there are differences in adrenocorticotropic hormone (ACTH)
concentrations between apparently healthy horses and ponies during autumn.
Methods: Properties inside a 100km radius of Melbourne, Australia, were visited within 2 weeks of the autumn
equinox. Inclusion criteria comprised: ≥10 years of age; any sex; no apparent clinical signs associated with
pituitary pars intermedia dysfunction (PPID); no concurrent illness, laminitis or drug administration; and no
historical administration of pergolide mesylate. Ponies were defined as any known pony breed (<14.2 hands)
excluding miniature breeds. Horses included only Thoroughbreds and Standardbreds (no cross-breeds or
warmbloods). Blood samples were collected into Vacutainer tubes containing EDTA, immediately chilled,
centrifuged within 4 hours, and stored at -80°C. ACTH concentrations were measured using a validated
chemiluminescent immunoassay (Immulite 1000).
Results: Results were obtained for 143 ponies (median age 14 years; range 10 – 32; 94 mares, 31 geldings, 18
stallions) and 121 horses (median age 15 years; range 10 – 30; 58 mares, 53 geldings, 10 stallions). ACTH
concentrations were significantly different between ponies (median 87.9 pg/ml; IQR 50.0–146 pg/ml) and
horses (median 42.6 pg/ml; IQR 33.3–64.3 pg/ml) at this time of year (P<0.001).
Conclusions: A clear difference in ACTH concentrations between apparently healthy horses and ponies during
autumn was demonstrated. Further work is required to determine breed-appropriate seasonally-adjusted
reference intervals and clinical cut-off values.
Acknowledgements: Supported by Early Career Researcher funding from the Melbourne Veterinary School.
14 4th Global Equine Endocrine Symposium 2020

The effect of latitude and breed on circannual ACTH concentrations in the UK. Julie Potier, Andy Durham The Liphook Equine Hospital, Forest Mere, Portsmouth road, Liphook, Hampshire GU30 7JG, UK Institution where the research was performed : The Liphook Equine Hospital Laboratory, Forest Mere, Portsmouth road, Liphook, Hampshire GU30 7JG, UK This work follows international guidelines for humane animal treatment and complies with relevant legislation in the country in which the study was conducted. The abstract has not been presented previously. Aims : To evaluate the effect of latitude and breed on equine plasma ACTH concentrations in the UK. Methods : Laboratory records were examined from all blood samples submitted to the Liphook Equine Hospital Laboratory for plasma ACTH analysis between 2014 and 2018. Data were excluded from repeat tests and individuals on treatment, as well as the ones with no clinical history declared. To evaluate the latitude, samples were only included in the final analysis if the post code of the submitting practice contacted the south coast of England (including Jersey) (comprising latitudes between 49.18 N and 51.34 N) and also where the post code of the submitting practice was in Scotland (comprising latitudes between 55.00 and 58.68 N). To assess the breed effect, data was only included in the final analysis if the breed was stated, and indicative of purebred horses, ponies and donkeys. A Mann-Whitney test was performed to compare the monthly median ACTH between samples from southern England and from Scotland. The median ACTH data was also plotted by month for each breed and the Kruskall Wallace test with Dunn’s post-test comparison was used to compare across monthly medians for each breed. Results : A total of 10,510 samples from southern England and 6,375 from Scotland were included and compared (Figure 1). There was a slightly but significantly higher median ACTH in Scottish samples in July (median [IQR] England 35.4 pg/mL [23.2-65.4], Scotland 37.3 pg/mL [24.4-88.1], P=0.034), and also a significantly higher median ACTH in English samples in September (median [IQR] England 87.6 pg/mL [46.0-211], Scotland 72.0 pg/mL [39.8-177], P=0.002).
P R O C E E D I N G S 15
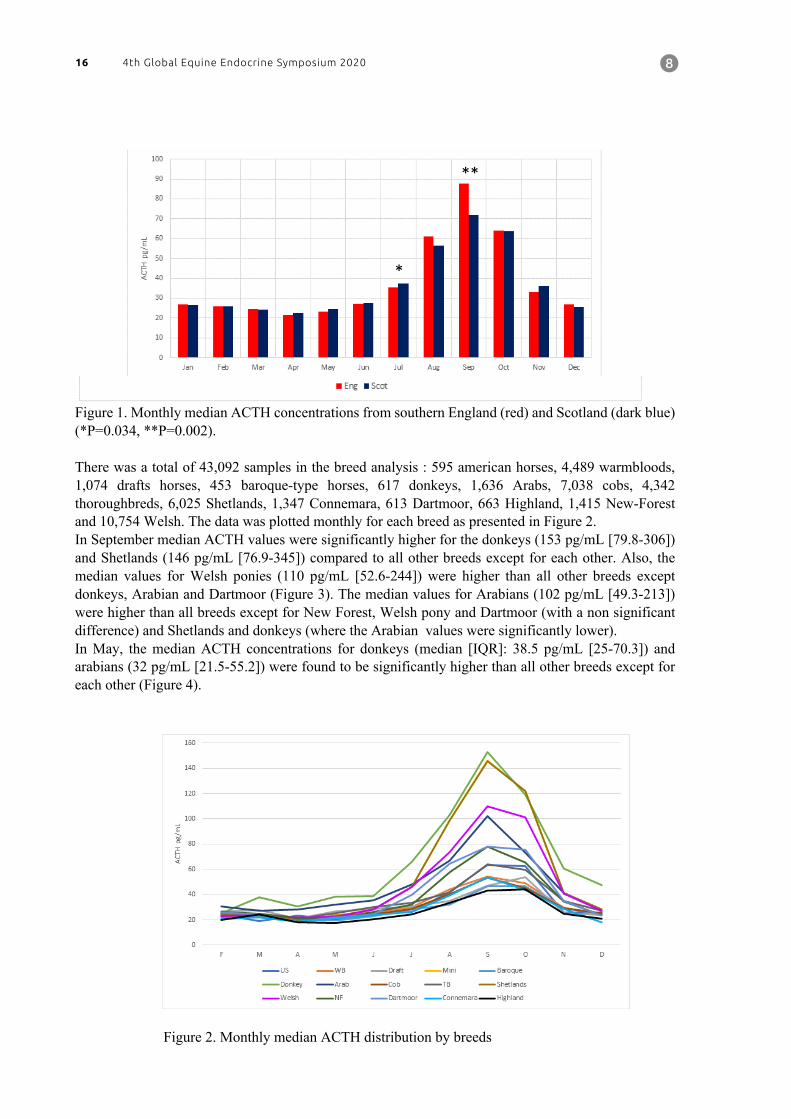
Figure 1. Monthly median ACTH concentrations from southern England (red) and Scotland (dark blue) (*P=0.034, **P=0.002). There was a total of 43,092 samples in the breed analysis : 595 american horses, 4,489 warmbloods, 1,074 drafts horses, 453 baroque-type horses, 617 donkeys, 1,636 Arabs, 7,038 cobs, 4,342 thoroughbreds, 6,025 Shetlands, 1,347 Connemara, 613 Dartmoor, 663 Highland, 1,415 New-Forest and 10,754 Welsh. The data was plotted monthly for each breed as presented in Figure 2. In September median ACTH values were significantly higher for the donkeys (153 pg/mL [79.8-306]) and Shetlands (146 pg/mL [76.9-345]) compared to all other breeds except for each other. Also, the median values for Welsh ponies (110 pg/mL [52.6-244]) were higher than all other breeds except donkeys, Arabian and Dartmoor (Figure 3). The median values for Arabians (102 pg/mL [49.3-213]) were higher than all breeds except for New Forest, Welsh pony and Dartmoor (with a non significant difference) and Shetlands and donkeys (where the Arabian values were significantly lower). In May, the median ACTH concentrations for donkeys (median [IQR]: 38.5 pg/mL [25-70.3]) and arabians (32 pg/mL [21.5-55.2]) were found to be significantly higher than all other breeds except for each other (Figure 4).
*
**
Figure 2. Monthly median ACTH distribution by breeds
Figure 3. September ACTH distributions by breed
Sept ACTH
ACTH
pg/
mL
Highland
Baroque
Draught Cob
Conne
mara
Warmblo
od
Thoroug
hbred
New Fores
t
Dartmoor
Arab
Welsh Pony
Shetla
nd
Donke
y0
100
200
300
400
Figure 2. Monthly median ACTH distribution by breeds
Figure 3. September ACTH distributions by breed
Sept ACTH
ACTH
pg/
mL
Highland
Baroque
Draught Cob
Conne
mara
Warmblo
od
Thoroug
hbred
New Fores
t
Dartmoor
Arab
Welsh Pony
Shetla
nd
Donke
y0
100
200
300
400
16 4th Global Equine Endocrine Symposium 2020

Figure 2. Monthly median ACTH distribution by breeds
Figure 3. September ACTH distributions by breed
Sept ACTH
ACTH
pg/
mL
Highland
Baroque
Draught Cob
Conne
mara
Warmblo
od
Thoroug
hbred
New Fores
t
Dartmoor
Arab
Welsh Pony
Shetla
nd
Donke
y0
100
200
300
400
Figure 2. Monthly median ACTH distribution by breeds
Figure 3. September ACTH distributions by breed
Sept ACTHAC
TH p
g/m
L
Highland
Baroque
Draught Cob
Conne
mara
Warmblo
od
Thoroug
hbred
New Fores
t
Dartmoor
Arab
Welsh Pony
Shetla
nd
Donke
y0
100
200
300
400
Figure 4. May ACTH distributions by breed Conclusion : The differences in ACTH observed, especially in September, may be important to consider when diagnosing horses with PPID in different latitudes within the UK as the autumnal peak of plasma ACTH is lower in Scotland than in southern England. Also, the difference between breeds in the autumn, should be taken in consideration when using ACTH to diagnose PPID. Higher values are characteristic of donkeys, Shetland ponies, Welsh ponies and Arabian horses. Acknowledgements : Referring veterinary surgeons who sent samples to the Liphook Equine Hospital Laboratory and the Laboratory staff for performing the analyses.
May ACTH
ACTH
pg/
mL
Highland
Baroque
Draught Cob
Conne
mara
Warmblo
od
Thoroug
hbred
New Fores
t
Dartmoor
Arab
Welsh Pony
Shetlan
d
Donke
y0
20
40
60
80
P R O C E E D I N G S 17

Title: The effect of freeze-thaw cycles on the determination of immunoreactive adrenocorticotrophic hormone
concentrations in horses
Presenting author: François-René Bertin; School of Veterinary Science The University of Queensland Gatton,
Queensland 4343 Australia; [email protected]
Other authors: Ke Hu, Allison J. Stewart, Ka Y. Yuen, Sophia Hinrichsen, Elizabeth L. Dryburgh
Institutional details: The University of Queensland Gatton, Queensland 4343 Australia
Ethical animal research: The study was approved by the institutional animal ethics committee of the School of
Veterinary Science, the University of Queensland (SVS/474/17)
Previous presentation: The abstract has never been presented at a conference
Abstract:
Aims: Determine the effects of multiple freeze-thaw cycles on immunoreactive ACTH concentration in horses
with and without pituitary pars intermedia dysfunction (PPID) at baseline or following a thyrotropin-releasing
hormone (TRH) stimulation test.
Methods: Twenty-eight horses ranging from 10 to 27 years of age were divided into 4 groups: Group 1, PPID
negative, without TRH stimulation; Group 2, PPID negative, with TRH stimulation; Group 3, PPID positive,
without TRH stimulation and Group 4, PPID positive, with TRH stimulation. Whole blood was collected from
each horse at baseline or 30 min after TRH stimulation and immunoreactive ACTH concentration was
determined after plasma separation using a chemiluminescent assay. Samples were then frozen at –80°C for
over 24 h, thawed at 4°C and re-analysed for 5 cycles. Percentages of change in ACTH concentrations were
analysed using a linear mixed effect model.
Results: There were significant effects of freeze-thaw cycles and PPID status on ACTH concentration but no
significant effect of TRH stimulation. Freezing and thawing samples resulted in a significant decrease in
immunoreactive ACTH concentration in control horses after 3 cycles while in PPID horses, a significant effect
was detected after the first cycle.
Conclusions: ACTH concentration is altered by freeze-thaw cycles and the effect is observed sooner in PPID
horses. Multiple pre-analysis freezing-thawing cycles should be avoided when measuring ACTH.
Acknowledgements: The study was funded by Boehringer-Ingelheim Pty Ltd. and the School of Veterinary
Science, The University of Queensland (Master of Veterinary Science research project scheme).
18 4th Global Equine Endocrine Symposium 2020

ACTH stability in frozen equine plasma
Heidi Banse1, Ann Chapman
1, Nicole Hazard
2, Jon Fletcher
1,2
1Department of Veterinary Clinical Sciences, Louisiana State University
2Veterinary Endocrinology Laboratory, Louisiana Animal Disease Diagnostic Lab
Corresponding author: Heidi Banse, [email protected]
Aims: Although ACTH is commonly used in diagnosis of PPID, long term stability of ACTH in frozen equine
plasma remains unknown. The aim of this study was to evaluate ACTH stability in frozen plasma following long
term storage.
Methods: This study was approved by the Institutional Animal Care and Use Committee at Louisiana State
University. Fifty-one equids were included in the study. Breeds represented included Quarter Horse (n=16),
Thoroughbred (n=15), Shetland ponies (n=12), Tennessee Walking Horses (n=4), and one each of Pony of America,
Standardbred, Missouri Foxtrotter, and unknown. Age of included equids ranged from 15-26 years with 35 mares,
15 geldings, and 1 stallion. Blood samples were collected from four cohorts of horses between June 11 and August
20. Plasma samples were batch analyzed based upon date of collection using an Immulite 1000 on the day of
collection, frozen at -80 C, and analyzed at 6 and 12 months after collection.
Results: Based upon an initial TRH stimulation test cut-off value of >200 pg/ml, 17 equids had concentrations above
the reference interval. Based upon a resting ACTH concentration of 50 pg/ml, twelve equids were above the
reference interval. Concentrations were compared over time among all T0 and T10 (post TRH) samples using a
Friedman test, and then further divided into groups based upon concentrations considered to be normal or above the
reference interval. Overall, there were no significant differences over time in T0 samples (p=0.07) but ACTH
concentrations did decrease over time in T10 samples (p<0.0001) between baseline and 6 months (p=0.0002) and
baseline and twelve months (p<0.0001). When dividing results between horses with values above the reference
interval or within the reference interval, those horses with values above the reference interval had T0 differences
between 6 months and 12 months (p=0.04) and T10 differences between baseline and 12 months (p<0.0001) and 6
months and 12 months (p=0.04). However, there were no differences over time in control horses from baseline to
12 months in T0 samples (p=0.68) or T10 samples (p=0.2).
Conclusions: These findings suggest that measured ACTH is not stable over time in frozen plasma from horses with
ACTH above the reference interval (both resting and stimulated), which may impact diagnosis of PPID in borderline
cases.
Acknowledgments: This study was funded by Boehringer Ingelheim Animal Health. This data has not been
previously presented.
P R O C E E D I N G S 19

Development and Evaluation of a Clinical Sign Scoring System
For Pituitary Pars Intermedia Dysfunction in Horses
1Grubbs S.T,
1Neal D.L., and
2Keefe T.J.
1. Boehringer Ingelheim Animal Health USA Inc., Duluth, GA
2. Colorado State University, Fort Collins, CO
Aims:
Pituitary pars intermedia dysfunction (PPID) has been described as the most common endocrinologic disorder of
aged horses. The diagnosis consists of information obtained from current history, a physical examination to
document clinical signs associated with PPID, and then to confirm these findings, diagnostically evaluate
adrenocorticotropic hormone (ACTH). In many horses with reported PPID associated signs, results of ACTH
evaluation were within normal reference range. It is possible that veterinarians were testing horses without clinical
signs or with very subtle PPID-associated signs. In addition, certain PPID-associated signs, by themselves, may not
be predictive of disease. Based on this dilemma, the purpose of this study was to obtain epidemiological information
from a large population of horses, and then develop a clinical sign score (CSS) based on odds ratios.
Methods:
In all, 2,989 horses exhibiting one or more of the typical signs of PPID were enrolled in the study. At initial visit, a
physical examination was conducted and blood drawn for basal adrenocorticotropic hormone (ACTH), insulin, and
glucose. All samples were centrifuged, plasma shipped overnight and analyzed for ACTH, insulin, and glucose by
the Animal Health Diagnostic Center, Cornell University, Ithaca, NY. The association between PPID status, based
on ACTH results, and each of the demographic variables and test results for insulin and glucose were statistically
evaluated individually using the Pearson chi-square test and collectively using multiple logistic regression analysis
of PPID to provide odds ratios for PPID associated with the clinical signs. The CSS is the product of the odds ratios
for PPID vs. all clinical signs collectively. Based on statistical analyses of the CSS data, a value of 1.5 for the CSS
was selected as a cut-off for predicting PPID status. The higher the CSS the more likely a horse was PPID+.
Results:
Clinical sign scores ranged from 0.60 to 5.51, with an overall geometric mean of 1.59. Using this model in the non-
fall months, the CSS score with an ACTH cut-off of 35 pg/mL (or 50pg/dL) had a sensitivity of 68.3% (70.9%) and
a specificity of 58.5% (52.6%). During the fall months using an ACTH cut-off of 100 pg/mL, the CSS had a 69.4%
sensitivity and a 62.3% specificity. Based on this population of horses, delayed shedding and abnormal sweating
were significant predictors of PPID+ status. Although pot-belly/weight gain, regional adiposity, excessive thirst and
recurrent infections are considered to be associated with PPID, odds ratios for each were <1.0.
Conclusions:
The CSS may be a viable option for veterinary practitioners to utilize to determine if evaluation of ACTH in a
particular horse is necessary. For example, based on the results of this study, if only one of the following clinical
signs are present: potbelly/weight gain, regional adiposity, excessive thirst or recurrent infections; evaluation of
ACTH for PPID is not recommended. Additional field-based studies are essential to further evaluate the sensitivity
and specificity of the CSS for PPID in horses.
Acknowledgments:
The authors would like to acknowledge Boehringer Ingelheim Animal Health, Duluth, GA for supporting this work.
20 4th Global Equine Endocrine Symposium 2020

Comparison of muscle mass and skeletal muscle proteolysis in aged horses with and
without PPID
Heidi Banse1, Ashley Whitehead
2, Dianne McFarlane
3, Prasanth Chelikani
2
1Department of Veterinary Clinical Sciences, Louisiana State University; [email protected]
2Faculty of Veterinary Medicine, University of Calgary
3Department of Physiological Sciences, Oklahoma State University
Aims: Muscle atrophy is a common clinical sign of PPID. To date, mechanisms contributing to muscle atrophy in
horses with PPID remain poorly understood. The aim of this study was to identify mechanisms of skeletal muscle
proteolysis that contribute to PPID-associated muscle atrophy.
Methods: This study was approved by the Animal Care and Use Committee at the University of Calgary. Twelve
PPID horses and seven aged (≥15 years) control horses were included in this study. ACTH response to TRH
stimulation, insulin response to an oral sugar test, and body condition score were evaluated. Ultrasound was used to
measure epaxial muscle and gluteal fat thickness. Epaxial muscle biopsies were evaluated for expression of
transcriptional regulators of skeletal muscle proteolysis, including regulators of the ubiquitin-proteasome system
(Muscle RING Finger-1, MuRF-1; atrogin-1), and the lysosome-autophagy system (Bcl2/adenovirus EIV 19kD
interacting protein 3; BNIP3 and microtubule-associated light chain 3, LC3), and muscle biopsy lean and fat mass
(using LF110® Bruker NMR). Gene expression and hormone concentrations were log transformed for analysis, and
data were analyzed using a Mann-Whitney U test (body condition score) or Student’s t-test.
Results: PPID horses were similar in age to control horses (p=0.051). As expected, ACTH (p=0.01) and ACTH
response to TRH (p=0.0025) were increased in horses with PPID compared to aged control horses. Body condition
score (p=0.45),and insulin before (p=0.81) and after (p=0.40) an oral sugar test did not differ between groups. PPID
horses had decreased epaxial muscle thickness (p=0.04) compared to aged control horses. There was no difference
in gluteal fat thickness (p=0.34), or biopsy lean (p=0.07) or fat mass (p=0.08) between groups. MuRF-1 (p=0.04)
was upregulated with PPID, but there were no differences between groups in atrogin-1 (p=0.08), Bnip (p=0.46) or
LC3 (p=0.12).
Conclusions: These findings support that PPID-associated skeletal muscle atrophy may in part be due to
upregulation of the ubiquitin-proteasome system.
Acknowledgments: This study was funded in part by Boehringer-Ingelheim Animal Health and in part by the
University of Calgary. This data has not been previously presented.
P R O C E E D I N G S 21

Title: The repeatability of the thyrotropin-releasing hormone stimulation test for the diagnosis of pituitary pars
intermedia dysfunction
Presenting author: François-René Bertin; School of Veterinary Science The University of Queensland Gatton,
Queensland 4343 Australia; [email protected]
Other authors: Kelly McKenzie
Institutional details: The University of Queensland Gatton, Queensland 4343 Australia
Ethical animal research: The study was approved by the institutional animal ethics committee of the School of
Veterinary Science, the University of Queensland (SVS/276/18)
Previous presentation: The abstract has never been presented at a conference
Abstract:
Aims: Determine the repeatability of the thyrotropin-releasing hormone (TRH) stimulation test in horses with
and without pituitary pars intermedia dysfunction (PPID).
Methods: Fifteen horses ranging from 11 to 25 years of age (10 controls and 5 PPID horses), underwent two
TRH stimulation tests. The first test was performed 3 days before the winter solstice (week 1) and the second
test 6 days later (week 2). Blood was collected at baseline and 30 minutes post-TRH stimulation.
Adrenocorticotropic hormone (ACTH) concentration was determined using a chemiluminescent assay. Data
were compared by 2-way repeated measures ANOVA. Coefficients of variation were calculated for each group
at both times of testing and Bland-Altman plots were generated to visualize agreement between tests.
Results: In controls, there was a significant TRH stimulation effect on ACTH concentration; however, this
effect was not detected in PPID horses. In controls, there was a significant week effect on ACTH concentration
with significantly lower values recorded post-TRH stimulation on week 2; however, this effect was not detected
in PPID horses. The coefficients of variation [95% confidence intervals] were 9.0 [1.4–29.3]% for baseline in
controls, 21.5 [3.1–37.6]% for post-TRH stimulation in controls, 11.3 [4.4–85.3]% for baseline in PPID horses
and 18.1 [6.6–83.0]% for post-TRH stimulation in PPID horses. Bland-Altman plots supported the limited
repeatability of the test.
Conclusions: The TRH stimulation test has a limited repeatability when performed 6 days apart, around the
winter solstice. Careful interpretation of post-TRH stimulation ACTH concentration is warranted when
following aged horses.
Acknowledgements: The study was funded by the John and Mary Kibble Trust fund.
22 4th Global Equine Endocrine Symposium 2020

The Thyrotropin Releasing Hormone Procedure Produces Repeatable ACTH Concentrations
In PPID-Negative and PPID-Positive Horses
1R.M. Hoffman, 1J.C. Haffner, and 2S.T. Grubbs 1Middle Tennessee State University, Murfreesboro, TN,
2 Boehringer Ingelheim Animal Health USA, Inc., Duluth, GA
Aims:
Pituitary Pars Intermedia Dysfunction (PPID) has been considered the most common endocrine disease of horses.
One of the major limitations of diagnostic testing for PPID is the sensitivity of available diagnostic assays. Resting
ACTH has been shown to have a decreased sensitivity in horses with early PPID compared to advanced PPID.
Thyrotropin-releasing hormone (TRH) test procedure has been shown to have an increased sensitivity of detecting
horses with early PPID compared to resting ACTH. Even though TRH stimulation of ACTH has been used as a
diagnostic test for equine PPID, it is unknown if the T10-ACTH response to TRH is repeatable in individual horses.
The purpose of this study was to conduct TRH stimulation tests at 4-week intervals, beginning in February and
ending in June, in horses with and without PPID to determine the repeatability of the T10-ACTH, over time.
Methods:
Twelve grade horses (PPID+ and PPID
-) were enrolled, mean age of 18.8 yrs (range 12 to 25 yrs) and blood
collected on Day -45 to analyze resting ACTH concentration for determination of PPID status for each horse. On
Day 0, all horses had blood collected for resting ACTH followed by administration of 1mg TRH IV. Blood was then
collected exactly 10 min post-TRH administration (T10-ACTH). The TRH stimulation procedure was repeated on
Days 28, 56, 84 and 112. These subsequent samples were compared to the T10-ACTH samples collected on Day 0.
All blood samples were centrifuged following collection and plasma was frozen (-80C) until analysis at Animal
Health Diagnostic Laboratory, Cornell University, Ithaca, NY. Data were analyzed using a mixed model with
repeated measures to compare T10-ACTH and the percent increase of ACTH after TRH stimulation, using horse as
the subject and day as the repeated effect. Pearson’s correlation coefficients were used to examine relationships
between T10-ACTH on Days 28, 56, 84 and 112 to the T10-ACTH on Day 0. Bland-Altman plots were constructed
to compare T10-ACTH on Days 28, 56, 84 and 112 to the T10-ACTH on Day 0.
Results:
Of the 12 horses, the TRH stimulation indicated 5 negative and 5 positive for PPID, with 2 horses equivocal. There
was no effect of Day on T10-ACTH (P = 0.40) or the percent increase of ACTH after TRH stimulation (P = 0.12).
Pearson’s correlation coefficients indicated strong relationships between T10-ACTH on Day 0 and all other days (R
> 0.70, P < 0.01). Bland-Altman plots indicated an average Day bias of 27 pg/mL in all horses compared to Day 0,
with a Day bias of 10 pg/mL in PPID-negative and 43 pg/mL in PPID-positive horses.
Conclusions:
The Thyrotropin Releasing Hormone stimulation procedure produces repeatable ACTH concentrations in samples
collected 10 min after administration of TRH in horses collected at 4-week intervals over 112 days.
Acknowledgments:
The authors would like to acknowledge Boehringer Ingelheim Animal Health USA, Inc. and Middle Tennessee State
University Horse Science Center for supporting this work.
Presenting author:
Rhonda M. Hoffman PhD
1301 East Main Street
Murfreesboro, TN. USA 37132
email: [email protected]
This study was conducted at the Middle Tennessee State University Horse Science Center in Murfreesboro,
Tennessee USA. It was approved by the MTSU Institutional Animal Care and Use Committee under protocol #19-
2004.
This material has not been presented elsewhere.
P R O C E E D I N G S 23
Evaluation of Different Doses of Thyrotropin Releasing Hormone in Miniature Horses
Alfredo Sanchez-Londoño1, Nicholas Frank
2, Steve Grubbs
3, Pilar Hermida
2, Erik Hofmeister
4
Aims:
The aim of this study was to evaluate adrenocorticotropin hormone (ACTH) responses following the administration
of three different doses (1.0mg, 0.5mg and 0.25mg) of thyrotropin releasing hormone (TRH) to Miniature horses
with and without pituitary pars intermedia dysfunction (PPID).
Methods:
A total of 20 client-owned Miniature horses were enrolled in the study. Group 1 (non-PPID control horses) consisted
of 10 horses less than 10 years of age with no clinical evidence of PPID and/or a normal basal ACTH
concentrations. Group 2 consisted of 10 horses over 15 years of age with clinical evidence of PPID and/or an
increased (> 35 pg/mL) basal ACTH concentration A complete physical examination, baseline blood draw for
measuring ACTH concentrations and questionnaire regarding health questions were completed on the first visit. On
Days 0, 14, and 21, both groups of horses underwent TRH stimulation tests using three different doses of TRH given
intravenously on different calendar days at least 2 weeks apart. Testing was performed in the months of February
and June. Three doses of TRH were evaluated: 1.0mg, 0.5mg, and 0.25mg. On the day of testing, approximately 5
mL blood was drawn into each EDTA tube via jugular vein venipuncture and blood was collected before and 2, 5,
10, and 20 minutes after TRH administration. Blood and anticoagulant were mixed by gently inverting tubes several
times and then tubes were chilled immediately in either an ice bath or refrigerator. Tubes were centrifuged within 4
hours of collection and plasma was separated and transferred to cryovials for storage at – 20C. Frozen plasma was
shipped with ice packs via overnight courier service. Plasma ACTH concentrations were measured using a solid-
phase, two-site sequential, chemiluminescent immunoassay designed for IMMULITE® at Cornell University Animal
Health Diagnostic Center. Receiver operator characteristic (ROC) curves were plotted for each time point with each
TRH dose and Younden’s value was calculated and used to determine the best cutoff point for diagnosis. Analyses
were performed using a statistical software package (GraphPad Prism v.8) and P <0.05 was considered significant.
Results:
The ROC analysis results were examined to determine diagnostic performance, the 1.0mg TRH dose and 10-minute
time point had 100% sensitivity and 90% specificity with a cutoff value of 130 pg/mL, compared to the 0.5mg TRH
dose at 10 minutes which had 100% sensitivity and 80% specificity with a cutoff value of 121 pg/mL. In contrast,
the 0.25mg TRH dosage had 90% sensitivity and 80% specificity with a cutoff value of 104.3 pg/mL at 20 minutes
post injection. All other combinations had lower sensitivity and specificity values.
Conclusions:
Thyrotropin-releasing hormone dosages of 0.5mg and 1.0mg have the best sensitivity and specificity at 10 minutes
post-injection for consistent identification and diagnosis of miniature horses with PPID. A larger group of horses
should be examined in the future to determine whether a lower TRH dose can be used for this diagnostic test.
Acknowledgements:
Financial support was received from a 2017 Cummings Research Seed Grant and from Boehringer Ingelheim
Animal Health USA Inc., Duluth,GA
1 Department of Environmental and Population Health, Cummings School of Veterinary Medicine at Tufts
University, North Grafton, MA 2 Department of Veterinary Clinical Sciences, Cummings School of Veterinary Medicine at Tufts University, North
Grafton, MA 3 Boehringer Ingelheim Animal Health USA Inc., Duluth, GA
4 Department of Clinical Sciences, Auburn University College of Veterinary Medicine, Auburn, AL
Presenting Author
Alfredo Sanchez-Londoño
Vaughan Large Animal Teaching Hospital
1500 Wire Rd
Auburn, AL 36849
The research was performed in client owned animals at their place of stabling/housing, following IACUC Protocol
approved by Cummings School of Veterinary Medicine at Tufts University. All owners were required to sign a
Voluntary Participation in Research Activities Owner Consent Form at the time of enrollment in the study of their
horses.
The current research has not been presented previously at any national or international meetings.
24 4th Global Equine Endocrine Symposium 2020

COMPARISON OF TWO TRH DOSES IN PPID PATIENTS
Christiane Schorn1, Klaus Failing
2, Kerstin Fey
1
1 Equine Clinic, Internal Medicine, Justus-Liebig-University Giessen/Germany
2 Unit for Biomathematics and Data Processing, Justus Liebig University Giessen/Germany
Aims:
The TRH-Stimulation Test for detecting PPID usually is performed by injecting 1mg/TRH per horse (2µg/kg per
500 kg equid). To the knowledge of the authors, no dose-effect studies have been done in PPID patients. Due to
costs and unwanted, however short termed and self-limited symptoms after iv TRH, this study was aimed at
comparing ACTH releases in PPID affected horses and ponies after administration of 1µg/kg or 2µg/kg TRH.
Methods:
Six warmbloods and 5 ponies (24.3 ± 3.65 years) were included in this controlled, randomized cross over study.
Inclusion criteria were clinical signs of PPID and increased basal ACTH concentrations. On the first and third
day of the study, all probands received either 1µg/kg or 2µg/kg TRH (TRH Ferring, Kiel/Germany) in a
randomized order. Six probands additionally received saline (placebo) at day 2.
ACTH was measured directly before and 5, 10, 15, 30, 60, 90 and 120 minutes after TRH or placebo injection.
For statistics, two-way ANOVAs in modification for cross-over-studies were used to detect differences between
TRH-doses and order of TRH-application, e.g. for areas under ACTH curves and ACTH peaks. One-way
ANOVAs followed by Dunett-tests were performed to detect differences between ACTH AUCs after TRH and
placebo. Adverse effects were documented and scored. For statistical analysis, a Wilcoxon signed-rank test was
used.
Results:
There was no statistical difference between ACTH AUCs after administration of 1µg/kg or 2µg/kg TRH
(p=0,72). However, ACTH responses at day 1 tended to be higher (p=0.05) than at day 3; regardless of dosage.
ACTH AUCs after TRH were significantly (p>0.01) higher compared to placebo.
All TRH injections led to some teeth grinding. Lip licking, flehmen, coughing and other symptoms were seen
within the first 10 minutes after TRH and no such signs were noticed after placebo. The score points were not
statistically different between TRH dosages.
Conclusion:
The results suggest that the 48h wash-out time between TRH stimulations might have been too short.
Nevertheless, half of the usual TRH provoced the same ACTH reactions as the usual dose. Due to this (and no
reduction in adverse effects too) it might be possible to reduce TRH dosages further. Our results so far indicate,
that 1µg/kg TRH might be sufficient for diagnosing PPID by ACTH release.
P R O C E E D I N G S 25

Duration of Effectiveness of Frozen/Thawed Thyrotropin Releasing
Hormone to Stimulate ACTH Release in Horses
1J.C. Haffner,
1R.M. Hoffman,
2K. A. Jones, and
3S.T. Grubbs
1Middle Tennessee State University, Murfreesboro, TN,
2Around the Bend Veterinary Services, Bend, OR, 3Boehringer Ingelheim Animal Health USA, Inc., Duluth, GA
Aims:
The TRH stimulation of ACTH due to the increased sensitivity compared to measurement of resting ACTH has
increasingly been used as a diagnostic test for pituitary pars intermedia dysfunction (PPID). Many equine
practitioners will freeze doses of TRH, then thaw them, and drive to the farm to examine the horse. If the horse
owner declines testing, the veterinarian has TRH that has been frozen and thawed. Anecdotally, TRH can only be
frozen and thawed once for optimum and consistent response. The potency and stability over time of TRH after one
freeze thaw cycle is unknown. It would be useful for veterinarians to understand if thawed TRH stored at
refrigerated temperature can produce accurate results when administered to a horse at a later date. This study was
designed to determine the duration of effectiveness of TRH following one freeze/thaw cycle when stored at 5ºC over
time in horses.
Methods:
Ten horses (PPID+ and PPID
-) were enrolled, mean age 18.8 yrs. (range 12 to 25 yrs.). Horses were first paired by
PPID status and randomized into 2 groups of 5 horses each prior to –Day 14. Thirty, 1 mg/ml doses of constituted
TRH were frozen at -20°C on –Day 28. On –Day 14, ten doses of TRH were thawed at 5ºC followed by thawing of
the remaining (20 doses) TRH on Day 0. Thawed TRH was stored at 5ºC until administration. On Day 0, all horses
had blood collected for baseline ACTH followed by administration of 1mg TRH IV. Blood was then collected
exactly 10 minutes post-TRH administration (T10-ACTH). The TRH stimulation procedure was repeated with the
thawed TRH on Days 14, 28, 42 and 56. In order to avoid potential carryover effects of multiple TRH stimulation
procedures administered every two weeks, horses in Group 1 had the TRH stimulation repeated on Days 14 and 42
whereas Group 2 horses had the TRH stimulation repeated on Days 28 and 56 days TRH post-thaw. All samples
were centrifuged following collection and plasma was frozen (-80C) until analysis at Cornell Animal Health
Diagnostic Center. Data were analyzed using a mixed model with repeated measures to compare T10-ACTH and the
percent increase of ACTH after TRH stimulation, using horse as the subject and day as the repeated effect.
Pearson’s correlation coefficients were used to examine relationships between T10-ACTH on Days 14, 28, 42, 56 to
the T10-ACTH on Day 0.
Results:
There was no effect of Group (P > 0.25), so when appropriate, data were combined for analysis. There was no effect
of Day post-thaw on T10-ACTH (P = 0.13) or the percent increase of ACTH after TRH stimulation (P = 0.36).
Pearson’s correlation coefficients indicated strong relationships between T10-ACTH on Day 0 and all other days
(R > 0.98, P < 0.001).
Conclusions:
The Thyrotropin Releasing Hormone stimulation procedure produces repeatable ACTH concentrations in samples
collected 10 min after administration of TRH in horses when using TRH that has been thawed and stored at 5ºC for
up to 56 days.
Acknowledgments:
The authors would like to acknowledge Boehringer Ingelheim Animal Health USA Inc., Duluth, GA and Middle
Tennessee State University Horse Science Center for supporting this work.
Presenting author:
John C. Haffner DVM
314 W. Thompson Lane
Murfreesboro, TN. USA
email: [email protected]
This study was conducted at the Middle Tennessee State University Horse Science Center in Murfreesboro,
Tennessee USA. It was approved by the MTSU Institutional Animal Care and Use Committee under protocol #19-
2015.
This material has not been presented elsewhere.
26 4th Global Equine Endocrine Symposium 2020
Is there merit in utilising the TRH stimulation test in horses with an equivocal ACTH concentration?
Gough, S.1, Duz, M.
2 and Rendle, D.
1
1Rainbow Equine Lab, Malton, North Yorkshire, YO17 6SG.
2 Faculty of Medicine & Health Sciences, School
of Veterinary Medicine and Science, Sutton Bonington, Leicestershire, LE12 5RD.
Aims: Guidelines were issued recently over the use of plasma adrenocorticotrophic hormone (ACTH)
concentration and the use of the thyrotropin releasing hormone (TRH) stimulation test in the diagnosis of
pituitary pars intermedia dysfunction (PPID) however there is a lack of evidence to inform when different tests
may be necessary. Objectives: To determine whether performing a TRH stimulation test in a horse with an
equivocal ACTH concentration influences clinical decision making. Methods: A retrospective analytical cohort
study was performed. Results of basal ACTH (bACTH) and TRH stimulation tests performed at Rainbow
Equine Laboratory for the diagnosis of PPID between 2016 and 2018 in 438 horses were analysed. bACTH
concentration was defined as negative, equivocal or positive and was adjusted seasonally [1]. ACTH
concentration following TRH (tACTH) was classified as a binary outcome (negative or positive with positive
>200pg/mL non-Autumn and > 500pg/mL in Autumn) and logistic regression was performed to investigate
relationships between bACTH and tACTH. Where 2 bACTH measurements had been performed on different
dates these were also compared (previous result pACTH). Results: Overall there was no relationship between a
pACTH and tACTH, regardless of seasonality (p = 0.5). With increasing bACTH concentration a positive
tACTH result was more likely; the OR for every 1 unit increase in bACTH in the Autumn was 1.02 (95%CIs:
1.01-1.03, p<0.001) and non-Autumn period was 1.05 (95%CIs: 1.03-1.07, p<0.001). Conclusions: In horses
with an equivocal diagnosis of PPID, the correlation between basal ACTH concentration and tACTH is poor.
Performing a TRH stimulation test frequently alters clinical decision making supporting the use of this test in
practice.
Ethical Animal Research Statement: The study was approved by The University of Nottingham Animal Welfare
and Ethical Review Body. The work follows National guidelines for humane animal treatment and complies
with relevant legislation in the United Kingdom.
References:
1. Schott, H., Andrews, F., Durham, H., Frank, N., Hart, K., Kritchevsky, J., McFarlane, D. & Tadros, L.
Recommendations for the Diagnosis and Treatment of Pituitary Pars Intermedia Dysfunction (PPID).
2017. 12.
P R O C E E D I N G S 27
Effect of sample handling on adrenocorticotropic hormone (ACTH) concentrations following thyrotropin-releasing hormone (TRH) stimulation in horses
Stewart AJ, Yuen, KY, Hinrichsen S, Horn R, Dryburgh E, Bertin FR
School of Veterinary Science, The University of Queensland Aim: Although endogenous ACTH and ACTH post thyrotropin-releasing hormone (TRH) stimulation concentrations are used to diagnose PPID; the stability of ACTH after TRH stimulation has not been evaluated. Methods: Fifteen horses ≥10 years of age, including 6 horses that underwent a TRH stimulation test 30 min before blood collection, were included. Blood samples were collected in EDTA tubes and stored for 2, 4, 8, 12, 24 or 48 hours at 4°C, 20°C or 30°C as whole blood or after plasma separation by centrifugation or gravity. Immunoreactive ACTH concentrations were measured using a chemiluminescent assay. Using the 2-hour, 4°C centrifuged sample as a reference, percentage change in immunoreactive ACTH concentrations were compared with a linear mixed effect model, with P < 0.05 considered significant. Results: An overall effect of separation method, temperature, time and hemolysis (P < 0.01) was observed but there was no significant effect of TRH stimulation (P = 0.58). Centrifuged samples remained stable up to 48 hours at 4°C, while centrifuged samples kept at 20°C and 30°C were stable for less than 24 hours. Gravity separated samples and samples stored as whole blood affected immunoreactive ACTH concentrations. Overall, immunoreactive ACTH concentrations decreased with time and suboptimal sample handling; however, in 37% of samples, spurious increases in immunoreactive ACTH concentrations were observed. Conclusions: TRH stimulation did not impact the stability of immunoreactive ACTH. Improper sample handling decreases immunoreactive ACTH concentrations, but unpredictable increases can be observed and lead to false positive diagnoses of PPID in some horses. Acknowledgements: Funding provided by Boehringer Ingelheim Animal Health Australia Pty. Ltd. Presenting Author: Allison Jean Stewart, Building 8114, The University of Queensland, School of Veterinary Science, Gatton Campus, Gatton, Queensland, Australia, 4343 [email protected] The research was performed at: 1 School of Veterinary Science, The University of Queensland, Gatton, Queensland, Australia 2 Boehringer Ingelheim Animal Health Australia Pty. Ltd. Macquarie Park, New South Wales, Australia The work followed institutional guidelines for humane treatment and complied with relevant Australian legislation. All aspects of the study were approved by the University of Queensland Animal Ethics committee.
28 4th Global Equine Endocrine Symposium 2020

Presenting author
E.J.Knowles: The Royal Veterinary College, Hawkshead lane, Herts, UK
The work was carried out at the Royal Veterinary College and was approved by the College’s Ethics and
Welfare committee and complies with UK legislation.
Elution of endogenous CLIP from an ACTH assay capture antibody.
Knowles, E.J., Hyde, C. B., Harris, P.A., Elliott, J. and Menzies-Gow, N.J.
Aims
Pituitary pars intermedia dysfunction (PPID) is often diagnosed using a chemiluminescent adrenocorticotrophic
hormone (ACTH) sandwich immunoassay (Immulite ACTH, Siemens). The assay capture antibody is raised to
human corticotropin-like intermediate lobe peptide (CLIP, ACTH 18-39). Previously, this assay showed
seasonally dependent autumn cross-reactivity. Synthetic human CLIP showed significant (17.5%) cross-
reactivity and endogenous CLIP is a candidate in vivo cross-reactant.
Endogenous ACTH and CLIP may interact differently with assay antibodies compared with synthetic peptides.
The present study aimed to determine whether synthetic human CLIP and endogenous equine CLIP bind to the
capture antibody of the chemiluminescent ACTH assay and can be detected following elution.
Methods
Liquid chromatography – mass spectrometry (LCMS) methods were optimised to identify selected ions for
LCMS detection from synthetic human ACTH, α-melanocyte stimulating hormone (α-MSH, ACTH 1-17) and
CLIP.
Interactions between synthetic peptide solutions and the capture antibody were determined by analysis of
solutions of each peptide in distilled water at supra-physiological concentrations (60ng/ml) prior to and
following incubation with the antibody bound beads and following washing and elution of the peptide from the
beads.
Each solution was incubated with 5 antibody bound beads in a syringe barrel for 30 minutes on an orbital shaker.
The solution was removed under vacuum. The beads were washed twice with distilled water. Finally an elution
solution of 1% formic acid in water: acetonitrile (1:1) was added and the syringe was mixed for a further 30
minutes on an orbital shaker. The resulting solution was transferred to a tube, dried under nitrogen and
reconstituted in distilled water prior to analysis by LCMS.
Pools of residual EDTA plasma with high and low measured ACTH concentrations were created following
routine ACTH analysis of samples from non-laminitic ponies in the autumn (September 2018). Incubation,
elution and LCMS detection of equine endogenous ACTH and CLIP was compared with charcoal stripped
equine serum spiked with synthetic ACTH and CLIP.
Results
The most readily detectable ions are shown in table 1. The solutions of synthetic peptides in distilled water
overloaded the beads. After incubation with the bead, most of the peptide remained in solution but there was a
reduction in the peaks for CLIP and ACTH but not α-MSH.
The high and low pools of plasma yielded ACTH results of 232pg/ml and 25.7pg/ml respectively LCMS SIM
analysis identified endogenous CLIP (Figure 1) and ACTH in eluted solutions created from both pools, with
higher concentrations of both analytes in the high pool. Unfortunately these analytes could not yet be quantified
accurately.
Effect of sample handling on adrenocorticotropic hormone (ACTH) concentrations following thyrotropin-releasing hormone (TRH) stimulation in horses
Stewart AJ, Yuen, KY, Hinrichsen S, Horn R, Dryburgh E, Bertin FR
School of Veterinary Science, The University of Queensland Aim: Although endogenous ACTH and ACTH post thyrotropin-releasing hormone (TRH) stimulation concentrations are used to diagnose PPID; the stability of ACTH after TRH stimulation has not been evaluated. Methods: Fifteen horses ≥10 years of age, including 6 horses that underwent a TRH stimulation test 30 min before blood collection, were included. Blood samples were collected in EDTA tubes and stored for 2, 4, 8, 12, 24 or 48 hours at 4°C, 20°C or 30°C as whole blood or after plasma separation by centrifugation or gravity. Immunoreactive ACTH concentrations were measured using a chemiluminescent assay. Using the 2-hour, 4°C centrifuged sample as a reference, percentage change in immunoreactive ACTH concentrations were compared with a linear mixed effect model, with P < 0.05 considered significant. Results: An overall effect of separation method, temperature, time and hemolysis (P < 0.01) was observed but there was no significant effect of TRH stimulation (P = 0.58). Centrifuged samples remained stable up to 48 hours at 4°C, while centrifuged samples kept at 20°C and 30°C were stable for less than 24 hours. Gravity separated samples and samples stored as whole blood affected immunoreactive ACTH concentrations. Overall, immunoreactive ACTH concentrations decreased with time and suboptimal sample handling; however, in 37% of samples, spurious increases in immunoreactive ACTH concentrations were observed. Conclusions: TRH stimulation did not impact the stability of immunoreactive ACTH. Improper sample handling decreases immunoreactive ACTH concentrations, but unpredictable increases can be observed and lead to false positive diagnoses of PPID in some horses. Acknowledgements: Funding provided by Boehringer Ingelheim Animal Health Australia Pty. Ltd. Presenting Author: Allison Jean Stewart, Building 8114, The University of Queensland, School of Veterinary Science, Gatton Campus, Gatton, Queensland, Australia, 4343 [email protected] The research was performed at: 1 School of Veterinary Science, The University of Queensland, Gatton, Queensland, Australia 2 Boehringer Ingelheim Animal Health Australia Pty. Ltd. Macquarie Park, New South Wales, Australia The work followed institutional guidelines for humane treatment and complied with relevant Australian legislation. All aspects of the study were approved by the University of Queensland Animal Ethics committee.
P R O C E E D I N G S 29

Conclusions
Synthetic and endogenous equine ACTH and CLIP can be eluted from the capture antibody of the
chemiluminescent immunoassay for LCMS detection. Endogenous CLIP is present in plasma collected from
ponies in the autumn supporting but not proving the hypothesis that CLIP cross-reactivity affects measured
ACTH concentrations.
The extent to which CLIP affects measured ACTH in health and disease requires further study.
Acknowledgements
Petplan Charitable Trust, WALTHAM Centre for Pet Nutrition and the Mellon Trust.
Peptide m/z Dwell time
(msec)
Q3 bias (V)
ACTH 909.1 100 -26
757.5 100 -38
649.7 100 -32
CLIP 822.6 10
1233.3 10
α-MSH 555.7 10
833 10
peptides.
Figure 1: Equine CLIP selected ion monitoring from equine plasma spiked with synthetic CLIP and low and
high pools of endogenous plasma following elution from the chemiluminescent (CL) assay capture antibody.
- = synthetic CLIP in equine plasma
-= ‘high pool’ ACTH = 232pg/ml CL
assay
-= ‘low pool’ ACTH =25.2pg/ml CL
assay
Table 1: mass/charge (m/z), dwell time and Q3 bias for the most readily detectable ions from synthetic
30 4th Global Equine Endocrine Symposium 2020

Circannual pattern of ACTH, insulin and glucose concentrations in horses and ponies.
Julie Potier, Andy Durham
The Liphook Equine Hospital, Forest Mere, Portsmouth road, Liphook, Hampshire GU30 7JG, UK
Institution where the research was performed :
The Liphook Equine Hospital Laboratory, Forest Mere, Portsmouth road, Liphook, Hampshire GU30
7JG, UK
This work follows international guidelines for humane animal treatment and complies with relevant
legislation in the country in which the study was conducted.
The abstract has not been presented previously.
Aims :
To evaluate, in greater detail than previous studies, the circannual pattern in ACTH, insulin and
glucose in horses.
Methods :
Laboratory records were examined from all blood samples submitted to the Liphook Equine Hospital
Laboratory for plasma ACTH analysis between 2014 and 2018. Many submissions were also analysed
for serum insulin and plasma glucose and these were also examined as part of the study. Data were
excluded from repeat tests and individuals on treatment, as well as those with no clinical history
submitted. The ACTH data was plotted by week and by month, while the insulin and glucose
concentrations were plotted by month and by season only due to lower numbers (Winter= December,
January February; Spring=March, April, May; Summer=June, July, August; Autumn=September,
October, November).
The Kruskal-Wallis test was used to compare across monthly and seasonal medians with Dunn’s
Multiple Comparison Test used to compare all pairings of monthly and seasonal medians.
Results :
There was a total of 43,059 samples included. Examination of weekly ACTH data indicated a peak
concentration in weeks 38 and 39 (17th-30
th September) (w38: 84.6 pg/mL; w39: 84.2 pg/mL) with a
nadir in weeks 16 to 18 (16th April-6
th May) (w16: 21.5pg/mL; w17: 21.4 pg/mL; w18: 21.2 pg/mL)
(figure 1). Examination of monthly ACTH concentrations revealed that ACTH concentrations in the
months of April and May were significantly lower than in all other months (P<0.001), and that ACTH
concentrations in August, September and October were significantly higher than in all other months
(P<0.001).
Analysis of insulin concentrations revealed that January had significantly higher median insulin
concentrations than all months except February, September, November and December (p<.05);
February had significantly higher median insulin concentrations than all months except January,
September, November and December (P<0.05) (figure 2). When insulin concentrations were
compared by season, winter was found to be significantly higher than all other months and summer
was found to be significantly lower than in all other months (median [IQR] Winter 24.1 mU/L [8.0-
85.5]; Spring 15.7 mU/L [4.9-55.3]; Summer 11.6 mU/L [4.4-40.9]; Autumn 14.6 mU/L [4.5-68.2]).
Analysis of glucose concentrations revealed a similar pattern to insulin with highest median values in
the winter and lowest in the summer (figure 3).
P R O C E E D I N G S 31

Figure 1. Weekly median ACTH concentrations.
Figure 2. Monthly insulin distribution
0
10
20
30
40
50
60
70
80
90
1 2 3 4 5 6 7 8 9 10111213141516171819202122232425262728293031323334353637383940414243444546474849505152
ACTH
pg/
mL
weekly ACTH concentrations
Figure 3. Monthly glucose distribution
Conclusion :
Additional detail of the circannual variability in ACTH was provided with novel evidence of a nadir
in the spring (April and May). Both insulin and glucose had a different seasonal pattern to ACTH with
highest values in the winter and lowest in the summer. This is suggestive of seasonal insulin
resistance in the winter and greatest insulin sensitivity in the summer, which might reflect an
historical survival advantage.
Aknowledgements :
Referring veterinary surgeons who sent samples to the Liphook Equine Hospital Laboratory and the
Laboratory staff for performing the analyses.
Figure 1. Weekly median ACTH concentrations.
Figure 2. Monthly insulin distribution
0
10
20
30
40
50
60
70
80
90
1 2 3 4 5 6 7 8 9 10111213141516171819202122232425262728293031323334353637383940414243444546474849505152
ACTH
pg/
mL
weekly ACTH concentrations
Figure 1. Weekly median ACTH concentrations.
Figure 2. Monthly insulin distribution
0
10
20
30
40
50
60
70
80
90
1 2 3 4 5 6 7 8 9 10111213141516171819202122232425262728293031323334353637383940414243444546474849505152
ACTH
pg/
mL
weekly ACTH concentrations
Figure 3. Monthly glucose distribution
Conclusion :
Additional detail of the circannual variability in ACTH was provided with novel evidence of a nadir
in the spring (April and May). Both insulin and glucose had a different seasonal pattern to ACTH with
highest values in the winter and lowest in the summer. This is suggestive of seasonal insulin
resistance in the winter and greatest insulin sensitivity in the summer, which might reflect an
historical survival advantage.
Aknowledgements :
Referring veterinary surgeons who sent samples to the Liphook Equine Hospital Laboratory and the
Laboratory staff for performing the analyses.
32 4th Global Equine Endocrine Symposium 2020

GEES 2020 Clinical Research Abstract
Investigating the epidemiology of pituitary pars intermedia dysfunction in horses/ponies enrolled in a
laminitis cohort study in Great Britain
D. Pollard1,2
, C. E. Wylie3,4
, K.L.P. Verheyen2, J. R. Newton
1.
1Animal Health Trust, Lanwades Park, Kentford, Newmarket, UK;
2Royal Veterinary College, Hatfield,
Hertfordshire, UK, 3Rossdales Equine Hospital, Exning, Newmarket, UK,
4University of Sydney, Camperdown,
Sydney, Australia.
Presenting author: Danica Pollard; [email protected]
Aims: To estimate the prevalence of owner-reported pituitary pars intermedia dysfunction (PPID) and factors
associated with PPID in a cohort of horses/ponies enrolled in an epidemiological study of equine laminitis in
Great Britain.
Methods: Self-selected horse/pony owners enrolled in a web-based laminitis epidemiological study (August
2014 to December 2016) completed questionnaires detailing their animals’ signalment, management and
previous and current health. The proportion of horses/ponies tested for PPID, the diagnostic testing used,
reasons for testing and use of medication were described and the prevalence (95% confidence interval [CI]) of
PPID was estimated. Random effects multivariable logistic regression modelling identified factors associated
with higher odds of having PPID (P≤0.05) while adjusting for owner-level clustering.
Results: Baseline questionnaires from 1,799 horses/ponies were available. The median age and height of
enrolled horses/ponies was 14 (interquartile range [IQR] 9 to 19; range 1 to 38) years and 147.3 (IQR 137.2 to
157.5) cm. The main breeds included native ponies (23.9%; n=414), Welsh (21.9%; n=394) and Thoroughbred
(10.2%; n=184) breeds and their crosses. The median number of horses/ponies enrolled was 2 (range 1 to 18
horses). A total of 509/1,796 horses/ponies (28.3%) were tested for PPID using diagnostic laboratory tests,
46.8% (n=238) of which were diagnosed as positive. The most common diagnostic test reported was the plasma
adrenocorticotropic hormone test (52.8%; n=269). However, 219 (43.0%) of owners could not name the test
used. The main reasons owners had their horses/ponies tested for PPID were recurrent laminitis episodes
(36.3%; 185/509), increasing age (32.5%; 179/509), regional adiposity (31.2%; 159/509) and lethargy (19.8%;
101/509). Twenty-nine horses/ponies were diagnosed with PPID based on clinical signs alone. The overall
prevalence of PPID was 14.8% (95% CI 13.3, 16.6%; n=267/1,799). Of 256 horses/ponies with PPID, 69.5%
(n=178) were currently receiving pergolide. The odds of PPID increased by 1.2 (95% CI 1.2, 1.3) with each
increasing year of age. Arabians and their crosses had higher odds (2.8; 95% CI 1.2, 6.2) and cobs and their
crosses lower odds (0.2; 95% CI 0.1, 0.8) compared to other breeds combined (excluding Thoroughbreds and
natives). Horses/ponies with PPID were more likely to have a history of laminitis, have equine metabolic
syndrome (EMS), be tested for presence of tapeworm via the ELISA blood test, be lame or footsore after
shoeing/trimming and be shod with specialised horse shoes as opposed to regular or no shoes. Regarding
management, horses/ponies with PPID were more likely to have restricted access to grass, receive bucket feed,
receive supplements marketed to regulate hormones, receive feed balancers and not be fed straw.
Conclusions: This study has revealed interesting insight into owner knowledge and management of PPID as
well as providing important epidemiological data on the condition. The indication that Arabians had highest and
cobs lowest risk of having PPID is a novel finding. Laminitis and EMS are important co-morbidities in
horses/ponies with PPID, as reflected by their management. Although 70% of horses/ponies were medicated,
there may be high reliance on unproven supplements to help manage PPID.
Acknowledgements: Many thanks to the funders and all participating horse/pony owners.
Sources of funding
The project was supported by funding from World Horse Welfare, the Margaret Giffen Charitable Trust, the
Horserace Betting Levy Board (HBLB), Racehorse Owners Association (ROA) and Thoroughbred Breeders’
Association (TBA).
Ethical approval This study was granted institutional ethical approval from the Animal Health Trust (AHT01-2014) and the
Royal Veterinary College (2014 0105H). Animal use not applicable. Explicit informed consent was sought from
owners at enrolment.
P R O C E E D I N G S 33

GEES 2020 Clinical research abstract
Presenting author: Nichola Steel BVM&S MSc CertAVP (EM) MRCVS FHEA
Email: [email protected]
Institution where the research was performed: University of Liverpool
The work involved in the following audit follows international, national, and/or institutional guidelines for
humane animal treatment and complies with relevant legislation in the country in which the study was
conducted
Management of equine pituitary pars intermedia dysfunction in veterinary practice: A clinical audit
Nichola Louise Steel, Joanne Lesley Ireland, Catherine Marie McGowan
Institute of Veterinary Science, Faculty of Health and Life Sciences, the University of Liverpool, Leahurst,
Cheshire, UK.
Aims
To compare current treatment and monitoring of PPID cases in veterinary practice against evidence-based
clinical guidelines (Table 1)
Methods
Case data and basal plasma adrenocorticotropic hormone (ACTH) concentrations from all equids tested for
PPID between 2012 and 2016 from a single veterinary practice were obtained. Clinical records were reviewed
and information on treatment and monitoring over the subsequent 2-6 years was extracted and compared with
current evidence-based clinical guidelines (Table 1).
Criterion Target level Exceptions
Horses diagnosed with PPID, based on
elevated ACTH, treated with pergolide
mesylate
100% Cases that died or were subject to euthanasia
following diagnosis without commencing
treatment
The starting dose of pergolide mesylate
is recorded in clinical records
100% None
Starting dose of oral pergolide
mesylate should be 2µg/kg once daily
100% As accurate bodyweight not always recorded,
estimated starting dose of 1.5-2.5µg/kg
considered compliant with criterion
Horses receive follow-up endocrine
(ACTH) testing 1-3 months following
diagnosis and initiation of treatment
100% Cases that died or were subject to euthanasia
within 1-3 months of commencing treatment
Table 1: Criteria based on currently available clinical recommendations used to evaluate processes for
treatment and monitoring of PPID cases in a clinical audit of 480 horses/ponies/donkeys in a first opinion
equine practice in the United Kingdom.
Results
A total of 536 horses were recorded as tested for PPID, after exclusions, the final audit population was 480
animals. Of these, 51.7% (n=248) animals were classified as positive, 37.1% (n=178) as negative and 11.3%
(n=54) classified as borderline for PPID, based on seasonally adjusted reference ranges for basal ACTH.
Clinical records were available for 459 individuals; of which medical treatment with pergolide was initiated in
78.7% (n=185/235) of positive cases, 19.2% (n=10/52) of borderline cases and 6.4% (n=11/172) of cases
initially classified as negative (Fig.1). Overall, 87.2% (n=129/148) of cases were initially treated as per current
34 4th Global Equine Endocrine Symposium 2020
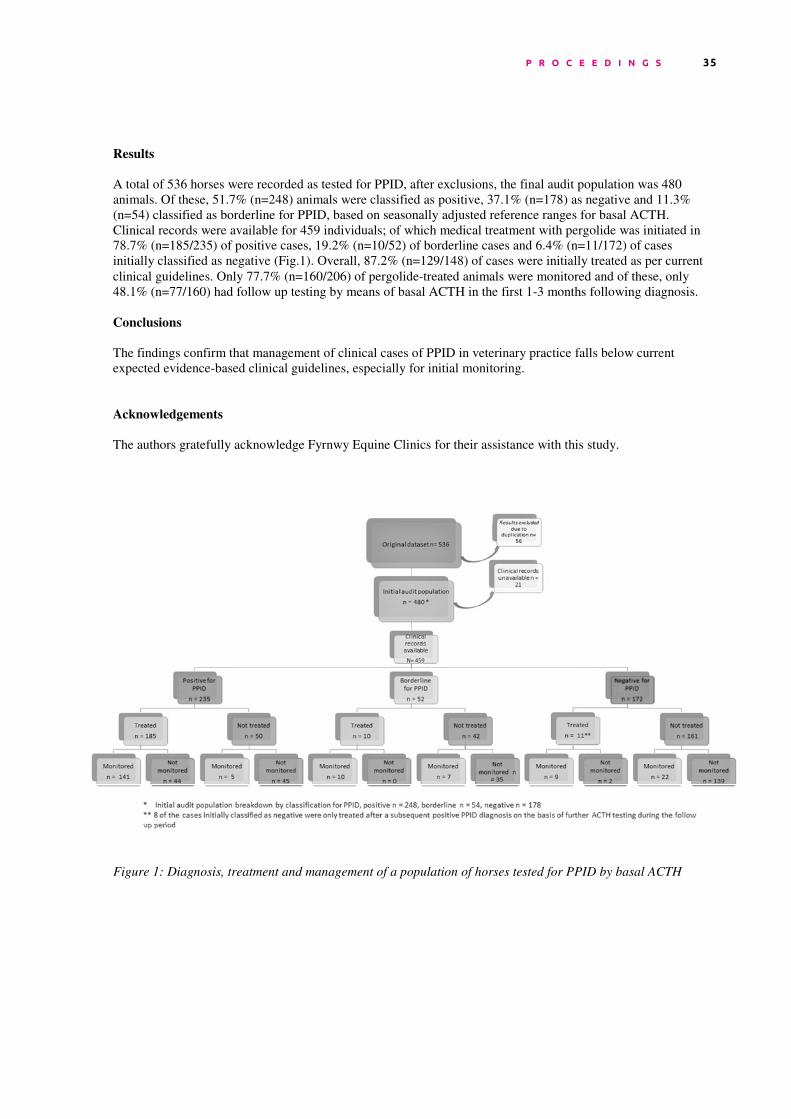
GEES 2020 Clinical research abstract
Presenting author: Nichola Steel BVM&S MSc CertAVP (EM) MRCVS FHEA
Email: [email protected]
Institution where the research was performed: University of Liverpool
The work involved in the following audit follows international, national, and/or institutional guidelines for
humane animal treatment and complies with relevant legislation in the country in which the study was
conducted
Management of equine pituitary pars intermedia dysfunction in veterinary practice: A clinical audit
Nichola Louise Steel, Joanne Lesley Ireland, Catherine Marie McGowan
Institute of Veterinary Science, Faculty of Health and Life Sciences, the University of Liverpool, Leahurst,
Cheshire, UK.
Aims
To compare current treatment and monitoring of PPID cases in veterinary practice against evidence-based
clinical guidelines (Table 1)
Methods
Case data and basal plasma adrenocorticotropic hormone (ACTH) concentrations from all equids tested for
PPID between 2012 and 2016 from a single veterinary practice were obtained. Clinical records were reviewed
and information on treatment and monitoring over the subsequent 2-6 years was extracted and compared with
current evidence-based clinical guidelines (Table 1).
Criterion Target level Exceptions
Horses diagnosed with PPID, based on
elevated ACTH, treated with pergolide
mesylate
100% Cases that died or were subject to euthanasia
following diagnosis without commencing
treatment
The starting dose of pergolide mesylate
is recorded in clinical records
100% None
Starting dose of oral pergolide
mesylate should be 2µg/kg once daily
100% As accurate bodyweight not always recorded,
estimated starting dose of 1.5-2.5µg/kg
considered compliant with criterion
Horses receive follow-up endocrine
(ACTH) testing 1-3 months following
diagnosis and initiation of treatment
100% Cases that died or were subject to euthanasia
within 1-3 months of commencing treatment
Table 1: Criteria based on currently available clinical recommendations used to evaluate processes for
treatment and monitoring of PPID cases in a clinical audit of 480 horses/ponies/donkeys in a first opinion
equine practice in the United Kingdom.
Results
A total of 536 horses were recorded as tested for PPID, after exclusions, the final audit population was 480
animals. Of these, 51.7% (n=248) animals were classified as positive, 37.1% (n=178) as negative and 11.3%
(n=54) classified as borderline for PPID, based on seasonally adjusted reference ranges for basal ACTH.
Clinical records were available for 459 individuals; of which medical treatment with pergolide was initiated in
78.7% (n=185/235) of positive cases, 19.2% (n=10/52) of borderline cases and 6.4% (n=11/172) of cases
initially classified as negative (Fig.1). Overall, 87.2% (n=129/148) of cases were initially treated as per current
clinical guidelines. Only 77.7% (n=160/206) of pergolide-treated animals were monitored and of these, only
48.1% (n=77/160) had follow up testing by means of basal ACTH in the first 1-3 months following diagnosis.
Conclusions
The findings confirm that management of clinical cases of PPID in veterinary practice falls below current
expected evidence-based clinical guidelines, especially for initial monitoring.
Acknowledgements
The authors gratefully acknowledge Fyrnwy Equine Clinics for their assistance with this study.
Figure 1: Diagnosis, treatment and management of a population of horses tested for PPID by basal ACTH
Figure 1: Diagnosis, treatment and management of a population of horses tested for PPID by basal ACTH
P R O C E E D I N G S 35

• Presenting authors name, address and email address
Nicola Menzies-Gow
Department of Clinical Sciences and Services, Royal Veterinary College, Hawkshead Lane, North Mymms, Herts. AL9 7TA. UK
• Details of the institution where the research was performed
Department of Clinical Sciences and Services, Royal Veterinary College, Hawkshead Lane, North Mymms, Herts. AL9 7TA. UK
• A statement that the work follows international, national, and/or institutional guidelines for humane animal treatment and complies with relevant legislation in the country in which the study was conducted.
The project was approved by the Royal Veterinary College Social Science Ethical Review Board (URN: SR2019-0051)
• The abstract has not been previously presented or published
4. The abstract must be written and presented in English. Use single line spacing and Times
New Roman 10 point font; do not indent paragraphs. Simple tables, graphs and figures may
be included. Abstracts must not exceed 500 words excluding all titles, tables and figures.
5. The format for the abstract should be as follows:
Aims, Methods, Results, Conclusions, Acknowledgements.
Title: The effect of pergolide dosing compliance on the laboratory control of pituitary pars intermedia
dysfunction
Authors: Hague N.,1 Durham A.E.,
2 and Menzies-Gow N.J.
1
1Royal Veterinary College, Hawkshead Lane, North Mymms, Herts
2Liphook Equine Hospital, Liphook, Hampshire GU30 7JG, UK.
Aims: To determine the effect of pergolide dosing compliance on the laboratory control of equine pituitary pars
intermedia dysfunction (PPID).
Methods: The clinical records from two first opinion equine veterinary practices were searched to identify
animals with PPID that were being treated with pergolide between 2016 and 2019. Animals were defined as
having PPID if they had ≥1 clinical sign suggestive of PPID and a basal adrenocorticotrophic hormone (ACTH)
concentration above the seasonally adjusted reference range at presentation. These animals were then included
in the study if the amount of pergolide being prescribed was apparent in the clinical record and follow up
measurements of basal ACTH concentration were recorded. The age, breed and sex of each animal was noted
and appropriate breed and age categories created. The dose of pergolide each animal received was calculated
(amount of pergolide dispensed/by the time period between each dispensing) and animals were classified as
36 4th Global Equine Endocrine Symposium 2020
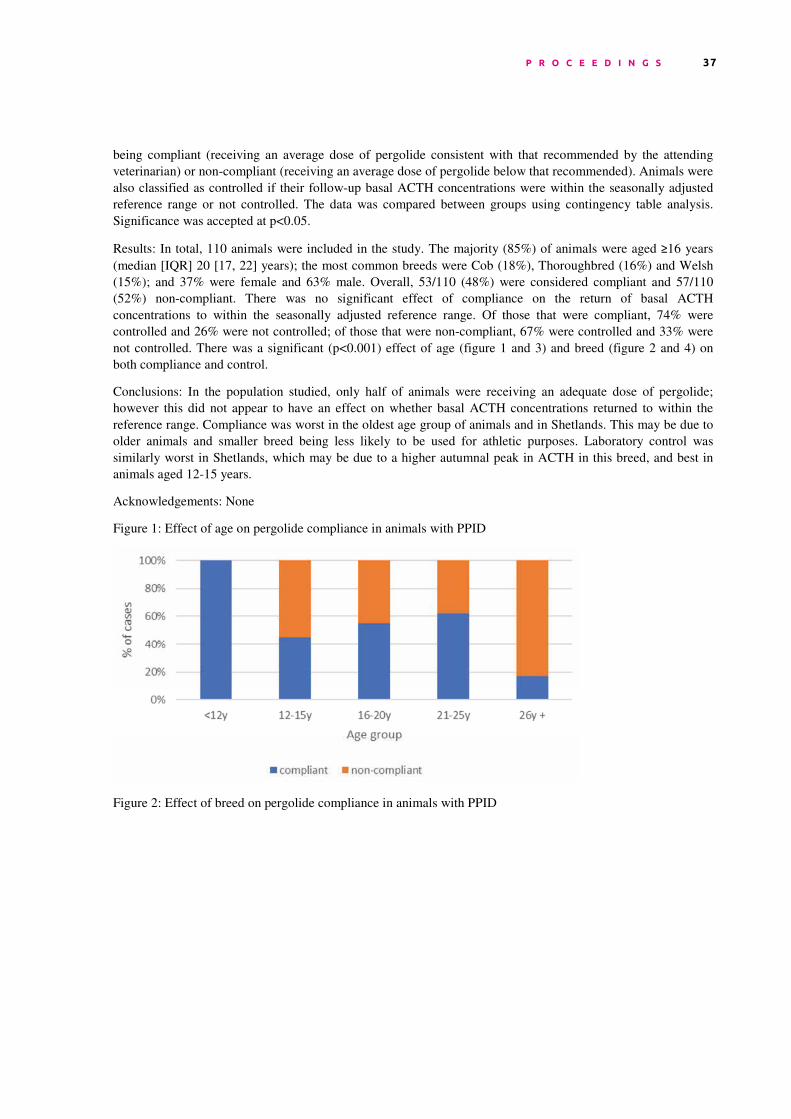
being compliant (receiving an average dose of pergolide consistent with that recommended by the attending
veterinarian) or non-compliant (receiving an average dose of pergolide below that recommended). Animals were
also classified as controlled if their follow-up basal ACTH concentrations were within the seasonally adjusted
reference range or not controlled. The data was compared between groups using contingency table analysis.
Significance was accepted at p<0.05.
Results: In total, 110 animals were included in the study. The majority (85%) of animals were aged ≥16 years
(median [IQR] 20 [17, 22] years); the most common breeds were Cob (18%), Thoroughbred (16%) and Welsh
(15%); and 37% were female and 63% male. Overall, 53/110 (48%) were considered compliant and 57/110
(52%) non-compliant. There was no significant effect of compliance on the return of basal ACTH
concentrations to within the seasonally adjusted reference range. Of those that were compliant, 74% were
controlled and 26% were not controlled; of those that were non-compliant, 67% were controlled and 33% were
not controlled. There was a significant (p<0.001) effect of age (figure 1 and 3) and breed (figure 2 and 4) on
both compliance and control.
Conclusions: In the population studied, only half of animals were receiving an adequate dose of pergolide;
however this did not appear to have an effect on whether basal ACTH concentrations returned to within the
reference range. Compliance was worst in the oldest age group of animals and in Shetlands. This may be due to
older animals and smaller breed being less likely to be used for athletic purposes. Laboratory control was
similarly worst in Shetlands, which may be due to a higher autumnal peak in ACTH in this breed, and best in
animals aged 12-15 years.
Acknowledgements: None
Figure 1: Effect of age on pergolide compliance in animals with PPID
Figure 2: Effect of breed on pergolide compliance in animals with PPID
P R O C E E D I N G S 37
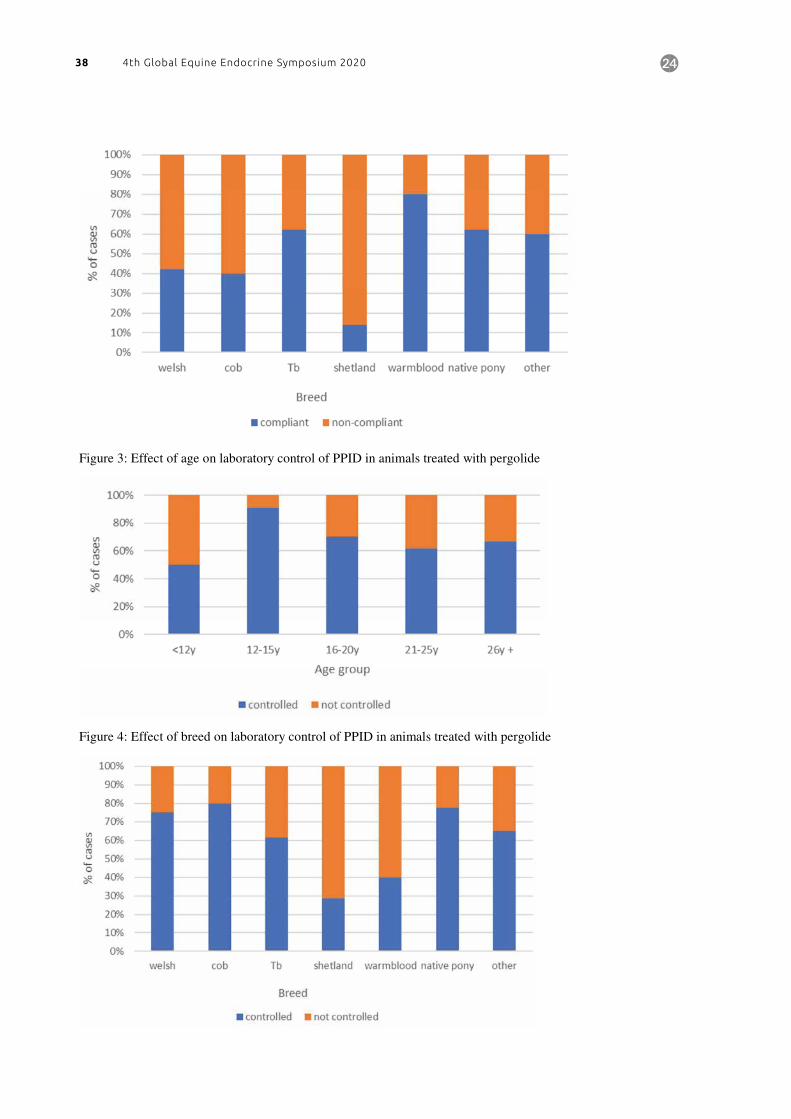
Figure 3: Effect of age on laboratory control of PPID in animals treated with pergolide
Figure 4: Effect of breed on laboratory control of PPID in animals treated with pergolide
38 4th Global Equine Endocrine Symposium 2020

A cross-sectional study of horses diagnosed with pituitary pars intermedia dysfunction in the United
Kingdom: Treatment practices and factors associated with quality of life
1,2Tatum R C,
1McGowan C M and
1Ireland J L
1University of Liverpool, Institute of Veterinary Science, Leahurst Campus, Neston, CH64 7TE;
2Animal Health
Trust, Centre for Preventive Medicine, Newmarket, CB8 7UU.
Presenting author: Rebecca C Tatum, [email protected]
This study did not include animal participants, therefore international, national, or institutional guidelines for
humane animal treatment are not applicable. This study was granted institutional ethical approval from the
University of Liverpool. Return of a completed questionnaire was taken as informed owner consent.
This research has not been presented or published previously.
Word count: 500
Aim: To describe owner treatment practices and perceptions of quality of life (QoL) in horses with pituitary
pars intermedia dysfunction (PPID) as well as identifying clinical and treatment factors associated with QoL.
Methods: A cross-sectional questionnaire was distributed both online and via post to owners of horses
diagnosed with PPID in the UK. Information on treatment and clinical signs were gathered. Likert-style
questions were used to gather owner perceived ratings of QoL on a scale of 1–10 (could not be worse - could not
better).
Results: In total 377 completed questionnaires met inclusion criteria. The vast majority of horses had received
pergolide treatment after PPID diagnosis (94.1%; n=352/374), while 86.9% (n=325/374) were currently treated
with pergolide. Seventeen percent (n=65/374) currently received an alternative treatment (e.g. Vitex agnus
castus) and of these 70.8% (n=46/65) also received pergolide. The most frequent reason for not currently
treating with pergolide was observed side-effects (95.5%; n=21/22). The median current dose of pergolide per
horse was 1mg (range 0.25-6mg), this was reported not to have changed within the preceding year for 65.8%
(n=219/333). Where dose modifications had been made, the majority of owners reported consulting their vet
before making changes (78.1%; n=89/114). Pergolide had a significantly higher efficacy rating (median = 8;
IQR 7-10) compared to alternative treatments (median = 5; IQR 2.5-7) (p<0.001).
Horses with PPID were perceived to have a very good current QoL (median rating = 9 IQR 8-10). This was
significantly higher compared to QoL rating at time of diagnosis (median = 6 IQR 4.75-8) (p<0.001). Pergolide
treatment was associated with an improvement in QoL rating since the time of diagnosis (p=0.002). Horses
administered pergolide treatment alone had a significantly higher QoL rating compared to horses receiving other
treatment combinations or no treatment (p=0.008). Owners reported currently observing ≥1 clinical sign of
PPID in 73.9% (n=252/341) of horses. Clinical signs associated with a lower QoL rating were laminitis
(p=<0.001), a curly/over-grown coat (p=0.007), lethargy/poor performance and patchy/excessive sweating (both
p=0.002).
Conclusions: Overall, horses with PPID appear to enjoy a very good QoL, with significant improvement
reported since diagnosis. Pergolide was considered by owners to be an effective treatment and was positively
correlated with QoL. Despite this, most owners reported observing clinical signs of PPID and several of these
had a negative association with QoL. There is a need for a practical tool to help both owners and veterinary
surgeons assess QoL in horses. Evaluation of QoL may be beneficial as a component of routine prescription
checks or when considering changes in pergolide dose. The ability to score and monitor QoL could also be
beneficial when treating other chronic diseases.
Acknowledgements: We gratefully acknowledged all participating horse owners. This project was generously
part funded by Boehringer Ingelheim Ltd.
P R O C E E D I N G S 39
Pharmacokinetics of pergolide mesylate in donkeys (Equus africanus asinus)
Cynthia Xue,1 Jennifer Davis,
2 Londa J. Berghaus,
1 Amanda Hanafi,
1 Sarah A. Vaughn,
1 Kelsey A. Hart
1
1Department of Large Animal Medicine, University of Georgia College of Veterinary Medicine, Athens GA, USA
2Department of Biomedical Sciences and Pathobiology, Virginia-Maryland College of Veterinary Medicine,
Blacksburg VA, USA
This work was conducted under the direction and oversight of the University of Georgia College of Veterinary
Medicine Clinic Research Committee to ensure compliance with institutional and national guidelines for humane
animal treatment.
This abstract/research has not previously been presented.
Aims. Donkeys exhibit the same clinical signs of pituitary pars intermedia dysfunction (PPID) – including laminitis,
hair coat changes, and weight loss – as horses. Donkeys with suspected PPID are typically managed with pergolide
mesylate as recommended for horses. However, drug dosages and dosing intervals recommended in horses cannot
be extrapolated to donkeys due to differences in drug distribution and clearance between species. The objective of
this study was to determine the pharmacokinetics of pergolide mesylate after oral administration to adult donkeys.
We hypothesized that based on pharmacokinetic variables in donkeys, pergolide mesylate will be suitable for once
daily oral administration at a comparable dose of 2-4 mcg/kg in this species.
Methods. Six healthy client-owned donkeys (age 1 – 10 years; 5 females, 1 male) were recruited. On day 1,
pergolide mesylate (2 mcg/kg) was administered intragastrically in 60 ml tap water and blood samples were
collected for quantification of pergolide plasma concentrations at 0, 10, 20, 30, 45 min, and 1, 1.5, 2, 3, 4, 6, 8, 12,
24, 36, and 48 h after administration. Five additional doses of pergolide (2 mcg/kg) were then administered orally
once daily for 5 days, at 48, 72, 96, 120, and 144 h after the first dose. On day 5, blood was collected before and at
the time points listed above after the last dose. Plasma concentrations of pergolide were measured using UPLC and
tandem mass spectrophotometry. Pergolide concentration versus time data after the first and last doses were
analyzed based on noncompartmental pharmacokinetics using commercially available software. Paired t tests were
used to compare Cmax, Tmax, AUC, and t½λz after administration of the first and last doses (P < 0.05).
Results. Cmax, Tmax, AUC, and t½λz were significantly different (P < 0.03) after administration of the last dose
compared to the first dose. Specifically, maximal plasma concentration reached after intragastric dosing on day 1
(0.16 ± 0.16 ng/mL) was more than 6-fold lower than maximal plasma concentration reached after 5 days or oral
dosing (3.74 ± 2.26 ng/mL). t½λz was 1.7-fold longer after 5 days of oral dosing than on day 1 after one intragastric
dose. Accumulation index after 5 days of oral dosing was 1.57 ± 0.29.
Conclusions. These data demonstrate differences in pharmacokinetic parameters between the first and last dose,
which might in part be due to drug accumulation after repeated dosing. However, some differences could be
attributed to sublingual absorption of the drug with oral dosing, which has been suggested in horses and warrants
further investigation. Maximal plasma concentration reached in donkeys after repeated dosing was substantially (>6
times) higher than Cmax observed in horses after repeated dosing in some previous studies. Thus, pergolide
pharmacokinetics in donkeys differ from those in horses, impacting dosing recommendations for this drug in
donkeys.
Acknowledgements: We would like to acknowledge Natalie Norton and UGA VTH clients, personnel and staff for
their assistance with sample collection, study organization, and animals for this work, and the UGA CVM
Department of Large Animal Medicine for funding support.
40 4th Global Equine Endocrine Symposium 2020
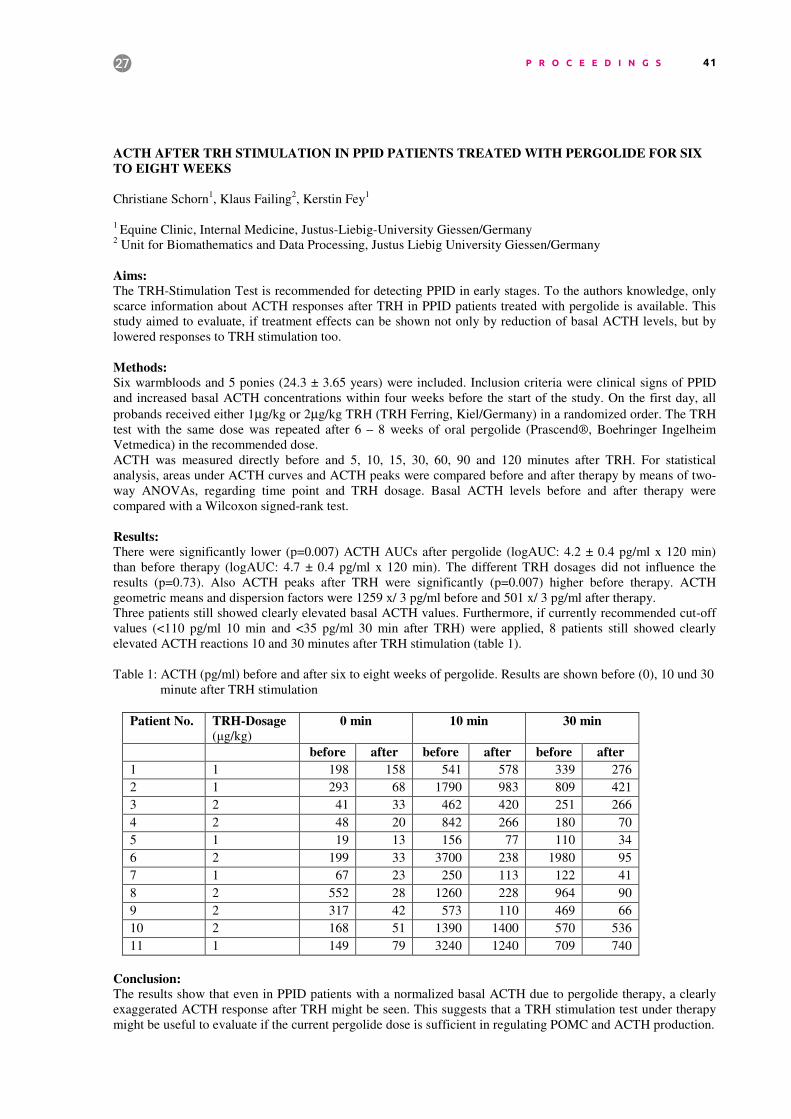
ACTH AFTER TRH STIMULATION IN PPID PATIENTS TREATED WITH PERGOLIDE FOR SIX
TO EIGHT WEEKS
Christiane Schorn1, Klaus Failing
2, Kerstin Fey
1
1 Equine Clinic, Internal Medicine, Justus-Liebig-University Giessen/Germany
2 Unit for Biomathematics and Data Processing, Justus Liebig University Giessen/Germany
Aims:
The TRH-Stimulation Test is recommended for detecting PPID in early stages. To the authors knowledge, only
scarce information about ACTH responses after TRH in PPID patients treated with pergolide is available. This
study aimed to evaluate, if treatment effects can be shown not only by reduction of basal ACTH levels, but by
lowered responses to TRH stimulation too.
Methods:
Six warmbloods and 5 ponies (24.3 ± 3.65 years) were included. Inclusion criteria were clinical signs of PPID
and increased basal ACTH concentrations within four weeks before the start of the study. On the first day, all
probands received either 1µg/kg or 2µg/kg TRH (TRH Ferring, Kiel/Germany) in a randomized order. The TRH
test with the same dose was repeated after 6 – 8 weeks of oral pergolide (Prascend®, Boehringer Ingelheim
Vetmedica) in the recommended dose.
ACTH was measured directly before and 5, 10, 15, 30, 60, 90 and 120 minutes after TRH. For statistical
analysis, areas under ACTH curves and ACTH peaks were compared before and after therapy by means of two-
way ANOVAs, regarding time point and TRH dosage. Basal ACTH levels before and after therapy were
compared with a Wilcoxon signed-rank test.
Results:
There were significantly lower (p=0.007) ACTH AUCs after pergolide (logAUC: 4.2 ± 0.4 pg/ml x 120 min)
than before therapy (logAUC: 4.7 ± 0.4 pg/ml x 120 min). The different TRH dosages did not influence the
results (p=0.73). Also ACTH peaks after TRH were significantly (p=0.007) higher before therapy. ACTH
geometric means and dispersion factors were 1259 x/ 3 pg/ml before and 501 x/ 3 pg/ml after therapy.
Three patients still showed clearly elevated basal ACTH values. Furthermore, if currently recommended cut-off
values (<110 pg/ml 10 min and <35 pg/ml 30 min after TRH) were applied, 8 patients still showed clearly
elevated ACTH reactions 10 and 30 minutes after TRH stimulation (table 1).
Table 1: ACTH (pg/ml) before and after six to eight weeks of pergolide. Results are shown before (0), 10 und 30
minute after TRH stimulation
Patient No. TRH-Dosage
(µg/kg)
0 min 10 min 30 min
before after before after before after
1 1 198 158 541 578 339 276
2 1 293 68 1790 983 809 421
3 2 41 33 462 420 251 266
4 2 48 20 842 266 180 70
5 1 19 13 156 77 110 34
6 2 199 33 3700 238 1980 95
7 1 67 23 250 113 122 41
8 2 552 28 1260 228 964 90
9 2 317 42 573 110 469 66
10 2 168 51 1390 1400 570 536
11 1 149 79 3240 1240 709 740
Conclusion:
The results show that even in PPID patients with a normalized basal ACTH due to pergolide therapy, a clearly
exaggerated ACTH response after TRH might be seen. This suggests that a TRH stimulation test under therapy
might be useful to evaluate if the current pergolide dose is sufficient in regulating POMC and ACTH production.
P R O C E E D I N G S 41
Owner Assessment of Long-Term Treatment of PPID
H.C. Schott II, J.R. Strachota. J.M. Marteniuk, Michigan State University
Aims: To assess owner satisfaction with long-term treatment of PPID.
Methods: Owners of 29 equids (28 horses and 1 pony) enrolled in a long-term safety study of Prascend® (1 mg
pergolide mesylate tablets) for treatment of pituitary pars intermedia dysfunction (PPID) were asked to complete a
survey about their experience with this treatment 10 years after the start of treatment.
Results: All equids were initially treated with a dose of 2 µg/kg, PO, q 24h and 26/29 equids had a dosage increase
to 4 µg/kg, PO, q 24h (maximum allowable dose for study) from 0.5 to 6 years after onset of treatment. Over the
course of the study, 25 of 29 equids died (n=4) or were subjected to humane euthanasia (n=21) between 1.5 and 10
years after onset of treatment. Death or euthanasia was attributed to complications of PPID, specifically laminitis, in
five equids while death in the remaining 20 equids was attributed to disorders associated with advancing age (i.e.,
acute colic [n=5], arthritis [n=4], poor dentition and wasting [n=4], neurological disorders [n=3], and sudden death
[n=4]). Of the 29 equid owners contacted, 25 (86%) completed the follow-up survey. With regard to their experience
with use of PRASCEND, 71% and 70% strongly agreed and 25% and 30% agreed that treatment with PRASCEND
improved their equids quality of life and prolonged lifespan, respectively. The improvement in clinical signs was
greatest for energy level (77%), hair coat (71%), and muscle mass (61%). Overall satisfaction with treatment on a
scale of 1-10 (10 best) was 5: 9%, 7: 9%, 8: 13%, 9: 17%, and 10: 52% and 87% of owners either agreed or strongly
agreed that they would provide lifelong treatment if they had another equid with PPID. However, medication cost
would be a factor: 26% and 57% of owners were willing to pay an annual cost of $500 or $1000, respectively, while
only 17% of owners would be willing to pay $1500 or more annually.
Conclusions: Owner satisfaction with PRASCEND as a treatment for PPID is high. Further, recognition of
improved energy level by equid owners is an important criterion to assess response to treatment. Finally, cost of
medication is likely an important factor for many equid owners faced with the decision of whether or not to pursue
lifelong medical treatment of PPID, especially since a dosage increase would likely be necessary over time.
Acknowledgements: The authors thank the dedicated equid owners that participated in this long-term study, Sue
Wismer and Lauren Houston for assisting with data collection, and Boehringer-Ingelheim Animal Health USA, Inc.,
Duluth, GA for providing PRASCEND for the participants in this study.
42 4th Global Equine Endocrine Symposium 2020

Equine metabolic syndrome in native United Kingdom ponies and cobs: Prevalence and risk factors
H.B. Carslake1, G.L. Pinchbeck
2 and C.M. McGowan
1.
1Institute of Aging and Chronic Disease,
2Institute of
Infection and Global Health, Faculty of Health and Life Sciences, University of Liverpool, Leahurst, Cheshire,
UK.
This work follows national and institutional guidelines for humane animal treatment and complies with relevant
legislation in United Kingdom.
This research has not been presented or published previously.
Word count: 464
Aims: To estimate the prevalence of EMS in native ponies and cobs aged 3–14 years in northwest England and
identify associated risk factors.
Methods: Animals were recruited via online databases and visited following an overnight fast. Blood samples
for measurement of serum insulin and glucose concentrations were obtained before, and 120 min after an in-feed
oral glucose test (OGT, 1 g dextrose/kg BW). Body and hoof morphometrics were recorded following a clinical
examination, and a face-to-face questionnaire was conducted with the owner examining the animal’s feeding,
exercise, housing and medical history. EMS was diagnosed based on published cut-offs for basal and 120-
minute insulin concentrations (insulin0 and insulin120, respectively). Explanatory variables were divided into two
groups: risk factors (e.g. signalment, BCS, season, management practices) and clinical manifestations (e.g.
previous laminitis, hoof morphology). Two–level (horse, yard), univariable logistic and linear regression were
used to examine associations between explanatory variables and binary (EMS positive/negative) and continuous
(loge insulin120) outcomes respectively. Two-level, multivariable regression analysis was then performed to
examine associations between risk factors and both outcomes.
Results: A total of 352 animals were sampled at 64 properties. After exclusions for PPID (n=4) and insufficient
consumption of glucose, 339 animals were retained for analysis of the binary outcome and 320 animals for the
continuous outcome. Median (IQR) age was 9 (6-11) years, and the most common breeds were Welsh (45%),
cob (25%) and Connemara (13%). Most animals (75.2%) were overweight (BCS 7-9).
The overall prevalence of EMS adjusted for clustering within yard was 23.3% (95%CI 17.9-29.8%). Risk
factors associated with increased odds of EMS in the multivariable model were increasing age (odds ratio [OR]
1.38/year; 95%CI 1.24-1.54), female (OR 2.13; 95%CI 1.13-4.01), Welsh Section A breed, a less active
principle use of the animal (OR 3.51; 95%CI 1.74-7.04), reduced time at grass during summer and being
overweight (OR 3.48; 95%CI 1.53-7.92). The same six risk factors were associated with increased insulin120,
with the addition of absence of winter rugging (coefficient (s.e.) 0.36 (0.16)). Regarding clinical manifestations,
animals having ≥1 episode of laminitis in the previous 5 years were 14.4 (95%CI 5.9-35.3) times more likely to
be EMS-positive than those without. Growth ring (OR 2.5 (95%CI 1.15-5.26)) and supraorbital fat scores of 3/3
were both associated with an increased risk of EMS compared to scores of 1/3. A greater increase in blood
glucose concentration during the OGT was associated with an increased risk of EMS, however basal glucose
concentration was not.
Conclusions: Equine metabolic syndrome is common in the population of animals studied. Assessment of hoof
growth rings, body condition score and other risk factors can be used to identify animals at increased risk of
EMS. Modifiable risk factors exist that may help guide management strategies.
Acknowledgements: This study was financially supported by Boehringer Ingelheim.
P R O C E E D I N G S 43
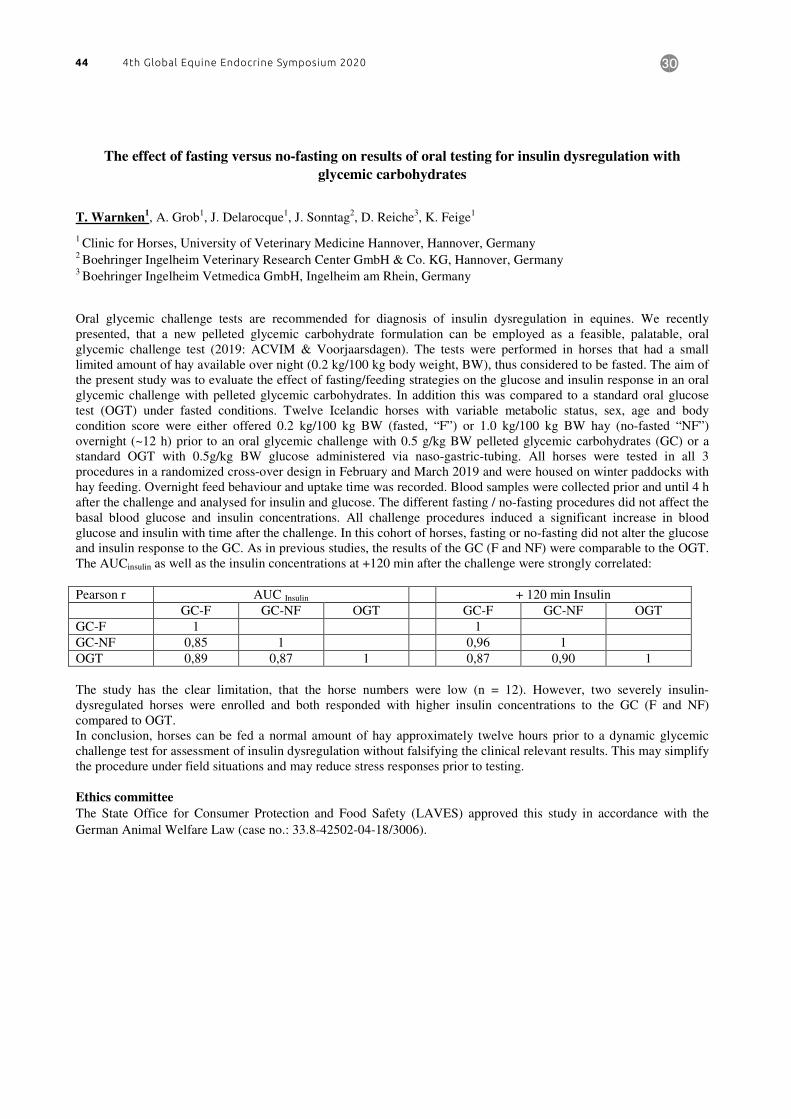
The effect of fasting versus no-fasting on results of oral testing for insulin dysregulation with
glycemic carbohydrates
T. Warnken1, A. Grob
1, J. Delarocque
1, J. Sonntag
2, D. Reiche
3, K. Feige
1
1 Clinic for Horses, University of Veterinary Medicine Hannover, Hannover, Germany
2 Boehringer Ingelheim Veterinary Research Center GmbH & Co. KG, Hannover, Germany
3 Boehringer Ingelheim Vetmedica GmbH, Ingelheim am Rhein, Germany
Oral glycemic challenge tests are recommended for diagnosis of insulin dysregulation in equines. We recently
presented, that a new pelleted glycemic carbohydrate formulation can be employed as a feasible, palatable, oral
glycemic challenge test (2019: ACVIM & Voorjaarsdagen). The tests were performed in horses that had a small
limited amount of hay available over night (0.2 kg/100 kg body weight, BW), thus considered to be fasted. The aim of
the present study was to evaluate the effect of fasting/feeding strategies on the glucose and insulin response in an oral
glycemic challenge with pelleted glycemic carbohydrates. In addition this was compared to a standard oral glucose
test (OGT) under fasted conditions. Twelve Icelandic horses with variable metabolic status, sex, age and body
condition score were either offered 0.2 kg/100 kg BW (fasted, “F”) or 1.0 kg/100 kg BW hay (no-fasted “NF”)
overnight (~12 h) prior to an oral glycemic challenge with 0.5 g/kg BW pelleted glycemic carbohydrates (GC) or a
standard OGT with 0.5g/kg BW glucose administered via naso-gastric-tubing. All horses were tested in all 3
procedures in a randomized cross-over design in February and March 2019 and were housed on winter paddocks with
hay feeding. Overnight feed behaviour and uptake time was recorded. Blood samples were collected prior and until 4 h
after the challenge and analysed for insulin and glucose. The different fasting / no-fasting procedures did not affect the
basal blood glucose and insulin concentrations. All challenge procedures induced a significant increase in blood
glucose and insulin with time after the challenge. In this cohort of horses, fasting or no-fasting did not alter the glucose
and insulin response to the GC. As in previous studies, the results of the GC (F and NF) were comparable to the OGT.
The AUCinsulin as well as the insulin concentrations at +120 min after the challenge were strongly correlated:
Pearson r AUC Insulin + 120 min Insulin
GC-F GC-NF OGT GC-F GC-NF OGT
GC-F 1 1
GC-NF 0,85 1 0,96 1
OGT 0,89 0,87 1 0,87 0,90 1
The study has the clear limitation, that the horse numbers were low (n = 12). However, two severely insulin-
dysregulated horses were enrolled and both responded with higher insulin concentrations to the GC (F and NF)
compared to OGT.
In conclusion, horses can be fed a normal amount of hay approximately twelve hours prior to a dynamic glycemic
challenge test for assessment of insulin dysregulation without falsifying the clinical relevant results. This may simplify
the procedure under field situations and may reduce stress responses prior to testing.
Ethics committee
The State Office for Consumer Protection and Food Safety (LAVES) approved this study in accordance with the
German Animal Welfare Law (case no.: 33.8-42502-04-18/3006).
44 4th Global Equine Endocrine Symposium 2020

The effect of fasting versus no-fasting on results of oral testing for insulin dysregulation with
glycemic carbohydrates
T. Warnken1, A. Grob
1, J. Delarocque
1, J. Sonntag
2, D. Reiche
3, K. Feige
1
1 Clinic for Horses, University of Veterinary Medicine Hannover, Hannover, Germany
2 Boehringer Ingelheim Veterinary Research Center GmbH & Co. KG, Hannover, Germany
3 Boehringer Ingelheim Vetmedica GmbH, Ingelheim am Rhein, Germany
Oral glycemic challenge tests are recommended for diagnosis of insulin dysregulation in equines. We recently
presented, that a new pelleted glycemic carbohydrate formulation can be employed as a feasible, palatable, oral
glycemic challenge test (2019: ACVIM & Voorjaarsdagen). The tests were performed in horses that had a small
limited amount of hay available over night (0.2 kg/100 kg body weight, BW), thus considered to be fasted. The aim of
the present study was to evaluate the effect of fasting/feeding strategies on the glucose and insulin response in an oral
glycemic challenge with pelleted glycemic carbohydrates. In addition this was compared to a standard oral glucose
test (OGT) under fasted conditions. Twelve Icelandic horses with variable metabolic status, sex, age and body
condition score were either offered 0.2 kg/100 kg BW (fasted, “F”) or 1.0 kg/100 kg BW hay (no-fasted “NF”)
overnight (~12 h) prior to an oral glycemic challenge with 0.5 g/kg BW pelleted glycemic carbohydrates (GC) or a
standard OGT with 0.5g/kg BW glucose administered via naso-gastric-tubing. All horses were tested in all 3
procedures in a randomized cross-over design in February and March 2019 and were housed on winter paddocks with
hay feeding. Overnight feed behaviour and uptake time was recorded. Blood samples were collected prior and until 4 h
after the challenge and analysed for insulin and glucose. The different fasting / no-fasting procedures did not affect the
basal blood glucose and insulin concentrations. All challenge procedures induced a significant increase in blood
glucose and insulin with time after the challenge. In this cohort of horses, fasting or no-fasting did not alter the glucose
and insulin response to the GC. As in previous studies, the results of the GC (F and NF) were comparable to the OGT.
The AUCinsulin as well as the insulin concentrations at +120 min after the challenge were strongly correlated:
Pearson r AUC Insulin + 120 min Insulin
GC-F GC-NF OGT GC-F GC-NF OGT
GC-F 1 1
GC-NF 0,85 1 0,96 1
OGT 0,89 0,87 1 0,87 0,90 1
The study has the clear limitation, that the horse numbers were low (n = 12). However, two severely insulin-
dysregulated horses were enrolled and both responded with higher insulin concentrations to the GC (F and NF)
compared to OGT.
In conclusion, horses can be fed a normal amount of hay approximately twelve hours prior to a dynamic glycemic
challenge test for assessment of insulin dysregulation without falsifying the clinical relevant results. This may simplify
the procedure under field situations and may reduce stress responses prior to testing.
Ethics committee
The State Office for Consumer Protection and Food Safety (LAVES) approved this study in accordance with the
German Animal Welfare Law (case no.: 33.8-42502-04-18/3006).
Glucose stimulates GLP-2 secretion from equine small intestine
P. E. M. Sibthorpe and M. A. de Laat
Science and Engineering Faculty, Queensland University of Technology, Brisbane, 4001, Queensland, Australia
Presenting author: Melody de Laat ([email protected])
The Australian Research Council funded this study.
The tissue used in this study was obtained from an abattoir and was exempt from requiring ethical approval
(Queensland University of Technology Animal Ethics Committee; 1800000144).
Aims: Glucagon-like peptide-2 (GLP-2) is secreted by enteroendocrine cells in the small intestine in response to
dietary nutrients. The peptide functions to increase epithelial cell density, small intestinal mass and glucose
transporter (SGLT-1) expression, which increases glucose uptake from the intestine. Equine insulin
dysregulation is associated with increased glucose bioavailability and the plasma GLP-2 concentration is higher
in insulin-dysregulated ponies, compared to metabolically healthy ponies. Thus, this study hypothesized a link
between glucose uptake and GLP-2 secretion in horses and aimed to determine in vitro 1) whether intestinal
GLP-2 secretion would increase in response to glucose and 2) whether inhibition of SGLT-1 would reduce
GLP-2 concentration.
Methods: Fresh equine jejunum (n = 6 per experiment; in triplicate) were collected from an abattoir, rinsed with
ice-cold saline and placed in Tyrode’s buffer with 2mM glucose on ice for 60 min. The serosa was then
removed with sharp dissection and the tissue sectioned into ~100mg explants, which were incubated for 60 min
at 37°C in 0 or 12mM glucose to determine whether glucose-dependent GLP-2 secretion occurred.
Subsequently, fresh explants were incubated separately with or without two inhibitors, phlorizin (1mM; an
SGLT-1 inhibitor) and phloretin (0.67mM; an SGLT-1 and GLUT-2 inhibitor), for 60 min with 12mM glucose.
An ELISA was used to measure GLP-2 secretion and production was normalised to the protein concentration of
each explant.
Results: Unstimulated explants (0mM glucose) had a basal GLP-2 secretion of 3.5 ng/mg protein. Stimulation
with 12mM glucose increased (P = 0.03) the secretion of GLP-2 by equine jejunum. This glucose-dependent
GLP-2 secretion was inhibited by both phlorizin (P = 0.02) and phloretin (P = 0.04).
Conclusions: This in vitro experiment has confirmed that the equine jejunum secretes GLP-2 and that secretion
increases in response to glucose stimulation. It also showed that SGLT-1 inhibitors reduced GLP-2 secretion in
horses (at 12mM glucose), compared to the positive control, possibly through a reduction in glucose uptake.
These data are important for improving our understanding of mechanisms potentially associated with increased
glucose bioavailability in insulin-dysregulated horses, and provide preliminary information on which future
investigations of the pathophysiology of insulin dysregulation can be based.
Acknowledgements: The Australian Research Council (DP180102418) funded this study and the authors
acknowledge technical assistance from Robert Spence.
P R O C E E D I N G S 45

Associations between systemic oxidative stress and endocrine parameters in horses and ponies
Sarah A. Vaughn, Margaret B. Lemons, Natalie A. Norton, Kelsey A. Hart
Department of Large Animal Medicine, University of Georgia College of Veterinary Medicine, Athens GA, USA
This work was conducted under the direction and oversight of the University of Georgia College of Veterinary
Medicine Clinic Research Committee to ensure compliance with institutional and national guidelines for humane
animal treatment.
This abstract/research has not previously been presented.
Aims. British native pony breeds are predisposed to obesity and insulin dysregulation (ID), and previous studies
show that healthy mixed breed ponies have increased circulating insulin and exaggerated oxidant responses to
inflammatory stimuli compared to horses. Additionally, some studies suggest that some pony breeds may be
predisposed to Pituitary Pars Intermedia Dysfunction (PPID). Oxidative damage to the hypothalamus is integral to
the development of PPID, but mechanisms leading to this oxidative damage are not well understood. Both obesity
and ID are associated with increased oxidative stress in other species; insulin and hypothalamic-pituitary-adrenal
(HPA) axis hormones such as cortisol also impact glucose metabolism, which produces reactive oxygen species. The
objective of this study was to compare plasma reactive oxygen metabolites (dROMs) and plasma antioxidant
capacity (PAC) between Welsh ponies and Quarter horses to determine if oxidative status is associated with
endocrine parameters and obesity. We hypothesized: 1) there is a pro-oxidant bias in ponies and animals with
obesity/ID, and 2) pro-oxidant markers are positively correlated with insulin concentration and markers of obesity.
Methods. Twenty-eight healthy client-owned Quarter horses (age 2-20 years) and 58 healthy client-owned Welsh
ponies (age 1-30 years) were used. Plasma total cortisol, ACTH, insulin, and leptin concentrations were measured
with validated immunoassays, and plasma dROMs and PAC were quantified using a novel photometric assay system
validated in our lab. Animals were sampled before feeding in their normal routine, and excluded if they met criteria
for PPID (resting ACTH > 50 pg/ml in spring). Data were compared between breeds with unpaired t tests and
Mann-Whitney tests, and Spearman correlation analysis performed to determine significant associations between
oxidative markers and endocrine and obesity parameters (P < 0.05).
Results. ACTH and leptin concentration were significantly higher in ponies than horses (P = 0.011 and P < 0.001
respectively), while cortisol and insulin did not significantly differ (P > 0.197). dROMs were significantly (P =
0.026) higher in ponies (116.4 UCarr) than horses (97.7 UCarr), but PAC did not differ significantly between breeds
(P = 0.677). dROMS were moderately and significantly positively correlated with insulin concentration (r = 0.316,
95% CI 0.01592 to 0.564, P = 0.034) and girth circumference (r = 0.334, 95% CI 0.03219 to 0.58, P = 0.027) in
ponies but not in horses (P = 0.345, P = 0.753 respectively).
Conclusions. These data demonstrate differences in endocrine parameters, oxidative markers, and associations
between the two in ponies and horses. The impact of increased reactive oxygen metabolites and associations
between pro-oxidant markers and insulin in ponies on oxidative damage to tissues like the hypothalamus – and thus
on the risk of PPID development – warrant further mechanistic investigation.
Acknowledgements. This research would not have been possible without the Welsh pony breeders and owners in
East Texas and the equestrian team at Texas A&M University who permitted sampling of their animals for this
work. This study was financially support by the UGA CVM’s Veterinary Medical Experiment Station.
46 4th Global Equine Endocrine Symposium 2020

Fecal extract from obese horses induces inflammation in vitro
Paige Roth1, Jone Stanley
1, Ana Chamoun-Emanuelli
1, Canaan Whitfield-Cargile
1, Michelle Coleman
1*
1 Veterinary Large Animal Clinical Sciences, College of Veterinary Medicine & Biomedical Sciences, Texas A&M
University, College Station, TX, USA
*Presenting Author; email: [email protected]
The following work was accepted by the Institutional Animal Care and Use Committee and the Clinical Research
and Review Committee of the College of Veterinary Medicine & Biomedical Sciences at Texas A&M University
(TAMU IACUC #2017-0284) and consent for each participating horse was obtained.
Aims: Obesity is a growing concern in the equine population, with an estimated prevalence of 23-31%. Importantly,
obesity in horses is associated with poor health outcomes and comorbidities, most critically of which are insulin
dysregulation (ID) and laminitis. Identification of molecular interactions linking gastrointestinal (GI) inflammation
and gut microbiota with host energy metabolism, lipid accumulation, and an inflammatory response in obese people
has resulted in development of novel therapeutic approaches to alter the gut microbial ecosystem to regulate obesity
and related pathologies. There is evidence in horses supporting the concept that obesity and ID may occur in
response to chronic, low-grade inflammation; however, the molecular origin and importance of this inflammation is
unclear. The objective of this study was to evaluate whether the enteric microbiome from obese horses could induce
an inflammatory response in vitro.
Methods: Filtered fecal extract from 14 obese (Body Condition Score (BCS) ≥ 7) and 14 non-obese (BCS ≥3 and
≤5) horses were exposed to RAW 264.7 murine macrophages. Cytokine concentrations were measured via ELISA,
following manufacturers’ protocol (R&D Systems, Minneapolis, MN).
Results: A significant increase in levels of pro-inflammatory cytokines Interleukin-1β (IL-1β), Tumor Necrosis
Factor-α (TNF-α), and Interleukin-6 (IL-6) were noted from obese horses compared to non-obese horses (P<0.001)
(Figure 1).
Conclusions: Overall, this study indicates that the microbiome mediates an inflammatory response in the GI tract.
Further, the increased levels of inflammatory markers induced by the microbiome of obese horses suggest important
differences in the enteric microbial composition of these horses.
Acknowledgements: This work was funded in part by the NIH T35 (NIH 5T35OD01099-15) and the Texas A&M
College of Veterinary Medicine & Biomedical Sciences, Department of Large Animal Clinical Sciences
Figure 1: Boxplot of inflammatory cytokine concentrations. Cytokine ELISA results for A) Il-1β B) TNF-α, and
C) IL-6 using fecal extract from 14 obese and 14 non-obese horses. The horizontal line represents the median, and
the top and bottom of the box extend to the 75% and 25% percentiles, respectively. The thin vertical extending to
the thin horizontal lines represent multiples of 1.75 times their respective interquartile range. The filled circles
represent each data point. A statistically significant difference between non-obese and obese horses was noted (P
<0.001) between obese and non-obese horses, for all three cytokines.
P R O C E E D I N G S 47

The equine pancreas in chronic hyperinsulinaemia
Ruth Morgan1,2*
, Daniella Teo and Roxane Kirton
1 University/BHF Centre for Cardiovascular Science, The Queen’s Medical Research Institute, University of
Edinburgh, UK
2 Royal (Dick) School of Veterinary Studies, University of Edinburgh, UK
Aim: Insulin dysregulation is the critical feature of equine metabolic syndrome and the development of
endocrinopathic laminitis. The most common type of insulin dysregulation identified in horses is “compensated”
insulin resistance in which the pancreas continues to produce insulin in the face of insulin resistance. In humans
persistent hyperinsulinaemia eventually leads to exhaustion of the beta cells of the pancreatic islets which can
no longer make insulin and as such these people must go on insulin therapy. Beta cell exhaustion is often
accompanied by amyloid deposition in humans. In horses, islet exhaustion is rarely identified and horses can go
for very long periods of time with very high circulating levels of insulin. The aim of this study was to
investigate the characteristics of the equine pancreas in chronic hyperinsulinaemia.
Method: Pancreata from healthy horses (n=7) and horses with fasting basal hyperinsulinemia (>100mIU/l) for
longer than 3 months (n=3) were collected at post mortem. Pancreata were weighed, photographed and sections
from the body and tail of each pancreas were fixed in 10% formalin prior to paraffin embedding. 5µm sections
were cut and H&E stained to examine the histomorphology. Immunohistochemistry staining for insulin,
glucagon and islet amyloid polypeptide (IAPP) was performed. Pancreas morphology and amyloid staining were
further investigated with an aldehyde fuscin stain and Congo Red staining respectively. Positive and negative
controls were used for all stains.
Results: Horses with basal hyperinsulinaemia had larger pancreases which were darker in colour. The islets
were clearly identified with the aldehyde fuscin stain. Two distinct cell types were identified with insulin (β
cells) and glucagon (α cells) staining. Horses with hyperinsulinaemia had an increased number of islets in the
pancreas body sections compared to healthy horses. IAPP was not detected in any of the horse pancreas samples
and no Congo Red staining for amyloid was detected in any samples.
Conclusion: Horses with hyperinsulinaemia have an increased number of islets which may explain the
persistent hyperinsulinaemic response. Horses with persistent hyperinsulinaemia do not deposit amyloid around
the islets as is seen in the human pancreas. The response of the equine pancreas to insulin resistance warrants
further investigation.
*Presenting Author: Ruth Morgan [email protected]
Work was carried out at the University/BHF Centre for Cardiovascular Science, The Queen’s Medical Research
Institute, University of Edinburgh, UK
The study was conducted with approval from the University of Edinburgh Veterinary Ethics Review Committee
in accordance with UK legislation.
48 4th Global Equine Endocrine Symposium 2020

1st Author Information:
Erica L. Macon MS, PAS, PhD Candidate
108 Gluck Equine Research Center
Lexington, KY, 40546
2nd
Author and Institution Information:
Patricia Harris,
Director of Science, MARS Horsecare UK Ltd;
Equine Studies Group, Waltham Centre for Pet Nutrition
Freeby lane
Waltham-on-the-Leics
LE 14TRT
United Kingdom
3rd
Author Information:
Amanda Adams, PhD
108 Gluck Equine Research Center
Lexington, KY, 40546
Institution Information for Author 1 & 3:
M. H. Maxwell Gluck Equine Research Center
Department of Veterinary Science
College of Agriculture, Food and Environment
University of Kentucky
Lexington, KY, 40546
Humane Treatment of Animals:
Both protocols (#2014-1224 & #2018-2886) followed the guidelines described by the Institutional Animal Care and
Use Committee (IACUC).
P R O C E E D I N G S 49

Insulinemic Responses to Non-Structural Carbohydrates and Crude Protein in Varying Concentrates in
Healthy and Insulin Dysregulated Horses
Aims: To examine insulin responses to concentrates varying in non-structural carbohydrates (NSC) and crude
protein (CP) in both the insulin dysregulated (ID) and non-insulin dysregulated (NID) horses.
Methods: Sixteen healthy (non-PPID) adult horses of mixed sex and breed were used for two studies: study A: n=8
ID & n=8 NID; and study B: n=11 ID & n=5 NID. Categorization (ID or NID) was determined by an oral sugar test
(OST). ID and NID animals did not differ in age, BW or BCS in either study but cresty neck scores were higher for
the IDs. Both A and B were crossover studies with a 1-week acclimation period before the insulin response to
feeding each diet was assessed. In study A, horses were catheterized using aseptic technique and blood collected 0,
30, 60, 75, 90, 105, 120, 150, 180, 210, 240 minutes postprandially and centrifugated at 800 g for 10 minutes.
Insulin analysis was done via RIA (Cornell University). In study A horses were fed 4 diets: 1) a commercial ration
balancer (RB) 2) research pellet (RP) 3) cracked corn w/ molasses (CC) 4) 50:50 mix of the RB & RP (Mix); with
an average intake rate of 1.02 + 0.05 g/kg BW. In study B, blood was collected at time 0 and 60 minutes
postprandially and was processed and analyzed similarly to A. Five diets were evaluated with an average intake rate
of 1.25 + 0.07 g/kg BW: 1a) low NSC pellet (LOW) 2a) RB 3a) oat groats (Oats) 4a) steam-flaked corn w/ molasses
(SF) 5a) CC. All diets were analyzed by Equi-Analytical (wet
chemistry; Table 1).
Table 1. Nutrient Concentrations for Treatment Diets. Values presented are means of the treatment diets on a
DM basis.
Results: ID and NID horses differed for the OST 60-minute postprandial sample pre-study A (39.4 + 15.6 µIU/mL
NID & 157.6 + 60.3 µIU/mL ID; P<0.001) and B (23.9 + 8.2 µIU/mL NID & 134.8 + 48.3 µIU/mL; P<0.001). In
Study A within the NID horses there was no significant effect (P=0.215) of diet on the AUC for insulin (AUCi), but
the AUCi was higher in the IDs (22,362.4 + 6,829.7 AUCi) compared to NIDs (6,145.3 + 830.4 AUCi; P<0.001) for
all diets. In ID the AUCi for the CC (31, 999.7 + 13,959.7 AUCi) was significantly higher than for the RP (16,403.2
+ 4,304 AUCi; P=0.04). In study B, within NID horses, the LOW (2.7 + 1.9 µIU/mL) had lower deltas than the
OATS (18.2 + 8.1 µIU/mL; P=0.012). ID delta insulins were lowest for LOW (8.91 + 9.28 µIU/mL) compared to all
other diets (69.4 + 15.9 µIU/mL; P<0.001).
Conclusions: In NID animals’ small amounts of high NSC feedstuffs did not promote a significant insulin response;
however, in the ID animals even such small intakes (~1g/Kg BW) promoted an insulin response other than for the
very low NSC pellet. These studies suggest that NSC is the main driver of the hyperinsulinemia responses in ID
horses.
Acknowledgements: MARS Horsecare & Buckeye Nutrition
Concentrate CP% NSC% WSC%
Study A
RB 36.9 14.3 9.2
RP 16.8 14.9 5.4
MIX 26.3 15.28 7.9
CC 9.3 74.4 8.95
Study B
RB 35.3 15.3 11
CC 9.6 70.9 8.3
SF 9.3 72.8 2.9
Oats 14 63.9 3
LOW 11.9 6.1 4.2
50 4th Global Equine Endocrine Symposium 2020
Insulin Dysregulated Horses: Responses to Varying Oral Sugar and Fasting to the Oral Sugar Test
Aims: To determine if dose or dietary state influence OST insulin responses in insulin dysregulated (ID) or non-
insulin dysregulated (NID) horses.
Methods: Sixteen mixed breed similarly aged adult horses, previously determined (multiple OST results) to be NID
(n=8) or ID (n=8) were used in a crossover study (Study A), with a 7-day wash out period between the low dose
(0.15 ml/kg BW; [LD]) and high dose (0.45 ml/kg BW; [HD]) OSTs. A grain-fasted basal blood (T0: 8-10am)
sample was collected followed by the oral administration of the appropriate Karo Light Corn Syrup dose and a blood
sample (T60) collected sixty minutes later. In cross-over Study (B), the LD OST was carried out either after a 3-hour
fast or directly off pasture (fed) in both ID (n=8) and NID horses (n=8), which were sampled at the same time (10-
11am). Insulin was determined by RIA (Cornell Endocrinology Lab). Data were transformed, resulting in normality,
and analyzed with a general fit model Minitab software.
Results: Insulin responses differed between NID and ID horses for both doses (P<0.001): LD : T0 ID – 47.5 + 33.7
µIU/mL & T0 NID – 10.26 + 6.43 µIU/mL, T60 ID – 118.7 + 93.1 µIU/mL & T60 NID – 18.50 + 8.72 µIU/mL, and
delta ID – 71.2 + 60.0 µIU/mL & delta NID – 8.24 + 4.35 µIU/mL; HD: T0 ID - 32.55 + 13.92 µIU/mL & T0 NID –
14.24 + 6.21 µIU/mL, T60 ID – 125.2 + 69.5 µIU/mL & T60 C – 18.92 + 7.37 µIU/mL, and delta ID – 92.7 + 62.2
µIU/mL & delta NID – 4.73 + 2.85 µIU/mL. There was no dose effect for T0, T60 or delta (P=0.685, P=0.485, &
P=0.774 respectively); however, the day of sampling influenced both T0 and T60 (P=0.044 & P=0.046,
respectively), but not delta insulin (P=0.182). Basal insulins differed between fed vs. fasted horses for both NID
(Fasted 8.8 + 1.6 µIU/mL & Fed 13.84 + 3.97 µIU/mL; P=0.006) and ID horses (Fasted 28.42 + 10.27 µIU/mL &
Fed 67.37 + 19.04 µIU/mL; P<0.001). There were no differences for T60 or delta insulins for either NID (Fasted
17.47 + 5.04 µIU/mL & Fed 18.25 + 6.89 µIU/mL, T60 P=0.095; Fasted 8.70 + 5.42 µIU/mL & Fed 5.31 + 5.30
µIU/mL, delta P=0.100) or ID horses (Fasted 101.2 + 29.1 µIU/mL & Fed 153 + 65.1 µIU/mL, T60 P=0.178; Fasted
66.5 + 41.1 µIU/mL & Fed 91.9 + 57.3, delta P=0.393).
Conclusion: Although there was no significant effect of dose, 2/8 (25%) ID horses in the current study would only
have been diagnosed as being ID by the HD OST, due to their LD OST T60 values falling under the currently
recommended cut-off level of 45 µIU/mL, suggesting that the HD might be preferable in borderline cases. Study B
showed that whilst basal insulins were significantly lower in fasted animals dietary state did not affect T60 and delta
responses suggesting that basal insulins should be carefully diagnosed in fasting animals and a dynamic test may be
more optimal.
P R O C E E D I N G S 51

Insulin signaling of liver and adipose tissue in insulin-dysregulated horses after oral
glucose administration
Florian Frers1, Julien Delarocque
1, Karsten Feige
1, Korinna Huber
2, Tobias Warnken
1
1 Clinic for Horses, University of Veterinary Medicine Hannover, Buenteweg 9, 30559 Hannover, Germany 2 Institute of Animal Science, Faculty of Agricultural Sciences, University of Hohenheim, Fruwirthstr. 35,
70599 Stuttgart, Germany
The mechanisms of peripheral insulin resistance (IR) are poorly understood in insulin-dysregulated horses.
Therefore, this study aimed to determining if insulin-dysregulation (ID) is associated with altered expression of
key proteins of the insulin signaling cascade (ISC) in liver (LT) and adipose tissue (AT) under basal and
stimulated conditions. Twelve Icelandic horses were subjected to an Oral Glucose Test (OGT) with 1g/kg bwt
glucose. Biopsies of LT and AT were taken at basal conditions and at 120 minutes of the OGT. Expression levels
of different key proteins of the ISC as well as their extent of phosphorylation were determined by semi
quantitative Western Blot in these biopsies. Corresponding insulin levels were measured by an equine optimized
ELISA (Mercodia, Uppsala). Insulin levels ≥ 110µIU/mL at 120 minutes during the OGT indicated that 6 horses
were insulin-dysregulated while 6 were not. No significant differences in basal protein expression could be
identified by two-way repeated measures ANOVA with Holm adjustment for multiple testing between groups.
Extent of phosphorylation of key proteins of the ISC showed differences in the molecular strategy of LT and AT
to respond to glucose stimulation. Linear regression of phosphorylated insulin receptor (InsR) against insulin
under stimulated conditions in LT revealed a significant positive linear relationship between both variables
(p=0.021) in healthy horses while it was negative in dysregulated horses (p=0.015). Phosphorylation of InsR in
LT appeared to be impaired in insulin-dysregulated horses. This indicated a liver specific mechanism
contributing to systemic IR in horses suffering from ID.
Ethics committee
The State Office for Consumer Protection and Food Safety (LAVES) approved this study in accordance with the
German Animal Welfare Law (case no.: 33.8-42502-04-18/2870).
· Abstract Withdrawn ·
52 4th Global Equine Endocrine Symposium 2020

Comparisons of basal insulin concentrations, oral sugar test results and euglycemic-
hyperinsulinemic clamp measurements in horses
Johan Bröjer, Sanna Lindåse, Katarina Nostell
Department of Clinical Sciences
Swedish University of Agricultural Sciences
Uppsala, Sweden
Presenting author: Johan Bröjer; email: [email protected]
The study was approved by the Ethical Committee for Animal Experiments, Uppsala, Sweden.
Aims:
To compare basal insulin concentrations (BIC), oral sugar test (OST) results and insulin sensitivity (IS)
measurements from the euglycemic-hyperinsulinemic clamp (EHC).
Methods:
Sixty horses of different breeds (age ≥ 4 years, warmblood horses (n=19); Icelandic horses (n=23); pony breeds
(n=18)) with varying degrees of IS were included in the study. All horses had normal plasma ACTH concentrations.
The horses underwent an oral sugar test (Dan Sukker Glucose Syrup; 0.2 mL/kg of body weight) followed by an
EHC the following day. Samples for determination of BIC (plasma insulin) were collected prior to the OST and after
feed withdrawal overnight. Samples for determination of plasma insulin concentrations during the OST were
collected at 60 and 90 minutes (INS60 and INS90 respectively). Insulin was determined by use of the Mercodia
Insulin or the Mercodia Equine Insulin ELISA as appropriate. Insulin sensitivity was expressed as the M-index,
calculated from an EHC. Cut-off values for IS determined by the M-index was set to 2.4 mg/kg/min whereas the cut-
off value for insulin dysregulation determined by the BIC or the INS60 and INS90 was set to 10 µIU/mL or 45
µIU/mL respectively.
Results:
Thirty-four horses were categorized as having insulin resistance and 26 as having normal IS based on the EHC.
Scatter plots of the correlation between BIC, INS60 or INS90 and the M-index showed an inverse relationship. When
IS decreased, the β-cell response (expressed as the BIC, INS60 or INS90) increased.
Scatter plots of the correlation between BIC and the INS60 or INS90 showed heteroscedasticity. Weighted Linear
Regression showed that the BIC were highly correlated with the INS60 and INS90 derived from the OST; r = 0.82 and
0.88 for INS60 and INS90, respectively.
Thirty-three or 34 horses were identified with insulin dysregulation (ID) based on the OST (for INS60 and INS90
respectively) and 34 horses were identified as ID based on the BIC. There were some inconsistencies in the
diagnosis of ID between the BIC and the OST with 3 or 4 horses categorized differently (ID or normal insulin
regulated) between methods.
Conclusions: The BIC and the INS60 and INS90 demonstrated a typical beta-cell response when compared to the IS. The BIC and
the INS60 and INS90 where highly correlated but due to the heteroscedasticity, the magnitude of the results from the
two diagnostic techniques may differ considerably for ID horses.
Acknowledgements:
Funding for this project was provided by the Swedish-Norwegian Foundation for Equine Research
P R O C E E D I N G S 53

Plasma metabolome of horses during oral glucose tests
Julien Delarocque1*
, Florian Frers1, Klaus Jung
2, Korinna Huber
3, Karsten Feige
1, Tobias Warnken
1
1Clinic for Horses, University of Veterinary Medicine Hannover, Foundation, Hanover, Germany
2Institute for Animal Breeding and Genetics, University of Veterinary Medicine Hannover, Foundation, Hanover,
Germany 3Institute of Animal Science, Faculty of Agricultural Sciences, University of Hohenheim, Stuttgart, Germany
*presenting author
Aims
This study aimed at describing the effect of oral glucose tests (OGTs) on the plasma metabolome of healthy and insulin
dysregulated horses.
Methods
Twelve horses were subjected to three OGTs (0.5 g/kg bodyweight glucose). The basal, 120 and 180 minutes samples
were analysed using a combined LC-MS/MS and FIA-MS/MS metabolomic assay (IDQ p180, Biocrates, Innsbruck).
Insulin concentrations were measured with an ELISA (Equine Insulin ELISA, Mercodia, Uppsala). Linear models were
employed to identify metabolites significantly varying over time or associated with level of dysregulation
(approximated by the area under the curve for insulin). Additionally, the ability of reduced sets of metabolites to
discriminate between horses with high and low insulin responses was investigated using partial least squares
discriminant analysis in a bootstrap approach.
Results
The metabolic response to the OGT is astoundingly similar to the one observed in humans. However, acylcarnitine
metabolism is impacted by the level of insulin dysregulation (FDR adjusted P-value=0.001). Moreover, some
phosphatidylcholines previously linked to liver conditions in other species, characterise the differential metabolic
response of horses with high insulin (FDR adjusted P-value=0.03). Lastly, highly performant predictive models can be
obtained relying on as few as 11 metabolites to identify horses with a high insulin response (sensitivity 96% [87–100%]
and specificity 89% [79–96%]).
Conclusions
The repercussions of insulin dysregulation on the energy metabolism are potentially associated with an impairment of
liver function and β-oxidation. Impacted metabolites could be of great use as biomarkers for this condition.
Acknowledgements
The authors wish to thank Professor Wolfgang Leibold for his support and providing the horses, and Dr Björn
Steinbjörnsson for his help during the experiments and dedicated care to the horses.
Ethics committee
The State Office for Consumer Protection and Food Safety (LAVES) approved the study in accordance with the German
Animal Welfare Law (case number: 33.19-42502-05-17A099).
Presentations prior to GEES
This work will be presented as a poster at the European College of Equine Internal Medicine congress in Valencia (21st–
23rd
November 2019).
54 4th Global Equine Endocrine Symposium 2020

Evaluation of three dynamic oral carbohydrate tests for insulin dyregulation in ponies
H.B. Carslake1, C. McG. Argo
1, G.L. Pinchbeck
2, A.H.A. Dugdale
1 and C.M. McGowan
1.
1Institute of Aging
and Chronic Disease, 2Institute of Infection and Global Health, Faculty of Health and Life Sciences, University
of Liverpool, Leahurst, Cheshire, UK.
This work follows national and institutional guidelines for humane animal treatment and complies with relevant
legislation in United Kingdom.
This research has not been presented or published previously.
Word count: 250
Aims: Clinical diagnosis of insulin dysregulation (ID) frequently involves oral tests in an attempt to capture
horses with enteroinsular axis dysfunction. Tests using simple sugars may not reflect naturally ingested starch-
based carbohydrates. This study aimed to evaluate one novel and two established oral carbohydrate tests for
diagnosis of ID in ponies.
Methods: Twelve mixed-breed ponies were enrolled in a randomised crossover study. Ponies were administered
an in-feed oral glucose test (OGT) (1g/kg glucose), oral sugar test (OST) (0.15ml/kg corn syrup), proprietary
breakfast cereal ‘WeetabixTM
’ (WEET) (1g/kg non-structural carbohydrate), or combined glucose-insulin
tolerance test (CGIT) weekly. Glycaemic and insulinaemic responses were monitored over 5 hours.
Results: Consumption of WEET was incomplete (33-73%) in 7/12 ponies; one was excluded (consumption
33%). Bivariate correlations between OGT, OST and WEET were all very strong for area under the curve (AUC)
and maximum concentration of insulin, (ρ=0.84-0.91, and ρ=0.83-0.92 respectively, P≤0.001), and non-
significant between CGIT and all oral tests. AUC for glucose was significantly correlated between OGT and
both WEET and CGIT (r=0.66 and r=0.74 respectively, P≤0.03). Using conventional ID cutoffs, dichotomous
results showed substantial agreement between CGIT and both OST (κ=0.8) and OGT (κ=0.67), and moderate
between OGT and OST (κ=0.5). For diagnosis of ID compared to CGIT, sensitivity and specificity of OST were
75% and 100% and OGT were 100% and 75% respectively.
Conclusions: Dichotomous diagnostic outcomes from oral tests using simple sugars compare reasonably well to
CGIT. WEET offers a diagnostic feedstuff with a consistent NSC content, but palatability may be poor.
P R O C E E D I N G S 55

Nationwide comparison of different methods used for measurement of equine insulin in
veterinary laboratories in Germany
Tobias Warnken1, Anastasios Moschos
2, Alexandra Diefenbach
3, Corinna Weber
4, Judith Winter
5, Martina
Hoedemaker6, Anne Grob
1, Karsten Feige
1
1 Clinic for Horses, University of Veterinary Medicine Hannover, Bünteweg 9, 30559 Hannover, Germany 2 IDEXX GmbH, Mörikestraße 28/3, 71636 Ludwigsburg, Germany 3 Biocontrol GmbH, Konrad-Adenauer-Straße 17, 55218 Ingelheim, Germany 4 LABOKLIN GmbH & Co. KG, Steubenstraße 4, 97688 Bad Kissingen, Germany 5 SYNLAB.vet GmbH, Turmstraße 21, 10559 Berlin, Germany 6 Clinic for Cattle, University of Veterinary Medicine Hannover, Bischofsholer Damm 15, 30173 Hannover,
Germany
Assessment of equine insulin dysregulation (ID) requires exact insulin quantification and has become even more
important in recent time. However, striking differences in insulin concentrations obtained from analyses
performed with different immunoassays exist. Therefore, the aim of the study was to test and compare
commonly used immunoassay methods used in German veterinary laboratories to quantify equine insulin in
samples obtained during diagnostic procedures for ID. Eighty-six serum samples were obtained at multiple time
points during oral glycemic challenges in seven Icelandic horses of variable metabolic status, sex, age and body
condition score. Samples were collected via jugular vein catheter, transferred into plain tubes for serum
preparation, were incubated at room temperature for 1 h and centrifuged at 3000 g for 6 min. Serum was split
into different aliquots, frozen, stored at −80 °C and shipped on dry ice. Samples were measured with four
different methods 1) ADVIA Centaur Insulin (Siemens Healthcare GmbH, Eschborn, Germany – Method A), 2)
Immulite Insulin 1000 (Siemens Healthcare GmbH, Eschborn, Germany – Method B), 3) Immulite Insulin 2000,
(Siemens Healthcare GmbH, Eschborn, Germany – Method C) and 4) Equine Insulin ELISA (Mercodia AB,
Uppsala, Sweden – Method D) in six veterinary laboratories. Samples contained a broad range of insulin
concentrations ranging from normal resting concentrations to pathological high postprandial insulin
concentrations reflecting hyperinsulinemia after glycemic challenge. The number of samples with measurable
insulin concentrations differed significantly between methods, with method B showing the lowest number of
results (n=60) due to 26 samples which had been measured below the specific measuring range. Insulin
concentrations differed significantly between methods, as well as between laboratories using the same method.
Analyses with method A showed the lowest concentrations and the least variation. In contrast, method D
supplied the highest concentrations with the broadest intra-assay variation. Analyses with method B and C
supplied significantly different (P<0.001) insulin concentrations. Deming regression analyses and Bland-Altman
analysis indicated method-dependent bias and limits of agreements with presence of proportional error.
According to these results, insulin concentrations obtained by the different methods used for equine insulin
analyses cannot be used interchangeable. Basal insulin concentrations and especially insulin concentrations
measured in samples obtained during dynamic oral testing with expected higher insulin concentrations should be
interpreted in consideration of the immunoassay method used. Interpretation of insulin concentrations obtained
with different insulin assays without taking into account the assay specific performance characteristics may lead
to a biased differentiation of diseased and healthy animals based on previously published reference intervals. The
reported data provide a first basis for comparison of insulin concentrations measured in different laboratories and
may allow extrapolation for application of references ranges and cut-off values originally reported for another
diagnostic test and immunoassay combination. Although taking into account, that combinations of testing
protocols and immunoassay methods used for analyses of samples obtained during dynamic testing can increase
or decrease test sensitivity dramatically.
Ethics committee
The State Office for Consumer Protection and Food Safety (LAVES) approved this study in accordance with the
German Animal Welfare Law (case no.: 33.8-42502-04-18/3006).
· Abstract Withdrawn ·
56 4th Global Equine Endocrine Symposium 2020

The research reported in this abstract was undertaken at the University of Liverpool, United Kingdom. This
abstract has not been presented previously.
The study did not include animal participants, therefore international, national, or institutional guidelines for
humane animal treatment are not applicable. Respondents submitted all data anonymously and indicated their
consent by ticking a check box prior to commencing the questionnaire. The study was granted ethical approval
by the University of Liverpool’s Committee on Research Ethics.
Translating research in to practice: adoption of endocrine diagnostic testing in cases of laminitis
Ireland, J.L. and McGowan, C.M.
Institute of Veterinary Science, Faculty of Health and Life Sciences, Leahurst Campus, University of Liverpool.
Chester High Road, Neston, Wirral, CH64 7TE.
Presenting Author Email Address: [email protected]
Aims: to investigate current diagnostic approaches employed by veterinary surgeons for horses/ponies
presenting with clinical signs consistent with laminitis and to evaluate research knowledge translation regarding
endocrinopathic laminitis through exploring changes in diagnostic approach over time.
Methods: A survey of equine veterinary surgeons currently working within the United Kingdom was
undertaken using a self-administered online questionnaire, designed using an online survey tool
(www.kwiksurveys.com). During the 56th
Congress of the British Equine Veterinary Association (BEVA),
veterinary surgeons attending the University of Liverpool’s commercial exhibition stand were invited to
participate in the study, and participants provided their responses anonymously on a supplied Apple iPad.
Additionally, a link to the questionnaire was promoted via social media.
Results: A total of 141 veterinary surgeons meeting study inclusion criteria submitted useable questionnaires. Respondents had graduated from their primary veterinary degree a median of 8 years previously (inter-quartile
range (IQR) 3-17 years). The majority of respondents’ current employment was in a solely equine clinical
veterinary role, with 46.1% working in a 100% equine first opinion/ambulatory practice and a further 21.3%
working in a 100% equine role that combined equine first opinion/ambulatory practice and referral hospital. From a list of diagnostic techniques and laboratory tests, respondents were asked to indicate the frequency with
which they would perform each, both at the first examination and on subsequent re-examination(s), when
presented with a horse/pony/donkey with a clinical suspicion of laminitis, but no signs of systemic illness or
pyrexia (Figure 1).
Overall, 83.6% of respondents reported that their diagnostic approach to laminitis cases had changed since they
graduated. Of the respondents whose diagnostic approach had changed, 97 volunteered a description of what
aspect(s) of their approach had altered. The most frequently reported change in diagnostic approach was
increased use of endocrine testing for PPID and/or EMS (88.7%), followed by changes in approach to
radiography (14.4%). The most frequently reported factors influencing change in diagnostic approach to
laminitis were personal experience (73.5%), research or evidence-based veterinary medicine (70.1%) and
Continuing Professional Development (CPD) activities/events (68.4%). Veterinary surgeons who reported
changing their diagnostic approach had been qualified for a median of 10 years (IQR 5 – 18 years) compared to
a median of 2 years (IQR 1 – 4 years) for those who reported no change in their approach to laminitis (p<0.001). Current role was significantly associated with change in diagnostic approach to laminitis (p=0.05): only 58.8%
of respondents working within a mixed practice reported a change in their diagnostic approach compared to
>86.2% of vets working in 100% equine or in academia, research or equine industry.
Conclusions: The results of this study demonstrate successful translation of research knowledge in to equine
practice, with the vast majority of respondents indicating that they have adopted endocrine diagnostic testing
within their routine approach to laminitis cases. However, measurement of insulin was undertaken less
frequently than ACTH, highlighting an important area for future knowledge dissemination and veterinary
education.
Acknowledgements: The authors gratefully acknowledge all participating veterinary surgeons, and staff of the
University of Liverpool Veterinary Postgraduate Unit who assisted with survey recruitment and administration.
P R O C E E D I N G S 57

58 4th Global Equine Endocrine Symposium 2020

Is the magnesium metabolism altered in horses with insulin dysregulation?
Judith C. Winter1, Eva Müller
1, Gerhard Sponder
2, Roswitha Merle
3, Jörg R. Aschenbach
2 and Heidrun Gehlen
1
1Equine Clinic: Surgery and Radiology,
2Institute of Veterinary Physiology,
3Institute of Veterinary
Epidemiology and Biostatistics; Freie Universität Berlin
Corresponding author
Judith C. Winter
Oertzenweg 19b
14163 Berlin
The study has not been presented or published previously. The study was not declared according to the German
Animal Protection Law § 8,1 because all blood samples were taken as part of a routine examination in horses
presented with typical clinical sign of Equine Metabolic Syndrome. All horse owners approved the use of their
horses’ blood samples in this study in writing.
The Equine Metabolic Syndrome (EMS) is one of the most common endocrinopathies in horses worldwide with
parallels to human Diabetes mellitus type 2. In both diseases, patients show an insulin dysregulation as a key
feature. Magnesium metabolism, especially the intracellular magnesium concentration [Mg2+
]i, plays an
important role in human diabetes mellitus. These patients often exhibit a magnesium deficit in the serum or at the
cellular level and multiple studies have demonstrated the beneficial effect of magnesium supplementation on
insulin sensitivity. The aim of this study was to evaluate [Mg2+
]i in horses with insulin resistance and to examine
a possible association with other markers of insulin dysregulation. The hypothesis was tested, that [Mg2+
]i is
inversely correlated with parameters of insulin resistance. The study included 38 horses with a positive
combined glucose insulin tolerance test (CGIT) and phenotypic signs of EMS. Baseline glucose (G0), glucose
curve, baseline insulin (I0), insulin after 45 minutes (I45), total serum magnesium concentration and [Mg2+
]i were
measured. The reciprocal inverse square of insulin (RISQI), the modified insulin-to-glucose ratio (MIRG) and
the insulin difference (I45-0) were calculated. A t-test for independent samples was used to compare [Mg2+
]i in
healthy and EMS horses. Linear regression analyses with uni- and multivariable models were calculated to
evaluate the influence of [Mg2+
]i on all other blood and clinical parameters in EMS horses. Compared to healthy
controls, [Mg2+
]i was significantly lower in horses with EMS (P = 0.015). Univariable linear regression models
showed significant associations between I0 (P = 0.004, b = 0.006), I45 (P = 0.006, b = 0.001), I45-0 (P = 0.008, b =
0.001), RISQI (P = 0.009, b = -0.158), MIRG (P < 0.001, b = 0.015) and [Mg2+
]i. The multivariable model
revealed that only MIRG was significantly associated with [Mg2+
]i whereas the other factors had no additional
influence. Horses with insulin dysregulation exhibited a significantly lower [Mg2+
]i than healthy horses, what
can partially be reversed by increased secretion of insulin. These findings substantiate the important
interconnection of the insulin and magnesium metabolism and its relevance in Equine metabolic Syndrome.
P R O C E E D I N G S 59

Title: Dynamics of incretins and insulin in hospitalized foals
Author: Rings, Lindsey1; Swink, Jacob1; Dunbar, Laura1; Kamr, Ahmed1; Dembek, Katarzyna2; Barr, Bonnie3;
Toribio, Ramiro1,*
Institution: 1The Ohio State University;
2Iowa State University;
3Rood and Riddle Equine Hospital
*Presenting author: [email protected]
Background: Incretins are factors secreted from the gastrointestinal tract in response to oral nutrients and amplify
insulin secretion in response to a meal. Glucagon-like peptide-1 (GLP-1) and glucose-dependent insulinotropic
polypeptide (GIP) are the main incretins. Incretins and insulin comprise the enteroinsular axis (EIA), which is
essential for energy regulation. Disorders of energy homeostasis are frequent in critically ill foals. It has been
proposed that EIA dysfunction plays a role in equine insulin dysregulation/equine metabolic syndrome.
Gastrointestinal disease and anorexia are common in sick foals and could interfere with EIA activity, further
disturbing energy regulation. We recently showed that healthy foals have a functional EIA. Information on the EIA
in sick foals is lacking, but could enhance our understanding of energy homeostasis in sick equine neonates.
Aims/hypothesis: The goal of this study was to evaluate the dynamics of GLP-1, GIP, and insulin in healthy and
hospitalized foals. We hypothesized that activity of the EIA will be impaired in foals with severe disease, with lower
incretin and insulin concentrations compared to healthy and sick non-septic (SNS) foals. We also proposed that EIA
disruption will be more evident in non-surviving foals.
Methods: Blood samples were collected at 0 (admission), 24, 48 and 72 hours into hospitalization from 24 septic, 18
SNS, and 10 healthy foals, of < 3 days of age. Blood was collected into tubes containing protease and dipeptidyl
peptidase 4 (DPP-4) inhibitors. Disease severity was determined based on clinical and hematologic findings. Foals
that died or were euthanized due to grave prognosis were included. Plasma insulin and incretin concentrations were
measured by validated immunoassays. Data were analyzed by non-parametric methods.
Results: On admission, septic foals had lower plasma insulin and GIP, but higher GLP-1 concentrations than healthy
foals (P < 0.05). GIP concentrations were lower in hospitalized and septic compared to healthy foals at all time
points (P < 0.05). During hospitalization, insulin concentrations remained lower in septic and SNS compared to
healthy foals (P < 0.05). GLP-1 concentrations decreased significantly in septic and SNS foals at 48 and 72 hours
compared to admission values (P < 0.05). No difference in insulin and incretin concentrations was found between
foals with and without gastrointestinal disease. Insulin concentrations were lower in non-surviving foals (P < 0.05).
In healthy foals, there was a positive correlation between insulin, GLP-1 and GIP, and between GLP-1 and GIP at
all sampling points. However, no correlation existed between these hormones in hospitalized foals.
Conclusions: Findings from this study indicate that critical illness alters the EIA in newborn foals. Despite septic
foals having high GLP-1 concentrations, insulin concentrations remained lower, suggesting a disconnect between
the GLP-1 and insulin component of the EIA in critically ill foals, which appears to be mainly at the β-cell level.
The positive association between incretins and insulin in healthy foals supports the functionality of the EIA. Our
results also favor a role of the intestinal endocrine system on energy homeostasis during health and disease in
newborn foals.
Word count: 493 (500)
Acknowledgements: This study was funded by the OSU Equine Research Funds. The authors are grateful to
clinicians, residents, and staff at the OSU Equine Hospital and Rood and Riddle Equine Hospital for their assistance
with sample collection and processing.
Note: This study was approved by the OSU Institutional Animal Care and Use Committee and adhered to national
and international principles of humane treatment of animals in veterinary research. Some of this information was
presented at the 2019 ACVIM forum.
60 4th Global Equine Endocrine Symposium 2020

The Effect of an Alpha2-adrenoceptoragonist and –antagonist in Horses with and without Insulin Dysregulation N.P. Karikoski, J.R. Box, H. Tanskanen, M.R. Raekallio
Aims: Investigate the effects of an alpha2-adrenoceptor agonist (detomidine) and -antagonist (vatinoxan) on blood glucose (BG) and insulin concentrations in horses with and without insulin dysregulation (ID). Methods: Finnhorses with (n=8, 12.8±3.4 years) and without (n=8, 10.6±4.5 years) ID (based on three preceding oral sugar tests) were fasted overnight. Each horse was assigned to four treatments: saline (SAL), detomidine (0.02 mg/kg) (DET), vatinoxan (0.2 mg/kg) (VAT), and their combination (DET+VAT) by means of a blinded cross-over design. Baseline venous blood samples were taken for BG and insulin concentration analysis, then again at 1, 2, 4, 6, and 8 hours after treatment (given as a single IV bolus). Insulin was analyzed with a human insulin-specific radioimmunoassay (Merck Millipore HI-14K). Blood glucose was analyzed immediately after collection with a glucometer (Alpha-TRAK II). Results: Peak mean BG, 12.7±1.9 mmol/L, occurred 1 hour after DET and did not differ between groups. At the same time point, BG was 6.9±0.9 after DET+VAT and 5.6±0.4 mmol/L after VAT. Mean serum insulin concentration peaked 4 hours after DET and was higher in ID group (p=0.026). In ID group, the peak insulin (24.2±15.0 µIU/mL) was higher (p ≤ 0.037) after DET than after other treatments; however, there was no difference between treatments in horses without ID. Conclusions: Vatinoxan prevented or alleviated the detomidine-induced increase in BG, but did not affect BG when administered alone. A subsequent compensatory increase in serum insulin concentration was detected in horses with ID, which was significantly reduced by vatinoxan. Acknowledgements: The authors would like to thank Vetcare for providing funding for this study. Presenting Author:
Ninja Karikoski, DVM PhD PL 57 00014 University of Helsinki [email protected]
Institutional Affiliation: University of Helsinki Department of Equine and Small Animal Medicine Faculty of Veterinary Medicine Helsinki, Finland Animal Use Approval: This study was approved by the National Animal Experimentation Board of Finland.
P R O C E E D I N G S 61
Factors associated with critical illness related corticosteroid insufficiency (CIRCI) in adult horses
Stewart AJ1,2,3, Hackett E4, Towns TJ2, Bertin FR1
School of Veterinary Science, The University of Queensland
Aim: Illness-associated stress results in elevation in cortisol concentration; however, in critical illness related
corticosteroid insufficiency (CIRCI), cortisol concentrations and adrenal response to ACTH stimulation are
inadequate. The clinical features and consequences of CIRCI have not been described in adult horses.
Methods: Medical records from emergency admissions in which stimulation with 0.1 µg/kg of synthetic ACTH was
performed were reviewed. CIRCI was defined as baseline cortisol <2.6 µg/dL or delta-cortisol <1.9 µg/dL. Variables
associated with CIRCI, survival, systemic inflammatory response syndrome (SIRS) and presence of ischemic lesions
were investigated.
Results: Sixty-nine horses were included of which 29% had CIRCI at admission, an additional 14% developed
CIRCI during hospitalization, 25% died, 67% had SIRS and 32% had ischemic lesions. At admission, horses with
CIRCI had higher ACTH concentrations, lower cortisol, delta-cortisol and insulin concentrations and were less
likely to survive (P<0.03). Survivors had lower ACTH and cortisol concentrations at admission and on day 2, higher
post-stimulation cortisol on admission and on day 2 and were less likely to have CIRCI, ischaemic lesions or reflux
(P<0.04). Horses with SIRS had higher glucose concentrations (P<0.01). Horses with ischaemic lesions had higher
ACTH, cortisol and glucose concentrations at admission, lower insulin concentrations on day 2 and were more
likely to have SIRS and not survive (P<0.05). No multivariable analysis could be fitted for any outcomes.
Conclusions: CIRCI in adult horses is common, characterized by high ACTH, but low cortisol and low delta-
cortisol and is associated with non-survival.
Acknowledgements:
Funding provided by the American College of Veterinary Emergency and Critical Care research award and Morris
Animal Foundation: Veterinary Student Scholar Program. Thanks to Heather Weaver, Bradley Johnson, Rebecca
Funk, Amelia Munsterman, Christina Hewes, Anne A Wooldridge and Erin S. Groover for assistance with patient
enrolment and sample collection and Katherine A. Busch, Qiao Zhong for technical assistance.
Presenting Author: Allison Jean Stewart, Building 8114, The University of Queensland, School of Veterinary
Science, Gatton Campus, Gatton, Queensland, Australia, 4343 [email protected]
The research was performed at: 1 School of Veterinary Science, The University of Queensland, Gatton, Queensland, Australia
2 Department of Clinical Sciences, College of Veterinary Medicine, Auburn University, Auburn, Alabama, USA
3 Swedish University of Agricultural Sciences, Uppsala, Sweden.
4 Colorado State University, College of Veterinary Medicine & Biomedical Sciences, Fort Collins, USA
The work followed institutional guidelines for humane treatment and complied with relevant USA legislation. All
aspects of the study were approved by the Auburn and Colorado State Universities Institutional Laboratory Animal
Care and Use Committees (20091564, 09-079A-01) and the College of Veterinary Medicine Clinical Research
Review Committee, with signed owner’s consent obtained for ACTH stimulation tests.
62 4th Global Equine Endocrine Symposium 2020
Title: Sex hormone concentrations differ between healthy and critically ill foals
Author: Swink, Jacob1; McAuley, Rachel1; Snyder, Hailey1; Rings, Lindsey1; Dembek, Katarzyna2; Gilsenan,
William3; Kamr, Ahmed
1; Toribio, Ramiro
1,*
Institution: 1The Ohio State University;
2Iowa State University;
3Rood and Riddle Equine Hospital
*Presenting author: [email protected]
Background: Neonatal bacterial infections remain the main cause of mortality in newborn foals. Critical illness
alters multiple endocrine systems in newborn foals. Most research on steroid hormones in foals has focused on
cortisol and stress. However, more recently we and others showed that concentrations of steroids with neuroactive
properties (progestogens) are elevated in newborn foals with various disorders (sepsis, prematurity, and neonatal
maladjustment syndrome). The functions of these steroids in the equine fetus remain unclear, but is likely that they
influence organ differentiation and function, neuronal plasticity, and immunity. While some information has been
generated on progestogens in newborn foals, little is known about estrogens and androgens in healthy and sick
equine neonates. Abnormal sex steroid concentrations in sick newborn foals could reflect fetal maturity, disease
severity, delayed steroid metabolism, or placental dysfunction.
Aims/Hypothesis: The goal of this study was to measure sex steroids in newborn foals with various levels of disease
severity and to determine their association with outcome. We hypothesized that estrogens and androgens will remain
elevated in proportion to disease severity and mimic changes seen for progestogens in sick foals.
Methods: Blood samples were collected on admission (0) and at 24, 48, and 72 hours from 15 healthy, 40 septic, and
25 sick non-septic (SNS) foals of <3 days of age. History and clinicopathologic variables were used to classify
disease severity (healthy, SNS, septic) and outcome. Serum estrogens (17β-estradiol, estrone), androgens
(testosterone, dihydrotestosterone [DHT], dehydroepiandrosterone sulfate [DHEAS]), progestogens (progesterone),
and glucocorticoids (cortisol) concentrations were measured using immunoassays. Data were not normally
distributed and analyzed by non-parametric methods.
Results: At admission, septic foals had higher 17β-estradiol, estrone, testosterone, DHT, progesterone, and cortisol
concentrations than SNS and healthy foals (P<0.05). All steroid hormones declined in healthy and SNS compared to
septic foals. Nonsurviving foals had higher 17β-estradiol, testosterone, DHEAS, DHT, and progesterone (P<0.05)
during hospitalization compared to survivors. Dummy foals had higher 17β-estradiol, progesterone, and DHEAS
(P=0.05), but not no difference in other steroid compared to healthy foals.
Conclusions: Sex steroid hormone concentrations differed between healthy and critically ill foals, were associated
with disease severity and may play a role in or reflect a response to illness. Abnormal androgen and estrogen
concentrations in critically ill foals may indicate impaired steroid metabolism, unique aspects of the foal stress
steroid response (adrenocortical activity), and/or dysfunction of the fetomaternal unit.
Word count: 388
Acknowledgements: This study was funded by the OSU Equine Research Funds and the Grayson-Jockey Club
Research Foundation. The authors are grateful to clinicians, residents, and staff at the OSU Equine Hospital and
Rood and Riddle Equine Hospital for their assistance with sample collection and processing.
Note: This study was approved by the OSU Institutional Animal Care and Use Committee and adhered to national
and international principles of humane treatment of animals in veterinary research. Some of this information was
presented at the 2019 ACVIM forum.
P R O C E E D I N G S 63

Presenting authors name, address and email address
Patricia Harris
Equine Studies Group, WALTHAM Centre for Pet Nutrition, Waltham-on-the-Wolds,
Melton Mowbray, Leics. LE14 4RT
• Details of the institution where the research was performed
Equine and Livestock Nutrition Services (ELNS)
Pantafallen Fach,
Tregaron,
Ceredigion
Wales
SY25 6NG
• A statement that the work follows international, national, and/or institutional
guidelines for humane animal treatment and complies with relevant legislation in the
country in which the study was conducted.
The project was approved by the RCVS Ethics Review Panel
• The abstract has not been previously presented or published
Title: Comparison of three restricted grazing practices for equine bodyweight management during the UK grass
growing season
Authors: Longland A and Harris P.A.
Aims: To compare the efficacy of three restricted gazing practices on managing pony bodyweight
Methods: 12 mature (4-20 years) ponies (BCS 4.0-6.0) were divided into 4 groups of 3 animals matched for
weight/height and secondarily BCS and assigned to one of three grazing restriction practices. After an
acclimation period, ponies were individually pastured in electric fenced paddocks with a diverse composition of
species which had been ‘topped’ to a constant height (15cm) to ensure, uniform vegetative growth. Two days
before trial commencement, herbage DM /square meter was directly determined (through clipping, weighing
and drying of ≥6 samples per paddock), enabling determination of individual paddock herbage yield. Paddock
width (10m) was constant but length was individually adjusted (for the pony grazing that paddock) to give a
total area equivalent to 1.5% of individual BW (plus 10% to allow for wastage) as herbage DM per day for 28
days. The three practices were : (TA) no other restriction ; (SG1 ) a ‘lead ‘ fence was placed across the width
of the paddock to allow fresh grass to be accessed each day by moving the lead fence 1/28th
of the paddock
length daily; (SG2) ponies were strip grazed with both a ‘lead ‘ and a ‘back ‘ fence with the back fence moving
the same distance as the lead fence daily. Ponies received a low-calorie forage balancer (Spillers ™ Lite and
Lean) at 100g/100kg BW/d and were allowed to interact in social groups for ca. 30 mins per day in a 25 x 45 m,
sand and rubber-floored outdoor arena. Droppings were removed from paddocks twice daily. Bodyweight
(BW), Cresty neck score (CNS) and Body condition score (BCS) (were monitored before, at least weekly during
and after the 28-day study. ANOVA was used to compare bodyweight changes between treatments and
differences in BCS and CNS within each treatment from the start to the end of the trial were subjected to paired
t-tests. Significance was accepted at p<0.05.
64 4th Global Equine Endocrine Symposium 2020
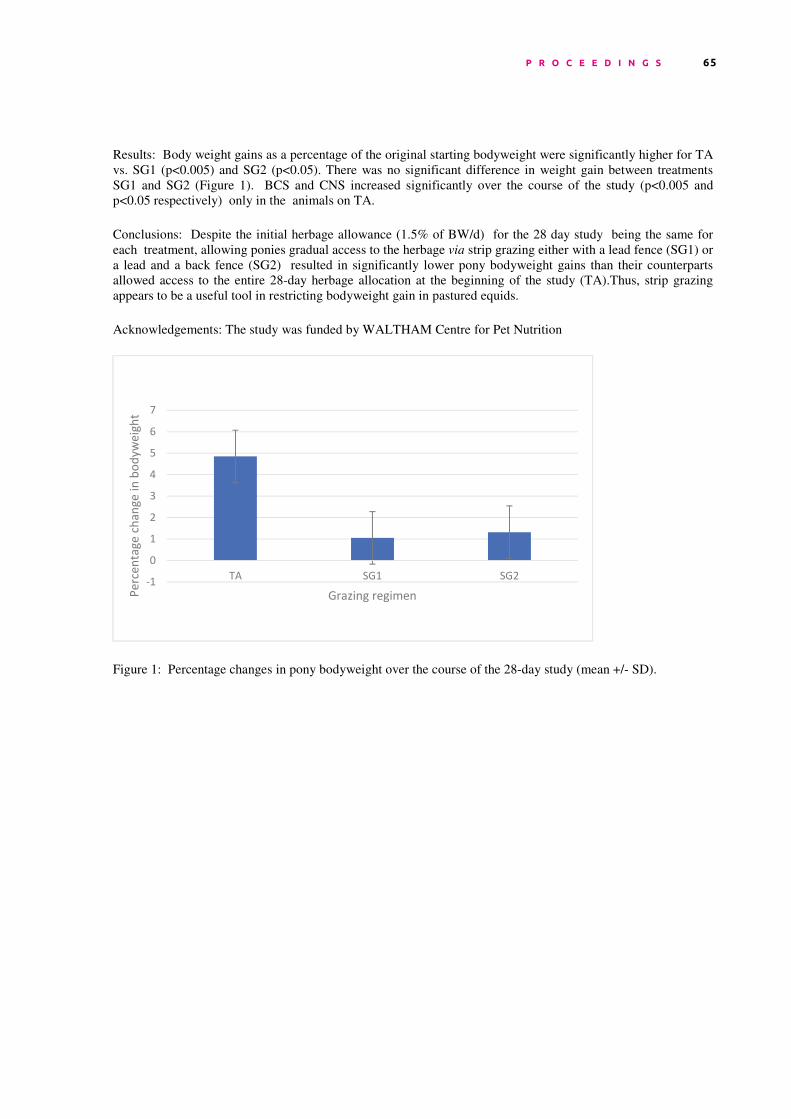
Results: Body weight gains as a percentage of the original starting bodyweight were significantly higher for TA
vs. SG1 (p<0.005) and SG2 (p<0.05). There was no significant difference in weight gain between treatments
SG1 and SG2 (Figure 1). BCS and CNS increased significantly over the course of the study (p<0.005 and
p<0.05 respectively) only in the animals on TA.
Conclusions: Despite the initial herbage allowance (1.5% of BW/d) for the 28 day study being the same for
each treatment, allowing ponies gradual access to the herbage via strip grazing either with a lead fence (SG1) or
a lead and a back fence (SG2) resulted in significantly lower pony bodyweight gains than their counterparts
allowed access to the entire 28-day herbage allocation at the beginning of the study (TA).Thus, strip grazing
appears to be a useful tool in restricting bodyweight gain in pastured equids.
Acknowledgements: The study was funded by WALTHAM Centre for Pet Nutrition
Figure 1: Percentage changes in pony bodyweight over the course of the 28-day study (mean +/- SD).
-1
0
1
2
3
4
5
6
7
TA SG1 SG2
Perc
enta
ge c
hang
e in
bod
ywei
ght
Grazing regimen
P R O C E E D I N G S 65

GEES 2020 Clinical Research Abstract
This work follows national and institutional guidelines for humane animal treatment and complies with relevant
legislation in United Kingdom. The study was granted ethical approval by the University of Liverpool’s
Committee on Research Ethics and all owners provided informed consent.
The research reported in this abstract was undertaken at the University of Liverpool, United Kingdom. This
abstract has not been presented previously.
Effect of management of insulin dysregulation in horses and ponies with or without concurrent pituitary
pars intermedia dysfunction
Catherine M. McGowan and Charlie Hertel
Institute of Veterinary Science, Faculty of Health and Life Sciences, Leahurst Campus, University of Liverpool.
Chester High Road, Neston, Wirral, CH64 7TE.
Presenting Author Email Address: [email protected]
Word count: 428
Aims: To determine if horses with pituitary pars intermedia dysfunction (PPID) and insulin dysregulation (ID),
compared to horses with ID without PPID showed different responses to management of ID while PPID was
medically treated and controlled.
Methods: Data was collected from clinical cases attending the University of Liverpool Equine Hospital
metabolic management clinic. All horses underwent the same diagnostic protocol involving a clinical
examination and endocrine testing including basal adrenocorticotrophic hormone (ACTH) concentration and a
combined glucose insulin tolerance test (CGIT) to assess insulin sensitivity with insulin measured at baseline
and 45 and 75 min after the administration of glucose and insulin. Endocrine results were used to define two
groups of horses; PPID and ID or ID-only. Management of all horses followed a general protocol, with tailoring
of diet and exercise to individual horses and owners. Only one pony (PPID group) received metformin. After the
management period of 3 to 6 months, endocrine tests were repeated and the results compared to the initial
assessment using parametric or non-parametric comparisons depending on distribution (R: A Language and
Environment for Statistical Computing, 2017). Significance was set at P<0.05.
Results: Twenty horses and ponies were recruited, all were native ponies or cobs except one Arabian (ID-only
group). Eight were defined as PPID and ID, while 12 had ID-only. On first presentation, there were no
differences between mean age (14 ± 4 and 11 ± 5 years, respectively), body condition score (4 ± 0.5/5 in both
groups) or baseline insulin concentration (24 ± 20 and 14 ± 9 IU/L, respectively) between groups. However,
horses and ponies with PPID had significantly higher insulin concentrations than ID-only horses and ponies at
45 min (358 ± 158 and 206 ± 61 IU/L, respectively) and 75 min (257 ±185 and 206 ± 61 IU/L, respectively) of
the CGIT. Following management, horses and ponies with PPID had higher insulin concentrations than ID-only
horses and ponies at baseline (17 ± 15 and 4 ± 3 IU/L, respectively), 45 min (329 ± 156 and 68 ± 37 IU/L,
respectively) and 75 min (206 ±203 and 26 ± 19 IU/L, respectively) of the GCIT. ID-only horses and ponies
showed significant improvements in CGIT baseline, 45 min and 75 min insulin concentrations (P<0.01), while
those with PPID did not.
Conclusions: In this population, horses and ponies with PPID and ID had greater basal and dynamic insulin
concentrations and did not respond as well to treatment as those with ID-only. These data support that PPID
influences insulin dysregulation.
Acknowledgements
The authors would like to thank the veterinary surgeons who referred these cases.
66 4th Global Equine Endocrine Symposium 2020
• Presenting authors name, address and email address
Nicola Menzies-Gow
Department of Clinical Sciences and Services, Royal Veterinary College, Hawkshead Lane,
North Mymms, Herts. AL9 7TA. UK
• Details of the institution where the research was performed
Department of Clinical Sciences and Services, Royal Veterinary College, Hawkshead Lane,
North Mymms, Herts. AL9 7TA. UK
• The work follows international, national, and/or institutional guidelines for humane
animal treatment and complies with relevant legislation in the country in which the
study was conducted.
The project was approved by the Royal Veterinary College Clinical Research Ethical Review
Board (URN 2017 U109).
• The abstract has not been previously presented or published
Title: The effect of strip grazing on physical activity in ponies
Authors: Menzies-Gow N.J.,1 Pinnegar S.,
1 Pfau T.
1 and Harris P.A.
2
1 Royal Veterinary College, Hawkshead Lane, North Mymms, Herts. AL9 7TA. UK
2 WALTHAM Centre for Pet Nutrition, Freeby Lane, Waltham-on-the-Wold, LE14 4RT. UK
Aims: Using validated accelerometers, the aim of the study was to determine the effect of strip grazing on
physical activity in ponies
Methods: Ten British native breed ponies (mean±SD age 17.8±5.5 years; weight 355±85.9 Kg; all mares) were
randomly assigned to either paddock A or B for six days. The paddocks were adjacent, the same total area (110
x 50m) and subjectively contained the same amount of herbage, however paddock B was divided into six equal
size strips using electric fencing. The ponies in paddock B were allowed access to one additional strip of the
paddock each day. The ponies wore an Actigraph wGT3X-BT accelerometer attached to the poll using a
headcollar continuously throughout the study. Data was exported into Microsoft Excel and sorted into twenty-
four hour periods (commencing at 10:00:00 GMT and ending 09:59:50 GMT). Each ten-second epoch was
categorised as standing, grazing or ambulating using previously validated cut off points for the vector magnitude
(<127.6 counts for standing, 127.6-702.7 counts for grazing and >702.7 counts for ambulating) and time spent
in each category for each day and over the six days calculated. A two way ANOVA was used to compare data
from the large paddock with the strip grazed paddock and significance was accepted at p<0.05.
Results: There was no significant difference in the amount of time spent in each activity category when
comparing the ponies in paddock A and B (figure 1).
Conclusions: Strip grazing did not have a negative impact on the amount of time the ponies spent undertaking
physical activity. Thus, the beneficial effect of reducing calorie intake through the geographic restriction of
pasture access should not be offset by a reduction in calorie expenditure through reduced physical activity.
Acknowledgements: The study was funded by WALTHAM Centre for Pet Nutrition
P R O C E E D I N G S 67

• Presenting authors name, address and email address
Nicola Menzies-Gow
Department of Clinical Sciences and Services, Royal Veterinary College, Hawkshead Lane,
North Mymms, Herts. AL9 7TA. UK
• Details of the institution where the research was performed
Department of Clinical Sciences and Services, Royal Veterinary College, Hawkshead Lane,
North Mymms, Herts. AL9 7TA. UK
• The work follows international, national, and/or institutional guidelines for humane
animal treatment and complies with relevant legislation in the country in which the
study was conducted.
The project was approved by the Royal Veterinary College Clinical Research Ethical Review
Board (URN 2017 U109).
• The abstract has not been previously presented or published
Title: The effect of strip grazing on physical activity in ponies
Authors: Menzies-Gow N.J.,1 Pinnegar S.,
1 Pfau T.
1 and Harris P.A.
2
1 Royal Veterinary College, Hawkshead Lane, North Mymms, Herts. AL9 7TA. UK
2 WALTHAM Centre for Pet Nutrition, Freeby Lane, Waltham-on-the-Wold, LE14 4RT. UK
Aims: Using validated accelerometers, the aim of the study was to determine the effect of strip grazing on
physical activity in ponies
Methods: Ten British native breed ponies (mean±SD age 17.8±5.5 years; weight 355±85.9 Kg; all mares) were
randomly assigned to either paddock A or B for six days. The paddocks were adjacent, the same total area (110
x 50m) and subjectively contained the same amount of herbage, however paddock B was divided into six equal
size strips using electric fencing. The ponies in paddock B were allowed access to one additional strip of the
paddock each day. The ponies wore an Actigraph wGT3X-BT accelerometer attached to the poll using a
headcollar continuously throughout the study. Data was exported into Microsoft Excel and sorted into twenty-
four hour periods (commencing at 10:00:00 GMT and ending 09:59:50 GMT). Each ten-second epoch was
categorised as standing, grazing or ambulating using previously validated cut off points for the vector magnitude
(<127.6 counts for standing, 127.6-702.7 counts for grazing and >702.7 counts for ambulating) and time spent
in each category for each day and over the six days calculated. A two way ANOVA was used to compare data
from the large paddock with the strip grazed paddock and significance was accepted at p<0.05.
Results: There was no significant difference in the amount of time spent in each activity category when
comparing the ponies in paddock A and B (figure 1).
Conclusions: Strip grazing did not have a negative impact on the amount of time the ponies spent undertaking
physical activity. Thus, the beneficial effect of reducing calorie intake through the geographic restriction of
pasture access should not be offset by a reduction in calorie expenditure through reduced physical activity.
Acknowledgements: The study was funded by WALTHAM Centre for Pet Nutrition
Figure 1: The total amount of time (hours) spent undertaking standing, grazing and locomoting activity in
paddock A (large paddock) and B (strip grazed).
A B A B A B0
20
40
60
80
100
120
140
Field
Standing
Grazing
Locomoting
68 4th Global Equine Endocrine Symposium 2020

Straw-feeding to induce weight loss in native ponies
Miranda Dosi, Roxane Kirton and Ruth Morgan1,2*
1 University/BHF Centre for Cardiovascular Science, The Queen’s Medical Research Institute, University of
Edinburgh, UK 2 Royal (Dick) School of Veterinary Studies, University of Edinburgh, UK
Aim: Obesity is a common condition in equine population contributing to equine metabolic syndrome and
susceptibility to laminitis. Obesity can be reversed with diet and exercise but dietary management changes are
not without their difficulties. Particular difficulties include management of animals kept in large groups, animals
kept at grass, inducing weight loss whilst ensuring gut fill and avoiding nutritional stress. Horses kept at grass
during the winter in the UK are often supplemented with forage and while winter can be a good time to
implement dietary restriction it is our experience that this is often not the case. We hypothesized that
supplementing pasture with a mix of straw and hay compared with hay alone would lead to a greater weight loss
in grazing horses over winter.
Method: A herd of native ponies (n=40) was divided into two groups: the first (n=25) was offered a mixture of
straw and hay (50:50), while the second (n=15) was offered hay alone for a four month period whilst being kept
on the same grazing (~1.6Ha/group). Ponies were weighed on a weigh bridge every month.
Table 1: Nutritional analysis of the straw and hay fed during the trial
Straw hay
DM % 86 86.9
CP % 6.3 7.5
EDE Mj/Kg 7.4 7.6
MADF % 42.4 38.4
WSC % 1.3 5
DM:Dry Matter, CP:Crude Protein, EDE: Estimated Digestible Energy, MADF: Modified Acid Detergent Fibre,
WSC: Water Soluble Carbohydrates
Results: Over the study period of 4 months the straw-fed group had a mean weight change of -27±17 kg, while
the hay group weight loss had a mean weight change of +7 ± 8.6 (p<0.001). There were no incidents of colic
over this time period.
Conclusion: Straw has poor digestibility, high fibre and low WSC content resulting in a reduction in calorie
intake; the longer ingestion time and poor palatability also reduces daily dry matter intake. In conclusion, straw
was found to be a safe, cost-effective and low energy roughage, capable of inducing weight loss in grazing
ponies over winter.
*Presenting Author: Ruth Morgan [email protected]
Work was carried out at Redwings Horse Sanctuary, Norfolk, UK
P R O C E E D I N G S 69

Weight loss in combination with physical activity is highly effective against
insulin dysregulation
Julien Delarocque1*, Florian Frers
1, Korinna Huber
2, Karsten Feige
1, Tobias Warnken
1
1Clinic for Horse, University of Veterinary Medicine Hannover, Foundation, Bünteweg 9, 30559 Hannover, Germany
2Institute of Animal Science, Faculty of Agricultural Sciences, University of Hohenheim, Stuttgart, Germany
*presenting author
Aims
As insulin dysregulation (ID) is frequently associated with regional or generalized adiposity, the promotion of weight
loss is conceivably the most obvious therapeutic option against it. However, the amount of weight loss required to
achieve a reduction of ID is yet unknown. Therefore, this study aimed at describing the relationship between weight
variations and the level of ID as determined by oral glucose tests (OGT).
Methods
Five OGTs (0.5 g/kg bodyweight glucose) were conducted over a one-year period in twelve Icelandic horses held under
conditions promoting high physical activity (HIGH) and five Icelandic horses with low physical activity (LOW). The
relationship between the weight variations and variations in the insulin response, approximated by the area under the
curve for insulin, was analysed using a weighted least squares model.
Results
The variation in the insulin response between successive OGTs was effectively predicted by the corresponding relative
weight difference (P<0.001). Horses of group HIGH displayed a reduction of the insulin response of 26% for 5%
weight loss, while in group LOW no marked decrease of the insulin response could be observed despite weight loss (5%
increase of the insulin response for 5% weight loss).
Conclusions
Combining dietary restrictions with physical activity is highly effective against ID. These results have direct
applications in the monitoring of horses with ID and the prevention of laminitis.
Acknowledgements
The authors wish to thank Professor Wolfgang Leibold for his support and providing the horses, and Dr Björn
Steinbjörnsson for his help during the experiments and dedicated care to the horses.
Ethics committee
The State Office for Consumer Protection and Food Safety (LAVES) approved the study in accordance with the German
Animal Welfare Law (case number: 33.8-42502-04-17/2646).
Presentations prior to GEES
This work will be presented as a talk at the World Equine Veterinary Association congress in Verona (3rd
–5th
October
2019).
70 4th Global Equine Endocrine Symposium 2020
GEES 2020 Clinical Research Abstract
Investigating the epidemiology of equine metabolic syndrome in horses/ponies enrolled in a laminitis
cohort study in Great Britain
D. Pollard1,2
, C. E. Wylie3,4
, K.L.P. Verheyen2, J. R. Newton
1.
1Animal Health Trust, Lanwades Park, Kentford, Newmarket, UK;
2Royal Veterinary College, Hatfield,
Hertfordshire, UK, 3Rossdales Equine Hospital, Exning, Newmarket, UK,
4University of Sydney, Camperdown,
Sydney, Australia.
Presenting author: Danica Pollard; [email protected]
Aims: To estimate the prevalence of owner-reported equine metabolic syndrome (EMS) and factors associated
with EMS in a cohort of horses/ponies enrolled in an epidemiological study of equine laminitis in Great Britain.
Methods: Self-selected horse/pony owners enrolled in a web-based laminitis epidemiological study (August
2014 to December 2016) completed questionnaires detailing their animals’ signalment, management and
previous and current health. The proportion of horses/ponies tested for EMS, the diagnostic testing used, reasons
for testing and use of medication were described and the prevalence (95% confidence interval [CI]) of EMS was
estimated. Random effects multivariable logistic regression modelling identified factors associated with higher
odds of having EMS (P≤0.05) while adjusting for owner-level clustering.
Results: Baseline questionnaires from 1,799 horses/ponies were available. The median age and height of
enrolled horses/ponies was 14 (interquartile range [IQR] 9 to 19; range 1 to 38) years and 147.3 (IQR 137.2 to
157.5) cm. The main breeds included native ponies (23.9%; n=414), Welsh (21.9%; n=394) and Thoroughbred
(10.2%; n=184) breeds and their crosses. The median number of horses/ponies enrolled was 2 (range 1 to 18
horses). A total of 259/1,761 horses/ponies (14.7%) were tested for EMS/insulin dysregulation using diagnostic
laboratory tests, 42.5% (n=110) of which were diagnosed as positive. The most common diagnostic test reported
was the in-feed oral glucose tolerance test (52.8%; n=60). However, 40.5% (n=105) of owners could not name
the test used. The main reasons owners had their horses/ponies tested for EMS were recurrent laminitis episodes
(49.4%; 128/259), regional adiposity (38.2%; 99/259) and general obesity/history of obesity (24.3%; 63/259).
Of 649 horses/ponies with a history of laminitis, only 32.5% (n=211) had been tested for EMS. Forty-eight
horses/ponies were reported to have EMS without diagnostic test confirmation. The overall prevalence of EMS
was 8.8% (95% CI 7.6, 10.2%; n=158/1,799). Of 154 horses/ponies with EMS, 17.5% (n=27) were currently
receiving metformin and 1.3% (n=2) levothyroxine. Arabians and native breeds (including crosses) had higher
odds of EMS compared to Thoroughbreds. Horses/ponies aged 10-19 years had higher odds compared to those
older than 19 years. Owners of horses/ponies with EMS were more likely to use the study’s custom designed
weight tracker tool. Horses/ponies with EMS were more likely to have a cresty neck, a history of laminitis, be
tested for pituitary pars intermedia dysfunction, receive anti-inflammatory drugs and be shod with specialised
horse shoes as opposed to regular/no shoes. They were also more likely to spend most of their time on grass-free
turnout or in a stable, wear grazing muzzles, be fed hay, receive bucket feed multiple times/day, receive salt or
anti-laminitic supplements and receive structured exercise.
Conclusions: The majority of horses/ponies with a history of laminitis were not tested for EMS/insulin
dysregulation. Presence of a cresty neck was associated with EMS independently of body condition. Owners
appeared to be proactive about weight management and used multiple strategies to manage EMS; the impact of
these strategies on equine health and welfare should be explored further.
Acknowledgements: Many thanks to the funders and all participating horse/pony owners.
Sources of funding The project was supported by funding from World Horse Welfare, the Margaret Giffen Charitable Trust, the
Horserace Betting Levy Board (HBLB), Racehorse Owners Association (ROA) and Thoroughbred Breeders’
Association (TBA).
Ethical approval
This study was granted institutional ethical approval from the Animal Health Trust (AHT01-2014) and the
Royal Veterinary College (2014 0105H). Animal use not applicable. Explicit informed consent was sought from
owners at enrolment.
P R O C E E D I N G S 71

The insulin-like growth factor-1 receptor: a potential target to treat equine endocrinopathic laminitis
Samira Rahnama1, Niveditha Vathsangam
2, Robert Spence
1, Melody de Laat
1, Simon Bailey
2, Stephen Anderson
3 and
Martin Sillence1
1Science and
Engineering Faculty, Queensland University of Technology, Brisbane, Queensland, Australia
2Faculty of Veterinary and Agricultural Sciences, The University of Melbourne, Melbourne, Victoria, Australia
3School of Biomedical Sciences, The University of Queensland, St Lucia, Queensland, Australia
Presenting author: Martin Sillence ([email protected])
Ethics: As this study used tissue from horses that were slaughtered commercially for human consumption, it was deemed
by the Office of Research Ethics and Integrity at QUT, to be exempt from the need for review, approval or monitoring by
the Animal Care and Ethics Committee (Exemption #1600000866).
Aims Although hyperinsulinemia is known to play a crucial role in the induction of endocrinopathic laminitis, the mechanism of
insulin action is unclear, because insulin receptors are scarce in lamellar tissue. A previous study has shown that insulin can
stimulate cell proliferation in cultured lamellar cells by activating receptors for IGF-1 (IGF-1R), as this effect was blocked
by a selective anti-IGF-1R monoclonal antibody (mAb). The present study aimed to confirm this finding using a different
anti-IGF-1R mAb, while developing a method to measure cell proliferation in fresh lamellar explants.
Methods
Hoof sections were obtained from 36 horses killed at a local abattoir. Explants of tissue from 6 horses were dissected and
placed in duplicate in 3 ml of cell culture medium containing 3 µCi of [3H]-thymidine, with or without IGF-1 or insulin, at
1, 10, or 100 nM, to determine the optimum concentration of peptide. For the next experiment, additional explants were
incubated with IGF-1 (10 nM), insulin (10 nM), anti-IGF-1R mAb (1 µg/ml), or a combination of either peptide plus mAb.
All tissues were incubated at room temperature for 24 h. After incubation, each explant was weighed and digested, and the 3H content measured using a liquid scintillation counter. Genomic DNA was extracted using a commercially available kit
and measured using a spectrophotometer. Results are expressed as CPM/pg DNA. The data were log10 transformed to
achieve normality, then analysed using one-way ANOVA, followed by a Holm-Sidak test to compare the means.
Results The concentration of insulin and IGF-1 that caused the greatest cell proliferation was 10 nM for both peptides. Results of
the next experiment are summarised in Table 1. Compared with control tissue, both IGF-1 and insulin increased 3H-
thymidine uptake by more than 2-fold (P < 0.01). The anti-IGF-1R mAb alone did not alter 3H-thymidine uptake, but
blocked proliferative effects of both insulin and IGF-1 at 10 nM completely (P < 0.001).
Table 1. Effects of insulin, IGF-1 and an anti-IGF-1 receptor monoclonal antibody (mAb) on cell proliferation in
isolated lamellar explants, as measured by the rate of thymidine uptake over 24 h. Results are expressed as mean
±SE (n); units are CPM/pgDNA.
Peptide Treatment
Nil
(negative-control)
mAb alone Peptide only
(positive-control)
Peptide + mAb
IGF-1, 10 nM 4.4 ± 0.5 (36) 4.1 ± 0.7 (11)
10.1 ± 1.9 (25)** 3.5 ± 0.6 (19) ###
Insulin, 10 nM 9.7 ± 1.6 (31)** 3.6 ± 0.5 (24) ###
**P < 0.01 compared with negative-control group; ###
P< 0.001 compared with positive-control group
Conclusions
• [3H]-thymidine incorporation provides a useful tool for measuring cell proliferation in isolated lamellar explants.
• Insulin can act directly on lamellar tissue to stimulate cell proliferation via the activation of IGF-1R.
• The effect of insulin can be blocked using a selective anti-IGF-1R antibody, confirming that the IGF-1R is a
potential therapeutic target for treating or preventing endocrinopathic laminitis.
Acknowledgements This study was funded by an industry linkage grant to Queensland University of Technology from the Australian Research
Council (LP150101025), in association with The University of Melbourne, The University of Queensland, the Animal
Health Foundation and Zoetis.
72 4th Global Equine Endocrine Symposium 2020

Obesity as a risk factor for the development of equine asthma
Sarah Thomas1, Cris Navas de Solis
1§, Michelle Coleman
1*
1Veterinary Large Animal Clinical Sciences, College of Veterinary Medicine & Biomedical Sciences, Texas A&M
University, College Station, TX, USA
*Presenting Author; email: [email protected]
§Current Address: School of Veterinary Medicine, University of Pennsylvania, Clinical Studies-New Bolton Center,
Kennett Square, Chester, Pennsylvania
The following work complies with ethical standards in the treatment of animals. This abstract was presented at the
American College of Veterinary Internal Medicine Forum, Phoenix, AZ, June 2019.
Aims: In parallel with the obesity epidemic, a distinct asthmatic phenotype has emerged in people in the context of
obesity. Obesity is a significant risk factor for the development of incident asthma. Similarities between equine and
human asthma exists; however, few studies have investigated risk factors for development of equine asthma. Thus,
the objectives of this study were to investigate risk factors for incident cases of equine asthma.
Methods: This retrospective case-control study evaluated horses presenting for asthma to Texas A&M College of
Veterinary Medicine from 2014-2018. Three populations of horses were included: 1) horses diagnosed clinically and
cytologically with incident asthma, 2) age-matched controls (± 2 years) and, 3) temporal controls presenting within
48 hours of the case. Data were analyzed using conditional logistic regression separately for each set of controls. All
variables associated with equine asthma at P <0.2 in univariable analysis were included into the multivariable
model. Results: A total of 42 horses in each group met criteria for inclusion. Obesity, defined as having a body condition
score ≥7, was the only variable that remained significantly associated with the development of equine asthma in the
final model, for age-matched controls (odds ratio 14; 95% confidence interval 1.9-106; P <0.01) and temporal
controls (odds ratio 3.8; 95% confidence interval 1.2-11.3; P = 0.02).
Conclusions: This study demonstrates that obesity is a risk factor for the development of equine asthma. Though
limitations to the existing study exist, the association of obesity and equine asthma warrants further investigation.
Acknowledgements: This work was supported by the Texas A&M College of Veterinary Medicine & Biomedical
Sciences, Department of Large Animal Clinical Sciences
P R O C E E D I N G S 73

Endocrinopathic laminitis and the epidermal growth factor system
M. A. de Laat1, R. J. Spence
1, M. N. Sillence
1 and C. C. Pollitt
2.
1Science and Engineering Faculty, Queensland University of Technology, Brisbane, 4001, Queensland,
Australia, 4001.
2The Australian Equine Laminitis Research Unit,
School of Veterinary Science, The University of Queensland,
Gatton, Queensland, Australia, 4343.
Presenting author: Melody de Laat ([email protected])
The study used archived tissues and blood samples and was exempt from requiring additional ethical approval
(Queensland University of Technology Animal Ethics Committee; 1800000144).
Aims: Lamellar epidermal cell stretching and proliferation typify insulin-associated laminitis, although the
disease pathogenesis is incompletely understood. Insulin can activate the epidermal growth factor (EGF) system
in other species and this promotes epidermal cell proliferation. This study aimed to determine whether
upregulation of the EGF receptor (EGFR) occurs during hyperinsulinaemic laminitis. A second aim was to
determine whether plasma EGF concentrations are higher in insulin-dysregulated ponies with post-prandial
hyperinsulinaemia, compared to healthy ponies.
Methods: We examined lamellar tissue from horses that were healthy (n = 4) or in the developmental and acute
stages of insulin-induced laminitis (n = 16). Immunostaining was used to examine EGFR distribution,
immunoblotting was used to detect receptor phosphorylation and digital PCR was used to quantify EGFR.
Plasma EGF concentrations were also measured in the horses using an equine-specific ELISA. For the second
aim, 16 ponies were tested for insulin dysregulation using an oral glucose test and plasma EGF concentrations
were measured at the same time.
Results: The EGFR were localised to the secondary epidermal lamellae, with stronger staining in parabasal,
than basal, cells. The distribution of the EGFR (rather than the amount of immunolocalisation) changed during
the development of laminitis with EGFR expression becoming less evident in basal cells. No change in EGFR
gene expression occurred with acute laminitis, although receptor phosphorylation tended to be increased (P =
0.09). No difference in EGF concentrations occurred between laminitic and healthy horses. However, post-
prandial EGF was higher in ponies with insulin dysregulation, compared to healthy ponies (274 ± 90 and 97.4 ±
20.9 pg/mL, respectively; P = 0.05).
Conclusions: While EGFR are unlikely to be a pathogenic factor in insulin-associated laminitis development,
their redistribution and phosphorylation during acute disease might suggest that they contribute to epidermal
repair. Increased circulating EGF in insulin-dysregulated ponies may indicate a synergistic relationship between
insulin and EGF in this species.
Acknowledgements: The Australian Research Council (DP180102418) funded this study. Technical assistance
was received from Danielle Fitzgerald.
74 4th Global Equine Endocrine Symposium 2020

The application of a new ‘modified Obel’ method to monitor recovery from endocrinopathic laminitis in a clinical
setting
Martin Sillence1, James McGree
1, Alexandra Meier
1, Melody de Laat
1, Rebecca Klee
2, and Dania B Reiche
2
1Science and Engineering Faculty, Queensland University of Technology (QUT), Brisbane, Queensland, Australia
2Boehringer Ingelheim Vetmedica GmbH, Ingelheim am Rhein, Germany
Presenting author: Martin Sillence ([email protected])
Ethics: This clinical study was registered with to the appropriate German federal authorities and was conducted in
accordance with applicable animal welfare regulations, as well as the Good Clinical Practice, VICH Guideline GL9.
Aims
The evaluation of any treatment for endocrinopathic laminitis requires: an understanding of the natural history of the
disease, including the pattern of disease progression and recovery; and the tools to measure this accurately. This study used
both a traditional grading system and a new scoring system to describe the laminitis recovery pattern in a large clinical
cohort. The new “modified Obel” method developed at QUT by Meier et al. has recently been validated in an experimental
setting (PeerJ. 2019;7:e7084). Our aim was to extend this evaluation to a clinical setting, and to inform the development of
a disease recovery model.
Methods Eighty naturally-occurring cases of endocrinopathic laminitis were identified at 16 sites in Germany, in a wide range of
horse breeds, during a randomised clinical trial. Each case was evaluated for severity on the day of presentation, then after
4, 9, 14, 25 and 42 days, using the traditional 5-point Obel method (scores 0-4) and a “modified Obel”, 12-point scale. The
evaluations were made by 25 independent equine veterinarians, who managed each case with a range of interventions
including short-acting pain relief (withdrawn 24 h before laminitis severity assessments), diet modification, cryotherapy,
supportive boots, pads and bandages, and corrective hoof care.
Results
The traditional Obel method for grading laminitis showed little differentiation when describing recovery rates, whereas the
new, modified Obel method showed clear differences between individuals and a clearer pattern of recovery over time. The
average recovery pattern appeared to follow a form of exponential decay (Fig 1A), although the pattern and rate of recovery
varied markedly between subjects. There was also a marked variation in the rate of change for the individual variables that
are summed to derive the total ‘modified Obel’ score (Fig 1B). The average time taken for each of the following variables
to reach a median score of zero was: foot lift and weight shifting, 4 days; digital pulse, 9 days; gait at the walk, 14 days;
gait when turned in a circle, 25 days.
Day
0 10 20 30 40
Media
n lam
initis
gra
de a
nd s
core
0
2
4
6
8
Obel grade
Modified Obel score
Day
0 10 20 30 40
Media
n s
core
0.0
0.5
1.0
1.5
2.0
2.5
Weight shift
Foot lift
Gait at the walk
Gait at the circle
Digital pulse
A B
Fig. 1. Laminitis severity determined in 80 horses using the Obel and ‘modified Obel’ methods. Panel A shows the total
grade and score attained using each method; Panel B shows the components that contribute to a total score for the
‘modified Obel’ method.
Conclusions
• The pattern of laminitis recovery shows considerable variation between individuals, but on average appears to
follow a form of exponential decay, with a time to 50% recovery of 4 to 5 days.
• The apparent rate of recovery is highly dependent on the variable measured, and so the use of an aggregate score
is recommended.
• The new ‘modified Obel’ method developed by Meier et al. provides a useful way to track recovery and evaluate
treatments for endocrinopathic laminitis in a clinical setting.
Acknowledgements
We thank the veterinarians who treated and scored the laminitis cases, for their valuable contribution to this study.
P R O C E E D I N G S 75

The application of a new ‘modified Obel’ method to monitor recovery from endocrinopathic laminitis in a clinical
setting
Martin Sillence1, James McGree
1, Alexandra Meier
1, Melody de Laat
1, Rebecca Klee
2, and Dania B Reiche
2
1Science and Engineering Faculty, Queensland University of Technology (QUT), Brisbane, Queensland, Australia
2Boehringer Ingelheim Vetmedica GmbH, Ingelheim am Rhein, Germany
Presenting author: Martin Sillence ([email protected])
Ethics: This clinical study was registered with to the appropriate German federal authorities and was conducted in
accordance with applicable animal welfare regulations, as well as the Good Clinical Practice, VICH Guideline GL9.
Aims
The evaluation of any treatment for endocrinopathic laminitis requires: an understanding of the natural history of the
disease, including the pattern of disease progression and recovery; and the tools to measure this accurately. This study used
both a traditional grading system and a new scoring system to describe the laminitis recovery pattern in a large clinical
cohort. The new “modified Obel” method developed at QUT by Meier et al. has recently been validated in an experimental
setting (PeerJ. 2019;7:e7084). Our aim was to extend this evaluation to a clinical setting, and to inform the development of
a disease recovery model.
Methods Eighty naturally-occurring cases of endocrinopathic laminitis were identified at 16 sites in Germany, in a wide range of
horse breeds, during a randomised clinical trial. Each case was evaluated for severity on the day of presentation, then after
4, 9, 14, 25 and 42 days, using the traditional 5-point Obel method (scores 0-4) and a “modified Obel”, 12-point scale. The
evaluations were made by 25 independent equine veterinarians, who managed each case with a range of interventions
including short-acting pain relief (withdrawn 24 h before laminitis severity assessments), diet modification, cryotherapy,
supportive boots, pads and bandages, and corrective hoof care.
Results
The traditional Obel method for grading laminitis showed little differentiation when describing recovery rates, whereas the
new, modified Obel method showed clear differences between individuals and a clearer pattern of recovery over time. The
average recovery pattern appeared to follow a form of exponential decay (Fig 1A), although the pattern and rate of recovery
varied markedly between subjects. There was also a marked variation in the rate of change for the individual variables that
are summed to derive the total ‘modified Obel’ score (Fig 1B). The average time taken for each of the following variables
to reach a median score of zero was: foot lift and weight shifting, 4 days; digital pulse, 9 days; gait at the walk, 14 days;
gait when turned in a circle, 25 days.
Day
0 10 20 30 40
Media
n lam
initis
gra
de a
nd s
core
0
2
4
6
8
Obel grade
Modified Obel score
Day
0 10 20 30 40
Media
n s
core
0.0
0.5
1.0
1.5
2.0
2.5
Weight shift
Foot lift
Gait at the walk
Gait at the circle
Digital pulse
A B
Fig. 1. Laminitis severity determined in 80 horses using the Obel and ‘modified Obel’ methods. Panel A shows the total
grade and score attained using each method; Panel B shows the components that contribute to a total score for the
‘modified Obel’ method.
Conclusions
• The pattern of laminitis recovery shows considerable variation between individuals, but on average appears to
follow a form of exponential decay, with a time to 50% recovery of 4 to 5 days.
• The apparent rate of recovery is highly dependent on the variable measured, and so the use of an aggregate score
is recommended.
• The new ‘modified Obel’ method developed by Meier et al. provides a useful way to track recovery and evaluate
treatments for endocrinopathic laminitis in a clinical setting.
Acknowledgements
We thank the veterinarians who treated and scored the laminitis cases, for their valuable contribution to this study.
76 4th Global Equine Endocrine Symposium 2020

Association between ACTH, insulin, glucose and triglycerides with laminitis in PPID.
Julie Potier, Andy Durham
The Liphook Equine Hospital, Forest Mere, Portsmouth Road, Liphook, Hampshire GU30 7JG, UK
Institution where the research was performed :
The Liphook Equine Hospital Laboratory, Forest Mere, Portsmouth road, Liphook, Hampshire GU30
7JG, UK
This work follows international guidelines for humane animal treatment and complies with relevant
legislation in the country in which the study was conducted.
The abstract has not been presented previously.
Aims :
To assess PPID cases with and without laminitis to evaluate the association of ACTH, insulin, glucose
and triglycerides with laminitis.
Methods :
Laboratory records were examined from all blood samples submitted to the Liphook Equine Hospital
Laboratory for plasma ACTH analysis between 2014 and 2018 which were subsequently diagnosed
with PPID. Serum insulin, glucose and triglycerides were also measured in many of these cases and
also examined as part of the study. Data were excluded from repeat tests and individuals on treatment,
as well as those with an unknown laminitis status.
The data was categorised into horses with current or previous laminitis and horses with no known
history of laminitis. A Mann-Whitney test was used to compare the ACTH, insulin, glucose and
triglyceride concentrations of the PPID cases with laminitis and the PPID cases without laminitis.
Results :
A total of 13,278 PPID cases where laminitis history was known were included, comprising 11,807
(88.9%) with current or previous laminitis and 1,473 (11.1%) with no known history of laminitis.
The ACTH concentration in horses with PPID was not significantly different between those with and
without laminitis (median [IQR]: laminitis 126 pg/mL [72.3-263]; no laminitis 117 pg/mL [73.4-
226.5], P=.059). However, when PPID cases with and without laminitis were restricted to an age-
matched group (between 20-30yo), those cases with laminitis had significantly higher ACTH than
those without laminitis (median [IQR]: laminitis 147 pg/mL [79.0-303]; no laminitis 120 pg/mL
[72.4-244], P<0.001) (Figure 1).
The insulin, glucose and triglyceride concentrations were significantly higher in the laminitic PPID
cases compared to the non-laminitic PPID cases (median [IQR]: Insulin: laminitis 30.1 mU/L [11.8-
106]; no laminitis 13.1 mU/L [6.3-41.4], P<0.001. Glucose: laminitis 5.4 mmol/L [4.8-6.0]; no
laminitis 5.2 mmol/L [4.3-5.75], P=0.032. Triglycerides: laminitis 0.54 mmol/L [0.35-0.77]; no
laminitis 0.36 mmol/L [0.2-0.43], P<0.001). (Figure 2,3,4).
P R O C E E D I N G S 77

AC
TH
pg
/mL
lam
initi
s
no lam
initi
s
0
100
200
300
TG
mm
ol/L
lam
initi
s
no la
min
itis
0.0
0.2
0.4
0.6
0.8
1.0
Conclusion :
Markers of insulin dysregulation comprising increased concentrations of circulating insulin, glucose
and triglycerides indicate higher risk of laminitis in PPID cases. ACTH is also higher in laminitic
PPID cases than in non-laminitic PPID cases matched for age.
Acknowledgements :
Referring veterinary surgeons who sent samples to the Liphook Equine Hospital Laboratory and the
Laboratory staff for performing the analyses.
Figure 1. ACTH values in PPID
horses aged between 20-30 years old
with and without laminitis
(box=IQR, line within box=median).
Figure 2. Insulin values in PPID
horses with and without laminitis.
Figure 3. Glucose values in PPID
horses with and without laminitis.
Figure 4. Triglyceride values in
PPID horses with and without
laminitis.
78 4th Global Equine Endocrine Symposium 2020

79
N O T E S