With the advent of wireless devices, a growing number of Senior Design projects are utilizing in the S Band frequency range. Prior to this project, Senior Design teams had limited methods of testing performance of the design. The objective of this project is to design a system capable of detecting, capturing, logging, and displaying measurements inside an Anechoic Chamber. This anechoic chamber attenuates outside interference but captures signals from the transmit antenna which are received by the test antenna. This chamber has a special absorber that also attenuate unwanted transmitted signal that may reflect off surfaces, such as the wall, floor and or additional metal surfaces that are contained inside it.
NOMENCLATURE
Anechoic: non-echoingDAC: Digital to Analog ConverterDB: decibelDBi: decibel isotropicDUT: Device Under TestFAR-FIELD: region of electromagnetic radiation where the shape of the antenna pattern is independent of distanceLabVIEW: graphical programming environmentRF: Radio FrequencyRx: ReceiveS BAND: 2-4GHz frequency range in the microwave band of the electromagnetic spectrumTx: Transmit
INTRODUCTION
An Anechoic chamber is an isolated test chamber used to measure the gain and radiation pattern of the DUT. The most common chamber, and the one used here, is the rectangular chamber. The Tx antenna is fixed to one of the end walls, and the DUT is located down the length of the chamber as far as possible while still leaving room for it to spin 360 degrees. This ensures far-field conditions are met. These chambers are isolated, so any outside signals cannot enter and any inside signals cannot leave. All inside surfaces are lined with RF absorbent material to prevent reflections so only the main lobe of the antenna signal is being measured. This helps to provide conditions of simulated open space. The DUT is on a rotating platform with its 0 degree position facing the door and perpendicular to the Tx antenna. The 90 degree point is when the DUT is facing the Tx antenna and the 180 degree point is when the antenna is facing opposite the door. The Rx antenna begins the measurement process at the 0 degree point, and rotates through to the 180 degree point with power measurements being taken periodically.
Proceedings of the Multi-Disciplinary Senior Design Conference Page 2
These measurements create the radiation pattern of the antenna. The gain measurement is taken when the antennas are facing each other.
Two critical systems of this project was a rotating antenna platform for the DUT and a LabVIEW program to control the antenna rotation and capture, log and display measurements, for gain and power. The frequency range given was 2-4GHz (S Band), with the focus being on 2.4GHz given the number of wireless devices using this frequency. This is the carrier frequency used by Bluetooth, Zigbee and Wi-fi devices. The isolated chamber used is 8’ wide by 8’ tall by 12’ long. Placement of the Tx antenna should be in the center of the back wall. This minimizes the number of reflections off the 4 side walls. Therefore, the center of the DUT must sit at 4’ from each side wall and 4’ off the floor. The DUT must rotate in 0.5 degree and 1 degree increments depending on the test the user is running. After each rotation increment, the spectrum analyzer must measure the power being received by the Rx antenna. LabVIEW is responsible for controlling the motor rotation increment, controlling the frequency generator and spectrum analyzer, and correlating the received power to the angle the DUT has rotated. Once test data is captured, LabVIEW will then create a linear radiation measurement plot with power in dB. A normalized linear plot, logarithmic plot, and normalized logarithmic plot are also created. A text file with power and frequency values is created and can be exported to MATLAB for further manipulation.
PROJECT DESIGN
Rotating Platform
For this chamber, measurements will be taken in the far-field region. To be in the far-field, the Rx and Tx antenna must be at least a certain distance away. This distance is given by:
R=2D2
λ (1)
D is the effective aperture size of the antenna being used. In the case of the parabolic reflector being used for this project, the aperture size is:D=0.55√w2+h2 (2)where w is the width and h is the height of the grid reflector. λ is the wavelength of the given frequency and is shown by:
λ= cf
(3)
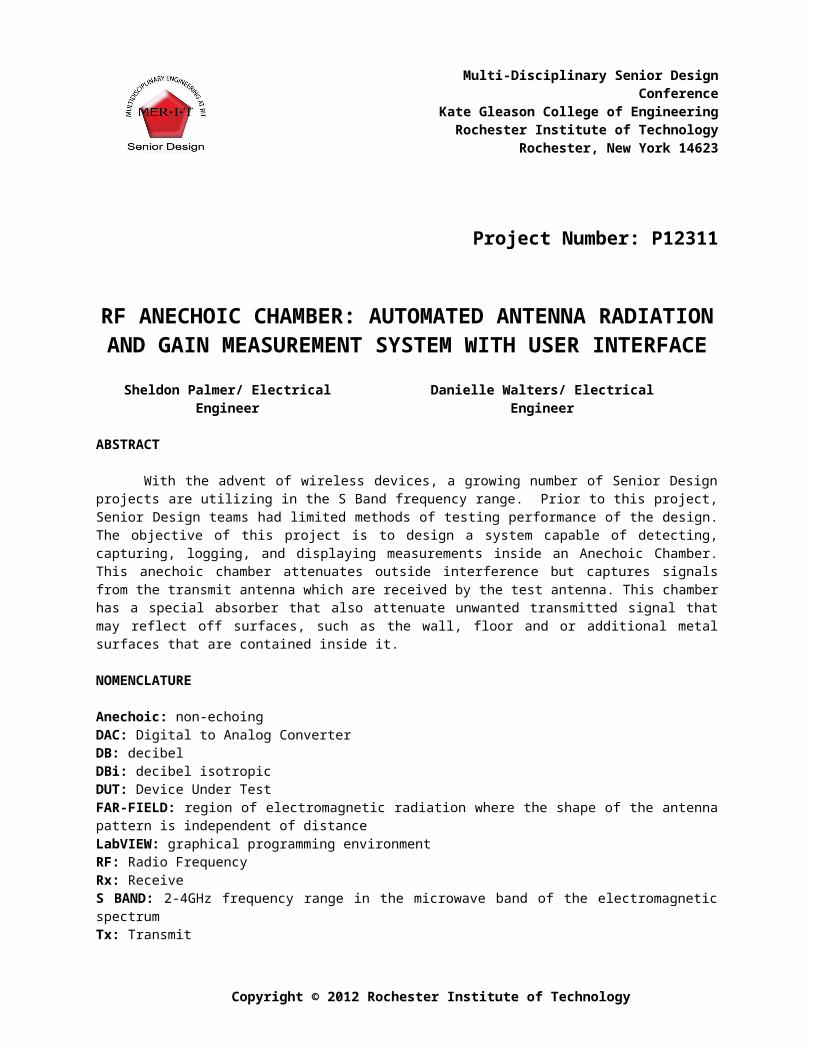
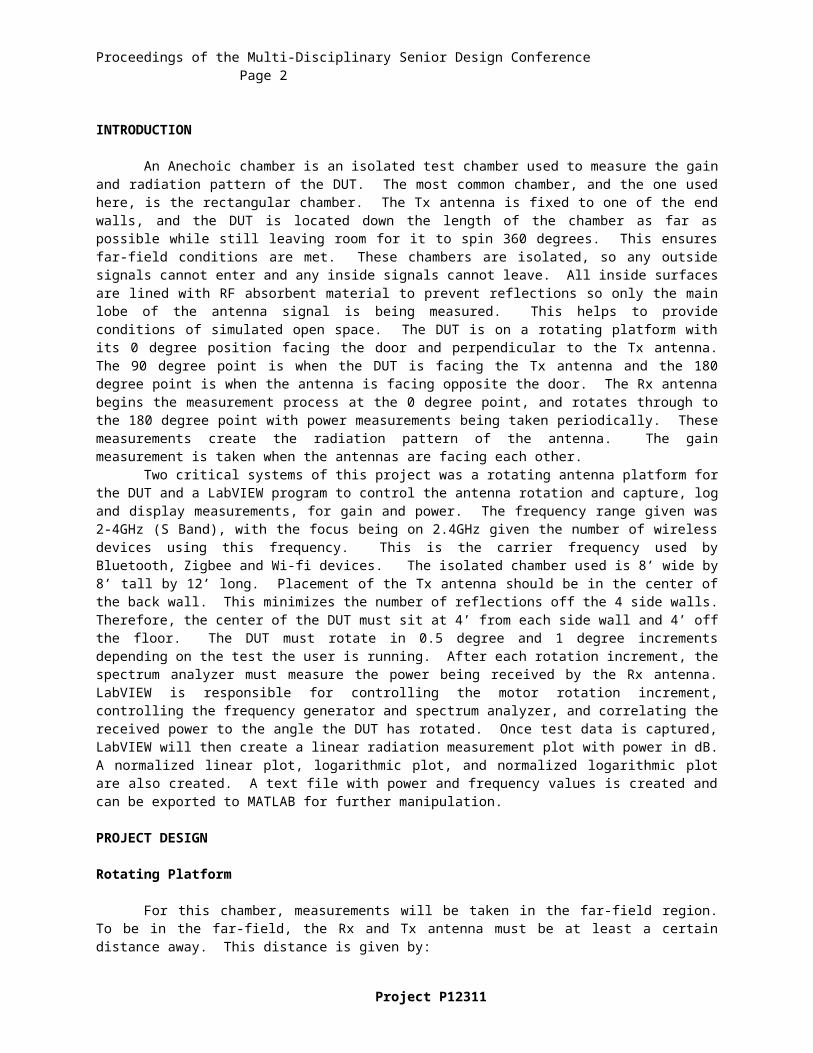
where c is the speed of light [m/s] and f is the frequency [Hz]. Normally, standard gain horn antennas are used in Anechoic Chambers; however the horn for this frequency was almost 2’ in length. Having 2 horns of this size in the system would cut down on the distance between the Rx and Tx antennas available, which could result in far-field conditions not being met. Figure 1 shows the set-up of the measurement equipment outside the chamber. The Spectrum Analyzer being used on the right is the Hewlett Packard 8565E 9kHz-50GHz Spectrum Analyzer. The frequency generator used on the left is the Agilent N5181A 100kHz-6GHz MXG Analog Signal Generator. Figure2 shows the set-up within the chamber. The antenna on the right is the Tx antenna and the antenna on the left is the Rx antenna. The blue foam is the RF absorbent foam lining the inside walls of the chamber.
Project P12311
Proceedings of the Multi-Disciplinary Senior Design Conference Page 3
Figure 1: Instrumentation Set-Up
Figure 2: Measurement Set-Up
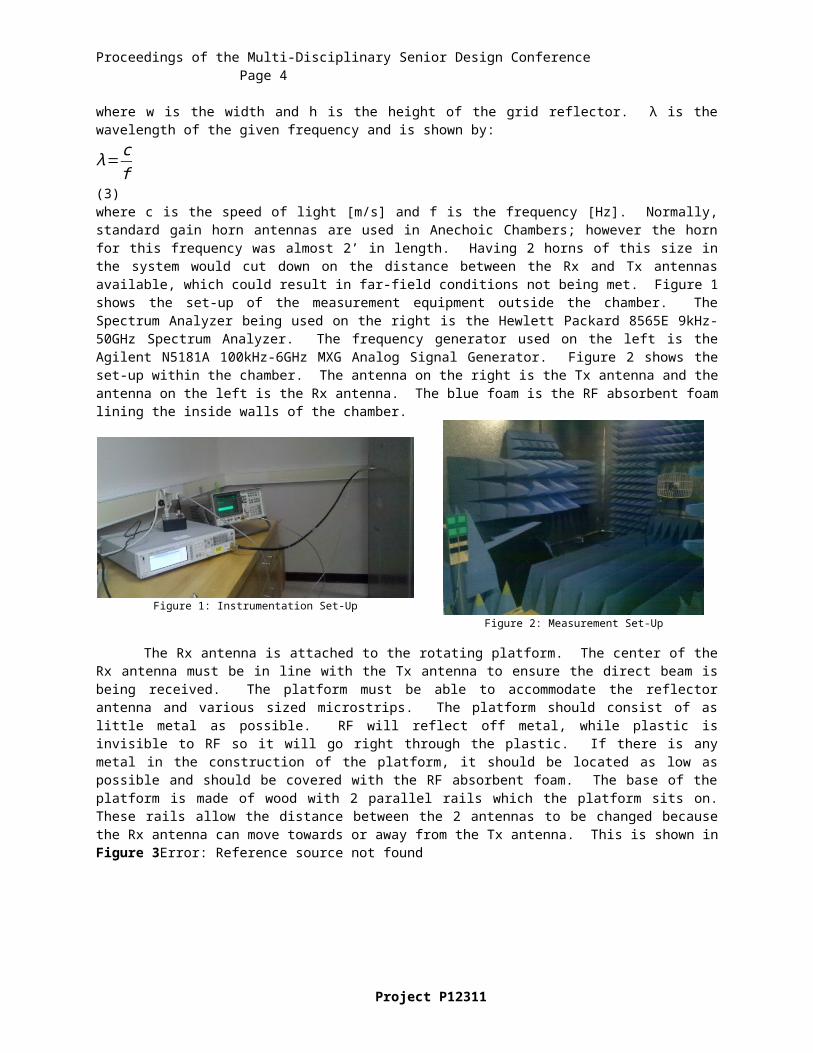
The Rx antenna is attached to the rotating platform. The center of the Rx antenna must be in line with the Tx antenna to ensure the direct beam is being received. The platform must be able to accommodate the reflector antenna and various sized microstrips. The platform should consist of as little metal as possible. RF will reflect off metal, while plastic is invisible to RF so it will go right through the plastic. If there is any metal in the construction of the platform, it should be located as low as possible and should be covered with the RF absorbent foam. The base of the platform is made of wood with 2 parallel rails which the platform sits on. These rails allow the distance between the 2 antennas to be changed because the Rx antenna can move towards or away from the Tx antenna. This is shown in Figure 3Error: Reference source not found
Figure 3: Base of Rotating PlatformFigure 4: Side View of Rotating Platform
A piece of acrylic 12” wide by 12” long by ½” thick sits on top of these rails. The motor is screwed into this and there is a hole in the middle to allow the motor shaft to protrude. On top of the acrylic sits a plastic turntable lazy susan. On top of this is another acrylic sheet with the same dimensions. Attached to the motor shaft is a threaded metal rod. This metal rod screws into the threaded center hole on the top acrylic sheet. A PVC flange is screwed into the top side of the top piece of acrylic. Into this a PVC pipe is inserted. Figure 4 shows the side view of platform put together. The PVC pipe was cut so that the reflector antenna would be at exactly 4 feet high when assembled.
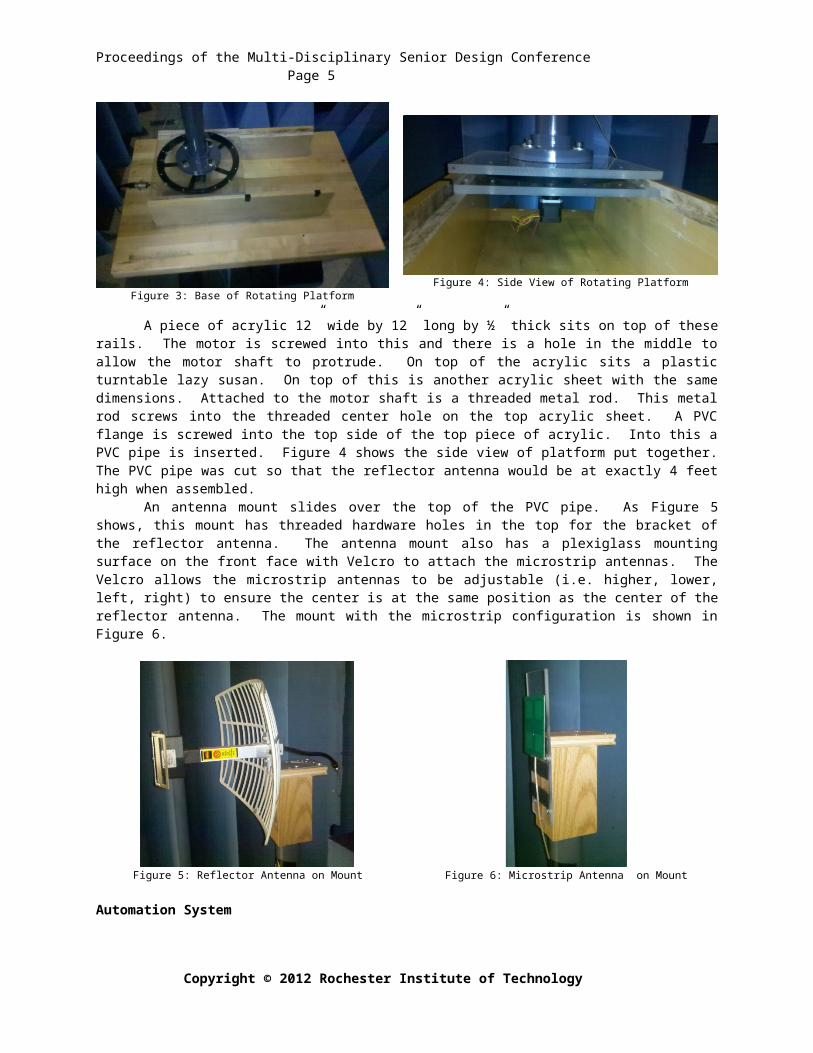
An antenna mount slides over the top of the PVC pipe. As Figure 5 shows, this mount has threaded hardware holes in the top for the bracket of the reflector antenna. The antenna mount also has a plexiglass mounting surface on the front face with Velcro to attach the microstrip antennas. The Velcro allows the microstrip antennas to be adjustable (i.e. higher, lower, left, right) to ensure the center is at the same position as the center of the reflector antenna. The mount with the microstrip configuration is shown in Figure 6.
Proceedings of the Multi-Disciplinary Senior Design Conference Page 4
Figure 5: Reflector Antenna on Mount Figure 6: Microstrip Antenna on Mount
Automation System
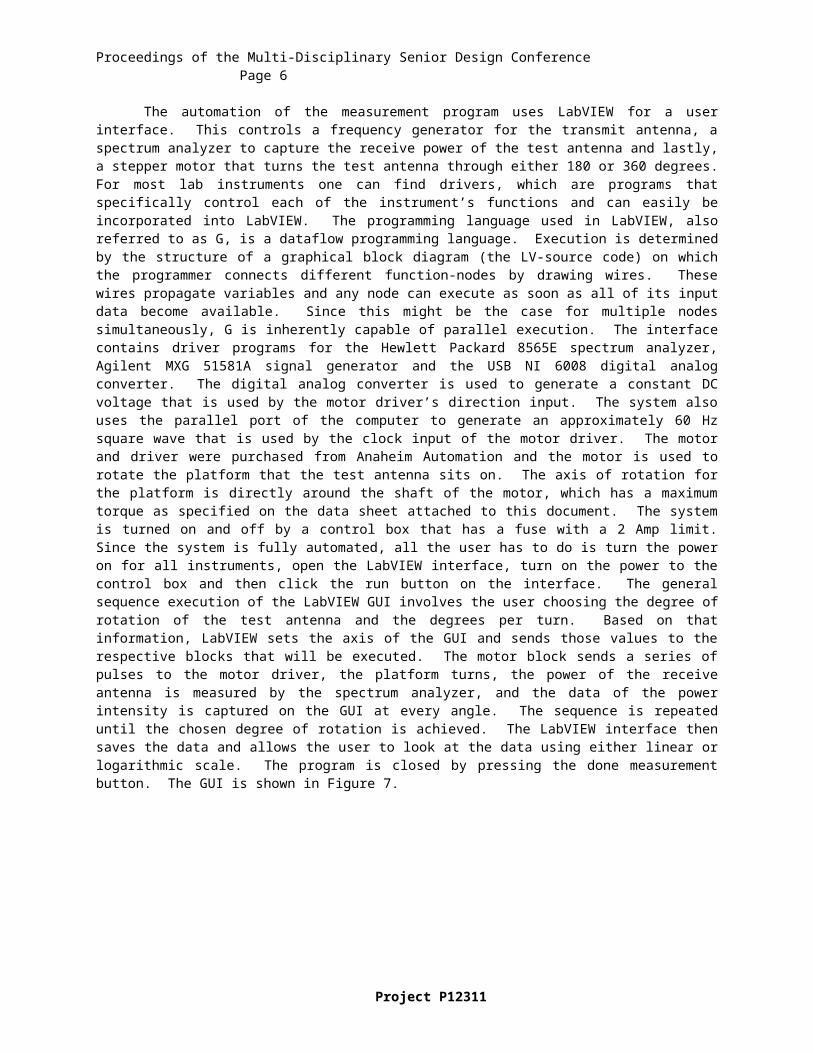
The automation of the measurement program uses LabVIEW for a user interface. This controls a frequency generator for the transmit antenna, a spectrum analyzer to capture the receive power of the test antenna and lastly, a stepper motor that turns the test antenna through either 180 or 360 degrees. For most lab instruments one can find drivers, which are programs that specifically control each of the instrument’s functions and can easily be incorporated into LabVIEW. The programming language used in LabVIEW, also referred to as G, is a dataflow programming language. Execution is determined by the structure of a graphical block diagram (the LV-source code) on which the programmer connects different function-nodes by drawing wires. These wires propagate variables and any node can execute as soon as all of its input data become available. Since this might be the case for multiple nodes simultaneously, G is inherently capable of parallel execution. The interface contains driver programs for the Hewlett Packard 8565E spectrum analyzer, Agilent MXG 51581A signal generator and the USB NI 6008 digital analog converter. The digital analog converter is used to generate a constant DC voltage that is used by the motor driver’s direction input. The system also uses the parallel port of the computer to generate an approximately 60 Hz square wave that is used by the clock input of the motor driver. The motor and driver were purchased from Anaheim Automation and the motor is used to rotate the platform that the test antenna sits on. The axis of rotation for the platform is directly around the shaft of the motor, which has a maximum torque as specified on the data sheet attached to this document. The system is turned on and off by a control box that has a fuse with a 2 Amp limit. Since the system is fully automated, all the user has to do is turn the power on for all instruments, open the LabVIEW interface, turn on the power to the control box and then click the run button on the interface. The general sequence execution of the LabVIEW GUI involves the user choosing the degree of rotation of the test antenna and the degrees per turn. Based on that information, LabVIEW sets the axis of the GUI and sends those values to the respective blocks that will be executed. The motor block sends a series of pulses to the motor driver, the platform turns, the power of the receive antenna is measured by the spectrum analyzer, and the data of the power intensity is captured on the GUI at every angle. The sequence is repeated until the chosen degree of rotation is achieved. The LabVIEW interface then saves the data and allows the user to look at the data using either linear or logarithmic scale. The program is closed by pressing the done measurement button. The GUI is shown in Figure 7.
Project P12311
Proceedings of the Multi-Disciplinary Senior Design Conference Page 5
Figure 7: LabVIEW Gain Measurement Program
The stepper motor is controlled using LabVIEW through the parallel port of the computer. The D0 pin of the parallel port outputs a 60 Hz, 3.5 Volt peak to peak square wave that is used by the motor driver clock input. To access the parallel port on the computer, the address to the port was assigned to the LabVIEW block controlling the motor operation. The port address and the number of steps to the motor are placed in a while-loop block that is executed each time this block is called. The parallel port cable is connected to the motor control box, which is then connected to the motor driver that is also used to create the ground for the system. (i.e. the parallel port, the motor driver and the digital analog converter all share the same ground.) The motor driver is set to operate in the micro-step mode. (i.e. one eighth of a full step which makes it turn 0.0225 degrees per step.) With this fine resolution the system is able to do 0.5 degrees per turn, which is a requirement of the interface. Lastly, the digital analog converter is used to generate a 5 or 0 Volt DC signal when the block is called. The DC signal is used by the motor driver direction input. When the signal is high (5 Volts), the motor turns counterclockwise. When the input is 0 volts, the motor turns clockwise. The system does not require any additional signals to operate except for the power to the motor driver that is transmitted through a 12- 24 Volts variable DC power cord. The system is operated at 15 Volts DC and because the stepper motor uses the applied voltage to excite its windings, the induced current causes the motor to become very hot. The design recommendation is for the system to operate at this voltage level unless more torque is needed by the motor. Also, the motor system must be turned off immediately after all tests are completed, so as to allow the motor to cool down.
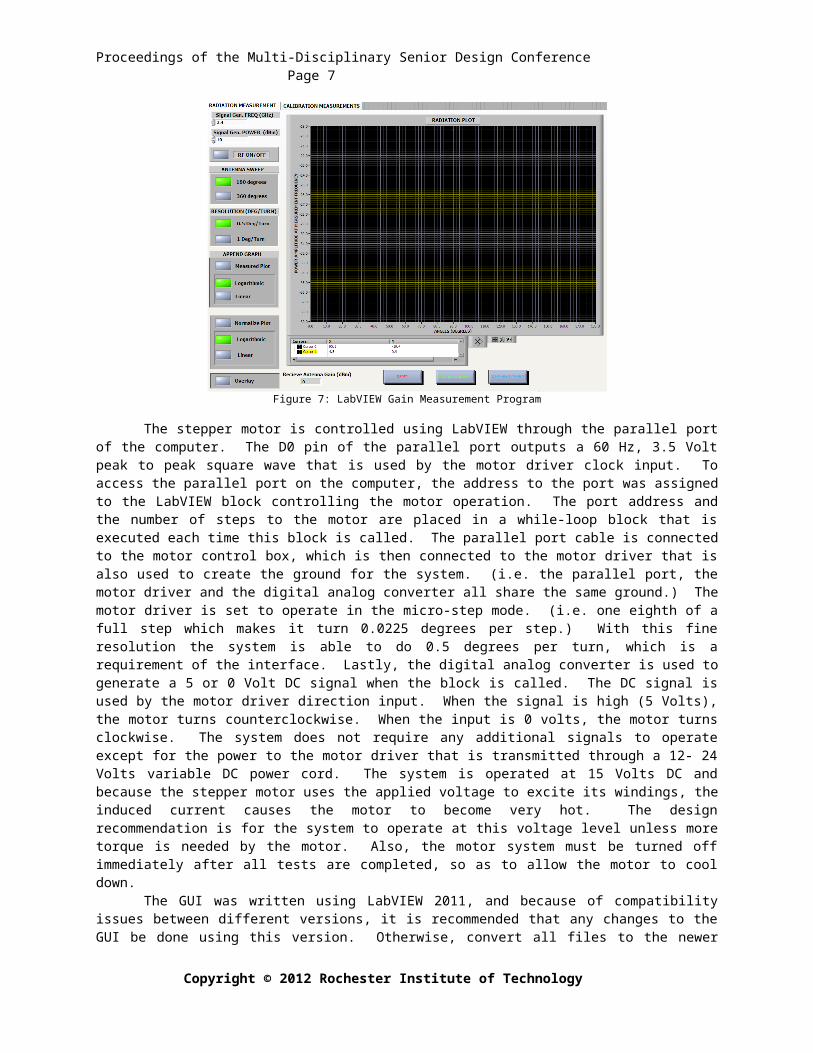
The GUI was written using LabVIEW 2011, and because of compatibility issues between different versions, it is recommended that any changes to the GUI be done using this version. Otherwise, convert all files to the newer version before making any changes. The GUI is used to implement the motor control mentioned above and the figure below shows the block used to implement this.
Proceedings of the Multi-Disciplinary Senior Design Conference Page 6
With the system being fully automated, the GUI also controls the signal generator and the figure below shows the block used to implement this.
Figure 9: Block Used to Control the Signal Generator
The figure shows the series of drivers that were downloaded from the National Instrument website. The blocks were aligned in series starting with the initialization block, followed by the setting for the frequency, the power setting and lastly the RF on or off. The initialization block contains the instrument address and once the instrument is on, the configuration blocks allow the user to change the various settings of the instrument. The front of the GUI contains all the control settings that the user can change. The frequency generator is used to power the Tx antenna and also sets its operating frequency. The maximum frequency of the generator is 17 dBi and most of the tests were conducted using 10 or 15 dBi.
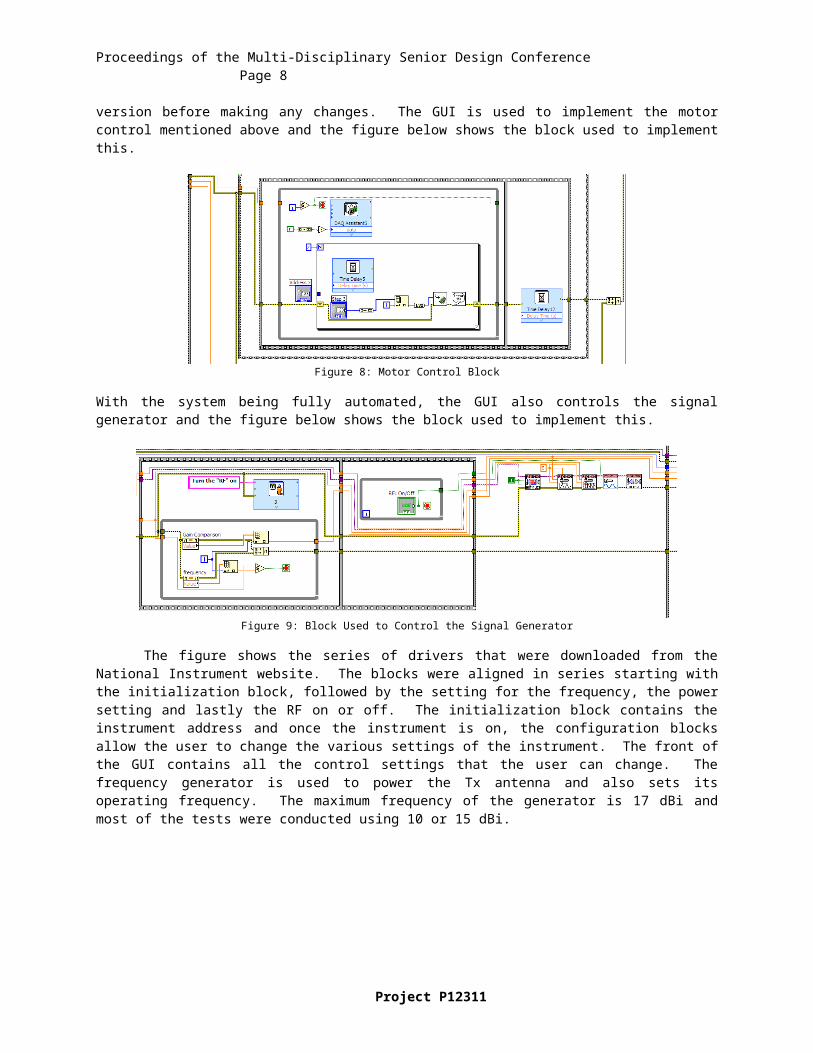
Figure 10: Block Used to Control the Spectrum Analyzer and Block Used for Plotting the Graph
As mentioned in the sequence of execution, the system should also acquire the received power from the spectrum analyzer and this data is plotted in real time on the GUI. This block is shown above. The block operates similar to that of the signal generator, with the only exception being that all default settings are used and the user is not allowed to change them. The initialization block is used to open communication with the instrument and the configuration blocks determine the modes and settings that the spectrum analyzer operates in. The peak at the operating frequency setting is used to acquire the power intensity and a plot of this value is done for each angle of the radiation plot. The plot default is a linear-linear scale. The GUI also allows the use of markers to look at a specific power intensity value and the corresponding angle, which can be seen on the front panel of the GUI.
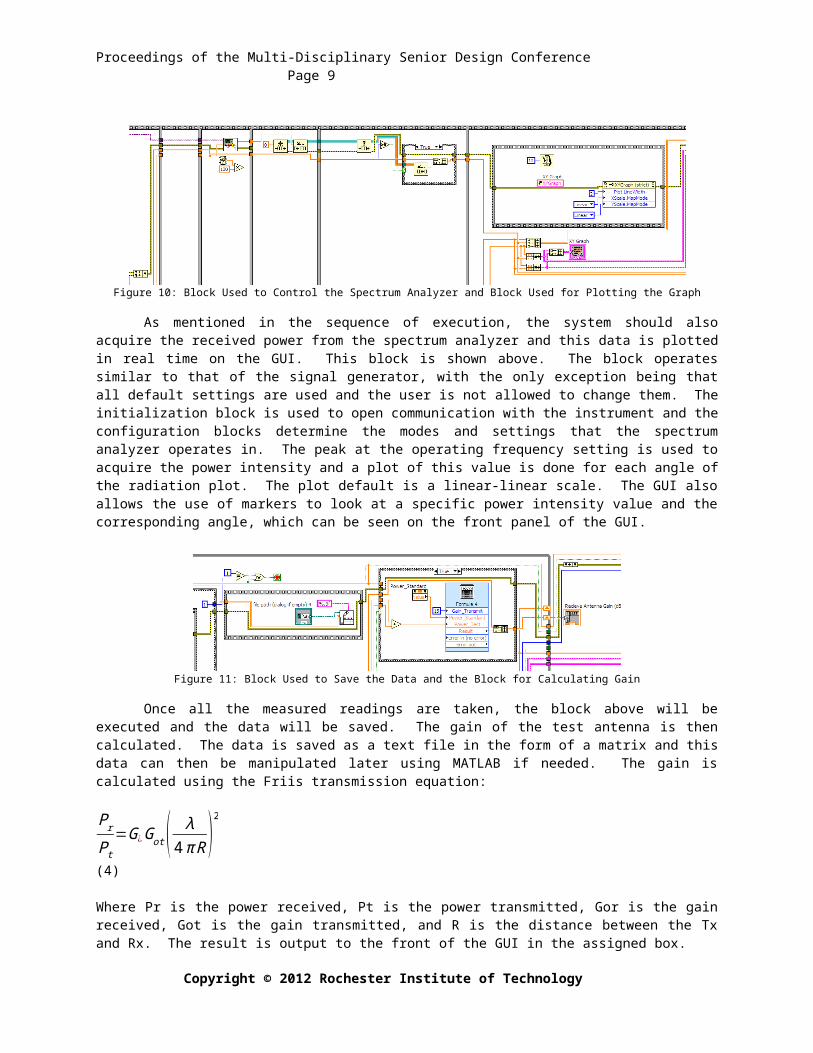
Figure 11: Block Used to Save the Data and the Block for Calculating Gain
Once all the measured readings are taken, the block above will be executed and the data will be saved. The gain of the test antenna is then calculated. The data is saved as a text file in the form of a matrix and this data can
Project P12311
Proceedings of the Multi-Disciplinary Senior Design Conference Page 7
then be manipulated later using MATLAB if needed. The gain is calculated using the Friis transmission equation:
P rPt
=G¿Got( λ4π R )
2
(4)
Where Pr is the power received, Pt is the power transmitted, Gor is the gain received, Got is the gain transmitted, and R is the distance between the Tx and Rx. The result is output to the front of the GUI in the assigned box.
Figure 12: Block Used to Allow the User to Use the Append Graph Feature
The user will be able to look at the result of the data using the graph append feature. This feature of the GUI allows the user to change the power intensity scale from linear to logarithmic. Also, the graph can be represented as normalized or as measured. The buttons to operate this feature are located on the front panel of the GUI.
The block shown in Figure 8-Figure 10 are replicated to implement the calibration program. The calibration program is used to characterize the chamber. Two reflector antennas are used while facing each other. The calibration program uses the known gain from the antenna specification sheet and the power received to calculate an offset that is used in the radiation program for the gain calculations. This offset equation is shown below:
GTEST=GSTANDARD+PTEST−PSTANDARD (5)
The “test” subscripts represent the gain and power being received from the DUT. The “standard” subscript represents the gain and power taken from the calibration program. In the calibration program, direct power measurement over all the specified frequencies of the antenna data sheet and this data is saved similar to how data is saved in the radiation program. The GUI for the calibration program is shown in Figure 13.
Test Results
The rotating platform set-up was placed in the chamber, and radiation measurements were taken for each type of antenna. First, the calibration was run using the microstrip antenna as shown below:
Proceedings of the Multi-Disciplinary Senior Design Conference Page 8
Figure 13: Microstrip Calibration Program Results
These values were then used as offset values in the gain measurement test to ensure that the gain being recorded was accurate. Next, the gain measurement program was run using the microstrip antenna and the results are below:
Error: Reference source not found shows the measured data using a linear scale. From this plot, the gain of the antenna can be determined. shows the measured data using a linear scale after it has been normalized. From this plot, the half power beam width can be determined. Below are the results from the gain measurement program when the reflector antenna was attached.
Proceedings of the Multi-Disciplinary Senior Design Conference Page 9
The system is able to make radiation measurements comparable to those given by the antenna datasheets. A 0.5 degree and 1 degree increment can be chosen to give fine or course resolution. Both a 180 degree and 360 degree test can be completed. This system is fully automated which allows users with no background to successfully run the measurement program. The automated test system to be placed inside of an Anechoic Chamber was a success.
ACKNOWLEDGMENTS
The team would like to express its sincerest gratitude to those who have made invaluable contributions to the project. Many thanks to Mark Hinman of Kodak, who generously donated the isolated chamber that was the base of the project. Also thanks to Don McPherson and Lance Bradsteet for absorber and monetary donation, along with technical expertise. Thanks to Professor George Slack for guidance, support, and an extra hand during construction. Thanks to Dr. Jayanti Venkataraman for theoretical expertise and for being the driving force behind the project.
REFERENCES[1] Constantine A. Balanis, Antenna Theory Third Edition, Hoboken, NJ: John Wiley & Sons, 2005. [2] Leland H. Hemming. Electromagnetic Anechoic Chambers A Fundamental Design and Specification Guide. Piscataway, NJ: IEEE Press, 2002.