Page 1
THESIS FOR THE DEGREE OF LICENTIATE OF ENGINEERING
Production of Hydrogen for Oil Refining by Thermal
Gasification of Biomass:
Process Design, Integration and Evaluation
JEAN-FLORIAN BRAU
Heat and Power Technology
Department of Energy and Environment
Chalmers University of Technology
Göteborg, Sweden 2013
Page 2
ii
Production of Hydrogen for Oil Refining by Thermal Gasification of Biomass: Process Design,
Integration and Evaluation
JEAN-FLORIAN BRAU
© Jean-Florian Brau, 2013
Publication 2013:
Heat and Power Technology
Department of Energy and Environment
ISSN:
Chalmers University of Technology
SE-412 96 Göteborg
Sweden
Phone: +46 (0) 31 771 10 00
Printed by Chalmers Reproservice
Göteborg, Sweden 2013
Page 3
iii
Production of Hydrogen for Oil Refining by Thermal Gasification of Biomass: Process Design,
Integration and Evaluation
JEAN-FLORIAN BRAU
Heat and Power Technology, Department of Energy and Environment
Chalmers University of Technology
ABSTRACT
Hydrogen is an important part of crude oil refining operations since it is required in several units
for the desulphurization and upgrading of various oil fractions. At present, most of the refineries
meet their hydrogen demand through methane steam reforming, a refinery unit that can represent
up to 25% of the plant’s fossil CO2 emissions. Processes based on thermochemical gasification of
biomass are promising alternatives for hydrogen production. This thesis presents a process
integration study of two distinct biomass-to-hydrogen concepts. The focus is put on the
integration of these processes with an existing refinery used as a case study for the identification
of promising configurations.
The first biomass-to-hydrogen concept is based on indirect, atmospheric steam gasification and
proven technologies for gas cleaning and upgrade (IG concept) while the second concept relies
on direct, pressurized oxygen-steam blown gasification and more advanced cleaning and
upgrading technologies (DG concept). Mass and energy balances for the biorefinery concepts are
obtained by process simulation while actual refinery data is used. Simulation results show that
based on Higher Heating Values (HHV), the conversion efficiency from biomass to hydrogen is
67% for the IG concept and 65% for the DG concept.
Process integration tools are then used to identify promising integration and heat recovery
opportunities. The identified process configurations differ in terms of coproducts: in addition to
hydrogen, the production of HP steam and/or electricity is investigated. All configurations are
compared in terms of energy and exergy efficiency and their environmental impact is assessed by
means of a fossil CO2 balance.
Results highlight the potential for improvement of process performances by performing biomass
drying with low quality refinery excess heat instead of high temperature biorefinery excess heat.
This integration allows the export of additional HP steam to the refinery or electricity generation
through an integrated steam cycle, which increase the efficiency of the biorefinery. The IG
concept is found to consistently outperform the DG concept according to both thermodynamic
efficiencies. For both concepts, the configuration where HP steam is exported to the refinery
appears most promising in a context of decreasing emissions from the European power sector.
Keywords: Process Integration, Hydrogen, Refining, Energy Systems, Modeling, Biomass
Gasification
Page 5
v
List of Publications
This thesis is based on the following papers.
I. Brau J-F, Morandin M, Berntsson T. Hydrogen for oil refining via biomass indirect
steam gasification: energy and environmental targets. Clean Technologies and
Environmental Policy. 2013;15(3):501-12.
II. Brau J-F, Morandin M. Biomass-based hydrogen for oil refining: integration and
performances of two gasification concepts. 2013. Submitted for publication in
International Journal of Hydrogen Energy.
Jean-Florian Brau is the main author of these papers. Thore Berntsson was the main supervisor of
and Matteo Morandin co-supervised the work.
Related work not included in this thesis
Brau J-F, Morandin M, Berntsson T. Integration of a biomass-to-hydrogen process in an
oil refinery. Chemical Engineering Transactions. 2012;29:1087-92.
This article is a conference paper that presents results included in Paper I, which is an extended
version including also additional work. Including this conference article was not considered
instrumental to improving the quality of this thesis and it was thus discarded.
Page 7
vii
Table of Contents
1. Introduction ............................................................................................................................ 1
1.1 Background ........................................................................................................................ 2
1.1.1 Case study .................................................................................................................. 2
1.1.2 Hydrogen for oil refining ........................................................................................... 3
1.2 Objectives .......................................................................................................................... 5
1.3 Related work ...................................................................................................................... 5
1.4 Outline ............................................................................................................................... 6
2. Thermochemical biomass-to-hydrogen conversion ............................................................. 7
2.1 Biomass drying .................................................................................................................. 8
2.2 Gasification ........................................................................................................................ 8
2.2.1 Principles ................................................................................................................... 8
2.2.2 Technical solutions ..................................................................................................... 9
2.3 Gas cleaning .................................................................................................................... 11
2.3.1 Principles ................................................................................................................. 11
2.3.2 Technical solutions ................................................................................................... 12
2.4 Gas upgrading .................................................................................................................. 13
2.4.1 Reforming ................................................................................................................. 13
2.4.2 Water-gas-shift ......................................................................................................... 15
2.5 Hydrogen separation ........................................................................................................ 15
2.5.1 Pressure-Swing Adsorption (PSA) ........................................................................... 15
2.5.2 Membrane separation .............................................................................................. 15
3. Methodology ......................................................................................................................... 19
3.1 Process simulation ........................................................................................................... 19
3.2 Process integration ........................................................................................................... 21
3.3 Process evaluation ........................................................................................................... 23
3.3.1 Performance indicators ............................................................................................ 23
3.3.2 Fossil CO2 balance .................................................................................................. 24
4. Results ................................................................................................................................... 27
4.1 Process design .................................................................................................................. 27
Page 8
viii
4.1.1 Indirect Gasification concept ................................................................................... 27
4.1.2 Direct Gasification concept ..................................................................................... 28
4.2 Process integration ........................................................................................................... 29
4.2.1 Integration opportunities .......................................................................................... 29
4.2.2 Selected configurations ............................................................................................ 33
4.3 Process performances ...................................................................................................... 33
4.4 Fossil CO2 balance ........................................................................................................... 37
4.5 Relevance and final choice of indicators ......................................................................... 40
5. Discussion .............................................................................................................................. 43
5.1 Future use of biomass ...................................................................................................... 43
5.2 Keeping track of the “green” ........................................................................................... 44
5.3 Relevance of the case study ............................................................................................. 44
6. Conclusions ........................................................................................................................... 47
7. Future work .......................................................................................................................... 49
7.1 Design optimization ......................................................................................................... 50
7.2 Process synthesis ............................................................................................................. 50
Nomenclature ................................................................................................................................ 53
References ..................................................................................................................................... 55
Acknowledgements ....................................................................................................................... 61
Appendix ....................................................................................................................................... 63
Page 9
Introduction
1
1. Introduction
As a response to the challenges of global warming and climate change, the European Union (EU)
has issued various policy instruments such as the Emissions Trading System (ETS), which
objective is to reduce industrial greenhouse gas emissions cost-effectively [1]. A quantitative
target for global emission reduction was also set by the EU at a level 20% lower than 1990 as an
additional incentive to translate policy into an effective transition (part of the EU 20-20-20
targets [2]). Cuts in emissions from the industrial sector are expected to play a significant role in
meeting the target since this sector represented 58% of the total carbon dioxide (CO2) emissions
in the EU-27 in 2007 [3]. As an energy intensive activity, the refining industry holds a significant
share of these emissions.
Options for the reduction of fossil CO2 emissions in the industrial sector include energy
efficiency measures and replacement of fossil-based energy with renewable energy. Solar power,
wind power and hydropower are alternative technologies to produce renewable electricity but
when it comes to the production of chemicals and transportation fuels, biomass appears as a
promising renewable substitute for fossil fuels [4].
The use of biomass, when it replaces fossil fuel supply in a given conversion process, leads to a
reduction in fossil CO2 emissions. Additionally, systems making use of biomass are inherently
more sustainable than their fossil fuel-based counterparts since biomass is a renewable resource,
as opposed to fossil fuel supply which is bound to exhaustion. Biofuel production through
biomass conversion processes could thus contribute in meeting two of the EU 20-20-20 targets:
global emission reduction and share of energy produced from renewables.
However, renewable does not mean unlimited: the worldwide potential for biomass energy
supply is estimated at around 20 to 30% of the current energy demand [5, 6]. Identifying the most
efficient biomass conversion pathways is therefore crucial to achieve the transition to a consistent
and more sustainable energy system.
The focus of this study is put on the utilization of biomass for hydrogen supply in a complex
European oil refinery. The work presented in this thesis is based on the case study of an existing
Page 10
Jean-Florian Brau
2
oil refinery, where the substitution of the existing fossil-based hydrogen production unit by a
biomass-based process is investigated. Since a number of different technologies can be used in a
biomass-to-hydrogen process, the aim is to determine the most promising concept among some
design alternatives.
1.1 Background
Oil refining designates the process of transforming crude oil into a variety of marketable products
such as gasoline or diesel. The overall aims of the refining chain are as follow:
- Remove contaminants (essentially sulfur compounds) from crude oil;
- Separate the oil into so-called “fractions”, according to the molecular weight of the
hydrocarbon chains. A fraction is composed of hydrocarbons within a certain range of
molecular weight;
- Break down long hydrocarbon chains (heavy fractions) into more value-added short
chains (light fractions): this is known as cracking;
- Improve quality of the obtained fractions regarding e.g. environmental regulations and
combustion behavior.
Several techniques are operated to reach each of these objectives. The refining process therefore
consists in a number of operations ranging from simple distillation to heterogeneous, catalytic
chemical reactions. Depending on the range of products delivered by a refinery, its organization
can take various levels of complexity, from a simple refinery equipped only with atmospheric
distillation and a few upgrading operations to a complex refinery operating several distillation
trains and extensive upgrading units.
1.1.1 Case study
The case study refinery is located on the Swedish West Coast. The plant is one of the most
modern in Europe and has a capacity of 11.4 Mt crude oil/y. Figure 1 shows a flowsheet of the
refinery.
The total hot utility demand in the refinery amounts to 408 MW. The plant has an electricity
demand of 45 MW, which is entirely satisfied through power import from the grid. A large
amount of excess heat is also available from the refinery, mostly in process streams currently
cooled by air fans. Fuel gas-fired boilers in the refinery produce 49.4 MW of High Pressure
steam (HP steam at 390°C and 39 bars) with an efficiency of 80%.
The total hydrogen requirements in the refinery are 12.5 t/h. Of these, only 5.1 t/h originate from
catalytic reforming operations where hydrogen is a byproduct. Therefore, the additional 7.4 t/h
(291.5 MW, HHV basis) need to be produced in a dedicated refinery unit.
Page 11
Introduction
3
Figure 1: flowsheet of the case study refinery
1.1.2 Hydrogen for oil refining
The European refining industry is directly impacted by the ETS and EU 20-20-20. In addition to
these political incentives aiming at a reduction of on-site CO2 emissions, other measures target
combustion emissions, i.e. emissions that take place when fuels are used in combustion engines.
Among these, more stringent regulations have been implemented that limit sulfur content in
automotive fuels [7]. Sulfur removal is performed in the refinery by hydrodesulphurization:
sulfur compounds in the feed are broken down into hydrocarbons and gaseous hydrogen sulfide
(H2S) on a catalyst bed and in presence of hydrogen. Reaction (1) presents the example of
ethanethiol desulphurization. Gaseous H2S is subsequently removed from the liquid process
stream.
P
R
O
D
U
C
T
M
I
X
E
R
V
D
U
I
C
R
HYDROGEN PRODUCTION(HPU)7.4 t/h
AMINE
TREATMENT
SULPHUR RECOVERY
(SRU)
TAIL GAS TREATMENT
(TGTU)
OXYGEN
VACUUM DISTILLATION
M
H
C
F
C
C
V
B
U
HEAVY FUEL OIL
GASOIL TO MHC
NAPHTHA TO NHTU
VISTAR
S
S
U
C
R
U
I
S
O
N
H
T
U
CRUDE
HYDRO CRACKER
CATALYTIC CRACKER
M
E
R
O
X
POLY UNIT
SYNSAT UNIT
MILD HYDRO CRACKER
DECANT OIL
PITCH
UCO
ATM. RESIDUE
GASOIL
MKI/MKII DIESEL
UL 95 GASOLINE
UL 98 GASOLINE
BUTANE
NAPHTHA
CRUDE DISTILLATION
(CDU)11.4 Mt/yr
KEROSENE
LAGO
HAGO
SYNSAT PRODUCT
VGO
HEAVY REFORMATE
LIGHT REFORMATE
HHAGO
HEXATE
ISOMERISATE
BUTANE
PROPANE
NAPHTHA
KEROSENE
POLY. GASOLINE
PROPYLENE
SULPHUR
"DESULPHURISED" FUEL GAS TO STACK
REFINERY FUEL GAS
P
O
L
Y
PROPANE & BUTANE
MHC GASOIL
FCC GASOIL (LCO)
VISBREAKER
NAPHTHA HYDROTREATING
NAPHTHA
ISOMERISATION
CCR PLATFORMER
Page 12
Jean-Florian Brau
4
Ethanethiol + Hydrogen → Ethane + Hydrogen sulfide
C2H5SH + H2 → C2H6 + H2S (1)
The toughening of regulations imposes deeper desulphurization and therefore leads to an increase
in hydrogen demand in the refinery. As a consequence, most complex refineries are structurally
in deficit of hydrogen and therefore operate dedicated Hydrogen Production Units (HPU). As
opposed to catalytic reforming units where hydrogen is a byproduct of the upgrading of oil
fractions, the sole purpose of these HPUs is to produce hydrogen to meet the refinery’s demand.
An overwhelming majority of HPUs consists in steam reforming of light hydrocarbons (e.g.
methane) followed by single or dual shift of carbon monoxide (CO) into hydrogen [8]. Figure 2
presents the flowsheet of a typical industrial HPU with indicative temperature levels.
Figure 2: flowsheet of a typical refinery HPU
Steam reforming can represent up to 25% of the total CO2 emissions in a refinery [9]. It is
therefore crucial for the refinery sector to find efficient, environmental-friendly pathways to meet
an increasing hydrogen demand without hindering their emission reduction plans. While
improving hydrogen recovery within the refining processes and the refinery hydrogen network is
a solution that cannot be overlooked [10], the refining industry has the opportunity to take a
leading role in the implementation of new, carbon lean technologies for hydrogen production.
Indeed, a range of pathways based on very different approaches is currently under research:
electrolysis and thermal dissociation use water as feedstock while several processes rely on
biomass. From a sustainability point of view, water electrolysis may prove an interesting pathway
if renewable-based electricity is used. Unless combined with large scale electricity storage
however, availability issues arise. Thermal dissociation by means of nuclear energy is a source of
environmental and social concerns. Biomass fermentation does not seem promising because of
low yields and long reaction times [11].
Among biomass-to-hydrogen processes, production through biomass gasification is highly
efficient and could reduce dependence on fossil feedstock and, as a consequence, emissions of
fossil CO2 [12]. Compared to the processes discussed previously, biomass gasification is also the
Page 13
Introduction
5
route that is the most likely to comply with the availability and productivity requirements of a
refinery.
1.2 Objectives
The overall objective of this thesis is to study hydrogen production through thermal gasification
of biomass as a substitution to a fossil fuel-based HPU in a complex European oil refinery. Since
a number of different technologies can be combined to form a complete biomass-to-hydrogen
process, the aim is to determine the most promising concept among some design alternatives.
To this end, performance indicators are defined. These are general enough to allow comparing
these concepts to other biomass conversion pathways but also well adapted to the nature of the
processes, material and energy flows involved in this study. The environmental performance of
these biomass-based concepts is also determined. This is done by evaluating the change in fossil
CO2 emissions at the refinery after the implementation of each concept.
The necessity of making use of the high temperature excess heat potentially available in biomass
gasification processes was highlighted in several previous studies [13]. Additionally, although
modern refineries are rather well energy-integrated, a structural excess of heat remains in these
plants [14, 15]. However, the temperature levels of this waste heat are usually much lower than
those expected in biomass gasification concepts. In this thesis, particular attention is thus paid to
opportunities for heat integration, both within the biorefinery and with the oil refinery. The
identified opportunities are included in different configurations of the biorefinery that are then
compared using the selected performance indicators.
1.3 Related work
Although no industrial plants have been built yet, a large body of literature has been produced on
stand-alone hydrogen production through biomass gasification. Detailed design parameters and
economic results for a process based on the Battelle Columbus Laboratory gasifier were
published by Spath et al. [16]. Williams et al. [17] provided a literature review on existing
gasifier concepts with focus on technological challenges associated with hydrogen production.
Hamelinck and Faaij studied several stand-alone biomass-to-hydrogen concepts considering two
types of gasifiers [18]. They published detailed simulation data and economic evaluations which
showed comparable outcomes for the various systems. The concepts using membrane separation
appeared to perform well on an economic point of view due to high efficiencies and modest
investments.
More recently, Cohce et al. studied one concept of a hydrogen production process based on
biomass gasification by applying energy and exergy analysis [19]. With help of a multi-objective
optimization framework, Tock and Maréchal designed and optimized the thermo-economic
performance of stand-alone biomass-to-hydrogen concepts based on the FICFB gasifier [20].
Page 14
Jean-Florian Brau
6
Some concepts included a gas turbine and/or carbon capture; efficiencies of 60% were reached in
some cases. The integration of hydrogen production processes with other industrial plants was
also investigated in a number of publications. As an example, Andersson and Harvey compared
hydrogen production via black liquor gasification and stand-alone biomass gasification [21].
Among the studies dealing with hydrogen production for refinery applications, Sarkar and Kumar
[22] investigated the production of hydrogen via biomass gasification for the upgrading of
bitumen from oil sands. However, they considered only stand-alone processes producing
hydrogen sent via pipeline to the refining site, which was very specific to the Canadian oil sands
industry. Heat integration with the refining plant was not part of their work.
In [23], Johansson et al. investigated CO2 emission consequences of hydrogen production
through biomass gasification compared to standard methane reforming in a simple oil refinery
equipped only with atmospheric distillation, naphtha reformer and necessary treatment. Several
process designs were included but all had dual shift and pressure swing adsorption in common.
Opportunities for the use of refinery excess heat were studied as well. In this latter study, the
biomass gasification process was considered as a supplementary capacity installed to satisfy an
increase in hydrogen demand and excess heat from the biorefinery was used for steam export
only. Results were found to heavily depend on assumptions on the surrounding energy system
and biomass availability.
The present work is based on the case study of a much larger and more complex refinery, which
is likely to be more representative of the future European refining plants. Besides steam export,
electricity generation is also considered for biorefinery excess heat recovery and several
technologies are included in process concepts.
1.4 Outline
Chapter 2 is a presentation of the biomass-to-hydrogen gasification pathway and the different
steps it consists of. In Chapter 3, the methodology used and the way the work was structured are
detailed. Results are then presented in Chapter 4 and discussed in Chapter 5, followed by
conclusions in Chapter 6. In Chapter 7, ideas for future work on the project are highlighted.
Page 15
Thermochemical biomass-to-hydrogen conversion
7
2. Thermochemical biomass-to-hydrogen
conversion
A thermochemical biomass-to-hydrogen process is organized in roughly three sections: biomass
drying and gasification, syngas cleaning and upgrading and hydrogen separation. However,
several technologies can be applied in each of these sections and the resulting biomass-to-
hydrogen concept is a combination of chosen building blocks, see Figure 3.
Figure 3: principle diagram of a biomass-to-hydrogen process with alternative technologies
Two process concepts, following two different design approaches, are investigated in this work.
The principles of the subsequent steps included in the biomass-to-hydrogen concepts are
described in this section, together with the main technologies that can be applied. The design of
the two processes, built by assembling these technologies to form a whole biomass-to-hydrogen
conversion chain, is explicated in the results section (section 4.1).
Page 16
Jean-Florian Brau
8
2.1 Biomass drying
The usual moisture content of woody biomass is around 50wt%. Gasifying wet biomass implies
evaporating this water content with high temperature heat in the gasifier, which leads to
additional energy requirements. The first step of a biomass conversion system therefore consists
in drying the incoming feed.
Drying is performed prior to gasification to ensure reliable operation of the gasifier and to
maximize efficiency [24]. Higher moisture content in the biomass also hinders char combustion
which leads to lower gasification temperature and, therefore, to increased methane and lower
hydrogen contents in the produced syngas [25]. The optimal moisture content for gasification is a
function of the gasifier type and the final desired product but is in a range of 10 to 20wt% [17].
Several drying technologies exist but three are mainly considered in biomass conversion systems:
- Flue gas drying
- Steam drying
- Low temperature air drying
Each technology has a different net specific energy demand for drying [26]. Although steam
drying offers the lowest demand, low temperature air drying is of particular interest in case of a
biorefinery since it allows recovering low temperature excess heat for biomass drying. This low
quality energy can originate either from the biorefinery itself or from a nearby industrial plant
with an excess of heat, i.e. the oil refinery in this work. For these reasons, low temperature air
drying is the only biomass drying technology included in this thesis.
2.2 Gasification
2.2.1 Principles
Gasification is the conversion of solid biomass into a gas with usable heating value and solid
mass residues (ash and unconverted material, i.e. char) [27]. The gaseous phase mainly consists
in CO, CO2, H2, CH4 and steam originating from vaporization of the remaining biomass moisture
content and potentially from unreacted steam injection. This gas will in the following be referred
to as syngas.
Thermal gasification of biomass essentially takes place in three subsequent stages. In the first
stage, remaining biomass moisture is evaporated. Biomass is then pyrolyzed to char and,
simultaneously, condensable and permanent gases are produced. Condensable gases consist in
water and TAR, i.e. heavy hydrocarbons. Above 800-850°C, the main chemical reactions
occurring in gasification are as follow (adapted from [27]).
Page 17
Thermochemical biomass-to-hydrogen conversion
9
C + (1/2) O2 → CO Partial oxidation 298KrΔH = -111 kJ/mol (2)
C + H2O ↔ CO + H2 Steam gasification 298KrΔH = +131 kJ/mol (3)
C + CO2 ↔ 2 CO Reverse Boudouard 298KrΔH = +172 kJ/mol (4)
CO + H2O ↔ CO2 + H2 Water-gas shift 298KrΔH = -41 kJ/mol (5)
CH4 + H2O ↔ CO + 3 H2 Steam reforming 298KrΔH = +206 kJ/mol (6)
Additionally, pyrolysis reactions take place, essentially producing char and TAR.
2.2.2 Technical solutions
Several alternative technologies exist to perform biomass gasification. They have different feed
quality requirements, operating and capacity ranges and, most importantly, produce syngas with
different compositions. All of them are not adequate for continuous hydrogen supply in a
refinery. The different gasifier types are depicted in Figure 4.
Figure 4: types of gasifier technologies
In a fixed bed gasifier, the oxidant is injected through a fixed bed of biomass where the gasifying
reactions take place. In a fluidized bed gasifier, the velocity of the oxidant is increased until
bubbles appear in the bed of biomass. Bubbles allow for a more uniform temperature in the bed.
If the velocity of the oxidant is further increased, biomass particles are entrained with it. To
stabilize temperature and carry heat in the process, bed material (e.g. sand) is added to the bed
and a circulating fluidized bed gasifier is obtained. Bed material, ash and slag are separated from
the product gas in a cyclone and returned to the gasifying section. Finally, increasing the velocity
of the oxidant and the gasification temperature until over 1250°C allows operation in entrained
flow mode, i.e. without bed material thanks to quick reaction times and easy fluidization. This is
possible only with small size biomass particles.
Page 18
Jean-Florian Brau
10
Fixed bed gasifiers have a tendency to produce large amounts of TAR and/or char (unconverted
biomass), have small capacities and are usually operated in batch modes. For these reasons they
seem to be rather inadequate for H2 supply in a refinery. Their main advantage is their ability to
handle extremely inhomogeneous feedstock such as municipal solid waste, which makes them
good candidates for small-scale waste-to-fuels or chemicals applications [25].
Bubbling fluidized beds are by far the technology the most widely demonstrated for biomass
gasification, however not at high enough temperatures (1200-1300°C) to eliminate the need for
downstream syngas upgrading. They are possibly the cheapest option among biomass gasification
technologies thanks to their simple design, but have lower capacity and potentially less uniform
temperature distribution than circulating fluidized beds.
Circulating fluidized beds (CFBs) use higher gas velocities and offer higher conversion rates,
efficiencies and throughput. This technology involves direct heating, i.e. in situ combustion of
part of the biomass feed to provide energy to the endothermic gasification reactions. If air is used
as an oxidant, the syngas is diluted with inert nitrogen and a separation step must be added to the
process. Alternatively, combustion can be carried out with pure O2. Oxygen-fired CFBs are
candidates for H2 and/or liquid fuels production [17].
Indirectly heated gasifiers are inherently more complicated than directly-heated systems, but can
produce syngas with a high heating value [25]. Combustion and gasification take place in two
different vessels; heat is provided to the gasification reactions by bed material that circulates in
loop between the two sections. Compared to directly heated gasifiers, their advantage is that pure
O2 is not required to produce nitrogen-free syngas. This reduces both investment and running
costs since air separation units are no longer needed and the avoided dilution of the syngas allows
smaller downstream equipment. TAR production remains an issue in indirectly heated gasifiers,
although TAR content can be reduced by adding steam to the gasification section [28] [29].
Finally, entrained-flow gasifiers have even higher material throughput, thanks to high gas
velocities which enable operation without bed material. This type of system is usually oxygen-
blown and operates at high temperature (>1250°C). Consequently, little to no TAR or methane is
formed. High gas velocities however mean short residence time for biomass particles, which
therefore need to be very small. Pretreating and feeding biomass to entrained-flow gasifiers,
especially for pressurized systems, remain thus an important issue to overcome for industrial-
scale application. Entrained-flow gasifiers are used extensively in oil refining but only pilot
plants are currently in operation with biomass feedstock (e.g. bioliq in Karlsruhe or the DBI pilot
plant in the Netherlands). An industrial plant, using the Choren technology involving entrained-
flow gasification, is currently in the engineering phase for construction in Finland (Ajos BtL
project) [30].
Page 19
Thermochemical biomass-to-hydrogen conversion
11
2.3 Gas cleaning
2.3.1 Principles
In refineries, feedstock is treated upstream and syngas produced in the HPU is clean from
particles or TAR. In the case of biomass gasification though, syngas is contaminated with:
‐ particles (char, dust, bed material entrained with the gas flow) ;
‐ heavy, condensable compounds (TAR);
‐ alkali, sulfur and halogen compounds [31].
All of these can block or deactivate catalysts via e.g. adsorption or chemical reactions and foul
downstream equipment through e.g. condensing. Cleaning is thus required before further syngas
processing in a biomass conversion system. Indicative maximum allowable impurities
concentrations in syngas are given in Table 1.
Table 1: Maximum allowable concentration of impurities in syngas (adapted from [32])
Impurity Specification
Sulfur compounds (H2S, COS) < 1 ppmv
Nitrogen compounds (NH3, HCN) < 1 ppmv
Halogens (HCl) < 1 ppbv
Alkali metals (Na, K) < 1 ppbv
Particles “Almost completely removed”
TAR Not condensing
Hetero-organic species (incl. S, N, O) < 1 ppmv
The term “TAR” designates a number of heavy hydrocarbons produced during gasification of
biomass. Although the accurate definition varies among scientific publications, TAR can be
summarized as heavier hydrocarbons that can potentially condense in colder parts of the process,
downstream the gasifier [24]. TAR yield decreases with increasing gasification temperatures, as
heavier species are cracked into lighter products. A classification of TAR species according to the
order of production through gas-phase thermal cracking is suggested by Milne et al. [33]:
- Primary products: cellulose-derived products such as hydroxyl-acetaldehyde and
furfurals, hemicellulose-derived products, lignin-derived methoxyphenols;
- Secondary products: phenolics, olefins;
- Alkyl tertiary products: methyl derivatives of aromatics such as toluene, methyl
acenaphthylene, methylnaphthalene, indene;
- Condensed tertiary products: naphthalene, acenaphthylene, anthracene/phenanthrene,
pyrene.
Page 20
Jean-Florian Brau
12
Figure 5: Distribution of the four TAR component classes vs. temperature (adapted from [33])
Figure 5 shows the distribution of these four “classes” vs. gasification temperature. Primary and
tertiary products are essentially mutually exclusive, i.e. primary products are destroyed before
tertiary products appear in significant amounts.
2.3.2 Technical solutions
Biomass syngas can be cleaned using available, conventional technologies: gas cooling, low
temperature filtration (dust and particles removal) and water scrubbing at 150-200°C (TAR
condensation and removal, removal of other contaminants) [18]. A cyclone for first solid
separation and a ZnO guard bed to remove traces of sulfur contaminants before catalytic
treatment might be added [32]. These technologies have been demonstrated and are used in coal
gasification combined cycle and Fischer-Tropsch synthesis. This low temperature cleaning
strategy will be further referred to as wet gas cleaning.
Wet gas cleaning is not always a penalty in terms of feedstock conversion, but in processes
involving high temperature operations such as steam reforming, wet gas cleaning reduces the
maximum energy efficiency that can be reached by the system. Hot gas cleaning strategies can
therefore improve energy efficiency (i.e. the fraction of energy entering the system recovered in
useful forms) and reduce equipment costs since cooling and reheating are avoided [34] [18]. This
does not apply to atmospheric gasification, where syngas needs compressing, thus cooling, before
upgrading. Hot gas cleaning is at research stage and further developments are needed for
industrial application. Cleaning takes place between 500 and 1000°C, with 800°C being listed as
preferred temperature for heat recovery. Several options are investigated for particles removal,
see Table 2.
Page 21
Thermochemical biomass-to-hydrogen conversion
13
Table 2: options for particle removal at high temperature (adapted from [34])
Technology Operating conditions Advantages Drawbacks
Cyclone T up to 925°C
P up to 1-2 MPa
Low investment and
operating costs
Continuous operation
without particle
accumulation
Inefficient for particles
smaller than 5 μm
Candle filter
Up to 1000°C for metal
filters, 400 to 700°C
reported
Near 100% efficiency
Residual particle deposit,
inconvenient cleaning
methods
Low reliability for
ceramic filters
Granular
bed filter High T and P
99% for d>4 μm, 93% for
smaller Few data available
Electrostatic
precipitator
Up to 1000°C
P from 0,1 to 3,5 MPa
No pressure drop
Observed efficiency
between 95 and 100% for
particle size between 0,01
– 100 μm
Few data in extreme T
and P conditions
TAR cracking is preferred to scrubbing in hot gas cleaning configurations. In addition to high
temperature operation, TAR cracking increases the H2 and CO content of the syngas. NH3 can be
removed by base absorption or decomposition over Ni catalyst after H2S removal, which can be
performed through chemisorption or absorption [18]. Other contaminants (SOx, NOx, HCl, HCN,
alkali) are removed by adsorption or absorption [35] [36].
2.4 Gas upgrading
In a biomass-to-hydrogen process, upgrading of the syngas is carried out in two steps: reforming
and water-gas-shift.
2.4.1 Reforming
In the reforming step, light hydrocarbons in the syngas react with steam to produce hydrogen and
carbon monoxide. With methane (CH4) as an example, the global balance can be written as
follows:
CH4 + 2 H2O ↔ 4 H2 + CO2 (7)
Natural gas is the main feedstock used for hydrogen production through steam reforming – this
process is therefore commonly known as Steam-Methane Reforming (SMR). The reformer
operates at elevated temperatures, usually around 850-900°C, and moderate pressure (15 to 30
bars). The steam to carbon ratio is typically between 2.5 and 5. Nickel catalysts are used. The
syngas obtained has a higher H2 and CO content than the incoming feed; CH4 conversion is
Page 22
Jean-Florian Brau
14
around 90%. Reaction (7) is highly endothermic: the reforming reactor is a large high
temperature heat sink and the reaction is usually carried out in a furnace where a tubular reactor
is disposed.
Two concepts derive from SMR: partial oxidation and autothermal reforming (ATR). They are
not as widespread as reforming for hydrogen production, but industrial application was
demonstrated or industrial units exist.
Partial oxidation
Partial oxidation can be described as combustion of the feedstock below stoichiometric
conditions (i.e. in lack of oxidizing agent). It takes place at high temperature and pressure: 1200
to 1500°C and 20 to 90 bars. The reaction is exothermic, conducted in presence of pure O2 and a
temperature moderator, i.e. steam. Catalysts can be used to lower the required reaction
temperature to around 1000°C. The feedstock is first preheated to around 300°C and Reaction (8)
(global reaction resulting from numerous chemical equilibria) brings the gaseous mixture to
above 1000°C.
CnHm + (n/2) O2 → n CO + (m/2) H2 (8)
Partial oxidation is in fact a partial combustion of the feedstock, carried out in a deficit of O2
compared to stoichiometric combustion proportions. It can be applied to heavier hydrocarbons
compared to reforming (asphalts, petcoke) but also directly to coal and biomass.
Autothermal reforming
Autothermal reforming (ATR) is based on the combination, in a single vessel, of partial oxidation
and steam reforming. The energy needed by endothermic reforming reactions is provided by the
exothermic partial oxidation section. Heat flows are thus optimally integrated.
Partial oxidation takes place in a combustion zone at the beginning of the reactor. Hot gases are
then led to a catalytic section for reforming. Ni-based catalyst is usually used and operating
conditions are from 900 to 1100°C and between 20 and 60 bars [8].
ATR allows higher H2 yields than partial oxidation for any type of feedstock. It is also less
sensitive to coking than SMR. According to some sources, ATR could be the only technology
able to handle the high CO and C+ content of biomass syngas without excessive coking [18].
Finally, ATR allows recovering the energy content of TAR through either partial oxidation for
heat supply or cracking to increase H2 yield, which eliminates the need for a separate TAR
cleaning step.
Page 23
Thermochemical biomass-to-hydrogen conversion
15
2.4.2 Water-gas-shift
Following reforming, water-gas-shift (WGS) is applied (Reaction (4)). This enables a first
purification of the syngas and an increase in H2 yield through the conversion of carbon
monoxide. This step generates around 15% of the total H2 produced in a traditional SMR plant.
The shift reaction is favored at low temperatures, in excess of steam and is usually operated in
two steps. The first step, at high temperature (HTS), favors kinetics and the second, low
temperature step (LTS) favors higher CO conversion. Usual characteristics of the two WGS steps
are given in Table 3.
Table 3: characteristics of WGS steps [8]
HTS LTS
Catalyst type Iron oxide Copper oxide, zinc oxide, aluminum oxide
Inlet temperature (°C) 350 200-220
Temperature elevation (°C) 30 to 60 10 to 30
2.5 Hydrogen separation
2.5.1 Pressure-Swing Adsorption (PSA)
The PSA process is the most widespread H2 purification process. Highly pure H2 can be
produced, at the same pressure level as the syngas feed but at near- or ambient temperature. H2
recovery rates range from 75 to 95%, depending on purity specifications [37].
This process relies on the adsorption of gas phase molecules on a solid adsorbent. In the case of
H2 production, impurities are selectively retained by the adsorbent because of their greater
affinities. A pure H2 stream is produced at constant pressure level. After a while, the adsorbent
bed is saturated with impurities and needs regeneration. This is usually done by lowering the
pressure. A single PSA adsorber is thus operated in a cycle and several adsorbers are needed in
parallel to obtain a continuous purification unit (typically 5 to 12). Several adsorbents are usually
used as subsequent layers in an adsorber: silica gels, activated char and zeolites, with the latter
two being the most widely employed.
2.5.2 Membrane separation
Another option for H2 purification exists, namely inorganic membrane separation. A membrane is
a physical barrier allowing selective transport of mass species. The driving force of the
membrane separation process is often a pressure or concentration gradient across the membrane,
see Figure 6. Selectivity and permeation rate (or permeance, i.e. the mass flux through the
membrane) are the most basic properties of a membrane. The higher the selectivity, the more
efficient the process and the lower the driving force required to achieve a given separation. The
higher the permeation rate, the smaller the required membrane area.
Page 24
Jean-Florian Brau
16
Figure 6: Simplified principle of membrane separation
In hydrogen production, dense phase metal and microporous ceramic membranes have the
potential to replace not only PSA systems but also WGS reactors if installed in catalytic
membrane reactors. These even have the potential to improve the equilibrium-limited WGS
reaction by continually removing the product (H2) while reactants are retained on the retentate
side [38]. Among these types, Pd-based metal membranes and ceramic microporous membranes
are showing great potential for the intended applications.
Additionally, these membranes are expected to perform better at high temperature, which would
eliminate the need of gas cooling before purification. Costs for heat exchangers and drop in
energy efficiency would thus be avoided [18]. Main advantages and current limitations of both
Pd-based and microporous membranes are summarized in Table 4.
Table 4: advantages and limitations of Pd-based and microporous membranes [38]
Pd-based membranes Microporous membranes
Advantages
‐ Commercially available
‐ Generally good mechanical stability
‐ Very high selectivity for H2 (practically in
the order of 103)
- Chemically and thermally stable
- Higher flux than Pd-base membranes
- Better performance than Pd-based
membranes for WGS reaction
Current limitations
‐ Limited life span (months) for best
membranes because of cracking or pinhole
formation
‐ Pd alloys can undergo surface enrichment
from minor metal atoms
‐ Ultrathin, continuous Pd layers needed to
maximize H2 flux
‐ Complex reactor design needed to maximize
specific area
‐ High and unpredictable Pd prices
‐ Hydrothermal stability when applied in
vapor-containing gas streams (exposure to
humidity at T > 400°C causes rapid
densification)
‐ Selectivity generally lower than Pd-based
membranes
Page 25
Thermochemical biomass-to-hydrogen conversion
17
These membranes offer advantages such as high flux and high operating temperatures and, in
reactor applications, could lead to catalyst reductions, reduced equipment size, improved
temperature and pressure conditions and ultimately lower costs. Both membrane types have thus
great potential for H2 production and purification but ceramic membranes, especially silica or
silica functionalized, seem to take a lead on dense phase metal membranes thanks to their greater
ability to improve WGS equilibrium. Developments in ceramic membranes are however more
recent in comparison to dense phase metal.
When compared to PSA, ceramic membranes appear promising because cooling is not necessary
(especially interesting in hot gas applications, e.g. H2 production for refining purposes) and the
technology is potentially simpler [17]. Both types have already been applied in membrane
reactors showing promising results, but it must be stressed that despite the interesting results at
laboratory scale , no industrial application for large scale project was reported to date. Further
work is necessary to improve the technology, especially concerning scale up (i.e. efficient,
reliable manufacturing process) and stability of membranes.
Page 26
Jean-Florian Brau
18
Page 27
Methodology
19
3. Methodology
The first step of this work is to design and simulate the processes in order to obtain the necessary
input to the second step, which consists in the application of process integration tools to identify
integration opportunities and select relevant process configurations. Finally, evaluating and
comparing these configurations requires choosing adequate indicators; these are presented in the
final paragraph of this section.
Figure 7: system boundaries for performance evaluation. Left: refinery with current HPU; Right: refinery with
biomass-to-hydrogen concept
To match the production of the current HPU, two mandatory outputs are allocated to the
biorefinery concepts: 291.5 MW of hydrogen and at least 15.9 MW of HP steam, see Figure 7. As
explained in section 1.2, the focus is put on integration opportunities and options for electricity
generation, which excludes modifications in the refinery hydrogen and steam networks. System
boundaries for the evaluation of process performances are thus put around the hydrogen
production process.
3.1 Process simulation
In order to obtain the necessary input to process integration tools, i.e. mass and energy balances,
the investigated processes were simulated using ASPEN+. ASPEN+ is a comprehensive chemical
process modeling system that provides extensive databases of physical properties to be used in
Page 28
Jean-Florian Brau
20
various equations of states, as well as a number of built-in models of unit operations (e.g. pump,
distillation column, reactor) [39].
For gas-phase operations, the Peng-Robinson cubic equation of state with the Boston-Mathias
alpha function extension was used. To obtain more accurate results in operations involving only
water, steam data tables were used instead. When possible, models were validated against
relevant, available literature data. While the model of the indirect gasifier was the result of
internal work ([40], updated subsequently by S. Heyne and J.-F. Brau), the model of the direct
gasifier was largely built according to Hannula and Kurkela [41]. Some particular species
representing TAR in the simulation differ slightly between the two models. The impact on overall
mass and energy balances is negligible and results from both models form a consistent basis for
process comparison. The chemical species and their relative fractions chosen to represent TAR
content in syngas produced through indirect gasification were chosen according to Figure 5.
The following chemical species were accounted for in the simulations:
- Main species: H2, CO, CO2, H2O, CH4
- TAR:
‐ Indirect gasifier: toluene (C7H8), naphthalene (C10H8), phenol (C6H6O;
‐ Direct gasifier: acetylene (C2H2), ethylene (C2H4), ethane (C2H6), propane
(C3H8), benzene (C6H6)
- Sulfur , nitrogen and chlorine compounds: H2S, NH3 and HCl
Char was modeled as pure solid carbon.
All main modeling assumptions and parameters, together with relevant references, can be found
in Articles I and II. Pressure drops in all equipment were included in the simulations in order to
determine electricity demands for compression. Apart from hot gas cleaning and the membrane
reactor, for which no industrial scale numbers were found, unit operations were modeled based
on literature data and experimental or industrial values. When oxygen is needed in the biomass-
to-hydrogen concept, production in a cryogenic Air Separation Unit (ASU) is assumed. The ASU
was not modeled but an overall power demand for oxygen production was used to determine
consistent energy balances. It is assumed that 200 kWh of electricity are required for each ton of
pure oxygen produced at 25°C and atmospheric pressure [42]. Oxygen compression up to
operating pressures was then included in the model.
Hot gas cleaning essentially consists in chemical and physical adsorption of pollutants present in
the raw gas and was simulated as a black box since no heat demand or excess is expected to occur
in this section of the process. The adsorbent beds need regeneration and thus, the installation of
2-3 adsorption trains might be necessary to ensure continuous availability. This is important
when it comes to cost evaluation but is beyond the scope of the present study. More details on hot
gas cleaning strategies can be found in [36]. The membrane reactor was simulated by means of
two separate unit models available in ASPEN+. The WGS reaction was simulated via a
stoichiometric reactor and hydrogen separation was modelled as a separator block.
Page 29
Methodology
21
3.2 Process integration
Process integration was defined at an IEA expert meeting in 1993 as systematic and general
methods for designing integrated production systems, ranging from individual processes to total
sites, with special emphasis on the efficient use of energy and reducing environmental effects
[43]. In its broader sense, process integration covers material as well as thermal integration.
Material integration can be performed to e.g. minimize raw material consumption while thermal
integration focuses on energy usage and the minimization of external energy or fuel supply to the
process. The focus of this study is on thermal integration between hot and cold streams within the
biorefinery and between the biorefinery and the existing oil refinery.
Thermal integration is performed in this study by means of Pinch Analysis. This method was first
developed by Linnhoff et al. [44] and Umeda et al. [45]; several updated versions of the
Linnhoff's user guide on process integration are available, the latest being Ref. [46]. Pinch
Analysis was first developed in order to design new, or improve existing heat exchanger
networks but was subsequently applied to a number of other problems such as the integration of
new process units in existing plants or optimization studies [47]. Other examples where Pinch
Analysis has been used include the analyses of hydrogen and freshwater networks [48, 49].
According to Pinch Analysis, the minimum heating and cooling demands of a process can be
found by analyzing thermal streams in the process, i.e. streams that require heating (cold streams)
or cooling (hot streams). Pinch Analysis is therefore widely applied on industrial processes as a
targeting methodology. A common graphical representation of the thermal profile of a process is
the Grand Composite Curve (GCC) [50], see Figure 8.
Figure 8: Grand Composite Curve (GCC)
Page 30
Jean-Florian Brau
22
On a GCC, the process heat demand and availability versus the temperature level in the process is
represented. The minimum heating and cooling demands of the process can be read on the GCC,
as well as the potential for internal heat exchange in so-called “heat pockets”, i.e. parts of the
curve where a heat excess is located above a heat deficit. This means that heat available at a
given temperature level can be transferred to a lower temperature level, where a net deficit of
heat is located. To account for thermodynamic limitations in heat exchange (a temperature
difference is needed for heat to flow from a source to a sink) and different stream characteristics
(e.g. phase, phase change, composition), individual stream contributions to minimal temperature
differences are implemented in this work. The values used in this work are given in Table 5.
Table 5: individual contributions to minimal temperature differences used for Pinch Analysis in this work
Type of stream ΔTmin/2 (°C)
Gaseous process stream 15
Air 10
Water 5
Steam 2.5
More advanced integration opportunities can also be deduced from the GCC, such as the
integration of another process with the plant represented in the GCC. Such opportunities can be
quantified by means of a graphical approach, using the so-called split GCC.
Figure 9: split GCC representation. Black line: GCC of the background process; Blue dotted line: heat recovery
steam cycle
Figure 9 represents the split GCC of a fictitious process with an integrated heat recovery steam
cycle: the GCC of the heat recovery steam cycle is plotted against that of the process streams.
Page 31
Methodology
23
Accordingly, the maximum steam cycle net power generation is found when at least one pinch
point is activated between the steam cycle and the process. Similarly with any new system to be
integrated with the background process, the activation of these utility pinch point(s) allows
exploiting the maximum heat integration potential [51].
3.3 Process evaluation
In order to compare several processes, adequate criteria have to be chosen and clearly defined.
The most promising configurations are identified in this study by means of thermodynamic
criteria (energy and exergy efficiencies) as well as with an environmental criterion (fossil CO2
balance).
3.3.1 Performance indicators
The performances of the processes investigated in this study are quantified by means of two
thermodynamic performance indicators. The first indicator, energy efficiency ƞtot, is a measure of
the overall performance of the process according to the first law of thermodynamics. Energy
efficiency is the ratio between the energy contained in all useful outputs and the energy content
of all inputs. Energy efficiency is calculated according to Equation 9:
)(
)(
iii ii
ooo ootot
PQHHVm
PQHHVm
(9)
where process outputs and inputs are denoted by the subscripts o and i, respectively, m represent
mass flows, HHV higher heating values1, Q thermal energy flows and P electrical power.
Energy efficiency can be misleading for systems involving inputs and/or outputs of different
nature, such as steam, fuels and electricity. According to the second law of thermodynamics,
these indeed differ in energy quality, a feature that is not taken into account in energy efficiency
calculations where energy contained in steam is equivalent to energy contained in electricity. To
include differences in energy quality in efficiency calculations, exergy must be used instead of
energy. Exergy is defined as the potential for work generation of an energy commodity, i.e. steam
has much lower exergy content than electricity [52]. The exergy content of a stream is always
related to a reference state (also called dead state), that is the ambient conditions. The second
performance indicator used in this study is the exergy efficiency ƞex:
)(
)(
iCHi
PHii
netCHoo
PHoo
exeem
Peem
(10)
1 To facilitate comparison with other studies, energy efficiency is also calculated on a LHV basis; HHV values for
biomass and hydrogen are then replaced by LHV values in Equation 9.
Page 32
Jean-Florian Brau
24
where PHe and CHe represent the physical and chemical exergy. netP represents the exergy
content in the net electrical power balance of the process, which has the same value as its energy
content.
Although energy efficiency gives an easily understandable picture of a process, exergy efficiency
seems more relevant when dealing with multiple energy commodities of various energy quality,
as is the case in this study. Furthermore, exergy efficiency might also give a better idea of the
economic performance of the process than energy efficiency since energy commodities of high
exergy content often are more valuable than those with lower exergy content (e.g. electricity).
3.3.2 Fossil CO2 balance
In relation to the challenge of GHG emission mitigation, an environmental indicator is also
included in this study: the fossil CO2 balance ΔCO2. With this indicator, the difference in fossil
CO2 emissions from the refinery following the implementation of the biomass-based process is
evaluated. Biomass is considered to be 100% CO2-neutral and the current refinery operating the
fossil-based HPU is chosen to set the reference for CO2 emissions. Therefore, any negative value
for ΔCO2 means that the studied configuration has the potential to reduce fossil CO2 emissions.
ΔCO2 is calculated according to Equation 11.
fgfgCCel
netel meme
PeCO 442
(11)
where e represents specific CO2 emissions associated with natural gas consumption for electricity
production (subscript el), butane and fuel gas consumption (subscripts C4 and fg, respectively);
Pnet is the net electricity balance of the biomass-to-hydrogen process; ƞel is the efficiency of the
marginal electricity producer; m represents the avoided mass flows of butane and fuel gas.
When calculating the fossil CO2 balance, systems where inputs and/or outputs are impacted by
the implementation of the biorefinery are taken into account. More specifically, it is assumed that
if HP steam is exported from the biomass-to-hydrogen process, the use of refinery fuel gas-fired
boilers is decreased by the corresponding load. Also, the impact of the electricity balance of the
biomass-to-hydrogen process is included by calculating a change in CO2 emissions at the
marginal electricity producer. In such calculations, the choice of marginal electricity producer is
therefore of great importance since different electricity production technologies have different
specific CO2 emissions associated with power production. In this study, two marginal electricity
producers are considered: natural gas combined cycle (NGCC) and coal power plant. These were
chosen to represent two widespread electricity generation alternatives in Europe [53].
Consequences of future technology changes in marginal power production, e.g. deployment of
Carbon Capture and Storage (CCS), are discussed further in this thesis. The parameters used to
calculate ΔCO2 are listed in Table 6 [54].
Page 33
Methodology
25
Table 6: parameters used in calculations of fossil CO2 balances [54]
Marginal electricity producer
Efficiency ƞel Specific emissions eel (kg CO2/GJfuel)
NGCC 0.6 57
Coal power plant 0.45 92
Fuel specific CO2 emissions e (kg CO2/ kgfuel)
Fuel gas efg 1.99
Butane eC4 3.03
In the configuration where excess fuel gas from the refinery is used for power generation in a gas
turbine, the efficiency of the combined cycle is set to 55%. In that case the system boundaries are
extended to include this gas turbine, with fuel gas as an input and electricity as an output.
It should be noted that, as opposed to cases where all or part of the automotive fuels produced in
the refinery are replaced by biofuels (e.g. Fischer-Tropsch diesel or DME), only hydrogen atoms
are ultimately replaced in this work. Combustion emissions of fossil CO2 from these fuels thus
remain unchanged and are not included in the calculation of ΔCO2. This is further discussed in
section 4.5.
Page 34
Jean-Florian Brau
26
Page 35
Results
27
4. Results
Results obtained in the project are summarized in this section. The designs of two biomass-to-
hydrogen process concepts are presented first. These serve as a base for the whole study. The
configurations selected for detailed investigation and the way these were designed, especially
using process integration approaches, are presented afterwards. Values of the performance
indicators introduced in Section 3.3 are finally discussed and solutions compared.
4.1 Process design
To achieve the conversion of biomass into hydrogen, building blocks presented in Section 2 were
combined according to two different design approaches: one based on indirect heat transfer
between a combustion zone and a gasifier zone and well-known technologies, the second
involving direct heating via combustion in oxygen and emerging technologies. Both designs are
scaled to replace the current refinery HPU, i.e. for a hydrogen production of 7.4 t/h. As
mentioned in section 2.1, air drying is used in both concepts. Final hydrogen compression to 27
bars is also common to both concepts for injection in the refinery hydrogen distribution network.
4.1.1 Indirect Gasification concept
The first process concept, based on atmospheric, indirect steam-blown gasification and here
referred to as the IG concept, is presented in Figure 10. For the upgrading and separation
sections, this process relies on technologies that are proven industrially with syngas produced
from fossil fuels.
The dried biomass is gasified in an atmospheric, indirect steam-blown gasifier at 850°C. Since
compression is needed prior to downstream syngas upgrading, wet gas cleaning is chosen in this
concept. The syngas leaving the gasifier is cooled, passed through a filter for particle removal and
scrubbed with water to remove TAR and sulfur compounds. The cleaned syngas is then
compressed to 15 bars prior to the SMR reactor which is followed by dual CO-shift at 22 bars.
Hydrogen is finally separated from the remaining gases via PSA, where it is produced at a
pressure of 21 bars.
Page 36
Jean-Florian Brau
28
Figure 10: flowsheet of the IG concept
As a result of process simulation, a hydrogen yield of 0.1 ton of H2 per ton of dry biomass was
obtained for the IG concept. This corresponds to a conversion efficiency of biomass to hydrogen
of 67% on HHV basis (64% on LHV basis)2. The total process steam demand amounts to 11.6
ton of steam per ton of H2 and the power requirement is 22 MWel.
4.1.2 Direct Gasification concept
As shown in Figure 10, the IG concept consists of several conversion steps which not only
implies a rather large number of units, but also that a large amount of heat shall be transferred
between thermal streams. Indirect gasification and SMR also imply indirect heat transfer and
therefore, technical complexity and possible thermal losses. Finally, wet gas cooling means that if
heat is not recovered in appropriate ways, all sensible high temperature heat in the syngas is lost.
Figure 11: flowsheet of the DG concept
Following a different approach, a second biomass-to-hydrogen concept was designed as shown in
Figure 11. This process - further on referred to as the DG concept - is based on direct, pressurized
oxygen/steam-blown biomass gasification. Pressurized gasification eliminates the need of
downstream syngas compression and therefore cooling can be avoided. To avoid loss of high
temperature sensible heat, hot gas cleaning is implemented in this concept. SMR is replaced by
2 HHVH2 = 141.8 MJ/kg; LHVH2 = 120 MJ/kg.
HHVbiomass = 20.96 MJ/kg (dry basis); LHVbiomass,50% moisture = 9.26 MJ/kg ; LHVbiomass,10% moisture = 18.6 MJ/kg.
Page 37
Results
29
ATR, operated at 1000°C with pure oxygen injection. The final step of the DG concept is a
membrane reactor where the remaining WGS reaction takes place on the catalyst surface and
hydrogen is separated from the offgas. The DG and IG concepts are thus based on very different
technologies.
As a result of process simulation, a hydrogen yield of 0.087 ton of H2 per ton of dry biomass was
obtained for the DG concept. This is lower than the yield in the IG concept and corresponds to a
biomass to hydrogen conversion efficiency of 65% on HHV basis (63% on LHV basis). The total
process steam demand amounts to 5.4 ton of steam per ton of H2, which is less than half the
demand in the IG concept. The total oxygen demand (to gasification and ATR) is 6.7 ton per ton
of H2 while the electricity consumption for the entire concept is 35.1 MWel, including power
demand for the ASU.
Compared to the IG concept, the DG concept eliminates the need for indirect heat transfer in the
gasifier and the reforming step thanks to in-situ combustion of part of the biomass and the
syngas, respectively. This represents potential efficiency increases from reduced heat losses.
Furthermore, the implementation of the membrane reactor is a step forward in terms of process
intensification since two unit operations are performed in a single vessel. The drawback of these
apparent advances is the need for pure oxygen injection into the gasifier and the ATR. This
means that an oxygen production plant is required in the concept, which leads to an increase in
electricity demand.
4.2 Process integration
As mentioned earlier in this thesis, the focus of this study is put on opportunities for energy
integration. Material integration aspects are here essentially limited to the substitution of
hydrogen supply, from a fossil fuel-based route to a biomass-based process. Heat integration
opportunities, both within the biorefinery concepts and with the oil refinery, were studied by
means of pinch analysis graphical tools such as GCCs and Split GCCs.
Integration opportunities are presented in the following section. Once options for heat integration
are identified, several relevant system configurations can be determined which are discussed in
more detail in section 4.2.2. The main differences between these configurations are the nature and
potential amount of additional products such as electricity and steam.
4.2.1 Integration opportunities
As a result of the simulations, data on temperatures and heat loads of the various heating and
cooling processes of the biomass conversion plants were obtained and were used to study
theoretical heat recovery opportunities with the help of Pinch Analysis. To match the current
production in the refinery HPU and to meet steam requirements in the refinery, additional thermal
streams representing the production of 15.9 MW of HP steam were added to those of the bioH2
Page 38
Jean-Florian Brau
30
plant. The details about all thermal streams are summarized in Article II along with the
composition of key process streams.
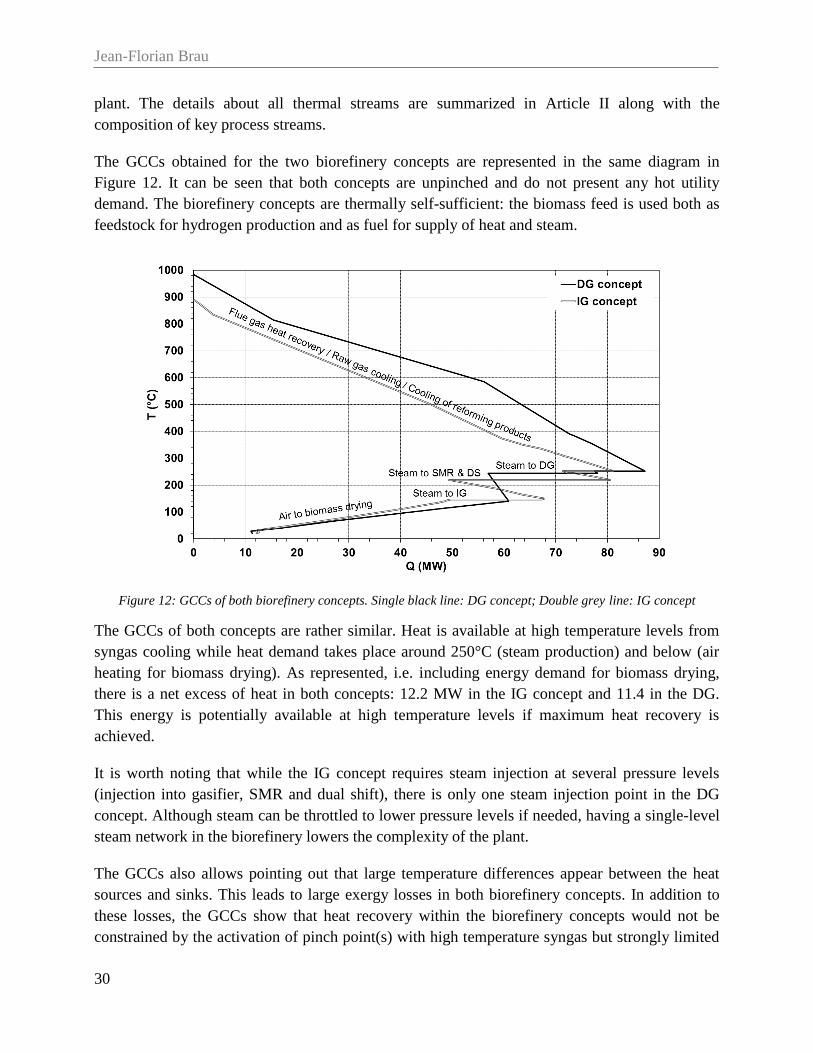
The GCCs obtained for the two biorefinery concepts are represented in the same diagram in
Figure 12. It can be seen that both concepts are unpinched and do not present any hot utility
demand. The biorefinery concepts are thermally self-sufficient: the biomass feed is used both as
feedstock for hydrogen production and as fuel for supply of heat and steam.
Figure 12: GCCs of both biorefinery concepts. Single black line: DG concept; Double grey line: IG concept
The GCCs of both concepts are rather similar. Heat is available at high temperature levels from
syngas cooling while heat demand takes place around 250°C (steam production) and below (air
heating for biomass drying). As represented, i.e. including energy demand for biomass drying,
there is a net excess of heat in both concepts: 12.2 MW in the IG concept and 11.4 in the DG.
This energy is potentially available at high temperature levels if maximum heat recovery is
achieved.
It is worth noting that while the IG concept requires steam injection at several pressure levels
(injection into gasifier, SMR and dual shift), there is only one steam injection point in the DG
concept. Although steam can be throttled to lower pressure levels if needed, having a single-level
steam network in the biorefinery lowers the complexity of the plant.
The GCCs also allows pointing out that large temperature differences appear between the heat
sources and sinks. This leads to large exergy losses in both biorefinery concepts. In addition to
these losses, the GCCs show that heat recovery within the biorefinery concepts would not be
constrained by the activation of pinch point(s) with high temperature syngas but strongly limited
Page 39
Results
31
by the low temperature energy demand for biomass drying. It would therefore be greatly
beneficial to eliminate this energy demand in order to release more high temperature heat from
the biorefinery concepts, which could be used for steam export or electricity production. The
resulting GCCs of both concepts are shown in Figure 13.
Figure 13: GCCs of the biorefinery concepts without biomass drying; Single black line: DG concept; Double grey
line: IG concept
Figure 13 was obtained by removing the stream corresponding to the energy demand for biomass
drying from the data set used to build the GCCs. More high temperature heat is now available
from the biorefinery concepts since the constraint of low temperature energy demand was
removed. The DG concept appears to have an advantage compared to the IG concept in terms of
potential for heat recovery since the absence of energy demand for steam production at 150°C
and 210°C seems to allow recovering more heat from the biorefinery process for useful
applications.
Two alternative ways of taking advantage of the high temperature heat available in the
biorefinery process are considered in this work: export of HP steam to the refinery and electricity
generation by means of a heat recovery steam cycle. Steam demand in the refinery is partly
satisfied through heat recovery steam generation in various units, but the operation of fuel gas-
fired boilers is required to satisfy the HP steam demand. Producing HP steam in the biomass-to-
hydrogen concepts would allow a net export to the refinery and thus, offloading these furnaces.
Ultimately, this would result in fuel gas savings and a reduction of fossil CO2 emissions.
On the other hand, the implementation of a heat recovery steam cycle allows generating
electricity, which has a higher energy quality than HP steam. This electricity can be consumed
on-site in the biomass-to-hydrogen process or in the refinery, or can be sent to the grid if a net
Page 40
Jean-Florian Brau
32
excess is created. Thanks to the release of high temperature heat, the export of HP steam and/or
electricity is enabled in the biomass-to-hydrogen concepts. This in turn translates into increased
overall efficiencies as a greater part of the energy fed to the system is converted in useful
products.
Although eliminating the energy demand for biomass drying from the biorefinery concepts is
appealing, the need for drying remains. This energy demand is thus shifted from within the
biorefinery process to outside the system. Beyond the creation of a more sustainable hydrogen
supply, the major advantages of heat integrating the biorefinery concepts with the refinery appear
in this context, as shown below.
Results of a complete pinch analysis of the refinery [55] allowed plotting a temperature profile of
excess heat available at the refinery, see Figure 14. This excess heat originates from refinery hot
streams that are currently not recovered but cooled by means of water or air. It is thus, literally,
waste heat. Excess heat is available at temperatures up to 475°C, but as much as 91% of the total
amount is available below 150°C.
Figure 14: available refinery excess heat
Although emerging applications such as low temperature electricity generation through Organic
Rankine Cycles (ORC) can be envisioned below 150°C [56], this low temperature level limits the
options for relevant utilization of this excess heat in relation to the biorefinery concepts. Low-
temperature air drying of biomass was already identified as a promising option for the use of low
temperature industrial waste heat [26].
This latter alternative was confirmed as an option of high interest in this project since it allows
releasing high temperature energy within the biomass-to-hydrogen process. Regarding the
Page 41
Results
33
specific biorefinery concepts and refinery included in this study, the temperature level and the
amount of available refinery excess heat make it possible to cover the entire energy demand for
drying in both biomass-to-hydrogen concepts.
4.2.2 Selected configurations
For each concept four system configurations were investigated in this work, corresponding to a
frozen setup of the biomass to hydrogen concepts but different integration options with the
refinery, as shown in Table 7.
Table 7: description of selected configurations: W – wet biomass input, D – dry input, HP - HP steam production, E
- electricity production, FG - use of refinery fuel gas excess.
Configuration Biomass feed Products Use of fuel gas excess
W Wet (50% moisture) H2, HP steam
No DHP
Dry (10% moisture)
H2, HP steam
DE H2, electricity
DFG H2, HP steam Yes
In Configuration W, wet biomass is fed to the process; therefore air drying is included and
performed with excess heat from the biomass-to-hydrogen concept. In all other configurations,
dry biomass is fed to the process. This allows investigating the impact of moisture content in the
feed on system performances and, since biomass drying can be performed with refinery excess
heat, highlighting the potential interest of locating the biomass-to-hydrogen concept within the oil
refinery. Excess heat from the biomass-to-hydrogen concepts is recovered to produce either HP
steam in configurations W, DHP and DFG or electricity through a steam cycle in configuration
DE.
When HP steam is exported from the biorefinery to the refinery, the boilers are offloaded and
thus, an excess of refinery fuel gas is created [57]. However, this fuel gas supply originates from
crude oil refining operations and cannot be discontinued. A fourth configuration was therefore
included in this work, where the excess of refinery fuel gas is used in a combined cycle to
generate electricity (configuration DFG).
4.3 Process performances
Energy balances were determined for each configuration and are presented in Table 8. In all
configurations, the hydrogen production amounts to 291.5 MW (HHV basis). The biomass input
to the IG concept is 433 MW (HHV basis). Due to the lower hydrogen yield, the biomass feed to
the DG concept is 442 MW (HHV basis). In all configurations, 15.9 MW of HP steam are also
produced to match the production of the current HPU. The HP steam production listed in Table 8
corresponds to additional steam export from heat recovery.
Page 42
Jean-Florian Brau
34
Table 8: energy balances for the selected configurations
Configuration
HP steam (MW)
(+ 15.9 MW in all cases)
Electricity balance (MW)
(production – demand = net)
IG concept DG concept IG concept DG concept
W 12.2 11.3 0-22 = -22 0-35.1 = -35.1
DHP 49.4 62.5 0-22 = -22 0-35.1 = -35.1
DE 0 0 21.8-22 = -0.2 24.8-35.1 = -10.4
DFG 49.4 62.5 51.1-22 = 29.1 51.1-35.1 = 16
If wet biomass is fed to the systems (Configuration W), a small amount of excess heat is
available from the biorefinery; 12.2 and 11.3 MW of HP steam can be exported to the refinery
from the IG and the DG concept, respectively. Both concepts are in deficit of electricity but
oxygen production in the cryogenic ASU leads to a high power demand in the DG concept: 35.1
MW against 22 MW for the IG concept, i.e. 60 % higher consumption.
The interest of allowing heat integration between the biorefinery and the refinery is visible when
comparing Configuration W to all other configurations, where biomass is dried with refinery
excess heat. The released high temperature excess heat from the biorefinery allows exporting
49.4 MW and 62.5 MW of HP steam in the IG and DG concept, respectively (config. DHP).
Alternatively, this excess heat can be recovered through an integrated steam cycle (config. DE).
This allows generating 21.8 MW and 24.8 MW of electricity in the IG and DG concept,
respectively. The IG concept is then energy self-sufficient without supplementary fuel
requirement. A power deficit of 10.4 MW remains in the DG concept.
In Configuration DFG, the excess of refinery fuel gas created by the export of HP steam from the
biorefinery is used to generate electricity in a gas turbine combined cycle. Other potential
utilizations of the fuel gas are discussed in section 7.2. The amount of excess fuel gas being the
same regardless of which concept is implemented, 51.1 MW of electricity can be produced in the
two cases. This allows both concepts to become net electricity producers, with a net electricity
surplus of 29.1 MW in the IG concept and 16 MW in the DG concept. These numbers amount to
65% and 36% of the refinery’s total electricity import, respectively. This configuration thus
appears very interesting since it would allow an important reduction of power purchase from the
grid.
Table 8 shows that heat integration between the biorefinery and the refinery enables the
production of HP steam and/or electricity in addition to hydrogen from the same amount of
biomass. It also shows that for the same hydrogen output, the DG concept can produce more HP
steam or electricity than the IG concept. These results are however not sufficient to evaluate the
processes since the DG concept has both higher biomass and electricity demands. Here,
Page 43
Results
35
performance indicators such as energy and exergy efficiencies can be advantageously used in
order to compare the configurations on a consistent basis.
Energy and exergy efficiencies were calculated for each configuration and are presented in Table
9. Energy efficiency is presented and discussed on HHV basis; results on LHV basis are shown in
Table 11 in the Appendix. In the following, results from the two indicators are first commented
separately. A discussion and comparison including both indicators is presented.
Table 9: performance indicators results
Configuration Energy efficiency (%) Exergy efficiency (%)
IG concept DG concept IG concept DG concept
W 70 67 57 51
DHP 78 78 61 57
DE 72 70 66 56
DFG 75 74 53 51
Looking at the configurations from W to DFG, energy efficiency results follow the same trend
for both concepts, see Figure 15. Grey bars represent results for the IG concept while black bars
those for the DG concept. Feeding wet biomass to the process and using biorefinery excess heat
for drying (config. W) yields the lowest efficiencies in both concepts.
Figure 15: energy efficiency plot for both concepts. Grey bars: IG concept; Black bars: DG concept
Drying biomass with refinery excess heat and exporting HP steam with high temperature
biorefinery excess heat yields an increase of 8 and 11 percentage points in energy efficiency for
the IG and DG concept, respectively. The higher potential for HP steam export observed in Table
8 for the DG concept allows this greater efficiency improvement; the amount of exported HP
steam is sufficient to offset the higher electricity deficit and the same efficiency as the IG concept
Page 44
Jean-Florian Brau
36
is obtained. HP steam export (config. DHP) appears as the most efficient configuration, with an
energy efficiency of 78% for the two concepts.
Alternatively, recovering this excess heat by means of a steam cycle for electricity production
(config. DE) yields energy efficiencies of 72% and 70% for the IG and DG concept respectively.
Since energy efficiency puts the same value on 1 MW of HP steam and 1 MW of electricity, HP
steam export appears more efficient than electricity generation because of the higher amount of
energy that can be recovered. Therefore, although the IG concept becomes energy self-sufficient
with the integration of a heat recovery steam cycle, the energy efficiency remains lower than the
value obtained in Configuration DHP.
Finally, the use of excess refinery fuel gas for electricity production (config. DFG) yields energy
efficiencies of 75% and 74% for the IG and DG concept, respectively. This configuration appears
thus interesting since it makes efficient use of all available resources: the energy efficiencies
obtained are the second best of all configurations.
According to exergy efficiency, the selected configurations are ranked differently, see Figure 16.
The performances of Configuration W appear rather low, with 57% exergy efficiency for the IG
concept and 51% for the DG concept. The higher electricity deficit of the DG concept puts a
greater penalty on its performances with exergy efficiency as an indicator because of the high
exergy content of electricity.
Figure 16: exergy efficiency plot for both concepts. Grey bars: IG concept; Black bars: DG concept
The heat integration opportunities identified in section 4.2.1 also yield efficiency improvements
from Configuration W to DHP and DE. The methodology used thus seems relevant to identify
and reduce exergy losses in the biorefinery concepts. The highest efficiencies now appear when
electricity is produced through the heat recovery steam cycle (config. DE). This is clear with the
IG concept, which has an exergy efficiency of 61% with HP steam export (config. DHP) and
Page 45
Results
37
66% with electricity production (config. DE). In the case of the DG concept, the higher potential
for HP steam export is sufficient to offset the lower exergy content of steam and both
configurations yield close exergy efficiencies: 57% with HP steam export and 56% with power
generation.
The two performance indicators used in this work give different pictures of the system
configurations. According to energy efficiency, export of HP steam to the refinery is the most
efficient way to recover high temperature excess heat from the biorefinery concept (config.
DHP). On the other hand, since electricity has much higher exergy content than steam, exergy
efficiency favors the configuration where electricity is produced by means of a heat recovery
steam cycle (config. DE).
Beyond this different result with the two performance indicators, a stronger conclusion can be
made regarding the two biomass-to-hydrogen concepts. Indeed, it appears that the IG concept
consistently outperforms the DG concept, in every configuration and according to both
indicators. The main factors that explain the poorer performance of the DG concept are the higher
electricity consumption of the ASU and oxygen compression as well as the lower biomass-to-
hydrogen yield. Thermal integration of the ASU with the biorefinery represents an important area
for process improvement since increased integration leads to a reduced power demand.
4.4 Fossil CO2 balance
The environmental performance of the biorefinery concepts was evaluated by means of the fossil
CO2 balance. Results are shown in Figure 17 and Figure 18 with Coal and NGCC as marginal
electricity producer, respectively3. Grey bars represent results for the IG concept while black bars
those for the DG concept.
Figure 17 shows that, with coal power plants as marginal electricity producer, the IG concept
appears to have higher emission reduction potentials than the DG concept in all configurations.
This can be explained by the higher electricity deficit found in the DG concept, which has a
negative impact on the fossil CO2 balance since it implies increased power generation from the
marginal producer.
3 To facilitate comparison with other biomass conversion pathways, the specific CO2 balance (t CO2/t dry biomass) is
given in Table 12 in the Appendix.
Page 46
Jean-Florian Brau
38
Figure 17: fossil CO2 balance with coal as marginal electricity producer. Grey bars: IG concept; Black bars: DG
concept
The selected configurations are ranked in the same way for both concepts. The integration
options chosen to design these configurations seem therefore robust since they lead to
comparable benefits for both biomass-to-hydrogen concepts. According to ΔCO2, the
configuration where biomass is dried with excess heat from the biorefinery performs worst
(config. W). This result is not surprising since in the other configurations, heat recovery allows
producing HP steam and/or electricity and thus avoiding fossil fuel utilization. Without
considering refinery fuel gas utilization, the best configuration appears to be the drying of
biomass with refinery excess heat and the implementation of a heat recovery steam cycle for
electricity production in the biorefinery (config. DE).
With coal as marginal electricity producer, the use of refinery fuel gas for electricity generation
clearly appears of high interest (config. DFG) in terms of emission abatement. Given the much
lower CO2 emissions of refinery fuel gas compared to coal and the net electricity export created,
this configuration yields the highest potentials for reduction of CO2 emissions.
Observations from Figure 18 are slightly different from those drawn from the previous graph.
With NGCC as marginal electricity producer, results for the selected configurations are within a
narrower range: ΔCO2 is found between -522 kt/y and -630 kt/y while extreme values were -469
kt/y and -690 kt/y with coal as marginal producer. Larger CO2 emissions of the marginal power
production technology lead to a greater impact on the CO2 balance when the net electricity
balance of the studied system is changed.
Page 47
Results
39
Figure 18: fossil CO2 balance with NGCC as marginal electricity producer. Grey bars: IG concept; Black bars: DG
concept
Since fossil CO2 emissions from refinery fuel gas are close to those of natural gas, the difference
between using either of these to produce electricity is small, as can be seen in Figure 18
(configurations DHP and DFG). Although excess heat from the biomass-to-hydrogen concept is
used to produce HP steam in these two configurations, the best concept is not the same in both
cases:
- in the configuration where electricity is imported from the grid (config. DHP), the DG
concept has an advantage over the IG concept since more steam can be produced. With
NGCC as marginal electricity producer, this is enough to offset the negative impact of the
higher electricity deficit;
- in the configuration where refinery fuel gas is used to produce electricity (config. DFG),
the IG concept performs best. Because of the lower electricity deficit, the net electrical
power that can be exported to the grid is higher than in the DG concept, which leads to a
higher potential for emission reduction.
While the configuration with the lowest potential for emission reduction remains the same as in
Figure 17, i.e. biomass drying carried out with excess heat from the biorefinery; the best
configuration does not appear as clearly. Indeed, both configurations discussed previously (DHP
and DFG) yield very close ΔCO2 values.
Results from Figure 17 and Figure 18 show that marginal electricity production technologies
have an impact on the calculated environmental performance of biorefineries that should not be
neglected. With both marginal electricity producers included in this work, configuration DFG
appears the most promising. However, if for any reason such as technical constraints, backup
considerations or economic issues, refinery fuel gas cannot be diverted from boilers, this
Page 48
Jean-Florian Brau
40
conclusion does not apply. The most promising configuration becomes then a function of the
marginal electricity producer.
In a context where more carbon lean power generation technologies (such as NGCC in this work)
are envisioned in the European energy system, it appears from the results above that a
polygeneration concept producing hydrogen and HP steam in order to offload refinery boilers is
the most promising configuration. This is true even though all electricity demand in the biomass-
to-hydrogen concepts must be imported from the grid.
4.5 Relevance and final choice of indicators
Three indicators are used in this study, two of them to evaluate the thermodynamic performance
of the biorefinery configurations and the third to assess the environmental impact of the proposed
solutions. Using several indicators gives more information on the studied systems and allows
identifying influent factors. However, there is a drawback to having several indicators: it can
decrease the intelligibility of results, i.e. make them harder to comprehend for the reader. This
multiplication also raises a question: what is the most relevant indicator? This is even more
important when the selected indicators give different results, as is the case in this work with
energy and exergy efficiency. Which one to select to draw the final conclusions?
On a general level, it is my opinion that a researcher should eventually state a clear conclusion
that goes beyond writing “the results depend on a number of factors”. In a work of research, very
few – if any – conclusions are definitive: they all depend on the achieved work and its scope.
However, whatever their limitations and shortcomings, there should be clear conclusions at the
end of a study. This is all the more important if a research project is meant to help the general
public to gain a better understanding of the subject, let alone if the target audience is decision
makers.
Energy and exergy efficiency are both used to evaluate thermodynamic performances. A choice
should thus be made between these two indicators, especially since another biorefinery
configuration appears best according to each of them. Energy efficiency gives equal value to all
material and energy flows, regardless of their nature. Exergy efficiency intrinsically takes into
account differences in nature by introducing the concept of “energy quality”. This indicator thus
seems much more relevant in cases where energy commodities of different energy quality
coexist. With biomass, hydrogen, steam and electricity flows involved in the processes studied in
this thesis, exergy efficiency appears to be the indicator of choice. Favoring the best
configuration in terms of exergy efficiency makes sure that the energy input is converted with
minimal loss of energy quality. However, exergy efficiency does not give information on the
environmental impact of a process. It must therefore be used together with another indicator for
this purpose, such as the fossil CO2 balance in this work. Similarly, an indicator of the economy
of the process should be added for final decision.
Page 49
Results
41
Accordingly, the best configuration among those considered in this work can be selected by
plotting the potential for reduction of fossil CO2 emissions versus the exergy efficiency, see
Figure 19 (coal as marginal electricity producer) and Figure 20 (natural gas combined cycle as
marginal electricity producer). On these figures, grey markers represent configurations of the IG
concept while black markers represent those of the DG concept.
Figure 19: potential for emission reduction versus exergy efficiency, Coal as marginal electricity producer. Grey
markers: IG concept; Black markers: DG concept
On Figure 19 and Figure 20, the most promising system configurations are linked by a red dotted
line. These are configurations with either the highest exergy efficiency or the highest potential for
emission reduction. Accordingly, the further from this line the other points are, the worse are the
performances of the associated configurations.
As highlighted earlier, configuration W is the worst performing of all for both concepts. The
better performance of the IG concept appears again on Figure 19 since configurations DE and
DFG of this concept are located directly on the red dotted line. Configuration DFG of the DG
concept is the closest point not located on this line, i.e. the performances of this configuration are
the closest to that of configurations DE and DFG of the IG concept.
If the marginal electricity producer is changed from coal to natural gas combined cycle, Figure 20
is obtained. Three of four configurations of the IG concept are especially well performing while
configuration DHP is the only one of the DG concept located on the red dotted line. The distance
between other configurations and this line is shorter than with coal as marginal electricity
Page 50
Jean-Florian Brau
42
producer, which shows again the impact of the marginal electricity producer on the relative
performances of the different system configurations.
Figure 20: potential for emission reduction versus exergy efficiency, Natural gas combined cycle as marginal
electricity producer. Grey markers: IG concept; Black markers: DG concept
These figures confirm that the IG concept outperforms the DG concept. Additionally, comparing
the two figures leads to interesting conclusions. From Figure 19 to Figure 20, fossil CO2
emissions from the marginal electricity producer are decreased. In the range of marginal
electricity producers included here, configurations DE and DFG of the IG concept appear as the
most robust since they are twice located on the red dotted line. For both concepts, the location of
configuration DHP is shifted and is on the line on Figure 20. It is likely that this trend can be
extrapolated to less emitting marginal electricity producers, where configuration DHP would shift
further down on the graphs and define the red dotted line. Drying biomass with refinery excess
heat and exporting HP steam from the biorefinery therefore appears as a promising configuration
in the context of a future, more emission-lean European energy system.
Page 51
Discussion
43
5. Discussion
5.1 Future use of biomass
In this study, biomass is used to produce hydrogen for refining purposes. In a longer term
perspective, some general questions concerning biomass as a feedstock can arise. Biomass has
the advantage of being a very versatile resource since it allows the production of many chemicals,
materials and energy commodities. As its use becomes more widespread, users will compete for
this resource and it is essential that the most sustainable conversion pathway(s) are promoted.
The number of products and processes involved is another argument in favor of the use of exergy
efficiency in order to keep track of the most resource efficient routes.
The case study refinery is located in Europe, where sales of hybrid vehicles (vehicles combining
an internal combustion engine with one or several electrical motors) are steadily increasing since
2004 [58]. If this trend confirms or if a massive switch to 100%-electrical cars takes place, the
market for automotive fuels will shrink dramatically (although not disappear). In such a situation,
the production of refining hydrogen or of any automotive fuel does not seem an interesting
pathway for biomass conversion while combustion (or co-combustion with coal) for electricity
production appears as a more suitable use.
In the near future however, it is likely that the demand for fossil automotive fuels (i.e. gasoline,
diesel) will continue to rise and, as a consequence, so will hydrogen requirements in refineries. In
developing countries such as China or India, car sales are growing at a fast rate and, in developed
countries, traditional combustion engine cars still represent the large majority of new license
numbers. Despite the clear upward trend, hybrid vehicles represented an average of less than 1%
of the sales in the EU-27 in 2010 although their fraction peaked to 3-4% in the Netherlands.
Several renewable-based automotive fuels, e.g. those produced through upgrading of bio-oils,
also require more hydrogen than their crude oil-based counterparts [59]. If the market for these
fuels increases, hydrogen will remain an essential part of the production chain.
Page 52
Jean-Florian Brau
44
5.2 Keeping track of the “green”
As mentioned in Section 3.3.2, CO2 emitted during combustion of the fuels (occurring in car
engines) produced at the refinery are not included in the calculation of ΔCO2. Indeed, only
hydrogen atoms are replaced in these fuels: the fossil CO2 emissions occurring during
combustion in car engines remain unchanged. Only on-site fossil CO2 emissions are impacted by
the implementation of the biorefinery. This is very different from cases where renewable
automotive fuels are produced, e.g. Fischer-Tropsch fuels, ethanol or tall oil diesel. In these
cases, fossil fuels are replaced by “green” fuels in engines and combustion emissions of fossil
CO2 are avoided.
The location were fossil CO2 emissions are avoided constitutes a major difference between the
production of hydrogen and automotive fuels from biomass. Considering only this parameter,
these products are thus likely to be eligible for different kinds of subsidies.
On the other hand, it can be argued that automotive fuels produced in a refinery using biogenic
hydrogen also are “green” since, even if the carbon dioxide released during their combustion is
100% fossil, they contain hydrogen atoms originating from renewable feedstock. Similarly, if life
cycle fossil CO2 emissions is the parameter taken into account, should there be a difference
between fuels (or blends) containing biogenic carbon and those containing biogenic hydrogen?
One can imagine that, if its life cycle specific fossil CO2 emissions are lower than those of a
traditional fossil fuel, a fuel could be marketed as “green” and therefore be eligible for the same
type of subsidies as other bio-fuels.
This however requires more advanced accountings of the renewable share of automotive fuels
produced with biomass-based H2 than in the case the whole fuel is based on renewable feedstock,
which represents a barrier for both policy makers and the final customer market. Similar issues
appear however in the petrochemical sector where large scale productions of chemical
intermediates cannot entirely rely on renewable feedstock. There are therefore evidences that a
transition towards more sustainable production of conventional fuels and chemicals relies upon
more advanced policy instruments and renewable certifications than those currently available.
5.3 Relevance of the case study
This project is based on a case study and the quantitative results presented in this thesis are
therefore very specific to the plant considered for the calculations.
However, the studied refinery ranks among Europe’s largest and most complex plants. The
structure of these refineries is very similar; especially, most of them operate dedicated HPUs and
use byproduct fuel gas in boilers to produce HP steam. This means that the trends identified from
the results and the conclusions of this project can most likely be generalized to other refineries of
the same type.
Page 53
Discussion
45
The implementation of large-scale gasification-based biorefineries of the type discussed in this
thesis is likely to take place in the medium-term future. The economies of scale and the versatility
of the large, complex refineries have allowed them to adapt to feedstock and market changes for a
long time. These characteristics will most likely allow these plants to remain in operation for
several more decades, which makes this case study relevant in terms of time perspective.
Additionally, this type of refineries appears as a relevant candidate for the implementation of
large scale gasification-based biorefineries.
Page 54
Jean-Florian Brau
46
Page 55
Conclusions
47
6. Conclusions
The results presented in this work highlighted the importance of including integration aspects in
the design phase to build efficient biomass-to-hydrogen concepts and select sound heat recovery
options. Two process concepts were designed, following two approaches. The IG concept, based
on indirect, atmospheric steam gasification, relies on well-proven unit operations for gas cleaning
and upgrading. On the other hand, the DG concept is based on pressurized, direct gasification and
involves emerging technologies such as a membrane reactor. This technology puts together
chemical reactions and hydrogen separation and represents a step forward in terms of process
intensification.
Both biomass-to-hydrogen concepts were found to be self-sufficient in terms of heat and steam
but in deficit of electricity; this deficit being highest in the DG concept. A higher biomass-to-
hydrogen yield was found in the IG concept, but this process also requires twice as much steam
as the DG concept. In both concepts, large exergy losses were identified between high
temperature heat sources and low temperature heat sinks.
Heat integration opportunities were identified and proved to increase both energy and exergy
efficiencies of the selected configurations. Especially, the integration of low-temperature biomass
drying with refinery excess heat appears to be of high interest since it allows releasing high
temperature excess heat in the biorefinery. Taking advantage of this opportunity, several
configurations could then be designed, where this high quality energy is recovered in the form of
either HP steam or electricity. Although the DG concept allows for larger HP steam and
electricity production, it was found to be consistently outperformed by the IG concept according
to energy and exergy efficiency.
The environmental impact of biomass-based hydrogen production through the designed concepts
was evaluated by calculating a fossil CO2 balance after their implementation. It was found that all
selected configurations led to potential reductions of fossil CO2 emissions. Because of the
electricity deficit of both concepts, the reduction potential was found higher with natural gas
combined cycle as marginal electricity producer.
Page 56
Jean-Florian Brau
48
Combining exergy efficiency and potential for reduction of fossil CO2 emissions allowed
identifying the most promising configurations. In a context of decreasing emissions from the
marginal electricity producer, two configurations of the IG concept were found to be well
performing and the most robust in the considered range:
- Configuration DE, where biomass is dried with refinery excess heat and electricity is
produced with biorefinery excess heat.
- Configuration DFG, where biomass is dried with refinery excess heat, HP steam is
produced with biorefinery excess heat and electricity is generated through a fuel gas
combined cycle. This configuration is also the one yielding the highest potential for
emission reduction.
If the trends identified in the results of this work are extrapolated to less emitting marginal
electricity producers, which is likely to represent a future European energy system [60], the
configuration of both concepts where HP steam is exported to the refinery appears promising.
Much like oil refining in the fossil industry, biomass gasification is a key technology that enables
the production of various chemicals and energy commodities from renewable feedstock. Among
these, hydrogen appears as a product of interest since it can be produced through high efficiency
routes and can contribute to on-site emission reduction at the refinery. Its use in the production of
automotive fuels is not likely to decrease in the near to medium-term, whether for fossil or
renewable fuels. Other, emerging and much researched applications can also be envisioned for
hydrogen, such as its use in fuel cells [61]. Hydrogen production thus appears as a relevant
pathway for biomass conversion.
Page 57
Future work
49
7. Future work
The type of work described in this thesis often involves the same options for further work, i.e.
improvements of the models used for process simulation and economic calculations. Although
the performance indicators used in this project give a clear picture of the biorefinery concepts,
their actual implementation indeed strongly depends on the process economy. Together with its
environmental impact, the economy of a process is likely to be the governing indicator on which
decision makers will base their choices. In the case of this project, the economic study should
also include an evaluation of the possibility to use existing HPU equipment for the upgrading of
biomass syngas.
It was also shown that a promising way of recovering low temperature refinery excess heat was
biomass drying. Biomass is used on-site for hydrogen production in this work but it could be
interesting to evaluate the potential for drying and export to other locations where biomass would
be used. As mentioned in the introduction of this thesis, hydrogen production is one of many
pathways for biomass conversion. Other potential products include e.g. pellets, methanol,
synthetic natural gas and FT-crude. These different biorefinery routes should ultimately be
compared in order to determine the most promising pathway to achieve the transition to a
consistent, more sustainable energy system.
The main opportunities for further studies directly related to the work described in this thesis are
presented in the following sections. These can be divided into two parts according to their focus:
the first part consists in more detailed work on parts of or the whole biomass-to-hydrogen
concepts investigated in the project. The main objective would be to investigate the options for
changing either the type or the operating parameters of single equipment units and how these
changes could impact the performance of the biorefinery process and the energy integration
options between the biorefinery and the refinery. The second part involves working at a higher
scale and expanding the system to match resources (biomass and refinery fuel gas) with products
and energy commodities (hydrogen, steam and, optionally, electricity).
Page 58
Jean-Florian Brau
50
7.1 Design optimization
Based on sound simulations and performances indicators, the results presented in this thesis are
rather close for each concept. It was shown that the IG concept consistently outperforms the DG
concept and some main reasons can be pointed out such as a lower hydrogen yield and a greater
electricity demand. Although the first parameter is largely fixed by known chemical equilibriums,
these can be influenced by the operating conditions (T, P) applied in the various reacting steps of
the process. The electricity consumption essentially consists in the electricity demand for oxygen
production in the Air Separation Unit and its subsequent compression and for hydrogen
compression at the process output.
Thus, it might be interesting to optimize process operating conditions such as temperature and
pressure and to increase the overall performance of the biorefinery processes. Temperature can
have an impact on heat integration opportunities described in this thesis while pressure levels will
change compression requirements and therefore, electricity demands.
Perhaps the most interesting trail for performance improvement involves the Air Separation Unit
(ASU) in the DG concept. This unit has a large electricity demand and its integration with the rest
of the process was not included in the work accomplished so far. Opportunities for such
integration have however been identified in other publications [42] and investigating in this
direction could lead to substantial performance improvements for the DG concept.
7.2 Process synthesis
When excess heat from the biorefinery is used to export HP steam to the refinery, an excess of
fuel gas is created since boilers are offloaded. This fuel gas supply cannot, however, be
discontinued since it is a byproduct of crude oil refining. In this work, the use of this fuel gas in a
gas turbine combined cycle to generate electricity was considered. However, this is not the only
potential application of this resource.
Refinery fuel gas contains around 20% of hydrogen. Combustion of this fuel gas therefore allows
producing electricity with low CO2 emissions, but in a context of hydrogen deficit in the refinery
the recovery of the hydrogen content is also of interest. Similarly, the light hydrocarbon fraction
of fuel gas could be sent to a reforming unit to produce hydrogen.
The general aim of the work accomplished so far was to study the substitution of a traditional
refinery HPU with a biomass-based process. Nevertheless, biomass can be used for other
purposes in a refinery, especially for steam production in boilers. It thus appears that the
formulation of a problem of resource management or of resource allocation can be of interest.
Indeed, it would be very interesting to consider biomass and refinery fuel gas as available
resources that could be used in various processes in order to satisfy the refinery demands in
hydrogen and steam. Electricity can be added as an optional product.
Page 59
Future work
51
Figure 21 presents an example of a system that can be considered for resource allocation. The
system consists in a variety of technologies and equipment that can be used for the production of
steam, electricity and hydrogen from fuel gas and biomass. The solutions to the problem will thus
consist in sets of sizes of these different technologies and the respective input flow of fuel gas or
biomass.
Figure 21: example of system for an optimization problem
This type of problem can be solved by means of linear programming in order to determine
optimal ways of allocating the resources to the different users. The optimization can be
performed for several targets: lowest fossil CO2 emissions, highest overall efficiency, best
economic performance or lowest overall net electricity import.
Page 60
Jean-Florian Brau
52
Page 61
Nomenclature
53
Nomenclature
Symbols
m mass flow
Q thermal power
298KrΔH enthalpy of reaction at 298K
e specific fossil CO2 emissions
eCH
chemical exergy
ePH
physical exergy
HHV Higher Heating Value
ƞel efficiency of marginal electricity producer
ƞex exergy efficiency
ƞtot total energy efficiency
P electrical power
wt% weight percent (mass-based composition)
ΔCO2 fossil CO2 balance
ΔTmin individual contribution to minimum temperature difference for heat exchange
Subscripts
C4 butane
fg fuel gas
i input
net net output
o output
Page 62
Jean-Florian Brau
54
Abbreviations
ASU Air Separation Unit
ATR AutoThermal Reforming
CCS Carbon Capture and Storage
CFB Circulating Fluidized Bed
DE biorefinery configuration with dry biomass input and electricity production
DFG biorefinery configuration with dry biomass input, HP steam export and utilization
of refinery excess fuel gas
DG concept biorefinery concept based on Direct Gasification
DHP biorefinery configuration with dry biomass input and HP steam export
DME DiMethylEther
ETS Emission Trading System
EU European Union
EU-27 European Union with 27 member countries (from 2007-01-01 to 2013-06-30)
GCC Grand Composite Curve
HP High Pressure
HPU Hydrogen Production Unit
HTS High-Temperature Shift
IG concept biorefinery concept based on Indirect Gasification
LTS Low-Temperature Shift
NGCC Natural Gas Combined Cycle
P Pressure
ppbv part per billion, volume based
ppmv part per million, volume based
PSA Pressure-Swing Adsorption
SMR Steam Methane Reforming
T Temperature
W biorefinery configuration with wet biomass input
WGS Water-Gas Shift
Page 63
References
55
References
[1] European Commission. The EU Emissions Trading System (EU ETS). European Union;
2013.
[2] European Commission. Europe 2020 targets. European Union; 2013.
[3] Transport EC-D-GfEa. EU ENERGY IN FIGURES 2010 CO2 Emissions by Sector. In:
EXT_CO2_Emissions_by_Sector.xls, editor.: European Commission; 2010.
[4] Cherubini F. The biorefinery concept: Using biomass instead of oil for producing energy and
chemicals. Energy Conversion and Management. 2010;51(7):1412-21.
[5] Parikka M. Global biomass fuel resources. Biomass and Bioenergy. 2004;27(6):613-20.
[6] Slade R, Saunders R, Gross R, Bauen A. Energy from biomass: the size of the global
resource. London: Imperial College Centre for Energy Policy and Technology and UK Energy
Research Centre; 2011.
[7] Reinaud J. The European refinery industry under the EU emissions trading scheme.
International Energy Agency; 2005.
[8] Boyer C. Hydrogène. ed: Techniques de l'Ingénieur; 2012.
[9] Ratan S. Processing trends: Curtailing hydrogen plant CO2 emissions. Petroleum Technology
Quarterly. 2008;13(4):9-10.
[10] Smith R, Zhang N, Zhao J. Hydrogen integration in petroleum refining. Chemical
Engineering Transactions. 2012;29:1099-104.
[11] Show KY, Lee DJ, Tay JH, Lin CY, Chang JS. Biohydrogen production: Current
perspectives and the way forward. International Journal of Hydrogen Energy. 2012.
[12] Dincer I, Zamfirescu C. Sustainable hydrogen production options and the role of IAHE.
International Journal of Hydrogen Energy. 2012.
Page 64
Jean-Florian Brau
56
[13] Heyne S, Thunman H, Harvey S. Exergy-based comparison of indirect and direct biomass
gasification technologies within the framework of bio-SNG production. Biomass Conv Bioref.
2013:1-16.
[14] Worrell E, Galitsky C. Energy efficiency improvement and cost saving opportunities for
petroleum refineries. University of California, Berkeley; 2005.
[15] Gunnarsson A, Magnusson C. Pinch analysis of Nynas refinery - an energy efficiency study
[Master's Thesis]. Göteborg: Chalmers University of Technology, 2011.
[16] Spath P, Aden A, Eggeman T, Ringer M, Wallace B, Jechura J. Biomass to hydrogen
production detailed design and economics utilizing the Battelle Colombus Laboratory Indirectly-
Heated Gasifier. In: NREL, editor.: NREL; 2005.
[17] Williams R, Parker N, Yang C, Ogden J, Jenkins B. H2 Production via Biomass gasification.
Advanced Energy Pathways Project. Davis, Ca.: UC Davis, Institute of Transportation Studies;
2007.
[18] Hamelinck CN, Faaij APC. Future prospects for production of methanol and hydrogen from
biomass. Journal of Power Sources. 2002;111(1):1-22.
[19] Cohce MK, Dincer I, Rosen MA. Energy and exergy analyses of a biomass-based hydrogen
production system. Bioresource Technology. 2011;102(18):8466-74.
[20] Tock L, Maréchal F. Co-production of hydrogen and electricity from lignocellulosic
biomass: Process design and thermo-economic optimization. Energy. 2012;45(1):339-49.
[21] Andersson E, Harvey S. Comparison of pulp-mill-integrated hydrogen production from
gasified black liquor with stand-alone production from gasified biomass. Energy.
2007;32(4):399-405.
[22] Sarkar S, Kumar A. Biohydrogen production from forest and agricultural residues for
upgrading of bitumen from oil sands. Energy. 2010;35(2):582-91.
[23] Johansson D, Franck PT, Berntsson T. Hydrogen production from biomass gasification in
the oil refining industry - A system analysis. Energy. 2012;38(1):212-27.
[24] Basu P. Biomass Gasification and Pyrolysis: Practical Design and Theory. Elsevier Science,
2010.
[25] Ciferno JP, Marano JJ. Benchmarking Biomass Gasification Technologies for Fuels,
Chemicals and Hydrogen Production. U.S. Department of Energy. National Energy Technology
Laboratory; 2002.
[26] Heyne S. Process integration opportunities for synthetic natural gas (SNG) production by
thermal gasification of biomass [Licentiate Thesis]. Göteborg: Chalmers University of
Technology, 2010.
Page 65
References
57
[27] Higman C, van der Burgt M. Gasification. USA: Gulf Professional Publishing (Elsevier);
2003.
[28] He J, Göransson K, Söderlind U, Zhang W. Simulation of biomass gasification in a dual
fluidized bed gasifier. Biomass Conv Bioref. 2012;2(1):1-10.
[29] Hofbauer H, Rauch R. Stoichiometric water consumption of steam gasification by the
FICFB-gasification process. Progress in Thermochemical Biomass Conversion. 2000;September
2000.
[30] Landälv I. Biomass to Liquids (BtL). European Biofuels Technology Platform; 2013.
[31] Bauen A. Biomass Gasification. In: Encyclopedia of Energy. Elsevier; 2004. p. 213 - 21.
[32] van der Drift A, Boerrigter H. Synthesis Gas from Biomass for fuels and chemicals. ECN
Biomass, Coal and Environmental Research; 2006.
[33] Milne TA, Evans RJ, Abatzoglou N. Biomass Gasifier "Tars": their nature, formation and
conversion. Golden, Colorado. NREL; 1998.
[34] Villot A, Gonthier Y, Gonze E, Bernis A, Ravel S, Grateau M, et al. Separation of particles
from syngas at high-temperatures with an electrostatic precipitator. Separation and Purification
Technology. 2012;92:181-90.
[35] Hamelinck CN, Faaij APC, den Uil H, Boerrigter H. Production of FT transportation fuels
from biomass; technical options, process analysis and optimisation, and development potential.
Energy. 2004;29(11):1743-71.
[36] Aravind PV, de Jong W. Evaluation of high temperature gas cleaning options for biomass
gasification product gas for Solid Oxide Fuel Cells. Progress in Energy and Combustion Science.
2012;38(6):737-64.
[37] De Souza G. Purification des gaz par le procédé PSA - Fondamentaux et cycles en pression.
Techniques de l'Ingénieur.
[38] Lu GQ, Diniz da Costa JC, Duke M, Giessler S, Socolow R, Williams RH, et al. Inorganic
membranes for hydrogen production and purification: A critical review and perspective. Journal
of Colloid and Interface Science. 2007;314(2):589-603.
[39] AspenTech. AspenOne Engineering v7.2. 2010.
[40] Heyne S, Thunman H, Harvey S. Integration aspects for synthetic natural gas production
from biomass based on a novel indirect gasification concept. Conference PRES, Prague; 2008.
[41] Hannula I, Kurkela E. A parametric modelling study for pressurised steam/O2-blown
fluidised-bed gasification of wood with catalytic reforming. Biomass Bioenergy. 2012;38:58-67.
Page 66
Jean-Florian Brau
58
[42] Tranier J-P, Dubettier R, Darde A, Perrin N. Air separation, flue gas compression and
purification units for oxy-coal combustion systems. Energy Procedia. 2011;4(0):966-71.
[43] IEA. Tracking Industrial Energy Efficiency and CO2 Emissions. In: Energy Indicators.
Paris. OECD/IEA; 2007.
[44] Linnhoff B, Boland D, Townsend DW, Hewitt GF, Thomas BEA, Guy AR, et al. A user
guide on process integration for the efficient use of energy. 1st ed. 1982 (revised edition 1994)
ed. Rugby, UK: IChemE, 1982.
[45] Umeda T, Itoh J, Shiroko K. Heat exchange system synthesis. Chem Eng Prog.
1978;74(7):70-6.
[46] Kemp IC. Pinch Analysis and Process Integration, a user guide on process integration for the
efficient use of energy. 2nd ed. Oxford, UK: Butterworth-Heinemann, 2007.
[47] Smith RM. Chemical Process: Design and Integration. 1st ed: Wiley, 2005.
[48] Alves JJ, Towler GP. Analysis of Refinery Hydrogen Distribution Systems. Industrial &
Engineering Chemistry Research. 2002;41(23):5759-69.
[49] Wang YP, Smith R. Wastewater minimisation. Chemical Engineering Science.
1994;49(7):981-1006.
[50] Eastwood AR, Linnhoff B. CHP AND PROCESS INTEGRATION. Gas engineering and
management. 1986;26(2):56-64.
[51] Marechal F, Kalitventzeff B. Targeting the minimum cost of energy requirements: A new
graphical technique for evaluating the integration of utility systems. Computers and Chemical
Engineering. 1996;20(SUPPL.1):S225-S30.
[52] Bejan A, Tsatsaronis G, Moran M. Thermal Design and Optimisation: Wiley-Interscience,
1996.
[53] EEA. Electricity production by fuel (ENER 027) - Assessment published Apr 2012.
European Environment Agency; 2012.
[54] Gode J, Martinsson F, Hagberg L, Öman A, Höglund J, Palm D. Miljöfaktaboken -
Uppskattade emissionsfaktorer för bränslen, el, värme och transporter. In: Värmeforsk, editor.
Anläggnings- och förbränningsteknik. Stockholm. Värmeforsk; 2011.
[55] Andersson E, Franck P-Å, Åsblad A, Berntsson T. Pinch Analysis at Preem LYR. Göteborg,
Sweden: Division of Heat and Power Technology, Department of Energy and Environment,
Chalmers University of Technology; 2013.
Page 67
References
59
[56] Hackl R, Perret S. Power production with Organic Rankine Cycle technology utilizing waste
heat from a cracker and three polyethylene units [Master's Thesis]. Göteborg: Chalmers
University of Technology, 2009.
[57] Brau JF, Morandin M, Berntsson T. Hydrogen for oil refining via biomass indirect steam
gasification: energy and environmental targets. Clean Technologies and Environmental Policy.
2013:1-12.
[58] Campestrini M, Mock P. European Vehicle Market Statistics. In: Transportation TICoC,
editor. Washington, USA. ICCT; 2011.
[59] Bridgwater AV. Review of fast pyrolysis of biomass and product upgrading. Biomass and
Bioenergy. 2011.
[60] European Commission. Énergie. In: Communication DGdl, editor. Luxembourg. European
Union; 2012.
[61] Upreti G, Greene DL, Duleep KG, Sawhney R. Fuel cells for non-automotive uses: Status
and prospects. International Journal of Hydrogen Energy. 2012;37(8):6339-48.
Page 68
Jean-Florian Brau
60
Page 69
Acknowledgements
61
Acknowledgements
There is only one name on this thesis but the work could not have been possible without the help
and support from many people. This is the place to thank all of you!
First of all, I would like to thank Simon for being my examiner and giving me the opportunity to
work on this project. Thore, thank you for your supervision and for your guidance and advice.
Matteo, thank you for your support, for all the ideas, discussions, proofreadings and all your
questions pushing me to think always a little further.
The financial support by Chalmers Energy Initiative (based on strategic funding provided by the
Swedish Government) and PREEM AB is gratefully acknowledged. Getting data from an actual
refinery was an essential part of the case study and discussions with process engineers were
valuable inputs to this project. Thank you Göran Blomberg and Mattias Backmark. The help from
Chalmers Industriteknik was another essential contribution to this project: thank you Per-Åke and
Eva.
Something that was invaluable during my time on this project was the working environment. I
would like to thank all the present and former co-workers at VoM for contributing to an inspiring
and fun working atmosphere. The innebandy, fika, afterworks, Trysil trip and all other activities
made my Swedish years unforgettable. You know that you are all welcome down South, on the
continent – I mean in France. A huge thank to my office mate Maria who had to put up with me
for two years: thanks for listening to my nonsense, for all the Swedish lessons and everything
else!
There were some twists and turns in my long way to this point, and my family followed me all
along. I am grateful beyond words for your love and support. There would be none of this had
you not raised me the way you did.
Last but not least, Sophie: loin des yeux mais pas du cœur! Merci d’avoir cru en moi et en nous.
Vill du plocka svamp?
Page 70
Jean-Florian Brau
62
Page 71
Appendix
63
Appendix
Table 10: Composition of forest residues used in simulations
Proximate analysis (wt% dry basis)
Fixed carbon 20.6
Volatile matter 76.8
Ash 2.6
Ultimate analysis (wt% dry basis)
C 51.3
H 6.1
N 0.5
Cl 0
S 0.05
O 39.5
Ash 2.6
Moisture content, wet biomass (wt%) 50
Moisture content, after drying (wt%) 10
Table 11: Energy efficiencies on HHV and LHV basis
Configuration
Energy efficiency (%)
HHV basis
Energy efficiency (%)
LHV basis
IG concept DG concept IG concept DG concept
W 70 67 62 58
DHP 78 78 70 69
DE 72 70 64 61
DFG 75 74 68 66
Table 12: specific potential for emission reduction
Configuration
δCO2 IG concept
(t CO2/t dry biomass)
δCO2 DG concept
(t CO2/t dry biomass)
NGCC CPP NGCC CPP
W -0.92 -0.79 -0.77 -0.61
DHP -1.01 -0.88 -0.90 -0.75
DE -0.99 -0.98 -0.84 -0.80
DFG -1.06 -1.17 -0.89 -0.97