Page 1
This project has received funding from the European Union’s Horizon 2020 research and innovation
programme under grant agreement No 723650.
D2.2 - Process Industry Domain Analysis and Use Cases
Deliverable ID D2.2
Deliverable Title Initial Process Industry Domain Analysis and Use Cases
Work Package WP2 – Requirements Engineering and Reference Architecture
Dissemination Level PUBLIC
Version 1.3
Date 2016-12-30
Status Final Version
Lead Editor AP
Main Contributors Manuel Chareyre, Jean-Michel Jolas (RTA - AP),
Nathalie Praizelin, Vivian Guillaud, Martin Richiardone (CAP),
Aamir Muhammad, Rubben Schlutter, Marko Gelhen (KIMW),
Marco Dias, Andre Silva (GLN), José Antonio Jiménez Caballero
(AENOR), Thanasis Vafeiadis (CERTH), Olga Michel Chico (FIT)
Published by the MONSOON Consortium
Page 2
Model based control framework for Site-wide OptimizatiON of data-intensive processes
Deliverable nr.
Deliverable Title
Version
D0.0
Process Industry Domain Analysis and Use Cases
0.03 - 13/01/2016
Page 2 of 110
Document History
Version Date Author(s) Description
0.1 2016-11-14 FIT First Draft with TOC.
0.2 2016-12-03 AP-CAP Aluminium Domain detailed TOC.
0.3 2016-12-08 GLN, KIMW Plastic Domain SoA and use cases description.
0.4 2016-12-11 AP Aluminium Domain SoA and use cases description.
0.5 2016-12-18 AP Various add-on and CAP/CERTH comments/contents integration.
0.6 2016-12-19 KIMW Various add-ons and FIT comments integration.
0.7 2016-12-20 KIMW Addition of information of the plastics domain use cases.
1.0 2016-12-22 AP Global review and various comments integration.
1.1 2016-12-23 GLN Addition of some photos of the 2nd
use case - Plastic Domain and
also a small text related to Impacts.
1.2 2016-12-26 AP Minor comments.
1.3 2016-12-30 AP Final Version.
Internal Review History
Version Review Date Reviewed by Summary of comments
0.4 2016-12-17 CERTH Approved with minor comments.
0.6 2016-12-21 AENOR Approved with minor comments.
1.2 2016-12-29 ISMB Approved with minor comments.
Page 3
Model based control framework for Site-wide OptimizatiON of data-intensive processes
Deliverable nr.
Deliverable Title
Version
D0.0
Process Industry Domain Analysis and Use Cases
0.03 - 13/01/2016
Page 3 of 110
Table of Contents
Document History ...................................................................................................................................................................................... 2
Internal Review History ............................................................................................................................................................................ 2
Table of Contents ....................................................................................................................................................................................... 3
Executive Summary .................................................................................................................................................................................... 5
1 Introduction ........................................................................................................................................................................................ 6
1.1 Related documents................................................................................................................................................................ 6
2 Domain State of the Art Analysis ............................................................................................................................................... 7
2.1 Aluminium industry domain .............................................................................................................................................. 7
2.1.1 Aluminium production .................................................................................................................................................... 7
2.1.2 The anode assembly ...................................................................................................................................................... 10
2.1.3 Anode Quality criteria ................................................................................................................................................... 13
2.1.4 Anode manufacturing overview ................................................................................................................................ 20
2.1.5 Green anode manufacturing stages ........................................................................................................................ 23
2.1.6 Baking anodes .................................................................................................................................................................. 30
2.1.7 Anode Assemblies Rodding anodes ........................................................................................................................ 40
2.1.8 Introduction to the electrolysis process ................................................................................................................. 47
2.1.9 Main KPIs to drive production ................................................................................................................................... 55
2.1.10 Gas treatment and environment .......................................................................................................................... 56
2.2 Plastics industry domain .................................................................................................................................................... 58
2.2.1 Injection molding process in general ...................................................................................................................... 58
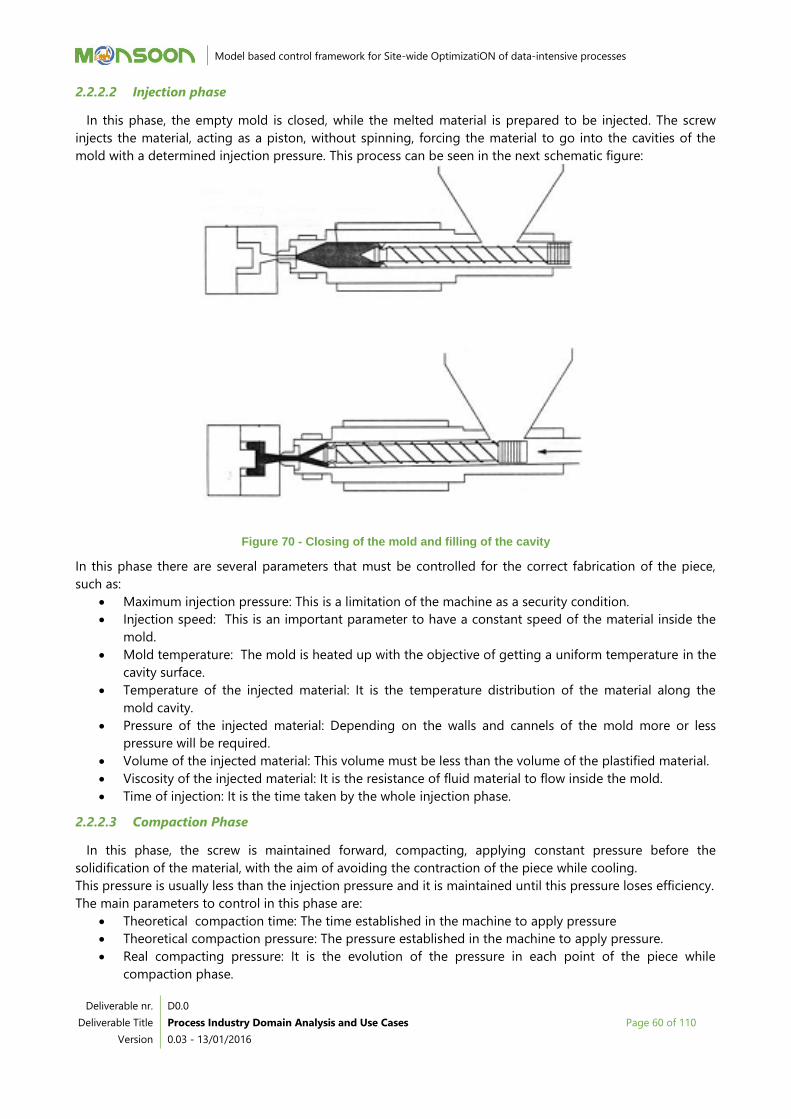
2.2.2 Process phases ................................................................................................................................................................. 59
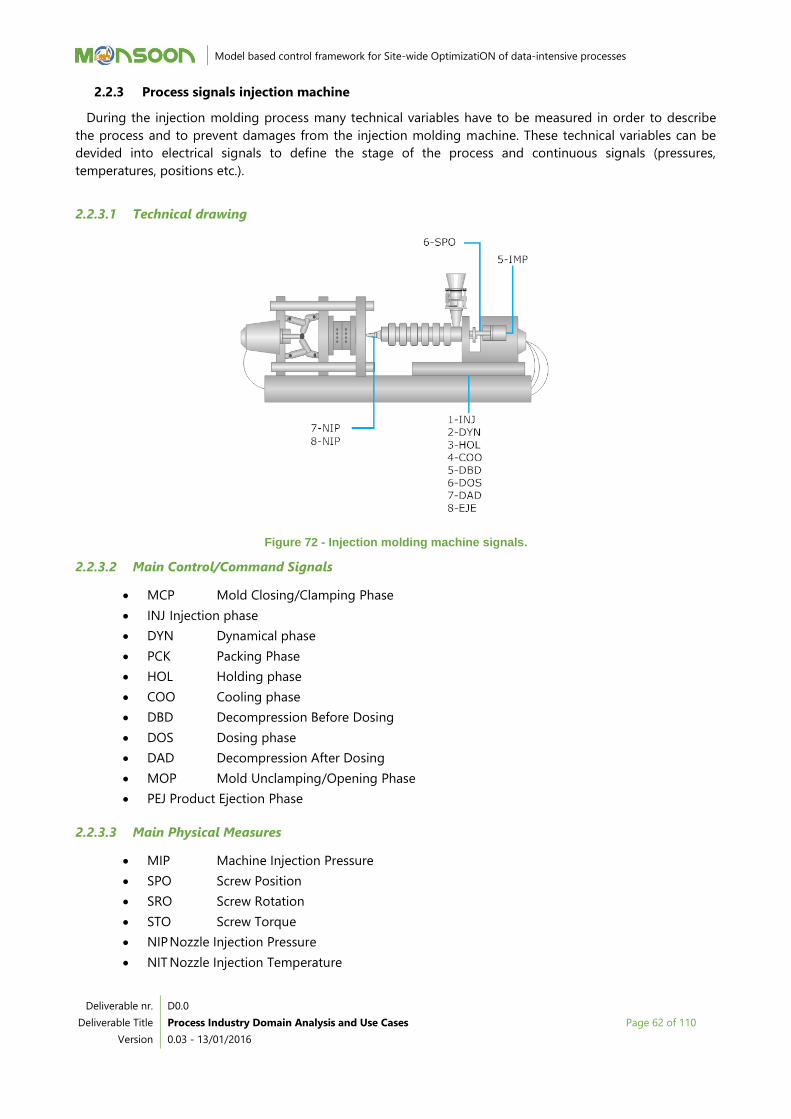
2.2.3 Process signals injection machine ............................................................................................................................ 62
2.2.4 Process signals injection mold ................................................................................................................................... 63
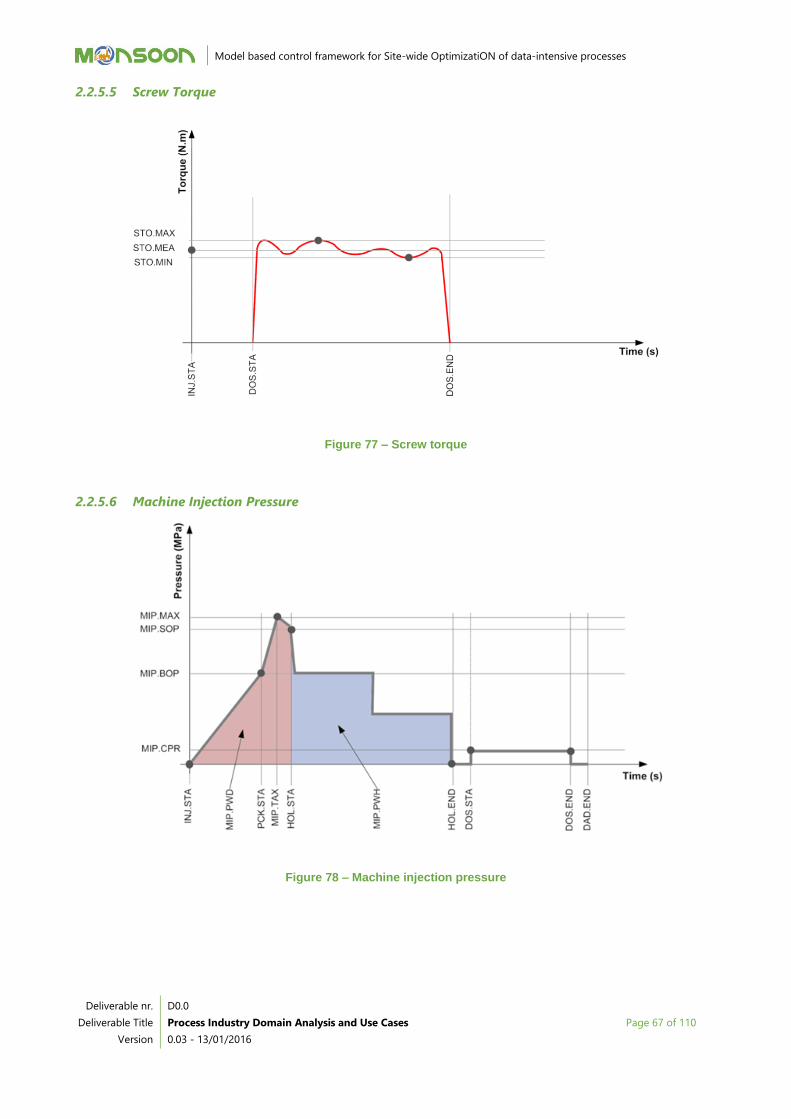
2.2.5 Process signals interpretation of physical measures ........................................................................................ 63
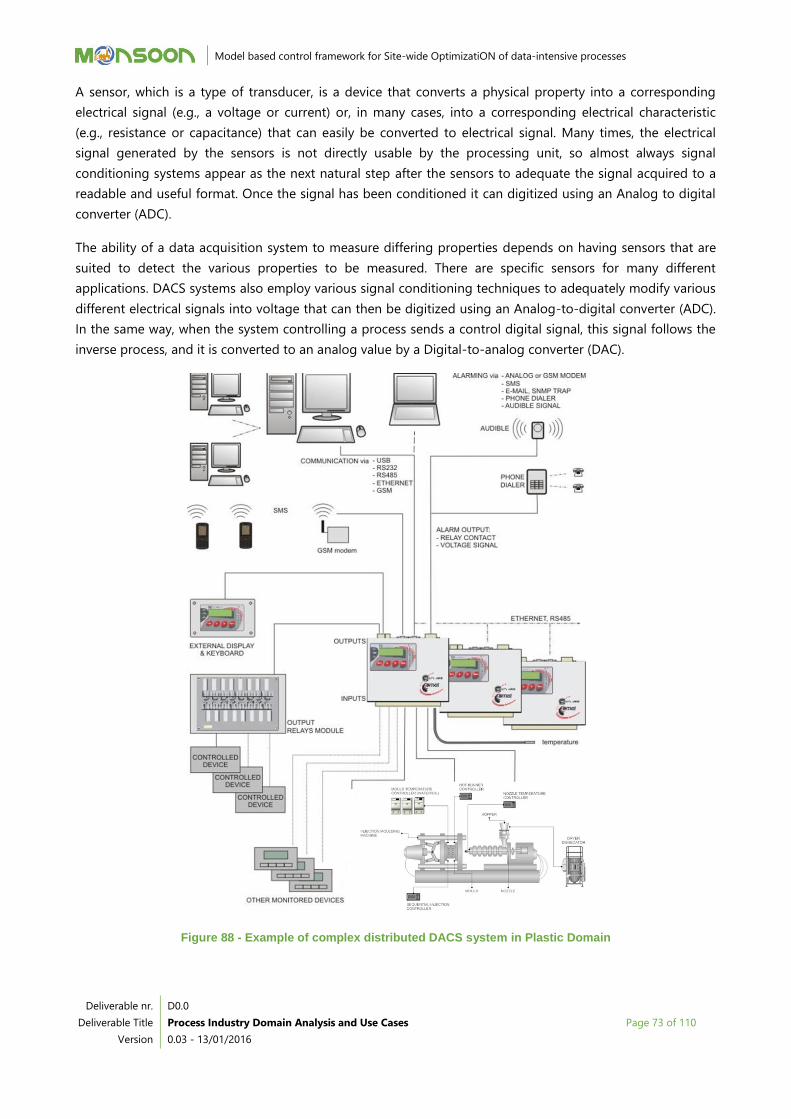
2.2.6 General Scheme of a DACS for Plastic Domain .................................................................................................. 72
2.2.7 Configuration of data collection system for plastic domain .......................................................................... 74
3 Domain Use Cases ......................................................................................................................................................................... 75
3.1 Aluminium industry domain ............................................................................................................................................ 75
3.1.1 General objective ............................................................................................................................................................ 75
3.1.2 Expected impacts ............................................................................................................................................................ 75
3.1.3 Use cases selection ......................................................................................................................................................... 78
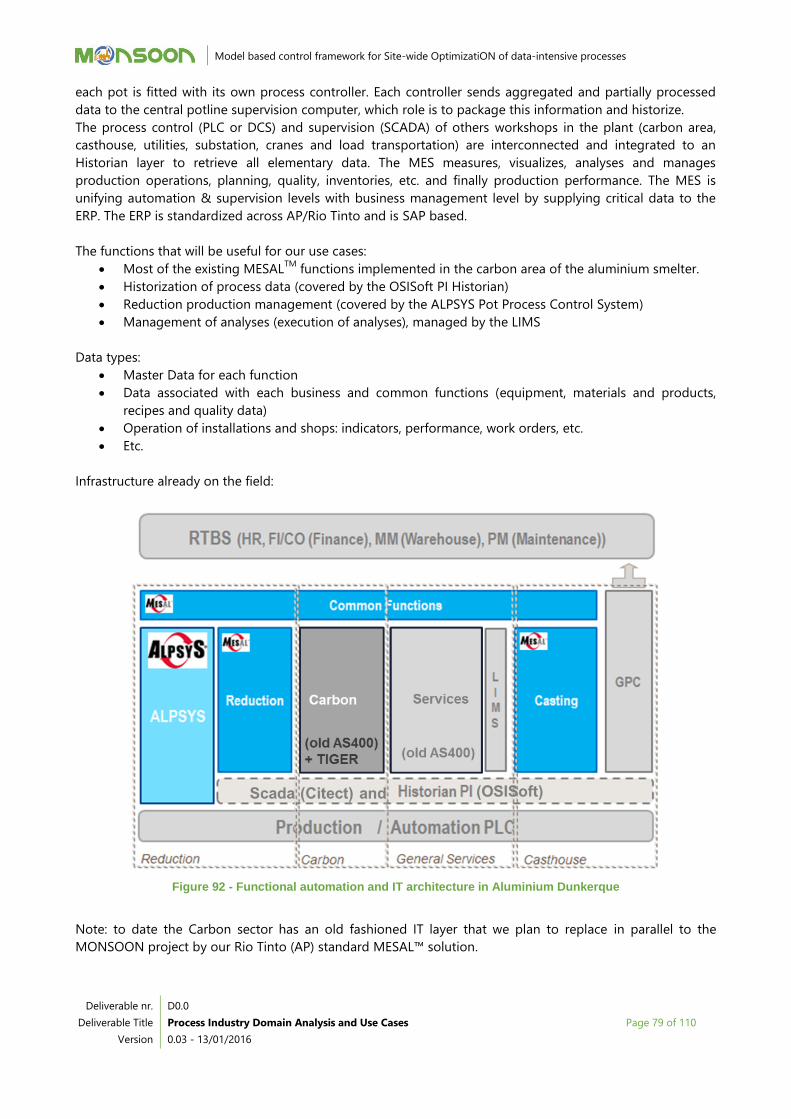
3.1.4 Overview of the infrastructure already on the field .......................................................................................... 78
3.1.5 Functions capturing data ............................................................................................................................................. 80
3.1.6 Carbon area Historian, MCS and MES .................................................................................................................... 80
3.1.7 Electrolysis Pots Process Control and Supervision (ALPSYS) ......................................................................... 84
3.1.8 Use case: predictive anode quality ........................................................................................................................... 86
3.1.9 Use case: predictive maintenance on the paste mixer (ramp-up phase) .................................................. 89
3.1.10 Use case: electrolysis process optimization, predictive detection of anodic incidents .................. 97
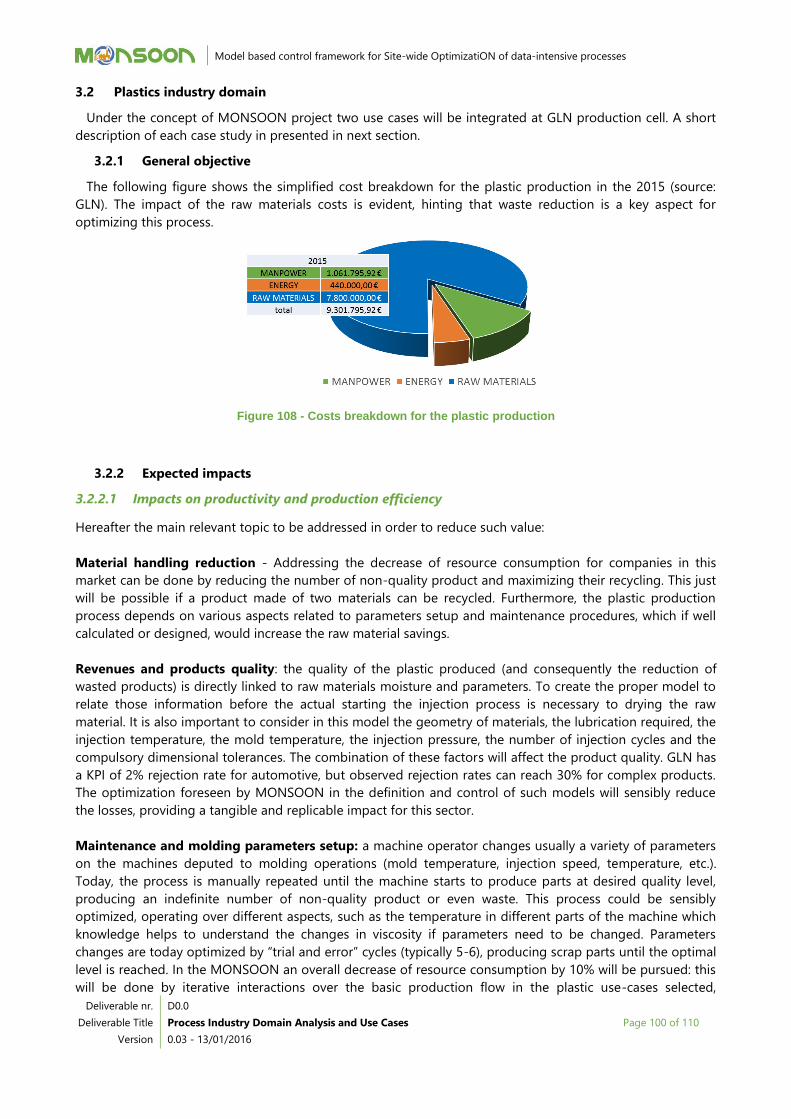
3.2 Plastics industry domain ................................................................................................................................................. 100
3.2.1 General objective ......................................................................................................................................................... 100
3.2.2 Expected impacts ......................................................................................................................................................... 100
Page 4
Model based control framework for Site-wide OptimizatiON of data-intensive processes
Deliverable nr.
Deliverable Title
Version
D0.0
Process Industry Domain Analysis and Use Cases
0.03 - 13/01/2016
Page 4 of 110
3.2.3 Plastic Domain Use-Case-1 ...................................................................................................................................... 103
3.2.4 Plastic Domain Use-Case-2 ...................................................................................................................................... 104
4 Conclusions .................................................................................................................................................................................... 106
Acronyms .................................................................................................................................................................................................. 107
List of figures ........................................................................................................................................................................................... 108
List of tables ............................................................................................................................................................................................. 110
References ................................................................................................................................................................................................ 110
Page 5
Model based control framework for Site-wide OptimizatiON of data-intensive processes
Deliverable nr.
Deliverable Title
Version
D0.0
Process Industry Domain Analysis and Use Cases
0.03 - 13/01/2016
Page 5 of 110
Executive Summary
The purpose of this deliverable is to document and describe the aluminium and plastic domain-specific and
cross-sectorial use cases, defining how the MONSOON platform will be used for predictive optimization and
scheduling tasks in production plants and sites.
The second chapter of the document is dedicated to the state of the art analysis for the aluminium and
plastics domain on both the technological and business aspects.
The third chapter defines the detailed use cases and the initial requirements engineering.
It presents an initial taxonomy for the involved technologies and processes that will be fed into the
development of the cross-sectorial models and the platform development.
Next iterations of this document, will enrich the use cases descriptions and detail the cross-sectorial aspects,
will also focus on process modelling and life-cycle aspects and with analysis on methodologies and key
indicators to account for “circularity” aspects in the use cases definition.
Page 6
Model based control framework for Site-wide OptimizatiON of data-intensive processes
Deliverable nr.
Deliverable Title
Version
D0.0
Process Industry Domain Analysis and Use Cases
0.03 - 13/01/2016
Page 6 of 110
1 Introduction
The purpose of this deliverable is to document and describe the state of the art analysis for the aluminium
and plastics domain on both the technological and business aspects. It describes the aluminium and plastic
domain-specific and cross-sectorial use cases, defining how the MONSOON platform will be used for
predictive optimization and scheduling tasks in production plants and sites.
The deliverable documents the work undertaken in task T2.2 with the objective to define Initial (month 3)
Process Industry Domain Analysis and Use Cases.
Two other iterations are scheduled month 15 as an update and month 24 for the final Process Industry
Domain Analysis and Use Cases.
It the next iterations of the deliverable the detailed use cases will be developed on the technological aspects
but also, based on the “MONSOON Platform Usage Scenarios” D2.1 deliverable, with the description for each
the future use of the MONSOON platform as well as more detailed scenarios either common or specific to
the Aluminium and Plastics domains.
The cross-sectorial aspects will be addressed giving details on the methodology to duplicate our use cases to
similar ones in other industries.
Next iterations will also focus on process modelling and life-cycle aspects and with analysis on
methodologies and key indicators to account for “circularity” aspects in the use cases definition.
1.1 Related documents
ID Title Reference Version Date
[RD.1] Grant Agreement-723650-MONSOON 723650 2016-10-5
[RD.2] MONSOON Consortium Agreement MONSOON-
CA_v1.0 1.0 2016-10-4
[RD.3] MONSOON Platform Usage Scenarios D2.1 1.0 2016-11-30
Table 1 – Related documents
Page 7
Model based control framework for Site-wide OptimizatiON of data-intensive processes
Deliverable nr.
Deliverable Title
Version
D0.0
Process Industry Domain Analysis and Use Cases
0.03 - 13/01/2016
Page 7 of 110
2 Domain State of the Art Analysis
2.1 Aluminium industry domain
2.1.1 Aluminium production
The production process goes through several main steps, two of which are in scope of this project – Carbon
plant and Potline processes.
The heart of the plant (smelter) is constituted by the Potline. It is constituted by a set of several hundred
pots where liquid aluminium is being produced from electrolyte based on utilization of electrochemical
process (electrolysis). Each of these pots is in a different production condition and with slightly different
architecture. The main inputs to the process are electricity, Alumina (Al2O3), anodes and cryolite bath. As an
output not only the aluminium but emissions is produced as well. The process is highly energy consuming –
electrical energy from an external supplier is used.
In order to run the electrolysis, pots must be equipped with anodes and cathodes. Anodes are consumed
during the process within typically 28 days and therefore they have to be continually replaced. Anodes and
their quality are the one of the most important inputs for the electrolysis pot which can be controlled. Each
anode position in the pot has its own specific condition of operation (very strong magnetic field, current
distribution and thermal conditions in pot).
After putting the anode into the pot, the alumina reduction process in the pot continuously consumes the
anode and decreases the height thereof. Therefore each anode in a pot has different height. When the anode
is consumed (the height reaches a critical level), the anode is replaced by a new one. After removing the
spent anode (butt) from the pot, it is cleaned and electrolyte as well as anode butts are recycled.
New anodes are being prepared in-house within the Carbon plant.
Anode blocks go through three successive stages:
Green anodes (produced from calcined petroleum-coke, coal-tar pitch and recycled scraps and
anode butts by mixing and subsequent forming and vibro-compaction in the paste plant),
Baking anodes (produced from green anodes in chambers of Baking furnace),
Rodded anodes (produced from baking anodes by splicing them together with stems – two anodic
blocks on one stem).
Besides usable anode blocks, tar emission and anode scraps are co-produced. From energy point of view, the
baking process is usually using natural gas. The rodded anodes represent the final product stage of the
Carbon plant. They are subsequently distributed to electrolysis pots to replace consumed anodes.
The aim is to optimize anode production procedures, distribution of anodes to pots and selection of
anodes for specific positions in pot as an anode replacement. In an ideal case, all produced rodded anodes
would be with high quality only. In reality not all of the typically 200 anodes (400 blocks) produced per day
are of the best quality – due to several challenges (e.g. quality distribution of raw materials, technical
abnormalities in production process, normal distribution of the process) there is a chance to produce anodes
not in the best quality which can cause problems in electrolysis pots.
Aluminium Pechiney has proposed its Dunkerque plant (in northern France) as an indicative use case as
there is an intensive need for plant-wide monitoring within its aluminium production, electrolysis process and
potline process. The Dunkerque plant is in fact the highest-producing primary aluminium plant in the EU-28
area. It is equipped with 264 electrolytic pots (potline) operating at 390 kA, yearly producing 280.000 tons of
aluminium, and consumes 3.7 TWh of electricity, equivalent to a 1-million people city consumption. The
Dunkerque plant is also the first aluminium factory in France with 65% of total national production and
Europe’s largest sheet-aluminium producer as well as one of the most modern smelters.
Page 8
Model based control framework for Site-wide OptimizatiON of data-intensive processes
Deliverable nr.
Deliverable Title
Version
D0.0
Process Industry Domain Analysis and Use Cases
0.03 - 13/01/2016
Page 8 of 110
2.1.1.1 A continuous process
Figure 1 - A continuous process: 24 h / day, 365 days / year over the 30-50 years of plant operation.
The aluminium process consists in breaking by electrolysis the bonds through which the aluminium metal
atom is tight to oxygen in alumina. This process can be simply described as follow:
Metallurgical alumina (aluminium oxide – Al2O3), the main aluminium production input, is
transported to the plants.
Alumina, which has a high melting point, undergoes over an electrolytic reduction within the so-
called electrolytic pots. In the electrolytic pots, high direct current passes through a negative carbon
cathode and a positive carbon anode. The reaction with oxygen, present in the alumina, consumes
the anode when generating CO2 (2 Al2O3 + 3 C + e- 4 Al + 3 CO2 at 960°C)
Liquid aluminium is periodically drawn from pots using specific vehicles and is casted into extrusion
ingots, sheet ingots, billets, or different other products depending on how it will be further processed
in transformation plants.
Figure 2 - overview of the aluminium electrolysis process
Page 9
Model based control framework for Site-wide OptimizatiON of data-intensive processes
Deliverable nr.
Deliverable Title
Version
D0.0
Process Industry Domain Analysis and Use Cases
0.03 - 13/01/2016
Page 9 of 110
The production process is happening at high temperature. Like in any electrochemical reactor, there are
several equilibria that need to be monitored, managed and kept under control and in steady levels in real
time:
Thermal balance: adjustment of the Joule effect generated in the pot to balance the heat losses.
Chemical balance: raw material feeding rates and bath chemical composition adjustments.
Magneto-hydro-dynamic equilibrium: stable Laplace forces induced liquid bath and metal
movements.
The mass balance: produced metal tapping, and the liquid bath volume control.
2.1.1.2 A typical aluminium smelter
Figure 3 - a typical aluminium smelter
2.1.1.3 Finished aluminium products at Casthouse
The objective of a casthouse is to manufacture a product with the shape, composition, properties and
internal structure that correspond to the customers’ requirements with:
safety, cost effectively and a way that does not harm the environment,
the best value potline metal purity.
The main final customers are aluminium transformation businesses.
Main finished products:
Figure 4 - main casthouse finished products
Page 10
Model based control framework for Site-wide OptimizatiON of data-intensive processes
Deliverable nr.
Deliverable Title
Version
D0.0
Process Industry Domain Analysis and Use Cases
0.03 - 13/01/2016
Page 10 of 110
2.1.1.4 A typical potline and pot
Managing a potline process of such size is similar to managing a population. The pots involved in
aluminium production line are like individuals behaving according to common rules and trends and
individual behaviours, which can drift with time and events, or as a reaction to potline process setting
changes.
An optimum performance of the potline happens when the whole population is operating in average at an
optimum target setting point, and expected behaviour, and when the standard deviation of the population is
minimal (i.e. there is no problematic individual pots).
Figure 5 - a typical potline view
Figure 6 - Schematic cross-section of an AP pot
2.1.2 The anode assembly
2.1.2.1 Description
An anode assembly (AA) comprises:
an aluminium stem
a cast or welded steel bracket, on which cylindrical pins are welded (this assembly is also called a
hexapod when there are 6 pins)
one or more amorphous carbon anodes rodded to the pins
Page 11
Model based control framework for Site-wide OptimizatiON of data-intensive processes
Deliverable nr.
Deliverable Title
Version
D0.0
Process Industry Domain Analysis and Use Cases
0.03 - 13/01/2016
Page 11 of 110
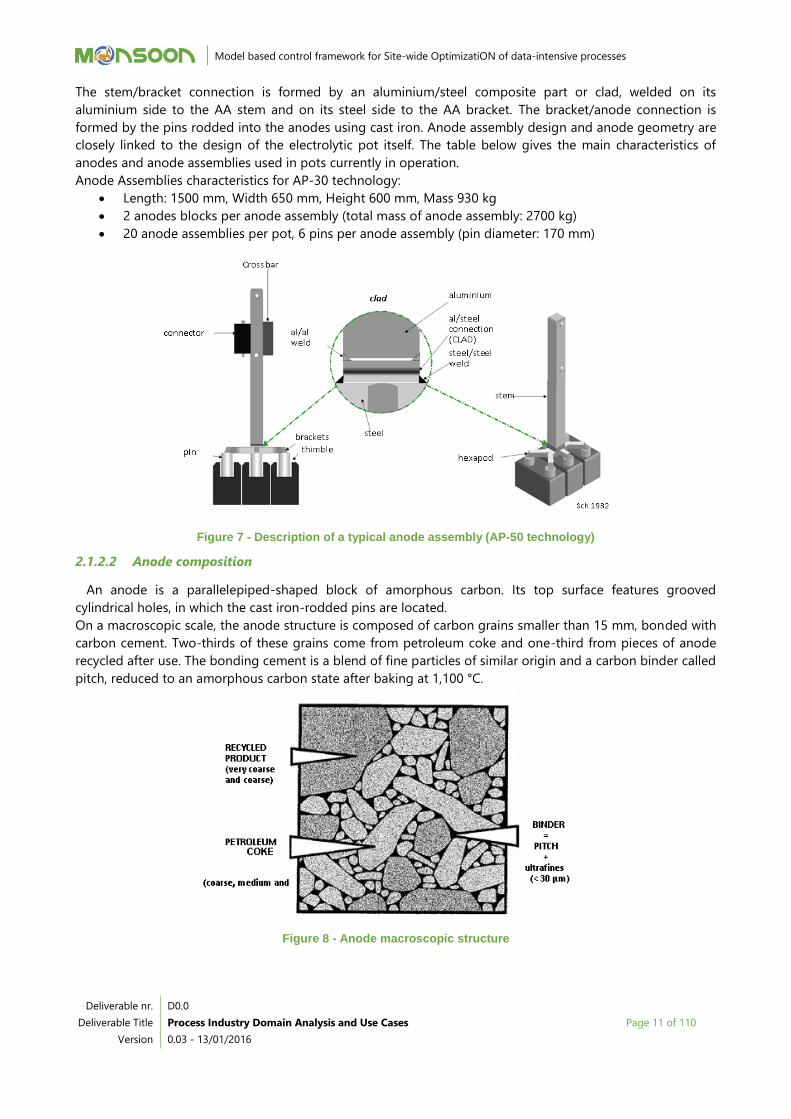
The stem/bracket connection is formed by an aluminium/steel composite part or clad, welded on its
aluminium side to the AA stem and on its steel side to the AA bracket. The bracket/anode connection is
formed by the pins rodded into the anodes using cast iron. Anode assembly design and anode geometry are
closely linked to the design of the electrolytic pot itself. The table below gives the main characteristics of
anodes and anode assemblies used in pots currently in operation.
Anode Assemblies characteristics for AP-30 technology:
Length: 1500 mm, Width 650 mm, Height 600 mm, Mass 930 kg
2 anodes blocks per anode assembly (total mass of anode assembly: 2700 kg)
20 anode assemblies per pot, 6 pins per anode assembly (pin diameter: 170 mm)
Figure 7 - Description of a typical anode assembly (AP-50 technology)
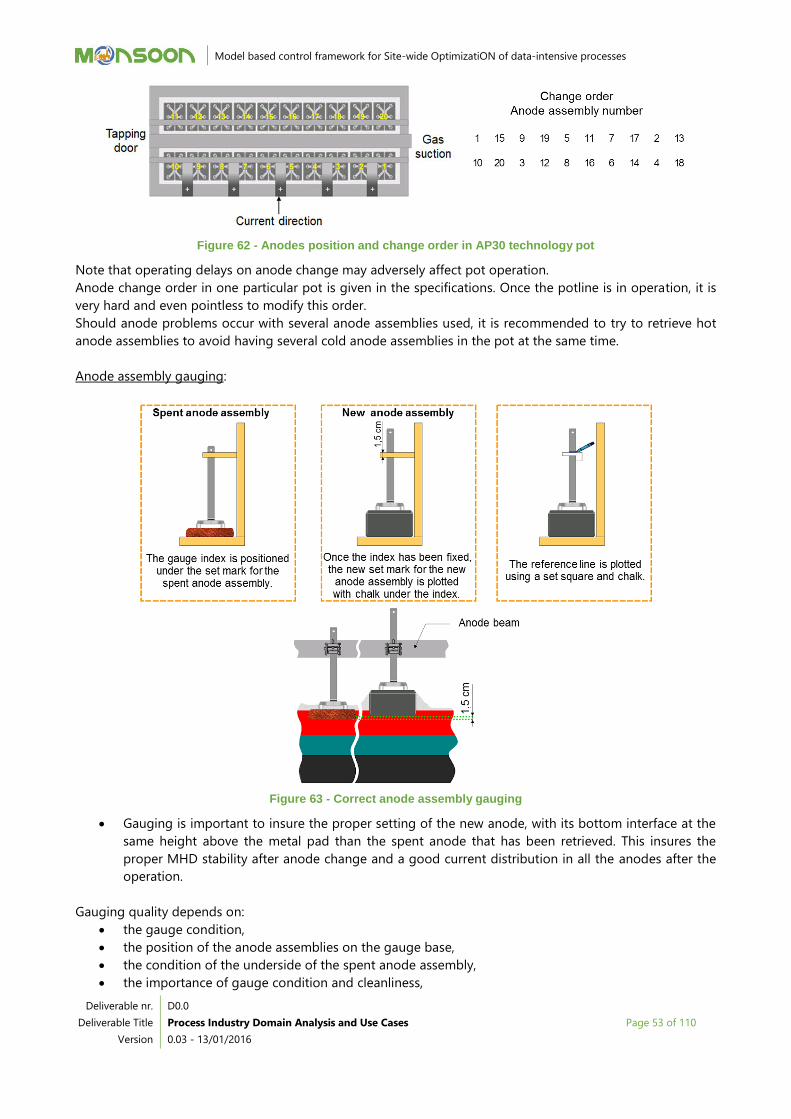
2.1.2.2 Anode composition
An anode is a parallelepiped-shaped block of amorphous carbon. Its top surface features grooved
cylindrical holes, in which the cast iron-rodded pins are located.
On a macroscopic scale, the anode structure is composed of carbon grains smaller than 15 mm, bonded with
carbon cement. Two-thirds of these grains come from petroleum coke and one-third from pieces of anode
recycled after use. The bonding cement is a blend of fine particles of similar origin and a carbon binder called
pitch, reduced to an amorphous carbon state after baking at 1,100 °C.
Figure 8 - Anode macroscopic structure
Page 12
Model based control framework for Site-wide OptimizatiON of data-intensive processes
Deliverable nr.
Deliverable Title
Version
D0.0
Process Industry Domain Analysis and Use Cases
0.03 - 13/01/2016
Page 12 of 110
An anode is therefore formed of two intimately mixed types of carbon. This important notion conditions
many of its properties. One third of the volume of this structure is composed of microscopic pores
intercommunicating to a greater or lesser degree, which makes the anode permeable to gases.
It contains small quantities of metallic impurities, which can have serious consequences in the event of
deviation.
An anode is an electrical conductor.
Its geometric density (ratio of its mass to its external volume) varies between 1.52 and 1.62 according to its
quality. A good quality anode is exempt of internal defects such as areas of constituent segregation or cracks,
or else it contains only limited, controlled proportions thereof.
2.1.2.3 Anode Assembly usage
The following picture shows a new AA being placed in a pot using a pot tending assembly (PTA).
Figure 9 - Placement of a new AA (AP30 technology)
The AA is held approximately 5 cm above the pot liquid metal pad by means of a tube that clamps the stem
to the pot anode beam, which also distributes current to all the AAs.
In the case of an AP-30 pot, the average current circulating in an AA from the beam to the pot is 15,000 A.
As soon as anodes are placed in the pot, they are covered with crushed bath to protect them from oxidation.
27 to 30 days later, two-thirds of the anode height has been consumed and the AA has to be replaced by a
new AA. AA usage time in the pots – typically 28 days - is called the "anode cycle".
Figure 10 - Spent anode removal at end of cycle
During their cycle, anodes must fulfill a number of conditions to ensure optimum operation of the electrolytic
process.
Page 13
Model based control framework for Site-wide OptimizatiON of data-intensive processes
Deliverable nr.
Deliverable Title
Version
D0.0
Process Industry Domain Analysis and Use Cases
0.03 - 13/01/2016
Page 13 of 110
2.1.3 Anode Quality criteria
2.1.3.1 Low carbon consumption
Two factors contribute to carbon consumption, the first corresponds to an electrochemical reaction and
second to purely chemical reactions.
Electrochemical consumption
The anode/bath interface is the center of the following basic reaction: Al2O3 + 3/2 C 2 Al + 3/2 CO2
According to this reaction, the theoretical carbon consumption is 333 kg/t of aluminium produced.
Parasitic reactions result in re-oxidation of part of the metal with the produced CO2 (back reaction), so the
aluminium quantity actually produced is slightly less than the theoretical quantity. The ratio between actual
and theoretical production is called the current efficiency, which may vary between 92 and 97%, depending
on pot performance.
Effective carbon consumption per tonne of aluminium produced is therefore slightly higher than 333 kg/t
and, if the current efficiency is 95%, it is, for example: 333 x 100 / 95 = 351 kg/t
Chemical consumption
Part of the CO2 produced when reducing alumina disperses by circulating within the porosity of the anode
which is at very high temperature when in contact with the electrolytic bath, which causes further oxidation
of the carbon by carbon dioxide reactivity based on the following reaction: CO2 + C 2 CO
This so-called Boudouard reaction is a chemical reaction that is accompanied by excess carbon consumption
of approximately 40 kg/t of aluminium produced. Its value depends on the reaction intensity, which itself
depends on pot temperature, anode permeability to pot gases and various catalyzers present in the anode in
the form of impurities (especially sodium, vanadium, nickel...).
Another cause of chemical consumption is due to oxygen in the air, which manages to come into contact
with the top of the anode, despite the layer of bath protecting it: O2 + C CO2
CO2 produced by this reaction is discharged along with the other pot gases.
This new excess consumption due to anode oxygen reactivity varies between 10 and 30 kg/t of aluminium
produced, depending on the airtightness of the bath cover, the anode permeability and and the above
mentioned metallic impurities.
Figure 11 - Reaction causing carbon consumption
Net consumption and net carbon
Page 14
Model based control framework for Site-wide OptimizatiON of data-intensive processes
Deliverable nr.
Deliverable Title
Version
D0.0
Process Industry Domain Analysis and Use Cases
0.03 - 13/01/2016
Page 14 of 110
This is the total carbon consumption per ton of aluminium actually produced. Its breakdown is as follows:
. electrochemical consumption (at 95% current efficiency) 350 kg/t,
. consumption due to carbon dioxide reactivity 45 kg/t,
. consumption due to oxygen reactivity 15 kg/t,
Total net carbon 410 kg/t.
In practice and depending on anode properties and pot operation, net carbon varies between 395 and 450
kg/t or even more.
The example below illustrates the case of a downgraded situation:
. electrochemical consumption (at 91% current efficiency) 365 kg/t,
. consumption due to carbon dioxide reactivity 60 kg/t,
. consumption due to oxygen reactivity 20 kg/t,
Total net carbon 445 kg/t.
This case corresponds to downgraded pot operation with a current efficiency of 91% instead of 95%, as well
as increased consumptions due to oxygen and carbon dioxide reactivity resulting from both the operating
conditions at this pot and insufficient anode quality.
Figure 12 - Net and gross consumption
Gross consumption or gross carbon
Unlike net carbon, gross carbon takes into account the anode quantity remaining at the end of the cycle
because it is defined as the anode quantity supplied (or lost) to the pot, reduced to each tonne of aluminium
produced.
In general, gross consumption varies between 550 and 580 kg/t, depending on the net carbon and the anode
quantity remaining at the end of the cycle.
Figure 13 - Anode cycle in an AP-30 pot
Theoretical
95 % CE
Carbon dioxide reactivity
Oxygen reactivity
GROSS :
(+ 17)
(+ 45)
(+ 15)
(+ 140)
NET :
333
350
395
410
550
300 400 500 kg/t
Page 15
Model based control framework for Site-wide OptimizatiON of data-intensive processes
Deliverable nr.
Deliverable Title
Version
D0.0
Process Industry Domain Analysis and Use Cases
0.03 - 13/01/2016
Page 15 of 110
2.1.3.2 Long anode cycle
In the case of the pots referred to above, the end-of-cycle anode height must not be less than about 200
mm to ensure that the pins do not come into contact with the liquid bath, if the anode is submerged during
operations to suppress pot polarization. Steel dissolves quickly in the bath and this effectively leads to rapid
pin wear and unwanted aluminium contamination by the iron dissolved in the bath.
With 600 mm high anode, the wear is approximately 400 mm, i.e. for an 80-shift cycle, 5 mm per 8-hour shift.
Other things being equal, the rate of anode wear and thus the cycle time effectively depend on:
the net carbon,
anode density or quantity of carbon per unit volume.
The rate of anode wear is all the lower when the net consumption is low and the anode density is high.
Dense, lowly reactive anodes are therefore preferred, either to reduce anode changing frequency by
prolonging the cycle time or, with the same cycle time, to have higher spent anodes to improve pin
protection and reduce iron contamination of the metal.
2.1.3.3 Resistance to carbon dusting
We have seen that the CO2 produced by reducing the alumina consumes the anode carbon due to carbon
dioxide reactivity and that the anode carbon is made up of coke grains cemented by a carbon binder.
If the CO2 reactivity of the binder is higher than that of the coke grains, the binder is consumed quicker
leading to dislodgement of the coke grains, which then fall into the pot before being consumed themselves.
Figure 14 – matrix and binder cokes
This reaction, known as carbon dusting, seriously destabilizes pot operation and must be avoided at all costs.
Drawn by movement of the metal, the carbon grains concentrate effectively at different points of the
bath/metal interface, where they form magmas called mushrooms that adhere to the anodes.
Figure 15 – carbon dusting
The resulting reduction in the anode/metal distance immediately above the mushrooms constitutes as many
zones of preferential current passage, which destabilize pot operation by disrupting the uniformity of the
current distribution at the anode assemblies.
One of the principal effects of this disturbance is an increase in temperature of the pot, whose performance
deteriorates. Moreover, because temperature accelerates the CO2 oxidation rate, the phenomenon spreads to
other anodes, which would not have produced carbon dust at a lower temperature. The phenomenon
therefore propagates throughout the pot.
Page 16
Model based control framework for Site-wide OptimizatiON of data-intensive processes
Deliverable nr.
Deliverable Title
Version
D0.0
Process Industry Domain Analysis and Use Cases
0.03 - 13/01/2016
Page 16 of 110
Figure 16 – anode spike / mushroom
The treatment applied to the pots involves extracting the carbon dust concentrated at the tapping hole and
finding, then breaking, mushrooms after removing the anode assemblies concerned. These additional tasks
can make potroom results worse because they significantly increase the potline operation workload and
process disturbance.
It is therefore essential that anodes resist dusting, which means that the binder and matrix cokes must have
comparable CO2 reactivities, so that the anode/bath interface is uniformly consumed.
Figure 17 – dust removal
2.1.3.4 Thermal shock resistance
When the anodes are being installed, they are at ambient temperature and are immersed in 20 cm of bath
at 960 °C. At this moment, they are subjected to a thermal shock, which may result in one of the following
consequences.
Figure 18 - Anode fracture profiles due to thermal shock
Page 17
Model based control framework for Site-wide OptimizatiON of data-intensive processes
Deliverable nr.
Deliverable Title
Version
D0.0
Process Industry Domain Analysis and Use Cases
0.03 - 13/01/2016
Page 17 of 110
Figure 19 – corner fracture.
After a longer period (one or two hours), cracking across a vertical plane mid-way between pins, both anode
sections being held by roddings.
After an even longer time, cracking across a horizontal plane possibly causing separation of the bottom
section, which then falls into the pot.
The first case is the most characteristic of thermal shock and results in a rise in pot temperature, which must
be avoided to prevent destabilization of the pot. As soon as a crack appears, the anode must be removed
and the corner broken off, if it is still attached. If the broken corner is small, the anode can be placed again in
the pot; if not, a new anode is required.
The second case has less impact on pot operation and current passage because the two pieces of anode
remain part of the anode assembly.
The last case is usually linked to an anode structural defect created at mixing/forming stage, aggravated by
the thermal shock to the extent of causing anode separation. The detached section must of course be
removed from the pot as soon as possible, a major task involving pieces weighing several hundreds of
kilograms.
We see that the additional remedial work required, when such incidents occur, can itself also severely disrupt
potline operations and, in turn, pot performance.
It is therefore essential to ensure that anodes have high thermal shock resistance.
Figure 20 - Relative weight of parameters versus thermal shock resistance
Page 18
Model based control framework for Site-wide OptimizatiON of data-intensive processes
Deliverable nr.
Deliverable Title
Version
D0.0
Process Industry Domain Analysis and Use Cases
0.03 - 13/01/2016
Page 18 of 110
2.1.3.5 Low anode voltage drop
The following diagram represents a typical breakdown of voltage drop along an anode assembly.
It should be noted that the rodding itself (pin > cast iron > carbon contact) represents 50% of the anode
voltage drop because of the relatively poor conductivity of the cast iron, as well as the pin/cast iron and cast
iron/carbon contacts.
Rodding cast iron must therefore meet strict specifications to obtain the required quality and limit the anode
voltage drop at this location.
Figure 21 - Breakdown of AA anode voltage drop at mid-life
2.1.3.6 Anode uniformity
The structure of a given anode must be totally identical throughout, to ensure a uniform wear front
throughout the usage cycle. Internal non-uniformities can effectively cause deformations of this surface and
these disrupt pot operation.
Wear regularity concerns the whole anode bottom level, implying also that all anodes forming this bottom
level must be mutually identical to ensure regular pot operation.
The carbon dust propagation mechanism illustrates this necessity because a small number of defective
anodes is enough to extend the phenomenon to other healthy anodes by a simple rise in temperature.
Similarly, pot destabilization due to thermal shock-induced breakage of a few anodes causes breakage of
other anodes that would have remained intact under normal conditions.
2.1.3.7 Low impurity contents
The following table shows the main impurities contained in anodes, along with their usual concentrations
and consequences on all processes.
Page 19
Model based control framework for Site-wide OptimizatiON of data-intensive processes
Deliverable nr.
Deliverable Title
Version
D0.0
Process Industry Domain Analysis and Use Cases
0.03 - 13/01/2016
Page 19 of 110
Table 2 - Main chemical impurities present in anodes
Most of these impurities originate from raw materials, which must therefore be selected accordingly.
Those whose concentrations are increased by the anode preparation process must be subjected to
particularly careful control:
iron results from mill wear and recycling of spent anodes from which iron particles have been
incompletely excluded (splatterings of rodding cast iron, shot used for cleaning),
sodium, calcium and fluorine are introduced by recycled anodes from which pot bath has been
incompletely excluded.
Consequences of these impurities are of three types:
Quality of metal produced:
Iron, silicon and vanadium must not exceed specific levels for certain applications. In the casthouse,
there are processes for eliminating part of the vanadium but their efficiency is limited, imposing raw
material selection. In the case of iron and silicon, care must be taken to ensure recycled anode
cleanliness.
Potroom and anode preparation processes:
Vanadium, nickel and sodium are catalyzers of carbon oxidation, the two first by air, the third by CO2
(this second reaction is itself inhibited by sulfur). They play a dominant role in carbon consumption
mechanisms.
Sodium coexists with fluorine introduced by the bath in a 1.7 to 1.8 mass ratio.
Both have a highly corrosive action on the alumino-silicate refractory materials used in the anode
preparation process (baking and induction furnaces). This is the main reason why they must be
eliminated in the most efficient way.
Environment:
Sulfur is released during anode combustion and cannot be stopped by potroom gas treatment
installations.
Limiting of emissions therefore depends on the choice the coke, which is the main source of sulfur.
2.1.3.8 Review of required characteristics
Anode characteristics are not independent and, depending on their nature, there are more or less marked
correlations between them. Thus, resistivity varies in the same direction as density and certain metal impurity
contents influence reactivity.
Page 20
Model based control framework for Site-wide OptimizatiON of data-intensive processes
Deliverable nr.
Deliverable Title
Version
D0.0
Process Industry Domain Analysis and Use Cases
0.03 - 13/01/2016
Page 20 of 110
Reactivity appears an essential anode characteristic because it conditions three of its usage values:
carbon consumption
anode cycle time
resistance to carbon dusting (more in the form of differential reactivity than overall reactivity).
The term "optimization of mechanical properties" means ensuring that a few composite indicators are kept
within determined value ranges, resulting in anodes that are resistant to thermal shock.
2.1.4 Anode manufacturing overview
2.1.4.1 Process overview
Anode and anode assembly production comprises carbon raw material selection, green anode preparation,
anode baking and anode rodding with hexapods.
Figure 22 – “cold” part of the anode manufacturing process
Coke and pitch handling and storage shop:
Receive and store the pitch
Receive coke arriving from the main on-site stock
Prepare the mixture of the coke qualities if necessary: the coke “blend”.
Paste plant:
The function of this shop is to produce paste by mixing coke, recycled anode products, recycled dedusting
products and pitch. The stages of the process are as follows:
Crushing and sorting the dry products (coke, recycled green and baked products, dedusting fines)
Preheating and mixing the raw material products with pitch
Heating and distributing the heat transfer medium for the dry product preheating.
Once the paste is produced, a forming step occurs in the paste plant.
Forming the green anodes by vibrocompaction of the paste in a mould
Cooling the green anodes.
Green and baked anode handling and storage shop
Page 21
Model based control framework for Site-wide OptimizatiON of data-intensive processes
Deliverable nr.
Deliverable Title
Version
D0.0
Process Industry Domain Analysis and Use Cases
0.03 - 13/01/2016
Page 21 of 110
The shop manages the following stocks:
Green anodes arriving from the paste plant and going to the baking furnace
Baked anodes arriving from the baking furnace and going to the rodding shop.
A sufficient stock of green anodes is built up to supply the baking shop when no anodes, or not enough
anodes, are produced by the paste plant (in particular when the paste plant is stopped for maintenance).
The baked anode stock comprises baked anodes produced by the baking furnace, but not required for
consumption by the rodding shop. This stock must be sufficient to supply the rodding shop regularly with
baked anodes independently of the baking furnace production rate.
Anode baking shop:
The function of the shop is to produce baked anodes from green anodes.
The baking furnace comprises sections. Each section consists of pits. In each pit the anodes are arranged in
rows and layers. The baking furnace uses packing coke to cover the loaded green anodes.
The baking furnace is in continuous operation.
Anode assembly rodding shop:
The function of this shop is to:
Produce new anode assemblies for the potroom from baked anodes, recycled stems and cast iron
Recycle spent anodes returned from the potline
Recycle rodding cast iron.
The stages of the process covered by the rodding shop are as follows:
Storing anode assemblies
Preparing stem-bracket assemblies
Rodding anode assemblies
Repairing stem-bracket assemblies
Recycling cast iron.
Carbon recycling shop:
The function of this shop is to crush green and baked recycled products:
Rejected green anodes
Rejected paste
Rejected baked anodes
Spent anode carbon.
Anode baking furnace fumes treatment:
Combustion fumes produced by anode baking are treated in the Fume Treatment Center. Fresh alumina is
used to fix the particles and pollutants carried in the fumes. The charged alumina is collected through filters
and subsequently mixed with the fluorinated alumina in the potline silos.
Each stage has a specific impact on obtaining final product characteristics.
2.1.4.2 Properties the anode needs to meet the Electrolysis requirements
Table 3 reviews schematically the characteristics that anodes must have in order to meet quality criteria
specified by the potroom.
Page 22
Model based control framework for Site-wide OptimizatiON of data-intensive processes
Deliverable nr.
Deliverable Title
Version
D0.0
Process Industry Domain Analysis and Use Cases
0.03 - 13/01/2016
Page 22 of 110
Table 3 - Schematic review of anode characteristics meeting user quality specifications
2.1.4.3 Raw materials
Levels of reactivity, geometric density, resistivity and chemical purity of anodes and their thermal shock
resistance properties depend, to a large extent, on characteristics of the petroleum coke from which they are
derived. For financial and availability reasons, the choice of coke entails a compromise resulting in cokes from
different sources being mixed and process parameters being adapted accordingly.
Through its wettability, pitch plays a no less determining part in establishing the parameters referred to
above, except for chemical purity, which is most often unaffected by pitch origin.
Anode uniformity depends primarily on the raw material consistency, which requires rigorous monitoring of
acceptance operations and establishment of long-term relations with suppliers to ensure stable supplies in
compliance with issued specifications.
2.1.4.4 Green anode manufacturing
High anode geometric density, low resistivity, homogeneity and no cracking depend on the green process
capacity for delivering high mixing powers and times, as well as temperatures suited to each green anode
preparation stage.
Soundness characterizes the process capacity for ensuring that these characteristics remain constant; it must
be high to ensure production uniformity.
When coke characteristics do not permit sufficient thermal shock resistance to be reached, adopting a
suitable dry products grain size distribution is usually enough to achieve the target objective.
Page 23
Model based control framework for Site-wide OptimizatiON of data-intensive processes
Deliverable nr.
Deliverable Title
Version
D0.0
Process Industry Domain Analysis and Use Cases
0.03 - 13/01/2016
Page 23 of 110
2.1.4.5 Anode baking
The majority of anode characteristics are acquired at the green stage and reach their final values at baking
with coking of the binder, followed by baking to 1,100 C.
End-of-baking temperature, in particular, results in reducing reactivity to an acceptable level with respect to
pot usage conditions. It is especially important that the baking level is uniformly distributed in the
chambers/pits to ensure baked anode homogeneity.
The volatile matter emission stage may be the cause of anode cracking and it must be negotiated at a
sufficiently slow heating rate in the corresponding temperature range to prevent any deformation of this
type.
2.1.4.6 Anode Assembly rodding
Low anode voltage drop is obtained by rigorous control of rodding cast iron quality.
At the rodding stage, there is a major risk of anodes being contaminated by spent anode bath, which results
in increased anode reactivity and accelerated ageing of baking furnace refractory materials. Spent anodes
must be cleaned with the utmost care, in particular to prolong the service life of baking furnace flue walls.
2.1.5 Green anode manufacturing stages
2.1.5.1 General
The following figure recalls typical green anode composition with 85% Dry Products (DPs) and 15% pitch.
(FC : Fixed carbon)
(VM : Volatile matter)
Figure 23 - Typical green anode composition
DPs themselves comprise 2/3 petroleum coke and 1/3 anodes recycled after previous usage (baked recycled
products).
Schematically, pitch comprises 2/3 fixed carbon and 1/3 volatile matter. It forms the binder that cements the
coarsest DP grains, when blended with the finest DPs.
Green anode preparation, which takes place in the Paste Plant (PP), includes the following stages:
crushing and sizing of coke and recycled carbon products to obtain DPs of constant, determined
grain size,
mixing of DPs and pitch to obtain a uniform paste,
forming of paste in a vibrating machine.
Page 24
Model based control framework for Site-wide OptimizatiON of data-intensive processes
Deliverable nr.
Deliverable Title
Version
D0.0
Process Industry Domain Analysis and Use Cases
0.03 - 13/01/2016
Page 24 of 110
Figure 24 - Diagram of green anode preparation
Green anodes are characterized by their geometric and dry densities. Derived from geometric density by
excluding the pitch from the green anode, dry density measures the compactness achieved by the DP
stacking.
Usual green anode geometric densities are between 1.65 and 1.60, corresponding to a dry density range of
1.42 – 1.38 with 14% pitch (i.e. 86% DPs).
Densities obtained result from optimizing many factors involving the raw materials and preparation process:
coke density,
baked recycled product content,
DP grain size distribution,
pitch softening point and wettability characteristics,
pitch content,
mixing and vibrocompacting intensity.
By "mixing and vibrocompacting intensity" we mean the capacity of these two essential process stages to
produce, as fully as possible, the following state of the green anode forming material:
DP grains coated with binder,
DP grain porosity filled with binder,
intergranular space minimized and filled with binder.
In this respect, dry density is a favored indicator measuring the efficiency of the green anode manufacturing
process.
2.1.5.2 Milling, screening,classification
Coke and baked recycled products are continuously mixed at constant ratio calculated to ensure recycling
of all spent anodes produced by the potroom. in general, this ratio is 2/3 coke and 1/3 baked recycled
products.
Coke is itself a mixture of 2 different quality cokes proportioned in relation to the anode characteristics
sought.
Conveyed to the highest point of the PP by a bucket elevator, this mixture is separated into three grain size-
based fractions by a screen:
oversize: > 15 mm,
coarse: 3/15 mm,
medium: < 3 mm.
Page 25
Model based control framework for Site-wide OptimizatiON of data-intensive processes
Deliverable nr.
Deliverable Title
Version
D0.0
Process Industry Domain Analysis and Use Cases
0.03 - 13/01/2016
Page 25 of 110
The last two fractions are stored in holding silos. Their ratio is adjusted according to needs, by:
milling oversize (over-coarse) grains to be used as such using roll mills,
milling pat of the "Coarse" fraction using a hammer mill.
Part of the "Medium" fraction is directed to the main feed silo for a ball mill producing the last "Fines"
fraction. This mill is also fed with all dust fines collected by different anode shop filters (crushing of baked
recycled products, dedusting of anode baking furnace overhead traveling cranes, general PP dedusting).
A pneumatic conveyance system directs the dust fines produced by the ball mill to a classifier, which returns
oversize particles to the mill inlet for additional milling. Other dust fines are collected by a filter and stored in
a silo awaiting usage. These dust fines, smaller than 0.2 mm, contain 70 – 80% of fines smaller than 74
microns. Part of these fines passes through the mixing fume treatment center, where they are fixed by mixing
vapor adsorption in a Venturi-type reactor.
Figure 25 - Milling/Classification block diagram
Page 26
Model based control framework for Site-wide OptimizatiON of data-intensive processes
Deliverable nr.
Deliverable Title
Version
D0.0
Process Industry Domain Analysis and Use Cases
0.03 - 13/01/2016
Page 26 of 110
Figure 26 - Paste plant
2.1.5.3 Proportioning and mixing
Dry products (DPs) are obtained by mixing the three extracted fractions supplied at a constant rate by
continuous proportioning units.
The target DP grain size distribution is obtained by adjusting the grain size distribution and extraction rate of
each fraction. The follwing diagram shows an example of a frequently used DP grain size distribution. There
are others, depending on the anode characteristics sought.
Figure 27 - Example of DP grain size distribution
Page 27
Model based control framework for Site-wide OptimizatiON of data-intensive processes
Deliverable nr.
Deliverable Title
Version
D0.0
Process Industry Domain Analysis and Use Cases
0.03 - 13/01/2016
Page 27 of 110
A bucket elevator conveys the DPs to the highest point of the mixing line, which includes the following
forming stages:
preheating of DPs to 200 °C in a exchanger containing heat transfer fluid,
feeding of liquid pitch at 160 °C,
mixing of pitch and DPs at 180 °C,
mixing and cooling of paste produced at 150/160 °C,
green anode forming by compacting paste into molds,
cooling of green anodes.
The exchanger incorporates a trough containing the DPs and Archimedean screws ensuring their conveyance.
Preheating is performed by heat transfer fluid circulating inside the trough and screws, supplied at 280 °C by
an electrical boiler.
Paste temperature in the mixer is fixed to optimize the DP mix and blending of the pitch with the DPs.
Mixing intensity increases with:
temperature,
developed energy,
paste holding time.
We recall that the purpose of mixing is to produce a uniform paste, in which the binder coats the DP grains
and fills their porosity and intergranular space as much as possible.
Figure 28 - Proportioning/mixing block diagram
Page 28
Model based control framework for Site-wide OptimizatiON of data-intensive processes
Deliverable nr.
Deliverable Title
Version
D0.0
Process Industry Domain Analysis and Use Cases
0.03 - 13/01/2016
Page 28 of 110
2.1.5.4 Vibrocompacting
A weighing hopper alternately delivers doses of paste to two molds. Once filled, these molds are
transferred and locked to a vibrating table, then closed by a cover equipped with a pressing mass that rests
on top of the paste:
Figure 29 - Vibrocompacting sequence (LM: Left Mold / RM: Right Mold / WH: Weighing Hopper)
Vibrating tables are equipped with a pneumatic suspension and a system of eccentric masses that induces
vertical vibration at a frequency close to 25 Hz. Table vibration is transmitted to the paste by the cover, the
vertical oscillations of which cause the paste to compact within the mold by a succession of shocks.
Figure 30 - Vibrocompaction forming principle
Page 29
Model based control framework for Site-wide OptimizatiON of data-intensive processes
Deliverable nr.
Deliverable Title
Version
D0.0
Process Industry Domain Analysis and Use Cases
0.03 - 13/01/2016
Page 29 of 110
Figure 31 - Vibrocompactor
Vibrocompacting intensity results from optimizing forming parameters:
vibration cycle time (50 - 60 seconds),
cover pressure on paste (0.5 kg/cm2),
vibrating table excitation frequency (25 Hz),
suspension stiffness,
paste temperature.
Depending on the paste composition, some of these parameters may be adjusted (especially the
temperature, limited by the appearance of cracks).
We recall that the objective of anode forming is to minimize intergranular space, monitored by measuring
the dry density of each anode after the mold has been stripped.
After unmolding, anodes are at 140/150 °C and can easily deform. They are transferred to a cradle conveyor,
which transports them through a cooling tunnel, where they are sprayed with water for approximately one
hour. On leaving the tunnel, anode cores are still at their tunnel entry temperature, but their exterior has
been cooled to about 60 °C. This permits application of the different mechanical stresses during handling
operations, without risk of deformation. The cooling water is recycled.
2.1.5.5 Key parameters of the Paste plant
Table 4 – key parameters of the paste plant
Page 30
Model based control framework for Site-wide OptimizatiON of data-intensive processes
Deliverable nr.
Deliverable Title
Version
D0.0
Process Industry Domain Analysis and Use Cases
0.03 - 13/01/2016
Page 30 of 110
2.1.6 Baking anodes
2.1.6.1 Why are anodes baked?
The main goal is to bake the anode at requisite temperature to optimize anode properties and
performance in electrolytic pots (at optimized baking costs).
The anode has acquired many of its properties at the green stage. However, it does not conduct electricity
because of the nature of pitch and it could not sustain the temperatures and mechanical stresses
encountered in the electrolytic pots.
Anodes must be baked to reduce the pitch to an amorphous carbon state by coking and make them usable.
Figure 32 – anode properties changing at baking
Baking takes place in an open-type, moving fire furnace or in a ring furnace.
Coking occurs between 350 and 500°C and is accompanied by emission of pitch volatile matter (figure 33).
The pitch residue remaining within the anode is called "semi-coke". Its structure is far too different from that
of the matrix coke for the anode to be used in this condition.
Figure 33 - Baking principle 1
The semi-coke structure is changed by continuing baking above 500 °C until it resembles that of the matrix
coke, which results in a lowly reactive anode that is relatively insensitive to carbon dusting (figure 34).
Page 31
Model based control framework for Site-wide OptimizatiON of data-intensive processes
Deliverable nr.
Deliverable Title
Version
D0.0
Process Industry Domain Analysis and Use Cases
0.03 - 13/01/2016
Page 31 of 110
Figure 34 - Baking principle 2
From ambient to coking temperature, the pitch passes successively from a solid state through pasty and
liquid states to an ultimate gaseous state. This change of state makes the anode fragile during this baking
stage and cracks can result. This stage must therefore be performed at a rate of temperature rise not
exceeding 15 °C per hour.
Total baking time is between 150 and 170 hours and an equivalent time, at least, is required for the baked
anodes to be cooled to ambient temperature prior to usage, resulting in a total cycle of about 13-15 days.
2.1.6.2 Anode Baking Furnace description
Anodes are placed in pits separated by hollow flue walls, through which hot gases flow during the baking
phase and air flows during the cooling phase. The flue wall structure is internally reinforced by baffles and tie
bricks arranged to create uniformity not only of gas circulation, but also of thermal exchanges.
Figure 35 - General view of anode baking furnace with green anodes arriving
In the pits, anodes are completely covered with packing coke ensuring the following functions:
anode support during baking,
protection against oxidation by air,
transfer of exchanged energy between anodes and gases circulating inside flue walls,
insulation of pit tops to reduce thermal losses,
insulation of furnace against unwanted air infiltrations.
Page 32
Model based control framework for Site-wide OptimizatiON of data-intensive processes
Deliverable nr.
Deliverable Title
Version
D0.0
Process Industry Domain Analysis and Use Cases
0.03 - 13/01/2016
Page 32 of 110
A set of 8 parallal pits and 9 flue walls forms a furnace section. Sections are separated by headwalls through
which flue walls in the same row communicate from one section to the next, thereby forming individual flue
wall lines extending along the entire furnace.
The 34 sections of a furnace are arranged in two parallel 17-section bays, between which flue wall line
communication is ensured at the ends by crossover flues.
Each bay is contained within a U-shaped concrete casing, whose external walls are cooled by natural air
circulation; the casing interior is thermally protected by several thicknesses of insulating brickwork.
Flue walls and headwalls are built from alumino-silicate refractory bricks containing 45 – 55% alumina. Their
maximum service temperature is approximately 1,450 °C.
Figure 36 - View of anode baking furnace section
2.1.6.3 Description of a fire
A fire comprises:
6 sections in baking,
7 sections in cooling,
sections in handling and maintenance.
Gas circulation throughout the flue wall lines of a fire is established using a fume exhaust ramp installed at
one end of the fire and an air blowing ramp located 10 sections downstream. The exhaust ramp is connected
to a fume collection duct, linked to the fume treatment center (FTC), in which negative pressure is maintained
by the FTC exhaust fans. At the other end, cooling air is injected into the flue wall lines by individual fans
mounted on the blowing ramp.
The pressure difference in a flue wall line varies continuously between -100/-200 Pa at section 1 and
+100/+200 Pa at section 10. It is around 0 at section 7.
Page 33
Model based control framework for Site-wide OptimizatiON of data-intensive processes
Deliverable nr.
Deliverable Title
Version
D0.0
Process Industry Domain Analysis and Use Cases
0.03 - 13/01/2016
Page 33 of 110
Figure 37 - View of 2-fire, 34-section anode baking furnace
Three zones can be distinguished:
Preheating zone
In sections 1, 2 and 3, the fume temperature increasing from 300 to 900 °C raises the anode temperature
from ambient to 550/600 °C. Emitted between 300 and 500 °C, pitch volatile matter is sucked into the flue
walls through interstices between bricks, called degassing joints. The temperature within the flue walls at this
time is sufficiently high to cause combustion of the volatile matter. The energy produced, complemented by
the latent heat provided by fumes arriving from the heating zone, ensures the total energy requirements of
the preheating function. Throughout preheating, anodes are in a plastic state exposing them to risks of
deformation and cracking, which are prevented by imposing a baking rate of less than 15 °C/h and anodes
well supported by the packing coke.
At 500 °C, pitch is converted into semi-coke, but baking continues right up to 1,100 °C to reduce the
structural difference between binder and matrix cokes to a minimum.
Heating zone
Fume temperature at sections 4, 5 and 6 is raised from 900 to 1 150/1 200 C, then maintained at this level by
burner ramps that inject gas or fuel-oil into the flue walls. Simultaneously, the anode temperature rises from
550/600 to 1,100 °C, the temperature at which the binder coke acquires a structure similar to that of the
matrix coke.
The final anode baking temperature is adjusted to the nearest 20°C, according to the type of packing coke.
Blowing zone
At sections 7 to 10, anodes are subjected to an initial cooling action from air supplied by the blowing ramp.
This air is then directed to the heating zone, where it ensures oxygen requirements for combustion of the gas
or fuel-oil injected by the burner ramps. Energy accumulated by exchange with anodes being cooled
represents the third energy input for anode baking, after combustion of gas or fuel-oil and volatile matter
respectively.
Page 34
Model based control framework for Site-wide OptimizatiON of data-intensive processes
Deliverable nr.
Deliverable Title
Version
D0.0
Process Industry Domain Analysis and Use Cases
0.03 - 13/01/2016
Page 34 of 110
Forced cooling zone
Beyond section 10, anodes are subjected to a second cooling action by air blown from a second ramp of
fans, but energy recovery does not take place at this stage.
The following diagram shows typical temperature profiles in pits and flue walls throughout the 10 sections
located between the exhaust and blowing ramps.
Figure 38 - Gas and anode temperature profiles
2.1.6.4 Fire moving period
After each period of 24 to 32 hours, both the exhaust ramp and the blowing and cooling ramps are moved
forward by one section, the last burner ramp being transferred upstream of the heating zone.
This operation causes the fire to enter a new section of green anodes and, at the other end of the furnace,
releases a section of baked anodes, which goes into cooling. Further downstream again, a cooled section is
released and becomes available for coke and baked anode unloading.
The following diagram represents the different baking stages to which a given section is subjected. It can be
seen that 6 periods are required to bake a section and 7 periods to cool it completely (4 blowing and 3
forced cooling periods).
For a 28-hour fire moving period, baking and cooling times are therefore as follows:
baking: 6 x 28 = 168 hours,
cooling: 7 x 28 = 196 hours,
total time: 13 x 28 = 346 hours.
Fire production varies inversely with the fire moving period. At 24 hours, it is one section per day, i.e. 140
anode tonnes; at 28 hours, it is reduced by 24/28, i.e. to 120 anode tonnes per day, etc.
Page 35
Model based control framework for Site-wide OptimizatiON of data-intensive processes
Deliverable nr.
Deliverable Title
Version
D0.0
Process Industry Domain Analysis and Use Cases
0.03 - 13/01/2016
Page 35 of 110
Figure 39 - Successive baking phases for a furnace section
2.1.6.5 Heating equipment
Heating equipment includes:
1 exhaust ramp,
burner ramps,
1 blowing ramp,
1 cooling ramp.
The exhaust ramp features fume flow control dampers and a device for measuring fume flows and
temperatures in each flue wall line.
Each heating ramp is fitted with a pair of burners and one control thermocouple per flue wall. Burners are
arranged either with the flow for gas or against the flow for fuel-oil, to improve fuel combustion.
Figure 40 - Heating with flow (gas) and against the flow (fuel-oil)
Page 36
Model based control framework for Site-wide OptimizatiON of data-intensive processes
Deliverable nr.
Deliverable Title
Version
D0.0
Process Industry Domain Analysis and Use Cases
0.03 - 13/01/2016
Page 36 of 110
Blowing and cooling ramps have one fan per flue wall. Blowing ramp fans are driven by variable speed
motors to control blowing air flow.
Each ramp has its own PLC that controls locally the measuring, alarm and actuator control functions.
PLCs are network-linked to a central baking process control and supervision system.
Figure 41 - Fire structure and heating equipment
2.1.6.6 Handling operation
The anode baking furnace is tended by one or more multi-purpose overhead traveling cranes or furnace
tending assemblies (FTAs), fitted with a telescopic grab for gripping and picking up sets of anodes, and an 80
t/h capacity packing coke suction and restitution device.
Figure 42 - FTA anode grab
Page 37
Model based control framework for Site-wide OptimizatiON of data-intensive processes
Deliverable nr.
Deliverable Title
Version
D0.0
Process Industry Domain Analysis and Use Cases
0.03 - 13/01/2016
Page 37 of 110
This device comprises a hopper connected to telescopic suction and restitution pipes. When unloading pits,
the suction pipe extracts coke by creating negative pressure in the hopper using a vacuum system
comprising a vacuum pump and a dedusting filter. When loading pits, coke is placed in the pits using the
restitution pipe fed from the bottom of the hopper.
Figure 43 - Packing coke suction
Coke dust fines collected by the filter are transferred on the ground to a storage hopper, from where they are
conveyed to the Paste Plant for recycling with the DP fines fraction.
After cleaning, the baked anodes are stored or directed to the rodding area.
Generally, the time required to load and unload a complete section is equivalent to one 8-hour shift. One FTA
is therefore enough to tend two fires. In practice, the small capacity of the FTA hopper compared with the
volume of coke transferred means that loading and unloading sequences must be alternated between
different sections.
2.1.6.7 Brickwork maintenance
The term brickwork designates all furnace refractory material construction, essentially the flue walls and
headwalls.
Several factors are responsible for brickwork deformation with time:
falsification (alteration) of alumino-silicate refractory material caused by sodium and fluorine in
anodes,
expansion and contraction stresses due to thermal cycles,
stresses applied by anodes and packing coke to flue walls during handling operations and
baking/cooling cycles.
Flue walls are affected by deformation and cracking, to the point where proper process performance is
seriously compromised. Their service life can be prolonged by implementing the following actions:
aim for an anode sodium content that is as low as possible (~150/200 ppm),
control the process according to stringent procedures, especially furnace loading and unloading
operations,
maintain brickwork at each fire moving, especially the expansion joints at junctions between flue
walls and headwalls, so that flue walls can move freely.
Implementation of these actions largely conditions flue wall service life, which usually varies between 80 and
160 fire rotations, i.e. 4 to 8 years.
Old flue walls are demolished and removed from the furnace using a grab. they are replaced by new flue
walls prefabricated outside the furnace. One 8-hour shift is required to replace an internal flue wall and two
shifts for an external flue wall. Lifting operations are ensured by the multi-purpose overhead traveling crane
fitted with a 25 tons hoist.
Page 38
Model based control framework for Site-wide OptimizatiON of data-intensive processes
Deliverable nr.
Deliverable Title
Version
D0.0
Process Industry Domain Analysis and Use Cases
0.03 - 13/01/2016
Page 38 of 110
Figure 44 - Demolition of an old flue wall at Aluminium Dunkerque
2.1.6.8 Fumes treatment
Fumes extracted from the furnace contain various impurities, in particular:
tars (unburnt volatile matter and fuel - gas or fuel-oil),
carbon dust fines (unburnt and packing coke),
fluorine emitted by the bath traces coming from recycled fraction contained in anodes,
sulfur dioxide produced especially by combustion of gas or fuel-oil.
Owing to their impurity concentrations (100 - 200 mg/Nm3 for each of the first three and 500 mg/Nm
3 for
the fourth), these fumes cannot be discharged as such and must be subjected to treatment to reduce their
impurity contents to acceptable levels.
A fume treatment process, based on the reactive alumina property of fixing tars and fluorine by adsorption, is
employed to achieve acceptable impurity levels. Charged alumina is collected by filtration, along with the
carbon dust fines, then recycled via the electrolytic pots. This process has no effect on the sulfur dioxide and
low sulfur content fuels must be used to limit SO2 emissions.
The ABF fume treatment center (FTC) includes:
a cooling tower, where the temperature of fumes leaving the furnace (200/150 °C) is stabilized at 100
°C by controlled water spray,
several alumina-fed reactors,
an equivalent number of filters,
exhaust fans,
a system of valves directing fumes to an emergency stack in the vent of FTC malfunction,
an alumina handling and flow control system,
storage silos for fresh alumina feeding the reactors and charged alumina collected by the filters.
A baking furnace FTC producing 250 kt/y has a capacity of approximately 150,000 Nm
3/h and consumes
around 40 tonnes of fresh alumina per day, resulting in production of a large quantity of charged alumina.
With trapping efficiencies of over 95%, concentrations of gaseous effluents emitted with treated fumes are
reduced to several factors of 10 lower than those at the FTC intake.
Page 39
Model based control framework for Site-wide OptimizatiON of data-intensive processes
Deliverable nr.
Deliverable Title
Version
D0.0
Process Industry Domain Analysis and Use Cases
0.03 - 13/01/2016
Page 39 of 110
Figure 45 - Anode baking furnace fume treatment center (FTC)
2.1.6.9 Transformation of the anode during baking
Table 5 – transformation of the anode during baking
2.1.6.10 Key parameters of the baking furnace
Level of baking:
If level too low, then:
o anode resistivity too high => increased energy consumption;
o increased anode consumption;
o increased anode reactivity and dusting in the pots reducing cell current efficiency.
If level too high, then higher operating cost.
Flue wall service life:
Average service life: 50–170 fire cycles (open furnace).
Page 40
Model based control framework for Site-wide OptimizatiON of data-intensive processes
Deliverable nr.
Deliverable Title
Version
D0.0
Process Industry Domain Analysis and Use Cases
0.03 - 13/01/2016
Page 40 of 110
Average: about 20 fire cycles per year.
Factors influencing service life:
o design of furnace and flue walls;
o refractory lining quality;
o sodium content in anode;
o heating equipment performance characteristics;
o quality of baking process operations;
o quality of handling operations;
o quality of flue wall routine maintenance operations.
2.1.7 Anode Assemblies Rodding anodes
2.1.7.1 General
In the anode rodding shop, anode assemblies returning from the potroom are cleaned and stripped of
bath, spent anodes and cast iron, which are processed for re-use.
Stems and hexapods are then inspected and repaired if necessary, before new anodes are rodded with them
using molten cast iron.
Page 41
Model based control framework for Site-wide OptimizatiON of data-intensive processes
Deliverable nr.
Deliverable Title
Version
D0.0
Process Industry Domain Analysis and Use Cases
0.03 - 13/01/2016
Page 41 of 110
Figure 46 - Rodding shop overview
In the rodding shop, cooled anode assemblies are suspended from an overhead conveyor, which moves
them to the different processing stations installed at ground level. Conveyor lengths between stations are
designed to allow storage in accordance with actual production and OEE of each of them.
Figure 47 - Rodding shop processing stages – functional blocks
POTROOM
COOLING PROCESSING BAIN
AA HOOKING/UNHOOKING
AA INSPECTION
RODDING
STEM/ANODE ASSEMBLY TIGE/ANODE
GRAPHITE COATING
CAST IRON MELTING
CAST IRON SHOTBLASTING
STEM/PIN INSPECTION
REPAIRS
BATH BREAKING
FINISHING
SHOTBLASTING
ANODE BREAKAGE
THIMBLE STRIPPING
PASTE PLANT RECYCLED PRODUCT PROCESSING
BAKING FURNACE
Page 42
Model based control framework for Site-wide OptimizatiON of data-intensive processes
Deliverable nr.
Deliverable Title
Version
D0.0
Process Industry Domain Analysis and Use Cases
0.03 - 13/01/2016
Page 42 of 110
2.1.7.2 Cooling
Before entering the rodding shop, AAs must be cooled to a temperature below 100 °C, compatible with
allowable temperatures for the machines equipping the different processing stations.
Spent AAs are therefore immobilized on transport pallets stored in a building. Cooling is by natural
ventilation and, on average, requires a holding time of five 8-hour shifts to ensure a temperature drop from
800/900 °C to 80 °C.
Figure 48 - Cooling the spent anodes
2.1.7.3 Hooking / Unhooking
The following functions are performed at this station:
introduction and setting down of a pallet of 3 cooled AAs, transported from stock by special vehicle,
onto a transfer gantry,
hooking of AAs onto overhead conveyor trolleys and departure to next processing station,
tilting of unloaded pallet above a bath pit to evacuate remaining bath crusts,
setting down of new AAs onto clean pallet,
picking up of pallet by the special vehicle for storage, awaiting usage by potroom.
2.1.7.4 Bath removal
This station features a first so-called breaking machine, whose purpose is to break up covering bath crust
by means of punches thrusting horizontally between the pins.
The next finishing stage features two machines working in parallel, in which pieces of bath still cemented
around the pins, in cavities or between anodes, are removed using hydraulic breakers. For greater efficiency,
AAs are unhooked and tilted horizontally, then replaced in their initial position on completion of finishing.
The functions of this station are automatic, except for the finishing breakers, which are controlled by
operators.
2.1.7.5 Shotblasting
Bath films remaining at various places, especially beneath the anodes, are removed at this station by
shotblasting performed by a turbine unit. The shot is recycled after separation of carbon dust fines and bath.
Page 43
Model based control framework for Site-wide OptimizatiON of data-intensive processes
Deliverable nr.
Deliverable Title
Version
D0.0
Process Industry Domain Analysis and Use Cases
0.03 - 13/01/2016
Page 43 of 110
Figure 49 - Cleaned spent anodes
2.1.7.6 Anode breakage
After shotblasting, the AAs are introduced into an automatic press that breaks up the spent anodes. Pieces
of anode are evacuated by a conveyor supplying the recycled carbon product crushing shop.
2.1.7.7 Thimble stripping
This station features automatic presses that pull off the cast iron thimbles still encasing the pins after anode
breakage.
Pieces of cast iron recovered are cleaned of residual bath and carbon scale by shotblasting, then stored in a
hopper awaiting recycling for new roddings.
Figure 50 - Thimble stripping press
2.1.7.8 Inspection
Prior to re-use, anode stems are subjected to inspection involving:
stem and hexapod geometry (stem straightness and pin center-to-center distance),
condition of stem surface in contact with pot beams,
condition of clads,
state of wear of pins and hexapods.
Non-conforming stems are unhooked and dispatched for repair in a smelter shop or at a subcontractor.
Page 44
Model based control framework for Site-wide OptimizatiON of data-intensive processes
Deliverable nr.
Deliverable Title
Version
D0.0
Process Industry Domain Analysis and Use Cases
0.03 - 13/01/2016
Page 44 of 110
2.1.7.9 Graphite coating
To facilitate subsequent thimble stripping, pins are dipped in a liquid containing graphite powder in
suspension, then dried by crossing gas burner ramps.
2.1.7.10 Rodding
New AA fabrication at the rodding bench comprises the following operations:
unhooking of a stem and assembly with new anodes,
pouring of liquid cast iron into first row of anode holes,
rotation of AA through 180°,
casting into second row of anode holes,
hooking of AA onto conveyor.
Liquid cast iron is obtained by melting of recycled and cleaned cast iron charges in crucible induction
furnaces heated to 1,450/1,500 °C. Cast iron is transferred from induction furnaces to the rodding bench by a
trolley carrying a casting ladle.
Good rodding resistance requires the cast iron to have the following properties:
low shrinkage to reduce anode voltage drop and ensure a strong mechanical connection through
good cast iron contact with the pins and anode carbon,
low resistivity to reduce anode voltage drop,
mechanical strength suited to thimble stripping.
These properties are obtained with gray cast iron containingusing very tight composition specification.
This composition tends to deviate with successive recycling and is kept constant by adding alloying elements
during charge melting.
Figure 51 - Anode/stem mating station
Page 45
Model based control framework for Site-wide OptimizatiON of data-intensive processes
Deliverable nr.
Deliverable Title
Version
D0.0
Process Industry Domain Analysis and Use Cases
0.03 - 13/01/2016
Page 45 of 110
Figure 52 - Melting cast iron in an induction furnace (1 450°C)
Figure 53 - Cast iron pouring station
2.1.7.11 Inspection of new AAs
Before being directed to the unhooking station, new AA roddings are inspected and the top of the anodes
is cleared of possible cast iron spillages, which worsen the iron content of the metal produced.
2.1.7.12 Bath treatment
Bath recovered at the cleaning and hooking/unhooking stations is directed to a crushing and classification
shop by a conveyor system.
This shop also handles bath crusts arriving directly from the potroom, produced when placing anodes.
Pots also produce liquid bath in excess, which is recovered by tapping the pots.
Page 46
Model based control framework for Site-wide OptimizatiON of data-intensive processes
Deliverable nr.
Deliverable Title
Version
D0.0
Process Industry Domain Analysis and Use Cases
0.03 - 13/01/2016
Page 46 of 110
2.1.7.13 Treatment of recycled carbon products
Baked recycled carbon products are made of spent anodes recovered at the rodding shop breaking station
and a very much smaller proportion of whole anodes rejected at baking.
Green recycled products come from the paste and green anodes rejected at the paste plant.
To be suitable for re-use in the paste plant, recycled carbon products must be milled to a 0/30 mm grain size
distribution, which requires three reduction stages owing to their original dimensions.
The three crushers are interlinked by belt conveyors carrying the recycled carbon products. Magnetic
separators protect them from metallic parts, that could damage them (pins and cast iron shells).
Green recycled products are separately processed in campaigns undertaken during rodding area stoppages.
Shop dedusting fines are stored and dispatched to the PP for re-use.
Figure 54 – treatment of recycled carbon products
2.1.7.14 Key parameters of the rodding shop
Excellent conductivity of stems and pins: Cleanliness and purity of the cast iron
Excellent cleaning of the butts: Minimum amount of sodium (Na) in the baked anodes
Absence of deformation in the anode assemblies (vertical straightness)
Minimum treatment cost
Page 47
Model based control framework for Site-wide OptimizatiON of data-intensive processes
Deliverable nr.
Deliverable Title
Version
D0.0
Process Industry Domain Analysis and Use Cases
0.03 - 13/01/2016
Page 47 of 110
2.1.8 Introduction to the electrolysis process
The reduction of alumina into primary aluminium is a continuous electrochemical process at high
temperature, happening in so called electrolytic pots.
2.1.8.1 The main steps of electrolysis
During the electrolysis process, anodes are continuously consumed in the pot (1 anode = 28 days).
Cathodes are not (although 5-6 years practical life).
Figure 55 - The main steps of electrolysis
2.1.8.2 Bath, Alumina, Anode and Electrical Energy
Electrolytic bath:
The reduction process is taking place in a very thin bath layer inserted between the anodes and the metal
layer above the cathode. The bath is characterized by its chemical composition and its operating
temperature.
Figure 56 – electrolytic bath
The main role of the electrolytic bath is to dissolve alumina while conveying the current through the pot.
Composition:
Cryolite (Na3AlF6) 79 - 80 %
Alumina (Al2O3) 2,5 %
Page 48
Model based control framework for Site-wide OptimizatiON of data-intensive processes
Deliverable nr.
Deliverable Title
Version
D0.0
Process Industry Domain Analysis and Use Cases
0.03 - 13/01/2016
Page 48 of 110
Aluminium fluoride(AlF3) 11,5 - 12 %
Calcium fluoride (CaF2) 5 - 6,5 %
Others 1 %
Factors to be considered when selecting bath chemistry
Current efficiency.
Fluoride emissions.
Pot operation.
Crust hardness.
Alumina dissolution.
Electrical conductivity.
Technology/monitoring system.
Alumina (Al2O3):
Role:
Raw material to produce aluminium.
Adsorb fluoride emissions.
Cover anodes and reduce their oxydation.
Thermal insulation (crust).
Physico-chemical characteristics:
purity (Fe, Si, Zn, Na2O, CaO, P2O5),
grain size distribution (particularly the fine part),
specific surface (SSA),
density,
attrition.
Anode:
Refer to previous chapters.
Electrical energy:
Role
allow the electrolytic reaction,
provide heat through Joule effect to compensate the heat losses and to keep the bath liquid.
Characteristics:
direct current,
stable amperage.
Power = U x I = R x I2
Electrical energy consumption is measured in kWh (V x kA x h)
2.1.8.3 Current Efficiency and potline production
Three electrons are required to produce one aluminium atom, i.e.: 96 485 A for 1 s 8.993 g Al
Consequence (Faraday’s law): Relationship between theoretical daily production P (kg of Al) and pot
amperage (in kA): P (kg / day) = 8.053 x I (kA)
Ex : if pot amperage I = 380 kA (380 000 A) then Ptheoretical = 3060 kg Al per day
Page 49
Model based control framework for Site-wide OptimizatiON of data-intensive processes
Deliverable nr.
Deliverable Title
Version
D0.0
Process Industry Domain Analysis and Use Cases
0.03 - 13/01/2016
Page 49 of 110
Current (Faraday) efficiency:
Amount of metal actually PRODUCED / Actual amount POSSIBLE
If current efficiency = 100% then: Actual production = Theoretical production
Current Efficiency is not at 100% because:
The aluminium produced redissolves into the bath and reoxidizes with CO2;
Other metals (undesirable) are electrolyzed at the same time than aluminium.
In industrial reality, current efficiency is nowadays between 92 and 96 %.
The annual aluminium production of a plant with the following characteristics:
400 pots
94% current efficiency (typical value)
300 000 amperes
Daily production = 8.053 x CE (%) x Current (kA) x nb pots
is 331 558 tons.
2.1.8.4 Thermal Balance
The overall thermal balance of a pot has to be maintained in almost real time, taking into account inputs,
losses and used energy.
Power input (RxI2) is the setting variable of the thermal balance:
Global potline cooling/heating trend will trigger a reaction on the common parameter, ie. I
Individual pot imbalance will trigger a reaction on the specific pot parameter, ie its individual
resistance
Therefore, managing a pot/potline is largely managing a heat and power balance where 50% of the input is
useful production related energy to heat, dissolve the raw materials and electrolyse them, and 50% is
dedicated to heat losses management
Figure 57 - Thermal balance (AP 35 technology)
Page 50
Model based control framework for Site-wide OptimizatiON of data-intensive processes
Deliverable nr.
Deliverable Title
Version
D0.0
Process Industry Domain Analysis and Use Cases
0.03 - 13/01/2016
Page 50 of 110
Thermal balance and Voltage drop:
Figure 58 - Voltage drop (AP 35 technology)
The biggest lever to set the power input is the variable resistance within the 3 cm bath layer. This bath
resistance can be calculated in the following formula:
Bath resistance = resistivity * anode to metal distance / pot surface
The pot surface being a structural given based on the technology, and the resistivity being related to the
bath composition which is kept more or less stable and constant, the adjustment variable is indeed the
anode to metal (or interpolar) distance. This variable is adjusted by raising or lowering the anodic beam to
which all the anodes assemblies are connected.
2.1.8.1 Anode effects
When accidently reaching a low level of alumina concentration in the bath or a too high anodic current in
one specific anode, the electrolysis reaction does change. Instead, AlF3 – a bath component - is electrolyzed,
according to the following reaction:
y/3 AlF3 + x C CxFy + y/3 Al
This parasitic reaction is in fact generating Per-Fluoro-Carbon (PFC’s) which have a strong green house effect.
The main are CF4 and C2F6, with respectively a greenhouse effet of 6900 and 12500 times CO2. Besides the
detrimental effet in terms of global warming, these anodic gases have a very strong superficial tension and
tend to block the anodic surface by a non conductive bubble. This electrical insulation generate a strong
increase in heat generation through Joule effet in the bath, with possible catastrophic consequences if not
treated timeously.
The process control system is able to prevent this incident to happen most of the time. In average, one
particular pot will have an anode effet every 4 to 5 days, and this will be automatically treated by the process
control system within seconds. But in some cases, this event cannot be treated automatically (5% of the
cases) and need a manual intervention.
Anode effect rate and duration are the two parameters quantifying the level of disturbance to the process
associated to this event.
Page 51
Model based control framework for Site-wide OptimizatiON of data-intensive processes
Deliverable nr.
Deliverable Title
Version
D0.0
Process Industry Domain Analysis and Use Cases
0.03 - 13/01/2016
Page 51 of 110
2.1.8.2 Magneto-Hydro-Dynamic (MHD) balance
The second main equilibrium to be maintained in a pot is the MHD balance.
Any conductor crossed by a direct current generates a magnetic field B.
Conductors crossed by a current I in a magnetic field B, are submitted to a Laplace Force
Liquid bath and metal are indeed conductors at 960° seeing a current and and are at the same time
immersed in a magnetic field generated by all the conductors surrounding the pots and conveying the
current from one to the other. In application of the physics principle expressed here above, both bath and
metal will be submitted to the Laplace forces that will make them move in the pot trough.
They move permanently at a variable speed depending on the busbar design and pot operation and state.
MHD behavior modeling of a given technology is key for the design as it warranties that these movements
are minimum and predictable.It cannot be avoided to have a metal / bath pad deformation due to Laplace
forces, but the design has to provide a naturally stable deformation to keep anode to metal distance under
control:
This is defined by position and current distribution in the pot-to-pot busbar
Besides basic design, process adjustments or out of standard pot operation may have a catastrophic
effect on MHD stability
MHD instability can be detected on real-time pot resistance
Figure 59 - Metal pad speed and Metal pad deformation
2.1.8.3 The main operations
The main operations are typically based on a 32 hours (or 4-8h shifts) cycle:
Anode change – happens every 32 h on a given pot. An anode last 28 days.
Anode covering – idem, synchronised with anode change. This operation consists in protecting the
new anode by a cover made of a miw of crushed solid bath and alumina, and aims at protecting the
anode against air-burn. Another benefit is to keep the heat inside the pot and therefore save some
energy consumption.
Metal tapping: the metal production of the 32 hours is retrieved from the pot in one batch, using a
tapping ladle.
Anode beam raising - every 14 days or so.
Page 52
Model based control framework for Site-wide OptimizatiON of data-intensive processes
Deliverable nr.
Deliverable Title
Version
D0.0
Process Industry Domain Analysis and Use Cases
0.03 - 13/01/2016
Page 52 of 110
Operations do impact the process and its KPI’s. Each of these operations are characterised by typical KPIs
allowing quality assessment.
2.1.8.4 Highlight on Anode Changing operation
An anode cycle is the service life of an anode assembly. It is expressed in number of shifts or hours.
In practice, an anode assembly is changed every 80 8-hour shift, i.e. 42 cm (80 x 0.526 = 42 cm) of wear and a
6 cm margin (in reality less, as wear occurs from the top).
At end of life, 4 to 5 cm of carbon safety margin is maintained for:
Faster wear rate of anode blocks, depends on anode current density, density, overconsumption
factor (mainly corrosion in air);
high bath height;
operating delays;
an anode effect: on anode squelching anode bottom level drops by 1 cm = bath rises by 5 to 6 cm
(PISTON effect).
Figure 60 - Maximum usable height
Figure 61 - Safety margin
Anode change order rules:
Anode assembly # 1 is on the upstream fume aisle end.
first anode assembly 1 is changed, then anode assembly 15 and lastly anode assembly 18.
Change assemblies in different quarters of the pot in turn.
Never change adjacent anode assemblies consecutively.
Space out corner anode assemblies as well as possible.
Simplify setting under the positive risers (dimensions to be respected).
Ensure a number of shifts close to half the cycle between changed anode assemblies that are
adjacent to or facing each other.
One anode assembly every 32 hours.
Page 53
Model based control framework for Site-wide OptimizatiON of data-intensive processes
Deliverable nr.
Deliverable Title
Version
D0.0
Process Industry Domain Analysis and Use Cases
0.03 - 13/01/2016
Page 53 of 110
Figure 62 - Anodes position and change order in AP30 technology pot
Note that operating delays on anode change may adversely affect pot operation.
Anode change order in one particular pot is given in the specifications. Once the potline is in operation, it is
very hard and even pointless to modify this order.
Should anode problems occur with several anode assemblies used, it is recommended to try to retrieve hot
anode assemblies to avoid having several cold anode assemblies in the pot at the same time.
Anode assembly gauging:
Figure 63 - Correct anode assembly gauging
Gauging is important to insure the proper setting of the new anode, with its bottom interface at the
same height above the metal pad than the spent anode that has been retrieved. This insures the
proper MHD stability after anode change and a good current distribution in all the anodes after the
operation.
Gauging quality depends on:
the gauge condition,
the position of the anode assemblies on the gauge base,
the condition of the underside of the spent anode assembly,
the importance of gauge condition and cleanliness,
Page 54
Model based control framework for Site-wide OptimizatiON of data-intensive processes
Deliverable nr.
Deliverable Title
Version
D0.0
Process Industry Domain Analysis and Use Cases
0.03 - 13/01/2016
Page 54 of 110
Gauging quality is characterised by the anodic current distribution measured after the operation.
Crustbreaking:
limit stresses on the clad, when removing spent anode,
clear the location for the future anode assembly,
avoid picking up very large pieces with the crust shovel,
avoid uncovering adjacent anode assemblies,
avoid sending for cleaning anode assemblies with cover product wings.
Moreover, incorrect crustbreaking results in:
introduction of alumina, disrupting alumina feed control,
solid bath deposits on the cathode, resulting in insulation and instability.
To avoid insulating the cathode, a mechanised shovel is used to remove the crusts and passed as
many times as necessary to clean the anode cavity before setting the new one.
Figure 64 - Main anode changing steps: crust breaking, extraction, crust removal, anode gauging, insertion and covering
Anode covering: Covering the new anode assembly with covering product mix (bath + alumina) allows pot’s
thermal insulation and limit oxidation.
The anode covering is done several hours after anode change to limit pot contamination with the crushed
bath. Delay between anode change and covering is a quality indicator, as well as the volume of cover
material being poured on the new anode and visual quality control of the cover integrity.
Measurement of anode current distribution:
The purpose of this operation is to monitor current flowing through the anode assembly (relationship of
proportionality between voltage and current).
The measurement is taken 16 hours later anode changing.
Normal value: 1.4 to 1.9 mV on AP-30. If the value is higher than 1.9 mV, the anode assembly will be raised.
Many factors cause the value read to vary:
anode problem,
polarized anode assembly,
anode assembly age,
partially insulated cathode,
very low or very high bath height,
anode stem/beam connection quality.
Page 55
Model based control framework for Site-wide OptimizatiON of data-intensive processes
Deliverable nr.
Deliverable Title
Version
D0.0
Process Industry Domain Analysis and Use Cases
0.03 - 13/01/2016
Page 55 of 110
Figure 65 - Anode current distribution measurement
There is a general trend to move towards continuous anodic distribution measurement instead of punctual
ones. Continuous measurement is seen as a prerequisite for a performing anticipative process control.
2.1.8.5 Key levers of the electrolysis area
Main technical indicators driving value creation:
Amperage: average value flowing through the electrolytic pots to produce metal (kA).
Current efficiency: ratio of the metal tonnage really produced over the theoretical tonnage expected
as per the amperage used (%).
Energy consumption: average DC energy consumed to produce metal (MWh/t Al).
Pots in operation: average of pots in operation in the aluminium smelter (pots).
Net carbon consumption: carbon mass consumed to produce metal (kg C/t Al).
Main KPIs related to HSE and right to operate:
Anode effects (CO2 equivalent emission):
o Anode Effect Frequency (AEF): average number of anode effects per pot and per day.
o Polarization duration: average time during which voltage is higher than ~ 8 V.
o Anode effect overvoltage.
Fluorinated emissions:
o Mass of fluorine discharged into the atmosphere per tonne of Al: at the potline roof and at
the scrubber stack.
All injuries frequency rate
Professional illnesses rate
2.1.9 Main KPIs to drive production
2.1.9.1 Key Performances Indicators of the carbon area
Baked anode density per anode
Resistivity (MIREA measure)
Net carbon consumption (butt weight)
Sodium content in butts and anodes
Binder (pitch) content in anode
Furnace fluewall life duration
Page 56
Model based control framework for Site-wide OptimizatiON of data-intensive processes
Deliverable nr.
Deliverable Title
Version
D0.0
Process Industry Domain Analysis and Use Cases
0.03 - 13/01/2016
Page 56 of 110
Furnace energy consumption
Number of anode produced / number of incidents in potline
Pins / Clads replacement rates
Sulfur emissions…
2.1.9.2 Key Parameters Indicators of the electrolysis area
In real time > shift level: measured / calculated by the pot-microcomputer
Pot Instability, number of instable pots
Average pot resistance energy consumption
Anode effect rate – pots with anode effects
Anodic incidents (spikes, broken anodes, etc)
Potline normal/scheduled events : operations, delays, measurements, etc
Potline abnormal events: power outages, pot stoppages…
At day/32h timescale > week/month: given by potline system
Metal quality and quantity produced,
Alumina and anode quality
Manual measurements (bath T and comp., cathodic/anodic voltage drops, anodic current
distribution…)
Current efficiency
Potline energy consumption
Trends,
Potline standard deviations – individual outlier pots
Long term
General potline trends, global adjustments, production strategies
2.1.9.3 The challenge of electrolysis
The usual electrolysis industrial challenge is to increase production as much as possible while keeping the
costs as low as possible. Most of the Key Performance Indicators quantifying these are in fact process related:
Increase production by increasing:
o amperage; process related
o the number of pots in operation;
o current efficiency. process related
Reduce costs by:
o reducing energy consumption; process related
o increasing current efficiency; process related
reducing energy costs;
o reducing raw material consumption & costs. process related
Reduce emissions (GHG and fluorinated emissions) process related
Meet customer requirements (metal purity) process related
Zero injuries partially process related
Therefore, process control is a critical aspect of the aluminium industry profitability and sustainability.
2.1.10 Gas treatment and environment
The process is emitting a number of different types of pollutants in the two main processes described
above. The most important are the fluorides, gaseous or within the particulates released.
Page 57
Model based control framework for Site-wide OptimizatiON of data-intensive processes
Deliverable nr.
Deliverable Title
Version
D0.0
Process Industry Domain Analysis and Use Cases
0.03 - 13/01/2016
Page 57 of 110
Emissions at the pot = what is generated by the pot or by the process.
Atmospheric release = what goes into the atmosphere, with or without treatment.
Figure 66 – emissions and gas treatment principle
Modern potlines, with typical bath composition do emit around 35 kg of total fluorides per ton of aluminium.
Most of these fluorides are collected in the pots or in the anode bake furnace and stopped/treated in the gas
treatment centers or fume treatment center. The same goes for the tars and PAHs which are generated in the
carbon plant at anode production stage. In addition, all the dust collected in the processes are as well
treated.
The following collection methods are employed:
Gaseous fluorides and light tars adsorption + filtration
Heavy tars condensation + filtration
Dust and fluoride particles filtration
SO2: partially caught by the alumina then re-emitted.
Nevertheless, the following 3 main pollutants are released in small fractions in the air:
Fluorides 0.4 kg/t Al (99% collection/treatment efficiency)
SO2 15 to 25 kg/t Al (totally re-emitted – no constraints on SO2 emission)
Greenhouse gasses 1.5 to 5.4 t CO2e/t Al (the most modern plants are in any case below 2 t
CO2e/t Al)
Other pollutants: dust, tar
The 3 main pollution source locations to treat: Electrolysis, anode baking furnace and paste plant.
Page 58
Model based control framework for Site-wide OptimizatiON of data-intensive processes
Deliverable nr.
Deliverable Title
Version
D0.0
Process Industry Domain Analysis and Use Cases
0.03 - 13/01/2016
Page 58 of 110
2.2 Plastics industry domain
In plastic domain we are considering injection molding process industries to implement the concept of
MONSOON. The injection molding production technology has emerged as the main vehicle to produce
highly complex, precise, value-added commercial parts with tight tolerance and surface finish. Because of this
success, there is a sustained pressure for increased standards of part quality while requiring reduced product
development time and work-cell costs. Additionally, within the last 10 years the constant demand of diversity
and customization in the sector of plastics industry has led to more and more molds with smaller and smaller
batch production making the tuning of production cells extremely challenging because of the product time-
to-market decrease. This is not to mention the globalization factor leading to more frequently process lines
transfers from one production plant to another during a product life. These process lines still have to
produce good parts within minimum time of process validation and setup assessments.
Due to these new manufacturing constraints, it can be argued that the requirements and standards directed
to the injection molding industry often exceed their capabilities. For service-oriented industry this leads
towards long development cycles, increased tooling costs, low process yield and inferior product quality. The
MONSOON concept will address these issues to improve the overall production process through integrating
data oriented process control and monitoring systems.
2.2.1 Injection molding process in general
Under the MONSOON -Plastic Domain use cases are concentrating towards the injection molding industry.
Injection molding production process represents 2/3 of the overall number of plastic parts manufactured.
Almost 90% of the total high-tech polymer materials production is processed by injection molding, from
which 8.5% polymers are used for the production of communication or electronic products, 8% for
automotive products, 3% for medical equipment, 33% for small house appliances and 42% for sport, toys and
packaging and other high quality products. The actual market is very demanding and, and the production of
plastic pieces is changing from a low quality mass production to high quality injection processes, where the
pieces obtained must comply with rigorous quality tests. The characteristics of a certain piece do not depend
only on the raw material, but also on the process of transformation used in its fabrication. Because of this, it
is convenient to carry out an exhaustive control of the injection process, controlling all the parameters
present in this process. The process of plastic injection is based on melting a plastic material and make it flow
inside a mold, where a cavity is filled up, obtaining various forms that allow obtaining a wide variety of
products. In the following figure, there is a schema of an injection machine, where the three main parts of
these machines are specified.
Figure 67 - Schematic of an injection molding production cell and related equipment layout
Page 59
Model based control framework for Site-wide OptimizatiON of data-intensive processes
Deliverable nr.
Deliverable Title
Version
D0.0
Process Industry Domain Analysis and Use Cases
0.03 - 13/01/2016
Page 59 of 110
2.2.2 Process phases
The injection process is a sequential process called injection cycle. This process can be divided into five
phases:
1. Plasticization phase.
2. Injection phase
3. Compaction phase
4. Cooling phase
5. Ejection phase
In the following sections the different phases will be explained more in depth.
2.2.2.1 Plasticization phase
In this phase, the screw, by means of a rotated movement, moves the solidified plastic through injector
barrel. In this process the plastic is heated up by resistors surrounding the barrel.
Figure 68 - Melting and transportation of the plastic
In the following figure it can be seen where the principal parameters of this phase are controlled:
Figure 69 - Elements taking part in the melting process
Among the different parameters being monitored, the temperature of the melted plastic is fundamental.
Depending of this temperature, the characteristics of the injected pieces can vary ostensibly. The temperature
has great influence in the viscosity of the material and this, in the injection process. This temperature is
proportional to the temperature of the resistors and the heat generated by the friction between the solid
plastic and the screw.
Page 60
Model based control framework for Site-wide OptimizatiON of data-intensive processes
Deliverable nr.
Deliverable Title
Version
D0.0
Process Industry Domain Analysis and Use Cases
0.03 - 13/01/2016
Page 60 of 110
2.2.2.2 Injection phase
In this phase, the empty mold is closed, while the melted material is prepared to be injected. The screw
injects the material, acting as a piston, without spinning, forcing the material to go into the cavities of the
mold with a determined injection pressure. This process can be seen in the next schematic figure:
Figure 70 - Closing of the mold and filling of the cavity
In this phase there are several parameters that must be controlled for the correct fabrication of the piece,
such as:
Maximum injection pressure: This is a limitation of the machine as a security condition.
Injection speed: This is an important parameter to have a constant speed of the material inside the
mold.
Mold temperature: The mold is heated up with the objective of getting a uniform temperature in the
cavity surface.
Temperature of the injected material: It is the temperature distribution of the material along the
mold cavity.
Pressure of the injected material: Depending on the walls and cannels of the mold more or less
pressure will be required.
Volume of the injected material: This volume must be less than the volume of the plastified material.
Viscosity of the injected material: It is the resistance of fluid material to flow inside the mold.
Time of injection: It is the time taken by the whole injection phase.
2.2.2.3 Compaction Phase
In this phase, the screw is maintained forward, compacting, applying constant pressure before the
solidification of the material, with the aim of avoiding the contraction of the piece while cooling.
This pressure is usually less than the injection pressure and it is maintained until this pressure loses efficiency.
The main parameters to control in this phase are:
Theoretical compaction time: The time established in the machine to apply pressure
Theoretical compaction pressure: The pressure established in the machine to apply pressure.
Real compacting pressure: It is the evolution of the pressure in each point of the piece while
compaction phase.
Page 61
Model based control framework for Site-wide OptimizatiON of data-intensive processes
Deliverable nr.
Deliverable Title
Version
D0.0
Process Industry Domain Analysis and Use Cases
0.03 - 13/01/2016
Page 61 of 110
Real compacting time: It is the time while pressure in the cavity exists.
Compacted material temperature: It indicates the temperature evolution in different points of the
piece while compacting.
Material density: Its evolution depends on the compaction temperature and compaction pressure.
Solidified quantity of the material: It is important to control the solidification of the material in each
phase.
2.2.2.4 Cooling Phase
In this phase the material continues losing temperature inside the mold, where the heat is dissipated by
refrigerating liquid. While on this phase, the screw already has the material for next injection process.
The parameters in this phase are:
Mold Temperature: The mold must have a system or refrigeration system to be able to refrigerate all
the heat.
Cooling time: The time passed from the end of the compacting phase until the piece is rigid enough
to be extracted.
Ejecting piece temperature: Temperature at which the piece can be ejected without being damaged.
Cycle time with closed mold: The time the mold is closed, counting the phases of loading the
material, compacting and cooling.
Piece stresses: superficial and intern stresses in the piece if the cooling is very fast.
Quantity of solidified material: This parameter controls the quantity of material solidified in the
cooling phase.
Figure 71 - Quantity of solidified material in the cooling phase.
2.2.2.5 Ejection phase
In this phase, the mobile part of the mold is opened and the piece is extracted.
The ideal situation would be that the piece would fall by gravity, but the piece remains adhered to the mold
because of adherence forces or internal tensions. Because of these problems, the ejectors take the piece out
from the mold.
The parameters necessary to be controlled in this phase are:
Expulsion force: It is a very important factor when selecting the size and quantity of ejectors.
Ejectors movement: It is the distance that the ejectors must move to extract the piece from the mold
cavity
Expulsion speed: It is the speed the ejectors must have.
Cycle time: It is the sum of melting, injection, compaction, cooling and ejection times.
Page 62
Model based control framework for Site-wide OptimizatiON of data-intensive processes
Deliverable nr.
Deliverable Title
Version
D0.0
Process Industry Domain Analysis and Use Cases
0.03 - 13/01/2016
Page 62 of 110
2.2.3 Process signals injection machine
During the injection molding process many technical variables have to be measured in order to describe
the process and to prevent damages from the injection molding machine. These technical variables can be
devided into electrical signals to define the stage of the process and continuous signals (pressures,
temperatures, positions etc.).
2.2.3.1 Technical drawing
Figure 72 - Injection molding machine signals.
2.2.3.2 Main Control/Command Signals
MCP Mold Closing/Clamping Phase
INJ Injection phase
DYN Dynamical phase
PCK Packing Phase
HOL Holding phase
COO Cooling phase
DBD Decompression Before Dosing
DOS Dosing phase
DAD Decompression After Dosing
MOP Mold Unclamping/Opening Phase
PEJ Product Ejection Phase
2.2.3.3 Main Physical Measures
MIP Machine Injection Pressure
SPO Screw Position
SRO Screw Rotation
STO Screw Torque
NIP Nozzle Injection Pressure
NIT Nozzle Injection Temperature
Page 63
Model based control framework for Site-wide OptimizatiON of data-intensive processes
Deliverable nr.
Deliverable Title
Version
D0.0
Process Industry Domain Analysis and Use Cases
0.03 - 13/01/2016
Page 63 of 110
2.2.4 Process signals injection mold
2.2.4.1 Technical drawing
Figure 73 - Injection mold signals.
2.2.4.2 Main Control/Command Signals
MBC Mold Block Command (hydraulic/Pneumatic)
2.2.4.3 Main Physical Measures
MMP Material Molding Pressure
MMT Material Molding Temperature
CMT Cavity Molding Temperature
MCT Mold Component Temperature
CHF Cavity Heat Flow
2.2.5 Process signals interpretation of physical measures
All figures shown below show various variables which can be measured during the injection molding
process. These variables can be compared to reference values measured during a reference cycle. Due to this,
errors in the injection molding process can be detected and the fault parts can be rejected. Therefore
important points of the curves (i.e. maximums, mean values, integrals) and tolerances can be defined. It is
then also possible to detect variables coming close to the end of a tolerance and to give a signal to the
machine worker that he stabilizes the process manually.
The figures give some example of the principle behaviour of different variables.
Page 64
Model based control framework for Site-wide OptimizatiON of data-intensive processes
Deliverable nr.
Deliverable Title
Version
D0.0
Process Industry Domain Analysis and Use Cases
0.03 - 13/01/2016
Page 64 of 110
2.2.5.1 Physical measures
Type Description ERefs
SPO Injection Screw POsition Injection Molding Machine
SRO Screw ROtation Injection Molding Machine
STO Screw TOrque Injection Molding Machine
MIP Machine Injection Pressure Injection Molding Machine
NIP Nozzle Injection Pressure Injection Molding Machine Nozzle
NIT Nozzle Injection Temperature Injection Molding Machine Nozzle
MMP Material Molding Pressure Injection Mold
MMT Material Molding Temperature Injection Mold
CMT Cavity Molding Temperature Injection Mold
MCT Mold Component Temperature Injection Mold
CHF Cavity Heat Flux Injection Mold
CIT Channel Input Temperature
controller
Mold Temperature Controller
COT Channel Output Temperature
controller
Mold Temperature Controller
CFR Channel Flow Rate Mold Temperature Controller
HRT Hot-Runner Nozzle Temperature Hot-runner Nozzle
VGL Valve Gate Latency Sequential Injection Molding
Controller
Table 6 - Injection process physical measures.
2.2.5.2 Control/Commands
Type Description ERefs
MCP Mold Closed Phase Injection Molding Machine
INJ INJection phase Injection Molding Machine
DYN DYNamical phase Injection Molding Machine
PCK PaCKing phase Injection Molding Machine
HOL HOLding phase Injection Molding Machine
COO COOling phase Injection Molding Machine
DBD Decompression Before Dosing phase Injection Molding Machine
DOS DOsing Phase Injection Molding Machine
Page 65
Model based control framework for Site-wide OptimizatiON of data-intensive processes
Deliverable nr.
Deliverable Title
Version
D0.0
Process Industry Domain Analysis and Use Cases
0.03 - 13/01/2016
Page 65 of 110
DAD Decompression After Dosing phase Injection Molding Machine
MOP Mold OPening Phase Injection Molding Machine
PEJ Product EJection phase Injection Molding Machine
MCL Mold CLosing Phase
Table 7 - Injection process control and commands.
Illustration of Injection Molding process Control/Command Signals:
Figure 74 - Typical illustration of injection process control and commands.
Graphical representation process features illustrated in the next section.
Page 66
Model based control framework for Site-wide OptimizatiON of data-intensive processes
Deliverable nr.
Deliverable Title
Version
D0.0
Process Industry Domain Analysis and Use Cases
0.03 - 13/01/2016
Page 66 of 110
2.2.5.3 Screw Position
Figure 75 – Screw position
This figure shows the position of the screw during the injection molding cycle.
Between INJ.STA and HOL.STA the plastic melt is injected into the cavity. Afterwards there is a holding phase
to equalize the shrinkage and warpage. At the point HOL.END the gate is frozen, so that there is no holding
pressure still necessary. The dosing phase follows.
2.2.5.4 Screw Rotation
Figure 76 – Screw rotation
During the dosing phase the screw rotates in order to haul the melt. Therefore the screwrotation is defined
(SRO.MEA). Due to tolerances and the process there is small belt in which the screw rotation swings.
Page 67
Model based control framework for Site-wide OptimizatiON of data-intensive processes
Deliverable nr.
Deliverable Title
Version
D0.0
Process Industry Domain Analysis and Use Cases
0.03 - 13/01/2016
Page 67 of 110
2.2.5.5 Screw Torque
Figure 77 – Screw torque
2.2.5.6 Machine Injection Pressure
Figure 78 – Machine injection pressure
Page 68
Model based control framework for Site-wide OptimizatiON of data-intensive processes
Deliverable nr.
Deliverable Title
Version
D0.0
Process Industry Domain Analysis and Use Cases
0.03 - 13/01/2016
Page 68 of 110
2.2.5.7 Nozzle Injection Pressure
Figure 79 – Nozzle injection pressure
2.2.5.8 Nozzle Injection Temperature
Figure 80 – Nozzle injection temperature
Page 69
Model based control framework for Site-wide OptimizatiON of data-intensive processes
Deliverable nr.
Deliverable Title
Version
D0.0
Process Industry Domain Analysis and Use Cases
0.03 - 13/01/2016
Page 69 of 110
2.2.5.9 Material Molding Pressure
Figure 81 – Material molding pressure
2.2.5.10 Material Molding Temperature
Figure 82 – Material molding temperature
Page 70
Model based control framework for Site-wide OptimizatiON of data-intensive processes
Deliverable nr.
Deliverable Title
Version
D0.0
Process Industry Domain Analysis and Use Cases
0.03 - 13/01/2016
Page 70 of 110
2.2.5.11 Cavity Molding Temperature
Figure 83 – Cavity molding temperature
2.2.5.12 Cavity Heat Flow
Figure 84 – Cavity heat flow
Page 71
Model based control framework for Site-wide OptimizatiON of data-intensive processes
Deliverable nr.
Deliverable Title
Version
D0.0
Process Industry Domain Analysis and Use Cases
0.03 - 13/01/2016
Page 71 of 110
2.2.5.13 Channel Input Temperature controller
Figure 85 - Channel input temperature controller
2.2.5.14 Channel Output Temperature Controller
Figure 86 - Channel output temperature controller
Page 72
Model based control framework for Site-wide OptimizatiON of data-intensive processes
Deliverable nr.
Deliverable Title
Version
D0.0
Process Industry Domain Analysis and Use Cases
0.03 - 13/01/2016
Page 72 of 110
2.2.6 General Scheme of a DACS for Plastic Domain
The purpose of any data acquisition system is to gather useful measurement data for characterization,
monitoring, or control.
Data acquisition is the process of measuring electrical or physical phenomenon such as voltage, current,
temperature, pressure, or sound in concordance with real world physical conditions and converting the
resulting samples into digital numeric values that can be manipulated by a computer. Data acquisitions
typically convert analog waveforms into digital values for processing.
The components of data acquisition systems include:
Sensors: There is a great variety of sensors measuring many process parameters present in industrial
systems, using many physical principles for transduction. These give an electrical response, current or
voltage, which can afterwards be transformed for process identification and control.
Signal conditioning systems: Signal conditioning is used to amplify, attenuate, shape, or isolate signals
from transducers before they are sent to the measurement hardware. Many of the outputs provided by
the sensors are not treatable directly by the digital systems used for process control, so there is a need of
a signal conditioning circuitry to convert sensor signals into a form that can be converted to digital
values.
Analog to digital converters: Convert the conditioned sensor signals to digital values
Data acquisition starts at the transduction done to a physical phenomenon or physical property of the
process to me monitored. Examples of this include temperature, pressure, light intensity, gas pressure, fluid
flow, and force. Regardless of the type of physical property to be measured, the physical state that is to be
measured must first be transformed into a unified form that can be sampled by a data acquisition system.
The task of performing such transformations falls on devices called sensors.
Figure 87 - Basic schema of a DACS system
Page 73
Model based control framework for Site-wide OptimizatiON of data-intensive processes
Deliverable nr.
Deliverable Title
Version
D0.0
Process Industry Domain Analysis and Use Cases
0.03 - 13/01/2016
Page 73 of 110
A sensor, which is a type of transducer, is a device that converts a physical property into a corresponding
electrical signal (e.g., a voltage or current) or, in many cases, into a corresponding electrical characteristic
(e.g., resistance or capacitance) that can easily be converted to electrical signal. Many times, the electrical
signal generated by the sensors is not directly usable by the processing unit, so almost always signal
conditioning systems appear as the next natural step after the sensors to adequate the signal acquired to a
readable and useful format. Once the signal has been conditioned it can digitized using an Analog to digital
converter (ADC).
The ability of a data acquisition system to measure differing properties depends on having sensors that are
suited to detect the various properties to be measured. There are specific sensors for many different
applications. DACS systems also employ various signal conditioning techniques to adequately modify various
different electrical signals into voltage that can then be digitized using an Analog-to-digital converter (ADC).
In the same way, when the system controlling a process sends a control digital signal, this signal follows the
inverse process, and it is converted to an analog value by a Digital-to-analog converter (DAC).
Figure 88 - Example of complex distributed DACS system in Plastic Domain
Page 74
Model based control framework for Site-wide OptimizatiON of data-intensive processes
Deliverable nr.
Deliverable Title
Version
D0.0
Process Industry Domain Analysis and Use Cases
0.03 - 13/01/2016
Page 74 of 110
In DACS systems the processing of the signals acquired is generally done by a computer, mainly PCs or less
commonly by embedded systems designed for specific applications. Attending to the most common systems,
the PC based systems, the signals, after being acquired in the PC, are visualized, analyzed and recorded in the
computer. All these operations can be developed using general purpose programming languages, such as
C#, C, C++, Visual Basic .NET, or other more specific languages specially designed for this work, such as
LabView from National Instruments or Matlab from Mathworks.
2.2.7 Configuration of data collection system for plastic domain
Figure 89 shows the complete configuration of injection molding unit to collect data to implement
MONSOON concept and to build predictive model to analyze online variation of process variables and the
effect on part quality. The part quality assessment will be assessed on bases of imbedded in-mold pressure
and temperature sensors and by implementing an in-line opto-electric sensors and camera-scanning system
selected on bases of use cases. The figure below shows the MONSOON system elements in general for
plastic domain.
Figure 89 - Configuration of injection molding unit for data collection at field level
Page 75
Model based control framework for Site-wide OptimizatiON of data-intensive processes
Deliverable nr.
Deliverable Title
Version
D0.0
Process Industry Domain Analysis and Use Cases
0.03 - 13/01/2016
Page 75 of 110
3 Domain Use Cases
3.1 Aluminium industry domain
3.1.1 General objective
AP needs and interests in MONSOON project is at carbon production area and at potline (or shared
multiple potlines) supervision level. The vision is to allow on the long term shared “Process Excellence
Centers” to be able to assist operations of several potlines, such as analysing this volume of available data to
be able to detect and manage the outlier pots, providing early warnings or even predictive signals on global
or individual anomalies more efficiently than what is achieved currently, giving to the process people a better
analysis of the root cause of the abnormal behaviour, going towards predictive metal quality or maintenance,
detecting common trends between potlines, that could be related to – for example – common raw materials
supply, etc.
There are several issues in aluminium production process that can be improved by proposed
methodologies of the project such as pots process anomalies prevention, predictive detection of anode
spikes and environmental air emission avoidance. For pots process anomalies prevention MONSOON project
will apply trend analysis techniques, in order to identify and detect structural changes and anomalies during
pot process. For predictive detection of anode spikes MONSOON project will apply data analysis techniques
and multi-scale modelling based on trend analysis and inductive learning techniques (machine and deep
learning techniques), so as to build predictive models for spike detection and monitoring. For environmental
air emission reduction MONSOON project, again will apply multi-scale modelling so as to build predictive
models that could simulate several scenarios for air emissions with main objective to maintain the
environmental footprint of the plant low.
While early proof-of-concepts will be implemented in small scale “test” environments (3 pots) available in AP
plants, it is important to observe that the high amount of data required to apply the MONSOON
methodology will only be made available thanks to significant investments made privately by AP to prepare
the infrastructure of the Dunkerque plant for such an ambitious project. The ambitious deployment and
innovative methodology foreseen by MONSOON would in fact not provide enough historical data to run
complete analysis and thus would not result in significant outcomes, if only applied to small scale test-site
environment only.
3.1.2 Expected impacts
3.1.2.1 Impact on productivity and production efficiency
It is to be noted that the current primary aluminium production process is a fairly mature one, result of
more than 130 years of optimization. The value drivers of the industry are as represented in the following
figure.
Figure 90 - Costs breakdown for the aluminium production
Page 76
Model based control framework for Site-wide OptimizatiON of data-intensive processes
Deliverable nr.
Deliverable Title
Version
D0.0
Process Industry Domain Analysis and Use Cases
0.03 - 13/01/2016
Page 76 of 110
Based on this breakdown, on the top of the process briefly described before, it is possible to anticipate
some MONSOON concrete impacts on raw material consumption, in relation with the aluminium production:
Alumina – The aluminium production process is currently typically operating at 103% of the minimum
stoichiometric consumption. There is therefore very few opportunities and impact expected on this aspect.
Anodes – the process is operating at 121% of the minimum stoichiometric carbon consumption. There are
more opportunities in this area, related to anodic incidents minimization through a better process
anticipation and management. The anticipated impact is a 2 to 5% improvement, i.e. 10 to 25% of the gap
with theoretical minimum. The same improvement is expected on the corresponding handling volume.
Energy (electrical power) - Even if EU companies are quite efficient as regards costs for alumina per-tons of
final product, expenses by EU smelters for electricity are still the major source of competitive disadvantage.
Primary aluminium production is an electro-intensive process, requiring 13300 kWh in average to produce 1
ton of product. The current consumption for the best operating plants / processes is about 190% of the
theoretical minimum. Most of this difference is related to process design and inherent to the fact that the
process is operating at high temperature. By allowing a better and more proactive control of the process, the
project should enable major energy consumption gains either directly through better control of existing
processes (max 1-3%, ie 150 - 450 kWh/t) or indirectly by unlocking design improvements potential (5 to
10%, ie -1000 kWh/t)
This is representing a bigger step than what the global aluminium industry has achieved over the past 25
years. It is equivalent on the long term, if applied to the whole primary aluminium industry in the EC (2,0
Mt/year) to an yearly energy consumption of 3,8 TWh (or more or less a 1 million people city).
Furthermore, when considering the costs of converting alumina into aluminium, thus including not only
power cost, but also carbon cost, labour cost, fuel cost, bath material cost, other consumable costs as well as
maintenance and sustaining capital expenses, producers in the EU face a competitive disadvantage vis-à-vis
all international competitors. It is also possible to foresee also some wider spectrum advantages:
Other costs and manpower: This aspect is highly related to the process productivity in tons/hour or
tons/employee. The biggest driver is the potline amperage (defining the process productivity) and the level
of automation and control (defining the complement of operators and staff required to operate and maintain
the process and the related equipment).
Amperage and process productivity: the amperage able to go into the process is given by the design of the
electrolytic pot. For a given pot technology, due to the specifics of the electrochemical nature of the process,
the rule of the game has always been to keep the amperage as constant as possible, not to disturb the
process. However, a much better and predictive process control will allow more flexibility resulting in 1)
Amperage / production creeping potential on a given pot technology, 2) Ability to fluctuate pot amperage in
a wider window with the energy availability and market, with a resulting decrease in average kWh cost, 3)
Minimization of the cost related to inefficiencies. Allowing a 10-15% flexibility in the process amperage due
to this better control would allow a global win-win scenario with energy producers in a context of higher
proportion of renewable energy in the mix.
Plant staffing and maintenance costs: productivity and costs gains can be achieved through less incidents
treatment related manpower requirements (see business case section).
Revenues and products quality: Product quality improvement and access to new markets: the quality of the
metal produced is linked to raw materials purity and to the level of process disturbances generating in-
process metal pollution. Less disturbance will allow a higher metal purity. Typically a plant producing metal
with an average Fe pollution of 1000 ppm could achieve more sustainably a 900 or 850 ppm average
pollution and access other metal markets as a consequence.
Page 77
Model based control framework for Site-wide OptimizatiON of data-intensive processes
Deliverable nr.
Deliverable Title
Version
D0.0
Process Industry Domain Analysis and Use Cases
0.03 - 13/01/2016
Page 77 of 110
3.1.2.2 Impact on environmental efficiency
The process of aluminium production generates direct CO2eq emission and indirect ones related to the
energy mix of the electrical power production. Typically, one ton of aluminium is generating 2 tons of CO2eq
directly (anode consumption and incidental Per-Fluoro-Carbon (PFC) emission during process excursions),
and 0 to 15 tons of indirect CO2eq emission per ton of aluminium through the energy mix contribution (purely
hydro to 100% coal based).
Direct emissions: emissions represent another key relevant impact factor on the MONSOON project. Indeed,
The CO2 generated by the anodes is representing 1,5 t CO2 / t Al. As for the carbon consumption mentioned
above, the improvement associated to a better process control and anodic consumption should be around 2
to 5%. With respect to PFC’s (CF4, C2F6 with a GWP respectively of 7390 and 12200), the potential is much
bigger because these emission are process control and incident related. The current world average for the
industry is 0,60 t CO2eq / t Al and the European average is more around 0,20 t CO2eq /t Al, with best in
class operating at 0,03 t CO2eq / t Al. The potential gain order of magnitude for a typical plant should
therefore be around 0,1 t CO2eq/t Al, i.e. 250.000 t CO2eq/y in the EC, or the equivalent emission of 100.000
cars.
Indirect GHG reduction: the enabling of a potential gain of 5 to 10% mentioned above on power
consumption applies also to indirect GHG emissions, associated to energy consumption. All the impacts
related to Energy and GHG have been listed and evaluated38
. The report anticipates an overall improvement
potential of 21% on energy consumption and 66% in GHG emission before 2050, and although not all of
these gains may come from process control improvements, they will definitely contribute or enable a
significant part thereof.
3.1.2.3 Additional impacts related with the aluminium production (HSE)
It has been anticipated that a better process control, with much less excursions and incidents, will result in a
general HSE improvement in the smelters, specifically regarding:
Health: During incidents treatment, the pots are opened and expose the workers to very high heat (the
electrolytic bath is at 960°c) and fumes that contain amounts of HF, CO, CF4, C2F6, SO2. Less incidents in an
optimized process, necessitating less manual intervention by operators in degraded conditions, will decrease
overall exposure to these stressors. This is expected to improve industrial hygiene profile of the industry.
Safety: A significant part of the All Injuries Frequency Rate (AIFR) is finding its cause in abnormal situations
management. A minimized number of abnormal situations to manage and less exposure to deteriorated
conditions will result in less incidents and accidents. The AIFR of the plants beneficiating of the results of the
project should improve (-10 to -20%) consequently.
Environment: The process environmental impact is largely minimized by a proper reduction pot design and
operation. Fluoride emissions are in average below 0,5 kg F/t Al in the most recent plants, with benchmark
values around 0,2. A large part of residual emission and difference between benchmark and average is
related to the fugitive and incidental emission during process drift and incidents. A reduction of these
occurrences will therefore contribute to improve smelters performance. With respect for solid waste, the
biggest stream is indeed valorised as alternative raw material in third parties industries. This waste stream is
constituted by the dismantled cathodes at their end of life (i.e.: after more or less 6 years). Other wastes are
almost fully recycled in the process. The value at stake in waste recycling associated to a better process
control is essentially related to a longer cathode life that would be allowed by a smoother operation. This
said, cathode life duration is much more a matter of pot design than operation. It is possible to expect a 5 %
life increase (and therefore a 5% less waste to valorise) with process excursion avoidance.
Page 78
Model based control framework for Site-wide OptimizatiON of data-intensive processes
Deliverable nr.
Deliverable Title
Version
D0.0
Process Industry Domain Analysis and Use Cases
0.03 - 13/01/2016
Page 78 of 110
Society: thanks to the increase of the competitiveness of European aluminium industries, it is expected to
keep employment in Europe and avoid redundancy plans. Aluminium industry represent today 90 000
employees in 2010. Between 2008 and 2009, a 7.5% reduction of the workforce could be observed and is
directly linked to the reduction of the primary aluminium production.
3.1.3 Use cases selection
We have first reviewed all the potential use cases among the three main families of industrial Big Data.
Figure 91 - Initial selected use cases areas
We have chosen to work on the whole anode value chain (anode life cycle), from raw materials, anode
manufacturing and finally anode behaviour on electrolysis pots.
The three selected use cases:
• Predictive Anode Quality
• Carbon process optimization: Paste Plant, Baking Furnaces, Rodding
• Predictive Maintenance (e.g. main motor of the Paste Plant)
• Electrolysis process optimization: anode behavior on pot
• Electrolysis process optimization: other
The predictive maintenance use case was selected as the first one for the ramp-up phase and is supposed to
be an “easy one” because the scope is clear and limited and the predictive maintenance is one of the most
popular and known domain in Big Data Analytics. Moreover the mixer is one of the key equipment of the
Paste Plant which is critical for good quality paste production, this first use case could be seen as a zoom on
the work on the global anode quality prediction.
3.1.4 Overview of the infrastructure already on the field
From a typical potline it is possible to extract information such as, pots instantaneous resistance, the line
amperage, status indicators, bath temperature or chemical analysis, voltage drop manual measurements,
anodic or cathodic current distribution, raw material quality analysis, metal quality analysis at a tapping cycle
based schedule, equipment condition monitoring, operating equipment status, etc.
This information is collected at pot process control computer level, and through information transfer from
other sections of the plant (e.g., bath or metal quality comes from the analytical lab MES). All this information
is computed and presented to process control people at potline control room level. In terms of architecture,
Page 79
Model based control framework for Site-wide OptimizatiON of data-intensive processes
Deliverable nr.
Deliverable Title
Version
D0.0
Process Industry Domain Analysis and Use Cases
0.03 - 13/01/2016
Page 79 of 110
each pot is fitted with its own process controller. Each controller sends aggregated and partially processed
data to the central potline supervision computer, which role is to package this information and historize.
The process control (PLC or DCS) and supervision (SCADA) of others workshops in the plant (carbon area,
casthouse, utilities, substation, cranes and load transportation) are interconnected and integrated to an
Historian layer to retrieve all elementary data. The MES measures, visualizes, analyses and manages
production operations, planning, quality, inventories, etc. and finally production performance. The MES is
unifying automation & supervision levels with business management level by supplying critical data to the
ERP. The ERP is standardized across AP/Rio Tinto and is SAP based.
The functions that will be useful for our use cases:
Most of the existing MESALTM
functions implemented in the carbon area of the aluminium smelter.
Historization of process data (covered by the OSISoft PI Historian)
Reduction production management (covered by the ALPSYS Pot Process Control System)
Management of analyses (execution of analyses), managed by the LIMS
Data types:
Master Data for each function
Data associated with each business and common functions (equipment, materials and products,
recipes and quality data)
Operation of installations and shops: indicators, performance, work orders, etc.
Etc.
Infrastructure already on the field:
Figure 92 - Functional automation and IT architecture in Aluminium Dunkerque
Note: to date the Carbon sector has an old fashioned IT layer that we plan to replace in parallel to the
MONSOON project by our Rio Tinto (AP) standard MESAL™ solution.
Page 80
Model based control framework for Site-wide OptimizatiON of data-intensive processes
Deliverable nr.
Deliverable Title
Version
D0.0
Process Industry Domain Analysis and Use Cases
0.03 - 13/01/2016
Page 80 of 110
Data volume:
Description Quantity
Anodes Annual production ~ 140 000 baked anodes per year
Electrolysis area: Number of pots 1 potline of 264 pots
Number of shift indicators
Carbon (MESAL) 500 including 250 for materials (not all are useful)
Reduction (ALPSYS) 1000 (not all are useful)
total ~1500 indicators
Number of Carbon historian tags (PI) ~5000 tags
Number of analysis (laboratory)
LIMS (avg. 10000 requests) ~100000 samples (each has roughly 30 characteristics)
Table 8 – Aluminium domain use cases data volume
3.1.5 Functions capturing data
Existing Process Control and MES functions capturing data on the anode life cycle:
Figure 93 - Functions capturing data on the anode life cycle
3.1.6 Carbon area Historian, MCS and MES
3.1.6.1 MCS and Historian
The automation (MCS and historian) layer in AD carbon sector (plant/company standards):
PLC: S7 Siemens
RTS: Citect Schneider Electric
Historian: PI OSISoft
Page 81
Model based control framework for Site-wide OptimizatiON of data-intensive processes
Deliverable nr.
Deliverable Title
Version
D0.0
Process Industry Domain Analysis and Use Cases
0.03 - 13/01/2016
Page 81 of 110
3.1.6.2 MES
The MES provides production monitoring and management. It provides tools for monitoring the production
procedure, the behavior of installations and the quality of manufactured products.
The main MES functions are:
To provide long-term data storage acquired by the MCS, from the ERP or entered and/or calculated
at MES.
To present the collected data
To provide the necessary analysis tools
To print reports
To provide ERP with management data
To make calculations on the received data.
To date the Carbon sector has an old fashioned IT layer that we plan to replace in parallel to the MONSOON
project by our standard MESAL™ framework.
The MES layer in Aluminium Dunkerque (AD) carbon area (plant/company standards) will be:
MESAL, homemade MES solution developed using Microsoft tools: .NET, SQL Server
Reports are done using Microsoft Reporting Services.
Dashboards and Data Analysis are done using one of the top Business Intelligence tool of the
market: Qlikview from Qlik.
3.1.6.3 Main MES functions useful for the use cases
MATM - Material Flow Management:
This module provides functions for:
Stock management (stock level calculation and adjustments)
Traceability of all material and product movements
Validation of material and product movements using check data
Examples of materials followed-up for the Carbon Paste Plant:
Raw materials: coke, pitch
Intermediate materials: recycled baked products, recycled green products, dedusting fines, classified
products (coarse, etc.), dry matter, rejected paste, good paste, rejected green anodes
Materials produced: green anodes, rejected anodes, rejected paste, packing coke.
EQPF - Equipment Performance:
This module manages, for each equipment to be monitored by the MES:
Equipment configuration
Management of scheduled downtime planning
Equipment operation monitoring (traceability of breakdowns with reason)
Equipment performance monitoring (performance indicator calculation, e.g. Overall Equipment
Effectiveness, operating rate, etc.)
This module needs the MCS to supply the running bit for the equipment to be monitored as well as
maybe a tag containing the downtime cause when a stoppage occurs.
ANAM - Analysis Management:
The objective is to have in each sector a unique interface to the LIMS. It provides the following functions:
Reception of analysis result
Storage and processing of analysis results.
Page 82
Model based control framework for Site-wide OptimizatiON of data-intensive processes
Deliverable nr.
Deliverable Title
Version
D0.0
Process Industry Domain Analysis and Use Cases
0.03 - 13/01/2016
Page 82 of 110
SLOG - Shift Log:
The module provides the following information to the shift supervisors:
Shift-to-shift information
Limited life instructions as well as management instructions
Operator assignments to workstations
Operation Work orders to be done this shift
Summary and indicators of previous shift
Production targets and current status
Indicators follow up during the shift
Access to all previous shift logs.
It also accesses some functions covered by other functional modules, such as:
Validation of material and product movements (raw material consumption and finished products
produced)
Possibility of keying in equipment breakdown causes and validation of performance indicators.
KPIM - KPI Management:
This module manages the reception and storage of all data received from the MCS or calculated by the MES.
It identifies the indicators elected as KPIs. It includes KPI report.
TRAC - Traceability:
This module manages tracking function and is designed to carry out tracking both at “equipment” and at
“material” level through manually entered events, uploaded from the MCS or a specific function call.
This function allows:
Configuration of equipment on which tracking is required
Configuration of material classes on which tracking is required
Configuration of associated events (production steps or process event)
Configuration of utilization periods (tracking indicators).
For each event, the configuration of the HMI used to collect the associated data.
From an operational viewpoint (in manual or automatic):
Creation of an event for a given material class or item of equipment, and input of the data associated
with this event.
Modification of a previously entered event.
Post viewing of a list of events as per criteria to be defined.
Post viewing of an event.
PERM - Product and Equipment Recipe Management:
This module manages all parameters (recipe) used by an equipment to execute a production operation.
Parameters are always linked to equipment; some parameters are also linked to the manufactured product.
The module manages two types of recipe:
Equipment recipe: parameters corresponding to equipment configuration independently to the
manufactured product.
Product recipe: parameters for product manufacturing.
This module is following a 3 steps process:
Configuration of parameters and configuration of operator screens for data entries
Management of equipment and product recipes
Parameters sending to MCS
Page 83
Model based control framework for Site-wide OptimizatiON of data-intensive processes
Deliverable nr.
Deliverable Title
Version
D0.0
Process Industry Domain Analysis and Use Cases
0.03 - 13/01/2016
Page 83 of 110
AQUA - Anode Quality: The Anode ID Card
The MESAL AQUA module centralizes all the information regarding the monitoring of anode life from
manufacturing quality in Paste plant, Baking, Rodding shops through to their behavior on pots.
This function is enabling:
Automatic gathering of green production parameters from RTS systems
Manual input of baking furnace unload parameters
Manual input of rejected anodes in Baking furnace and Rodding shops
Automatic gathering of analysis results from the LIMS for Coke, Pitch, Baked Recycled and Anode
Core Samples
Automatic gathering of anode events from ALPSYS
Multi-criteria reports production about:
o Single anode sheet
o Anodes batch sheet
o Green and baked rejected anodes
o Quality of baked anodes
o Anode problems on pots
o Anode behavior on pots
All data are captured for an individual anode (per carbon block).
These data are then to be linked with the anode assembly (2 carbon blocks) to allow monitoring anode
behavior on pots.
Figure 94 -MESAL Anode ID Card (AQUA, Anode Sheet report)
AGGD - Dry product grain size distribution:
This module manages the grain size distribution of the dry product used in anode production.
ABFO – Anode Baking Furnace Operation management:
This module manages:
Loading/unloading operations at the baking furnaces (detailed material flow management)
Follow-up of baking shop flue walls life (construction, deterioration/reparation)
Follow-up of FTA operation quality
Page 84
Model based control framework for Site-wide OptimizatiON of data-intensive processes
Deliverable nr.
Deliverable Title
Version
D0.0
Process Industry Domain Analysis and Use Cases
0.03 - 13/01/2016
Page 84 of 110
FPDM – Fumes Treatment Center activity report and process data monitoring:
This module processes data and acquires information needed to produce periodic reports specific to the FTC
activity (shift, daily, weekly, monthly, annually reports).
3.1.7 Electrolysis Pots Process Control and Supervision (ALPSYS)
3.1.7.1 Pot Process Control system overview
Pot Process Control system main roles:
Adjusting alumina/fluoride feeding strategy
Moving anodic beam up and down to set pot « R »
Dealing with operations and anomalies and alarms
Transferring information and getting settings to/from supervision level
Figure 95 - Pot Process Control micro-controller and electrical cabinet
Each pot is equipped with:
A motorized system that vertically moves a beam that supports the anodes
8 solenoid valves controlling 4 alumina feeders and 4 crustbreakers for the feed of alumina (CAFD)
1 solenoid valve that operates the AlF3 feeder (ATFD)
1 solenoid valve that operates the oversuction valve.
A two-level automation system is used for pot monitoring and control and potline monitoring:
Level 1: each group of two pots is controlled-monitored by a dual potmicro connected to the dual
pot control cabinet.
Level 2: a central computer system with peripheral equipment is used for the supervision of the pots
and reduction shop management (the system is designed to support two potlines).
The Level 2 architecture is a 3-tier Web-based architecture with the following 3 levels:
o A set of redundant computers for data acquisition and storage
o A set of redundant Web applications for the Man-Machine Interface
o Operator workstations connected to the Web servers to provide the Man-Machine Interface.
Page 85
Model based control framework for Site-wide OptimizatiON of data-intensive processes
Deliverable nr.
Deliverable Title
Version
D0.0
Process Industry Domain Analysis and Use Cases
0.03 - 13/01/2016
Page 85 of 110
3.1.7.2 The Level 1 potmicro
The pot control cabinet includes the potmicro which is mounted on the front door of the cabinet. This
cabinet ensures the following functions:
Production of the various power supply and monitoring voltages
Electrical protection
Reception of control signals from the dual potmicro via the ASi network
Transmission of instructions to the anode beam and solenoid valves
Transmission to the dual potmicro of the pot input status via the ASi network
Enabling the operator to maneuver the anode beam, in manual mode, using the selector and
pushbuttons mounted on the front panel
Enabling the operator to switch ON/OFF the circuit breaker control of the beam motor of each pot
Control and monitoring of the pot with the potmicro
The pot monitoring and control program makes it possible to:
Set the operating modes
Acquire analog and binary signals
Maintain the pot resistance around a setpoint value and control the orders sent to the anode beam
Ensure bath alumina regulation and control the CAFD
Detect and treat anomalies and events that occur on the pot
Detect Forced Convection Network status and transmit it to L2
Adapt the operation of the pot to the various actions that concern it
Manage AlF3 corrections and control the ATFD
Manage Crustbreaker Chisel-bath contact
Calculate the specific operation values of the pot and establish reports
Dialogue with L2 (reception of parameters and transmission of monitoring data)
Managing operator dialogue (keyboard, display, single line, and LED).
3.1.7.3 Main Level 2 Supervision functions
The Level 2 server performs the supervision functions:
Dialogue with:
o The potmicros
o The operator via operator workstations linked to the Web server
o The substation to transmit the potline setpoint current
Calculate the potline setpoint current
Perform thermal regulation
Modify the dual potmicro parameters
Supervise and monitor, in real time, the pots and the potline by means of alarms, instant values, 1-
minute values, 5-minute values, pot servicing operations and sorting operations
Control the horns in the potrooms
Print out reports and balance sheets at shift or day intervals for technical monitoring and control.
The Level 2 server performs also some management functions:
Configure the whole application (groups of pots, schedule creation, parameter definition)
Perform work management and monitor jobs in the potline
Produce periodic activity reports such as weekly and monthly reports
Exchange information with the other sectors by means of the plant local network
Manage lining-related data
Manage a database and make it available in order for operators to perform potline operation
analysis using standard tools.
Page 86
Model based control framework for Site-wide OptimizatiON of data-intensive processes
Deliverable nr.
Deliverable Title
Version
D0.0
Process Industry Domain Analysis and Use Cases
0.03 - 13/01/2016
Page 86 of 110
3.1.8 Use case: predictive anode quality
3.1.8.1 Impacts of bad anode quality
Quality Management is a critical process at each step of anode manufacturing. The cost of scrapped
anodes that don’t meet electrolysis’ quality standards can be quite significant.
Scrap may be reintegrated to the production process at a certain cost (best case scenario), but sometimes,
especially when non-conforming anodes are detected at the end of the production cycle, when the stem is
rodded on the anode blocks, electrolysis is forced to use them or the anode assemblies are scrapped with
high reprocessing costs.
Worse case scenario, if the quality issue isn’t caught in time and non-conforming anodes are sent to the
potline, it could lead to dramatic operation disturbance at the potline level
3.1.8.2 Anode predictive quality principle
Predictive Quality Management:
The goal of predictive quality management (QM) is to detect quality defects in products before they are
mass-produced. Predictive quality management means looking at historical data of a product and then
developing a predictive model based on the data.
It’s a fact that almost 80% of all quality issues are repeat issues. The carbon plant lacks the ability to capture,
continuously improve, and leverage performance knowledge from lessons learned so that preventive action
can be taken.
This problem comes first to the challenge of integrating, tracking, sharing and analyzing quality data that
comes from many sources and processes within the carbon plant.
Monitoring the quality of anode production is a difficult challenge, especially when it will have to be
implemented in real time on the production lines. This is firstly because anodes are made in batches which
go through a sequence of operations, each taking place in strictly separate areas of the carbon plant, and
secondly because each operation involves a high degree of specialist expertise.
The solution will be developed in order to improve quality management in the triple context of batch
processing, monitoring by a large number of parameters and assessment by several different experts.
The solution will consist in collecting data on the different equipment while they are working, in order to fire
an early warning on any detected quality drift and display to the operators what remedial action they should
take. To achieve this early detection, the solution will have to integrate some of statistical tools, some
simulation models of the reactions involved along the production line and a rule-based expert system
encapsulating the multi-faceted knowledge of the operation and process experts.
Taking the above points into consideration, the MONSOON anode predictive quality solution will be
implemented based on the following evaluation criteria:
Predictive Quality Management: It should provide all necessary quality information and alerting in
real-time, to address quality issues before they occur.
Global and Integrated Solution: It must be able to consolidate quality data from disparate sources,
standardize it, analyze it and display it through interactive role-based dashboards for different staff
categories involved in the quality management process. Also share this information globally to learn
“best practices” site to site.
Quality Continuous Improvement: Find a solution that enhances quality planning through improved
visibility of previous and existing quality issues, permitting the “never ending” cycle of quality
improvement and permitting to allocate resources where changes are most needed
Page 87
Model based control framework for Site-wide OptimizatiON of data-intensive processes
Deliverable nr.
Deliverable Title
Version
D0.0
Process Industry Domain Analysis and Use Cases
0.03 - 13/01/2016
Page 87 of 110
Compliance of Batch Manufacturing Quality “current Good Manufacturing Practice”: Batch
consistency, validation, documentation and traceability will allow demonstrating that all the steps
required by the defined procedures and instructions were in fact taken, and that the quality of the
anode was as expected.
Figure 96 - Anode Predictive Quality principle
Product Predictive Quality technologies for this use case:
A promising approach for this use case could be the use of Data-Driven Model Predictive Control (MPC) of
anode production batch processes.
To address the problem of unavailability of online quality measurements, an inferential quality model, which
relates the process conditions over the entire batch duration to the final quality, is required. The accuracy of
this type of quality model, however, is sensitive to the prediction of the future batch behavior until batch
termination.
The “missing data” problem could be handled by integrating a data-driven modeling methodology, which
combines multiple local linear models with an appropriate weighting function to describe nonlinearities, with
the inferential model in a MPC framework.
To be detailed in next document drafting iterations.
3.1.8.3 Anode predictive quality alerts and objectives
Anode predictive quality management first objective will be to identify bad anodes with a high level of
confidence and scrap them to avoid send them to the electrolysis area.
The second objective will be enabling and optimizing the quality strategy deployment with real-time
actionable intelligence to best predict non-conformance production before it happens and immediately
invoke behavioral change to correct the problem.
Successful performing of these optimization tasks at the Carbon plant will have the following impacts:
Increase quality of the final product – rodded anodes
Decrease consumption of raw material
Bring flexibility to adopt to an actual conditions on raw material market
Page 88
Model based control framework for Site-wide OptimizatiON of data-intensive processes
Deliverable nr.
Deliverable Title
Version
D0.0
Process Industry Domain Analysis and Use Cases
0.03 - 13/01/2016
Page 88 of 110
3.1.8.4 New sensor: MIREA
MIREA is a device which measures online anode structural homogeneity through voltage drop cartography
and data analysis.
Data from MIREA could be a key enabler for anode predictive quality because MIREA enables 100% online
backed anode characterization instead of 2 to 5 ppm samples with results most often delayed by few weeks.
Figure 97 - MIREA device
3.1.8.5 Strategy: integrate the whole production chain data
To be detailed in next document drafting iteration.
Page 89
Model based control framework for Site-wide OptimizatiON of data-intensive processes
Deliverable nr.
Deliverable Title
Version
D0.0
Process Industry Domain Analysis and Use Cases
0.03 - 13/01/2016
Page 89 of 110
3.1.9 Use case: predictive maintenance on the paste mixer (ramp-up phase)
3.1.9.1 BUSS mixer at the Aluminium Dunkerque Paste Plant
Continuous mixing process:
Figure 98 - Paste Plant continuous mixing process
Buss AG (from Switzerland) introduced its first BUSS Kneader mixer for the continuous production of anode
pastes in 1951.
Since then, more than 250 BUSS mixers have been installed in aluminium plants worldwide (and more than
2500 in other industries). One BUSS mixer was installed part and parcel of the Paste Plant in Aluminium
Dunkerque during plant erection in 1993.
Figure 99 – BUSS Kneader views
Page 90
Model based control framework for Site-wide OptimizatiON of data-intensive processes
Deliverable nr.
Deliverable Title
Version
D0.0
Process Industry Domain Analysis and Use Cases
0.03 - 13/01/2016
Page 90 of 110
Figure 100 - BUSS Kneader process section
BUSS Kneader operating principle:
The characteristic kneading flights of the reciprocating mixing and kneading screw interact with each of the
stationary kneading teeth in the barrel. The simultaneously oscillating screw shaft ensures intensives material
exchange in the axial direction by multiple splitting, folding and reorientation of the product. This result is in
a distributive mixing effect, ensuring optimal distribution of the solid raw materials and micro-dispersion of
the pitch.
This dispersive step-by-step mixing effect avoids product damage due to stress peaks and high radial
pressures. Stress in the matrix is relieved after each shear cycle by distribution to neighbouring channels
before renewed splitting, folding and reorientation during the next shear cycle.
Main process characteristics:
- Micro-dispersion for paste quality
- Uniform shearing effect reduces cracking of larger solid particles
- Adequate residence time for penetration of the pitch into the coke pores
- Narrow residence time distribution
- Optimized specific mixing energy
- Axial mixing
Figure 101 - BUSS Kneader working principle
Page 91
Model based control framework for Site-wide OptimizatiON of data-intensive processes
Deliverable nr.
Deliverable Title
Version
D0.0
Process Industry Domain Analysis and Use Cases
0.03 - 13/01/2016
Page 91 of 110
Detailed process stages:
The coke fractions together with the butts are metered, conveyed and fed into the continuous preheater.
Therein the solids are heated up to about 190°C.
The preheated solids are continuously fed by gravity into the BUSS mixer. Simultaneously the metered
liquid pitch, at a temperature of about 210°C, is fed through one injection nozzle directly into the feed stock
in the process chamber. The escaping air and fumes are led to a separate vent.
When the preheated liquid pitch is fed into the mixer via one or several injection nozzles integrated in the
kneading teeth, small amounts of pitch are mixed thereby with small quantities of solids at a time. This
ensures penetration and micro-dispersion of the pitch, and prevents the formation of undesirable pitch
lumps. The kneading teeth are individually replaceable to allow the installation of pitch injection nozzles at
any point along the process section of the mixer.
Micro-dispersion of the pitch in the process section of the mixer ensures thorough mixing for uniformly
high-quality, high-density anode paste.
The anode paste emerging from the mixer, at a temperature of about 190°C, is fed by gravity via a closed
system directly to a continuous paste cooler.
BUSS mixer (K 500 CP) technical data:
- Barrel diameter: 500 mm
- Process length: 9.5 L/D
- Speed max.: 75 rpm
- Drive power: 300 kW
- Output rates: 16-35 tons / hour
- Length: 14,500 mm – Width 2000 mm – Height 1900 mm
3.1.9.2 Impacts of breakdowns and malfunctioning
Key equipment:
The mixer is key equipment for the paste production at the paste plant which is stopped in case of
breakdown.
There is no redundancy on the mixer mainly because of the high initial CAPEX cost of such equipment.
Malfunctioning:
Deviation to the nominal running settings of the mixer has a major impact on anode quality in case of
deviation.
The "mixing intensity" is the capacity of the mixer to produce, as fully as possible, the following state of the
green anode forming material:
- DP grains coated with binder,
- DP grain porosity filled with binder,
- intergranular space minimized and filled with binder.
In this respect, dry density is a favored indicator measuring the efficiency of the green anode manufacturing
process.
Actual maintenance actions:
During the regular quarterly maintenance shutdowns of the anode production line, the process section of
the BUSS mixer is checked and maintained as instructed by the provider (defective pieces repleacement and
preventive maintenance actions).
Page 92
Model based control framework for Site-wide OptimizatiON of data-intensive processes
Deliverable nr.
Deliverable Title
Version
D0.0
Process Industry Domain Analysis and Use Cases
0.03 - 13/01/2016
Page 92 of 110
3.1.9.3 Predictive maintenance principle and technologies
Predictive maintenance (PM):
Predictive maintenance, also known as PM, techniques are designed to help determine the condition of in-
service equipment in order to predict when maintenance should be performed. With the use of stochastic
algorithms it is possible to calculate the probability of future events (malfunction, anomaly detection,
machine downtimes etc.) at significant time before the event actually occurs. This approach promises
significant cost saving over routine on planned and unplanned repairs.
PM evaluates the condition of equipment by performing periodic or continuous (online) equipment
condition monitoring and/or time scheduled machine downtimes. The "predictive" component of predictive
maintenance stems from the goal of predicting the future trend of the equipment's condition. This approach
uses principles of statistical process control to determine at what point in the future maintenance activities
will be appropriate. Most PM inspections are performed while equipment is in service, thereby minimizing
disruption of normal system operations.
PM technologies for the use case:
To evaluate equipment condition, predictive maintenance utilizes nondestructive testing technologies such
as infrared, acoustic (partial discharge and airborne ultrasonic), corona detection, vibration analysis, sound
level measurements, oil analysis, and other specific online tests.
Vibration analysis:
Vibration analysis is most productive on high-speed rotating equipment and can be the most expensive
component of a PM program to get up and running. Vibration analysis, when properly done, allows the user
to evaluate the condition of equipment and avoid failures. The latest generation of vibration analyzers
comprises more capabilities and automated functions than its predecessors. Many units display the full
vibration spectrum of three axes simultaneously, providing a snapshot of what is going on with a particular
machine.
Model Based Condition Monitoring:
This method involves spectral analysis on the motor’s current and voltage signals and then compares the
measured parameters to a known and learned model of the motor to diagnose various electrical and
mechanical anomalies. This process of "Model Based Condition Monitoring" is used to monitor and detect
developing faults in the equipment. It allows for the automation of data collection and analysis tasks,
providing round the clock condition monitoring and warnings about faults as they develop.
Other potential technologies:
Acoustical analysis can be done on a sonic or ultrasonic level. New ultrasonic techniques for condition
monitoring make it possible to "hear" friction and stress in rotating machinery, which can predict
deterioration earlier than conventional techniques. Ultrasonic technology is sensitive to high-frequency
sounds that are inaudible to the human ear and distinguishes them from lower-frequency sounds and
mechanical vibration. Machine friction and stress waves produce distinctive sounds in the upper ultrasonic
range. Changes in these friction and stress waves can suggest deteriorating conditions much earlier than
technologies such as vibration or oil analysis. With proper ultrasonic measurement and analysis, it’s possible
to differentiate normal wear from abnormal wear, physical damage, imbalance conditions, and lubrication
problems based on a direct relationship between asset and operating conditions.
Sonic monitoring equipment is less expensive, but it also has fewer uses than ultrasonic technologies. Sonic
technology is useful only on mechanical equipment, while ultrasonic equipment can detect electrical
problems and is more flexible and reliable in detecting mechanical problems.
Infrared monitoring and analysis has the widest range of application (from high-to-low-speed equipment),
and it can be effective for spotting both mechanical and electrical failures; some consider it to currently be
the most cost-effective technology.
Page 93
Model based control framework for Site-wide OptimizatiON of data-intensive processes
Deliverable nr.
Deliverable Title
Version
D0.0
Process Industry Domain Analysis and Use Cases
0.03 - 13/01/2016
Page 93 of 110
Oil analysis is a long-term program that, where relevant, can eventually be more predictive than any of the
other technologies. It can take years for a plant's oil program to reach this level of sophistication and
effectiveness. Analytical techniques performed on oil samples can be classified in two categories: used oil
analysis and wear particle analysis. Used oil analysis determines the condition of the lubricant itself,
determines the quality of the lubricant, and checks its suitability for continued use. Wear particle analysis
determines the mechanical condition of machine components that are lubricated. Through wear particle
analysis, one can identify the composition of the solid material present and evaluate particle type, size,
concentration, distribution, and morphology.
3.1.9.4 Predictive maintenance alerts and objectives
The objective of PM is to allow convenient scheduling of corrective maintenance, and to prevent
unexpected equipment failures and machine downtimes. By knowing which equipment or piece of
equipment needs maintenance, maintenance work can be better planned (spare parts, people, etc.) and what
would have been "unplanned stops" are transformed to shorter and fewer "planned stops", thus increasing
Paste Plant availability. Other potential advantages include increased equipment lifetime, increased Paste
Plant safety, fewer accidents with negative impact on environment, and optimized spare parts handling.
The ultimate goal of PM is to perform maintenance at a scheduled point in time when the maintenance
activity is most cost-effective and before the equipment loses performance within a threshold. This is in
contrast to time and/or operation count-based maintenance, where a piece of equipment gets maintained
whether it needs it or not. Time-based maintenance is labor-intensive, ineffective in identifying problems that
develop between scheduled inspections, and is not cost-effective. Adoption of PM can result in substantial
cost savings and higher system reliability.
Reliability-centered maintenance (RCM) emphasizes the use of PM techniques in addition to traditional
preventive measures. When properly implemented, RCM provides companies with a tool for achieving lowest
asset Net Present Costs (NPC) for a given level of performance and risk.
Diagnostic information is presented to the maintenance team – including the specific fault, the
recommended action, and an estimate of time to failure. Electrical and mechanical problems are diagnosed,
including common faults like insulation breakdown, damaged rotor bars, imbalance, and bearing defects.
3.1.9.5 Strategy: focus on real-time data and combine PM technologies
A potential promising approach for our use case is to combine several PM technologies:
Vibration analysis
Model Based Condition Monitoring
Link with process performance data
Vibration analysis associated with Model Based Condition Monitoring and equipment wear units (cycle
time) could be the key driver to identify correlation with some pieces of equipment potential default.
Combining these measurements on the equipment with measurement of process performance could allow us
to successfully predict developing problems.
Based on historical data, a series of data-driven methodologies and techniques (regression analysis,
machine and deep learning techniques etc.) will be implemented so as to find a reference mathematical
model, with significant classification performance, either on binary class or multi-class scenarios. This
predictive model will include the most significant and the more useful information about all electrical and
mechanical characteristics of the motor and its driven system. This learning process will include all operating
states experienced during training, such as different speeds and loads. When the predictive model is decided,
it will be deployed in real-time. Furthermore, the suggested predictive model will be re-trained and updated
in regular bases.
The system will be then able to assess the severity of the problem and produce a series of indications to
suggest what is wrong, what action should be taken and how soon it should be done.
Page 94
Model based control framework for Site-wide OptimizatiON of data-intensive processes
Deliverable nr.
Deliverable Title
Version
D0.0
Process Industry Domain Analysis and Use Cases
0.03 - 13/01/2016
Page 94 of 110
3.1.9.6 Detected developing faults (TBC)
The following developing faults could be detected and diagnosed:
Electrical supply,
Internal electrical problems (like insulation breakdown),
Mechanical faults (like foundation and coupling looseness, imbalance and misalignment, and bearing
deterioration),
Operational problems leading to changes in load or electrical characteristics.
3.1.9.7 Existing data (TBC)
Our initial objective is to use existing measurements only (voltage, current signals, etc.). Nevertheless some
additional sensors could be introduced if they are promising to increase the robustness of our predictive
function.
ITEMS NUMBER DESIGNATION UNIT POWER (kW)
362.J100 1 Bucket elevator 20
362.J110 1 Vibrating feeder 3
362.J120 1 Magnetic separator 1
362.J130 1 Preheating screw 37
362.J140 1 Plug screw 3
362.J150 1 Mixer 350
Table 9 – Aluminium use case #1 equipment
List of variable control equipment:
J110 : flow rate
J130 : rotation speed
J150 : rotation speed
J150 : rotation speed
power
flap position
List of equipment with measurements:
J100 : elevator motor amperage
J130 : screw speed
motor amperage
dry solid temperatures
J150 : motor power
motor amperage
mixer speed
motor speed
paste temperature
pitch temperature at mixer inlet
flap position
Operator control on Preheating Screw J130:
A local control box, with:
o 1 "LOCAL - CENTRAL" selector
o ‘’PLUS’’ and ‘’MINUS’’ pushbuttons for screw speed adjustment
o 1 screw speed display
o 1 dry solid temperature display
o 1 screw inlet heat transfer fluid temperature display
Page 95
Model based control framework for Site-wide OptimizatiON of data-intensive processes
Deliverable nr.
Deliverable Title
Version
D0.0
Process Industry Domain Analysis and Use Cases
0.03 - 13/01/2016
Page 95 of 110
Operator control on Mixer J150 (in proximity to the mixer valves, an operator terminal with):
On the screen(s) (non-complete list):
o Mimic screens displaying the mixer equipment, valves and auxiliaries and their statuses
(positions, on, off, faults, measurements, setpoints, etc.)
o A display screen of the operating modes, actual operations, selections, control statuses, etc.
For the controls (by function keys or other controls):
o Selection of "CENTRAL" or "LOCAL" mode (mixer, valves, etc.)
o "FASTER" and "SLOWER" mixer speed controls
o Mixer valve "OPEN" and "CLOSE" controls
o "AUDIBLE ALARM OFF" control
o "ACKNOWLEDGE" control
1 mixer “EMERGENCY STOP " pushbutton
Remote measurements:
Preheating screw J130
o Screw speed
o Motor amperage
o Dry product temperature
Mixer J150
o Motor power
o Motor amperage
o Mixer screw speed
o Motor speed
o Temperatures of the paste in the mixer
o Pitch temperature at mixer inlet
o Flap position
Remote settings:
Filling time of preheating screw J130 monitoring setpoint
o Preheating screw J130 speed setpoint
Mixer J150:
o Power setpoint
o Rotation speed setpoint
o The various alarm and fault thresholds
o Etc.
All start-up and stoppage sequences have to be taken into account.
Other electrical parameter measurements (like real and reactive power, total harmonic distortion, supply
harmonic content, voltage imbalance, etc.) could also provide valuable analysis data.
3.1.9.8 Paste Plant Automation System Architecture – Section J – Mixer
Page 96
Model based control framework for Site-wide OptimizatiON of data-intensive processes
Deliverable nr.
Deliverable Title
Version
D0.0
Process Industry Domain Analysis and Use Cases
0.03 - 13/01/2016
Page 96 of 110
Bow laser printerColor printer
Paste plant RTS redundant
servers
Control room
Paste plant
Plant LAN
Switch
Switch
Industrial hub
Paste plant RTS operator stations
Industrial hub
PLC
J, N,
PLC
G, HPLC
K, L
PLC
CE , M
Feeding system
Terminal K
Vibrocompactor 1
Terminal K
Vibrocompactor 2
Terminal L
cooling tunnel
PLC room
Paste plant
Level 2
Level 1
Extension
units
Terminal C
Packing coke
Terminal E020
Crusher
Terminal J
Preheating screw
Terminal J
Miweur
Terminal J
cooler
Terminal G
Truck unloading
Terminal H
Boiler
Terminal C140
Dynamic
classifer
Terminal E200
Ball mill
Figure 102 - Paste Plant Automation System Architecture – Section J – Mixer
Page 97
Model based control framework for Site-wide OptimizatiON of data-intensive processes
Deliverable nr.
Deliverable Title
Version
D0.0
Process Industry Domain Analysis and Use Cases
0.03 - 13/01/2016
Page 97 of 110
3.1.10 Use case: electrolysis process optimization, predictive detection of anodic incidents
3.1.10.1 Anode problems on pot and consequences
Problems that require replacement of the anode assembly:
Anode block split, broken, unrodded,
Broken clad,
Cut anode pin,
Fallen anode block.
Problems that do not require anode assembly replacement every time:
Mushroom (spikes),
Flatness defect (deformation).
Depending on the type of problems, the following may arise: instability, burst anode block, fallen anode
block, reduction of iron purity, temperature increase.
In all cases:
Poor current distribution,
Reduction in current efficiency.
Figure 103 - Anode spike/mushroom and deformation
3.1.10.2 Highlight on anode spikes / mushrooms
Periodic spikes crisis lead to production loss and carbon production overcost:
The specificity of spikes crisis is its “snowball effect”: as explained in the Anode Quality chapter, the root
cause is due to bad anodes generating dust. Drawn by movement of the metal, the carbon grains
concentrate effectively at different points of the bath/metal interface, where they form magmas called spikes
or mushrooms that adhere to the anodes.
The whole current distribution at the anode assemblies is destabilized in the pot and one of the principal
effects of this disturbance is an increase in temperature of the pot, whose performance deteriorates.
Moreover, because temperature accelerates the CO2 oxidation rate, the phenomenon spreads to other
anodes, which would not have produced carbon dust at a lower temperature. The phenomenon therefore
propagates throughout the pot.
Because of the batch anode manufacturing process, several dozens of bad quality carbon blocks can create
dust in other pots.
This leads first to a work rate increase of anode changing operation to remove all the anode assemblies
identified with spikes in addition to normal anode changing operations. A consequence of this increasing
work rate is a decrease in anode changing operation quality with respect to operation best practices,
especially regarding bath crusts removal from anode cavity when extracting the consumed anode. These
crusts can adhere to the anodes, create new dust fixation points and finally create additional spikes.
Page 98
Model based control framework for Site-wide OptimizatiON of data-intensive processes
Deliverable nr.
Deliverable Title
Version
D0.0
Process Industry Domain Analysis and Use Cases
0.03 - 13/01/2016
Page 98 of 110
This also leads to a work rate increase of anode production at the Carbon plant to replace all removed
anodes. A consequence of increasing production beyond nominal rates is a decrease in anode production
quality (for example, reducing anodes baking duration to speed up the production). These new anodes
produced can also potentially generate dust when on pots and finally accelerate the “snowball effect”.
Figure 104 – anode spikes crisis "Snowball effect" principle
Figure 105 - Aluminium Dunkerque: Spikes/Mushrooms crisis over 2009-2014 period
(Average 3.1% with 8%+ during crisis)
3.1.10.3 Predictive detection of anode spikes principle
Generate a robust alert priori to traditional measurement (anode current distribution measurement).
To be detailed in next document drafting iterations.
3.1.10.4 Predictive detection alerts and objectives
Successful performing of these optimization tasks in the electrolysis potline will have the following impacts:
Less anode effects implying less emissions
Decrease cases with non-standard anode behavior implying higher energy efficiency
Increased quality and quantity of aluminium produced
Increase anode operating life in pot and reduction of manipulation implying safer working
environment
Page 99
Model based control framework for Site-wide OptimizatiON of data-intensive processes
Deliverable nr.
Deliverable Title
Version
D0.0
Process Industry Domain Analysis and Use Cases
0.03 - 13/01/2016
Page 99 of 110
3.1.10.5 Existing Data from ALPSYS
Monitoring variables:
The main monitoring variables are listed below:
Voltage at pot terminals
Current flowing through the pot
Pot resistance calculated from the measurement of the voltage and current flowing through the pot
All operator manual controls
All pot status inputs.
Control variables:
Anode-to-cathode (metal-to-anode) distance adjusted by vertical displacement of the anode beam
Alumina feed intervals
AlF3 feed intervals
3.1.10.6 New sensor: anodic individual current measurement
New sensor: Anodic Current individual measurement.
We will equip ~30 pots in Aluminium Dunkerque plant with these sensors.
Figure 106 - Current distribution principle
The information generated will be the main raw data for the predictive anodic incident detection on
electrolysis pots.
Figure 107 - Anodic current individual sensor is linked to each anode assembly stem
3.1.10.7 Strategy: focus on real time data
To be detailed in next document drafting iterations.
Page 100
Model based control framework for Site-wide OptimizatiON of data-intensive processes
Deliverable nr.
Deliverable Title
Version
D0.0
Process Industry Domain Analysis and Use Cases
0.03 - 13/01/2016
Page 100 of 110
3.2 Plastics industry domain
Under the concept of MONSOON project two use cases will be integrated at GLN production cell. A short
description of each case study in presented in next section.
3.2.1 General objective
The following figure shows the simplified cost breakdown for the plastic production in the 2015 (source:
GLN). The impact of the raw materials costs is evident, hinting that waste reduction is a key aspect for
optimizing this process.
Figure 108 - Costs breakdown for the plastic production
3.2.2 Expected impacts
3.2.2.1 Impacts on productivity and production efficiency
Hereafter the main relevant topic to be addressed in order to reduce such value:
Material handling reduction - Addressing the decrease of resource consumption for companies in this
market can be done by reducing the number of non-quality product and maximizing their recycling. This just
will be possible if a product made of two materials can be recycled. Furthermore, the plastic production
process depends on various aspects related to parameters setup and maintenance procedures, which if well
calculated or designed, would increase the raw material savings.
Revenues and products quality: the quality of the plastic produced (and consequently the reduction of
wasted products) is directly linked to raw materials moisture and parameters. To create the proper model to
relate those information before the actual starting the injection process is necessary to drying the raw
material. It is also important to consider in this model the geometry of materials, the lubrication required, the
injection temperature, the mold temperature, the injection pressure, the number of injection cycles and the
compulsory dimensional tolerances. The combination of these factors will affect the product quality. GLN has
a KPI of 2% rejection rate for automotive, but observed rejection rates can reach 30% for complex products.
The optimization foreseen by MONSOON in the definition and control of such models will sensibly reduce
the losses, providing a tangible and replicable impact for this sector.
Maintenance and molding parameters setup: a machine operator changes usually a variety of parameters
on the machines deputed to molding operations (mold temperature, injection speed, temperature, etc.).
Today, the process is manually repeated until the machine starts to produce parts at desired quality level,
producing an indefinite number of non-quality product or even waste. This process could be sensibly
optimized, operating over different aspects, such as the temperature in different parts of the machine which
knowledge helps to understand the changes in viscosity if parameters need to be changed. Parameters
changes are today optimized by “trial and error” cycles (typically 5-6), producing scrap parts until the optimal
level is reached. In the MONSOON an overall decrease of resource consumption by 10% will be pursued: this
will be done by iterative interactions over the basic production flow in the plastic use-cases selected,
Page 101
Model based control framework for Site-wide OptimizatiON of data-intensive processes
Deliverable nr.
Deliverable Title
Version
D0.0
Process Industry Domain Analysis and Use Cases
0.03 - 13/01/2016
Page 101 of 110
measuring production results and comparing them with settled parameters, so real-time tuning the molding
process to drastically reduce the non-quality product creation. A predictive model will increase the
production process, and consequently reduce the waste.
Mold process problems: if a non-quality product is spotted, the corresponding machine/mold has to be
stopped until the problem is solved. The problem can be the consequence of a severe issue (e.g. mold
damaged or broken), arriving at taking up to 3 weeks for the proper repair or substitution. The MONSOON
approach it is such that specific problem can be recognized by large scale data analysis over real time data
acquisition and problem pattern recognition, reducing the number of wasted parts produced and
immediately trigging the required repair operations.
3.2.2.2 Impacts on Environmental Efficiency
According to the British Plastic Federation “30% of the energy use is ‘discretionary’, this means that the cost
is incurred because the site management has either decided to take no action or because it has not
recognized the opportunities for such improvement. In most of the cases, energy use and costs can be
reduced by over 30%”. Accordingly, the energy costs could be reduced by Management actions,
Maintenance actions and Capital investment actions. For the next year GLN aims at reducing the total cost of
energy (electricity) at about 8,23%. This strategy foresees the usage of sensors to be placed within injection
machines, providing information about energy consumption spent by single machines. The MONSOON
project will facilitate this transition process, also providing low level integration of physical sensor to real time
collect data (exactly like electricity consumption), in order to address an analysis of energy lacks and
performing a quickly energy consumption reduction process.
Figure 109 - Energy savings strategy
3.2.2.3 Additional impacts (HSE)
There are several key aspects that represent additional impacts of the MONSOON project:
Manpower: this aspect is highly related to the process productivity in pieces/hour or pieces/employee.
Employees have to inspect the final product, after injection process (an operator inspects and checks
(randomly) the product according to the product specifications) It is anticipated that a better process control,
with much less excursions and incidents, will result in a general HSE improvement in the molding machines.
Health and safety: During incidents treatment, the molding machines are opened and expose the workers to
very high heat (hot plastic). Fewer incidents in an optimized process, necessitating less manual intervention
by operators in degraded conditions, will decrease overall exposure to these stressors. MONSOON will
introduce a new approach that is expected to improve also industrial security and safety profile of the
industry: less abnormal situations to manage and less exposure to deteriorated conditions will result in less
incidents and accidents. Most work-related accidents occur during the maintenance process. Through the
MONSOON project is expected to reduce 30% of work-related accident.
Environment: The environmental impact of plastic production process is largely minimized by a proper
reduction pot design and operation. The reduction of non-quality products will therefore reduce the plastic
waste (that cannot be recycled), thus contributing to improve environmental performances. In the GLN
industry, the biggest waste stream is used as alternative raw material for other industries.
Page 102
Model based control framework for Site-wide OptimizatiON of data-intensive processes
Deliverable nr.
Deliverable Title
Version
D0.0
Process Industry Domain Analysis and Use Cases
0.03 - 13/01/2016
Page 102 of 110
The other wastes are almost fully recycled in the process. The knowledge of waste material and the share of
such information will be helpful for the entire ecosystem, also encompassing the primary circular economy
objective of the SPIRE initiative.
3.2.2.4 Impacts on European Process Industry’s Innovativeness
The impacts for the European plastic industries exploiting the MONSOON innovation are potentially
extremely relevant.
Overall financial value at stake, and industry sustainability: The European plastic industry is operating in
a global market, and therefore competing with major production areas in emerging countries, where labour,
raw materials and construction costs are much lower.
In addition there are several global competitiveness challenges of the European plastics industry39
mostly
resulting from aggressive competition by other countries such as Brazil (bio-plastics), Middle-east
(advantages due to oil availability), India (growing internal market and low labour costs), China (market size
and low structural costs).
It is clear that the maintenance of a significant EU capacity of primary plastic production will only be possible
by focusing on high-quality products being produced by means of extremely optimized production
processes.
The process control has a direct influence on the final product and the economic aspects of the process. In
this context, cost reduction and control is a major prerequisite for companies’ survival. Cost minimization of
process disturbances and maintenance or even prediction of these inefficiencies is critical for industry cost
competitiveness. The three main types of predictive functions are predictive maintenance (Asset Health
Management), process optimization (on all injection processes: power, fusion, compression, injection),
predictive quality (on the injection parameters definition: temperature, injection speed, and temperature). This
functions will be the base analysis that the MONSOON project will implement through large scale data
collecting and real-time analysis, implementing on top of such data the actual needed algorithms which will
maximize the company value.
Social Impacts: accordingly to “Plastics – the Facts 2014/2015, an analysis of European plastics production,
demand and waste data”, the growth of the plastics industry as affects in numerous sectors of the European
economy. The plastics industry is a key to the innovation of many products and technologies in other sectors
like: healthcare, energy generation, aerospace, automotive, maritime, construction, electronics, packaging or
textile. On the other hand the Plastic Europe also defend that “the innovation and growth in Europe depend
on manufacturing, in particular the plastics industry”. Finally, the unique characteristics of plastics allows to
make a strong contribution to a more environmentally sustainable and resource efficient Europe.
Page 103
Model based control framework for Site-wide OptimizatiON of data-intensive processes
Deliverable nr.
Deliverable Title
Version
D0.0
Process Industry Domain Analysis and Use Cases
0.03 - 13/01/2016
Page 103 of 110
3.2.3 Plastic Domain Use-Case-1
Use Case-1 (coffee capsules): This use case covers the commodity product area having large quantities with
little variation and relative low quality specifications (currently running on 12 machines at the GLN
production site).
In Use Case-1 it is important to receive the correct diameter and height of the coffee capsules and to make
sure that the holes at the bottom of the capsules are formed properly.
3.2.3.1 Use Case Delta-Line
Following picture shows the existing process line to be integrated in MONSOON project.
Actually nothing can be measured and evaluated automatically. Due to this it it impossible to define the
injection molding machine, the cavitiy or the injection molding cycle a part was made with. The MONSOON
platform can provide the automatic evaluation of the produced capsules. With the help of this information it
can be said if an error occurs randomly or if there is a systematic error, which would be the case if one
specific cavity produces fault parts or if a complete cycle produces fault parts. In both cases further
investigations can be undertaken in order to prevent the production of fault capsules. If there is a failure in a
single cavity it can be seen if there is damage in the molding tool or in the injection molding process or even
in the injection molding machine. If a whole injection cycle produced fault parts it is possible to identify the
injection molding machine that produced these parts so that further investigations can be undertaken to find
out why the fault parts were produced and how to stop it.
Figure 110 – delta line
The inline quality control system is represented by the following picture and able to control 100% quality of
the high volume production based on the visual system according to the defined specification.
Therefore a picture of each coffee-capsule is taken and compared with a reference. If a capsule doesn’t fit the
requirements it is taken out. This step of the production process is very important to make sure that the
capsules and the lids fit onto each other because both are welded after the coffee has been filled into the
capsule. The measuring of the height is also important because it might happen, that the filled coffee capsule
does not fit into the coffee machine.
Page 104
Model based control framework for Site-wide OptimizatiON of data-intensive processes
Deliverable nr.
Deliverable Title
Version
D0.0
Process Industry Domain Analysis and Use Cases
0.03 - 13/01/2016
Page 104 of 110
Figure 111 – delta line
3.2.4 Plastic Domain Use-Case-2
The case study SUBASSY expresses a more technical application regarding the injection processes. It is a
part used in the automotive industry, where methods of over-molding metal inserts are applied - 6x M5
bolts, 6x M8 bolts and 2x M8 washers.
Figure 112 – Metal inserts
Because it is a complex part that also has an assembly process associated, an infrastructure was developed to
allow the article to be automatically complete (plastic + metal inserts) at the end of each cycle.
The production goes through 4 distinct phases, which are aided by robots, allowing it to reach the final
product:
Stage 1 - Selection (through a SCARA pick & place robot) of the different bolts and washers and
positioning them in a pre-mold (templet);
Phase 2 - Collection of the inserts through a robot (6-axis robot) and application in the mold;
Phase 3 - Injection of the part and the over-molding of the inserts
Phase 4 - Collection of the article (through a Cartesian coordinate robot), optical inspection, with due
acceptance or rejection.
During the process it can happen that one of the metal insers is missing. This part also has much higher
quality requests than the coffee capsules and is not produced in such high amounts as the coffee capsules.
During the manufacturing of SUBASSY it will also be possible to evaluate the variables of the injection
molding process in order to detect failures of the process and the long-time-changing of process variables.
Page 105
Model based control framework for Site-wide OptimizatiON of data-intensive processes
Deliverable nr.
Deliverable Title
Version
D0.0
Process Industry Domain Analysis and Use Cases
0.03 - 13/01/2016
Page 105 of 110
In both cases the machine worker can be informed by the system and change or stop the process in order to
prevent the production of many fault parts.
3.2.4.1 The Mold
The mold consists of a two-cavity tool, from which two pieces are injected simultaneously per cycle. At the
end of the injection two articles, with metal inserts and joined by a plastic Sprue, are extracted, with a weight
around 1200 grams (450 grams / piece + 300 grams / sprue).
Figure 113 – SUBASSY Mold and plastic pieces
The mold has some limitations and aspects to improve, namely, the produced Sprue is very large and heavy,
therefore its reduction will be addressed in the next modification of the mold - implementing this
modification will slightly reduce the cycle time, consumption of raw material and will minimize the amount of
burrs (by injection overpressure).
3.2.4.2 Metal Inserts
There is a sampling procedure to control the metal inserts, which are provided by an external supplier.
However, the probability of having NOK elements entering the injection circuit is still around 20%.
On the other hand, due to the wear of the gripers (robots accessories used to catch the components/parts),
the probability of the occurrence of failures increases very significantly.
If the robot in stage 1 does not put one or more inserts in the pre-mold, because there is no control
mechanism present, the article at the end will be NOK - the cavity without the insert will be filled with plastic
and in step 4 this error will not be detected. The same happens if the robot in phase 2 cannot catch or drop
the insert.
Still in phase 2, due to the wear of the gripers, there is a likelihood that the insert will be not correctly placed
in the mold, resulting, at the end, in a part with displaced inserts and/or damaged stud bolts.
Likewise, over time and the wear of the electromagnets, there is a reduction of the magnetic force, resulting
in the falling of the inserts.
Page 106
Model based control framework for Site-wide OptimizatiON of data-intensive processes
Deliverable nr.
Deliverable Title
Version
D0.0
Process Industry Domain Analysis and Use Cases
0.03 - 13/01/2016
Page 106 of 110
Figure 114 – Defective Metal Inserts
3.2.4.3 Optical Inspection
For this article, due to its complexity and need for constant control, an optical inspection system was fitted,
allowing the maximization of production and allowing for more efficiency.
However, the optical inspection system is not the most appropriate for this particular application: variations
such as light, vibrations, air variations and noise contribute to incorrect inspection of the article when it is
collected from the mold after the injection cycle.
On the other hand there is a fault in the separation of the OK and NOK parts: it will be necessary to create a
physical barrier that guarantees the correct separation.
3.2.4.4 Additional data
There is an average consumption of raw material (PA6 with fiber) around 240ton / year.
An average of 500 000 articles/year is being produced.
It is estimated an annual expenditure of 150K euros to be used between maintenance, NOK parts,
production stoppages and production optimization.
There is a time gap between the different robots, which if not respected, can make them collide with
each other. This matter is normally related to human error.
3.2.4.5 Impacts
The MONSOON platform can provide better control of the injection process, translating a perfect harmony
between the machine process and the robot activities.
It can also predict possible errors, considering the time intervals of each robot cycle and also the absence of
metallic inserts in the grippers. This will promote a reduction of NOK parts.
On the other hand, increasing the efficiency of the process, with the MONSOON platform, the economic
issue will also be affected and it is expected to reduce the cost related to the maintenance process and the
production stops.
4 Conclusions
This deliverable has documented the state of the art for the aluminium and plastics domain on both the
technological and business aspects. It has described the aluminium and plastic domain-specific and cross-
sectorial use cases, and particularly detailing the two first use cases that will be addressed by the MONSOON
platform.
Page 107
Model based control framework for Site-wide OptimizatiON of data-intensive processes
Deliverable nr.
Deliverable Title
Version
D0.0
Process Industry Domain Analysis and Use Cases
0.03 - 13/01/2016
Page 107 of 110
Acronyms
Acronym Explanation
AA Anode Assembly
ABF Anode Baking Furnace
AD Aluminium Dunkerque
ALPSYS® Pots Process Control and Shop Management System
ATFD Aluminium Trifluoride Feeding Device
CAFD Crustbreaking and Alumina Feeding Device
DACS Data ACquisition System
DP Dry Products
ERP Enterprise Resource Planning
FC Fixed Carbon
FTA Furnace Tending Assembly
FTC Fume Treatment Center
KPI Key Performance Indicators
LIMS Laboratory Information Management System
LM Left Mold
MCS Manufacturing Control System
MES Manufacturing Execution System
MESAL™ Rio Tinto MES ALuminium
MPC Model Predictive Control
PLC Programmable Logic Controller
PQM Predictive Quality Management
PM Predictive Maintenance
PP Paste Plant
PTA Pot Tending Assembly (= electrolysis operation crane)
Right Mold
RTBS Rio Tinto Business Solution
RTS Real Time Supervision
VM Volatile Matter
WH Weighing Hopper
Page 108
Model based control framework for Site-wide OptimizatiON of data-intensive processes
Deliverable nr.
Deliverable Title
Version
D0.0
Process Industry Domain Analysis and Use Cases
0.03 - 13/01/2016
Page 108 of 110
List of figures
Figure 1 - A continuous process: 24 h / day, 365 days / year over the 30-50 years of plant operation. ......................................... 8
Figure 2 - overview of the aluminium electrolysis process .................................................................................................................................. 8
Figure 3 - a typical aluminium smelter ......................................................................................................................................................................... 9
Figure 4 - main casthouse finished products ............................................................................................................................................................. 9
Figure 5 - a typical potline view..................................................................................................................................................................................... 10
Figure 6 - Schematic cross-section of an AP pot ................................................................................................................................................... 10
Figure 7 - Description of a typical anode assembly (AP-50 technology) ..................................................................................................... 11
Figure 8 - Anode macroscopic structure ................................................................................................................................................................... 11
Figure 9 - Placement of a new AA (AP30 technology) ......................................................................................................................................... 12
Figure 10 - Spent anode removal at end of cycle .................................................................................................................................................. 12
Figure 11 - Reaction causing carbon consumption .............................................................................................................................................. 13
Figure 12 - Net and gross consumption .................................................................................................................................................................... 14
Figure 13 - Anode cycle in an AP-30 pot ................................................................................................................................................................... 14
Figure 14 – matrix and binder cokes ........................................................................................................................................................................... 15
Figure 15 – carbon dusting .............................................................................................................................................................................................. 15
Figure 16 – anode spike / mushroom ......................................................................................................................................................................... 16
Figure 17 – dust removal .................................................................................................................................................................................................. 16
Figure 18 - Anode fracture profiles due to thermal shock ................................................................................................................................. 16
Figure 19 – corner fracture. ............................................................................................................................................................................................. 17
Figure 20 - Relative weight of parameters versus thermal shock resistance.............................................................................................. 17
Figure 21 - Breakdown of AA anode voltage drop at mid-life ......................................................................................................................... 18
Figure 22 – “cold” part of the anode manufacturing process ......................................................................................................................... 20
Figure 23 - Typical green anode composition......................................................................................................................................................... 23
Figure 24 - Diagram of green anode preparation ................................................................................................................................................. 24
Figure 25 - Milling/Classification block diagram .................................................................................................................................................... 25
Figure 26 - Paste plant ...................................................................................................................................................................................................... 26
Figure 27 - Example of DP grain size distribution ................................................................................................................................................. 26
Figure 28 - Proportioning/mixing block diagram .................................................................................................................................................. 27
Figure 29 - Vibrocompacting sequence (LM: Left Mold / RM: Right Mold / WH: Weighing Hopper) ........................................... 28
Figure 30 - Vibrocompaction forming principle ..................................................................................................................................................... 28
Figure 31 - Vibrocompactor ............................................................................................................................................................................................ 29
Figure 32 – anode properties changing at baking ................................................................................................................................................ 30
Figure 33 - Baking principle 1 ........................................................................................................................................................................................ 30
Figure 34 - Baking principle 2 ........................................................................................................................................................................................ 31
Figure 35 - General view of anode baking furnace with green anodes arriving ....................................................................................... 31
Figure 36 - View of anode baking furnace section ................................................................................................................................................ 32
Figure 37 - View of 2-fire, 34-section anode baking furnace ........................................................................................................................... 33
Figure 38 - Gas and anode temperature profiles ................................................................................................................................................... 34
Figure 39 - Successive baking phases for a furnace section ............................................................................................................................. 35
Figure 40 - Heating with flow (gas) and against the flow (fuel-oil) ................................................................................................................ 35
Figure 41 - Fire structure and heating equipment ................................................................................................................................................ 36
Figure 42 - FTA anode grab ............................................................................................................................................................................................ 36
Figure 43 - Packing coke suction .................................................................................................................................................................................. 37
Figure 44 - Demolition of an old flue wall at Aluminium Dunkerque ........................................................................................................... 38
Figure 45 - Anode baking furnace fume treatment center (FTC) .................................................................................................................... 39
Figure 46 - Rodding shop overview ............................................................................................................................................................................. 41
Figure 47 - Rodding shop processing stages – functional blocks .................................................................................................................. 41
Figure 48 - Cooling the spent anodes ........................................................................................................................................................................ 42
Page 109
Model based control framework for Site-wide OptimizatiON of data-intensive processes
Deliverable nr.
Deliverable Title
Version
D0.0
Process Industry Domain Analysis and Use Cases
0.03 - 13/01/2016
Page 109 of 110
Figure 49 - Cleaned spent anodes ................................................................................................................................................................................ 43
Figure 50 - Thimble stripping press ............................................................................................................................................................................. 43
Figure 51 - Anode/stem mating station ..................................................................................................................................................................... 44
Figure 52 - Melting cast iron in an induction furnace (1 450°C)...................................................................................................................... 45
Figure 53 - Cast iron pouring station .......................................................................................................................................................................... 45
Figure 54 – treatment of recycled carbon products.............................................................................................................................................. 46
Figure 55 - The main steps of electrolysis ................................................................................................................................................................. 47
Figure 56 – electrolytic bath ............................................................................................................................................................................................ 47
Figure 57 - Thermal balance (AP 35 technology) ................................................................................................................................................... 49
Figure 58 - Voltage drop (AP 35 technology) .......................................................................................................................................................... 50
Figure 59 - Metal pad speed and Metal pad deformation ................................................................................................................................ 51
Figure 60 - Maximum usable height ............................................................................................................................................................................ 52
Figure 61 - Safety margin ................................................................................................................................................................................................. 52
Figure 62 - Anodes position and change order in AP30 technology pot .................................................................................................... 53
Figure 63 - Correct anode assembly gauging ......................................................................................................................................................... 53
Figure 64 - Main anode changing steps: crust breaking, extraction, crust removal, anode gauging, insertion and covering
..................................................................................................................................................................................................................................................... 54
Figure 65 - Anode current distribution measurement ......................................................................................................................................... 55
Figure 66 – emissions and gas treatment principle .............................................................................................................................................. 57
Figure 67 - Schematic of an injection molding production cell and related equipment layout ........................................................ 58
Figure 68 - Melting and transportation of the plastic .......................................................................................................................................... 59
Figure 69 - Elements taking part in the melting process .................................................................................................................................... 59
Figure 70 - Closing of the mold and filling of the cavity .................................................................................................................................... 60
Figure 71 - Quantity of solidified material in the cooling phase. .................................................................................................................... 61
Figure 72 - Injection molding machine signals. ...................................................................................................................................................... 62
Figure 73 - Injection mold signals. ............................................................................................................................................................................... 63
Figure 74 - Typical illustration of injection process control and commands. ............................................................................................ 65
Figure 75 – Screw position ............................................................................................................................................................................................... 66
Figure 76 – Screw rotation ............................................................................................................................................................................................... 66
Figure 77 – Screw torque .................................................................................................................................................................................................. 67
Figure 78 – Machine injection pressure ..................................................................................................................................................................... 67
Figure 79 – Nozzle injection pressure ......................................................................................................................................................................... 68
Figure 80 – Nozzle injection temperature ................................................................................................................................................................. 68
Figure 81 – Material molding pressure ....................................................................................................................................................................... 69
Figure 82 – Material molding temperature .............................................................................................................................................................. 69
Figure 83 – Cavity molding temperature ................................................................................................................................................................... 70
Figure 84 – Cavity heat flow ............................................................................................................................................................................................ 70
Figure 85 - Channel input temperature controller ................................................................................................................................................ 71
Figure 86 - Channel output temperature controller ............................................................................................................................................. 71
Figure 87 - Basic schema of a DACS system ............................................................................................................................................................ 72
Figure 88 - Example of complex distributed DACS system in Plastic Domain ........................................................................................... 73
Figure 89 - Configuration of injection molding unit for data collection at field level ............................................................................ 74
Figure 90 - Costs breakdown for the aluminium production ........................................................................................................................... 75
Figure 91 - Initial selected use cases areas ............................................................................................................................................................... 78
Figure 92 - Functional automation and IT architecture in Aluminium Dunkerque .................................................................................. 79
Figure 93 - Functions capturing data on the anode life cycle .......................................................................................................................... 80
Figure 94 -MESAL Anode ID Card (AQUA, Anode Sheet report) ..................................................................................................................... 83
Figure 95 - Pot Process Control micro-controller and electrical cabinet ..................................................................................................... 84
Figure 96 - Anode Predictive Quality principle ....................................................................................................................................................... 87
Figure 97 - MIREA device ................................................................................................................................................................................................. 88
Page 110
Model based control framework for Site-wide OptimizatiON of data-intensive processes
Deliverable nr.
Deliverable Title
Version
D0.0
Process Industry Domain Analysis and Use Cases
0.03 - 13/01/2016
Page 110 of 110
Figure 98 - Paste Plant continuous mixing process .............................................................................................................................................. 89
Figure 99 – BUSS Kneader views ................................................................................................................................................................................... 89
Figure 100 - BUSS Kneader process section............................................................................................................................................................. 90
Figure 101 - BUSS Kneader working principle......................................................................................................................................................... 90
Figure 102 - Paste Plant Automation System Architecture – Section J – Mixer ........................................................................................ 96
Figure 103 - Anode spike/mushroom and deformation ..................................................................................................................................... 97
Figure 104 – anode spikes crisis "Snowball effect" principle ............................................................................................................................ 98
Figure 105 - Aluminium Dunkerque: Spikes/Mushrooms crisis over 2009-2014 period ...................................................................... 98
Figure 106 - Current distribution principle ............................................................................................................................................................... 99
Figure 107 - Anodic current individual sensor is linked to each anode assembly stem ........................................................................ 99
Figure 108 - Costs breakdown for the plastic production............................................................................................................................... 100
Figure 109 - Energy savings strategy ....................................................................................................................................................................... 101
Figure 110 – delta line .................................................................................................................................................................................................... 103
Figure 111 – delta line .................................................................................................................................................................................................... 104
Figure 112 – Metal inserts ............................................................................................................................................................................................. 104
Figure 113 – SUBASSY Mold and plastic pieces .................................................................................................................................................. 105
Figure 114 – Defective Metal Inserts ........................................................................................................................................................................ 106
List of tables
Table 1 – Related documents ........................................................................................................................................................................................... 6
Table 2 - Main chemical impurities present in anodes ........................................................................................................................................ 19
Table 3 - Schematic review of anode characteristics meeting user quality specifications ................................................................... 22
Table 4 – key parameters of the paste plant ............................................................................................................................................................ 29
Table 5 – transformation of the anode during baking......................................................................................................................................... 39
Table 6 - Injection process physical measures. ....................................................................................................................................................... 64
Table 7 - Injection process control and commands. ............................................................................................................................................. 65
Table 8 – Aluminium domain use cases data volume .......................................................................................................................................... 80
Table 9 – Aluminium use case #1 equipment .......................................................................................................................................................... 94
References