Process modeling of brackish and seawater nanofi ltration
J. Palmeria,*, N. Ben Amarb, H. Saidanib,c, A. Deratanic
aUniversité de Toulouse, Université Paul Sabatier, CNRS, Laboratoire de Physique Théorique(IRSAMC); 118 route de Narbonne, 31062 Toulouse Cedex 4, Franceemail: [email protected] de Modélisation Mathématique et Numérique dans les Sciences de l’Ingénieur, ENIT, Campus Universitaire, B.P 37 Le Belvédère 1002, Tunis, TunisiacInstitut Européen des Membranes, Université Montpellier 2 (ENSCM, UM2, CNRS),34095 Montpellier cedex 05, France
Received 15 September 2008; Accepted 2 September 2009
A B S T R AC T
We demonstrate that the multi-scale nanofi ltration (NF) “process modeling” software, NanoFlux, that we are developing can be used to perform reliable desalination plant modeling for highly concentrated brine and seawater feeds in real-world situations.
Keywords: Nanofi ltration; Modeling; Desalination; Process simulation; Seawater
1. Introduction
We have incorporated advanced nanoporous mem-brane transport models into the multi-scale nanofi ltra-tion (NF) “process modeling” software, NanoFlux, that we are developing for simulating multi-stage/multi-module NF plants [1–3]. This modeling tool has been used to simulate NF plants in real-world situations and two case studies are presented here for applications concerning the desal-ination of industrial effl uents and seawater (SW):
NF of brackish and highly concentrated brines (textile effl uent, Tunisia) [4];Seawater NF (SWNF pretreatment plant for SWRO, Umm Lujj, Saudi Arabia) [5].
In the fi rst case, we present only a feasibility study because a full scale plant has not yet been built. In the sec-ond, we show that the NanoFlux predictions are in good agreement with the real plant operating data. It is thus possible to obtain quick and reliable simulation results thanks to both the powerful and robust computational algorithms employed and the internal NanoFlux data-base that contains the principal commercial membranes. This modeling tool is easy to use, thanks to its ergonomic
1.
2.
graphical user interface, and has been validated using real case studies [1–3].
There is a pressing need for simulation tools in NF because the complexity of the transport mechanisms, coupled with the wide range of different nanofi lters and plant designs available, makes it extremely diffi cult to choose the right membrane and plant design for a given application in a reliable and cost effective way [6–8]. Reli-able transport modeling is especially crucial in this area because the composition of the permeate (the product) depends sensitively on the choice of membrane, the pH and composition of the feed (individual ionic concentra-tions and total feed ionic strength) and the operating con-ditions (applied pressure, cross-fl ow velocity, etc.). Since in NF plants many membrane modules may be linked in series (Fig. 1), it is important for reliable plant simulations to be able to account for the changing feed composition and fl ux that is injected into each membrane element and the concomitant change in membrane performance (typically the feed gets more and more concentrated in proceeding from one element to the next in a brine-staged plant and the membrane rejection performance gets degraded). In order to gauge the global fi ltration performance and eco-nomic attractiveness of a plant design, reliable methods are also needed to model concentration polarization and tangential module pressure drops (the latter implies that *Corresponding author.
Presented at the Conference on Membranes in Drinking and Industrial Water Production, 20–24 October 2008, Toulouse, France.
J. Palmeri et al. / Desalination and Water Treatment 9 (2009) 263–271264
the trans-membrane pressure for a given element, which is the transport driving force in NF, decreases as the feed passes from one element to the next).
Our results show that is feasible to use advanced membrane transport modeling techniques to perform reliable NF plant modeling for highly concentrated feeds in real-world applications (where a partial demin-eralization must often be carried out in situations where the composition and characteristics of the feed may change due to wide seasonal variations in salinity and/or temperature). The NanoFlux software tool puts the full power of state-of-the-art NF membrane transport modeling at the fi ngertips of plant engineers and ulti-mately decision-makers. The possibility of performing reliable simulations of plant performance sets the stage for reliable estimates of plant construction and operating costs.
2. Industrial applications of NF
For certain industrial applications, NF membrane processes have a number of advantages with respect to Reverse Osmosis (RO) ones [3–8]:
Lower working pressures and higher fl uxes, leading to lower operating costs.High rejection of organic molecules with molecular weights higher than the cut-off (MWCO) of the NF membrane (200–1000 Da) with potentially less fouling.High rejection of multivalent ions and low to mod-erate rejection of monovalent ions, leading to a high mono to multivalent selectivity.
In industrial effl uent and wastewater treatment one is usually concerned with reducing (in the fi ltration perme-ate) the concentration of: organic compounds, measured, for example, by COD (Chemical Oxygen Demand); salts,
1.
2.
3.
but maintaining a high mono to multivalent ion selectiv-ity; and heavy metal ions, all the while maintaining high permeate fl uxes at relatively low working pressures and respecting environmental norms concerning the usually highly concentrated retentate. When NF is used as a pre-treatment to a SWRO [5, 6] desalination plant, then the goal is to reduce the TDS (total dissolved solids), hard-ness, and turbidity suffi ciently to take the load off the RO membranes and increase the recovery and lower the operational costs of potable water production.
3. Ion membrane transport and multi-scale plant modeling
The composition of the feed is fi xed by the concen-tration of the N ions making up the mixture, each with a concentration c i Ni
f ( , , )= 1 … . At the one membrane element level theoretical ion rejection predictions for multi-electrolyte solutions are obtained using a Hin-dered Electro-Transport (HET) theory that is based on the volume averaged Stokes equation for solution fl ow and incorporates steric and hydrodynamic hindrance factors into the Extended Nernst–Planck (ENP) ion fl ux equations and steric/Donnan partitioning at the mem-brane/solution interfaces [1–3, 8, 9]. The volume aver-aged Stokes equation is given by [3]
10L
j P x xp
v = −∂ ∂ − ∂ ∂/ /ρ φ (1)
and the ENP equations, which describe the coupled trans-port of N ions, are composed of three terms (diffusion, electrical migration, and convection) [3]:
j Dcx
z D cF
RT xK c ji i
ii i i i
ci V= − ∂
∂− ∂
∂+φ (2)
The volume averaged Stokes equation (1) allows one to calculate jv as a function of ΔP, which requiresLp
0 [m/(s Pa) or L/(h m2 bar)], the pure water hydrau-lic permeability. The other quantities and parameters appearing in Eqs. 1 and 2 are :
ji molar ionic fl ux density (mol m−2 s−1),D–
i effective ionic diffusion coeffi cient in the membrane (m2 s−1),
c–i (x) local average ionic concentration in the membrane (moles/m3 of pore volume),
P(x) local average pressure in the membrane (bar),
φ(x) local average electrical potential in the membrane (V),
jV trans-membrane solution volume fl ux density (m s−1 or L h−1 m−2).
x transverse distance across the membrane (m) (0 ≤ x ≤ lm, where lm is the membrane thickness).
Fig. 1. Schematic diagram of a multi-stage/multi-module three brine-staged NF plant with each stage containing one housing composed of four membrane elements in series. In order to increase the plant productivity (total permeate fl ux) part of the retentate can be recycled and this feature can easily be handled with NanoFlux. The increasingly dark shade of each successive membrane element repre-sents the increasing salt concentration.
J. Palmeri et al. / Desalination and Water Treatment 9 (2009) 263–271 265
In Eq. 1 ρ( ) = ∑x F z C xi ii
( ) is the local ion charge den-
sity. In Eq. 2, Kic is the convective hindrance factor and
the effective ionic diffusion coeffi cients, D–
i, can be written as, D D Ki i i
dp= ϕ τ/ , where Di is the bulk ionic diffusion
coeffi cient, Kid is the hindered diffusion factor, ϕp is the
membrane porosity, and τ is the effective tortuosity. It is thus possible to defi ne an effective membrane thickness, l l leff m p m= ( ) >τ ϕ/ . The dimensionless convective and dif-fusive hindrance factors, Ki
c and Kid , depend on λi = ri/rp,
the ratio of the ionic radius, ri, to the effective membrane pore radius, rp (some of the ion parameters used in the NanoFlux simulations are collected in Table 1). Further-more, in NF, the electric current density across the mem-
brane vanishes, j F z jc i ii
N
= ==∑
1
0, which allows one to
obtain a relation between the electric potential gradient and the ionic concentrations. At the macroscopic level electro-neutrality must be obeyed in the feed, membrane and permeate:
z ci if
i
N
=∑ =1
0 (feed); z c x Xii
N
i m=∑ + =1
0( ) (membrane);
z cii
N
ip
=∑ =1
0 (permeate) (3)
where cif and ci
p are, respectively, the ionic concentra-tions in the feed and the permeate and Xm is the effec-tive membrane charge (moles/m3 of pore volume). In NF the HET equations must be solved using the fi ltration condition c j ji
pi v= / , as well as Donnan/steric
partitioning at the membrane/external solution inter-faces. An extended version of the transport model has been developed for modeling the NF of highly concen-trated feeds. In this extended model a residual partition coeffi cient, ki
res , is introduced into the ion partition coeffi -cients, ki , for certain ionic species in order to account for exclusion effects other than the electrostatic and steric ones ( dielectric,…) [10–14]:
kcc
kz FRTi
i
iires
iS i
Df(p)
f(p)
f(p) f(p) = = −⎡
⎣⎢⎤⎦⎥
Φ Δexp φ (4)
where the second term, ΦiS , accounts for steric effects
and the last for electrostatic (Donnan) ones [ ΔφDf(p) is the
Donnan potential at the feed (f) (permeate (p)) inter-faces].
Once the fi ltration problem has been well defi ned, NanoFlux can be used to calculate numerically (via accurate and robust fi nite difference methods) all the interesting system properties, including ionic rejectionR c ci i
pif= −1 / and volume fl ux density, jv, vs. applied
pressure, ΔP, and the fi ltration potential ΔφF (or any of its components, such as the streaming potential). The parameters that must be supplied in order to perform rejection and potential calculations are :
cif , ionic feed concentrations [mol/m−3 or mol/L−1],
ri, the effective ion radii [m], (5)rp, the effective membrane pore radius [m],leff, the effective membrane thickness [m],Xm, effective membrane charge density [mol m−3 or mol/L−1].
For the effective ion size we have chosen to adopt the ion crystal (or Pauling) radius, which, although cer-tainly an approximation in an aqueous medium, has been shown to be a reasonable starting point for explain-ing differences in rejection between ions of the same valence [1–3, 9]. The membrane parameters, rp, leff, and Xm, are termed “effective” because their chosen values are based on an approximate modeling protocol—and not an ab initio approach—that depends on fi tting the model to experiment (the chosen values do not therefore necessarily correspond to the “real” physical values). The extended transport model also requires the residual ionic partition coeffi cients, which are estimated by fi t-ting the transport model to single salt rejection experi-ments at high feed concentrations where all electrostatic effects are strongly screened and can therefore to a very good approximation be neglected.
4. NF single element and plant simulation
In order to simulate the operation of real NF plants several hurdles had to be overcome, including the ability to handle:
Multi-component ion mixtures (~ 7 predominant ones in seawater and effl uents);Multiple modules and/or Multiple-stages;Concentration polarization effects;Tangential pressure drops (cross-fl ow hydrodynamics).
As we demonstrate here, NanoFlux meets these requirements and can therefore be used for modeling R&D and industrial applications of NF (for feeds pos-sessing up to eleven ions). The ion transport equations
•••••
1.
2.3.4.
Table 1Ion parameters used in the NanoFlux simulations.
IonBulk diffusion coeffi cient(10−9 m2 .s−1)
Crystal (Pauling) radius (nm)
Na+
K+
1.3341.957
0.0950.133
Ca2+ 0.792 0.099Mg2+
Cl−
HCO3−
0.7062.0321.185
0.0650.1810.207
SO42− 1.065 0.290
J. Palmeri et al. / Desalination and Water Treatment 9 (2009) 263–271266
are solved across each membrane element and mass and fl ow balance is imposed within each membrane module. Trans-membrane transport and mass and fl ow balance equations are coupled to each other and there-fore they must be solved iteratively in order to obtain a self- consistent numerical solution to the multi-scale NF transport problem (from the active NF layer up to the full multi-stage/multi- module plant, see Fig. 1). The model membrane parameters (Eq. 4) used in the transport mod-eling, which depend in general on feed pH and ionic concentrations, are drawn from the internal NanoFlux “membrane-single salt” database [1–3]. The database values of these membrane parameters (Xm and leff) for a single salt-membrane pair are obtained by adjusting the HET model to experimental salt rejection data, obtained at carefully chosen values of feed salt concentration and pH. Estimates for the model membrane parameters for both single salts and ion mixtures (containing up to 11 ions) in conditions not studied experimentally are obtained using robust interpolation, extrapolation, and weighting methods [1–3, 12]. If the physical membrane thickness, lm, can be measured using electron micros-copy, then the fi tted value for leff can be used to estimate the combined effects of tortuosity and porosity: leff/lm = τ/ϕp. In membrane fi ltration, the ionic concentrations, ci, and fl uxes, Q, for the feed (f ), permeate (p), and retentate (r) are related via single element/module mass and fl ow balance ( c Q c Q c Qi
ff i
pp i
rr= + , Qf = Qp + Qr). The driving
force is the average pressure gradient across the mem-brane; the volume fl ux density, jV, crossing the mem-brane increases with increasing pressure and the ion rejection, Ri is a function of jV.
The best choice of NF membrane and plant design depends on the feed fl ux and composition and on the target goals for the productivity (permeate fl ux) and retentate fl ux, as well as the quality of the permeate and retentate in terms of component concentrations. The major challenge of designing an NF plant for a given industrial problem is to arrive at the imposed produc-tivity and quality targets accurately and at the lowest possible cost. An important result of an extensive study of NF membranes suitable for use in a pre-treatment plant for SWRO [6] was that at the high TDS typical of seawater, NF membranes can be divided roughly into three groups with very different fi ltration performances: group 1 membranes have high rejection and low per-meate fl ow; group 2 membranes have an intermedi-ate balanced performance of permeate fl ow and ion rejection; and group 3 membranes have high fl ow and modest rejection. Faced with this variety, the goal of NF process modeling is to speed-up both the choice of membrane and plant design, as well as plant operating optimization, using suitable simulation tools, such as NanoFlux.
4.1. NF of brackish and highly concentrated brines (textile effl uent, Tunisia)
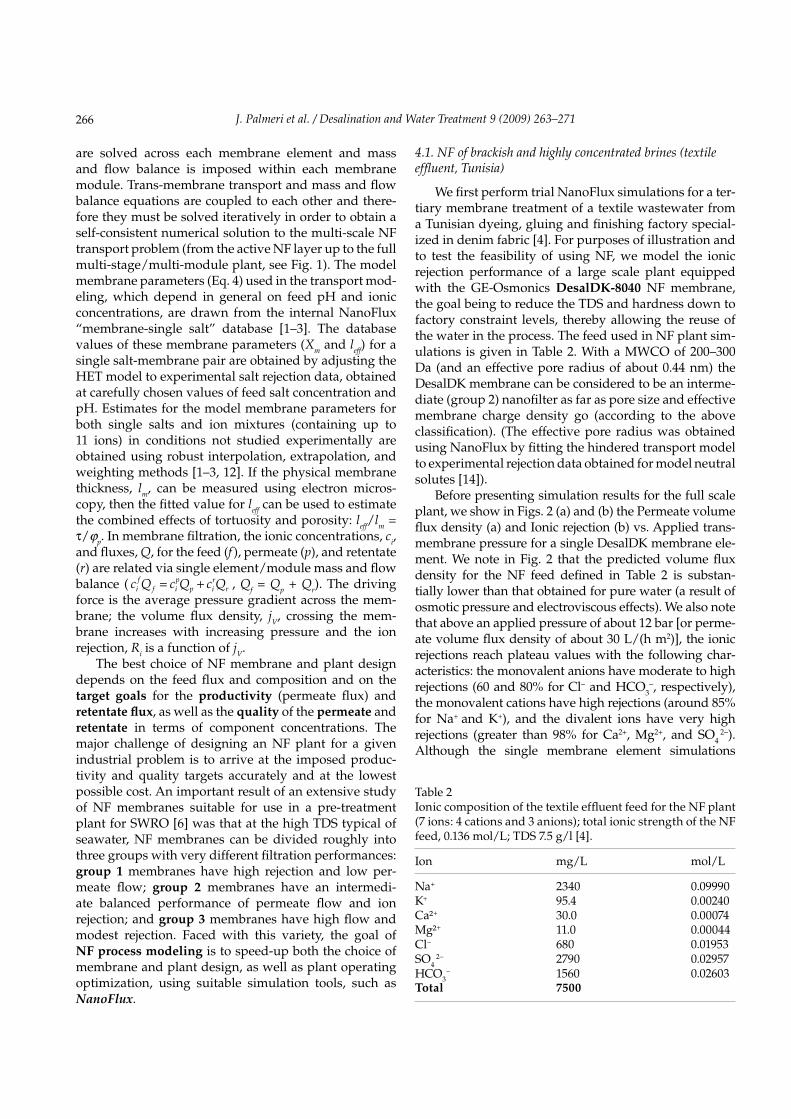
We fi rst perform trial NanoFlux simulations for a ter-tiary membrane treatment of a textile wastewater from a Tunisian dyeing, gluing and fi nishing factory special-ized in denim fabric [4]. For purposes of illustration and to test the feasibility of using NF, we model the ionic rejection performance of a large scale plant equipped with the GE-Osmonics DesalDK-8040 NF membrane, the goal being to reduce the TDS and hardness down to factory constraint levels, thereby allowing the reuse of the water in the process. The feed used in NF plant sim-ulations is given in Table 2. With a MWCO of 200–300 Da (and an effective pore radius of about 0.44 nm) the DesalDK membrane can be considered to be an interme-diate (group 2) nanofi lter as far as pore size and effective membrane charge density go (according to the above classifi cation). (The effective pore radius was obtained using NanoFlux by fi tting the hindered transport model to experimental rejection data obtained for model neutral solutes [14]).
Before presenting simulation results for the full scale plant, we show in Figs. 2 (a) and (b) the Permeate volume fl ux density (a) and Ionic rejection (b) vs. Applied trans-membrane pressure for a single DesalDK membrane ele-ment. We note in Fig. 2 that the predicted volume fl ux density for the NF feed defi ned in Table 2 is substan-tially lower than that obtained for pure water (a result of osmotic pressure and electroviscous effects). We also note that above an applied pressure of about 12 bar [or perme-ate volume fl ux density of about 30 L/(h m2)], the ionic rejections reach plateau values with the following char-acteristics: the monovalent anions have moderate to high rejections (60 and 80% for Cl− and HCO3
−, respectively), the monovalent cations have high rejections (around 85% for Na+ and K+), and the divalent ions have very high rejections (greater than 98% for Ca2+, Mg2+, and SO4
2−). Although the single membrane element simulations
Table 2Ionic composition of the textile effl uent feed for the NF plant (7 ions: 4 cations and 3 anions); total ionic strength of the NF feed, 0.136 mol/L; TDS 7.5 g/l [4].
J. Palmeri et al. / Desalination and Water Treatment 9 (2009) 263–271 267
g ive an idea of how well an NF plant equipped with this membrane could perform, they are not suffi cient for a full understanding because of the changing nature of the feed injected into each successive element in a multi-module plant. For this reason we now turn to the NF plant simu-lations.
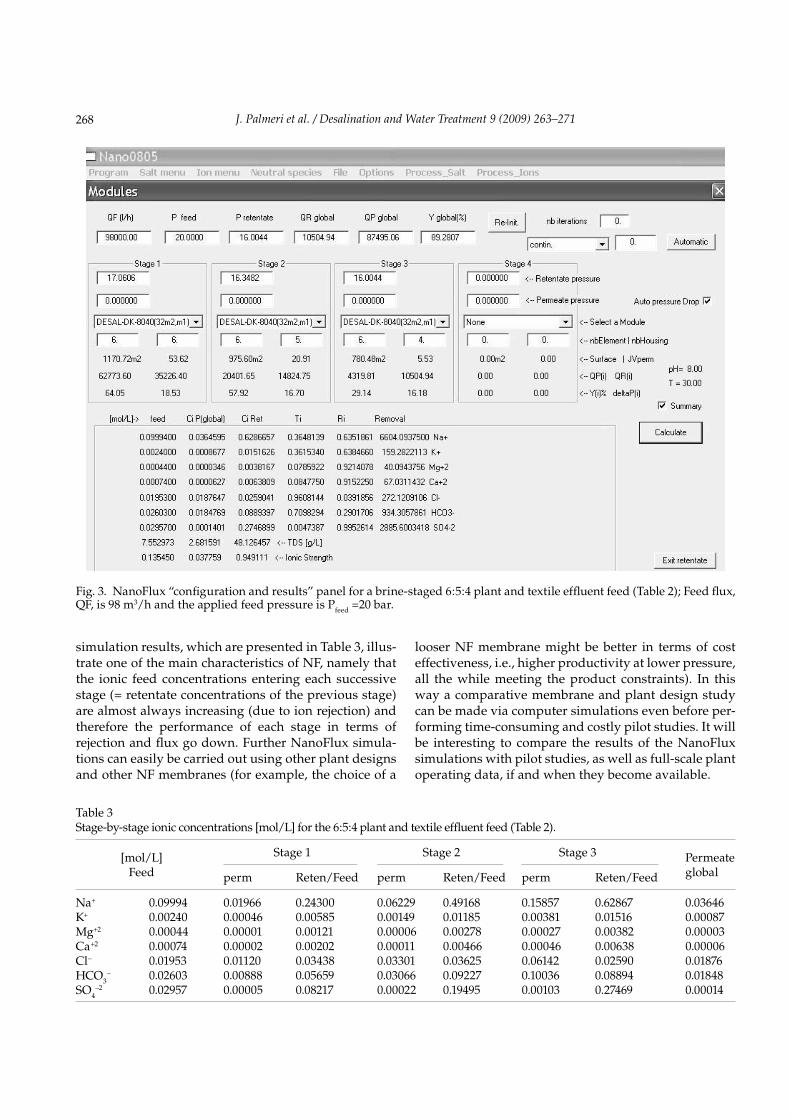
For illustrative purposes we fi x the incoming feed fl ux at QF = 98 m3 h−1 (98 000 L h−1) and adopt the fol-lowing plant design: 8" membrane elements with six ele-ments in series per housing arranged in a 3-brine staged 6:5:4 confi guration without recycling (six housings in parallel in stage 1, fi ve in parallel in stage 2, and four in parallel in stage 3). There are 90 membrane elements in this plant. Because in a brine staged set-up the reten-tate of one stage becomes the feed of the next, very high yields Y can be reached for large plants, even without recycling [Y = (Permeate Flux)/(Feed Flux)]. The total membrane surface area is Stotal = 2927 m2 = 90 membrane elements × 32.52 m2/element.
The results of the simulations, which are presented in the NanoFlux panel, Fig. 3, suggest that the present NF plant is capable of reducing the salt concentration and hardness to low enough levels for the reuse of the water in the industrial process. The predicted permeate fl ux, coming from combining the permeates of the 3 stages, is QP = 87.5 m3h−1 (87 500 L h−1). The retentate fl ux is QR = 10.5 m3 h−1 (10 500 L h−1) and the global yield is Y = QP/QF = 89%.
In the simulation the feed pressure of 20 bar was chosen to get a yield close to 85%. An overall measure of produc-tivity per unit feed pressure and unit membrane surface area is the global permeability: L = QP/(PFeed Stotal) = 1.5 L/(h m2 bar) [to be compared with the pure water permeabil-ity of 4.87 L/(h m2 bar)]. The permeate TDS is 2.68 g L−1 and that of the retentate is 48.13 g/L. Although the global ion TDS rejection is 65% (72% in terms of ionic strength),
the value for monovalent ions is much lower than that for divalent ones (> 90%), leading to high multi- to mon-ovalent ion selectivity, as expected in NF. The ratio of mono to multivalent ion concentrations has thus greatly increased in going from the feed to the permeate, thanks to the very high rejection of multivalent ions. On the con-trary this ratio has decreased in going from the feed to the retentate, as follows from simple mass balance. For each stage the following detailed individual stage information can be read off the results panel (Fig. 3):
Permeate Flux, Retentate Flux, QP,stage [L h−1] QR,stage [L/h]Stage Yield (Recovery), Average Pressure drop Y = QP, stage/QF,stage, deltaP [bar]
For each ion the following simulation results are also presented: Feed, Permeate, and Retentate concentrations [mol L−1]; Ion passage, T c ci i
pif= / [−], Ion rejection, Ri
= 1 – Ti [−], and Ion removal= Q cR ir× [mol h−1]. An
important factor, besides the quality of the permeate (controlled by the ion passage or rejection), is the retentate concentration factor RCF c ci i
rif= / , which can
be obtained from the results panel (Fig. 3). When it comes to evaluating methods of retentate disposal, this factor is especially important for certain multivalent ions, because of precipitation thresholds or high toxicity (such as for heavy metal ions, if present). In the present case the NanoFlux predictions reveal that the retentate is 6 times more concentrated than the feed in terms of TDS.
The details concerning the changes in ionic concentrations as one progresses through each of the three stages can also be obtained using NanoFlux. These
(a) (b)
Fig. 2. NanoFlux simulations for the Textile effl uent feed (a) Permeate volume fl ux density and (b) Ionic rejection versus applied trans-membrane pressure for a single DesalDK membrane element (30°C, pH 8, NF feed solution defi ned in Table 2). Negatively charged membrane with Xm = 0 16. mol/L and leff = 30 mμ (obtained from the NanoFlux internal database).
J. Palmeri et al. / Desalination and Water Treatment 9 (2009) 263–271268
simulation results, which are presented in Table 3, illus-trate one of the main characteristics of NF, namely that the ionic feed concentrations entering each successive stage (= retentate concentrations of the previous stage) are almost always increasing (due to ion rejection) and therefore the performance of each stage in terms of rejection and fl ux go down. Further NanoFlux simula-tions can easily be carried out using other plant designs and other NF membranes (for example, the choice of a
looser NF membrane might be better in terms of cost effectiveness, i.e., higher productivity at lower pressure, all the while meeting the product constraints). In this way a comparative membrane and plant design study can be made via computer simulations even before per-forming time-consuming and costly pilot studies. It will be interesting to compare the results of the NanoFlux simulations with pilot studies, as well as full-scale plant operating data, if and when they become available.
Fig. 3. NanoFlux “confi guration and results” panel for a brine-staged 6:5:4 plant and textile effl uent feed (Table 2); Feed fl ux, QF, is 98 m3/h and the applied feed pressure is Pfeed =20 bar.
Table 3Stage-by-stage ionic concentrations [mol/L] for the 6:5:4 plant and textile effl uent feed (Table 2).
J. Palmeri et al. / Desalination and Water Treatment 9 (2009) 263–271 269
4.2. Seawater NF (NF pretreatment plant for SWRO, Umm Lujj, Saudi Arabia)
The use of NF to desalinate brackish and sea water is the object of several important ongoing investigations [5–7, 15–17]. We carry out NanoFlux simulations fi rst at the single element level and then for the full scale Umm Lujj SWNF plant, built with the DesalDK mem-brane to be used as a pre-treatment step for the SWRO of Red seawater feed given in Table 4. The model pre-dictions are then compared with the plant operating data presented in [5]. The choice of NF membrane for this SWRO pretreatment application, which was made after a long and extensive pilot level study [6], was dic-tated by the following criteria: (1) prevent RO mem-brane fouling by prior turbidity and bacteria removal, (2) prevent scaling by prior removal of divalent hard-ness ions, (3) reduce the TDS load on the SWRO plant in order to lower RO operating pressures and increase product yield. Before presenting the full scale plant
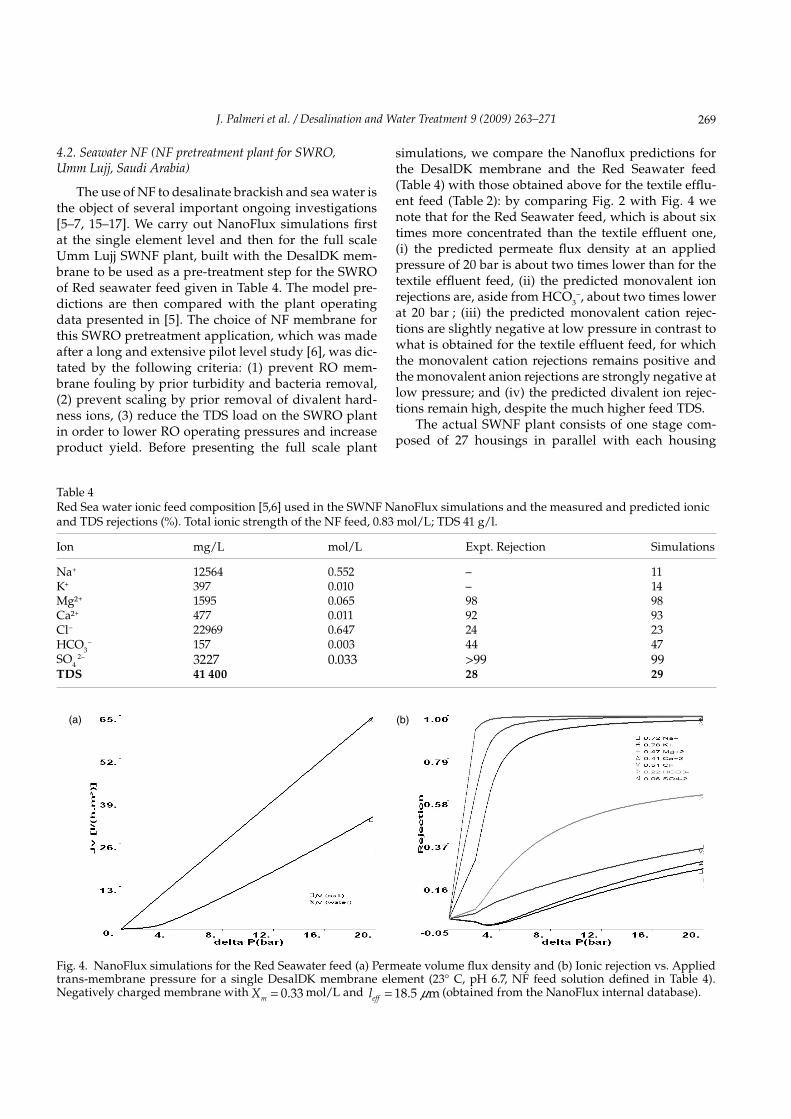
simulations, we compare the Nanofl ux predictions for the DesalDK membrane and the Red Seawater feed (Table 4) with those obtained above for the textile effl u-ent feed (Table 2): by comparing Fig. 2 with Fig. 4 we note that for the Red Seawater feed, which is about six times more concentrated than the textile effl uent one, (i) the predicted permeate fl ux density at an applied pressure of 20 bar is about two times lower than for the textile effl uent feed, (ii) the predicted monovalent ion rejections are, aside from HCO3
−, about two times lower at 20 bar ; (iii) the predicted monovalent cation rejec-tions are slightly negative at low pressure in contrast to what is obtained for the textile effl uent feed, for which the monovalent cation rejections remains positive and the monovalent anion rejections are strongly negative at low pressure; and (iv) the predicted divalent ion rejec-tions remain high, despite the much higher feed TDS.
The actual SWNF plant consists of one stage com-posed of 27 housings in parallel with each housing
Table 4Red Sea water ionic feed composition [5,6] used in the SWNF NanoFlux simulations and the measured and predicted ionic and TDS rejections (%). Total ionic strength of the NF feed, 0.83 mol/L; TDS 41 g/l.
Fig. 4. NanoFlux simulations for the Red Seawater feed (a) Permeate volume fl ux density and (b) Ionic rejection vs. Applied trans-membrane pressure for a single DesalDK membrane element (23° C, pH 6.7, NF feed solution defi ned in Table 4). Negatively charged membrane with Xm = 0 33. mol/L and leff = 18 5. mμ (obtained from the NanoFlux internal database).
J. Palmeri et al. / Desalination and Water Treatment 9 (2009) 263–271270
containing six 8" DesalDK-8040F elements. The total effective membrane surface area is about 5270 m². The feed fl ux is fi xed at 360 m3 h−1 (360 000 L h−1), the feed pH at 8.2, the temperature at 32°C, and the applied feed pressure is 25 bar. The results of the simulations, which are presented in the NanoFlux panel, Fig. 5, show very good agreement with the actual plant operating data (Table 4).
The measured and predicted yields are 65 and 71%, respectively, and the measured and predicted TDS rejec-tions are 28 and 29%. We also observe in Table 4 that the NanoFlux results for the ionic rejections are in good agreement with the plant operating data, especially the very high measured and predicted divalent ion rejections, which range between 92 and 99%. In view of the relatively low TDS rejection, which is dominated by the monovalent ion contribution, it is also clear why a group 2 type NF membrane, such as the DesalDK, is suit-able to be used in an NF pretreatment plant for SWRO, but not for the production of potable water directly.
5. Conclusions
The results presented here show that NanoFlux can be a useful tool for carrying out feasibility studies and for designing NF plants. Furthermore, the good agree-ment between the actual Umm Lujj SWNF operating data and the plant simulations reveals that NanoFlux can provide a fast and reliable way of modeling desali-nation via NF. In view of the increasing importance of fi nding economical ways of producing recyclable and potable water in a period of ongoing shortages, the improved design and optimization of nanofi ltration plants via process simulation tools should become a crucial step in the implementation of NF membrane technology.
Acknowledgements
Work supported in part by the French ANR Program NANO-2007, Project SIMONANOMEM.
Fig. 5. NanoFlux “confi guration and results” panel for the single stage NF plant used as pretreatment for the SWRO of Red Seawater feed presented in Table 4; Feed fl ux, QF, is 360 m3/h and the applied feed pressure is Pfeed =25 bar.
J. Palmeri et al. / Desalination and Water Treatment 9 (2009) 263–271 271
References
[1] J. Palmeri, et al. Desalination, 147 (2002) 231. [2] X. Lefebvre, et al. Sep. Purif. Technol., 32 (2003) 117. [3] H. Chmiel, X. Lefebvre, V. Mavrov, M. Noronha, J. Palmeri,
Computer Simulation of Nanofi ltration, Membranes and Pro-cesses, In: M. Rieth and W. Schommers (Eds.), Handbook of Theoretical and Computational Nanotechnology, Volume 5, American Scientifi c Publishers , 2006, pp. 93–214.
[4] N. Ben Amar, N. Kechaou, J. Palmeri, A. Deratani, A. Sghaier, J. Hazard. Mater., 170 (2009) 111.
[5] P. Eriksson, M. Kyburz, W. Pergrande. Desalination, 184 (2005) 281. [6] A. M. Hassan, et al. Desalination, 131 (2000) 157. [7] S. Adham, S., R. C. Cheng, D. X. Vuong, K. L. Wattier. The International
Desalination & Water Reuse Quarterly, 13 (3) (2003) 18. [8] W.R. Bowen and A.W. Mohammed. Trans IChemE, A 76, (1998) 885.
[9] X. Lefebvre, J. Palmeri, P. David. J. Phys. Chem., B 108 (2004) 16811.
[10] G. Hagmeyer and R. Gimbel, Desalination, 117 (1998) 247.[11] A. Yaroshchuk, Adv. Colloid Interface Sci., 85 (2000) 193.[12] X. Lefebvre, Ph.D. thesis (in French), Etude des modèles de transfert
en nanofi ltration. Application du modèle hybride basé sur les équations de Nernst-Planck étendues par le développement du logiciel de simula-tion “Nanofl ux”, University of Montpellier 2, France (2003).
[13] A. Szymczyk and P. Fievet, J. Membr. Sci., 252 (2005) 77.[14] W. R. Bowen and J.S. Welfoot, Chem. Eng. Sci., 57 (2002) 1121.[15] C. Oumar-Anne, D. Trebouet, P. Jaouen, F. Quemeneur.
Desalination, 140 (2001) 67.[16] M. Pontié, et al. Desalination, 158 (2003) 277.[17] R. Haddad, E. Ferjani, M. S. Roudesli, A. Deratani. Desalination,


![SALTWATER / BRACKISH-WATER AQ [objectives] Chapter 14](https://static.documents.pub/doc/80x56/56815907550346895dc63b2c/saltwater-brackish-water-aq-objectives-chapter-14.jpg)


