Process Safety and Environmental Protection 1 0 3 ( 2 0 1 6 ) 365–376
Contents lists available at ScienceDirect
Process Safety and Environmental Protection
journa l h om ep age: www.elsev ier .com/ locate /ps ep
nvolving economic, environmental and safetyssues in the optimal purification of biobutanol
uan Martinez-Gomeza, Eduardo Sánchez-Ramírezb,uan José Quiroz-Ramírezb, Juan Gabriel Segovia-Hernandezb,osé María Ponce-Ortegaa, Mahmoud M. El-Halwagi c,d,∗
Chemical Engineering Department, Universidad Michoacana de San Nicolás de Hidalgo, Morelia, Mich 58060,exicoChemical Engineering Department, Universidad de Guanajuato, Noria Alta s/n, Guanajuato, Gto. 36050, MexicoChemical Engineering Department, Texas A&M University, College Station, TX 77843, USAAdjunct Faculty at the Chemical and Materials Engineering Department, Faculty of Engineering, King Abdulazizniversity, Jeddah 21589, P.O. Box 80204, Saudi Arabia
r t i c l e i n f o
rticle history:
eceived 16 November 2015
eceived in revised form 18 April
016
ccepted 19 April 2016
vailable online 27 April 2016
eywords:
afety
isk assessment
nvironmental impact
iobutanol separation
olar collector
ulti-objective optimization
a b s t r a c t
Traditionally, the design of a separation sequence for the biobutanol production has been
based primarily on economic criteria with little or no consideration to the environmental and
safety issues. Since biobutanol is produced from acetone–butanol–ethanol (ABE) fermenta-
tion, the process involves several substances that may cause fire and explosion and can lead
to negative environmental and health impact. Hence, it is desirable to incorporate safety and
environmental issues in the design objectives to determine the optimal separation route.
This work presents an optimization approach for the biobutanol separation process from
the ABE fermentation while accounting simultaneously for economic, environmental and
safety objectives. The optimization is carried out through a differential evolution with a
Tabu search algorithm, where several Pareto solutions are identified and some routes are
highlighted to determine the best compensated solutions. In this case, the best economic
solution involves elevated values of the Eco-Indicator 99, the best environmental solution
incurs high costs, and the safest solution features less separation columns. The most com-
pensated solutions include configurations that represent a balance among the economic,
Ehlinger et al., 2014; Julián-Durán et al., 2014) and ethanol
. Introduction
iofuels are positioned to play an important role in the energyix because of their ability to reduce CO2 emissions. Although
he search for renewable and sustainable biofuel additiveshat can be blended with gasoline has focused largely onioethanol, there are merits for considering biobutanol. For
nstance, the energy density of bio-isobutanol is 26.5 MJ/l while
or bioethanol it is 21.1 MJ/l). It should be noted that 8.27
∗ Corresponding author at: Chemical Engineering Department, Univerexico.
billion of gallons/year of biobutanol can replace 7.55 billionof gallons/yr of gasoline (see Swanaa et al., 2011). In addi-tion, biobutanol has desirable properties for use in internalcombustion engines including lower corrosion, flammabil-ity and water miscibility compared with bioethanol. Whilemuch work has been reported for the design, environmen-tal assessment, and safety enhancement for methanol (e.g.,
sidad Michoacana de San Nicolás de Hidalgo, Morelia, Mich, 58060,
(Murillo-Alvarado et al., 2014; Conde-Mejía et al., 2013, 2012;
366 Process Safety and Environmental Protection 1 0 3 ( 2 0 1 6 ) 365–376
Nomenclature
ABE acetone–butanol–ethanolAB administrative buildingAIT auto-ignition temperatureBes volume of the enclosed spaceBuv ventilation rateBvdel ventilation draft directionBLEVE oiling liquid expanding vapor explosionCR control roomCTM,i capital cost of the plant ($/yr)Cut,i utility costs ($/yr).CFi fixed costs ($/yr).d chemical compoundDALYs disability adjusted life yearsDDE dynamic data exchangeDE differential evolutionDETL differential evolution with Tabu listDcn column diameterETSC evacuated tube solar collectorFrn distillate fluxesfi frequency of accidentsGAs genetic algorithmsGx,y total number of exposed workersHAZOP hazard and operabilityi process unitI investment costj process unitk impact categoryLLE liquid–liquid extractionLCA life-cycle assessmentLC50 lethal doseMIE minimum ignition energyMmbr multiplier for material being releasedMmr magnitude of the releaseMdr duration of the release and the number/densityMio indoors or outdoors.N lifetime of the project (yr)TAC total annual cost ($/yr)UVCE unconfined vapor cloud explosionpImmignition probability of immediate ignitionpDelayedIgn probability of delayed ignitionPx,y,i probability of affectation due an accident in the
location x,yQRA quantitative risk analysisROI return on investmentSCRI safety software to QRA assessmentSRi social riskWH Warehouse
Greek symbols˛b,k damage caused in impact category k per unit of
chemical bˇb total amount of chemical released per unit of
referenceωd weighting factor for damage in category dıd normalization factor for damage of category d
Gabriel and El-Halwagi, 2013; Ojeda et al., 2011), much lesswork has been carried out for butanol production. Butanol
can be obtained using two routes, by the Oxo (petro-butanol)and fermentation (biobutanol) processes. The ABE (acetone,
biobutanol and ethanol) fermentation process yields a respec-tive proportion of 3:6:1 of the three products, which is richin biobutanol. Unfortunately, the concentration of productsis typically low (Abdehagh et al., 2014). This limitation hasmotivated the search for efficient fermentation and separa-tion processes. The genetic modification of microorganismsand altered pre-treatment of the raw material are typicallyconsidered as the primary alternatives to improve the pro-duction efficiency of biobutanol (García et al., 2011; Kumarand Gayen, 2011). The development of an efficient separa-tion system increases the yield and productivity of biobutanol.The separation of biobutanol by pervaporation using polymerinclusion membranes (PIM) including ionic liquids has beenreported to be less expensive than distillation (Matsumotoet al., 2010). Previous studies have concluded that solventextraction, adsorption and membrane pervaporation are themost efficient approaches to separate biobutanol form theproducts of the ABE process (Huanga et al., 2014). The selec-tion of the separation process for biobutanol has been basedon economic aspects, considering exclusively the utility costs.With increasing attention to the environmental and safetyissues, there is a need to include these objectives in addition tothe economic criteria. The selection of the separation methodis not the only important task. System configurations have tobe generated and screened. Kraemer et al. (2011) presented aflowsheet for the separation of biobutanol from ABE fermen-tation by a hybrid extraction–distillation process. Recently,Errico et al. (2015) presented a set of separation processes forthe biobutanol mixture accounting for economic and environ-mental objectives. Notwithstanding the value of the previousresearch efforts, they have not incorporated safety as a goalfor generating, screening, and selecting the biobutanol sep-aration configuration. The safety issue is indeed importantin biobutanol production because the process involves sub-stances that are prone to fire and explosion. Inherently saferdesign approaches can be used to reduce the risk (CCPS, 2009).This approach has been applied to different processes, gen-erating new methodologies for the design of safer processes(Palaniappan et al., 2004; Study, 2007; Patel et al., 2010; Sainiet al., 2015). The importance of considering safety in pro-cess design resides in the prevention of economic and humanlosses. Moreover, damage to the environment can also bereduced by mitigating releases and accidents. These envi-ronmental and safety issues are best considered during theearly process synthesis, conceptual design, and integrationstages (e.g., Thiruvenkataswamy et al., 2016; Santibanez-Aguilar et al., 2015; Ramadhan et al., 2014; Hamad et al., 2013;El-Halwagi et al., 2013; Kazantzi et al., 2013; Martinez-Gomezet al., 2013a; Suardin et al., 2007).
This paper presents an approach for including safety objec-tives in the design of separation processes for biobutanol whilealso accounting for the economic and environmental objec-tives. The economic objective includes the total annual cost(TAC), the environmental objective is measured through theEco-Indicator 99 method whereas the safety objective is quan-tified through the quantitative risk analysis (QRA) accountingfor fire and explosion.
2. Problem statement
The problem to be addressed in this paper deals with the
inclusion of safety objectives in addition to the economicand environmental objectives in the design and selection of
Process Safety and Environmental Protection 1 0 3 ( 2 0 1 6 ) 365–376 367
Fig. 1 – Selection of the purification process for biobutanol.
tct1swc3urtobflcdtpoeewncocritfiai
he separation network of a biobutanol process from fourommonly used configurations. Fig. 1 shows four separa-ion processes for a biobutanol mixture (see Roffler et al.,987; Marlatt and Datta, 1986). Processes A, B and C con-ist of steam stripping distillation and distillation columns,hereas the process D consists of liquid–liquid extraction
olumns (1D-LL with side stream, 2D-Thermally coupled,D-Thermodynamic Equivalent and 4D-Intensified). Each col-mn has different operating conditions and different energyequirements. High temperature and pressure can improvehe efficiency of the process. However, these involve extremeperating conditions that may involve hazardous situations,ecause the process can operate in conditions close to theash point of the involved substances and it increases theonsequence associated with the occurrence of an acci-ent. Moreover, complex processes involve a greater risk,his way it results more convenient to generate simplifiedrocesses. It should be noticed that the selection of theptimal process for the purification of biobutanol is not anasy task when it is considered simultaneously the cost,nvironmental impact and risk. Hence, the purpose of thisork is to present a method to find the optimum tech-ology for the purification of biobutanol, considering theost, environmental impact and risk, and simultaneouslyptimizing the design and operating conditions of the pro-ess (number of stages in each column, feed stage, refluxatio, distillate fluxes and column diameter). In addition,t was performed a risk analysis to four designs includinghermally coupled, thermodynamic equivalent and intensi-ed designs, obtained from the process D. These columns
re characterized by the inclusion of an extractive columnn order to eliminate both heterogeneous and homogenous
azeotrope between butanol/water and ethanol/water respec-tively using n-hexyl-acetate as extractant agent. Further, inorder to diminish the energy requirements, two thermallycouplings were introduced in the non-products stream, gen-erating a thermally coupled design. In this case, a thermallycoupling at top of first distillation column, and another ther-mally coupling placed at bottom of second distillation columnwere introduced. In addition, since some column section canbe moved, a thermodynamic equivalent design can be pro-duced expecting similar energy requirements. In this study,the rectifying zone of the first distillation column is movedas rectifying section of the second distillation column, alsothe stripping zone of the third distillation column is movedas stripping zone of the second distillation column. Finally,by eliminating some column sections and replacing the sidestream, an intensified design is generated. Here, the elimi-nation of the condenser in the third distillation column andthe transporting section of the same column are consideredthereby introducing a side stream in the second distillationcolumn.
3. Optimization formulation
The problem was formulated as a multi-objective optimizationproblem in order to minimize simultaneously the total annualcost and the environmental impact (TAC and Eco-indicator99,respectively) and it is represented by the following expression:
OF ={
min TAC, min Eco-indicator 99}
(1)
As third criterion of selection, a quantitative risk analy-sis (QRA) is applied to the identified solutions to determine
368 Process Safety and Environmental Protection 1 0 3 ( 2 0 1 6 ) 365–376
the most attractive solution since the economic, environ-mental and safety points of view. The proposed optimizationapproach was implemented through a hybrid platform usingMatlab, Microsoft Excel and Aspen Plus, whereas the QRA wascarried out through the SCRI software. Under this approach,it is difficult to introduce the QRA as an additional objectivefunction, because is impractical to establish a link among Mat-lab, ASPEN Plus, Microsoft Excel and SCRI. Also, the requiredCPU time would be impractical. This way, first the economicand environmental criteria are optimized to obtain a set ofcompensated solutions, and then the QRA was applied to theidentified solutions to determine the level of risk for eachsolution. This approach is very interesting, because it canhelp to identify the best solution that compensates these treeobjectives. The considered objective functions are describedas follows:
3.1. Economic objective function
The economic objective consists in minimizing the totalannual cost and it is expressed as follows:
TAC =n∑
i=1
CTM,i +n∑
j=1
Cut,j (2)
where TAC is the total annual cost (see Guthrie, 1969; Ulrich,1984) expressed in $/yr, and corresponds to the sum of thecapital cost of the process (CTM) and the utility cost (Cut), nrepresents the number of individual units. Additionally, it wasassessed the return of investment (ROI) as an additional eco-nomic measurement. The ROI is defined by Eq. (3), where Nrepresents the lifetime of the project (years), I is the invest-ment cost, and CFi corresponds to the fixed costs.
ROI =
N∑i=1
CFi
NI(3)
3.2. Environmental objective function
The environmental objective function is given by Eq. (4),which is based on the Eco-Indicator 99, ˇb represents thetotal amount of chemical b released per unit of referenceflow due to direct emissions, ˛b,k is the damage caused incategory k per unit of chemical b released to the environ-
ment, ωd is a weighting factor for damage in category d, andıd is the normalization factor for damage. Table 1 shows the
impact categories assessed by the Eco-indicator99 (Geodkoopand Spriensma, 2001).
Eco-indicator =∑
b
∑d
∑k ∈ K
ıdωdˇb˛b,k (4)
In this paper, the Eco-indicator99 method was imple-mented (Geodkoop and Spriensma, 2001). The damagecategories (i.e., k) are Damage to the resources, Dam-age to the ecosystem quality, and Damage to the humanhealth. These categories are determined through the fol-lowing eleven impact categories: surplus energy for futureextraction (minerals), surplus energy for future extraction(fossil fuels), regional effect on vascular plant species, localeffect on vascular plant species, acidification/eutrophication,ecotoxicity, climate change, ozone layer depletion, ioniz-ing radiation, respiratory effects, carcinogenesis. In theintroduced approach, the main contribution to Eco-indicator99is associated with the use of external agents such as fossilfuels for heating as well as the use of solvents. For the weight-ing, we have followed the method of Eco-indicator99, separatingthe impact categories as damages to the human health(expressed in disability adjusted life years “DALYs”), damageto the ecosystem quality (expressed as the loss of species overa certain area), and damage to resources (expressed as thesurplus energy needed for future extractions of minerals andfossil fuels). Based on the work by Mettier (1999), the damage tothe human health and to the ecosystem quality are consideredto be equally important, whereas the damage to the resourcesis considered to be about half as important. Furthermore, inthe presented approach the hierarchical perspective was con-sidered to balance the short- and the long-term effects. Thenormalization set is based on a damage calculation for all rel-evant emissions, exactions and land-uses. As there are threedamage models, there are also three normalization sets, andin this case the hierarchical perspective was considered todetermine ıd (Geodkoop and Spriensma, 2001).
This work also considers the additional scenario of usingsolar collectors to supply all the steam needed as heat duty ineach distillation column. This scenario was assessed in orderto significantly reduce the greenhouse gas emissions that areassociated with the use of fossil fuels. Furthermore, consider-ing that each solar collector has its own economic impact, anew Pareto is developed, where the TAC includes the costs forpurifying and the number and size of the solar collectors.
3.3. Risk assessment
The application of the optimization process through differen-
tial evolution and Tabu search yields a set of Pareto solutionthat compensate the economic and environmental objectives,
eam ×10−3 (points/kg) Electricity (×10−3 points/kWh)
.11 0.43
.60 0.003
.13 0.82
.002 0.12
.0007 0.001
.10 0.28
.80 0.16
.08 0.46
.50 12.00
.008 0.005
Process Safety and Environmental Protection 1 0 3 ( 2 0 1 6 ) 365–376 369
pplication of a quantitative risk analysis.
aaqts
apuf(csgat(1nabpsiivt(fia
Fig. 3 – Proposed layout for applying the QRA.
Fig. 2 – Proposed algorithm for the a
nd for this set of optimal solutions there are identified thessociated risk to determine the best solution. This way, auantitative risk analysis is implemented for each Pareto solu-ion. Fig. 2 shows the general procedure of QRA applied to eacholution obtained.
The first step consists in the identification of incidents,n incident is any loss of matter or energy (AIChE, 2000); theotential incidents associated with these systems are contin-ous release and instantaneous release. This result is obtained
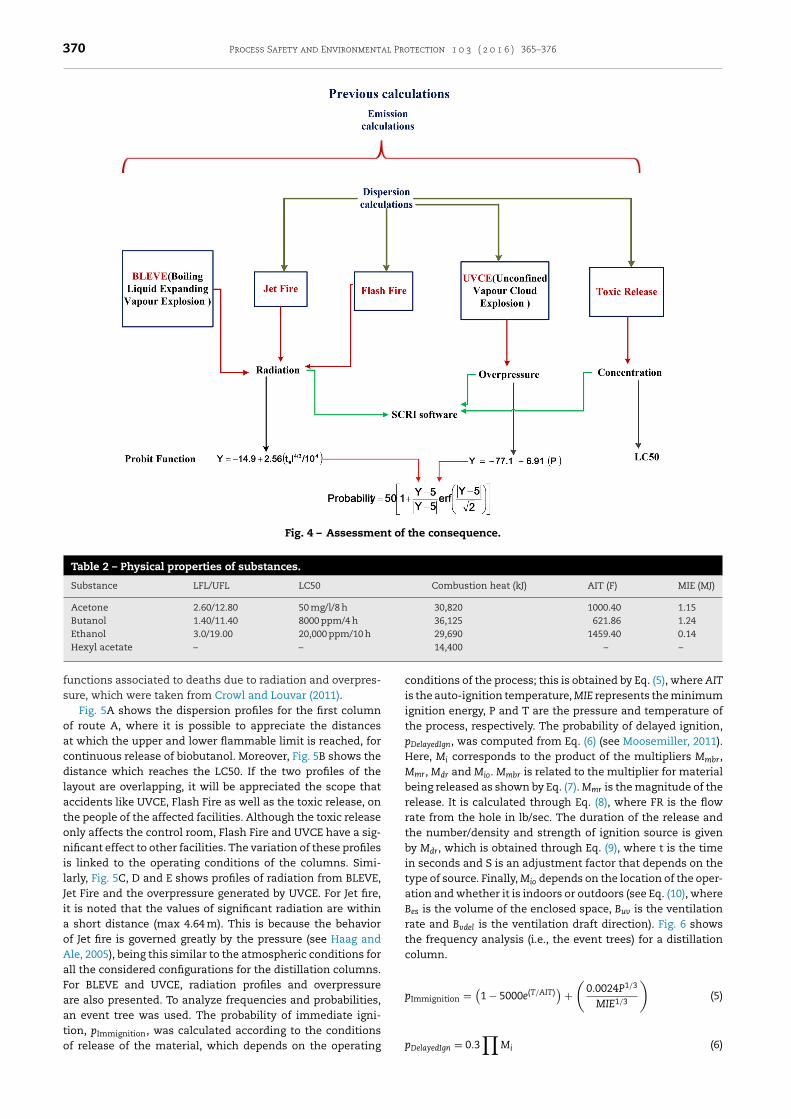
rom qualitative methods of risk analysis such as HAZOPKletz, 1999). For the assessment of the consequence for eachonfiguration (A, B, C and D), a layout is proposed, which ishown in Fig. 3. In this figure is possible to appreciate the geo-raphic location of the configuration (Process Design, A, B, Cnd D) as well as other facilities involved in the process: con-rol room (CR), administrative building (AB) and warehouseWH). The number of persons residing in these facilities is 10,5 and 7, respectively (based on the typical number of peopleeeded in these facilities, Martinez-Gomez et al., 2013b). Thessessment of the consequences consists in finding the proba-ility of damage that these accidents cause to other facilities orersonnel. To measure the physical damage caused to the per-onnel, a vulnerability Probit model is used. The consequences evaluated as a function of the accidents that can occur. Eachncident may involve different accidents. The event tree pro-ides the accidents expected from an incident. According tohe event trees, potential accidents that may occur are: BLEVEboiling liquid expanding vapor explosion), UVCE (uncon-
ned vapor cloud explosion), Jet Fire, Flash Fire, Toxic releasend Pool fire for liquid–liquid extraction. Fig. 4 shows the
algorithm used for quantifying the physical variables that pro-duce these accidents. The calculation of the physical variables(radiation and overpressure) and dispersion was performedwith the software SCRI®. The worst scenario was consid-ered for calculating the dispersion, wind speed of 1.5 m/s2
east direction and atmospheric stability type F were also con-sidered. The toxicity was evaluated considering the lethalconcentration (LC50). Table 2 shows the properties of the sub-
stances involved in the process, and Fig. 4 shows the generalprocedure for calculating the consequence as well as the Probit
370 Process Safety and Environmental Protection 1 0 3 ( 2 0 1 6 ) 365–376
Fig. 4 – Assessment of the consequence.
Table 2 – Physical properties of substances.
Substance LFL/UFL LC50 Combustion heat (kJ) AIT (F) MIE (MJ)
Acetone 2.60/12.80 50 mg/l/8 h 30,820 1000.40 1.15Butanol 1.40/11.40 8000 ppm/4 h 36,125 621.86 1.24Ethanol 3.0/19.00 20,000 ppm/10 h 29,690 1459.40 0.14
Hexyl acetate – –
functions associated to deaths due to radiation and overpres-sure, which were taken from Crowl and Louvar (2011).
Fig. 5A shows the dispersion profiles for the first columnof route A, where it is possible to appreciate the distancesat which the upper and lower flammable limit is reached, forcontinuous release of biobutanol. Moreover, Fig. 5B shows thedistance which reaches the LC50. If the two profiles of thelayout are overlapping, it will be appreciated the scope thataccidents like UVCE, Flash Fire as well as the toxic release, onthe people of the affected facilities. Although the toxic releaseonly affects the control room, Flash Fire and UVCE have a sig-nificant effect to other facilities. The variation of these profilesis linked to the operating conditions of the columns. Simi-larly, Fig. 5C, D and E shows profiles of radiation from BLEVE,Jet Fire and the overpressure generated by UVCE. For Jet fire,it is noted that the values of significant radiation are withina short distance (max 4.64 m). This is because the behaviorof Jet fire is governed greatly by the pressure (see Haag andAle, 2005), being this similar to the atmospheric conditions forall the considered configurations for the distillation columns.For BLEVE and UVCE, radiation profiles and overpressureare also presented. To analyze frequencies and probabilities,an event tree was used. The probability of immediate igni-
tion, pImmignition, was calculated according to the conditionsof release of the material, which depends on the operating
14,400 – –
conditions of the process; this is obtained by Eq. (5), where AITis the auto-ignition temperature, MIE represents the minimumignition energy, P and T are the pressure and temperature ofthe process, respectively. The probability of delayed ignition,pDelayedIgn, was computed from Eq. (6) (see Moosemiller, 2011).Here, Mi corresponds to the product of the multipliers Mmbr,Mmr, Mdr and Mio. Mmbr is related to the multiplier for materialbeing released as shown by Eq. (7). Mmr is the magnitude of therelease. It is calculated through Eq. (8), where FR is the flowrate from the hole in lb/sec. The duration of the release andthe number/density and strength of ignition source is givenby Mdr, which is obtained through Eq. (9), where t is the timein seconds and S is an adjustment factor that depends on thetype of source. Finally, Mio depends on the location of the oper-ation and whether it is indoors or outdoors (see Eq. (10), whereBes is the volume of the enclosed space, Buv is the ventilationrate and Bvdel is the ventilation draft direction). Fig. 6 showsthe frequency analysis (i.e., the event trees) for a distillationcolumn.
pImmignition =(
1 − 5000e(T/AIT))
+(
0.0024P1/3
MIE1/3
)(5)
pDelayedIgn = 0.3∏
Mi (6)
Process Safety and Environmental Protection 1 0 3 ( 2 0 1 6 ) 365–376 371
Fig. 5 – (A) Dispersion profiles for the first column of the route A (1.4%LFL-11.2UFL). (B) Distance which reaches the LC50( rofil
M
M
M
M
800 ppm). (C) Radiation profile due to Jet Fire. (D) Radiation p
mbr = 0.6 − 0.85 log MIE (7)
mr = 7e0642 ln(FR)−4.67 (8)
dr =[1 −
(1 − s2
)e−(0.015 S)t
]0.3
(9)
io = 2 Bes Buv Bvdel (10)
Instantaneous relea
Continuous relea
Immediate ignition
No immediate ignition
Delayed ignition
No ignition
P=0.532
P=0.47
P=0.248
P=0.75
2E-05
1E-04
Immediate ignition
No immediate ignition
Delayed ignition
No ignition
P=0.532
P=0.47
P=0.248
Fig. 6 – Event trees for the consi
e due to BLEVE. (E) Overpressure profile due to UVCE.
The risk quantification is done in terms of social andindividual risks. The individual risk is the risk that a per-son has based on its position, which involves a damage ofa certain magnitude and with certain frequency due to theeffects of physical variables caused by the occurrence of anaccident. This risk is independent of the number of peopleexposed. According to Eq. (11), the individual risk at geograph-
ical location x,y is determined by multiplying the probabilityof affectation caused by an accident (Px,y,i) and the frequency
se
se
BLEVE
UVCE
Flash fire
Jet fire
P=0.005
P=0.997
1.06E-05
1.17E-08
2.32E-06
7.05E-06Toxic release
Toxic release
5.32E-05
5.83E-08
1.16E-05
3.53E-05
UVCE
Flash fire
P=0.005
P=0.997
dered distillation columns.
372 Process Safety and Environmental Protection 1 0 3 ( 2 0 1 6 ) 365–376
of accidents, fi. The sum of individual risks provides the totalindividual risk of an incident.
IRx,y =n∑
i=1
fi Px,y,i (11)
The social risk (SR) is determined by Eq. (12), which indi-cates the multiplication between the probability of affectation,Px,y,i, and the total number of workers exposed to the physicalvariables of an accident.
SRi =n∑
x,y
Gx,yPx,y,i (12)
4. Solution strategy
The number of stages, feed stage, reflux ratio and flow of distil-late are optimizing variables in the considered columns, thisoptimization problem is significantly complex for which theDifferential Evolution with Tabu List (DETL) method (Srinivasand Rangaiah, 2007) is applied. The implementation of thisoptimization approach was made using a hybrid platformthrough Microsoft Excel and Aspen Plus. The vectors ofdecision variables (i.e., the design variables) are sent fromMicrosoft Excel to Aspen Plus using a DDE (Dynamic DataExchange) technique through a COM technology. In MicrosoftExcel, these values are assigned to the design variables thatAspen Plus needs. After the simulation, Aspen Plus returnsto Microsoft Excel the resulting vector of variables. Finally,Microsoft Excel analyzes the values of the objective functionand proposes new values for decision variables according tothe used stochastic optimization method. For the optimiza-tion of the analyzed process routes, the following parametersare used for the DETL method: 200 individuals, 500 genera-tions, a Tabu list of 50% of total individuals, a Tabu radius of0.0000025, and 0.80 and 0.6 for crossover and mutation frac-tions, respectively. These parameters were obtained througha tuning process via preliminary calculations. The tuningprocess consists of performing several runs with differentnumber of individuals and generations, in order to detectthe best parameters that allow obtaining the better conver-gence performance of the DETL method. For determining theused parameters for the heuristic search algorithm, a tuningapproach based on previous experiences for this type of prob-lems was implemented.
5. Results
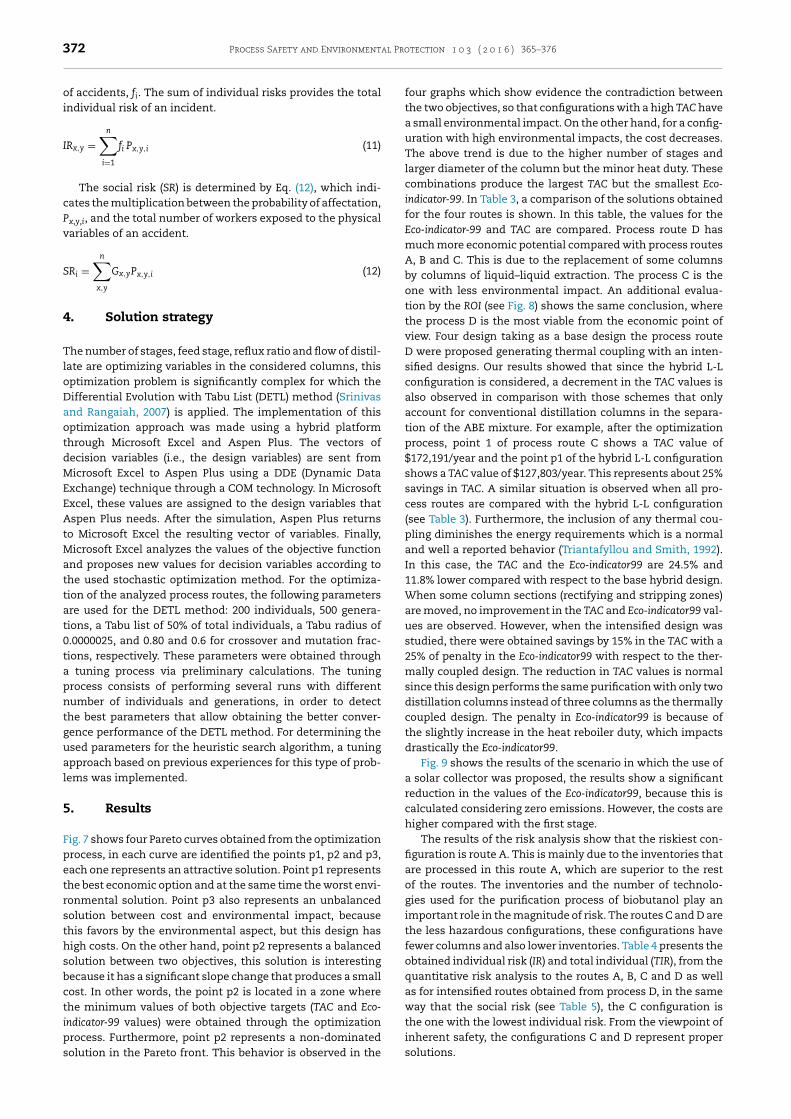
Fig. 7 shows four Pareto curves obtained from the optimizationprocess, in each curve are identified the points p1, p2 and p3,each one represents an attractive solution. Point p1 representsthe best economic option and at the same time the worst envi-ronmental solution. Point p3 also represents an unbalancedsolution between cost and environmental impact, becausethis favors by the environmental aspect, but this design hashigh costs. On the other hand, point p2 represents a balancedsolution between two objectives, this solution is interestingbecause it has a significant slope change that produces a smallcost. In other words, the point p2 is located in a zone wherethe minimum values of both objective targets (TAC and Eco-indicator-99 values) were obtained through the optimization
process. Furthermore, point p2 represents a non-dominatedsolution in the Pareto front. This behavior is observed in the
four graphs which show evidence the contradiction betweenthe two objectives, so that configurations with a high TAC havea small environmental impact. On the other hand, for a config-uration with high environmental impacts, the cost decreases.The above trend is due to the higher number of stages andlarger diameter of the column but the minor heat duty. Thesecombinations produce the largest TAC but the smallest Eco-indicator-99. In Table 3, a comparison of the solutions obtainedfor the four routes is shown. In this table, the values for theEco-indicator-99 and TAC are compared. Process route D hasmuch more economic potential compared with process routesA, B and C. This is due to the replacement of some columnsby columns of liquid–liquid extraction. The process C is theone with less environmental impact. An additional evalua-tion by the ROI (see Fig. 8) shows the same conclusion, wherethe process D is the most viable from the economic point ofview. Four design taking as a base design the process routeD were proposed generating thermal coupling with an inten-sified designs. Our results showed that since the hybrid L-Lconfiguration is considered, a decrement in the TAC values isalso observed in comparison with those schemes that onlyaccount for conventional distillation columns in the separa-tion of the ABE mixture. For example, after the optimizationprocess, point 1 of process route C shows a TAC value of$172,191/year and the point p1 of the hybrid L-L configurationshows a TAC value of $127,803/year. This represents about 25%savings in TAC. A similar situation is observed when all pro-cess routes are compared with the hybrid L-L configuration(see Table 3). Furthermore, the inclusion of any thermal cou-pling diminishes the energy requirements which is a normaland well a reported behavior (Triantafyllou and Smith, 1992).In this case, the TAC and the Eco-indicator99 are 24.5% and11.8% lower compared with respect to the base hybrid design.When some column sections (rectifying and stripping zones)are moved, no improvement in the TAC and Eco-indicator99 val-ues are observed. However, when the intensified design wasstudied, there were obtained savings by 15% in the TAC with a25% of penalty in the Eco-indicator99 with respect to the ther-mally coupled design. The reduction in TAC values is normalsince this design performs the same purification with only twodistillation columns instead of three columns as the thermallycoupled design. The penalty in Eco-indicator99 is because ofthe slightly increase in the heat reboiler duty, which impactsdrastically the Eco-indicator99.
Fig. 9 shows the results of the scenario in which the use ofa solar collector was proposed, the results show a significantreduction in the values of the Eco-indicator99, because this iscalculated considering zero emissions. However, the costs arehigher compared with the first stage.
The results of the risk analysis show that the riskiest con-figuration is route A. This is mainly due to the inventories thatare processed in this route A, which are superior to the restof the routes. The inventories and the number of technolo-gies used for the purification process of biobutanol play animportant role in the magnitude of risk. The routes C and D arethe less hazardous configurations, these configurations havefewer columns and also lower inventories. Table 4 presents theobtained individual risk (IR) and total individual (TIR), from thequantitative risk analysis to the routes A, B, C and D as wellas for intensified routes obtained from process D, in the sameway that the social risk (see Table 5), the C configuration isthe one with the lowest individual risk. From the viewpoint of
inherent safety, the configurations C and D represent propersolutions.
Process Safety and Environmental Protection 1 0 3 ( 2 0 1 6 ) 365–376 373
Fig. 7 – Pareto fronts for the analyzed process routes.
Table 3 – Economic and environmental comparison of the routes to purify biobutanol.
Design Point TAC ($/yr) Eco-Indicator 99 (points/yr)
A1 310,269 28,8942 360,054 24,3773 692,193 22,378
B1 224,799 20,7832 385,390 12,1983 558,065 11,465
C1 172,191 11,8502 211,478 11,1653 271,205 11,144
D1 127,803 12,9762 129,773 12,9723 133,418 12,971
1D-LL with side stream 128,785 13,0162D-Thermally coupled 103,083 11,6413D-Thermodynamic Equivalent 104,215 11,5704D-Intensified 99,110 15,594
Fig. 8 – Pareto fronts for evaluating the ROI.
374 Process Safety and Environmental Protection 1 0 3 ( 2 0 1 6 ) 365–376
Fig. 9 – Pareto fronts for each process route involving solar collectors.
Table 4 – Individual risk.
Process design Unit IR (×10−5/yr) TIR (×10−5/yr) Intensifiedprocess design
Unit IR (×10−5/yr) TIR (×10−5/yr)
AEA 4.75
24.60 1DEA 3.26
11.70CC 15.50 CC 5.41WH 4.39 WH 3.06
BEA 4.42
23.20 2D
EA 3.1412.00CC 14.90 CC 5.81
WH 3.84 WH 3.06
CEA 3.72
21.40 3DEA 5.06
15.50CC 14.30 CC 5.41WH 3.35 WH 5.06
DEA 4.20
22.50 4DEA 3.94
11.50CC 14.00 CC 4.08WH 4.25 WH 3.44
Table 5 – Social risk.
Process design Unit Social risk(fatalities)
Total social risk(fatalities)
Intensifiedprocess design
Unit Social risk(fatalities)
Total social risk(fatalities)
AEA 31
165 1DEA 30
104CC 72 CC 60WH 62 WH 14
BEA 41
155 2D
EA 30111CC 52 CC 66
WH 62 WH 15
CEA 41
127 3DEA 60
158CC 52 CC 77WH 62 WH 21
DEA 28
149 4DEA 51
80CC 61 CC 41WH 60 WH 14
Process Safety and Environmental Protection 1 0 3 ( 2 0 1 6 ) 365–376 375
fit1torfiotbwieoraansrswcDdtFtaWttto
6
TspadeatmmtRwmd
rmo
rba
fermentation by a hybrid extraction–distillation process.Computers and Chemical Engineering 5 (35), 949–963.
For the intensified configurations obtained from the con-guration D, the results regarding to the individual risk showhat the route 3D is the riskiest route, obtaining a value of5.5E−05 yr−1 (see Table 4). In the same way, the results showhat the configuration 4D is the less risky route presenting anverall individual risk of 11.5E−05 yr−1. The route 3D is theiskiest route because of the quantities of product that areed to the columns. The operating pressure has no significantmpact on the value of the risk, because most of the columnsperate at atmospheric conditions. Moreover, the tempera-ure has a significant impact on the level of individual riskecause it is greater or equal to the self-ignition temperature,hich increases the likelihood of immediate ignition, increas-
ng as well the individual risk. Table 5 shows the social risk forach configuration expressed in terms of fatalities. The valuef social risk also indicates that the configuration 3D is theiskiest one, which presents a risk of 158 fatalities. The socialnd individual risk were calculated considering the failure ofll units that conform the configuration, for that reason theumber of fatalities is high. It should be noticed that the inten-ified configurations are safer than routes A, B, C and D. Theesults show that the intensification strategy (minimization)ignificantly reduces the risk. This can be observed in Table 5,here the configurations 1D, 2D and 4D present lower risks
ompared with the conventional designs (reported in column), which are used as the basis for obtaining the intensifiedesigns. The main reason for this difference in results is dueo the minimization of inventories in the intensified designs.urthermore, there is an attenuation in the operating condi-ions of the intensified designs, which reduced the affectationrea due to physical variables of radiation and overpressure.hen the intensified designs are compared with the conven-
ional designs, specifically for the cases A and B, it is possibleo note the difference in the number of needed units, wherehe processes A and B require 5 units, the intensified solutionsnly require 4 units.
. Conclusions
his paper has presented an optimization approach and a casetudy for the technology selection of the biobutanol separationrocess while accounting for the economic, environmentalnd safety issues. The optimization approach is based on aifferential evolution with Tabu search algorithm, and theconomic objective considers the minimization of the totalnnual cost, whereas the environmental objective includeshe minimization of the, and the safety objective considers the
inimization of the associated risk, which Eco-indicator99waseasured through quantitative risk analysis. Several attrac-
ive configurations were identified through Pareto curves.oute A (steam stripping distillation and distillation columns)as found to be the worst since the economic and environ-ental points of view, this route consists of a steam stripping
istillation and distillation columns.The use of solar collectors represents an alternative for
eplacing fossil fuels, which impacts positively in the environ-ental objective but has a negative impact in the economic
bjective (i.e., the TAC increases more than 25%).Route D (where some of the distillation columns were
eplaced with a liquid–liquid extraction column) was found toe economically viable. It is also the next-to-best option from
safety perspective. This makes it an attractive solution.
References
Abdehagh, N., Tezel, F.H., Thibault, J., 2014. Separationtechniques in butanol production: challenges anddevelopments. Biomass and Bioenergy 60, 222–246.
American Institute of Chemical Engineers, 2000. Guidelines forChemical Process Quantitative Risk Analysis, 2nd ed. A JohnWiley & Sons, New York, USA.
Conde-Mejía, C., Jiménez-Gutiérrez, A., El-Halwagi, M.M., 2013.Assessment of combinations between pretreatment andconversion configurations for bioethanol production. ACSSustainable Chemistry and Engineering 1 (8), 956–965.
Conde-Mejía, C., Jiménez-Gutiérrez, A., El-Halwagi, M.M., 2012. AComparison of pretreatment methods for bioethanolproduction from lignocellulosic material. Process Safety andEnvironmental Protection 90 (3), 189–202.
Crowl, D.A., Louvar, J.F., 2011. Chemical Process SafetyFundamentals with Applications, 3rd ed. Prentice Hall PTR,Upper Saddle River, New Jersey, USA.
CCPS, 2009. Inherently Safer Chemical Processes: A Life CycleApproach, 2nd ed. John Wiley & Sons, New York, USA.
Ehlinger, V.M., Gabriel, K.J., Noureldin, M.M.B., El-Halwagi, M.M.,2014. Process design and integration of shale gas to methanol.ACS Sustainable Chemistry and Engineering 2 (1), 30–37.
El-Halwagi, A.M., Rosas, C., Ponce-Ortega, J.M., Jiménez-Gutiérrez,A., Mannan, M.S., El-Halwagi, M.M., 2013. Multi-objectiveoptimization of biorefineries with economic and safetyobjectives. AIChE Journal 59 (7), 2427–2434.
Errico, M., Ramirez, E.S., Ramìrez, J.J.Q., Hernández, J.G.S., Rong,B.G., 2015. Alternative hybrid liquid–liquid and distillationsequences for the biobutanol separation. Computer AidedChemical Engineering 37, 1127–1132.
Gabriel, K.J., El-Halwagi, M.M., 2013. Modeling and optimizationof a bioethanol production facility. Clean Technologies andEnvironmental Policy 15, 931–944.
García, V., Päkkilä, J., Ojamo, H., Muurinena, E., Keiskia, R.L., 2011.Challenges in biobutanol production: How to improve theefficiency? Renewable and Sustainable Energy Reviews 2 (15),964–980.
Geodkoop, M., Spriensma, R., 2001. The Eco-Indicator 99. Adamage oriented for life cycle impact assessment.Methodology report and manual for designers. In: TechnicalReport. PRe Consultants, Amersfoort, The Netherlands.
Guthrie, K.M., 1969. Capital cost estimating. ChemicalEngineering 76 (6), 14–142.
Haag, U.P.A.M, Ale, B.J.M., 2005. Guidelines for Quantitative RiskAssessment, Purple Book, Part One: Establishments,Publicatiereeks. Gevaarlijke Stoffen.
Hamad, N.A., El-Halwagi, M.M., Elbashir, N.O., Mannan, M.S.,2013. Safety assessment of potential supercritical solvents forFischer-Tropsch synthesis. Journal of Loss Prevention in theProcess Industries 26 (3), 528–533.
Huanga, H.J., Ramaswamya, S., Liub, Y., 2014. Separation andpurification of biobutanol during bioconversion of biomass.Separation and Purification Technology 132, 513–540.
Julián-Durán, L., Ortiz-Espinoza, A.P., El-Halwagi, M.M.,Jiménez-Gutiérrez, A., 2014. Techno-economic assessmentand environmental impact of shale gas alternatives tomethanol. ACS Sustainable Chemistry and Engineering 2 (10),2338–2344.
Kazantzi, V., El-Halwagi, A.M., Kazantzis, N., El-Halwagi, M.M.,2013. Managing uncertainties in a safety-constrained processsystem for solvent selection and usage: an optimizationapproach with technical, economic, and risk factors. CleanTechnologies and Environmental Policy 15, 213–224.
Kletz, T., 1999. HAZOP and HAZAN identifying and assessingprocess industry hazards. In: Institution of ChemicalEngineers, 4th ed. United Kingdom, London.
Kraemer, K., Harwardt, A., Bronneberg, R., Marquardt, W., 2011.Separation of butanol from acetone–butanol–ethanol
376 Process Safety and Environmental Protection 1 0 3 ( 2 0 1 6 ) 365–376
Kumar, M., Gayen, K., 2011. Developments in biobutanolproduction: new insights. Applied Energy 6 (88), 1999–2012.
Marlatt, J.A., Datta, R., 1986. Acetone-butanol fermentationprocess development and economic evaluation.Biotechnology Progress 1 (2), 23–28.
Martinez-Gomez, J., Burgara-Montero, O., Ponce-Ortega, J.M.,Nápoles-Rivera, F., Serna-González, M., El-Halwagi, M.M.,2013a. On the environmental, economic and safetyoptimization of distributed treatment systems for industrialeffluents discharged to watersheds. Journal of Loss Preventionin the Process Industries 26, 908–923.
Martinez-Gomez, J., Nápoles-Rivera, F., Ponce-Ortega, J.M.,Nápoles-Rivera, F., Serna-González, M., El-Halwagi, M.M.,2013b. Siting optimization of facility and unit relocation withthe simultaneous consideration of economic and safetyissues. Industrial and Engineering Chemistry Research 53,3950–3958.
Matsumoto, M., Murakami, Y., Kondo, K., 2010. Separation ofbiobutanol by pervaporation using polymer inclusionmembranes including ionic liquids. Journal of Biotechnology150, 196.
Mettier, 1999. Der Vergleich von Schutzguetern. Ausgewaehlteresultate einer panel-Befragung. In: Hofsttetter, P., Mettier, T.,Tietje, O. (Eds.), Anseatze zum Vergleich vonUmweltschaeden, Nachbearbeitung des 9. Diskussionsforumsoekobilanzen vom 4. Dezember 1998. ETH Zurich.
Murillo-Alvarado, P.E., Santibanez-Aguilar, J.E., Ponce-Ortega, J.M.,Castro-Montoya, A., Serna-González, M., El-Halwagi, M.M.,2014. Optimization of the supply chain associated to theproduction of bioethanol from residues of Agave from thetequila process in Mexico. Ind. Eng. Chem. Res. 53 (13),5524–5538.
Moosemiller, M., 2011. Development of algorithms for predictingignition probabilities and explosion frequencies. Journal ofLoss Prevention in the Process Industries 24, 259–265.
Ojeda, K., Sánchez, E., El-Halwagi, M., Kafarov, V., 2011. Exergyanalysis and process integration of bioethanol productionfrom acid pre-treated biomass: comparison of SHF, SSF andSSCF pathways. Chemical Engineering Journal 176–177,195–201.
Palaniappan, C., Srinivasan, R., Tan, R., 2004. Selection of
inherently safer process routes: a case study. ChemicalEngineering and Processing 43, 647–653.
Patel, S.J., Ng, D., Mannan, M.S., 2010. Inherently safer design ofsolvent processes at the conceptual stage: practicalapplication for substitution. Journal of Loss Prevention in theProcess Industries 23, 483–491.
Ramadhan, N.J., Wan, Y.K., Ng.F R.T.L., Ng, D.K.S., Hassim, M.H.,Aviso, K.B., Tan, R.R., 2014. Life cycle optimization (LCO) ofproduct systems with consideration of occupational fatalities.Process Safety and Environmental Protection 92 (5), 390–405.
Roffler, S., Blanch, H.W.M., Wilke, C.R., 1987. Extractivefermentation of acetone and butanol: process design andeconomic evaluation. Biotechnology Progress 3 (3), 131–140.
Saini, S., Abdolhamidzadeha, B., Reniers, G., 2015. Optimizationprocedure to select an inherently safer design scheme.Process Safety and Environmental Protection. 93, 89–98.
Srinivas, M., Rangaiah, G.P., 2007. Differential evolution withtaboo list for solving nonlinear and mixed-integer nonlinearprogramming problems. Industrial and EngineeringChemistry Research 46, 7126–7135.
Study, K., 2007. A real-life example of choosing an inherentlysafer process option. Journal of Hazardous Materials 142,771–775.
Suardin, J., Mannan, M.S., El-Halwagi, M.M., 2007. The integrationof Dow’s fire and explosion index (F&EI) into process designand optimization to achieve inherently safer design. Journalof Loss Prevention in the Process Industries 20 (1), 79–90.
Swanaa, J., Yanga, Y., Behnamb, M., Thompson, R., 2011. Ananalysis of net energy production and feedstock availabilityfor biobutanol and bioethanol. Bioresource Technology 2 (102),2112–2117.
Thiruvenkataswamy, P., Eljack, F.T., Roy, N., Mannan, M.S.,El-Halwagi, M.M., 2016. Safety and techno-economic analysisof ethylene technologies. Journal of Loss Prevention in theProcess Industries 39, 74–84.
Triantafyllou, C., Smith, R., 1992. The design and optimization offully thermally coupled distillation columns. ChemicalEngineering Research and Design 70 (2), 118–132.
Ulrich, G.D., 1984. A Guide to Chemical Engineering ProcessDesign and Economics. Wiley, New York, USA.