Process simulation and optimal design of membrane separation system for CO2 capture from natural gas TeesRep - Teesside's Research Repository Item type Article Authors Ahmad, F. (Faizan); Lau, K.K.; Shariff, A.M.; Murshid, Ghulam Citation Ahmad, F., Lau, K. K., Shariff, A. M., Murshid, G. (2012) Process Simulation and Optimal Design of Membrane Separation System for CO2 Capture from Natural Gas' Computer and Chemical Engineering 36; 119-128 Eprint Version No work archived DOI 10.1016/j.compchemeng.2011.08.002 Publisher Elsevier Journal Computers & Chemical Engineering Additional Link http://linkinghub.elsevier.com/retrieve/pii/S009813541100 2572 Rights Following 12 month embargo author can archive post-print (ie final draft post-refereeing). For full details see http://www.sherpa.ac.uk/romeo [Accessed: 24/05/2016] Downloaded 1-Jun-2018 19:29:29 Link to item http://hdl.handle.net/10149/610636 TeesRep - Teesside University's Research Repository - https://tees.openrepository.com/tees
Transcript
Process simulation and optimal design of membrane separationsystem for CO2 capture from natural gas
TeesRep - Teesside'sResearch Repository
Item type Article
Authors Ahmad, F. (Faizan); Lau, K.K.; Shariff, A.M.; Murshid,Ghulam
Citation Ahmad, F., Lau, K. K., Shariff, A. M., Murshid, G. (2012)Process Simulation and Optimal Design of MembraneSeparation System for CO2 Capture from Natural Gas'Computer and Chemical Engineering 36; 119-128
Eprint Version No work archived
DOI 10.1016/j.compchemeng.2011.08.002
Publisher Elsevier
Journal Computers & Chemical Engineering
Additional Link http://linkinghub.elsevier.com/retrieve/pii/S0098135411002572
Rights Following 12 month embargo author can archive post-print(ie final draft post-refereeing). For full details seehttp://www.sherpa.ac.uk/romeo [Accessed: 24/05/2016]
Downloaded 1-Jun-2018 19:29:29
Link to item http://hdl.handle.net/10149/610636
TeesRep - Teesside University's Research Repository - https://tees.openrepository.com/tees
Process Simulation and Optimal Design of Membrane Separation System
for CO2 Capture from Natural Gas
Abstract: In order to avoid carbon dioxide (CO2) built up in the atmosphere, the major source
of global warming, CO2 capture must be applied to large point sources including natural gas
processing. Membrane process, a relatively new technology among other available techniques,
can be used for the purpose of CO2 capture from natural gas. Over the decades, the membrane
performance has been described by different mathematical models, but there is limited work
done in the field of process simulation where membrane models can be incorporated with other
unit operations using a commercially available simulator. In this paper, mathematical model
for cross flow membrane separation has been proposed to be incorporated with ASPEN
HYSYS as a user defined unit operation in order to design and optimize the membrane system
for the separation of CO2 from natural gas. The proposed simulated model is validated by
published experimental and simulated data. Parameter sensitivities, along with process
economics, have been studied by changing the operating conditions (feed composition and
pressure) and membrane selectivity for different design configurations such as single stage
(with and without recycle) and multiple stages (with permeate and retentate recycle) systems.
It has been observed that double stage with permeate recycle system gives the optimum design
configuration due to minimum process gas cost involved with it. The ASPEN HYSYS user
defined unit operation proposed in the current paper has potential to be applied for the design,
optimization and scale up of complex membrane systems.
Keywords: CO2 capture; Membrane Process; Membrane modeling; Process simulation
3
Nomenclature
Am Total membrane area (m2)
BPC Base Plant cost (USD)
CC Installed Compressor cost (USD)
CH4LS Annual cost of methane loss in permeate (USD/year)
CMC Annual contract and material maintenance cost (USD/year)
CRC Annual capital related cost (USD/year)
DL Direct labor cost (USD/year)
FC Fixed cost (USD)
GPC Gas processing cost (USD/ MSCFD of natural gas product)
HP Power requirement for compressors (hp)
J Gas permeation flux through membrane (MMSCF/ft2 day)
Lf Feed flow rate (mol/s)
Lr Retentate flow rate (mol/s)
LOC Annual labor overhead cost (USD/year)
LTI Annual local tax and insurance cost (USD/year)
l Membrane thickness (mil)
MC Total cost of membrane modules (USD)
MMBTU 106 BTU
MMSCFD 106 ft3/day
MRC Annual membrane replacement cost (USD/year)
MSCF 103 standard cubic feet (at standard temperature and pressure)
NGLS Annual loss of natural gas (MMSCF/year)
NHV Heating value of natural gas (1066.8 MMBTU/MMSCF)
NWP Wellhead price of crude natural gas (USD/MMBTU)
4
OSF On stream factor
P Project contingency (USD)
PA Permeability of component A (mol/MPa-m2-s)
PB Permeability of component B (mol/MPa-m2-s)
ph Pressure on the high pressure side (bar)
pl Pressure on the low pressure side (bar)
SC Start up cost (USD)
SCF Standard cubic feet (at standard temperature and pressure)
TFI Total facilities investment (USD)
TPI Total plant investment (USD)
t Membrane life (years)
UC Annual utility cost (USD/year)
UCP Utility cost (USD/kwh)
VOM Annual variable operating and maintenance cost (USD/year)
Vp Permeate flow rate (mol/s)
xf Feed mole fraction
x0 Retentate mole fraction
yp Permeate mole fraction
Greek Symbols:
ϴ Stage cut or fraction permeated
α Selectivity of the membrane
Ƞcp Compressor efficiency (%)
5
1. INTRODUCTION
The increasing world-wide energy demand and pricing trends have directed the
attention of oil and gas companies towards developing contaminated fields. On the other hand,
global perceptions on climate change are exercising constant pressure on energy companies to
adopt practices leading to the reduction of carbon emissions (Hart and Gnanendran, 2009).
Therefore, CO2 capture is attracting interest as an option for minimizing CO2 emissions from
the use of fossil fuels (Steeneveldt et al., 2006).
The amount of CO2 contents in the natural gas can vary from 4% to 50% depending on
the gas source. Before the transportation of natural gas, it must be pre-processed in order to
meet the typical pipeline specification of 2%-5% CO2 (Datta and Sen, 2006; Safari et al., 2009).
Currently, many natural gas wells are undeveloped due to their low production rate and poor
quality, i.e., the high CO2 content, which has created the necessity to develop efficient
processes for the separation of CO2 from natural gas (Lee et al., 1995).
CO2 can be removed by a number of processes considering the factors of; capital and
operating costs, gas specifications and environmental concerns. The major processes can be
grouped as follows:
Absorption Processes (Chemical and Physical absorption)
Adsorption Process (Solid Surface)
Hybrid Solution (Mixed Physical and Chemical Solvent)
Physical Separation (Membrane. Cryogenic Separation) (Maddox, 1982; Koros and
Chern, 1987)
Membranes processes represent commercially proven technology for natural gas
processing application. For a gas to permeate through a membrane surface, the gas must first
6
dissolve in the high-pressure side of the membrane, diffuse across the membrane wall, and
evaporate from the low-pressure side. Gas separation therefore works on the principle that some
gases are more soluble in, and pass more readily through polymeric membrane than other gases
(Geankoplis, 2003; Baker, 2004; Ebenezer, 2005).
In the membrane process, feed gas is pretreated before entering the membrane system
in order to ensure an efficient operation. It serves mainly to control the fouling, plasticization
and condensation of hydrocarbons in the membranes (Baker and Lokhandwala, 2008;
Xomeritakis et al., 2007). Moreover, the temperature control system is provided to maintain
the gas at the desired operating temperature of the membrane fibres. Finally, the heated gas is
entered into the membrane gas separators where it gets separated into two streams: the
permeate, a low pressure CO2 stream and the non-permeate or residue, a high pressure
hydrocarbon rich stream (Ebenezer, 2005).
Although membrane separation technology has become a major industrial application
only during the last few decades but the study of gas separation has a long history (Baker,
2004). Graham (1866) measured the permeation rates of all the gases known by that time
through different diaphragms (Baker, 2004). Amerongen (1950), Barer (1951) and Stern (1966)
played an important role in the development of solution diffusion model for the explanation of
gas permeation (Baker, 2004). The first company to establish a Prism membrane was Monsanto
that marketed for hydrogen separation, but the success of Monsanto encouraged other
companies, like Cvnaoi Separex and Grace Membrane Systems, to produce membrane plants
for natural gas processing (Hennis et al., 1980; Baker, 2004).
Further research was conducted by Lee et al. (1994) who made field tests of membrane
modules for the separation of carbon dioxide from low-quality natural gas. In their study they
investigated the effects of the operating variables of pressure, feed flow rate, and the carbon
7
dioxide concentration in the feed. In addition to the analysis of the field data, computer models
were applied for the separation of gases under perfect mixing and cross flow conditions.
Lababidi et al. (1996) developed the mathematical model to optimize three configurations
including single stage, two stages, and the continuous membrane column (CMC) whereas Qi
and Hensen (1998) developed the optimal design strategy for spiral membrane networks for
gas separations. Moreover, Qi and Hensen (2000) proposed mixed integer non linear
programming for the membrane separation of multicomponent gas mixtures.
Wang (2004) enhanced the operational flexibility and adaptability of membrane process
using an optimal method in which auto-controlling of the permeate gas flux was applied for the
first time. Furthermore, Datta and Sen (2006) worked on the optimization of the gas processing
cost for a membrane unit demonstrating that the optimum configuration might be unique within
the certain ranges of CO2 concentration and the minimum gas processing cost could only be
achieved by adjusting the number of modules in each stage and the compressor power. The
permeability and selectivity variations of the CO2/CH4 system, which included both
temperature and pressure effects simultaneously, have been thoroughly studied by Safari et al.
(2008). In addition, Hau et al. (2008) have investigated process design, economics, and
sensitivity of the membrane stage with recycle streams.
The current paper provides analysis of different design parameters for membrane gas
separation under different configurations using ASPEN HYSYS software. As membrane unit
is not a pre-defined unit operation in ASPEN HYSYS, a cross flow model is proposed to predict
the membrane performance in the CO2 separation from natural gas. Finally, the proposed model
is included in the process simulation as user defined unit operation along with other available
unit operations. The main purpose is to optimize the membrane system configuration for
8
different feed compositions (from low CO2 to high CO2 contents), feed pressures (from low to
very high pressure) and membrane selectivity.
2. METHODOLOGY
2.1. Transport Mechanism
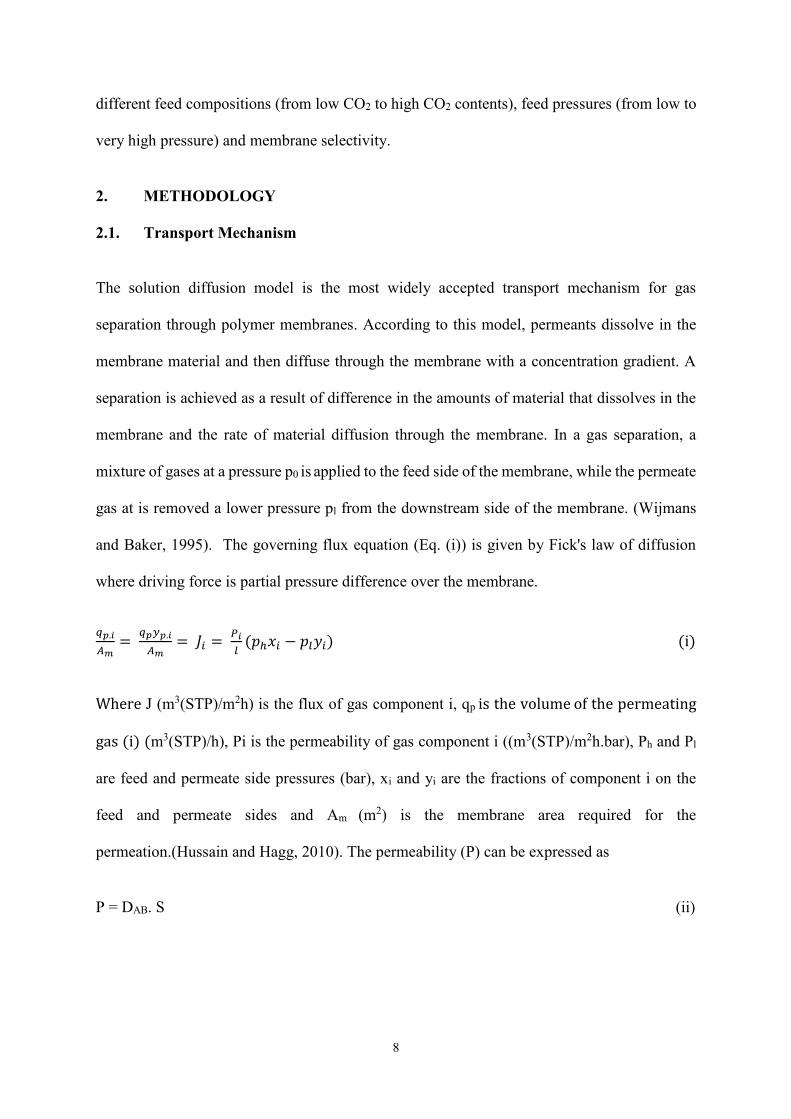
The solution diffusion model is the most widely accepted transport mechanism for gas
separation through polymer membranes. According to this model, permeants dissolve in the
membrane material and then diffuse through the membrane with a concentration gradient. A
separation is achieved as a result of difference in the amounts of material that dissolves in the
membrane and the rate of material diffusion through the membrane. In a gas separation, a
mixture of gases at a pressure p0 is applied to the feed side of the membrane, while the permeate
gas at is removed a lower pressure pl from the downstream side of the membrane. (Wijmans
and Baker, 1995). The governing flux equation (Eq. (i)) is given by Fick's law of diffusion
where driving force is partial pressure difference over the membrane.
𝑞𝑝.𝑖
𝐴𝑚=
𝑞𝑝𝑦𝑝.𝑖
𝐴𝑚= 𝐽𝑖 =
𝑃𝑖
𝑙(𝑝ℎ𝑥𝑖 − 𝑝𝑙𝑦𝑖) (i)
Where J (m3(STP)/m2h) is the flux of gas component i, qp is the volume of the permeating
gas (i) (m3(STP)/h), Pi is the permeability of gas component i ((m3(STP)/m2h.bar), Ph and Pl
are feed and permeate side pressures (bar), xi and yi are the fractions of component i on the
feed and permeate sides and Am (m2) is the membrane area required for the
permeation.(Hussain and Hagg, 2010). The permeability (P) can be expressed as
P = DAB. S (ii)
9
Where DAB (m2/s) is the diffusivity and S (m3(STP)/m3.bar) is the solubility coefficient for the
gas in the membrane. The ratio of pure gas permeabilities (PA, PB) gives the separation factor
or membrane selectivity, α (Geankoplis, 2003).
α = PA/ PB (iii)
It is important to mention here that Eq. (i) can be used to accurately and predictably
rationalize the properties of gas permeation membranes (Wijmans and Baker, 1995).
2.2. Process Simulation Method
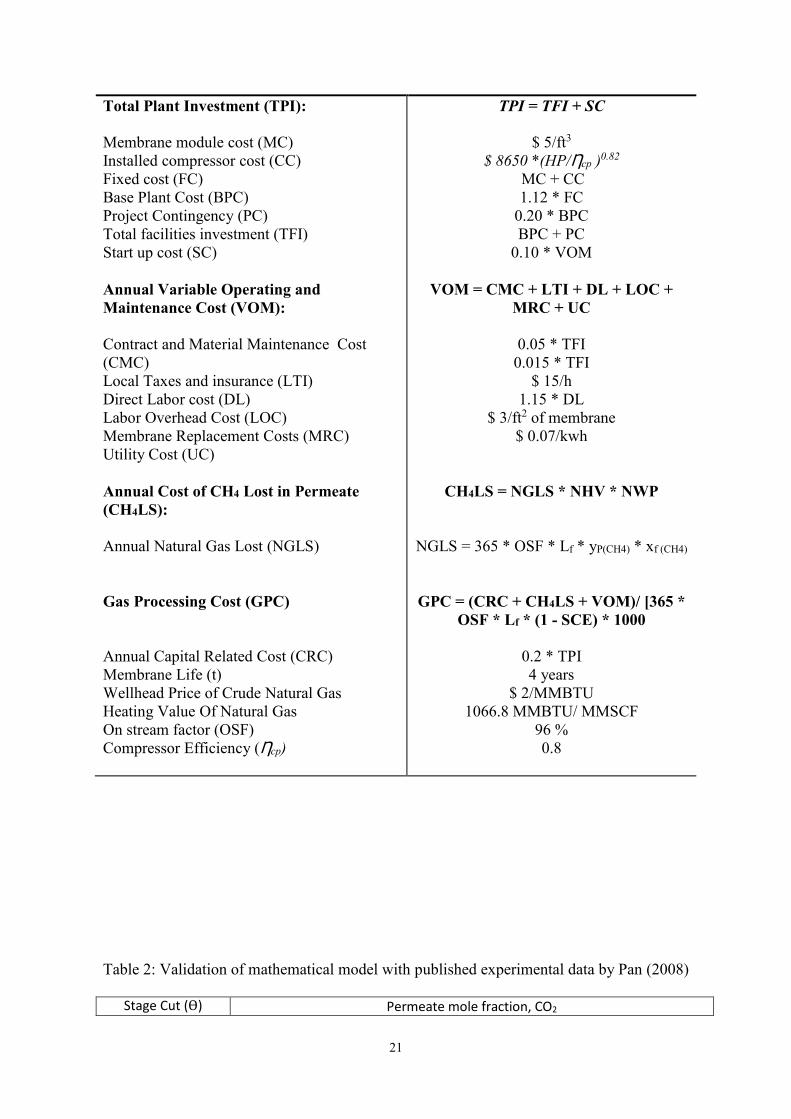
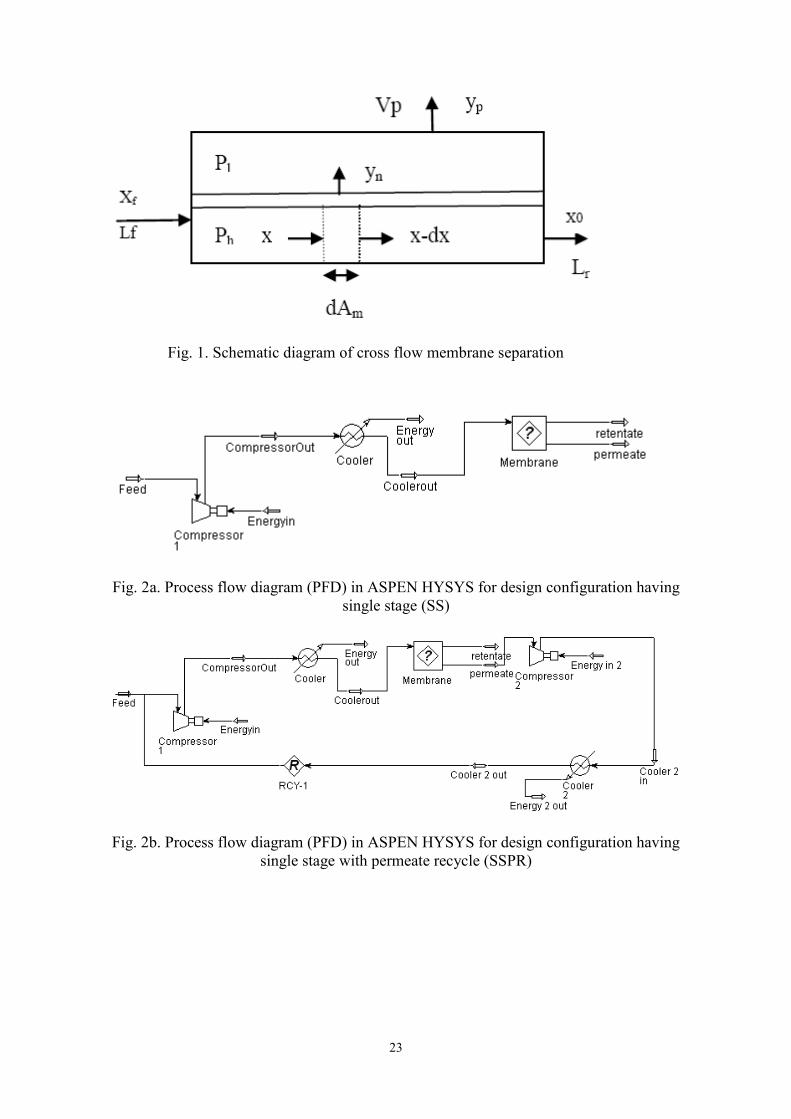
In this work, a cross flow isothermal model (Figure 1) has been implemented to describe the
performance of a membrane module. The model is then interfaced with Process simulation
programme, ASPEN HYSYS in order to calculate permeate and retentate of the system with
any number of modules, allowing complex process simulations. The programme has the
possibility to use ASPEN HYSYS capabilities to calculate mass and energy balances and
combine in the process model. The important process parameters are flow rates, temperatures,
compositions, pressure ratio (between the upstream pressure ph and downstream pressure pl
over the membrane) and stage cut (ratio of permeate Vp to feed flow rate Lf). The recovery of
desired component (methane in our work) is calculated as
R = 𝛳.yi / xi (iv)
Where 𝛳 is the stage cut and xi and yi are feed and permeate fractions of the desired component
respectively.
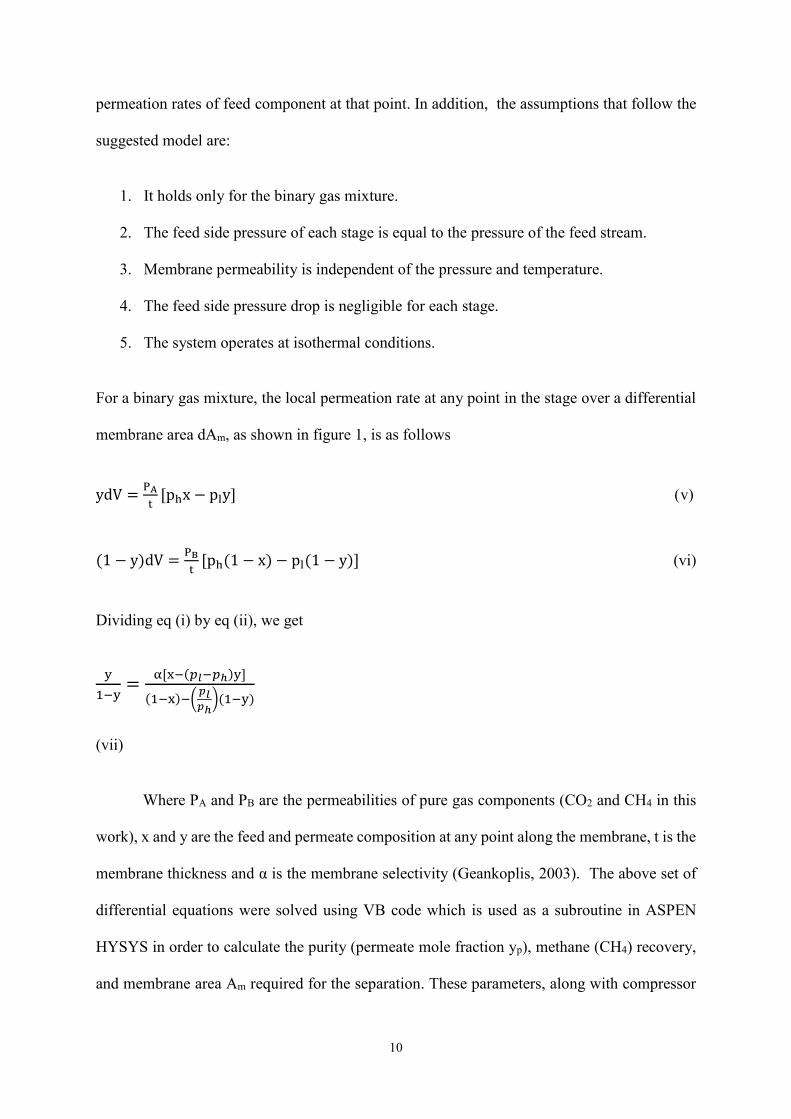
The model assumes no mixing in the permeate side as well as on the high pressure side. Thus,
the composition of permeate can be determined at any point along the membrane by the relative
10
permeation rates of feed component at that point. In addition, the assumptions that follow the
suggested model are:
1. It holds only for the binary gas mixture.
2. The feed side pressure of each stage is equal to the pressure of the feed stream.
3. Membrane permeability is independent of the pressure and temperature.
4. The feed side pressure drop is negligible for each stage.
5. The system operates at isothermal conditions.
For a binary gas mixture, the local permeation rate at any point in the stage over a differential
membrane area dAm, as shown in figure 1, is as follows
ydV =PA
t[phx − ply]v)
(1 − y)dV =PB
t[ph(1 − x) − pl(1 − y)] (vi)
Dividing eq (i) by eq (ii), we get
y
1−y=
α[x−(𝑝𝑙−𝑝ℎ)y]
(1−x)−(𝑝𝑙𝑝ℎ
)(1−y)
(vii)
Where PA and PB are the permeabilities of pure gas components (CO2 and CH4 in this
work), x and y are the feed and permeate composition at any point along the membrane, t is the
membrane thickness and α is the membrane selectivity (Geankoplis, 2003). The above set of
differential equations were solved using VB code which is used as a subroutine in ASPEN
HYSYS in order to calculate the purity (permeate mole fraction yp), methane (CH4) recovery,
and membrane area Am required for the separation. These parameters, along with compressor
11
power, define the gas processing cost (GPC) for the membrane system. In order to get the
optimal design, it must be minimized keeping operating conditions under consideration.
2.3. Design Configurations
The design of a membrane separation process depends on the operating parameters of
the individual permeators as well as the configuration of permeators (Qi and Hensen, 1998a)..
For moderate purity and recovery requirement, a single stage system, with and without recycle
is appropriate (Schell and Houston, 1982). For more demanding separations, a multiple stage
system is required that can further be modified by recycling permeate or retentate stream
(Spillman et al., 1988; Coady and Davis, 1982).
The design of multiple stage system is very complex as it is not feasible to consider all
possible configurations (Koros and Chern, 1987; Spillman, 1989; Qi and Hensen, 1998a). The
conventional approach is to select a small number of design configurations and optimize the
operating conditions of each configuration. The final optimum design is chosen to be the
system with most favourable economics (Spillman et al, 1988; Babcock et al., 1988; Bhide and
Stern, 1993; Qi and Hensen, 1998a).
The proposed design configurations include single stage (SS), single stage with
permeate recycle (SSPR), double stage with permeate recycle (DDPR), double stage with
retentate recycle (DDRR), triple stage with retentate recycle (TTRR) and triple stage with
permeate and retentate recycle (TTPRR) as shown in Fig. 2a-2f. A compressor is needed at the
start of each configuration in order to achieve the desired pressure for the parametric
investigation. In addition, a smaller compressor is required to increase the pressure of permeate
stream before recycling. The cooler is needed after each compression stage in order to decrease
the temperature of feed stream to avoid membrane damage.
12
2.4. Process Conditions and Economic Parameters
The composition, flow rates, pressures and temperature of crude natural gas depend
mainly on the source therefore feed conditions that are typical for medium sized natural gas
treatment plant are selected. As a result, the feed flow rate of crude natural gas is maintained
at 35 MMSCF (Hao et al, 2002). On the other hand, a wide range of feed pressures (10-100
bar) and membrane selectivity (5-80) has been investigated. The outlet residue CO2
concentration is set to 2 % while outlet permeate pressure for each stage is not greater than 4
bar (Qi and Hensen, 1998a). The thickness of membrane is considered to be 1000 A0 (3.937 *
10-6 in) (Hao et al, 2002). In addition, it is assumed that maximum outlet temperatures in the
compressors is limited to 1500C giving the compression ratio of 3.5 over each compressor stage
(Hussain and Hagg, 2010).
The processing cost for natural gas is often expressed as the cost per MSCF of feed but
it is more reasonable to define the processing cost per MSCF of product due to presence of
substantial amount of CO2 in the feed. In addition, upgraded natural gas is sold on the basis of
product volume rather than of feed volume (Hao et al, 2002).Therefore, processing cost per
MSCF of product is used in the present study.
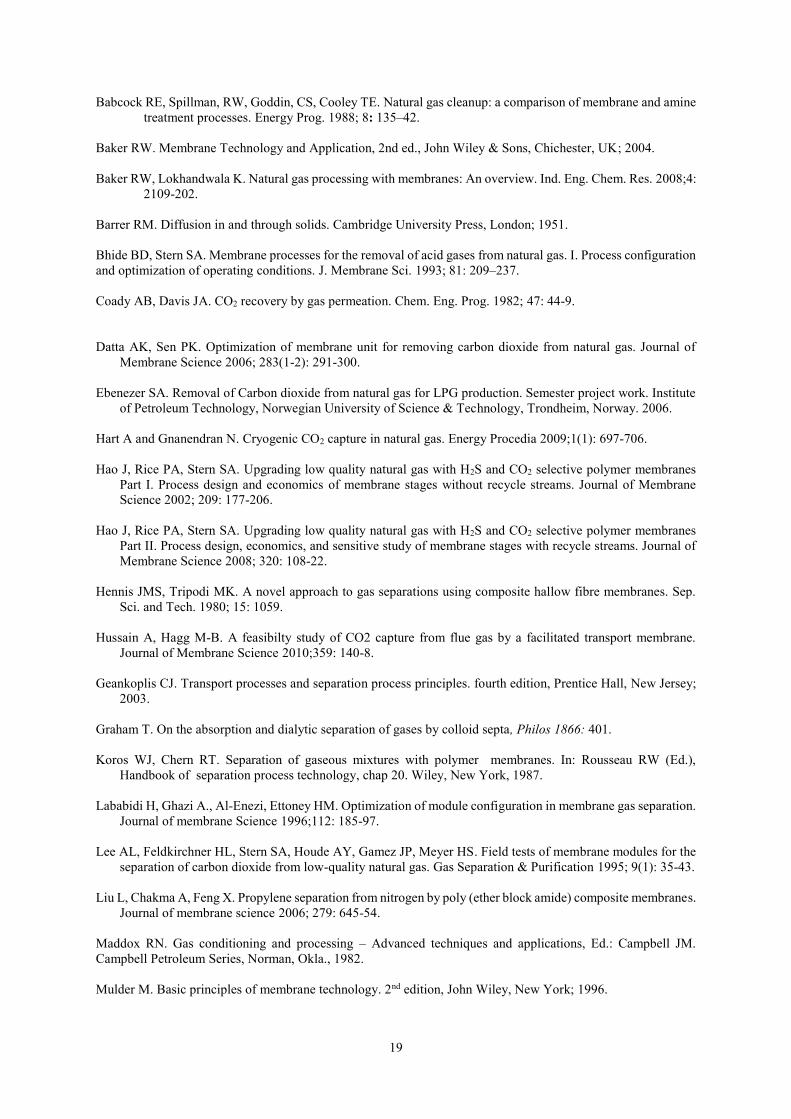
The procedure to calculate the gas processing cost (GPC) is given in Table 1. It includes
the capital related cost (CRC), the variable operating and maintenance cost (VOM) and the cost
of CH4 lost in the permeate stream (CH4LS) (Hao et al, 2008; Hussain and Hagg, 2010). The
cost of cooling system is included in the compressor cost (CC) as it usually comes along with
compressors. A payout time is considered to be 5 years in order to calculate the capital cost
whereas project contingency, that covers the unpredictable elements of the project, is assumed
to be 20% of the base plant cost (Hao et al, 2008).
13
3. RESULTS AND DISCUSSIONS
3.1. Model Validation
The suggested simulated mathematical model is validated by published experimental
and simulated data for CO2 removal from natural gas using membrane separation processes.
The data by Pan (1986) is based on the experiments performed on sour natural gas. The feed
gas used in the experiments contains 48.5 % CO2 that is removed in the permeate stream in
order to increase the recovery of methane in the retentate stream. The temperature and pressure
values of the gas are 10ºC and 35.28 bars, respectively, while the permeate pressure is 9.28 bar.
The selectivity is assumed to be 25. The same process conditions are maintained for the
proposed simulated model and compared with experimental data by Pan (1986). Table 2 shows
that the suggested model gives good approximation to the experimental data with maximum
percentage error < 7 %. The small error in the comparison could be attributed to the sensitivity
of membrane permeability towards high pressure, which is assumed negligible in the suggested
mathematical model.
The proposed simulated model is further validated by the data from Qi and Hensen
(1998a) based on the study conducted on CO2 separations from natural gas using approximate
algebraic permeator model. The operating conditions and requirements are maintained in such
a way to match that of simulated data by Qi and Hensen (1998a). The CO2 concentration in the
feed gas is set to 20% while permeate pressure is not allowed to exceed than 10.5 bar in order
to avoid negative pressure operation. The temperature of feed gas is 400C and the selectivity of
membrane is considered to be 20. Furthermore, natural gas processing capacity is maintained
at 19353 m3/day (6.8*105 ft3/day) for the simplest design configuration of single stage
membrane system without any recycle stream. Table 3 shows that the simulated model
14
proposed in our work is in close agreement with the simulated data by Qi and Hensen with
maximum percentage error < 5 %.
3.2. Parametric and Economic Analysis
3.2.1. Methane Recovery:
Methane (CH4) recovery decreases with the increase in CO2 contents of the feed (Qi
and Hensen, 1998). At the same time, CH4 recovery can be improved by recycling the permeate
stream as well as by using mutiple stage configuration (Schell and Houston, 1982; Babcock et
al., 1988; Spillman et al., 1988).
Fig. 3 shows the effect of feed composition on CH4 recovery for all proposed
configurations, for the stage cut of 0.5 and selectivity of 25. The permeability of CH4 is
considered as 1.4×10⁻³ mol/MPa-m2-s while the feed pressure and permeate pressure are
maintained at 100 and 4 bar, respectively. It can be observed that the CH4 recovery is reducing
with the increase of CO2 in the feed gas. The system without recycle, as expected, provides the
lowest methane recovery. It can also be observed that methane recovery for single stage system
with recycle is almost same as that of single stage system without recycle so it is not favourable
to recycle the permeate stream in single stage system. Besides, the simulated results also show
that the usage of a multiple stage systems leads to high methane recovery. In addition, it can
be deduced that methane recovery can be improved by recycling permeate and retentate stream
in the case of multiple stage systems.
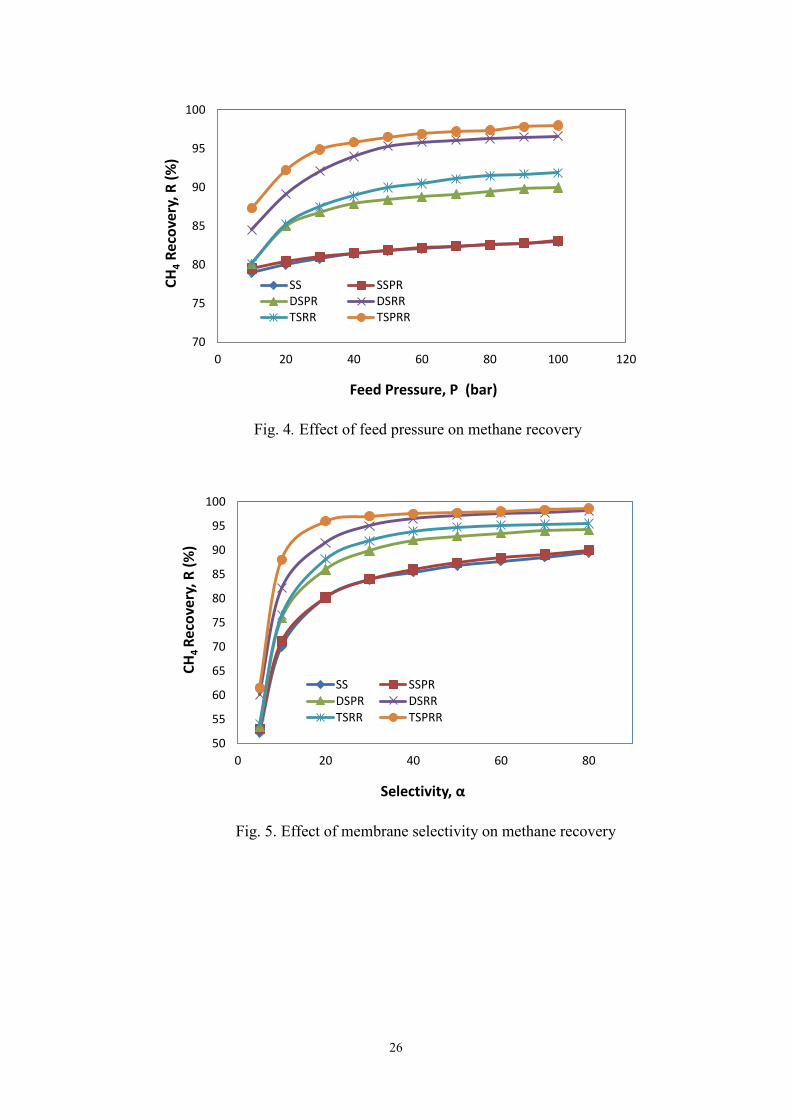
Fig. 4 shows the effect of feed pressure on CH4 recovery for different configurations.
The stage cut and selectivity is same as in the previous case, whereas the feed gas contains 20%
CO2 and 80% CH4. It can be observed that the increase in feed pressure improves CH4 recovery.
It is due to the fact that the increased pressure creates a greater driving force across the
15
membrane. As a result, a net increase in permeation through the membrane increases methane
recovery.
Membrane properties have a high influence on CH4 recovery, which increases with the
increase in selectivity of the membrane. The reason is that increased selectivity leads to higher
permeation and thus to an improved methane recovery. Fig. 5 shows the effect of membrane
selectivity on the three proposed configurations. As expected, the increase in selectivity
increases CH4 recovery, especially for the multiple stage configurations. On the other hand, the
increment in selectivity for the single stage configurations (with and without recycle) is less
significant on the methane recovery, especially for higher selectivity membranes.
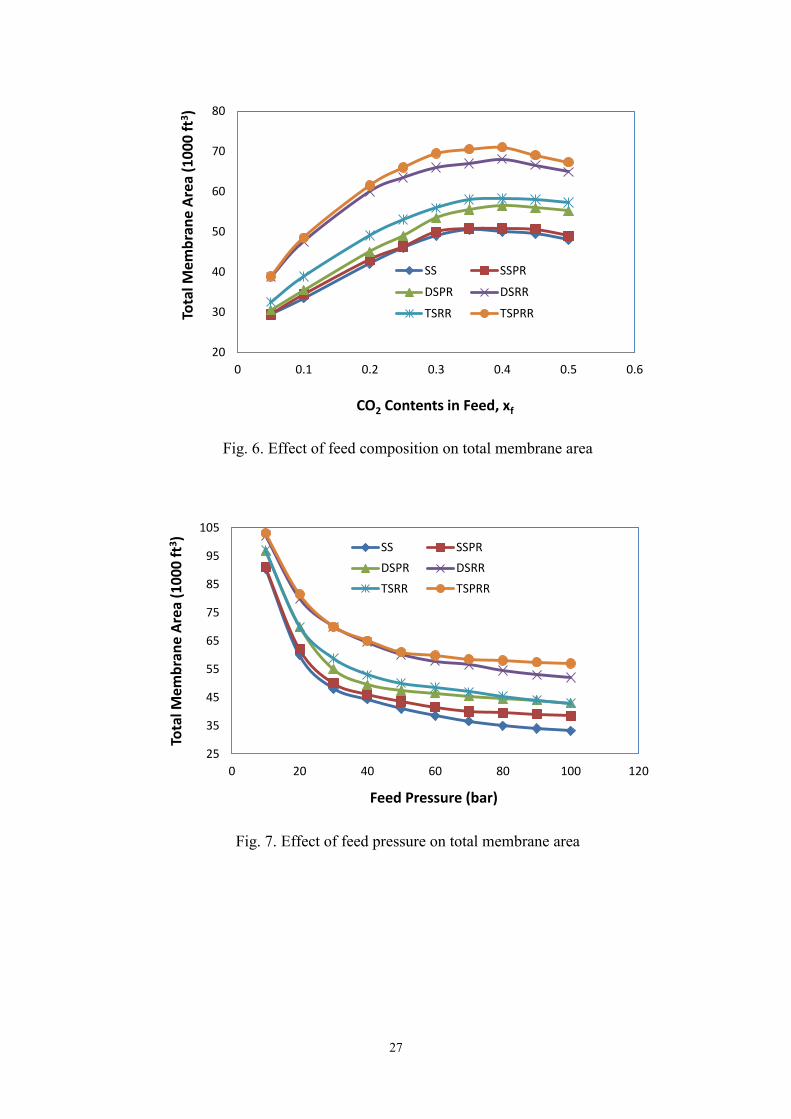
3.2.2. Total membrane Area
The effect of feed composition on the total membrane area required for the effective
separation is studied for proposed design configurations as shown in Fig 6. It is observed that
the total membrane area increases with the increase in CO2 composition of the feed until it
reaches its maximum point. After that, a further increase can lead to the decrease in the
membrane area requirement. It is due to the characteristics of chosen selectivity of the
membrane. It can also be observed that recycling the retentate stream in the multiple stage
configurations can lead to large requirements of area, while in the single stage system, recycling
has minimal effect.
On the other hand, an increase in feed pressure would decrease the total membrane area
required for the effective separation as shown in the Fig. 7. It is obvious that high pressure
leads to a high rate of permeation, due to which less membrane area is required for the
separation.
16
Fig 8. shows the effect of membrane selectivity on the total membrane area for different
design configurations. Increasing selectivity decreases the membrane area requirements, which
is more pronounced in the multiple stage configurations, followed by single stage configuration
with recycle and single stage configuration without recycle.
3.2.3. Gas Processing Cost:
In order to find the optimal design, gas processing cost (GPC) must be minimum subject
to operating conditions, material and energy balances, and individual permeator mathematical
model (Qi and Hensen, 1998a). The effect of feed composition on the GPC for the proposed
design configurations is shown in Fig. 9. It can be noted that single stage systems without
recycle (SS) yield a moderate GPC because the membrane area required is small and no
compressors are needed. The double stage with retentate recycle (DSRR) and triple stage with
permeate and retentate recycle (TSPRR) has the maximum GPC even in the presence of high
methane recovery due to the high compressor power and very large membrane area required.
Triple stage with retentate recycle (TSRR) yields relatively less GPC due to improved methane
recovery. The minimum GPC is achieved by the double stage system with permeate recycle
because of the high methane recovery and moderate power requirement for the configuration.
Moreover, it can also be observed that the increase of CO2 contents in the feed gas leads
to high GPC until a certain optimum point, depending upon the operating conditions and the
membrane properties. The further increase of CO2 contents can lead to the decrease in the GPC.
It is due to the similar behaviour of total membrane area requirement with the change in CO2
contents of the feed (discussed in section 3.2.2).
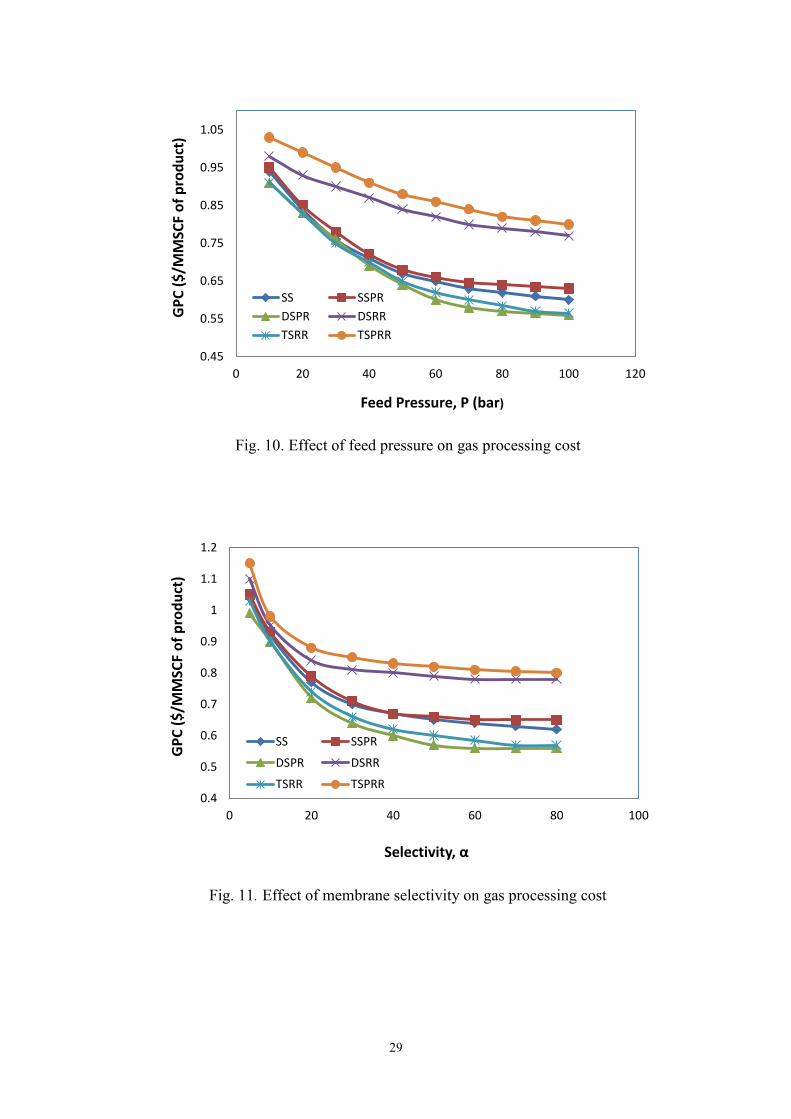
The effect of feed pressure on the GPC is shown in the Fig. 10. The increase in feed
pressure improves the GPC, especially at relatively lower pressure ranges, due to the
17
improvement in methane recovery and less membrane area required for the separation at
increased feed pressure.
The effect of selectivity on GPC is shown in Fig. 11. It can be deducted that GPC
decreases significantly with the increase in selectivity of the membrane, which can be explained
by the fact that membranes with high selectivity yield high methane recovery with less
requirements of membrane area. These results are consistent with those obtained by Spillman
et al. (1988), Babcock et al. (1988) and Qi and Hensen (1998a).
It can be observed in GPC comparison for different design configurations that the
optimal design for CO2 capture from natural gas using membrane is double stage with permeate
recycle as it gives minimum GPC due to high methane recovery and less requirement of
membrane area (even for feed with high contents of CO2).
4. CONCLUSIONS
A systematic design strategy has been presented for the CO2 capture from natural gas
using a membrane process. The proposed cross flow model is included in the process
simulation (Aspen HYSYS) as a user defined unit operation along with other available unit
operations in order to design the membrane system configuration. The simulated model is
validated with experimental data, where the simulated data exhibit good agreement with the
published results. The design sensitivity has been investigated by changing the operating
conditions and the membrane properties. It is observed that gas processing cost (GPC)
increases with the increase in composition of CO2 in natural gas to a certain point. After that,
further increase in CO2 contents can lead to the minimization of GPC. Moreover, it can be
minimized by the increase in feed pressure or selectivity of the membrane. Different
configurations including single stage (with and without recycle) and mutiple stage membrane
18
systems (with permeate and retentate recycle) have been investigated for optimal design under
the present study. The findings indicate that the GPC is minimum for double stage membrane
system with permeate recycle making it the optimal design for the membrane separation
system. Furthermore, the Aspen HYSYS user defined unit operation has potential to be applied
for complex membrane system design and optimization study.
Acknowledgements
This work was done with the financial support from Universiti Teknologi PETRONOS.
REFERENCES
Amerongen GJ. Influence of structure of Elastomers on their permeability to gases. J. Appl. Poly. Sci. 1950; 5:
307.
19
Babcock RE, Spillman, RW, Goddin, CS, Cooley TE. Natural gas cleanup: a comparison of membrane and amine treatment processes. Energy Prog. 1988; 8: 135–42.
Baker RW. Membrane Technology and Application, 2nd ed., John Wiley & Sons, Chichester, UK; 2004. Baker RW, Lokhandwala K. Natural gas processing with membranes: An overview. Ind. Eng. Chem. Res. 2008;4:
2109-202. Barrer RM. Diffusion in and through solids. Cambridge University Press, London; 1951. Bhide BD, Stern SA. Membrane processes for the removal of acid gases from natural gas. I. Process configuration and optimization of operating conditions. J. Membrane Sci. 1993; 81: 209–237. Coady AB, Davis JA. CO2 recovery by gas permeation. Chem. Eng. Prog. 1982; 47: 44-9. Datta AK, Sen PK. Optimization of membrane unit for removing carbon dioxide from natural gas. Journal of
Membrane Science 2006; 283(1-2): 291-300. Ebenezer SA. Removal of Carbon dioxide from natural gas for LPG production. Semester project work. Institute
of Petroleum Technology, Norwegian University of Science & Technology, Trondheim, Norway. 2006. Hart A and Gnanendran N. Cryogenic CO2 capture in natural gas. Energy Procedia 2009;1(1): 697-706. Hao J, Rice PA, Stern SA. Upgrading low quality natural gas with H2S and CO2 selective polymer membranes
Part I. Process design and economics of membrane stages without recycle streams. Journal of Membrane Science 2002; 209: 177-206.
Hao J, Rice PA, Stern SA. Upgrading low quality natural gas with H2S and CO2 selective polymer membranes
Part II. Process design, economics, and sensitive study of membrane stages with recycle streams. Journal of Membrane Science 2008; 320: 108-22.
Hennis JMS, Tripodi MK. A novel approach to gas separations using composite hallow fibre membranes. Sep.
Sci. and Tech. 1980; 15: 1059. Hussain A, Hagg M-B. A feasibilty study of CO2 capture from flue gas by a facilitated transport membrane.
Journal of Membrane Science 2010;359: 140-8. Geankoplis CJ. Transport processes and separation process principles. fourth edition, Prentice Hall, New Jersey;
2003. Graham T. On the absorption and dialytic separation of gases by colloid septa, Philos 1866: 401. Koros WJ, Chern RT. Separation of gaseous mixtures with polymer membranes. In: Rousseau RW (Ed.),
Handbook of separation process technology, chap 20. Wiley, New York, 1987. Lababidi H, Ghazi A., Al-Enezi, Ettoney HM. Optimization of module configuration in membrane gas separation.
Journal of membrane Science 1996;112: 185-97. Lee AL, Feldkirchner HL, Stern SA, Houde AY, Gamez JP, Meyer HS. Field tests of membrane modules for the
separation of carbon dioxide from low-quality natural gas. Gas Separation & Purification 1995; 9(1): 35-43. Liu L, Chakma A, Feng X. Propylene separation from nitrogen by poly (ether block amide) composite membranes.
Journal of membrane science 2006; 279: 645-54. Maddox RN. Gas conditioning and processing – Advanced techniques and applications, Ed.: Campbell JM. Campbell Petroleum Series, Norman, Okla., 1982. Mulder M. Basic principles of membrane technology. 2nd edition, John Wiley, New York; 1996.
20
Pan CY. Gas Separation by high flux, asymmetric hallow fiber membrane. AIChe Journal 1986;32: 2020-27. Peters MS, Timmerhaus KD. Plant design and economics for chemical engineers. McGraw-Hill, New Yok; 1980. Qi R, Hensen MA. Opitmal design of spiral wound membrane networks for gas separations. Journal of membrane
science 1998;148: 71-89. Qi R, Hensen MA. Optimization –based design of spiral wound membrane systems for CO2/CH4 separations.
Separation and Purification Technology 1998(a);13: 209-25 Qi R, Hensen MA. Membrane system design for multicomponent gas mixtures via mixed-integer nonlinear
programming. Computers and Chemical Engineering 2000; 24: 2719–37. Safari MH, Ghanizadeh A, Montazer-Rahamti MM. Optimization of membrane based CO2- removal from natural
gas using simple models considering both pressure and temperature effects. International Journal of Green House Control 2008;105: 3-10.
Shoemaker DP, Garland CW, Nibler JW. Experiments in physical chemistry. 6th edition, McGraw Hill, New York;
1996. Schell WJ, Houston CD. Spiral-wound permeators for purification and recovery. Chem. Eng. Prog. 1982;13: 33-
7. Spillman RW, Barrett MG, Cooley TE. Gas membrane process optimization. In AIChE National Meeting, New Orleans, LA; 1988. Spillman RW. Economics of gas separation membranes, Chem. Eng. Prog. 1989; 85: 41-62. Steeneveldt R, Berger B, Torp TA. CO2 Capture and Storage: Closing the Knowing-Doing Gap. Chemical
Engineering Research and Design 2006; 84(9): 739-63. Wang L, Shao C, Wang H. Operation optimization of a membrane separation process through auto-controlling
the permeate gas flux. Sep. Purif. Technol. 2007;55: 30. Wijmans JG, Baker RW. The solution diffusion mode: a review. Journal of Membrane Science 1995;107: 1-21. Xomeritakis G, Liu NG, Chen Z, Jiang YB, Köhn R, Johnson PE et al. Anodic alumina supported dual-layer
microporous silica membranes. Journal of Membrane Science 2007;287(2): 157-61. LISTS OF TABLES
Table 1: Economics parameters for gas processing cost (Hao et al., 2008)
21
Total Plant Investment (TPI): Membrane module cost (MC) Installed compressor cost (CC) Fixed cost (FC) Base Plant Cost (BPC) Project Contingency (PC) Total facilities investment (TFI) Start up cost (SC) Annual Variable Operating and Maintenance Cost (VOM): Contract and Material Maintenance Cost (CMC) Local Taxes and insurance (LTI) Direct Labor cost (DL) Labor Overhead Cost (LOC) Membrane Replacement Costs (MRC) Utility Cost (UC) Annual Cost of CH4 Lost in Permeate (CH4LS): Annual Natural Gas Lost (NGLS) Gas Processing Cost (GPC) Annual Capital Related Cost (CRC) Membrane Life (t) Wellhead Price of Crude Natural Gas Heating Value Of Natural Gas On stream factor (OSF) Compressor Efficiency (Ƞcp)