Page 1
PROCESS SIMULATION OF CRUDE OIL STABILIZATION
SYSTEM : AN INDUSTRIAL CASE SUDY
by
MUHAMMAD FIRDAUS BIN DAINURE
Progress report submitted in partial fulfillment
of the requirements for the
Bachelor of Engineering (Hons)
(Chemical Engineering)
MAY 2013
Universiti Teknologi PETRONAS
Bandar Seri Iskandar
31750 Tronoh
Perak Darul Ridzuan
Page 2
CERTIFICATION OF APPROVAL
PROCESS SIMULATION OF CRUDE STABILIZATION
— AN INDUSTRIAL CASE STUDY
by
MUHAMMAD FIRDAUS BIN DAINURE
A project dissertation submitted to the
Chemical Engineering Programme
Universiti Teknologi PETRONAS
in partial fulfilment of the requirement for the
BACHELOR OF ENGINEERING (Hons)
(CHEMICAL ENGINEERING)
Approved by,
_______________________
(Dr. Maziyar Sabet)
Date: 6 September 2013
UNIVERSITI TEKNOLOGI PETRONAS
TRONOH, PERAK
MAY 2013
Page 3
CERTIFICATION OF ORIGINALITY
This is to certify that I, Muhammad Firdaus Bin Dainure (I/C No : 901109-04-5367), am
responsible for the work submitted in this project, that the original work is my own except as
specified in the references and acknowledgements, and that the original work contained
herein have not been undertaken or done by unspecified sources or persons.
_________________________________
MUHAMMAD FIRDAUS BIN DAINURE
Student ID : 12731
I/C No : 901109-04-5367
Date : 06 September 2013
Page 4
ABSTRACT
Petroleum is a naturally occurring flammable liquid of complex hydrocarbons found
in oil reservoir beneath the Earth's surface. Crude oil (live crude) are sent to oil
refineries for it to be processed into marketable petroleum products. However, before
being transported to the refineries, the crude oil need to be stabilized beforehand since
it contains light components that could flash off in low pressure conditions. This
paper aims to find the suitable operating conditions to stabilize an incoming live crude
feed to maximum True Vapor Pressure (TVPs) of 10 psia and 12 psia at Terengganu
Crude Oil Terminal, TCOT. A simulations of the process has been conducted by
using Aspen HYSYS (ver. 2007) software. It was found that at an heat exchanger
outlet temperature of 85 - 90 ⁰C, High Pressure Separator, V-220 A/B and Low
Pressure Separator, V-230 A/B operating pressure of (400 - 592 kPa) and (165 - 186
kPa) respectively. The effects of major parameters, i.e. inlet feed properties, three
phase separators operating pressure and pre-heaters trains performance on the product
TVP are also studied. Based on the scenarios analyzed, it can be concluded that actual
water volume (kbbl/d) has greater impact on heat exchanger's duty, thus incoming
free water to TCOT should be less than 19.5 kbbl/d (9.1 vol%).
Page 5
ACKNOWLEDGEMENT
Alhamdulillah, thanks to Allah S.W,T, whom with His willing giving me the
opportunity to complete this Final Year Project.
First and foremost, I would like to express my deepest gratitude to my helpful
supervisor Dr. Nejatollah Rahmanian, who has guided and support me during these
two semester sessions to complete this project. The special thanks and gratitude also
goes to my co-supervisor, Dr. Maziyar Sabet. The supervision and guidance that they
gave truly help the progression and smoothness of my final year project. The co-
operation is much indeed appreciated. I would also want to thank all lecturers and
staffs of Chemical Engineering for their co-operations, suggestions and time
responding to my inquiries along the way.
Not to forget, to all my friends and course mates for their cooperation,
encouragement, constructive suggestion and full of support for this project
completion, from the beginning till the end. Thanks to everyone who has been
contributing by supporting my work during the final year project progress till it is
fully completed.
Deepest thanks and appreciation to my beloved parents, and family for their love,
support and prayers during my time completing this project. They also supported me
and encouraged me to complete this task so that I will not procrastinate in doing it.
Page 6
TABLE OF CONTENTS
Chapter Title Page 1.0 INTRODUCTION
1.1 Background of Study 1
1.2 Problem Statement 3
1.3 Objectives 5
1.4 Scope of Study 5
2.0 LITERATURE REVIEW
2.1 Well Fluid Composition 5
2.2 Oil Handling Facilities (Crude Processing & Treatment)
9
2.3 Crude Stabilization System (Multistage Separation) 12
2.4 Terengganu Crude Oil Terminal (TCOT) Overview 16
2.5 Basis of Study (Tapis Blend – Inlet Compositions) 19
2.6 Design Production Rate 20
2.7 Selecting Thermodynamic Model 21
3.0 PROJECT METHODOLOGY
3.1 General Methodology Chart 23
3.2 Project Research 24
3.3 Project Simulation 24
3.4 FYP 1 & FYP 2 Schedule and Gant Chart 25
4.0 RESULTS & DISCUSSIONS
4.1 Brief Process Description 27
4.2 HYSYS Process Simulation Case Study 29
4.3 Simulation Validation (HYSYS vs. Plant Data) 35
4.4 Preliminary Result Analysis 43
Page 7
4.5 Effects of Different Operating Conditions 49
4.6 Effects of Incoming Crude Oil Variables 51
4.7 Effects of Oil, Gas & Water Separators Variable 55
4.8 Pre-Heater Trains Variable 59
4.9 Hot Oil to Crude Exchanger, HX-220X Performance
63
5.0 RESEARCH CONCLUSION
5.1 Conclusions 67
5.2 Recommendations 68
6.0 REFERENCES 69
APPENDICES 71
I Related Drawing (TCOT — HYSYS Model)
II Related Drawing (TCOT Crude Stabilization System)
III Basis of Simulation (Tapis Blend – TCOT Inlet Crude Composition)
IV Preliminary Data Analysis (Tables)
V Fired Heater HX-610 Performance Calculations
VI HYSYS Simulation Report (Pseudo & Crude Assays)
Page 8
LIST OF FIGURES
Figure Titles Page 1 Diagram of Production Manifold 09 2 Typical PFD of Onshore Crude Oil Receiving Terminal Appendix 1 3 Effects of Separator Pressure on Liquid Recovery 13 4 Stage Separation Guidelines 14 5 TCOT General Overview and Process 16 6 Thermodynamic Model Decision Tree 21 7 Project Methodology and Activities 23 8 The Schematic Diagram of General Methodology 24 9 PFD of TCOT Crude Stabilization HYSYS Model Appendix 1 10 Phase Envelope Curve for Inlet Feed 34
11 Terengganu Crude Oil Terminal, TCOT Stabilized Crude Compositions (Mol Fraction) 35
12 Comparison of Product Compositions (Pseudo Component) 37 13 Comparison of Product Composition (Crude Assay) 40 14 Total Validation of HYSYS Software s. Plant Data 42
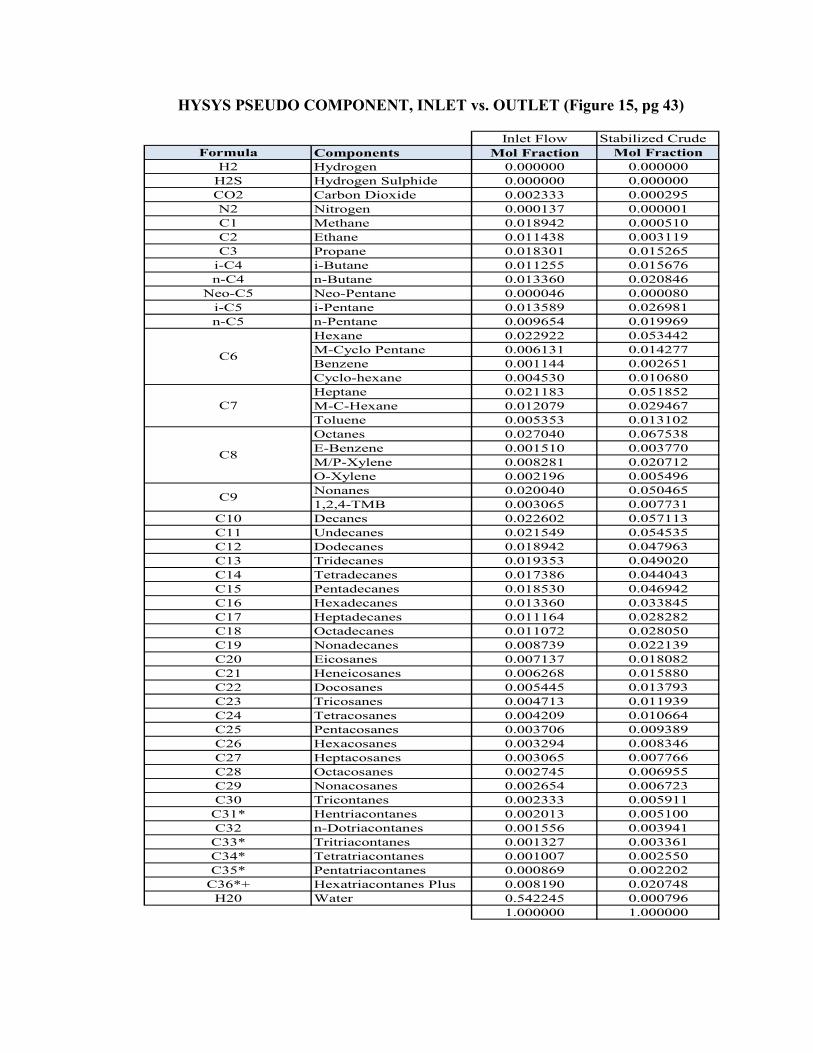
15 Inlet and Outlet Comparisons for HYSYS Simulation (Pseudo Components) 43
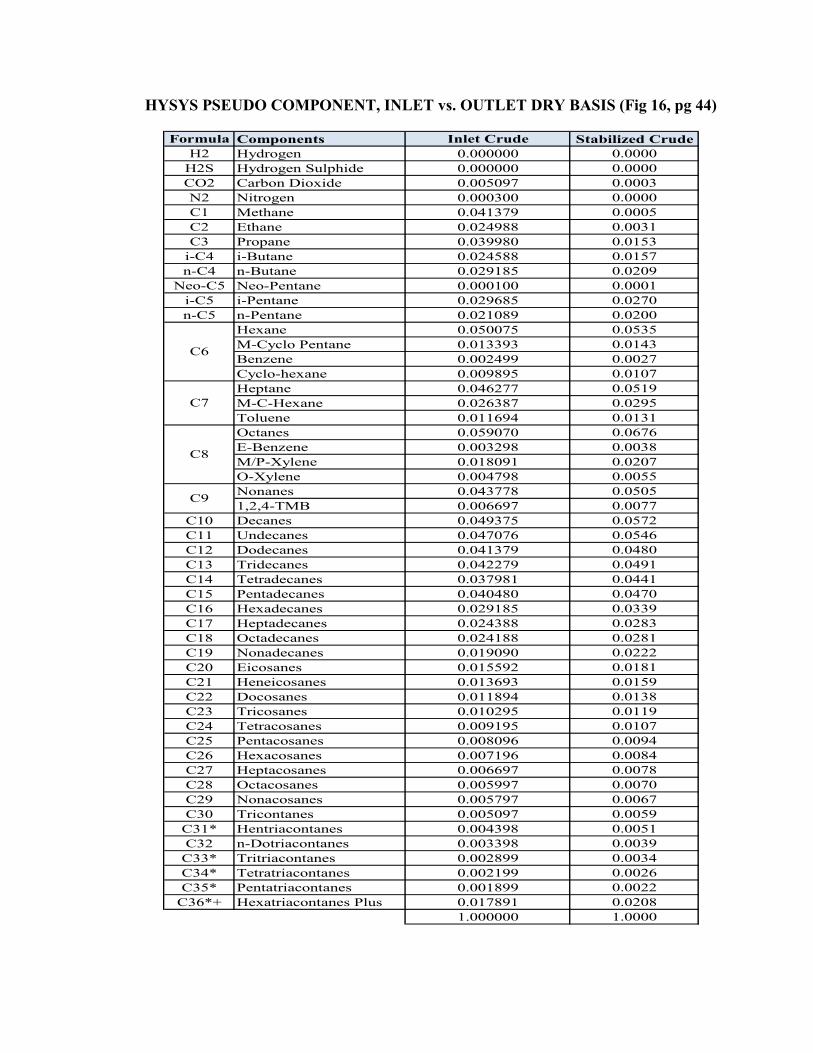
16 Inlet vs. Outlet Composition of HYSYS Simulations (Pseudo Components) Dry Basis Comparison 44
17 HYSYS Crude Assays Compositions (Inlet vs. Outlet) 46
18 HYSYS Crude Assays (Inlet vs. Outlet) in Dry Basis Comparison 47
19 Effect of Dry Feed Flow Rate towards Product TVP 51 20 Effect of Feed Temperature towards Product TVP 52 21 Effects of Feed Pressure towards Product TVP 53 22 Effects of Water Flow Rate towards Product TVP 54
23 Effects of High Pressure Separator, V-220 A/B Operating Pressure 56
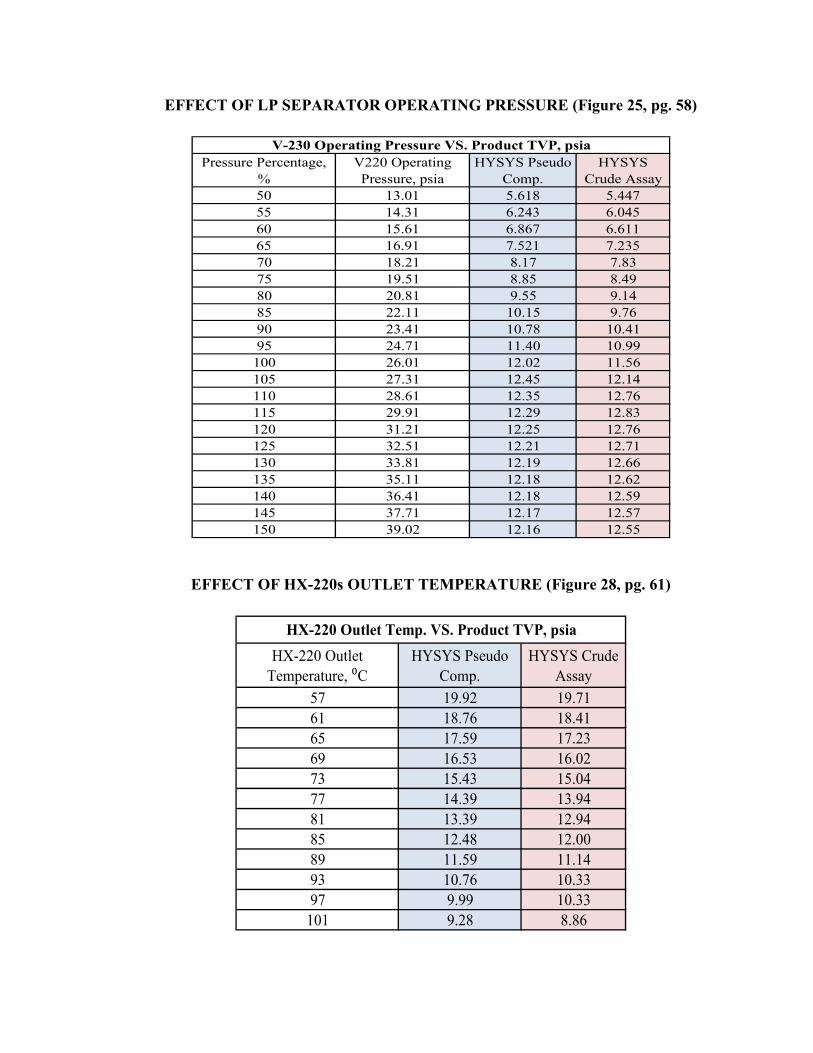
24 Effects of Electrostatic Precipitator Operating Pressure 57 25 Effects of Low Pressure Separator Operating Pressure 58
26 Effects of HX-210s Outlet Temperature (HYSYS Pseudo Component) 59
27 Effects of HX-210S Outlet Temperature (HYSYS Crude Assay) 60
28 Effects of HX-220s Outlet Temperature 61
Page 9
LIST OF TABLES
Table Titles Page 1 Exxon Pipeline Company Crude Specifications 3 2 Impurities Content In Crude Oil 7 3 List and Specification of Crude Oils 8 4 TCOT Inlet Crude Feed Compositions 19 5 Process Design Condition and Parameter 20 6 Typical System and Recommended Property Methods 22 7 Stabilized Crude Specifications (TCOT Storage & Export Line) 27 8 Pseudo Components Properties 29 9 Inlet Crude Compositions HYSYS Pseudo Components 30 10 Detailed Compositions of Light Ends Components 31 11 Bulk Properties of the Inlet Crude 31
12 Detailed Compositions of Incoming Crude to Characterize the Crude 32
13 Detailed Compositions of HYSYS Simulation (Crude Assay) 33 14 Feed Stream Properties 34 15 Preliminary Analysis on Stabilized Crude at TCOT 36
16 Detailed Compositions of Lumped Components of TCOT Plant Data 38
17 Detailed Components of Pseudo C36+* 39 18 Stabilized Crude Properties (HYSYS Pseudo Components) 45 19 Stabilized Crude Properties (HYSYS Crude Assays) 47
20 Status of Operating Conditions for the Study of Effects f Changing Operating Conditions 50
21 Different Between Design and Current Operation 62
22 Calculated Combined Thermal Efficiency of Fired Heater HX-610C and D 63
23 Scenario 1 for HYSYS Simulation Pseudo Component’s Method 63 24 Scenario 1 for HYSYS Simulation Crude Assay’s Method 64 25 Scenario 2 for HYSYS Simulation Pseudo Component’s Method 64 26 Scenario 2 for HYSYS Simulation Crude Assay’s Method 65 27 Scenario 3 for HYSYS Simulation Pseudo Component’s Method 65 28 Scenario 3 for HYSYS Simulation Crude Assay’s Method 66
Page 10
LIST OF ABBREVIATIONS
ABBREVIATIONS DETAILS
TCOT Terengganu Crude Oil Terminal
PCSB PETRONAS Carigali Sdn. Bhd.
PGB PETRONAS Gas Bhd.
GPP Gas Processing Plant
LPGRU Liquefied Petroleum Gas Recovery Unit
DPCU Dew Point Control Unit
VRC Vapor Recovery Compressor
TBC Turbo Booster Compressor
CRS Condensate Recovery System
GOR Gas Oil Ratio
HX Heat Exchanger
LP Low Pressure
HP High Pressure
Page 11
1
CHAPTER 1
INTRODUCTION
1.1 BACKGROUND OF STUDY
Petroleum is a mix of naturally organic compound contains primarily hydrogen, carbon
and oxygen. There are two types of petroleum which come straight out of the ground in
form of liquid. The first one is called as crude oil and the second one is called as
condensate. Crude oil is a dark and viscous liquid and condensate is a clear and volatile
liquid. Crude oil usually in black color but it also comes in other colors like green, red
or brown but they are not uncommon. Crude oil is come into two characteristics either it
is light or heavy. Their characteristics depend on how this crude oil is vaporizing when
it is heating, or it is added by chemical agents. It is light if it is a volatile oil and is heavy
if it is viscous. A significant portion of the world crude oil is produced in the form of
emulsion, R. C. Buruss & R. T. Ryder, (2003) [1].
The fluids existing in a hydrocarbon are usually under high pressure and may be in a
liquid or gaseous state. The hydrocarbon fluids in the reservoir are usually in contact
with water, which is normally salty. Each reservoir is unique : and all of its individual
characteristics, listed below, will have an effect on how the fluid will be produced and
how they must be treated when they reach the surface, M. George, (2010) [2].
a. Pressure
b. Temperature
c. Density of the fluids
d. Type and quantity of fluid that it contains
e. Whether the fluid contains components considered to be undesirable (e.g.,
hydrogen sulphide, H2S and carbon dioxide, CO2
f. Amount of free water in the crude
)
Page 12
2
The hydrocarbon fluids to be found in the reservoir range in a composition from nearly
pure methane gas to a crude so heavy that it is essentially asphalt. The job of a
production facility (oil & gas production terminal) is to separate the well stream into
three components, typically called ‘phases’ (oil, gas and water), and process these
phases into some marketable product(s) or dispose them in an environmentally
acceptable manner. In a typical onshore oil and gas processing facility, separation is the
heart of the process. Separation is a process to separate the gas from the liquid and the
water from the oil. This is usually done in a separator which is an unfired pressure
vessel. The well stream flows into the separator and allow the gas, oil and water to
separate because the of the gravity. During the separations: crude oil stabilization
process, gas is flashed from the liquids and ‘free water’ is separated from the oil. These
step remove enough light hydrocarbons to produce a stable crude oil with the volatility
(vapor pressure) to meet sales criteria. The gas that is separated must be compressed
and treated for sales, while the free water produced will undergo further hydrocarbon
recovery process as to reduce the oil proportion below 10 mg/L before being discharged
as water effluents to the sea, Malaysia Environmental Quality Act, (1974) [9].
Separation is often accomplished in two or three stages of decreasing pressure :
especially is this true in production from high-pressure wells. Staged separation is
desirable for the following reasons as per below, Manning & Thompson, (1991) [5]:
a. It promotes more efficient separation. Less of the intermediate and heavier
hydrocarbons is carried away by the gas : thus they remain in the liquid phase
and a larger volume is retained. The liquid will also have a higher API gravity,
increasing its value. Furthermore, less effort is required to remove the heavier
hydrocarbons from the gas to condition it for pipeline transmission.
b. Less horsepower is required to compress the gas to pipeline pressure.
The existing separator design is capable of processing heavy crude oil and has been
used widely over the world for so many years, however there is still need to improve the
crude stabilization system as to achieve higher separation efficiency and cost effective.
Page 13
3
1.2 PROBLEM STATEMENT
In oil & gas industry especially for oil & gas production facilities, managing
oil-gas-water separation is an important and critical aspect as to treat the reservoir fluid
to achieve standard storage/transport specification while maintaining a marketable
quality. In order to maximize oil/gas production and increasing its market value, the oil
and gas industry has shown keen interest in developing and optimize the separation
efficiency between oil-gas-water in the crude stabilization process.
In addition, crude oil constituents must be reduced to an acceptable level determined by
the purchaser. Table 1 shows the example of typical limit set by Exxon Pipeline
Company:
Table 1: Exxon Mobil Exploration & Production, EMEPMI General Crude Specifications, (1985) [4]
Constituent Limit Remarks
Methane 100 ppm by weight
Ethane 0.20% by volume
Propane 1.00% by volume
Hydrogen Sulphide 50 ppm by weight
Carbon Dioxide 100 ppm by weight
Basic Sediment and Water (BS&W) 1.00% by volume
Inorganic Salts 75 lb per
1000 barrels
Lead 0.010 ppm by weight
Viscosity at Minimum
Delivery Temperature 1000 SSU 216 centistokes
Reid Vapor Pressure 10 psia
Maximum API Gravity 90⁰ API
Minimum API Gravity 15⁰ API
These are only intended as guidelines, because the true criterion is the local pipeline
gauger acceptance (or Automatic Custody Transfer skid monitor), usually based on
percent of Basic Sediment and Water (BS&W) in stabilized crude volume [4].
Page 14
4
In reality, handling free water/produced water in crude is quite a challenging and
critical aspect in crude stabilization process. High free water content (above 0.5%
volume of BS&W set by PETRONAS Carigali Sdn Bhd) will eventually lead to the
following operation losses:
a. Shipment demurrage due to poor crude quality.
b. Potential crude oil terminal plant slowdown/trip.
c. Potential gas compression system slowdown/trip.
Thus, it is crucial that the separation system works properly as to reduce the
contaminant and undesirable constituents in the crude as well as to remove the
produced water/free water in the crude oil receiving terminal.
In addition, due to the declining production of well fluid over the years, the associated
petroleum gas (often called off-gas) also decreasing dramatically causing insufficient
off-gas produced from the crude stabilization system in crude oil receiving terminal.
This eventually lead to gas compressor surge and trip in the gas stabilization system.
This can occur when the mass flow of gas to the compressor falls below a critical level
with a high pressure difference across the machine. According to Norrie, (2010) [27]
generally, if the suction flow drops too low, a ‘Low-flow Trip’ will shut down the
machine. This ‘Surging’ in the machine can be very damaging to the compressor and
associated piping and equipment due to heavy vibrations set up in the system. Also,
surging can cause the machine to ‘Overspeed’ before the control system can react. This
can also cause damage and is prevented by an ‘Overspeed Trip Mechanism’ which will
again shut down the machine.
Frequent gas compressor surge/failure may results in production downtime or even
unplanned plant shutdown. Off-gas produced from the stabilization train must be sent
as sales gas to Gas Processing Plant (GPP) downstream for further treatment to be
converted into valuable Liquefied Petroleum Product (LPG) or fuel gas for
burners/heaters. Compressor failure will affect the sales gas production/transportation
thus the remaining insufficient off-gas from crude stabilization train will be simply
burnt off in gas flares or vented to atmosphere. The flaring of associated gas is
controversial as it is a pollutant (CO2), a source of global warming and is a waste of a
valuable fuel source due to high content of hydrocarbons.
Page 15
5
1.3 OBJECTIVES
The main aim of this project is to simulate a Crude Stabilization Unit with an inlet crude
composition of Tapis Blend (Terengganu Crude Oil Terminal act as the receiving
facilities) to obtain a stabilized crude with maximum True Vapor Pressure (TVP) of 83
kPa (12 psia) for storage/export. Thus, to accomplish the main aim, the following
objectives need to be achieved:
1. To carry out process simulation (HYSYS) of Crude Stabilization System using
Terengganu Crude Oil Terminal (TCOT) data as the case study.
2. To study on the effects operating conditions (Temperature, pressure, flowrate
etc.) on the crude oil stabilization system.
3. To propose on the optimum inlet crude standard specification that will
maximize the oil and gas production at crude oil processing facility.
1.4 SCOPE OF STUDY
This project will focus more on the crude stabilization system and identify any areas for
improvement, thus the work/study will cover on the following activities as per below:
1. Study on the detailed process of Terengganu Crude Oil Terminal (TCOT) and
carry out process simulation (HYSYS) as to observe/analyze the effect of
changes in operating condition on oil & gas production.
2. Compare the existing TCOT crude stabilization system with typical oil
production system.
3. Identify main critical equipment/facilities that affect separation efficiency.
4. Determine areas for improvement and design consideration to enhance
separation efficiency.
Page 16
6
CHAPTER 2
LITERATURE REVIEW
2.1 WELL FLUID COMPOSITIONS
Fluid flow from a well can include gas, free water, condensable vapors (water or
hydrocarbon), crude oil, and solid debris (basic sediment). The proportion of each
component varies in different well streams. When water is produced with crude oil, it is
mixed in either or both of the following forms:
1. Free Water/Produced Water: Water mixed with the oil but will separate
easily into a clear layer when the mixture is allowed enough time to settle.
2. Emulsion: Water can also be mixed with the oil in the form of very small
droplets of water coated with oil. A mixture like this is called emulsion. Water
in this case cannot be easily separated from oil and need to undergo
demulsifications process in order to remove the water content in crude.
The waste water may be used as utility or discharged as water effluents to the sea. In
either case, the water must be treated for solid particles removal, de-oxygenation,
bacteria and hydrocarbon recovery at skimmer pit. As for the gas, it can be found in the
well as [2]:
1. Solution Gas: Gas dissolved in the well fluids under the effect of pressure of
the reservoir. As the fluids flow from the reservoir into the well and up to the
surface, the pressure of the fluid decreases. The capacity of the liquid to hold
gas in solution also decreases and gas starts to separate out of the oil.
2. Free Gas: Gas that is not held in the oil under reservoir conditions.
3. Associated Gas: Total gas produced with the oil in a crude oil well. This type of
gas is separated in the three phase gravity separator and will under further
treatment to be converted into Liquefied Petroleum Gas (LPG product), sales
gas to petrochemical industries or used as a fuel gas for burner/heater at the
production facility.
Page 17
7
Non-hydrocarbon compound in crude may comprises of varying proportion of
impurities depending on the characteristic of reservoir. Table 2 shows solid and
gaseous impurities that may be produced with the crude oil:
Table 2: Impurities Content In Crude Oil, R. C. Buruss, (2003) [1]
Gaseous Solids
Carbon Dioxide, CO Asphaltene 2
Hydrogen Sulphide, H2 Wax S
Carbon Disulphide Sand
Nitrogen, N Sulphur 2
Helium Nickel, Vanadium
Iron, Mercury
The quantities of the impurities are small but their presence may lead to reduction of
efficiencies to the processing facilities such as the separator and compressor. Moreover,
the presence of water and sediment leads to major difficulties such as corrosion, uneven
heating, and plugging in heaters and exchangers and adverse effects on product quality.
The level of water and insoluble impurities are usually measured as Base Sediment and
Water (BS & W).
[4] Although crude oil assays evaluate various chemical properties of the oil, the two
most important properties determining a crude's value are its density (measured as API
specific gravity) and its sulphur content (measured per mass). Crude oil is considered
‘heavy’ if is high in wax content, or ‘light’ if low in wax content: an API gravity of 34
or higher is ‘light’, between 31-33 is ‘medium’, and 30 or below is considered ‘heavy’.
Crude may contain sulphur of varying quantities and are classified as follows:
a. Termed as sour crude when the sulphur content is more than (>2.5%/weight)
b. Termed as sweet crude when the sulphur content is less than (<0.5%/weight)
Page 18
8
Crude oil produced in Malaysia has low sulphur content and high API gravity.
Generally, the higher the API gravity (the ‘lighter’ it is), the more valuable the crude. It
is of high quality and well sought after in the market. Table 3 shows the specifications
of crude oil of certain countries:
Table 3: List and Specification of Crude Oil in Malaysia and other countries, Crude Oil Products, (2012) [7]
Product Name API
Gravity
Sulphur Content
(as % of mass) Field Location Country
Bintulu Crude 36.6⁰ 0.03% Bintulu
Malaysia Labuan Crude 32.0⁰ 0.09% Labuan
Miri Crude 32.3⁰ 0.08% Miri
Tapis Blend 45.2⁰ 0.03% Tapis
Arab Heavy 27.7⁰ 2.87% Saudi Arabia
Arab Light 32.8⁰ 1.97%
Turkmen Blend 33.0⁰ 0.15-0.29% Aladzha,
Okarem Turkmenistan
Syrian Light 37.7⁰ 0.74% Banias, Tartous Syria
Qatar Marine 35.8⁰ 1.47% Halul Island Halul
Page 19
9
2.2 GENERAL OIL HANDLING FACILITIES
2.2.1 Crude Processing & Treatment
Oil well fluids are produced normally in two phases - vapor and liquid. These two
phases require entirely different handling, measuring and processing methods.
Reservoir pressure are generally much higher than atmospheric pressure. As well fluids
reach the surface, pressure on them is decreased. The liquid ability to hold gas in
solution decreases and the liquids begin to release ‘Solution Gas’. Light fluids begin to
separate naturally when the pressure on them is lowered.
The solution gas released as ‘Free gas’ is held by the surface tension of the oil.
Referring to Manning & Thompson, (1991) [5,] this free gas is released from the oil
when the well fluids are warmed to reduce the surface tension of the oil. After the well
fluid has been extracted from various oil well/well platform/subsea manifold, it will
undergo primary separation to remove free water and any solid impurities (sand, wax
etc.) at the surface production facilities (offshore platform).
Well fluid extracted from the well is received in the production manifold. Demulsifier
chemicals is dozed in production manifold to promote breaking up of Water-Oil
emulsion. Figure 1 shows the diagram of the flowline and manifolds :
Figure 1: Diagram of Production Manifold [23]
Figure 2 (Attached in Appendix 1) shows the typical process for oil & gas processing
plant, starting from the crude oil well and to the onshore crude oil terminal via offshore
surface production platform.
Page 20
10
K. Arnold & M. Stewart, (1991) [17] states that three phase well fluid is received from
wells/well platforms and processed at large process platform generally consisting of the
following four major processing module :
a. Separation (Oil, gas and produced water) & oil dispatch
b. Gas compression & dehydration
c. Produced water conditioning
d. Sea water processing & injection system
Many permanent offshore platform have full oil production facilities on board. Smaller
platforms and subsea well must export raw production fluid to the nearest production
facilities, which may be on a nearby offshore processing platform or an onshore
terminal via pipeline for further treatment prior to storage or export Hazard Devold,
(2006) [20]. Special corrosion inhibitor might be injected into the pipeline stream as to
avoid the waxy formation and corrosion inside the pipeline.
Upon reaching onshore, the inlet crude will undergo further separation process (crude
stabilization process) as to separate the oil mixture into three phase (oil-gas-water)
streams. Most terminals have a series of production separators, starting with a high
pressure separator, which separates the (HP) gas from the liquids. Liquids are then
piped to a medium pressure (MP) separator, which removes more gas and the passes the
liquids to a low pressure (LP) separator that removes even more gas and then separates
water from the oil.
The produced water from the crude stabilization system is piped to a skim tank or to a
drain pit, with the oil being piped to a metering and pumping station to be piped to other
processes or storage tanks. Crude oil separation depend on the composition of the
fluids, and on their pressure and temperature. The pressure of the fluids is controlled by
the back - pressure regulator and the temperature may be regulated by expanding the
fluid through a choke, by addition of heat in a furnace or by heating or cooling in a heat
exchanger. Therefore, separators can be designed to handle fluids according to the fluid
composition. The main principle used to achieve physical separation of gas and liquids
are : Gravity Settling and Coalescing. Any separator may employ one or more of these
principle, but the fluid phases must be ‘immiscible’ (cannot mix), and have different
densities for separation to occur.
Page 21
11
In summary, these are variables which aid in the separation of a fluid stream, SKG16
Facilities Process, (2010) [23]:
a. Temperature of the fluids
b. Pressure on the fluids.
c. Density of the components.
In addition to using the force of gravity, modern separators make use of other forces to
get the best possible separation of oil and gas. The gas that is separated must be
compressed and treated for sales. Compression is typically done by engine-driven
reciprocating compressors while for large facilities or in booster service, turbine driven
centrifugal compressors are used. Usually, the separated gas is saturated with water
vapor and must be dehydrated to an acceptable level (normally less than 7 lb/MMscf) :
this process is typically done in a glycol dehydrator. Dry glycol is pumped to the large
vertical contact tower where it strips the gas off its water vapor. The wet glycol the
flows through a separator to the large horizontal reboiler where it is heated and the
water boiled off as a steam.
In overall, system capacity may be increased by [23]:
a. Fine tuning operating conditions of individual equipment items
b. Optimize process parameters or well fluid physical properties
c. De-bottlenecking production system
In some locations it may necessary to remove the heavier hydrocarbon to lower the
hydrocarbon dew point : which is the minimum temperature where liquid might formed
in gas phase. Contaminants such as H2S and CO2
The oil and emulsion from the separators must be treated to remove water. Most oil
contract specify a maximum percent of basic sediment and water (BS & W) that can be
in the crude. This will typically vary from 0.5% to 3% depending on location. Some
refineries have a limit on salt content in the crude, which may require several stages of
dilution with fresh water and subsequent treating to remove the water. Typical salt
limits are 10 to 25 pounds of salt per thousand barrels, Malaysia Environmental Quality
Act, (1974) [9].
may be present at levels higher than
those acceptable to the gas purchaser and it is necessary to ‘sweeten’ the gas.
Page 22
12
2.3 CRUDE STABILIZATION SYSTEM (MULTISTAGE SEPARATION)
Dissolved gas in the well fluid must be removed to meet pipeline, storage or tanker
Reid Vapor Pressure (RVP) specifications. When the oil is essentially free of dissolved
natural gas, then it can be stored in a vented tank at atmospheric pressure. The presence
of the most volatile hydrocarbons (C1, C2, C3 etc.) increase RVP drastically. Removal
of these dissolved natural gas components is called ‘crude oil stabilization’. Crude oil
can be stabilized by passing it through a series of flash drums or vapor-liquid-separator
vessels at successively lower pressure. Stabilization can also sweeten the crude because
the sour contaminant, H2
2.3.1 Effect of Separator Operating Pressure On Liquid Recovery
S, has a boiling point of -76.5 ⁰F, intermediate to that of ethane
and propane, Malaysia Environmental Quality Act, (1974) [9].
Because of the multi-component nature of the produced fluid, the higher the pressure if
at which the initial separation occurs, the more liquid will be obtained in the separator.
This liquid contains some light component that will vaporize in the storage tank
downstream of the separator. If the pressure for initial separation is too high, too many
light components will stay in the liquid phase at the separator and be lost to the gas
phase at the tank condition (RVP : 12 psi). If the pressure is too low, not as many of
these light components will be stabilized into liquid at the separator and they will be
lost to the gas phase.
The tendency of any one component in the process stream to flash to the vapor phase
depends on its partial pressure. The partial pressure of a component in a vessel is
defined as the number of molecules of that component in vapor space divided by the
total number of molecules of all components in the vapor space times the pressure in the
vessel. Thus, if the pressure in the vessel is high, the partial pressure for the component
will be relatively high and the molecules of that component will tend toward the liquid
phase. Ken Arnold & Maurice Stewart (1999) [17] point out that as the separator
pressure is increased, the liquid flow rate out of the separator increase.
Page 23
13
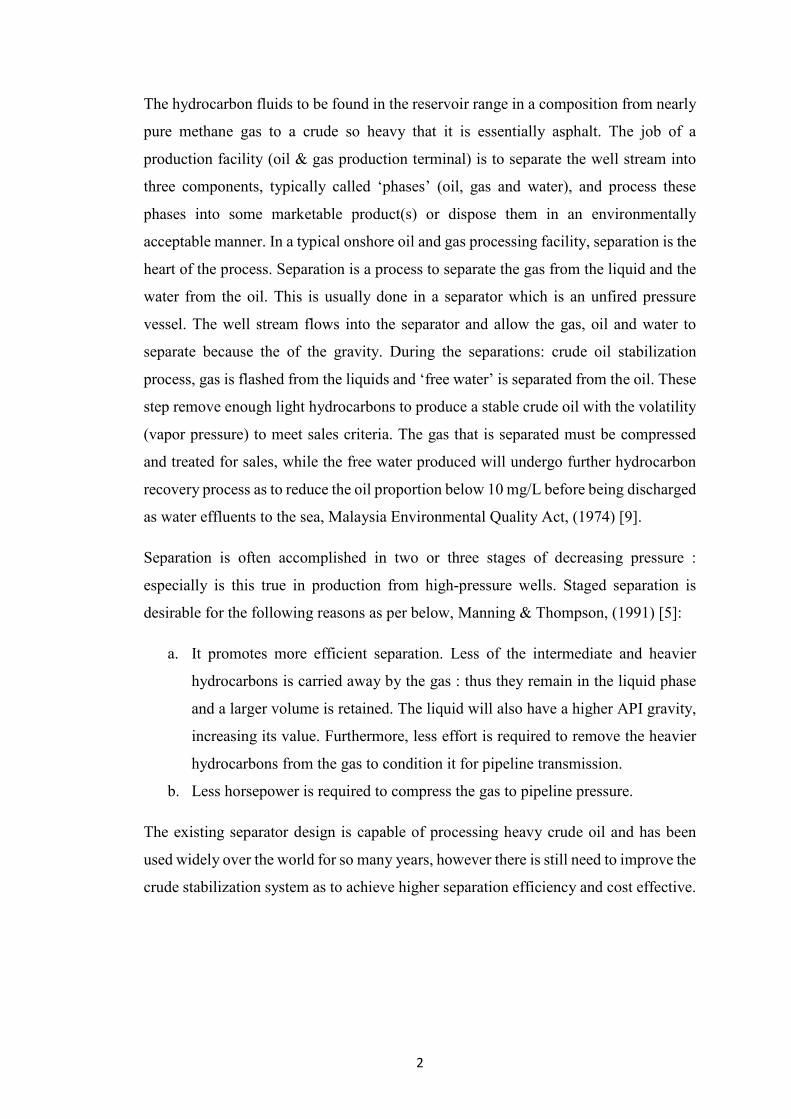
Figure 3 shows the effects of separator pressure on the stabilized oil produced from the
crude stabilization system:
Figure 3: Effects of Separator Pressure on Stabilized Crude Production [17]
Based on figure 3, the total liquid produced from the separation increase with an
increment of the separator’s pressure. The problem with this is that many of these
molecules are the lighter hydrocarbons (methane, ethane and propane), which have a
strong tendency to flash to the gas state in atmospheric pressure conditions (storage). In
the storage tank, the presence of these large number of molecules creates a low partial
pressure for the intermediate range hydrocarbons (butanes, pentane, and heptane)
whose flashing tendency at storage condition is very susceptible to small changes in
partial pressure.
Thus by keeping the lighter molecules in the feed to storage tank we manage to capture
a small amount of them as liquids, but we lose to the gas phase many more of the
intermediate range molecules. That is why beyond some optimum point there is
actually a decrease in storage tank liquid by increasing the separator operating pressure.
Page 24
14
2.3.2 Effect of Number of Stages on Liquid Recovery
Because of the multi-component nature of the produced fluid, it can be shown that the
more stages of separation after the initial separation the more light components will be
stabilized into the liquid phase. In a stage separation process, the light hydrocarbon that
flash are removed at relatively high pressure, keeping the partial pressure of the
intermediate hydrocarbons lower at each stage. As the number of stages approach
infinity, the lighter molecules are removed as soon as they are formed and the partial
pressure of the intermediate components is maximized at each stage. The compressor
horsepower required is also reduced by stage separation as some of the gas is captured
at a higher pressure during separation process.
Ken Arnold & Maurice Stewart (1999) [17] states that as more stages are added to the
process there is less and less incremental liquid recovery. The diminishing income for
adding a stage must more than offset the cost of additional separator, piping, controls,
space and compressor complexities. Usually, for each facility there is an optimum
number of stages. In most cases, the optimum number of stages is very difficult to
determine as it may be different from well to well and it may change as the well’s
flowing pressure declines with time.
Figure 4 shows an approximate guided to the number of stages in separation, which
field experience indicate is somewhat near optimum:
Initial Separator Pressure, psig Number of Stages
25 – 125 1
125 – 300 1 — 2
300 – 500 2
500 – 700 2 — 3
Figure 4: Stage Separation Guidelines [17]
Page 25
15
2.3.3 Separator Operating Pressure
The choice of separator operating pressures in multi-stage system is large. The higher
the operating pressure the smaller the compressor needed to compress the flash gas to
sales. Compressor horsepower requirements are a function of the absolute discharge
pressure divided by the absolute suction pressure. Increasing the low pressure separator
may decrease the compression horsepower, however it may also add backpressure to
inlet crude feed stream, restricting their flow, and allow more gas to be vented to
atmosphere at the tank.
For practical reasons, the choice of separator operating pressures should match closely
and be slightly greater than the compressor interstage pressures. The most efficient
compressor sizing will be with a constant compressor ratio per stage. Therefore, an
approximation of the intermediate separator operating pressures can be derived from:
𝐑𝐑 = �𝐏𝐏𝐏𝐏𝐏𝐏𝐏𝐏�𝟏𝟏 𝐧𝐧�
Where:
R= Ratio per stage
Pd
P
= Discharge pressure, psia
s
n= Number of stage
= Suction pressure, psia
Once a final compressor selection is made, these approximate pressures will be
changed slightly to fit the actual compressor configuration.
Page 26
16
2.4 TERENGGANU CRUDE OIL TERMINAL, TCOT OVERVIEW
Terengganu Crude Oil Terminal (TCOT) was commissioned in 1983, and has been
operating for more than 25 years. It is located at East Peninsular Malaysia. TCOT’s
main function is to receive, stabilize, dehydrate, store and export crude oil from
Terengganu’s offshore fields. Dehydrated crude oil from TCOT is exported to
customers through its export facilities such as SALM 1/SALM or to PETRONAS
Penapisan (Terengganu) Sdn Bhd, TCOT Operating Manual, (1985) [22].
Figure 5: TCOT General Overview & Process
Off-gas from the crude stabilization is metered and exported to GPP1 Liquefied
Petroleum Gas Unit (LPGRU) via Discharge Separator (V-272). Previously when the
crude production was high, TCOT off-gas was sent to GPP1-LPGRU and the balance
was sent to other GPP-DPCU in GPP-A through the Turbo Booster Compressor
(TBC) and Vapor Recovery Compressor (VRC). Currently, the off-gas has decreased
in volume as per decrease in oil production.
Page 27
17
The TBC was initially operated when the LPGRU was unavailable. However, the
TBC is currently obsolete, causing off-gas flaring in TCOT.
GPP-A has four Gas Processing Plants (GPP-1, 2, 3 & 4) which are currently
receiving feed gas from Onshore Gas Terminal (OGT), Onshore Slug Catcher (OSC)
and TCOT off-gas (mainly for GPP-1 only). The GPP-1 plant is divided into 2 plants,
which are Dew Point Control Unit (DPCU) and Liquefied Petroleum Gas Recovery
Unit (LPGRU). DPCU normally receives feed gas from OSC and OGT while LPGRU
receives feed off-gas from TCOT. The LPGRU design capacity is 60 Tonne/hr (32
MMSCFD with gas molecular weight of 38) with minimum and maximum pressure of
300 kPa and 600 kPa respectively.
2.4.1 TCOT Crude Stabilization System
Based on TCOT Operation Train Manual, (2010) [24], TCOT crude stabilization
system consist of two (2 x 50%) stabilization trains which each train is designed at 30,
605 m³/d (1922, 500 bpd) with a total of two train maximum of 385, 000 bpd. The
inlet pressure & temperature is designed at 1250 kpag & 27-29 ⁰C. Each train has an
operating valve (MOV-126 & MOV-127) for normal startup and shut down.
Considering the factor of safety, each train has an inlet shutdown valve (SV-132 &
SV-133) which activated on either abnormally high level or high pressure. TCOT
crude stabilization system consist of several main equipment and are described as per
below (Please note that detailed diagram for the equipment are attached in Appendix
2:
1. Crude / Crude Exchangers (HX-210s)
a. 8 HX-210s crude to crude heat exchangers per train.
b. Arranged in two parallel banks of four exchangers in series.
c. Warm the inlet crude from 27-29 ⁰C to 52-56 ⁰C and at the same time
cools the stabilized crude to about 40 ⁰C before it is transferred to
storage.
2. Hot Oil / Crude Exchangers (HX-220s)
a. 2 parallel HX-220s hot oil to crude heat exchangers per train.
b. One downstream of each parallel bank of four HX-210s.
c. The HX-220s supply additional heat to 80 ⁰C (normal operating)
Page 28
18
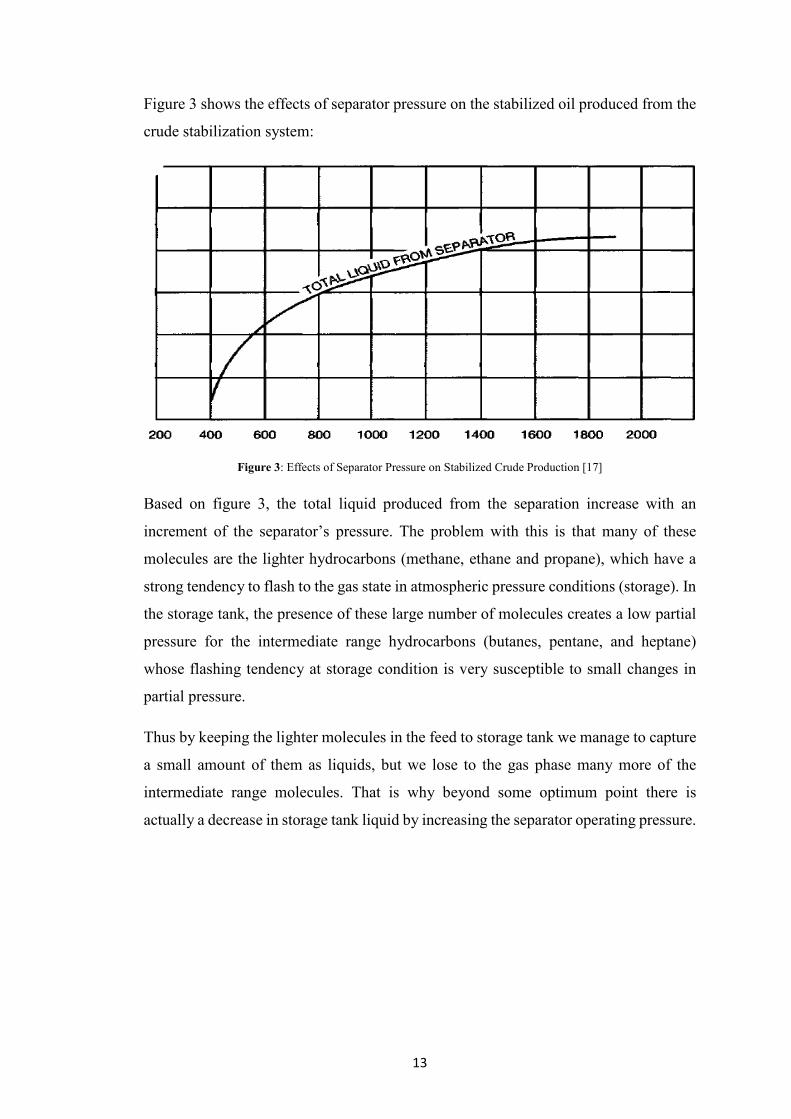
3. Gas-Oil-Water Separators (V-220s)
a. V-220 A/B operate as a three phase separator.
b. Liquid retention time : 2 mins
c. Gas flow : 27746 sm3/h each (23.5 mscfd)
d. Liquid flow : 1488 m3/h each (224.7 kbpd)
e. Pressure (operating / Design) : 443 / 724 kpag
f. Temperature (Operating / Design) : 80 / 122 ⁰C
4. Electrostatic Separators (V-225s)
a. V-225 A/B operate as a two phase separator.
b. Water content at outlet : 0.2 % volume
c. Crude flow : 1407 m3/h each (212.5 kbpd)
d. Water flow : 66 m3/h (10, 000 bpd)
e. Pressure (operating / Design) : 313 / 724 kpag
f. Temperature (Operating / Design) : 80 / 122 ⁰C
5. Crude Surge Separators (V-230s)
a. V-230 A/B operate as a three phase separator.
b. Liquid retention time : 5 mins
c. Gas flow : 15512 sm3/h each (13.1 mscfd)
d. Liquid flow : 1353 m3/h each (204.3 kbpd)
e. Pressure (operating / Design) : 130 / 552 kpag
f. Temperature (Operating / Design) : 80 / 122 DegC
6. Crude Oil Circulation Pumps (P-210s)
a. Three pumps per train
b. Vertical canned-type pump
c. Flow rate : 451 m3/h each (68.1 kbd)
d. Differential heads : 137 m
e. Rated KW : 160 KW
f. SG : 0.743
Page 29
19
2.5 BASIS OF STUDY (Tapis Blend – TCOT Inlet Crude Composition 2011)
This study will focus on Tapis Blend crude production, thus the inlet fluid composition
data of Terengganu Crude Oil Terminal (TCOT) will be used as the basis of process
simulation. Table 4 shows the summary of composition analysis of incoming feed to
Terengganu Crude Oil Terminal, TCOT :
Table 4: TCOT Inlet Crude Feed Compositions
Components Mol Fraction Components Mol Fraction Hydrogen 0.0000 Undecanes 0.0471 Hydrogen Sulphide 0.0000 Dodecanes 0.0414 Carbon Dioxide 0.0051 Tridecanes 0.0423 Nitrogen 0.0003 Tetradecanes 0.0380 Methane 0.0414 Pentadecanes 0.0405 Ethane 0.0250 Hexadecanes 0.0292 Propane 0.0400 Heptadecanes 0.0244 i-Butane 0.0246 Octadecanes 0.0242 n-Butane 0.0292 Nonadecanes 0.0191 Neo-Pentane 0.0001 Eicosanes 0.0156 i-Pentane 0.0297 Heneicosanes 0.0137 n-Pentane 0.0211 Docosanes 0.0119 Hexane 0.0501 Tricosanes 0.0103 M-Cyclo Pentane 0.0134 Tetracosanes 0.0092 Benzene 0.0025 Pentacosanes 0.0081 Cyclo-hexane 0.0099 Hexacosanes 0.0072 Heptane 0.0463 Heptacosanes 0.0067 M-C-Hexane 0.0264 Octacosanes 0.0060 Toluene 0.0117 Nonacosanes 0.0058 Octanes 0.0591 Tricontanes 0.0051 E-Benzene 0.0033 Hentriacontanes 0.0044 M/P-Xylene 0.0181 Dotriacontanes 0.0034 O-Xylene 0.0048 Tritriacontanes 0.0029 Nonanes 0.0438 Tetratriacontanes 0.0022 1,2,4-TMB 0.0067 Pentatriacontanes 0.0019
Decanes 0.0494 Hexatriacontanes Plus 0.0179
TOTAL 1.0000
Notes:
1. The fluid composition analysis are done based on dry basis mol fraction, TCOT
Incoming Fluid Composition, (2011) [28].
Page 30
20
2.6 DESIGN PRODUCTION RATE
Based on the composition and production profile, the facility design conditions are
based on the conditions and parameter defined in Table 5 as per follows:
Table 5: Process Design Condition and Parameters
Parameters Minimum Crude Production
Current Crude Production
Stabilized Crude
Crude Production, kBd 60 195
Temperature, ⁰C 40 40
True Vapour Pressure, psia 12 12
Water In Crude
Temperature, ⁰C 27 27
Pressure, Kpa (Abs) 1801 1801
Molecular Weight, g/mol 18.02 18.02
Dry Feed (Inlet Crude)
Temperature, ⁰C 27 27
Pressure, Kpa (Abs) 1801 1801
Molecular Weight, g/mol 180.57 180.57
Important notes:
1. Based on TCOT production profile obtained from TCOT Integrated Planning
Department [25], TCOT can only sustain the minimum off-gas required within
several years, while TCOT will reach its minimum design production rate.
Thus, minimum crude production is expected at 60 kBD.
2. Stable operation at TCOT in which the flowrate of crude oil feed and the outlet
temperature of Hot-Oil to Crude Exchanger (HX-220 AX-DX) are stable at
designated temperature of (80 ⁰C). Currently, TCOT are operating at 195 kBd
crude production (As per year 2012 average crude production).
Page 31
21
2.7 SELECTING THERMODYNAMIC MODEL
When faced with choosing a thermodynamic model, it is helpful to at least a logical
procedure for deciding which model to try first. Elliot and Lira (1999) [23] suggested a
decision tree as shown in Figure 6 as per below:
Figure 6: Thermodynamic Model Decision Tree
The property package available in HYSYS allow the user to predict properties of
mixtures ranging from well defined light hydrocarbon systems as to complex oil
mixtures and highly non-ideal (non-electrolyte) chemical systems.
HYSYS provides enhanced equations of state (Peng-Robinson, PR and PRSV) for
rigorous treatment of hydrocarbon system: semi-empirical and vapor pressure models
for the heavier hydrocarbon systems steam correlations for accurate steam property
Page 32
22
predictions: and activity coefficient models for the chemical systems. All of these
equations have their own inherent limitations and the user are given with a wide choice
of applications. Table 6 list some typical systems and recommended correlations:
Table 6: Typical System and Recommended Property Methods
For oil, gas and petrochemical applications, the Peng-Robinson EOS (PR) is generally
the recommended property package to be used. Based on the Aspen HYSYS Property
Wizard that helps the user to select the most appropriate property package for the
simulations based on components and application, its recommended to use
Peng-Robinson Fluid Packages as most of the components are hydrocarbons and
non-polar (Equation of State, EOS). In addition, PR Fluid Packages is most enhanced in
HYSYS, highest T & P range, has special treatment for key components, largest binary
interaction database: good standards for hydrocarbons.
Page 33
23
CHAPTER 3
PROJECT METHODOLOGY
3.1 GENERAL METHODOLOGY CHART
The chart below shows the general flow of this project from the beginning until the end:
For this project : Process Simulation of Crude Stabilization System, the methodology
will be divided into two parts which are Project Research and Project Simulation.
Figure 7: Project Methodology and Activities
Page 34
24
3.2 PROJECT RESEARCH
In this part of the project, research on the topic of crude stabilization system is
conducted by reading books, journals and article concerning the subject matter. Besides
research on crude stabilization system itself, a brief background research is also done
on the basis of crude oil terminal operation : in which for this study it is Terengganu
Crude Oil Terminal (TCOT). From this research, it can be known why the crude
stabilization is very important as to treat the well fluid according to the sales criteria.
Besides, current technology being used is studied and compared between other crude
oil receiving terminal.
3.3 PROJECT SIMULATIONS
Once thorough literature review and research has completed, detailed data acquisition
on the process flow diagram of Terengganu Crude Oil Terminal (TCOT) as well as the
estimates of operating conditions will be conducted. After all the required data has been
collected, evaluation of data must be done as to analyze the reliability of each data.
Then, the project simulation would be started by using ASPEN HYSYS® software. In
this part, the process flow diagram of TCOT is generated using the software and the
parameters inside the process will be adjusted as to obtain the desired/optimum results.
The figure below show the general process simulation procedure that will be
implemented in this research project:
Figure 8: The schematic diagram depicting the general approach in this project
In this project, the process simulation will be more focused on Tapis Blend crude
processing at TCOT. Thus, the inlet crude feed and stabilized crude composition were
acquired from PETRONAS Carigali Sdn Bhd (PMO/PCSB). The simulation is
intended as to find set of parameters/operating conditions that will optimize TCOT
operation and crude oil production.
Data acquisition; Inlet & Stabilized Crude Composition. Start on HYSYS simulation
Validation of simulation; Compare the simulation result with real plant data
Varying parameters of the equipment and inlet feed to find optimum condition.
Page 35
25
3.3.1 FYP1 Schedule and Gant Chart
Page 36
26
3.3.2 FYP2 Proposed Schedule and Gant Chart
Page 37
27
CHAPTER 4
RESULTS AND DISCUSSIONS
4.1 BRIEF PROCESS DESCRIPTIONS
Figure 9 (Attached in Appendix 1) shows the process flow diagram of the simulation of
the main crude stabilization unit using Aspen HYSYS (ver. 2006) software. HYSYS
model are constructed based on the Piping & Instrumentation Diagram (P&ID) of
Terengganu Crude Oil Terminal, TCOT [28]. Detailed material & energy balance are
shown in Appendix 5 — HYSYS Simulation Report (Pseudo & Crude Assays).
It can be seen in the PFD, the main equipment governing the crude stabilization process
is the staged separation using three phase separator (V-220 A/B, V-225 A/B, V-230
A/B). The inlet crude from offshore platform (TAPIS Pump) at maximum temperature
and pressure of 17 barg and 27 ͦ C are first heated via HX-210 A-R and HX-220 A-D to
achieve required temperature for the staged separation process at 80 ⁰C. The crude oil is
stabilized and dehydrated in a crude stabilization process prior to being stored in
floating roof storage tanks.
The crude stabilization facilities consist of two trains and each trains comprised of
Crude to Crude Heat Exchangers (HX210 A-R), Hot Oil to Crude Exchangers (HX220
A-D), Gas-Oil-Water Separator (V220 A/B). Stabilized Crude Oil form Crude Surge
Separators is piped through HX210 A-R to the storage tank. Stabilized crude
specifications and operating target are defined as below:
Table 7: Stabilized Crude Specifications (Storage & Export Line)
Product Specifications Operating Target Export Crude 0.5 % BS&W < 0.3 % BS&W TVP : 83 kPa
Temp. : 38 ⁰C
Page 38
28
Any malfunction of the stabilization train equipment that prevents completion of the
stabilization process will cause the stabilization train to be blocked in and the inlet flow
to the train will be diverted to Slop Oil Tank (T250) with a design capacity of
62 918 BBL (operating pressure and temperature of 13.8 kpag and 38 ⁰C).
Hydrocarbon Vapor from V230 A/B is sent directly to Discharge Separator (V272),
while the hydrocarbon vapor from V230 A/B is scrubbed by suction scrubber (V270
A-D) and compressed via Vapor Recovery Compressor, VRC (C270 A-D) before
sending to V272. The vapor from VRC is cooled by After Cooler (HX271 A-D) prior to
send to V272. The combined gas form V272 is metered and sent to LPGRU.
The condensate formed in V272 is piped to LP Condensate Recovery Separator (V274)
is sent to VRC suction Scrubber (V270 A-D) inlet while the condensate form V272 is
sent to Atmospheric Condensate Recovery Separator (V277). The flashed gas from
V277 is sent to LP flare. The condensate collected in V277 is metered and sent to
condensate storage.
The off-gas from the crude stabilization system which are mainly from the high
pressure separator (V-220 A/B) and low pressure separator (V-230 A/B) are gathered
and sent to gas stabilization header. After the off-gas has been dried and free from any
water and condensates, it will be sent as sales gas to Liquefied Petroleum Gas Recovery
Unit (LPGRU) and Dew Point Control Unit (DPCU), located in GPP1 via gas
compression system (Turbo Booster Compressor, TBC and Vapor Recovery
Compressor, VRC.
Page 39
29
4.2 PROCESS SIMULATIONS CASE STUDY
Based on the inlet crude compositions and production profile, there are two cases
considered for this study, which are:
1. Crude Stabilization HYSYS model based on pseudo components
2. Crude assay (HYSYS Oil Manager).
Basis inlet compositions used for both case studies are shown in section 2.5 (Tapis
Blend - TCOT Inlet Crude Compositions 2011). Both cases are simulated with a current
stabilized crude production of 195 kBD. Detailed description for each case study and
simulation validation are explained in further section as per below:
4.2.1 HYSYS Crude Stabilization Model (Pseudo Component)
The feed used for the simulation in this project was based on TCOT inlet Crude
Composition from Tapis Pump Offshore (Please refer section 2.5). Heavy components
from C31* to C36+* are lumped together to form new pseudo components. The new
pseudo components properties are defined as per below [28]:
Table 8: Pseudo Components Properties
Pseudo Component Molecular Weight Ideal Liquid Density, kg/m³
C31* 435.3 813.9 C33* 464.3 816.3 C34* 478.3 816.7 C35* 492.4 817.1
C36+* 599.7 930.0
These pseudo components will be used along with the pure components from Aspen
HYSYS (ver. 2006). Detailed inlet composition and feed properties used for this
simulation are tabulated as per Table 9 & 10 below:
Page 40
30
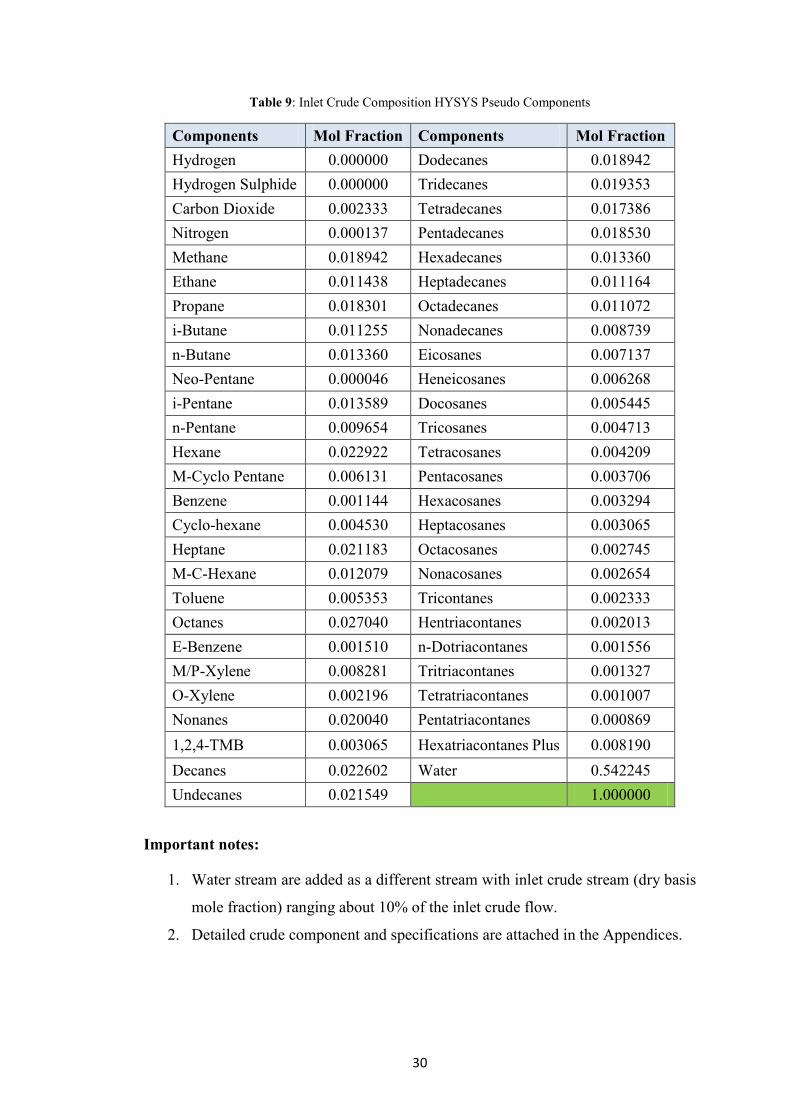
Table 9: Inlet Crude Composition HYSYS Pseudo Components
Components Mol Fraction Components Mol Fraction Hydrogen 0.000000 Dodecanes 0.018942 Hydrogen Sulphide 0.000000 Tridecanes 0.019353 Carbon Dioxide 0.002333 Tetradecanes 0.017386 Nitrogen 0.000137 Pentadecanes 0.018530 Methane 0.018942 Hexadecanes 0.013360 Ethane 0.011438 Heptadecanes 0.011164 Propane 0.018301 Octadecanes 0.011072 i-Butane 0.011255 Nonadecanes 0.008739 n-Butane 0.013360 Eicosanes 0.007137 Neo-Pentane 0.000046 Heneicosanes 0.006268 i-Pentane 0.013589 Docosanes 0.005445 n-Pentane 0.009654 Tricosanes 0.004713 Hexane 0.022922 Tetracosanes 0.004209 M-Cyclo Pentane 0.006131 Pentacosanes 0.003706 Benzene 0.001144 Hexacosanes 0.003294 Cyclo-hexane 0.004530 Heptacosanes 0.003065 Heptane 0.021183 Octacosanes 0.002745 M-C-Hexane 0.012079 Nonacosanes 0.002654 Toluene 0.005353 Tricontanes 0.002333 Octanes 0.027040 Hentriacontanes 0.002013 E-Benzene 0.001510 n-Dotriacontanes 0.001556 M/P-Xylene 0.008281 Tritriacontanes 0.001327 O-Xylene 0.002196 Tetratriacontanes 0.001007 Nonanes 0.020040 Pentatriacontanes 0.000869 1,2,4-TMB 0.003065 Hexatriacontanes Plus 0.008190 Decanes 0.022602 Water 0.542245 Undecanes 0.021549
1.000000
Important notes:
1. Water stream are added as a different stream with inlet crude stream (dry basis
mole fraction) ranging about 10% of the inlet crude flow.
2. Detailed crude component and specifications are attached in the Appendices.
Page 41
31
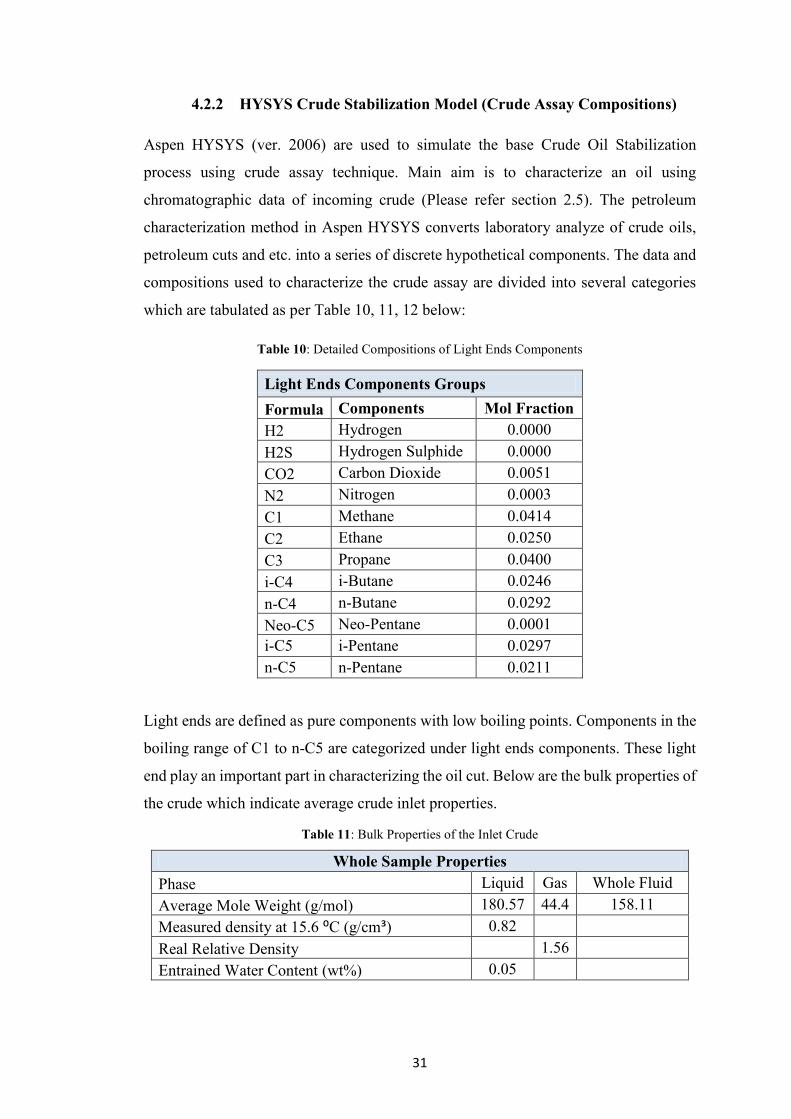
4.2.2 HYSYS Crude Stabilization Model (Crude Assay Compositions)
Aspen HYSYS (ver. 2006) are used to simulate the base Crude Oil Stabilization
process using crude assay technique. Main aim is to characterize an oil using
chromatographic data of incoming crude (Please refer section 2.5). The petroleum
characterization method in Aspen HYSYS converts laboratory analyze of crude oils,
petroleum cuts and etc. into a series of discrete hypothetical components. The data and
compositions used to characterize the crude assay are divided into several categories
which are tabulated as per Table 10, 11, 12 below:
Table 10: Detailed Compositions of Light Ends Components
Light Ends Components Groups Formula Components Mol Fraction H2 Hydrogen 0.0000 H2S Hydrogen Sulphide 0.0000 CO2 Carbon Dioxide 0.0051 N2 Nitrogen 0.0003 C1 Methane 0.0414 C2 Ethane 0.0250 C3 Propane 0.0400 i-C4 i-Butane 0.0246 n-C4 n-Butane 0.0292 Neo-C5 Neo-Pentane 0.0001 i-C5 i-Pentane 0.0297 n-C5 n-Pentane 0.0211
Light ends are defined as pure components with low boiling points. Components in the
boiling range of C1 to n-C5 are categorized under light ends components. These light
end play an important part in characterizing the oil cut. Below are the bulk properties of
the crude which indicate average crude inlet properties.
Table 11: Bulk Properties of the Inlet Crude
Whole Sample Properties Phase Liquid Gas Whole Fluid Average Mole Weight (g/mol) 180.57 44.4 158.11 Measured density at 15.6 ⁰C (g/cm³) 0.82 Real Relative Density 1.56 Entrained Water Content (wt%) 0.05
Page 42
32
Table 12: Detailed Composition of Incoming Crude to Characterize the Crude
Important notes:
1. These composition will be specified under categories in Aspen HYSYS.
2. The crude assay cuts obtained by HYSYS are characterize by its boiling point.
3. The mole fractions are done on dry basis.
Formula Components Mol Fraction Formula Components Mol FractionC6 Hexane 0.0501 Benzene 0.0025C7 Heptane 0.0463 Toluene 0.0117C8 Octanes 0.0591 E-Benzene 0.0033C9 Nonanes 0.0438 M/P-Xylene 0.0181C10 Decanes 0.0494 O-Xylene 0.0048C11 Undecanes 0.0471 1,2,4-TMB 0.0067C12 Dodecanes 0.0414C13 Tridecanes 0.0423 Formula Components Mol FractionC14 Tetradecanes 0.0380 M-Cyclo Pentane 0.0134C15 Pentadecanes 0.0405 Cyclo-hexane 0.0099C16 Hexadecanes 0.0292 M-C-Hexane 0.0264C17 Heptadecanes 0.0244C18 Octadecanes 0.0242C19 Nonadecanes 0.0191C20 Eicosanes 0.0156C21 Heneicosanes 0.0137C22 Docosanes 0.0119C23 Tricosanes 0.0103C24 Tetracosanes 0.0092C25 Pentacosanes 0.0081C26 Hexacosanes 0.0072C27 Heptacosanes 0.0067C28 Octacosanes 0.0060C29 Nonacosanes 0.0058C30 Tricontanes 0.0051C31 Hentriacontanes 0.0044C32 Dotriacontanes 0.0034C33 Tritriacontanes 0.0029C34 Tetratriacontanes 0.0022C35 Pentatriacontanes 0.0019C36+ Hexatriacontanes Plus 0.0179
Naphtenic Components Groups
Paraffinic Component Groups Aromatic Components Groups
Page 43
33
Based on the specified inlet compositions and properties, Aspen HYSYS (ver. 2006)
will generate a hypothetical components according to the oil cut specified by users.
Detailed composition of the crude cuts obtained from HYSYS are tabulated as per
Table 13 below:
Table 13: Detailed Compositions of HYSYS Simulation (Crude Assay)
Components Mol Fraction Components Mol Fraction
Hydrogen 0.000000 NBP[0]173* 0.029842
Hydrogen Sulphide 0.000000 NBP[0]188* 0.014135
Carbon Dioxide 0.002450 NBP[0]203* 0.015755
Nitrogen 0.000145 NBP[0]217* 0.015594
Methane 0.020018 NBP[0]232* 0.015599
Ethane 0.012088 NBP[0]246* 0.016323
Propane 0.019341 NBP[0]260* 0.016082
i-Butane 0.011895 NBP[0]275* 0.013129
n-Butane 0.014119 NBP[0]289* 0.011920
Neo-Pentane 0.000048 NBP[0]304* 0.012228
i-Pentane 0.014361 NBP[0]318* 0.011605
n-Pentane 0.010202 NBP[0]332* 0.008665
NBP[0]43* 0.011555 NBP[0]347* 0.007694
NBP[0]57* 0.010617 NBP[0]362* 0.007327
NBP[0]70* 0.012442 NBP[0]376* 0.006767
NBP[0]85* 0.021158 NBP[0]390* 0.005854
NBP[0]100* 0.025856 NBP[0]405* 0.005138
NBP[0]117* 0.023148 NBP[0]420* 0.004750
NBP[0]129* 0.015839 NBP[0]438* 0.007011
NBP[0]146* 0.020609 H20 0.516477
NBP[0]158* 0.012217 TOTAL 1.000000
Important notes:
1. Water are added as different stream along with the dry inlet feed to the crude
stabilization section with liquid volume flow of 10% of dry inlet crude flowrate.
Page 44
34
Table 14: Feed Stream Properties
Properties Vapor/Phase Fraction 0.0000 Temperature, ⁰ C 27 Pressure, kPa Abs 1801 Molar Flow, kgmole/h 13229.58 Mass Flow, kg/h 1104875.71 Std Liquid Volume Flow, barrel/day 195500 Molecular Weight 83.52 Average Mass Density, kg/m3 778.90
Figure 10: Phase Envelope Curve for Inlet Feed
The phase envelope diagram in Figure 10 shows the bubble points and dew points of the
inlet crude at different pressures. The phase envelope was calculated by Aspen HYSYS
on dry basis. According to Francis S. Manning & Richard E. Hompson (1995) [29],
between the bubble point and dew point curves, the hydrocarbon is in two phase which
is vapor–liquid. An obvious conclusion of this behavior is that a hydrocarbon mixture
has a boiling range at constant pressure rather than a boiling point. The incoming feed
from Tapis Pump (offshore platform) to Terengganu Crude Oil Terminal, TCOT is at
27 ⁰C and 17 barg (1801 kPa Abs.) As can be seen based on the phase envelope above,
the incoming feed will be in pure liquid state. The incoming live crude from offshore
platform usually comprises of produced water and also contaminant or typically
referred as Basis Sediments & Water (BS&W).
Page 45
35
4.3 PROCESS SIMULATION VALIDATIONS
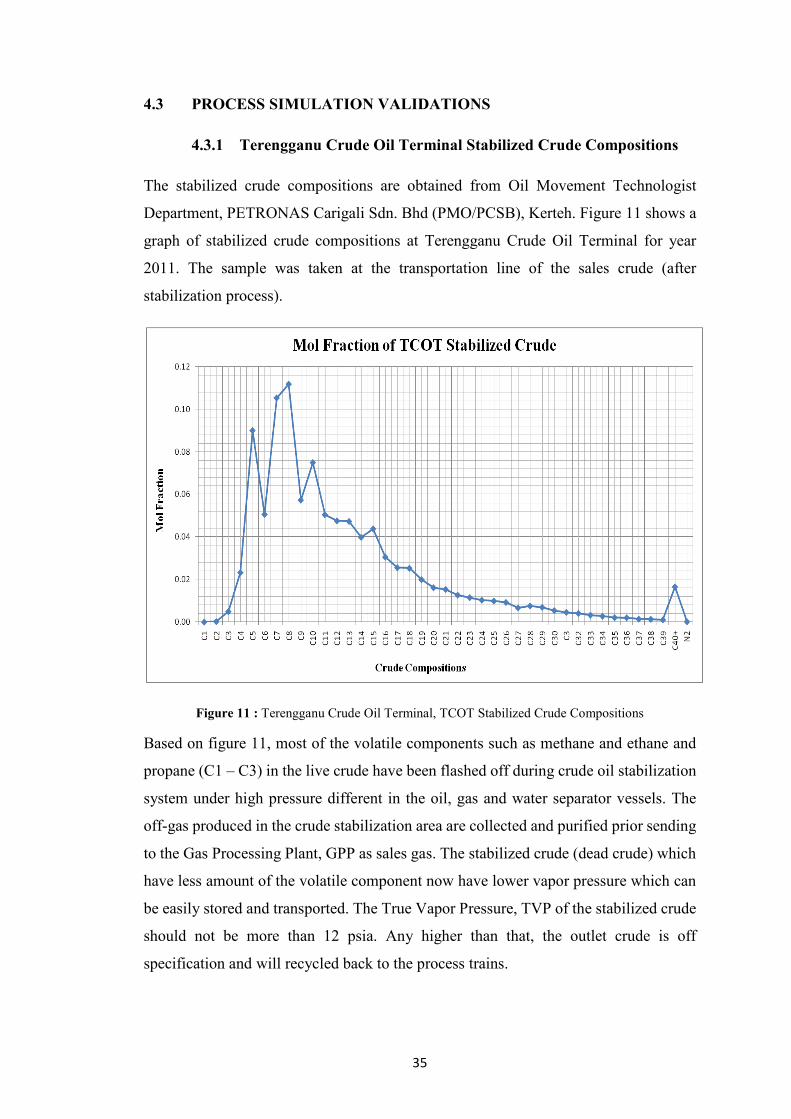
4.3.1 Terengganu Crude Oil Terminal Stabilized Crude Compositions
The stabilized crude compositions are obtained from Oil Movement Technologist
Department, PETRONAS Carigali Sdn. Bhd (PMO/PCSB), Kerteh. Figure 11 shows a
graph of stabilized crude compositions at Terengganu Crude Oil Terminal for year
2011. The sample was taken at the transportation line of the sales crude (after
stabilization process).
Figure 11 : Terengganu Crude Oil Terminal, TCOT Stabilized Crude Compositions
Based on figure 11, most of the volatile components such as methane and ethane and
propane (C1 – C3) in the live crude have been flashed off during crude oil stabilization
system under high pressure different in the oil, gas and water separator vessels. The
off-gas produced in the crude stabilization area are collected and purified prior sending
to the Gas Processing Plant, GPP as sales gas. The stabilized crude (dead crude) which
have less amount of the volatile component now have lower vapor pressure which can
be easily stored and transported. The True Vapor Pressure, TVP of the stabilized crude
should not be more than 12 psia. Any higher than that, the outlet crude is off
specification and will recycled back to the process trains.
Page 46
36
In addition, crude oil constituents must be reduced to an acceptable level determined by
the purchaser. Fortunately, Malaysisa’s crude oil are mostly sweet crude which
comprises low sulphur content and high API gravity. Generally, the higher the API
Gravity (the lighter it is), the more valuable the crude. It is of high quality and well
sought after in the market. Table 15 below shows the preliminary analysis on the
stabilized crude properties.
Table 15 : Preliminary Analysis on Stabilized Crude at TCOT [30]
TEST METHOD UNIT RESULT Density@ 15 °C
ASTM D 5002 g/cm³ 0.8058 API Gravity @ 60°F calculated degree 44.1 Specific Gravity calculated - 0.8062 Total Sulphur ASTM D 4294 wt% 0.0345 Nitrogen Content ASTM D 664 ppm wt 216 Flash Point IP 170 °C <0 Pour Point ASTM D 5853 °C 18 Reid Vapor Pressure @37.8°C ASTM D 323 kPa 54.5
Salt Content ASTM D 3230 lb/1000bbls 8.7 Kinematic Viscosity @40 °C ASTM D 445 cSt 2.458 Gross Calorific Value ASTM D 240 MJ/kg 45.755 Mercury UOP 938 ppb wt 38 Basic Sediment & Water ASTM D 4007 vol % 0.25 Water Content ASTM D 4006 vol % 0
Based on Table 14, Tapis blend crude has high API gravity of 44.1 and considered as
quality crude. On the other hand, the Reid Vapor Pressure of the stabilized crude is less
than 12 psia (83 kPa) which meet the required specification for storage and
transportation. The stabilized crude will be usually transported through pipeline or
shipment. Furthermore, usually the live crude coming from the offshore platform is
contaminated with sediment which includes sulphur (merchaptants, hydrogen sulphide
etc.) and must be reduced within acceptable limit.
Crude oil stabilization system is designed to sweeten the live crude by flashing off the
volatile component and reduce the amount of contaminants/sediments inside it. The
live crude also will be dehydrate to remove any free water which might result in
corrosion and give bad impact to the processing facilities downstream.
Page 47
37
4.3.2 HYSYS Simulation (Pseudo Components) Validation
In order to ensure that the simulation done in this project is valid, the compositions of
the final product obtained by HYSYS Simulations are compared to Terengganu Crude
Oil Terminal (TCOT) stabilized crude compositions. Figure 12 below shows a graph of
component's mole fraction (dry basis) vs. crude components. The two different trends
represent two dif ferent stabilized crude composition which are the TCOT plant data
and also stabilized crude compositions obtained from the Aspen HYSYS (ver. 2006) —
Pseudo components analysis. The complete data used for the simulation validation in
table form can be referred in Appendix IV.
Figure 12: Comparison of Product Compositions
The mol fraction comparison are done on dry basis which ignore the composition of
water in the crude. Detailed water content analysis for each simulation will be
explained further in Section 4.4 — Result Analysis. Based on the data in Figure 11, it
can be seen that the HYSYS Simulation results in high mol fraction of light component
compared to the plant data. There are two components which shows high deviations in
the comparison:
1. Hexane, C6
2. Decane, C10
Page 48
38
Based on the crude compositional analysis, these components were unable to be
quantified due to co-eluting with other components. Thus, the amounts were group
together as lumped component. Total components of the lumped components are
tabulated as per table 16 below:
Table 16: Detailed Compositions of Lumped Components of TCOT Plant Data
C5*
n-C5 Cyclopentane 2-Methylpentane 3-Methylpentane
C6*
n-C6 Methylcyclopentane 2,4-dimethylpentane Benzene Cyclohexane
C7* n-C7 Methylcyclohexane Toluene
C8*
n-C8 Ethylbenzene Meta & Para-Xylene Ortho-Xylene
C10* n-C10 n-Butylbenzene*
Based on the preliminary analysis, TCOT stabilized crude contains more intermediate
components compared to the HYSYS. On the other hand, the composition of paraffinic
component and heavy crude components from C11 to C36+* are almost the same for
both plant data and the simulation. In addition, there are only trace amounts of Carbon
Dioxide, CO2 and Nitrogen, N2
. Due to absence of pure heavy component in HYSYS,
pseudo components of C36+* were created (hypothetical components) which
comprises of the following components:
Page 49
39
Table 17: Detailed Components of Pseudo C36+*
C36+*
C36 C37 C38 C39
C40+
From the above analysis, it can be concluded that the HYSYS data contains the lightest
components followed by the real plant data. Besides, TCOT plant data results in the
crude the most intermediate components from C7* to C10*. In general, both stabilized
crude compositions either from TCOT plant data and HYSYS simulation, produced
crude with balanced heavy component from C11 to C36+*.
However, in overall, the trend of the mole fraction of the components is similar for all
two sets of data. There are no major differences and thus, it is proven that the simulation
done using the HYSYS software is valid and can be the basis of predicting tools for
operational purpose.
4.3.3 HYSYS Simulation (Crude Assay) Validation
As per explained before, generally there are two methods to simulate the crude oil
stabilization system using HYSYS simulation which is by:
1. Pseudo Components: Due to lack of pure component which is mostly
represents heavy crude in HYSYS simulation; hypothetical components are
created based on the crude characterization properties done by laboratories.
2. Crude Assay: Based on the crude sampling, the light component (C1 — C6)
can be used to characterize the heavy component in the simulations. The heavy
component are characterize based on the boiling points.
In order to ensure that the crude assays HYSYS simulations are valid and can be used to
study the effects of operating parameters towards the stabilized crude specifications
and quality, the data generated from the HYSYS are compared with the plant data.
Page 50
40
Figure 13 shows a graph of component mole fraction (dry basis) vs. crude components.
The two different trends represent two different data which are the plant data from
Terengganu Crude Oil Terminal, and also data generated from HYSYS (Crude Assay).
The complete data in table form can be referred to in Appendix IV.
Figure 13: Comparison of Product Composition
For the purpose of simulation validation among all data trends, the validation is more
focusing on two parts of the graph in which are the light components and also heavy
hydrocarbons (C6+ and heavier) of the stabilized crude. In the first part of the graph
(light components) from Methane to Pentane, it can be seen that two sets of data show
the exact trends of component compositions. There is no clear fluctuation from the
graph. As for the second part of the graph (heavy components ; C6 and heavier), it is
clear that the data from HYSYS (Pseudo components & Crude assay), both are giving
the same heavy hydrocarbon composition as per TCOT Plant data. The heavy crude is
estimated to have a mole fraction in a range of 0.88 — 0.90 from total composition.
This is good as less volatile component are presents in the final products thus results in
lower True Vapor Pressure which in turn is easier to store or export. The storage/export
specification is set at 12 psia @ 38 ⁰C. Any crude with pressure and temperature higher
than specification was consider off-spec crude and should be removed from the vessel
back to the crude stabilization trains.
Page 51
41
On the other hand, for the non-condensable mixtures (Nitrogen and Carbon dioxide),
the composition is nearly zero in which there is only a small trace of gas contaminants
in the stabilized crude. From the above analysis, it can be concluded that all three data
from HYSYS (ver. 2006) and TCOT plant data give out almost the same trends for all
components. Thus, in general, the trends of the mole fraction of the components are
similar for all sets of data. There are no major differences and it is proven that the
simulation done using the HYSYS software is valid and can be used to simulate the real
life plant process.
4.3.4 Total Validation (HYSYS Composition Data vs. Plant Data)
Total validation was done between HYSYS simulation (Pseudo & Crude Assay) vs
Plant Data (stabilized crude composition) as per figure 14 below. The validation was
carried out in order to identify any major differences between both simulations and
compare it with the plant data. The composition of the crude are arranged according to
the carbon number and heavy crude are lumped into one major component (hexane and
heavier) which comprises crude from C6 up to C36+.
In general, the graph in figure 14 shows no major differences between each other, the
mol fraction for each of the crude are exactly the same for both simulation which
indicate both simulation method are reliable in predicting the crude oil behavior in
crude stabilization plant. In addition, there is no major distinction between HYSYS
Simulation software and the plant data as most of the composition data from HYSYS
follows Plant Data accordingly.
For the first part of the graph (light hydrocarbon, C1 — C4), the composition of the
HYSYS Simulation follows the trend of the Plant Data accordingly. On the other hand,
heavy hydrocarbon which are lumped into one single component shows the highest mol
composition about 0.88 mol thus make up most of the bulk crude compositions.
This shows that most of the volatile components have been flashed off during the crude
oil stabilization by staged separation which consists of three Oil, Gas and Water
separator vessel. High pressure differences between the live crude and the separator are
the main driving force for the flashing off of the off-gas. The low pressure inside the
separator cannot hold the crude in its liquid form thus, some of the volatile component
turned into gas phase and separated from the heavy crude.
Page 52
42
Figure 14 : Total validation of HYSYS Software (Version 7.3) vs. Plant Data
All in all, stabilized crude data generated by HYSYS simulation software are
comparable to the plant data and valid. Stabilized crude composition contains about
90% of heavy hydrocarbon and less amount of light hydrocarbon which is a good
factors for crude storage. Volatile composition such as methane and ethane was flashed
off during stabilization process leaving only heavy hydrocarbon with lower vapor
pressure. Normally, stabilized crude has true vapor pressure (TVP) of 12 psia @ 37.8
⁰C and stored in floating roof tank in atmospheric conditions.
Page 53
43
4.4 PRELIMINARY RESULT ANALYSIS
4.4.1 HYSYS Simulations (Pseudo Components)
The inlet composition of the HYSYS simulation is compared with the final products
(Stabilized crude) data generated. Figure 15 shows the trend of inlet and outlet data for
HYSYS simulation (Pseudo Components) with free water content:
Figure 15: Inlet and Outlet Comparisons for HYSYS Simulation (Pseudo Components)
Based on the preliminary data analysis, it can be seen that from the graph that the water
content in incoming flow is high at 0.35 of mole fraction. HYSYS simulations are able
to remove almost 99% of the water content in the crude stabilization system thus
reducing the water content in the stabilized crude less than 0.02. The inlet water
volumetric flowrate to crude stabilization system is taken initially at 10% of the total
dry crude inlet feed which accounts for 9.1% BS&W.
In addition, from Figure 15, it is observed that the stabilized crude from HYSYS
contains more intermediate component compared to the inlet flow. This is mainly due
to the high pressure of the three phase separator which traps the intermediate
components in liquid phase while removing the volatile components as off-gas.
Page 54
44
Further analysis also conducted as to analyze the distribution of the component in dry
basis without considering water composition. Figure 16 shows the distribution of
component in inlet and outlet crude of HYSYS simulations.
Figure 16: Inlet vs. Outlet Composition of HYSYS Simulations (Pseudo Components) Dry Basis
Based on the preliminary analysis of the distribution of components (in dry basis), it is
observed that the inlet crude (live crude) contain high amount volatile components (C1
— C4) compared to the stabilized crude. This is mainly due to most of the volatile
components are being flashed off during the crude stabilization process which result in
high quality crude with standard specification of 12 psia for easy transportation and
storage. The flashed off-gas from crude stabilization system will then be sent to the gas
compression for further treatment and condensate recovery. The stabilized crude with
TVP 12 psia, at 40 ⁰C will then be transferred to floating roof crude storage tank at
atmospheric condition (500, 040 barrel capacity)
In addition, the stabilized crude generated from HYSYS also shows high composition
of intermediate - heavy hydrocarbons in the stabilized which results in high quality
crude with high API Gravity. Based on the data obtained from TCOT, the stabilized
crude is estimated to have a API gravity of 44.1 ⁰. Thus, it can be concluded that the
HYSYS simulation achieved its purpose to simulate a crude stabilization system.
Page 55
45
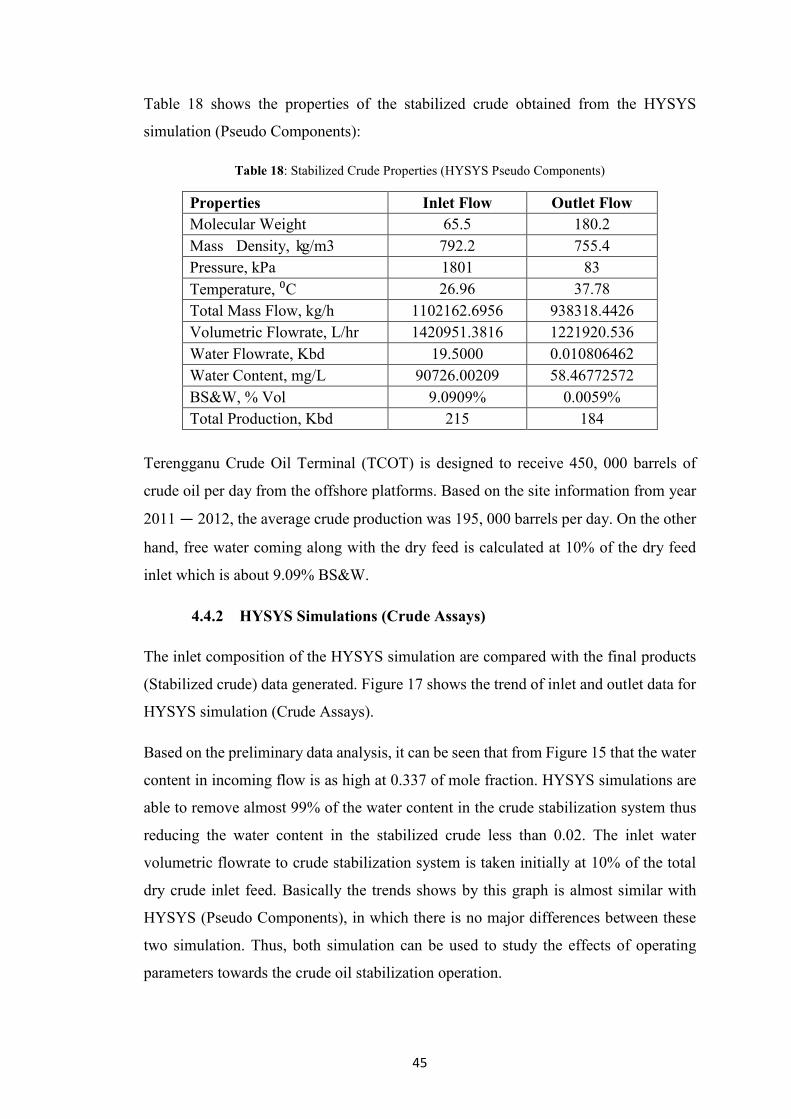
Table 18 shows the properties of the stabilized crude obtained from the HYSYS
simulation (Pseudo Components):
Table 18: Stabilized Crude Properties (HYSYS Pseudo Components)
Properties Inlet Flow Outlet Flow Molecular Weight 65.5 180.2 Mass Density, kg/m3 792.2 755.4 Pressure, kPa 1801 83 Temperature, ⁰C 26.96 37.78 Total Mass Flow, kg/h 1102162.6956 938318.4426 Volumetric Flowrate, L/hr 1420951.3816 1221920.536 Water Flowrate, Kbd 19.5000 0.010806462 Water Content, mg/L 90726.00209 58.46772572 BS&W, % Vol 9.0909% 0.0059% Total Production, Kbd 215 184
Terengganu Crude Oil Terminal (TCOT) is designed to receive 450, 000 barrels of
crude oil per day from the offshore platforms. Based on the site information from year
2011 — 2012, the average crude production was 195, 000 barrels per day. On the other
hand, free water coming along with the dry feed is calculated at 10% of the dry feed
inlet which is about 9.09% BS&W.
4.4.2 HYSYS Simulations (Crude Assays)
The inlet composition of the HYSYS simulation are compared with the final products
(Stabilized crude) data generated. Figure 17 shows the trend of inlet and outlet data for
HYSYS simulation (Crude Assays).
Based on the preliminary data analysis, it can be seen that from Figure 15 that the water
content in incoming flow is as high at 0.337 of mole fraction. HYSYS simulations are
able to remove almost 99% of the water content in the crude stabilization system thus
reducing the water content in the stabilized crude less than 0.02. The inlet water
volumetric flowrate to crude stabilization system is taken initially at 10% of the total
dry crude inlet feed. Basically the trends shows by this graph is almost similar with
HYSYS (Pseudo Components), in which there is no major differences between these
two simulation. Thus, both simulation can be used to study the effects of operating
parameters towards the crude oil stabilization operation.
Page 56
46
Figure 17: HYSYS Crude Assays Compositions (Inlet vs. Outlet)
In addition, from Figure 17, it is observed that the stabilized crude from HYSYS
contains more intermediate component compared to the inlet flow. This is mainly due
to the high pressure of the three phase separator which traps the intermediate
components in liquid phase.
Further analysis also conducted as to analyze the distribution of the component on dry
basis without considering water composition. Figure 18 below shows the distribution of
component in inlet and outlet crude of HYSYS simulations.
Based on the preliminary analysis of the distribution of components (in dry basis), it is
observed that the inlet crude (live crude) contain high volatile components compared to
the stabilized crude. This is mainly due to most of the volatile components are being
flashed off during the crude stabilization process which result in high quality crude with
standard specification of 12 psia for easy transportation and storage.
The flashed light component in gas phase (during crude stabilization process) will then
be sent to gas compression system for further treatment and condensate recovery. The
light component (gas phase) is a valuable product either as a sales gas, fuel gas and also
can be turned to liquefied petroleum gas products
Page 57
47
Figure 18: HYSYS Crude Assays (Inlet vs. Outlet) in Dry Basis Comparison
In addition, the stabilized crude generated from HYSYS also shows high composition
of heavy hydrocarbons in the stabilized which results in high quality crude with high
API Gravity. Based on the data obtained from TCOT, the stabilized crude is estimated
to have a API gravity of 42 ⁰. Thus, it can be concluded that the HYSYS simulation
achieved its purpose to simulate a crude stabilization system.
Table 19 shows the properties of the stabilized crude obtained from the HYSYS
simulation (Crude Assays):
Table 19: Stabilized Crude Properties (HYSYS Crude Assays)
Properties Inlet Flow Outlet Flow Molecular Weight 67.77 176.9 Mass Density, kg/m3 839 808.9 Pressure, kPa 1801 83 Temperature, ⁰C 26.95 37.78 Total Mass Flow, kg/h 1188171.9003 1019206.5154 Volumetric Flowrate, L/hr 1420951.3816 1213179.811 Water Flowrate, Kbd 19.50 0.01 Water Content, mg/L 90726.00209 66.0077852 BS&W, % Vol 9.0909% 0.0066% Total Production, Kbd 215 183
Page 58
48
4.4.3 HYSYS Methods Comparisons (Pseudo Comp. vs. Crude Assays)
Generally, there are two different methods to simulate crude oil stabilization system
using HYSYS simulations which are by;
1. Pseudo Component
Hypothetical components which represents heavy component of crude oil in the
process simulations are created based on the laboratories characterization and
crude sampling.
2. Crude Assay
The petroleum characterization method in Aspen HYSYS converts laboratory
analysis of crude oils, petroleum cuts and etc. into a series of discrete
hypothetical components based on their boiling point.
However, there are several differences between both simulations which lead to
variation of the results. Described below are the major differences of the two methods;
• Molecular Weight
HYSYS Pseudo components have lower molecular weight (g/mol) compared to
HYSYS Crude assays. The characterization of specific hypothetical
components of pseudo components are set by the users based on laboratory
analysis while the crude assays characterization are only based on light
components properties.
• Mass Density
HYSYS Crude assays have higher mass density (kg/m3
) compared to HYSYS
Pseudo components. The mass density of each components (Crude Assays) are
determined based on the fluid package of the simulations (Peng –Robinson)
while mass density of the pseudo component are set by the users.
All in all, HYSYS Pseudo components are more of simulation based on laboratory
results (experimental based simulation). On the other hand, HYSYS Crude assay
determined the properties of heavy components based on normal boiling points of each
component.
Page 59
49
4.5 EFFECTS OF DIFFERENT OPERATING CONDITIONS
In real life plant, the process is not at a steady state since there are always fluctuations in
the process parameter ; operating conditions which usually depends on the operation
mode. This may be due to many reasons such as changing surrounding conditions,
upset in other related process unit upstream and breakdown of related equipments. As a
result of these parameter changes, the specifications of the product may also change.
Therefore, it is important to know how much of these changes that the process can
tolerate and at which point the parameter change will cause the product to become
off-specification. In order to obtain those data, a one dimensional study is done on the
simulated crude oil stabilization plant by manipulating several parameter listed below:
1. Inlet Feed Parameters
a. Dry feed volumetric flowrate
b. Free water flowrate
c. Inlet Temperature
d. Inlet pressure
2. Three Phase Separator Parameters
a. V-220 operating pressure
b. IV-225 operating pressure
c. V-230 operating pressure
3. Pre-Heater Train Performance
a. Fuel gas inlet flowrate
b. Furnace efficiencies
c. Furnace duty
Manipulated variable as per above will be varied to study the effects of that particular
variable on stabilized crude specifications. The product specifications that are being
monitored in this study are listed as per below.
1. True Vapor Pressure, TVP : 12 psia
2. Basic Sediment & Water, BS&W content <0.5%
Page 60
50
In order to study the effects of the manipulated parameters, all other values except the
parameter being studied need to be kept constant. Table 20 shows what parameter is
kept constant for each study where C represents constant and V represents variable. The
findings from the observations will be discussed further in the following section. The
complete data obtained in the study can be referred in Appendix VI : Effects of
Different Operating Conditions.
Table 20 : Status of Operating Conditions for the Study of Effects of Changing Operating Conditions
Page 61
51
4.5.1 True Vapor Pressure, TVP
The main product specifications that is considered for a crude stabilization plant is the
True Vapor Pressure, TVP of the stabilized crude. Therefore, the TVP of the product is
the most important specification that needs to be monitored closely during the operation
of the crude stabilization plant. The lower the TVP of the product, the higher the quality
is. The standard method for measuring TVP is ASTM 2879. As stated earlier, in this
project, the effect of parameter changes on the TVP has been studied by changing all
manipulated parameters, i.e . inlet feed properties, three phase separator & hot oil
system. Any significant impacts of the variables on the operation will be observed.
4.6 EFEECTS OF INCOMING CRUDE OIL VARIABLES
In the first part of these simulations, the inlet crude properties are varied to study the
effects of the inlet parameters towards crude oil stabilization operations. Normal
incoming crude inlet to the terminal is at 195 Kbd at 27 °C, 17 Bar with BS & W of
9 vol%. Four major inlet properties which are flow rate, temperature, pressure and free
water content is set as manipulated variable with True Vapor Pressure, TVP of the
stabilized crude is the controlled variables.
4.6.1 Effect of Feed Flow Rate
Figure 19 : Effect of Dry Feed Flow Rate towards Product TVP
Page 62
52
The normal current feed flow rate used for the base case study is 195 kBD. The flow
rate is then decreased to 50% and then increased to 230% in 10% intervals. Figure 19
shows how the change in feed flow rate affects the affects the TVP of the stabilized
crude.
From the graphs, it can be seen for both HYSYS simulation methods, as the flow rate
increases, the TVP also increases. This increase in TVP is because when the flow rate
increases, more heat is required to flash off the light component in the dead crude. In
order to simulate the effects of the feed flow rate, all other variables and unit operation
such as heat exchangers duty (HX-210 & HX-220) are kept constant. This results in
insufficient heat to flash off the entire volatile component with traces amount of the C1
— C4 still there in the stabilized crude thus increasing total mixture TVP.
Therefore, the TVP would gradually increases with the increase of feed flow rate. For
an acceptable range of TVP from 10 psia — 12 psia, the maximum flow rate percentage
that can be processed by the crude stabilization plant is at 139 —188 kBD respectively.
4.6.2 Effect of Feed Temperature
Figure 20 : Effect of Feed Temperature towards Product TVP
The inlet feed to the crude stabilization plant is normally at 27 ⁰C from the offshore
platforms. In order to study the effects of feed temperature towards product TVP, the
Page 63
53
temperature is decreased to 2 ⁰C and then increased to 40 ⁰C at 4 ⁰C intervals. Figure 20
shows how the change in feed temperature affects the TVP of the stabilized crude.
As can be seen in the graphs, as the temperature of the feed is increased, the product
TVP gradually decreased. The increase in the feed temperature would cause more
portions of the light component to flash off easily from the crude and thus reduce the
TVP of the product.
The minimum temperature that the crude stabilization plant can tolerate n order to
achieve the specified TVP (10 — 12 psia) is in a range of 26 ⁰C to 38 ⁰C. Any
temperature lower than 26 ⁰C would cause the stabilized crude become
off-specifications as it is will require a larger duty for the heat exchanger to heat the
crude before entering the pressure vessels.
4.6.3 Effects of Feed Pressure
Figure 21 : Effects of Feed Pressure towards Product TVP
At normal operating conditions, the pressure of the feed to the crude stabilization plant
is 18 bar. At first, to study the effects of the feed pressure towards the product TVP, the
feed pressure is reduced to 6 bar and then increased to 50 bar at 4 bar intervals. Figure
21 shows how the change in feed pressure affects the TVP of the stabilized crude.
Page 64
54
Form the graph, for both simulations; it is observed that the highest TVP recorded
(12.1 psia) is at 10 bar feed pressure. As the pressure of feed increased, the TVP of the
stabilized crude gradually decreasing. This shows that the impact of the feed pressure
towards the crude stabilization unit is insignificant. The product TVP decrease as the
feed pressure increase is due to the high pressure drop into the pressure vessels which
lead to high amount of volatile component being flashed off to the stabilization gas
header. Thus, the stabilized crude contained only traces of light component which
posses lower TVP and can be stored in a atmospheric condition safely.
To summarize, even though the change in the feed pressure will affect the product TVP,
the TVP will not go off-specification since the highest TVP recorded is only at 12.45
psia. This shows that the impact of incoming crude feed is insignificant towards the
crude oil stabilization operations.
4.6.4 Effect of Water Flow Rate
Figure 22 : Effects of Water Flow Rate towards Product TVP
Based on the Terengganu Crude Oil Terminal, TCOT Design Basis Memorandum, the
existing facility is capable of processing 21, 600 barrels per day of free water content in
the inlet crude in which equivalent to 4.8 vol% for 450, 000 barrels of crude oil
production per day.
Page 65
55
However, based on site information from year 2011 - 2012, average crude oil
production is around 195 kBD. Thus the free water content is assumed 10% of the dry
feed which is about 19.5 kBD (9.09 vol% BS&W). In order to study the effects of water
inlet flowrate towards the crude stabilization operation, water flow rate is decreased to
2 kBD and increased to a maximum of 29 kBD. Figure 22 shows the effects of the water
inlet flow rate towards the product TVP.
Based on the graph for both HYSYS simulation methods, as the water content inside
the crude oil increase, the resultant stabilized crude will also have higher TVP. The
increase of water content will increase total mixture density and mass flow which
require a high duty of heaters/ heat exchangers to heat the process fluid to a suitable
temperature before entering the pressure vessel. In case of optimum operating
temperature cannot be achieved, it will affect the separation inside the pressure vessel
thus results in less volatile component being flashed off to the stabilization gas header.
The maximum water content that the crude stabilization operation can tolerate in order
to achieve the specified TVP is 20 kBD for a dry feed flow rate of 195 kBD which is
estimated around 10 vo1% BS&W. Any value higher than recommended will results in
off-specification crude (TVP high than 12 psia)
4.7 EFFECTS OF OIL, GAS & WATER SEPARATORS VARIABLE
Basically, the purpose of the simulation is to study the effect of changing the operating
condition of pressure vessel towards the crude oil stabilization operation. There are in
total of three pressure vessel at Terengganu Crude Oil Terminal,TCOT which are the
High Pressure Separator (V-220 A/B), Electrostatic Precipitator (V-225 A/B), Low
Pressure Separator (V-230 A/B).
4.7.1 Effects of High Pressure Separator Operating Pressure
High Pressure Separator (V-220 A/B) is the first three phase separator in the crude oil
stabilization system which normally operating at 466 kPa at 75 – 85 °C. The light
components flashed off from the high pressure separator are sent to the gas stabilization
header prior for condensation and purification process.
Page 66
56
Figure 23 : Effects of High Pressure Separator,V-220 A/B Operating Pressure
Based on site visit to Terengganu Crude Oil Terminal on 14th
The graph in Figure 23 shows that as the operating pressure of V-220 A/B is increased,
the stabilized crude product TVP also increased. The increase in TVP of the products is
because the increment in V-220 A/B operating pressure means lowers differential
pressure between the incoming crude inlet and the pressure vessel. This results in fewer
amounts of volatile components being flashed off as gas phase at the high pressure
separator. Thus, there are still traces amount of volatile component in the rundown
crude to storage which contributed to increase of product TVP.
May 2012, V-220 A/B is
operating at 466 kPa. For the purpose of these simulations, the operating pressure of
V-220 A/B is decreased from 330 kPa and increased up to 703 kPa.
However, the impact is not very significant as the increment in products TVP happens
slowly and not very drastically. In order to ensure smooth operation without any upset
to the operation, the High Pressure Separator,V-220 A/B operating pressure should be
kept around 450 kPa – 500 kPa.
Page 67
57
4.7.2 Effects of Electrostatic Precipitator Operating Pressure
Electrostatic Precipitator, V-225 A/B is two phase separator which uses electrostatic
force to break the oil-water emulsion formed inside the crude. It is normally operating
at 300 kPa at 75 – 85 °C. Separated crude oil and off-gas from V-225 A/B are gathered
together and sent to the Low Pressure Separator, V-230 A/B.
Figure 24 : Effects of Electrostatic Precipitator Operating Pressure
Based on site visit to Terengganu Crude Oil Terminal on 14th
The graph in Figure 24 shows that as the operating pressure of V-225 A/B is increased,
the product TVP remain constant. This is because the off-gas separated from V-225
A/B is sent to Low Operating Pressure, V-230 A/B which means no volatile component
are removed from the crude.
May 2012, V-225 A/B is
operating at 300 kPa. For the purpose of these simulations, the operating pressure of
V-225 A/B is decreased from 213 kPa and increased up to 448 kPa.
The impact of V-225 A/B operating pressure is insignificant to the operation as the
increment in the operating pressure only results in constant products TVP. In order to
ensure smooth operation without any upset to the operation, the High Pressure
Separator,V-225 A/B operating pressure should be kept around 300 kPa – 350 kPa.
Page 68
58
4.7.3 Effects of Low Pressure Separator Operating Pressure
Low Pressure Separator (V-230 A/B) is the last three phase separator in the crude oil
stabilization system which normally operating at 179 kPa at 75 – 85 °C. The light
components flashed off from the low pressure separator are sent to the gas stabilization
header prior for condensation and purification process.
Figure 25 : Effects of Low Pressure Separator Operating Pressure
Based on site visit to Terengganu Crude Oil Terminal on 14th
The graph in Figure 25 shows that as the operating pressure of V-230 A/B is increased,
the stabilized crude product TVP also increased. The increase in TVP of the products is
because the increment in V-230 A/B operating pressure means lowers differential
pressure between the incoming crude inlet and the pressure vessel. This results in fewer
amounts of volatile components being flashed off as gas phase at the high pressure
separator. Thus, there are still traces amount of volatile component in the rundown
crude to storage which contributed to increase of product TVP. In order to ensure
smooth operation without any upset to the operation, the Low Pressure Separator,
V-230 A/B operating pressure should be kept around 170 kPa – 230 kPa.
May 2012, V-220 A/B is
operating at 179 kPa. For the purpose of these simulations, the operating pressure of
V-220 A/B is decreased from 103 kPa and increased up to 268 kPa.
Page 69
59
4.8 PRE - HEATER TRAINS VARIABLE
Pre-heater trains consist of two major heat exchanger banks (HX-210 & HX-220)
which supply required heat to the live crude before entering the crude stabilization
trains. There are eight Crude to crude Heat Exchanger, HX-210s per train, arranged in
two parallel banks of four exchangers in series. The HX-210s supply needed heat to
warm the inlet crude from 29.4 °C to 52 °C, and at the same time cools the hot
stabilized crude to 40 °C before it is transferred to storage.
On the other hand, there are two parallel HX-220s per train ; one downstream of each
parallel bank of four HX-210s. The HX-220s supply the additional heat to raise the inlet
crude temperature to 80 °C using hot oil at 260 °C.
4.8.1 Effect of Crude to Crude Exchanger, HX-210s Outlet Temperature
In order to study the effect of changing HX-210s outlet temperature, all other
parameters are kept constant including the next heat exchanger, HX-220s duty. Thus,
HX-220s resultant temperatures are also observed along with the product TVP.
Figure 26: Effects of HX-210s Outlet Temperature (HYSYS Pseudo Components)
Page 70
60
Figure 27: Effects of HX-210s Outlet Temperature (HYSYS Crude Assays)
Figure 26 & 27 show graphs for the effects of HX-210s outlet temperature for HYSYS
simulation (both Pseudo Component and Crude Assays). There are two parts of the
graph as a result of changing HX-210s outlet temperature, which are the product TVP
and also HX-220s resultant temperature.
For the purpose of this study, the outlet temperature of HX-210s is decreased to 30 °C
and increased up to 68 °C instead of normal operation at 52 °C. As HX-210s outlet
temperature increase, the outlet temperature of subsequent HX-220s also increased.
Product True Vapor Pressure also increased but then starting to decrease when the
temperature of HX-210s is 52 °C (normal operation). Thus, it is observed that the effect
of changing HX-210s outlet temperature is insignificant towards the crude oil
stabilization system. In order to ensure smooth operation for the pre-heaters train, the
outlet temperature of HX-210s should be kept more than 52 °C. Heat supplied is used to
flash off the volatile component of the live crude.
Page 71
61
4.8.2 Effect of Hot Oil to Crude Exchanger, HX-220 Outlet Temperature
In order to study the effect of changing HX-220s outlet temperature, the outlet
temperature of HX-210s is kept constant at 52 °C. In normal operation, HX-220s outlet
temperature is 80 °C.
Figure 22 : Effects of HX-220s Outlet Temperature
Figure 28 shows graph for effects of HX-220s outlet temperature for HYSYS
simulation (both Pseudo Component and Crude Assays) towards Product True Vapor
Pressure. For the purpose of this study, the outlet temperature of HX-220s is decreased
to 57 °C and increased up to 97 °C instead of normal operation at 85 °C. As HX-210s
outlet temperature increases, the True Vapor Pressure of the stabilized crude decreases.
This is because more heat is supplied to flash off the light (volatile) components inside
the live crude coming from the offshore. Thus, leaving only heavy and viscous
components in rundown crude to storage with low vapor pressure. All in all, the impact
of changing the outlet of HX-220s is very significant towards the crude oil stabilization
operation. Thus, in order to ensure smooth operation for the pre-heaters train, the outlet
temperature of HX-220s should be kept around 85 – 90 °C with HX-210s outlet
temperature is constant at 52 °C. Hot oil and furnace performance will be discussed
further to analyze the limitation of the pre-heaters train.
Page 72
62
4.8.3 Fired Heater (HX-610) Analysis
4.8.3.1 Design Specifications and Current Operation
Terengganu Crude Oil Terminal, TCOT was designed with four (4) fired heaters
(HX-610 A/B/C/D) to heat up hot oil (PETRONAS Danol XHT 32) from 150 to 260 °C
with design efficiency of 89% for each fired heater. At full plant production load, 445
kbpd of crude flow, fired heater shall be operated based on N+2 (100% sparing)
philosophy in which 12 burners (each fired heater with 6 burners) will be online.
Currently, three fired heaters (12 burners online) are in operation with production load
of 175 kbpd of crude. The major differences between current operation and design
specifications consist of the following:
Table 21 : Different Between Design and Current Operation
PARAMETER DESIGN SPECIFICATION
CURRENT OPERATION
Crude Flow, kbpd 442 175 Hot Oil Inlet Temperature, °C 150 130 – 150 Hot Oil Outlet Temperature, °C 260 190 – 210 Stack/Flue Gas Temperature, °C 197 190 – 200 No. of Fired Heater In Operation 2+2 (12 burners) 3+0 (12-13 burners)
*Fired heater HX-610A is under maintenance
4.8.3.2 Fired Heater Actual Efficiency
Efficiency calculation had been carried out to evaluate actual fired heater performance.
Average value of fired heater HX-610C and HX-610D were used to estimate current
performance of fired heater HX-610B, due to unavailability data for the calculation
purposes. Assumptions were made on the physical properties of hot oil and fuel gas.
The calculation was performed (Refer Appendix V) using the following formula and
results are depicted in Table 22.
𝑯𝑯𝑯𝑯𝑯𝑯𝑯𝑯𝑯𝑯𝑯𝑯 𝑬𝑬𝑬𝑬𝑬𝑬𝑬𝑬𝑬𝑬𝑬𝑬𝑯𝑯𝑬𝑬𝑬𝑬𝑬𝑬 = 𝐻𝐻𝐻𝐻𝐻𝐻𝐻𝐻 𝐴𝐴𝐴𝐴𝐴𝐴𝐴𝐴𝐴𝐴𝐴𝐴𝐻𝐻𝐴𝐴 𝐴𝐴𝑏𝑏 𝐻𝐻𝐴𝐴𝐻𝐻 𝑂𝑂𝑂𝑂𝑂𝑂 (𝑀𝑀𝑀𝑀)𝐻𝐻𝐻𝐻𝐻𝐻𝐻𝐻 𝑅𝑅𝐻𝐻𝑂𝑂𝐻𝐻𝐻𝐻𝐴𝐴𝐻𝐻𝐴𝐴 𝐴𝐴𝑏𝑏 𝐹𝐹𝐹𝐹𝐻𝐻𝑂𝑂 𝐺𝐺𝐻𝐻𝐴𝐴 (𝑀𝑀𝑀𝑀)
× 100%
Page 73
63
Table 22 : Calculated Combined Thermal Efficiency of Fired Heater HX-610C and D
Date
Hot Oil Total Heat Released by
Fuel Gas (MW)
Thermal Efficiency
(%)
HX-610B HX-610C HX-610D Total Heat
Adsorbed (MW)
Heat Adsorbed
(MW)
Heat Adsorbed
(MW)
Heat Adsorbed
(MW) July 2010 6.91 6.32 7.52 20.75 53.87 38.51
August 2010 6.59 6.86 6.33 19.78 51.72 38.25
Based on Table 22, it is observed that currently, the efficiency of the furnace system
(HX-610s) has dropped below the design specification. The calculated thermal
efficiencies are a combined value for HX-610B C and D since only total fuel gas flow is
available. Average calculated efficiencies during year 2010 was 38.38% which is
56.88% deviation from the design efficiency (89%). This indicates the fired heater
performance will not achieve 89% of efficiency even all the burners are put online.
Further maintenance and regular monitoring are important to increase the efficiency of
the pre-heater train’s performance.
4.9 HOT OIL TO CRUDE EXCHANGER, HX-220X PERFORMANCE
4.9.1 Scenario 1 — Variable Water Volume % at Constant Outlet
Temperature & Inlet Crude Flow
Table 23 : Scenario 1 for HYSYS Simulation Pseudo Component’s Method
Scenario 1 (Pseudo Comp.) 1 2 3 4 5 % Deviation
HX-220 Inlet Temperature 57
HX-220 Outlet Temperature 87
Inlet Crude, kbpd 175 Water (vol%) 4.8 7 10 15 20 317 Water, kbpd 8.8 13.2 19.4 30.9 43.8 317 HX-220 Duty, MW 19.60 20.65 22.13 24.88 27.97 43 V-220 High Pressure Vessel Gas Production, MMSCFD
12.71 12.74 12.79 12.85 12.91 2
Page 74
64
Table 24 : Scenario 1 for HYSYS Simulation Crude Assay’s Method
Scenario 1 (Crude Assays) 1 2 3 4 5 % Deviation
HX-220 Inlet Temperature 57
HX-220 Outlet Temperature 87
Inlet Crude, kbpd 175 Water (vol%) 4.8 7 10 15 20 317 Water, kbpd 8.8 13.2 19.4 30.9 43.8 317 HX-220 Duty, MW 18.70 19.76 21.24 23.99 27.07 45 V-220 High Pressure Vessel Gas Production, MMSCFD
14.94 14.99 15.05 15.15 15.24 2
Table 23 & 24 shows the effect of increasing water volume at constant outlet
temperature and inlet crude flow rate for both HYSYS Simulation methods (Pseudo
Components & Crude Assays). By increasing 317% of water volume in the inlet crude
from 4.8 to 20 vol%, the duty requirement of HX-220X will increase by 43 - 45%. This
yields a ratio of 1 : 0.142 ±.
4.9.2 Scenario 2 — Variable Inlet Crude Flow at Constant Outlet
Temperature & Water Volume %
Table 25 : Scenario 2 for HYSYS Simulation Pseudo Component’s Method
Scenario 2 (Pseudo Comp.) 1 2 3 4 5 % Deviation
HX-220 Inlet Temperature 57
HX-220 Outlet Temperature 87
Inlet Crude, kbpd 150 160 170 180 190 27 Water (vol%) 4.8 Water, kbpd 7.56 8.07 8.57 9.08 9.58 27 HX-220 Duty, MW 16.80 17.92 19.04 20.16 21.28 27 V-220 High Pressure Vessel Gas Production, MMSCFD
10.89 11.62 12.35 13.07 13.80 27
Page 75
65
Table 26 : Scenario 2 for HYSYS Simulation Crude Assay’s Method
Scenario 2 (Crude Assays) 1 2 3 4 5 % Deviation
HX-220 Inlet Temperature 57
HX-220 Outlet Temperature 87
Inlet Crude, kbpd 150 160 170 180 190 27 Water (vol%) 4.8 Water, kbpd 7.56 8.07 8.57 9.08 9.58 27 HX-220 Duty, MW 16.03 17.11 18.17 19.24 20.31 27 V-220 High Pressure Vessel Gas Production, MMSCFD
12.80 13.66 14.51 15.36 16.22 27
Table 25 & 26 shows the effect of increasing crude flow at constant outlet temperature
and constant water volume% for both HYSYS Simulation methods (Pseudo
Components & Crude Assays). By increasing 27% of inlet crude (from 130 to 180
kbpd), both the actual water volume and duty requirement will also increase by 27%.
This yield a ratio of 1 : 1.
4.9.3 Scenario 3 — Variable Water Volume % at Constant Inlet Crude
Flow & Heat Exchanger Duty
Table 27 : Scenario 3 for HYSYS Simulation Pseudo Component’s Method
Scenario 3 (Pseudo Comp.) 1 2 3 4 5 % Deviation
HX-220 Inlet Temperature 57
HX-220 Outlet Temperature 90.05 88.44 86.41 83.25 80.41 -11
Inlet Crude, kbpd 175 Water (vol%) 4.8 7 10 15 20 317 Water, kbpd 8.8 13.2 19.4 30.9 43.8 317 HX-220 Duty, MW 21.68 V-220 High Pressure Vessel Gas Production, MMSCFD
13.53 13.12 12.63 11.91 11.31 -16
Page 76
66
Table 28 : Scenario 3 for HYSYS Simulation Crude Assay’s Method
Scenario 3 (Crude Assays) 1 2 3 4 5 % Deviation
HX-220 Inlet Temperature 57
HX-220 Outlet Temperature 91.50 89.77 87.60 84.21 81.19 -11
Inlet Crude, kbpd 175 Water (vol%) 4.8 7 10 15 20 317 Water, kbpd 8.8 13.2 19.4 30.9 43.8 317 HX-220 Duty, MW 21.68 V-220 High Pressure Vessel Gas Production, MMSCFD
16.36 15.85 15.23 14.33 13.57 -17
27 & 28 shows the effect of increasing water volume % at constant inlet crude flow and
heat exchanger duty for both HYSYS Simulation methods (Pseudo Components &
Crude Assays). By increasing 317 % of water volume in the inlet crude from 4.8 to 20
vol %, the outlet temperature will decrease by 11 %. This yield a ratio of 1 : 0.035.
Furthermore, there will be 17 % less gas produced from High Pressure Separator,
V-220 A/B. As a result, the gas compressor will be running at recycle flow and increase
of as flaring.
From all three scenarios, it can be concluded that actual water volume (kbbl/d) has
greater impact on the duty of HX-220X compared to water volume %. Since the design
water volume is 21 600 bbl/d (which is equivalent to 4.8 % of 450 000 bbl/d); at the
average current plant production of 195 000 bbl/d. HX-220X is capable to handle water
content up to 9.9 vol % (21 600 bbl/d). During pigging activities, the water content was
observed to receive an average of 15 vol %, the pre-heater's capability is limited.
Page 77
67
CHAPTER 5
CONCLUSION AND RECOMMENDATIONS
5.1 CONCLUSION
From the preliminary research, separation efficiency can be enhanced by several factors
which are the separator operating pressure, and also optimum number of staged
separation. In addition, fine tuning of operating condition of individual equipment
should lead to high quality and maximum production of crude oil. This project aims to
simulate an industrial case study which is based on Terengganu Crude Oil Terminal –
TCOT operations in order to obtain a stabilized crude with maximum True Vapor
Pressure of 83 kPa (12 psia) for storage/export. In addition, to propose a range of
optimum operating condition that maximize the oil and gas production and study the
limitation of crude oil stabilization. The inlet crude composition is taken from Tapis
Blend composition at 17 barg and 30 ⁰C.
From the research, for a stabilized crude with True Vapor Pressure of 10 - 12 psia, the
incoming dry feed flow rate should be from 158 - 200 kbbl/d at pressure and
temperature of 17 barg and (24 - 32 ⁰C) respectively. Moreover, the High Pressure
Separator, V-220 A/B operating pressure should be around (400 - 592 kPa) while Low
Pressure Separator, V-230 A/B pressure should be set around (165 - 186 kPa). On the
other hand, the outlet temperature of Hot Oil to Crude Heat Exchanger, HX-220X must
be around 85 - 90 ⁰C with three fired heater (HX-610 B/C/D) in operation.
Based on the scenario analyzed, it can be concluded that actual water volume (kbbl/d)
has greater impact towards the crude oil stabilization operation. Thus, in order to obtain
in specifications stabilized crude at TVP of 12 psia, incoming free water flowrate
should be less than 19 kbbl/d (10 vol %) at normal production of 195 kbbl/d.
Page 78
68
5.2 RECOMMENDATIONS
There are a few other aspects of this research that can be approached in order to
improve the findings of this projects. The recommendations are as below;
a. Compare the simulation data with data from Labuan and Miri Crude (which
have slightly lower quality than TAPIS Blend) to validate whether the
simulation is applicable for the East Malaysia regions.
b. Another parameter that can be studied for its effects towards the product True
Vapor Pressure is the sulphur content inside the incoming live crude.
c. Create a dynamic HYSYS model of fired heater (furnace system) to observe the
efficiencies of each fired heater.
d. Include an economic study that would take into account the cost of utilities and
processing and find the most optimum operating conditions that would results
in highest gross profit.
e. Conduct another simulations with a different simulation software in order to
compare its results with the current results and investigate what causes the
differences.
f. Conduct a design of experiments (DOE) study that could investigate the effects
of more than one parameter at once towards the product properties so as to find
the optimum parameter the optimum parameters where the product of highest
quality can be obtained.
g. Conduct a latest site visit to Terengganu Crude Oil Terminal, TCOT to monitor
the limitation/performance of each facilities.
h. Study the differences between normal operation and during pigging activities.
Page 79
69
REFERENCES
[1] R.C Burruss & R.T. Ryder, Composition of Crude Oil and Natural Gas. U.S
Geological Survey, 2003.
[2] Oilfield Separation & Separators-Separator Function. (2010). Retrieved
February 10, 2013, from: http://articles.compressionjobs.com/articles/oilfield
[3] GPSA Engineering Data Book, 11th ed. (Electronic)
[4] ExxonMobil Exploration and Production Malaysia Inc. (EMEPMI) General
Specifications (GS)
[5] Manning & Thompson, Oilfield Processing of Petroleum : Stabilization and
Sweetening of Crude Oil, vol. 2. PennWell Books, 1991.
[6] PETRONAS Technical Standards, Design & Engineering (Core), Rev. 12,
2004.
[7] List of Crude Oil Products, (2012). Retrieved February 10, 2013,
from: http://en.wikipedia.org/wiki/List_of_crude_oil_products
[8] U.S Environmental Protection Agency, Hazardous Air Pollutants (HAP)
Specification Methodology : Emission Factor, pg. 54.
[9] Malaysia's Environmental Law, ENVIRONMENTAL QUALITY ACT, 1974,
the Malaysia Environmental Quality (Sewage and Industrial Effluents)
Regulation, 1979
[10] Konstantin Panoussopoulus, Separation of Crude Oil-Water Emulsions :
Experimental Techniques and Models, 1998.
[11] ESMAP, Crude Oil Price Differentials and Differences in Oil Qualities : A
Statistical Analysis, 2005.
[12] KLM Technology Group, Separator Vessel Selection and Sizing : Engineering
Design Guideline, 2011.
[13] WO 2012/127295 A1 Patent, A Process For The Recovery of Crude, 2011.
[14] Nael N. Zaki,, Ruben G. Carbonell and Peter K. Kilpatrick, A Novel Process for
Demulsification of Water-in-Crude Oil Emulsions by Dense Carbon Dioxide,
North Carolina State University, 2003.
[15] J. C. Jones, Hydrocarbons : Physical Properties and their Relevance to
Utilization, Ventus Publishing ApS, 2010.
Page 80
70
[16] Dr. Paul Glover, Chapter 2 : Reservoir Fluids [PowerPoint Slides]
[17] K. Arnold and M. Stewart, Surface Production Operation : Design of
Oil-Handling System and Facilities, 2nd ed. Woburn, MA:
Butterworth-Heinemann, 1999, vol 1.
[18] Manish V.Shah, Practical Selection and Design Guide: For Gas Liquid
Separators With Optimization, 2000.
[19] Ernest W.Klechka, Use of Corrosion Inhibitors on the Trans Alaska Pipeline,
CORTEC Corp., 2001.
[20] Hazard Devold, Oil and Gas Production Handbook, ED 1.3, ABB ATPA Oil
and Gas, London, June 2006.
[21] Richard M. Felder, Elementary Principles of Chemical Processes, Third
Edition, John Wiley & Sons, Inc, New York
[22] Terengganu Crude Oil Terrminal (TCOT) Start-Up and Operating Manual
[23] SKG16 Facilities Process [PowerPoint Slides]
[24] Terengganu Crude Oil Terminal Operation Training [PowerPoint Slides]
[25] Feasibility Study For Terengganu Crude Oil Terminal (TCOT) & Liquefied
Petroleum Gas Unit (LPGRU) Debottlenecking Project
(TCOT-PR-RPT-0001_R0)
[26] Terengganu Crude Oil Terminal (TCOT) Design Basis Memorandum
[27] Norrie. (2010), Compression Principle & Gas Compressors — Surging in a
Centrifugal Compressor. Retrieved February 15, 2013,
from: http://articles.compressionjobs.com
[28] MMC Oil & Gas Engineering Sdn Bhd. (2011), TCOT Incoming Fluid
Composition – Separation Improvement and Sand Removal Installation Report.
[29] Francis S. Manning, Richard E. hompson, Chapter 3: Phase Behavior, Oilfield
Processing of Petroleum : Crude Oil, Vol. 2. 1995.
[30] Gerard Chin, Whole Crude Compositional Analysis, Laboratory Analysis
Report for PETRONAS Carigali Sdn Bhd, 2010.
[31] Group Technical Solutions, PMO SWAT- TCOT water Fluctuation Issue —
Phase Repor (Process Engineering), 2010.
Page 81
APPENDIX I
RELATED DRAWING
TYPICAL CRUDE
STABILIZATION
TCOT — HYSYS MODEL
TCOT — PFD
Page 82
Figure 2 (Section 2.2 Oil Handling Facilities, pg. 09) : Typical PFD of Onshore Crude Oil Receiving Terminal
Page 83
Figure 9 (Section 4.1 Brief Process Description, pg. 27) : PFD of TCOT Crude Stabilization HYSYS Model
Page 84
Figure 29 : PFD of Crude Oil Stabilization System at Terengganu Crude Oil Terminal, TCOT
Page 85
APPENDIX II
RELATED DRAWING
TCOT CRUDE STABILIZATION
SYSTEM
Page 86
Figure 30 : TCOT Crude Receiving System
Figure 11 : TCOT Crude Stabilization System
Page 87
Figure 32 : Gas Oil Water Separator V-220
Figure 33 : Electrostatic Precipitator V-225
Page 88
Figure 34 : Crude Surge Separator V-230
Page 89
APPENDIX III
BASIS OF SIMULATIONS
INLET CRUDE COMPOSITION
TCOT PLANT DATA
Page 90
INCOMING CRUDE FROM TAPIS PUMP DRY BASIS
Mol. Weight Formula Components Mol % Mol Fraction Mass, kg Mass Fraction Mass Flow, kg/hr Molar Flowrate, kmol/hr1 2.016 H2 Hydrogen 0.0000 0.0000 0.0000 0.0000 0.0000 0.00002 34.08 H2S Hydrogen Sulphide 0.0000 0.0000 0.0000 0.0000 0.0000 0.00003 44.01 CO2 Carbon Dioxide 0.5067 0.0051 0.2229 0.0014 1298.0506 29.49444 28.01 N2 Nitrogen 0.0300 0.0003 0.0084 0.0001 48.9129 1.74635 16.04 C1 Methane 4.1400 0.0414 0.6637 0.0041 3865.3966 240.98486 30.07 C2 Ethane 2.5000 0.0250 0.7514 0.0047 4375.8537 145.52227 44.1 C3 Propane 4.0000 0.0400 1.7632 0.0109 10268.0491 232.83568 58.12 i-C4 i-Butane 2.4600 0.0246 1.4291 0.0089 8322.4284 143.19399 58.12 n-C4 n-Butane 2.9200 0.0292 1.6963 0.0105 9878.6549 169.9700
10 72.15 Neo-C5 Neo-Pentane 0.0100 0.0001 0.0072 0.0000 41.9977 0.582111 72.15 i-C5 i-Pentane 2.9700 0.0297 2.1419 0.0133 12473.3222 172.880412 72.15 n-C5 n-Pentane 2.1100 0.0211 1.5217 0.0094 8861.5185 122.820813 86.18 Hexane 5.0100 0.0501 4.3156 0.0268 25132.3774 291.626614 84.16 M-Cyclo Pentane 1.3400 0.0134 1.1272 0.0070 6564.4732 77.999915 78.11 Benzene 0.2500 0.0025 0.1952 0.0012 1136.6742 14.552216 84.16 Cyclo-hexane 0.9900 0.0099 0.8328 0.0052 4849.8720 57.626817 100.2 Heptane 4.6300 0.0463 4.6371 0.0288 27004.6200 269.507218 98.19 M-C-Hexane 2.6400 0.0264 2.5910 0.0161 15089.0030 153.671519 92.14 Toluene 1.1700 0.0117 1.0775 0.0067 6275.1401 68.104420 114.2 Octanes 5.9100 0.0591 6.7461 0.0419 39286.4640 344.014621 106.2 E-Benzene 0.3300 0.0033 0.3503 0.0022 2039.9889 19.208922 106.2 M/P-Xylene 1.8100 0.0181 1.9213 0.0119 11189.0303 105.358123 106.2 O-Xylene 0.4800 0.0048 0.5095 0.0032 2967.2566 27.940324 128.3 Nonanes 4.3800 0.0438 5.6169 0.0349 32710.7215 254.955025 120.2 1,2,4-TMB 0.6700 0.0067 0.8050 0.0050 4687.7952 39.000026 142.3 C10 Decanes 4.9400 0.0494 7.0263 0.0436 40918.6414 287.551927 156.3 C11 Undecanes 4.7100 0.0471 7.3583 0.0457 42851.8171 274.163928 170.3 C12 Dodecanes 4.1400 0.0414 7.0471 0.0437 41039.7159 240.984829 184.4 C13 Tridecanes 4.2300 0.0423 7.7965 0.0484 45403.6368 246.223630 198.4 C14 Tetradecanes 3.8000 0.0380 7.5357 0.0468 43884.8503 221.193831 212.4 C15 Pentadecanes 4.0500 0.0405 8.5982 0.0534 50072.4559 235.746032 226.4 C16 Hexadecanes 2.9200 0.0292 6.6078 0.0410 38481.2022 169.970033 240.5 C17 Heptadecanes 2.4400 0.0244 5.8655 0.0364 34158.1439 142.029734 254.5 C18 Octadecanes 2.4200 0.0242 6.1560 0.0382 35850.2765 140.865535 268.5 C19 Nonadecanes 1.9100 0.0191 5.1260 0.0318 29851.5588 111.179036 282.5 C20 Eicosanes 1.5600 0.0156 4.4049 0.0273 25652.6602 90.805937 296.6 C21 Heneicosanes 1.3700 0.0137 4.0615 0.0252 23652.7189 79.746238 310.6 C22 Docosanes 1.1900 0.0119 3.6944 0.0229 21514.8226 69.268639 324.6 C23 Tricosanes 1.0300 0.0103 3.3418 0.0207 19461.4456 59.955240 338.6 C24 Tetracosanes 0.9200 0.0092 3.1137 0.0193 18132.7694 53.552241 352.7 C25 Pentacosanes 0.8100 0.0081 2.8555 0.0177 16629.5247 47.149242 366.7 C26 Hexacosanes 0.7200 0.0072 2.6390 0.0164 15368.5454 41.910443 380.7 C27 Heptacosanes 0.6700 0.0067 2.5495 0.0158 14847.2847 39.000044 394.7 C28 Octacosanes 0.6000 0.0060 2.3671 0.0147 13785.0306 34.925345 408.8 C29 Nonacosanes 0.5800 0.0058 2.3699 0.0147 13801.5619 33.761246 422.8 C30 Tricontanes 0.5100 0.0051 2.1553 0.0134 12551.4677 29.6865
47 435.3 C31 Hentriacontanes 0.4400 0.0044 1.9144 0.0119 11148.8661 25.611948 450.9 C32 Dotriacontanes 0.3400 0.0034 1.5323 0.0095 8923.7729 19.791049 464.3 C33 Tritriacontanes 0.2900 0.0029 1.3458 0.0084 7837.6531 16.880650 478.3 C34 Tetratriacontanes 0.2200 0.0022 1.0518 0.0065 6125.0892 12.806051 492.4 C35 Pentatriacontanes 0.1900 0.0019 0.9351 0.0058 5445.7914 11.059752 599.7 C36+ Hexatriacontanes Plus 1.7900 0.0179 10.7296 0.0666 62485.0954 104.1939
100.0467 1.0000 161.1104 1.0000 938244.0000 5823.6079
C7
C8
C9
C6
Page 91
STABILIZED CRUDE (TCOT EXPORT LINE) DRY BASIS
Formula Components Mol % Mol Fraction Wt %1 N2 N2 0.0190 0.0002 0.00302 CO2 CO2 0.0000 0.0000 0.00003 C1 C1 0.0020 0.0000 0.00004 C2 C2 0.0260 0.0003 0.00505 C3 C3 0.4940 0.0049 0.12406 i-C4 i-C4 1.4840 0.0148 0.49307 C4 C4 0.8410 0.0084 0.27908 Neo-Pentane 0.0000 0.0000 0.00009 i-C5 i-C5 3.0550 0.0305 1.260010 C5 C5 2.2990 0.0230 0.948011 2,2-Dimethylbutane* 0.0000 0.0000 0.000012 2,3-Dimethylbutane* 0.0000 0.0000 0.000013 Cyclopentane 0.2760 0.0028 0.134014 2-Methylpentane 2.2080 0.0221 1.075015 3-Methylpentane 1.1600 0.0116 0.565016 C6 C6 2.2890 0.0229 1.114017 Methylcyclopentane 1.1200 0.0112 0.589018 2,4-dimethylpentane 0.3550 0.0035 0.186019 Benzene 0.2700 0.0027 0.142020 Cyclohexane 1.0260 0.0103 0.540021 2-Methylhexane* 0.0000 0.0000 0.000022 3-Methylhexane* 0.0000 0.0000 0.000023 1,T-3-Dimethylcyclopentane* 0.0000 0.0000 0.000024 1,C-3-Dimethylcyclopentane* 0.0000 0.0000 0.000025 1,T-2-Dimethylyclopentane* 0.0000 0.0000 0.000026 C7 C7 6.4120 0.0641 3.372027 Methylcyclohexane 2.8590 0.0286 1.703028 Ethylcyclopentane* 0.0000 0.0000 0.000029 Toluene 1.2570 0.0126 0.748030 2-Methylheptane* 0.0000 0.0000 0.000031 1-Cis-3-Dimethylcyclohexane* 0.0000 0.0000 0.000032 3-Methylheptane* 0.0000 0.0000 0.000033 1-Methyl-T-3-Ethylcyclopentane* 0.0000 0.0000 0.000034 1-Trans-2-Dimethylcyclohexane* 0.0000 0.0000 0.000035 C8 C8 8.4520 0.0845 5.034036 Ethylcyclohexane* 0.0000 0.0000 0.000037 Ethylbenzene 0.1270 0.0013 0.088038 Meta & Para-Xylene 1.9230 0.0192 1.326039 Ortho-Xylene 0.6760 0.0068 0.466040 2-Methyloctane* 0.0000 0.0000 0.000041 3-Methyloctane* 0.0000 0.0000 0.000042 C9 C9 5.7300 0.0573 3.953043 1-Methyl-3-Ethylbenzene* 0.0000 0.0000 0.000044 1,3,5-Trimethylbenzene* 0.0000 0.0000 0.000045 n-Propylbenzene* 0.0000 0.0000 0.000046 1-Methyl-2-Ethylbenzene* 0.0000 0.0000 0.000047 C10 C10 7.0980 0.0710 5.435048 n-Butylbenzene* 0.3960 0.0040 0.332049 C11 C11 5.0470 0.0505 4.239050 C12 C12 4.7540 0.0475 4.374051 C13 C13 4.7300 0.0473 4.730052 C14 C14 3.9840 0.0398 4.325053 C15 C15 4.3810 0.0438 5.157054 C16 C16 3.0570 0.0306 3.879055 C17 C17 2.5560 0.0256 3.462056 C18 C18 2.5330 0.0253 3.634057 C19 C19 1.9940 0.0199 2.996058 C20 C20 1.6130 0.0161 2.534059 C21 C21 1.5350 0.0153 2.553060 C22 C22 1.2680 0.0127 2.209061 C23 C23 1.1510 0.0115 2.092062 C24 C24 1.0310 0.0103 1.949063 C25 C25 0.9890 0.0099 1.950064 C26 C26 0.9260 0.0093 1.901065 C27 C27 0.6700 0.0067 1.433066 C28 C28 0.7590 0.0076 1.683067 C29 C29 0.6950 0.0069 1.597068 C30 C30 0.5450 0.0054 1.295069 C31 C31 0.4590 0.0046 1.128070 C32 C32 0.4110 0.0041 1.043071 C33 C33 0.3290 0.0033 0.860072 C34 C34 0.2790 0.0028 0.753073 C35 C35 0.2100 0.0021 0.582074 C36 C36 0.2040 0.0020 0.613075 C37 C37 0.1430 0.0014 0.419076 C38 C38 0.1350 0.0013 0.406077 C39 C39 0.1050 0.0010 0.324078 C40+ C40+ 1.6550 0.0165 5.9660
100.0020 1.0000 100.0000TOTAL
Page 92
APPENDIX IV
PRELIMINARY ANALYSIS
TABLE DATA
Page 93
TCOT PLANT DATA vs. HYSYS PSEUDO COMPONENT (Figure 12, pg 37)
TCOT Real Plant Data
HYSYS Pseudo Component
Formula Components Mol Fraction Mol Fraction1 N2 Nitrogen 0.000190 0.0000012 C1 Methane 0.000020 0.0005113 C2 Ethane 0.000260 0.0031224 C3 Propane 0.004940 0.0152775 i-C4 i-Butane 0.014840 0.0156896 n-C4 n-Butane 0.008410 0.0208637 Neo-C5 Neo-Pentane 0.000000 0.0000808 i-C5 i-Pentane 0.030549 0.0270029 n-C5 n-Pentane 0.022990 0.019985
10 C6 Hexane 0.022890 0.05348511 C7 Heptane 0.064119 0.05189312 C8 Octanes 0.084518 0.06759113 C9 Nonanes 0.057299 0.05050514 C10 Decanes 0.070979 0.05715915 C11 Undecanes 0.050469 0.05457816 C12 Dodecanes 0.047539 0.04800117 C13 Tridecanes 0.047299 0.04905918 C14 Tetradecanes 0.039839 0.04407819 C15 Pentadecanes 0.043809 0.04697920 C16 Hexadecanes 0.030569 0.03387221 C17 Heptadecanes 0.025559 0.02830422 C18 Octadecanes 0.025329 0.02807223 C19 Nonadecanes 0.019940 0.02215624 C20 Eicosanes 0.016130 0.01809625 C21 Heneicosanes 0.015350 0.01589226 C22 Docosanes 0.012680 0.01380427 C23 Tricosanes 0.011510 0.01194828 C24 Tetracosanes 0.010310 0.01067229 C25 Pentacosanes 0.009890 0.00939630 C26 Hexacosanes 0.009260 0.00835231 C27 Heptacosanes 0.006700 0.00777232 C28 Octacosanes 0.007590 0.00696033 C29 Nonacosanes 0.006950 0.00672834 C30 Tricontanes 0.005450 0.00591635 C31* Hentriacontanes 0.004590 0.00510436 C32 n-Dotriacontanes 0.004110 0.00394437 C33* Tritriacontanes 0.003290 0.00336438 C34* Tetratriacontanes 0.002790 0.00255239 C35* Pentatriacontanes 0.002100 0.00220440 C36*+ Hexatriacontanes Plus 0.022420 0.02076441 M-Cyclo Pentane M-Cyclo Pentane 0.051189 0.01428842 Benzene Benzene 0.002700 0.00265343 Cyclo-hexane Cyclo-hexane 0.010260 0.01068944 M-C-Hexane M-C-Hexane 0.028589 0.02949045 Toluene Toluene 0.012570 0.01311246 E-Benzene E-Benzene 0.001270 0.00377347 M/P-Xylene M/P-Xylene 0.019230 0.02072948 O-Xylene O-Xylene 0.006760 0.00550149 1,2,4-TMB 1,2,4-TMB 0.003960 0.00773750 CO2 Carbon Dioxide 0.000000 0.00029551 H20 Water 0.000000 0.000000
1.000000 1.000000
DRY BASIS COMPOSITION
Page 94
TOTAL VALIDATION, PLANT DATA vs. HYSYS SIMULATIONS (Fig 14, pg 40)
DRY BASIS
COMPOSITION TCOT Real Plant Data
HYSYS Pseudo Component
HYSYS Crude Assay
Formula Components Mol Fraction Mol Fraction Mol Fraction
1 N2 Nitrogen 0.000190 0.000001 0.000000 2 C1 Methane 0.000020 0.000511 0.000373 3 C2 Ethane 0.000260 0.003122 0.002895 4 C3 Propane 0.004940 0.015277 0.015199 5 i-C4 i-Butane 0.014840 0.015689 0.015622 6 n-C4 n-Butane 0.008410 0.020863 0.021200 7 Neo-C5 Neo-Pentane 0.000000 0.000080 0.000079 8 i-C5 i-Pentane 0.030549 0.027002 0.027257 9 n-C5 n-Pentane 0.022990 0.019985 0.020263 10 C6*+ Hexane & Heavier 0.917802 0.897176 0.896866 11 CO2 Carbon Dioxide 0.000000 0.000295 0.000245
TOTAL 1.000000 1.000000 1.000000
Page 95
HYSYS PSEUDO COMPONENT, INLET vs. OUTLET (Figure 15, pg 43)
Inlet Flow Stabilized CrudeFormula Components Mol Fraction Mol Fraction
H2 Hydrogen 0.000000 0.000000H2S Hydrogen Sulphide 0.000000 0.000000CO2 Carbon Dioxide 0.002333 0.000295N2 Nitrogen 0.000137 0.000001C1 Methane 0.018942 0.000510C2 Ethane 0.011438 0.003119C3 Propane 0.018301 0.015265
i-C4 i-Butane 0.011255 0.015676n-C4 n-Butane 0.013360 0.020846
Neo-C5 Neo-Pentane 0.000046 0.000080i-C5 i-Pentane 0.013589 0.026981n-C5 n-Pentane 0.009654 0.019969
Hexane 0.022922 0.053442M-Cyclo Pentane 0.006131 0.014277Benzene 0.001144 0.002651Cyclo-hexane 0.004530 0.010680Heptane 0.021183 0.051852M-C-Hexane 0.012079 0.029467Toluene 0.005353 0.013102Octanes 0.027040 0.067538E-Benzene 0.001510 0.003770M/P-Xylene 0.008281 0.020712O-Xylene 0.002196 0.005496Nonanes 0.020040 0.0504651,2,4-TMB 0.003065 0.007731
C10 Decanes 0.022602 0.057113C11 Undecanes 0.021549 0.054535C12 Dodecanes 0.018942 0.047963C13 Tridecanes 0.019353 0.049020C14 Tetradecanes 0.017386 0.044043C15 Pentadecanes 0.018530 0.046942C16 Hexadecanes 0.013360 0.033845C17 Heptadecanes 0.011164 0.028282C18 Octadecanes 0.011072 0.028050C19 Nonadecanes 0.008739 0.022139C20 Eicosanes 0.007137 0.018082C21 Heneicosanes 0.006268 0.015880C22 Docosanes 0.005445 0.013793C23 Tricosanes 0.004713 0.011939C24 Tetracosanes 0.004209 0.010664C25 Pentacosanes 0.003706 0.009389C26 Hexacosanes 0.003294 0.008346C27 Heptacosanes 0.003065 0.007766C28 Octacosanes 0.002745 0.006955C29 Nonacosanes 0.002654 0.006723C30 Tricontanes 0.002333 0.005911
C31* Hentriacontanes 0.002013 0.005100C32 n-Dotriacontanes 0.001556 0.003941
C33* Tritriacontanes 0.001327 0.003361C34* Tetratriacontanes 0.001007 0.002550C35* Pentatriacontanes 0.000869 0.002202
C36*+ Hexatriacontanes Plus 0.008190 0.020748H20 Water 0.542245 0.000796
1.000000 1.000000
C9
C6
C7
C8
Page 96
HYSYS PSEUDO COMPONENT, INLET vs. OUTLET DRY BASIS (Fig 16, pg 44)
Formula Components Inlet Crude Stabilized CrudeH2 Hydrogen 0.000000 0.0000
H2S Hydrogen Sulphide 0.000000 0.0000CO2 Carbon Dioxide 0.005097 0.0003N2 Nitrogen 0.000300 0.0000C1 Methane 0.041379 0.0005C2 Ethane 0.024988 0.0031C3 Propane 0.039980 0.0153
i-C4 i-Butane 0.024588 0.0157n-C4 n-Butane 0.029185 0.0209
Neo-C5 Neo-Pentane 0.000100 0.0001i-C5 i-Pentane 0.029685 0.0270n-C5 n-Pentane 0.021089 0.0200
Hexane 0.050075 0.0535M-Cyclo Pentane 0.013393 0.0143Benzene 0.002499 0.0027Cyclo-hexane 0.009895 0.0107Heptane 0.046277 0.0519M-C-Hexane 0.026387 0.0295Toluene 0.011694 0.0131Octanes 0.059070 0.0676E-Benzene 0.003298 0.0038M/P-Xylene 0.018091 0.0207O-Xylene 0.004798 0.0055Nonanes 0.043778 0.05051,2,4-TMB 0.006697 0.0077
C10 Decanes 0.049375 0.0572C11 Undecanes 0.047076 0.0546C12 Dodecanes 0.041379 0.0480C13 Tridecanes 0.042279 0.0491C14 Tetradecanes 0.037981 0.0441C15 Pentadecanes 0.040480 0.0470C16 Hexadecanes 0.029185 0.0339C17 Heptadecanes 0.024388 0.0283C18 Octadecanes 0.024188 0.0281C19 Nonadecanes 0.019090 0.0222C20 Eicosanes 0.015592 0.0181C21 Heneicosanes 0.013693 0.0159C22 Docosanes 0.011894 0.0138C23 Tricosanes 0.010295 0.0119C24 Tetracosanes 0.009195 0.0107C25 Pentacosanes 0.008096 0.0094C26 Hexacosanes 0.007196 0.0084C27 Heptacosanes 0.006697 0.0078C28 Octacosanes 0.005997 0.0070C29 Nonacosanes 0.005797 0.0067C30 Tricontanes 0.005097 0.0059
C31* Hentriacontanes 0.004398 0.0051C32 n-Dotriacontanes 0.003398 0.0039
C33* Tritriacontanes 0.002899 0.0034C34* Tetratriacontanes 0.002199 0.0026C35* Pentatriacontanes 0.001899 0.0022
C36*+ Hexatriacontanes Plus 0.017891 0.02081.000000 1.0000
C8
C9
C6
C7
Page 97
HYSYS CRUDE ASSAY, INLET vs. OUTLET (Figure 17, pg 46)
Inlet Flow Stabilized CrudeNo. Components Mol Fraction Mol Fraction1 Hydrogen 0.000000 0.0000002 Hydrogen Sulphide 0.000000 0.0000003 Carbon Dioxide 0.002450 0.0002454 Nitrogen 0.000145 0.0000005 Methane 0.020018 0.0003736 Ethane 0.012088 0.0028937 Propane 0.019341 0.0151888 i-Butane 0.011895 0.0156109 n-Butane 0.014119 0.021184
10 Neo-Pentane 0.000048 0.00007911 i-Pentane 0.014361 0.02723712 n-Pentane 0.010202 0.02024813 NBP[0]43* 0.011555 0.02389014 NBP[0]57* 0.010617 0.02298215 NBP[0]70* 0.012442 0.02781616 NBP[0]85* 0.021158 0.04851817 NBP[0]100* 0.025856 0.06032618 NBP[0]117* 0.023148 0.05471519 NBP[0]129* 0.015839 0.03764820 NBP[0]146* 0.020609 0.04924221 NBP[0]158* 0.012217 0.02925522 NBP[0]173* 0.029842 0.07159023 NBP[0]188* 0.014135 0.03394724 NBP[0]203* 0.015755 0.03785925 NBP[0]217* 0.015594 0.03748526 NBP[0]232* 0.015599 0.03750427 NBP[0]246* 0.016323 0.03924928 NBP[0]260* 0.016082 0.03867229 NBP[0]275* 0.013129 0.03157230 NBP[0]289* 0.011920 0.02866531 NBP[0]304* 0.012228 0.02940632 NBP[0]318* 0.011605 0.02790833 NBP[0]332* 0.008665 0.02083834 NBP[0]347* 0.007694 0.01850235 NBP[0]362* 0.007327 0.01762036 NBP[0]376* 0.006767 0.01627437 NBP[0]390* 0.005854 0.01407738 NBP[0]405* 0.005138 0.01235539 NBP[0]420* 0.004750 0.01142440 NBP[0]438* 0.007011 0.01686141 H20 0.516477 0.000742
1.000000 1.000000
Page 98
HYSYS CRUDE ASSAY, INLET vs. OUTLET DRT BASIS (Figure 18, pg 47)
Components Inlet Flow Stabilized Crude Hydrogen 0.000000 0.000000Hydrogen Sulphide 0.000000 0.000000Carbon Dioxide 0.005067 0.000245Nitrogen 0.000300 0.000000Methane 0.041400 0.000373Ethane 0.025000 0.002895Propane 0.040000 0.015199i-Butane 0.024600 0.015622n-Butane 0.029200 0.021200Neo-Pentane 0.000100 0.000079i-Pentane 0.029700 0.027257n-Pentane 0.021100 0.020263NBP[0]43* 0.023898 0.023907NBP[0]57* 0.021957 0.022999NBP[0]70* 0.025732 0.027836NBP[0]85* 0.043759 0.048554NBP[0]100* 0.053475 0.060371NBP[0]117* 0.047873 0.054756NBP[0]129* 0.032758 0.037676NBP[0]146* 0.042622 0.049278NBP[0]158* 0.025266 0.029277NBP[0]173* 0.061718 0.071643NBP[0]188* 0.029234 0.033972NBP[0]203* 0.032584 0.037888NBP[0]217* 0.032250 0.037513NBP[0]232* 0.032260 0.037532NBP[0]246* 0.033758 0.039279NBP[0]260* 0.033259 0.038701NBP[0]275* 0.027152 0.031596NBP[0]289* 0.024652 0.028686NBP[0]304* 0.025289 0.029428NBP[0]318* 0.024001 0.027929NBP[0]332* 0.017921 0.020854NBP[0]347* 0.015912 0.018516NBP[0]362* 0.015153 0.017634NBP[0]376* 0.013995 0.016286NBP[0]390* 0.012106 0.014088NBP[0]405* 0.010625 0.012364NBP[0]420* 0.009825 0.011433NBP[0]438* 0.014500 0.016873
1.000000 1.000000
Page 99
EFFECT OF DRY FEED FLOW RATE (Figure 19, pg. 51)
Feed Flow Percentage, %
Feed Flowrate, Kbd
HYSYS Pseudo Comp.
HYSYS Crude Assay
60 105 7.43 7.1870 123 8.72 8.4080 140 9.58 9.4990 158 11.04 10.59
100 175 12.02 11.56110 193 12.72 12.53120 210 12.96 13.27130 228 13.15 13.48140 245 13.27 13.59150 263 13.41 13.70160 280 13.56 13.81170 298 13.70 13.94180 315 13.82 14.08190 333 13.95 14.20200 350 14.09 14.33210 368 14.20 14.40220 385 14.33 14.55230 403 14.44 14.62
Dry Feed Flowrate, kbpd VS. Product TVP, psia
EFFECT OF INLET FEED TEMPERATURE (Figure 20, pg 52)
Feed Temperature, ⁰C
HYSYS Pseudo Comp.
HYSYS Crude Assay
0 18.06 17.544 17.07 16.548 16.15 15.5912 15.16 14.6316 14.31 13.7820 13.42 12.9324 12.63 12.1228 11.8 11.3732 11.11 10.6436 10.42 10.0340 9.746 9.4144 9.177 8.83248 8.613 8.319
Feed Temperature, ⁰C VS. Product TVP, psia
Page 100
EFFECTS OF FEED PRESSURE (Figure 21, pg. 53)
Feed Pressure, bar
HYSYS Pseudo Comp.
HYSYS Crude Assay
6 12.050 11.5210 12.090 11.5814 12.060 11.5918 12.020 11.5622 11.980 11.5326 11.920 11.5030 11.880 11.4734 11.820 11.4538 11.780 11.3942 11.740 11.3646 11.740 11.3350 11.710 11.30
Feed Pressure, psia VS. Product TVP, psia
EFFECT OF WATER FLOW RATE (Figure 22, pg. 54)
Water Flow Percentage, %
Free Water Flowrate, Kbd
Water Content, BS&W % vol.
HYSYS Pseudo Comp. HYSYS Crude Assay
10 2 0.99% 9.84 9.3820 4 1.96% 10.11 9.6330 5 2.91% 10.28 9.7740 7 3.85% 10.58 10.0950 9 4.76% 10.85 10.3960 11 5.66% 11.14 10.6270 12 6.54% 11.28 10.8080 14 7.41% 11.56 11.0990 16 8.26% 11.78 11.35
100 18 9.09% 12.09 11.62110 19 9.91% 12.21 11.75120 21 10.71% 12.49 12.02130 23 11.50% 12.75 12.27140 25 12.28% 13.00 12.57150 26 13.04% 13.11 12.69160 28 13.79% 13.35 12.93
Water Flow Rate, kbpd VS. Product TVP, psia
Page 101
EFFECT OF HP SEPARATOR OPERATING PRESSURE (Figure 23, pg. 56)
Pressure Percentage, %
V220 Operating Pressure, psia
HYSYS Pseudo Comp.
HYSYS Crude Assay
70 47.31 11.74 11.7875 50.69 11.75 11.8180 54.07 11.79 11.8285 57.45 11.88 11.8890 60.83 11.91 11.9195 64.21 11.97 11.96100 67.59 12.02 12.00105 70.97 12.07 12.04110 74.35 12.12 12.08115 77.73 12.17 12.12120 81.11 12.22 12.16125 84.49 12.27 12.19130 87.87 12.32 12.22135 91.25 12.37 12.24140 94.63 12.45 12.26145 98.01 12.49 12.28150 101.39 12.53 12.30
V-220 Operating Pressure VS. Product TVP, psia
EFFECT OF ELECTROSTATIC PRECIPITATOR PRESSURE (Figure 24, pg. 57)
Pressure Percentage, %
V220 Operating Pressure, psia
HYSYS Pseudo Comp.
HYSYS Crude Assay
70 30.46 12.02 11.5675 32.63 12.02 11.5680 34.81 12.02 11.5685 36.98 12.02 11.5690 39.16 12.02 11.5695 41.33 12.02 11.56
100 43.51 12.02 11.56105 45.69 12.02 11.56110 47.86 12.02 11.56115 50.04 12.02 11.56120 52.21 12.02 11.56125 54.39 12.02 11.56130 56.56 12.02 11.56135 58.74 12.02 11.56140 60.91 12.02 11.56145 63.09 12.02 11.56150 65.27 12.02 11.56
V-225 Operating Pressure VS. Product TVP, psia
Page 102
EFFECT OF LP SEPARATOR OPERATING PRESSURE (Figure 25, pg. 58)
Pressure Percentage, %
V220 Operating Pressure, psia
HYSYS Pseudo Comp.
HYSYS Crude Assay
50 13.01 5.618 5.44755 14.31 6.243 6.04560 15.61 6.867 6.61165 16.91 7.521 7.23570 18.21 8.17 7.8375 19.51 8.85 8.4980 20.81 9.55 9.1485 22.11 10.15 9.7690 23.41 10.78 10.4195 24.71 11.40 10.99
100 26.01 12.02 11.56105 27.31 12.45 12.14110 28.61 12.35 12.76115 29.91 12.29 12.83120 31.21 12.25 12.76125 32.51 12.21 12.71130 33.81 12.19 12.66135 35.11 12.18 12.62140 36.41 12.18 12.59145 37.71 12.17 12.57150 39.02 12.16 12.55
V-230 Operating Pressure VS. Product TVP, psia
EFFECT OF HX-220s OUTLET TEMPERATURE (Figure 28, pg. 61)
HX-220 Outlet Temperature, ⁰C
HYSYS Pseudo Comp.
HYSYS Crude Assay
57 19.92 19.7161 18.76 18.4165 17.59 17.2369 16.53 16.0273 15.43 15.0477 14.39 13.9481 13.39 12.9485 12.48 12.0089 11.59 11.1493 10.76 10.3397 9.99 10.33101 9.28 8.86
HX-220 Outlet Temp. VS. Product TVP, psia
Page 103
EFFECT OF HX-210s OUTLET TEMPERATURE, (Fig 26 & 27, pg. 59)
HX-210 Outlet Temperature, ⁰C
HX-220 Outlet Temperature, ⁰C
Product TVP, psia
HX-220 Outlet Temperature, ⁰C
Product TVP, psia
30 61.76 10.26 62.11 10.1432 63.64 10.41 63.95 10.3534 66.52 10.56 65.81 10.5036 67.39 10.67 67.67 10.6538 69.27 10.87 69.52 10.8740 71.14 11.06 71.36 11.0942 73.02 11.23 73.21 11.3044 74.89 11.44 75.05 11.5446 76.76 11.62 76.90 11.7448 78.63 11.80 78.74 12.0450 80.49 11.99 80.58 12.2752 82.36 12.15 82.42 12.4554 84.22 12.25 84.25 12.1658 87.93 11.78 87.91 11.3660 89.79 11.45 89.73 10.9964 93.46 10.64 93.37 10.2468 97.16 9.97 96.98 9.57
HX-210 Outlet Temp. VS. Product TVP, psia
PSEUDO COMP. CRUDE ASSAY
Page 104
APPENDIX V
FIRED HEATER, HX-610
PERFORMANCE
CALCULATION
Page 105
FIRED HEATER HX-610s PERFORMANCE CALCULATION
Fired Heater Efficiency
𝑯𝑯𝑯𝑯𝑯𝑯𝑯𝑯𝑯𝑯𝑯𝑯 𝑬𝑬𝑬𝑬𝑬𝑬𝑬𝑬𝑬𝑬𝑬𝑬𝑯𝑯𝑬𝑬𝑬𝑬𝑬𝑬 = 𝐻𝐻𝐻𝐻𝐻𝐻𝐻𝐻 𝐴𝐴𝐴𝐴𝐴𝐴𝐴𝐴𝐴𝐴𝐴𝐴𝐻𝐻𝐴𝐴 𝐴𝐴𝑏𝑏 𝐻𝐻𝐴𝐴𝐻𝐻 𝑂𝑂𝑂𝑂𝑂𝑂 (𝑀𝑀𝑀𝑀)𝐻𝐻𝐻𝐻𝐻𝐻𝐻𝐻 𝑅𝑅𝐻𝐻𝑂𝑂𝐻𝐻𝐻𝐻𝐴𝐴𝐻𝐻𝐴𝐴 𝐴𝐴𝑏𝑏 𝐹𝐹𝐹𝐹𝐻𝐻𝑂𝑂 𝐺𝐺𝐻𝐻𝐴𝐴 (𝑀𝑀𝑀𝑀)
× 100%
Where:
Heat Absorbed, 𝑄𝑄𝐻𝐻𝐴𝐴𝐴𝐴 = 𝑚𝑚𝐶𝐶𝑝𝑝∆𝑇𝑇
m = Hot Oil Flow, kg/s
CP = Average Heat Capacity of Tin and Tout
LHV = lower heating value, KW.h/m
, Kj/kg.K
∆𝑇𝑇 = Temperature Different
3
Heat Released, Qrel
v = Fuel Gas Flow, m
= ѵ × 𝐿𝐿𝐻𝐻𝐿𝐿 3
𝑸𝑸𝑯𝑯𝒂𝒂𝒂𝒂 𝑯𝑯𝑯𝑯𝑯𝑯𝑯𝑯𝑯𝑯𝑯𝑯 = 6.91 MW
𝑄𝑄𝐻𝐻𝐴𝐴𝐴𝐴 𝐻𝐻𝐻𝐻610𝐶𝐶 = 176.12 𝑚𝑚3
ℎ × 0.86 × 103 𝑘𝑘𝑘𝑘
𝑚𝑚3 × 2.623 𝑘𝑘𝑘𝑘
𝑘𝑘𝑘𝑘.𝐾𝐾× (195.25 − 138.33)°𝐶𝐶
/h
𝑄𝑄𝐻𝐻𝐴𝐴𝐴𝐴 𝐻𝐻𝐻𝐻610𝐵𝐵 = 186.56 𝑚𝑚3
ℎ × 0.86 × 103 𝑘𝑘𝑘𝑘
𝑚𝑚3 × 2.623 𝑘𝑘𝑘𝑘
𝑘𝑘𝑘𝑘.𝐾𝐾× (197.09 − 138.33)°𝐶𝐶
𝑸𝑸𝑯𝑯𝒂𝒂𝒂𝒂 𝑯𝑯𝑯𝑯𝑯𝑯𝑯𝑯𝑯𝑯𝑯𝑯 = 6.23 MW
𝑄𝑄𝐻𝐻𝐴𝐴𝐴𝐴 𝐻𝐻𝐻𝐻610𝐷𝐷 = 197.0 𝑚𝑚3
ℎ × 0.86 × 103 𝑘𝑘𝑘𝑘
𝑚𝑚3 × 2.623 𝑘𝑘𝑘𝑘
𝑘𝑘𝑘𝑘.𝐾𝐾× (198.93 − 138.33)°𝐶𝐶
𝑸𝑸𝑯𝑯𝒂𝒂𝒂𝒂 𝑯𝑯𝑯𝑯𝑯𝑯𝑯𝑯𝑯𝑯𝑯𝑯 = 7.52 MW
Total Heat Absorbed by Hot Oil, MW = 6.91 + 6.23 + 7.52 MW = 20.75 MW
𝑄𝑄𝐴𝐴𝐻𝐻𝑂𝑂 = 123.61 × 10³ 𝑚𝑚3
𝐴𝐴 ×
1𝐴𝐴24 ℎ
× 10.46 𝑘𝑘𝑀𝑀.ℎ𝑚𝑚3 = 53.87 𝑀𝑀𝑀𝑀
Heater Efficiency = 20.75 𝑀𝑀𝑀𝑀53.87 𝑀𝑀𝑀𝑀
× 100% = 38.51%