Page 1
IN DEGREE PROJECT MATERIALS SCIENCE AND ENGINEERING,SECOND CYCLE, 30 CREDITS
, STOCKHOLM SWEDEN 2018
Process Simulation of Plasma Gasification for Landfill Waste
BOON HAU TAN
KTH ROYAL INSTITUTE OF TECHNOLOGYSCHOOL OF INDUSTRIAL ENGINEERING AND MANAGEMENT
Page 2
TableofContents
ListofFigures.....................................................................................................................I
ListofTables.....................................................................................................................II
ABSTRACT........................................................................................................................III
1.INTRODUCTION.............................................................................................................11.1Background.....................................................................................................................11.2Objective........................................................................................................................41.3Scope..............................................................................................................................4
2.LITERATUREREVIEW......................................................................................................52.1Finefraction...................................................................................................................52.2AspenPlusModelling.....................................................................................................62.3PlasmaGasification......................................................................................................122.4TarCracking..................................................................................................................142.5Melting.........................................................................................................................16
3.METHODOLOGY...........................................................................................................173.1PlasmaGasificationProcess.........................................................................................173.2PlasmaGasificationModel...........................................................................................183.2.1Feedstockproperties.............................................................................................183.2.2Drying....................................................................................................................203.2.3Pyrolysis.................................................................................................................213.2.4CharCombustionandGasification........................................................................213.2.5Melting..................................................................................................................223.2.6PlasmaTarCracking..............................................................................................22
3.3ASPENPlusModeldescription.....................................................................................243.3.1Assumptions..........................................................................................................283.3.2BoundaryConditions.............................................................................................28
3.4ParameterStudies........................................................................................................29
4.RESULTSANDDISCUSSION...........................................................................................314.1VerificationandValidationofModel...........................................................................314.1.1SyngasCompositionPreandPostTarCracking....................................................32
4.2MassandEnergyBalance.............................................................................................334.3ResultsofParameterStudies.......................................................................................354.3.1EffectofER............................................................................................................354.3.2EffectofPreheatedAirTemperature....................................................................37
5.CONCLUSION...............................................................................................................40
6.FUTUREWORK............................................................................................................41
7.REFERENCE..................................................................................................................42
Page 3
I
ListofFiguresFigure1.Theroleofplasmagasificationinacirculareconomy.(Power,2018)......................3Figure2.PlasmagasificationmodelofEPJModel(Minutilloetal.,2009)...............................9Figure3.Atwostageplasmagasificationprocess(Materazzietal.,2016)...........................12Figure4.TarCrackingModel(Fourcaultetal.,2010)............................................................15Figure5.Comparisonofrequiredheatforincinerationandgasification(Lietal.,2007)......16Figure6.Schematicoftwostageplasmagasificationmodel.................................................17Figure7.Simplifiedschematicoftheplasmagasificationmodel..........................................20Figure8.FlowsheetofplasmagasificationprocessinAspenPlus.........................................24Figure9.Comparisonbetweensyngascompositionbeforeandaftertarcracking...............32Figure10.MassandEnergyBalancediagramforplasmagasificationsystem......................33Figure11.Sankeydiagramshowingflowofenergyforplasmagasificationsystem.............34Figure12.Piechartshowingdistributionofenergyoutput...................................................35Figure13.EffectofincreasingERonsyngascompositionatTpreheatair=873K...............36Figure14.EffectofincreasingERonLHVandCGE................................................................36Figure15.Heatofpartialcombustionrequiredfromair(ER=0.208)atdifferent
Tpreheatair...................................................................................................................38Figure16.GraphshowinglowestpossibleERatdifferentTpreheatair...............................38Figure17.EffectofTpreheataironLHVandCGEaccordingtolowestpossibleERateach
Tpreheatair...................................................................................................................39
Page 4
II
ListofTablesTable2.MaterialCompositionofRDF...................................................................................18Table3.UltimateandproximateanalysesofRDF.................................................................19Table4.AnalysesofmetalcontentsofRDF...........................................................................19Table5.Charcombustionandgasificationreactionsconsidered..........................................22Table6.Reactionsconsideredfortarcracking......................................................................23Table7.DescriptionofunitoperationblocksinASPENPlusflowsheet.................................26Table8.AspenPlusmaterialstreams....................................................................................27Table9.AspenPlusheatstreams...........................................................................................28Table9.Boundaryconditionsforplasmagasificationmodel................................................29Table10.ParametersthatwerestudiedintheASPENPlusmodel........................................30Table11.ComparisonofcompositionbetweenAspenPlusModelandSimilarSetup..........31Table12.MassbalanceofAspenPlusmodel........................................................................34Table13.EnergybalanceofAspenPlusmodel......................................................................34
Page 5
III
ABSTRACT
ThegrowingamountoflandfillwastewithintheEUcouldposeaprobleminthefutureshould
therenotbeanyeffectivetreatmentmethods.Thisstudyaimstoinvestigatetheperformance
oflandfillwasteinaplasmagasificationprocessbysimulatingtheprocessinASPENPlus.The
investigationisfocusedontheenergyrecoverypotentialofRDFbasedoncompositionand
heatingvalueofsyngas,andcoldgasefficiency(CGE).Theplasmagasificationsystemconsists
ofashaftgasifierandaseparatetarcrackingreactorwherehightemperatureplasmaisused
forconversionoftarcompoundsconsideredinthemodel,whicharetolueneandnaphthalene.
Inaddition,themodelisdividedintofivesections,namelydrying,pyrolysis,chargasification,
meltingandtarcracking.Massandenergybalanceofthesystemwasperformedtobetter
understand the system.The results show that theplasmagasification systemwasable to
produce a syngaswith a LHVof 4.66MJ/Nm3while improving syngas yieldby attaining a
highercontentofhydrogen.Thus,theplasmatarcrackingoftarcompoundscanachievea
cleansyngasandimprovesyngasyield.ParameterstudyoneffectofERshowthatsyngashas
higherheatingvalueandCGEatlowerER.Ontheotherhand,preheatedaircanhelprecover
energyfromthesystemwhileloweringtheERrequiredforthechargasificationprocessto
meettheheatdemandfrompartialcombustion.Thefindingsimpliedthatlandfillwastehas
energypotentialbyusingasuitabletreatmentprocesssuchasplasmagasification.
Keywords:landfillwaste,RDF,plasmagasification,syngas
Page 6
1
1.INTRODUCTION1.1Background
Landfillhasbeentraditionallythesolutionforallthewastesproducedpriortoinventionof
modernandadvancedtreatmentmethods.Theconsequenceistheexistenceofanestimated
150,000to500,000landfillsiteswithinEuropethatwillhaverepercussionsforyearstocome
(Hoglandetal.,2010).Throughoutthedecades,wastemanagementhasprogressgradually
towardsamoresustainablepathwithfocusonreductioninconsumption,recycleofwaste
products,andwastevalorization.Stateof theart technology is requiredtoreduce landfill
wastewhichcanopenupotheropportunities.
Pertaining to landfilling, ithasbeen included in ‘Roadmap toaResourceEfficientEurope’
documentedbyEuropeanUnion(EU)thatlandfillingshouldbethefinaloptionandgradually
be ruled out as a solution as part of their aim by 2020 tomanagewaste resources in a
sustainablemanner(Commission,2011).Thishasledtotwoinnovativeconceptsknownas
EnhancedWasteManagement(EWM)andEnhancedLandfillMining(ELFM)thatattemptto
address issues surrounding landfill waste. EWM emphasizes on reduction in usage and
recycling,which rulesout landfillingas the finaldestinationbut as abuffer storage tobe
processedafter.Ontheotherhand,ELMisanapproachforwastevalorization,wherewaste
frombotholdandnewlandfillsareusedassourceofmaterialsandfuelforenergyrecovery
process (Bosmanset al., 2013). Such conceptswill beable tounlockpotential in thevast
amountofwastethathavebeenburiedandlefttoonceagainbepreciousresourcesthatcan
beutilize forvariousapplications.Furthermore,notonlyextravagantcostsofremediation
canbe avoided, the landused for landfilling can attain a higher valueby commercialized
explorationandactivities.Aprojected0,1-1trillioneurointhenext5decadeswillberequired
as remediation costs for the EU-28 while the Flemish Public Waste Agency, OVAM was
reportedtohavespent80millioneurotoremediatejust5problematiclandfills,byexcavating
landfilledmaterial,transportingandre-landfillinginamodernsanitarylandfill(Jonesetal.,
2013).Thereishoweverinsufficientandlessefficientusageofbudgettoperformsuchascale
ofprojectformajorityofstatesinEU(Vautmans,2015).
Page 7
2
Solidwastebasedenergyrecoveryviaincinerationhasbeenacommonmethodusedtotreat
municipalsolidwastebutalsoassourceofelectricityandheat.Wasteincinerationcombust
solidwastetypicallyintheformasrefusedderivedfuel(RDF)toobtainamoresustainable
operation aswell as to achieve a higher calorific value thus a higher electrical efficiency.
Conversionofmunicipal solidwaste (MSW) intoRDF involvespossiblemechanical and/or
manualhandling toobtainmorehomogeneouspropertieswhichenhances calorific value.
However, process and treatment varies according to landfill sites because of variation in
wastepropertiesandcompositions.Thedownsideofincinerationbeingacompleteoxidative
combustionprocessistheneedforexpensivefluegastreatmentequipmentduetopresence
of SOx andNOx, disposal problemswith fly ash andbottomash thatmay causepotential
hazard in leachingofheavymetals should itbe reused.Advanced thermal treatment that
turns bottom ash into environmentally friendly products is available but consumes a
significantamountofenergythatreducesenergyrecoveryefficiency.
Gasificationwhichisapartialoxidationprocessoffersanotheralternativethermochemical
processtotreatsolidwastesbyconvertingintosynthesisgas(syngas)thathascalorificvalue
and can be used as a fuel for various industries such as chemical industry and power
generation.Differentgasificationagentssuchasair,oxygencanbeusedtoproducesyngasof
higher calorific value using the latter. There has been development in using plasma
technologywithgasificationwherethehighenergydensityfromplasmacanenhancereaction
rate and at a higher temperature,materials can bemelted into slag. Plasma gasification
resultsinsyngaswithprimarilycarbonmonoxideandhydrogen.Atextremehightemperature,
tarandcharcanbebrokendownthushavingacleanersyngaswithoutexpensivegascleaning
facilities.Meanwhile,hazardousinorganicmaterialscanbevitrifiedinthemoltenslagwithout
leaching issues. Thus, the gasification process can play an important role in achieving a
circulareconomyasillustratedinFigure1.
Page 8
3
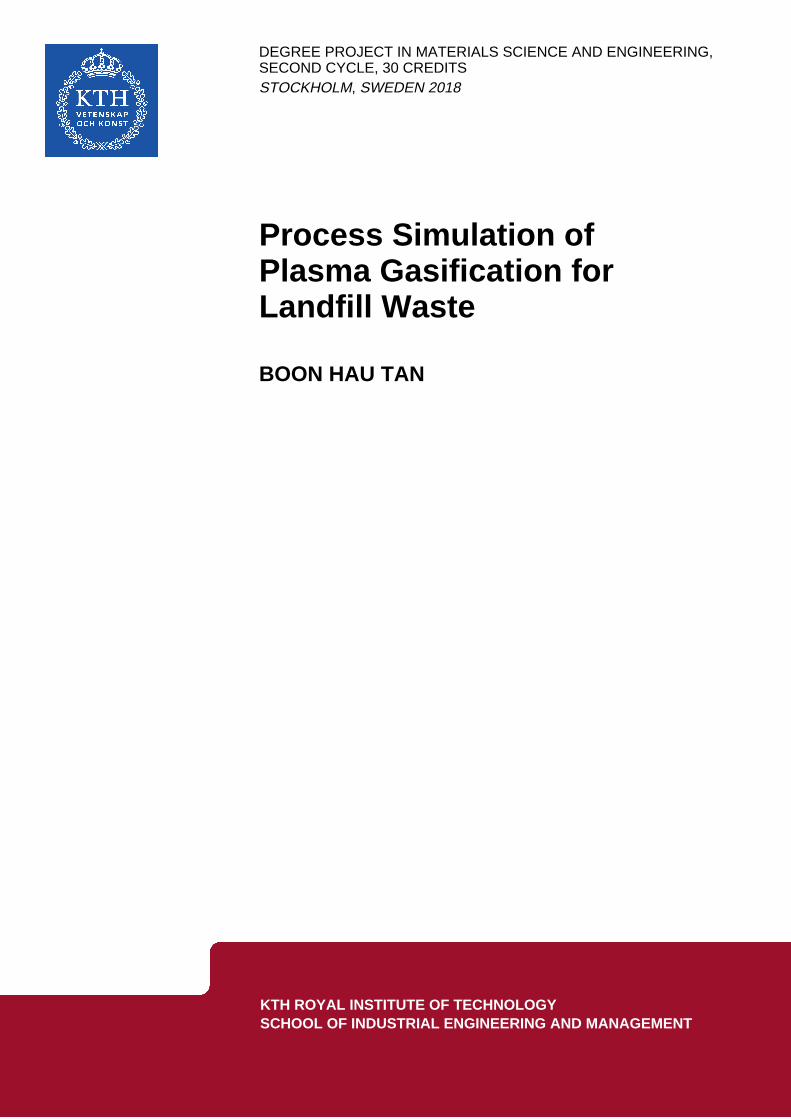
Figure1.Theroleofplasmagasificationinacirculareconomy.(Power,2018)
StudieshasbeenmuchonMSW,ratherlessonlandfillwaste.Landfillwastewhichareburied
foryearsanddecadesundergoesdecompositionwhichmakespropertiesdifficulttopredict
anditincreaseheterogeneityofthewaste.Thedecompositionincreasessoilandfinefraction
whichmayaffecttheenergyrecoverypotentialandalsoadditionalpre-treatmentprocessis
required before being used as a fuel. Preliminary studies have been conducted through
experiments,modelling,andsimulationbutstillrequirefurtherinvestigationastherearestill
uncertaintiesinthelandfillwastebeforeinvestinginlargescaleplants.
Therehavebeenstudiesconductedoncharacterizationoflandfillwasteusingvariousplasma
gasificationtechnologiessuchasfixedbed,fluidizingbedandentrainedflow.However,there
arenotmanystudiesontwostageplasmagasificationprocesscomprisingofastand-alone
gasifierandplasmatarconverter.Presenceof tar in theproductgasmakes itdifficult for
productgastobeusedandadditionalcostsmayberequiredtocleanupthegasforpractical
usage.Aseparateplasmatarconverterhasbetterpotentialinachievinghighertarconversion
rate. Tars contained in the product gas can contribute to an increase in heating value of
productgas.Tarisoftennottakenintoaccountinsimulationofgasificationduetocomplexity
oftarcompoundsandcrackingprocess.Hence,thisstudyintendstoinvestigatethepotential
of landfillwaste in energy recovery in termsof compositionofproduct gas, energy value
Page 9
4
consideringtarcompoundsintheprocessandtheefficiencyofthegasificationprocess.Firstly,
someliteraturestudieswillbedonetoreviewtheproblematiccontentofthelandfillwaste.
Next, some previous investigations onmodelling of gasification using ASPEN Plus will be
reviewed,followedbyastudyonusageofplasmagasificationandapplicationsoftarcracking.
Then,gasificationprocesswillbebrokendownindistinctmodelsbeforebuildingaASPEN
Plusmodelbasedontheschematicofthegasificationprocess.Usingthemodel,massand
energybalancewillbeperformedbeforeconductingparameterstudies.
1.2Objective
The objective of this study is to understand the energy and mass balance of plasma
gasificationsystemforalandfillwastebasedontheprocessmodelling,aswellaspredictthe
plasma gasification performance in terms of efficiency and syngas quality from its
composition.
1.3Scope
ThescopeofthisprojectinvolvesdevelopingthemodelforplasmagasifierusingASPENPlus
by breaking down into individual sections. The model will then be verified by using the
experimentaldataobtainedfromapilotscaleplasmagasifierofsimilarconstruction.Finally,
simulationoflandfillwastegasificationshallbeperformedtoobtaintheoptimumconditions
for the gasification process by carrying out parameter study to investigate the effect of
differentparametersintermsoftheefficiencyofprocessandcompositionofthesyngas.
Page 10
5
2.LITERATUREREVIEW
2.1Finefraction
Earlier studies on energy recovery potential of landfill wastewere carried out at various
locations.Duetonon-homogeneouspropertiesoftheexcavatedwaste,theyarerequiredto
bepre-processedviaprocesses suchascrushing, sievingandmanual sortingbeforebeing
utilizedasRDF.Themainconcerninlandfillwasteisthesignificantamountoffinefraction
that ispartlydue to thedecompositionofwastewhichwouldaffect thecalorificvalueof
syngasproducedasshowninsomestudies.
In a study done at REMO landfill located atHouthalen-Helchteren, Belgium characterized
eachcategoryofmaterialinthewastepostsievingprocessshowedthatthefinefraction(<10
mm)whichisbetween40–60%inweightfromdifferentlocationsoflandfillhasacalorific
value between 2.2 – 4.8MJ/kg (Quaghebeur et al., 2013), thereby showing some energy
recovery potential of landfill waste. In another landfill located at Högbytorp, Sweden, 3
differentsizefractionsofwastewereresultsofscreeningprocessandmedium-sizefraction
was hand sorted to extract more materials for energy recovery. For the fine fraction, a
comparablelowcalorificvalue(1.7MJ/kg)wasalsoobtainedbyaninvestigationdoneby(Jani
et al., 2016) for fine fraction below 10mm. Thus, fine fraction appears to be one of the
challengesinthewaste-to-energyapplicationwhichhastobeovercome.
Removaloffinefractionisabletoimprovethecalorificvalue.(Wankaetal.,2017)applied
theprincipleofdensitytofurtherseparatefinefractionwiththesizefractionbetween10–
60mminto3differentfractionsusingacombinationofwaterandmechanicaltreatment.The
methodismoreefficienttoextractRDFfromfinefractionandremovefinesattachedtothe
RDFwhichwillaffectthecalorificvaluesubsequentlyenergyrecoveryefficiency.Investigation
carriedoutattwodifferentlandfillsitesinAustriatoevaluatetheopportunityforresource
recovery.Sievingoffinefractiontoobtainhigherrecoverablefractionofwastesuggestedby
(Wolfsbergeretal.,2015).Contaminationofheavymetalscouldaffectthepossibilityofwaste
asRDF.Coarsefractionsshowedbetterenergyrecoverypotentialasshowninsomestudies.
Fine fraction in two landfills in Finland, one is aged between 1-10 years old and another
Page 11
6
between24-40yearsoldweremechanicallyseparateddefinedwithsizebelow20mmand
30mmwere investigatedof itsproperties suchasBiochemicalMethanePotential (BMP),
volatilesolidsandtotalsolids.ItwasdiscoveredthatBMPincreaseswithsizefraction.Besides,
finefractionincreaseswithageduetogreaterdecompositionofthewaste(Monkareetal.,
2016).(Kaartinenetal.,2013)suggesteddryingonthewastetoremovefinefractionattached
oncalorificfraction.Inthestudy,thewastewastreatedviamanualsortingandmechanical
treatment.However,investigatedcalorificvaluewereofdifferentsizefractions,largerthan
20mmand70mmformanuallysortedportionandmechanicallytreatedportionrespectively,
theobtainedcalorificvaluewasrathersimilar(20–25MJ/kg).Similarfindingsby(Hoglandet
al.,2004)infinefractionswithcalorificvaluebetween0–1MJ/kg,whileincoarsefraction,
itisfeasibleforenergyrecoverywithahighercalorificvalue.Thus,dryingappearstobeable
toimprovethecalorificvalueofthewastewhilemakingprocessmoreefficientaslessenergy
iswastedonheatingupwater.
2.2AspenPlusModelling
Numerousstudiesonmodellingandsimulationofgasificationprocesshasbeenperformed
usingtheprocesssimulationsoftware,AdvancedSystemforProcessEngineering(ASPEN)Plus
sinceitisamorecosteffectivewaytostudythecharacteristicofdifferentfeedstocksused
comparedtoapilotplantscale.Parameterstudiescanalsobedonetoinvestigateeffectof
differentparametersontheprocess.StudiesconductedusingAspenwerewidelyappliedfor
differentfeedstockandtechnology.Twodifferentmethodsthatcanbeusedtosimulatethe
modelinAspen,whichareequilibriumandkinetic.Equilibriumbasedmodelaresimulatedby
minimization of Gibbs free energywhile kinetic basedmodel takes into account reaction
kineticsthatoccur.Equilibriummodelcanbeusedasamodelthatprovidesabroadpicture
ofhowaparticularfeedstockbehavesinaprocessbeforedetailedstudiesarecarriedoutby
consideringmoreaspects.
Previous studiesusingequilibriumbasedmodel showed reasonableoutcomeas validated
againstexperimentaldataandotherstudies.CrucialparameterssuchasEquivalenceRatio
(ER),gasificationtemperatureandsteamadditionareamongothersthecommonparameters
Page 12
7
beinginvestigatedbecauseofthesignificantinfluenceontheenergyrecoverypotentialinthe
producedgas.(Niuetal.,2013)simulatedgasificationofmunicipalsolidwasteinabubbling
fluidizedbedusingtheminimizationofGibbsfreeenergymethodandinvestigatedtheeffect
ofEquivalenceRatio(ER),gasificationtemperature,moisturecontent,steam-wasteratio,and
percentageofoxygeninair.Itwasdiscoveredthatforahighersyngasyieldcanbeobtained
athighergasificationtemperature,anoptimalERof0.3at800°C,higherpercentageatlower
temperature.Pre-dryingoffeedstocktoalowermoisturetopreventextraenergytoconvert
watertosteamwhilehighersteam-wasteratiofacilitatesforconversiontoH2.Comparably,
a circulating fluidized bed gasifierwas simulated and the preheated air temperaturewas
investigatedover a range25 – 825°C showedan increase in syngas heating valuedue to
increaseinH2andCO.Furthermore, lesservolumeofair isrequiredtoachieveagasifier’s
operatingtemperaturecanhelptoreducethesizeofreactorwhich inturn isasavingsto
capitalcost.PreheatedairwasfoundtobeeffectiveatlowerER,wherealimitof0.35was
recommended(Dohertyetal.,2009).Similarly,influenceofERwasalsostudiedby(Lietal.,
2013)inasimulationwhereanoptimalpreheatedairtemperatureat600°CwithERof0.4
wasalsofoundouttobeimportantforthegasificationprocess.Meanwhile,anincreaseofER
ledtoadecreaseinlowerheatingvalue(LHV)ofsyngas.Plasmagasificationofthreetypesof
biomass, coffee husks, vines pruning and forest residues for hydrogen production were
investigated.ERwasvariedbetween0.1–0.6anditwasfoundthatoxidationreactionswas
moreprominentduetohigheroxygencontentthusdecreasingH2yield.Atthesametime,N2
contentrisescausedbyincreasedinamountofair.Steamusedasgasifyingagentincreased
H2 yieldbypromotingwatergas shift and steam reformingdue to increasedwater vapor
partialpressure(Favasetal.,2017).Gasifiertemperaturewasvariedfrom900–2000°Cand
itwasdiscovered thatCOyield increasedbutH2andCO2was theoppositeaswater shift
reactionsareexothermic.
AfixedbedgasifierthatusedMSWasfeedstockandresultswerecomparedtoexperimental
data.Themodelwasusedtostudytheeffectofair-fuelratioandgasifiertemperature.Results
showedthatoptimumair-fuelratiowasaround0.3andathighergasifiertemperature,yield
ofCOincreased(Begumetal.,2014).Adowndraftgasifierintegratedwithapowergeneration
unitfordifferentbiomassfuelscomprisedofdifferentwoodswassimulatedwithamodelin
Page 13
8
AspenPlususingREquilreactortocomparethegasifierefficiencies.Simulationresultswere
comparedwithexperimentaldataandCH4hadahugevariancepossiblyduetoverysimple
modelbuilt.Averagecalorificvalueobtainedforthebiomassfuelsisabout18MJ/kg(Keche
etal.,2014).
Apartfromair,steamisalsousedasagasifyingagentalongwithairtoachieveaproductgas
withhigheryieldofhydrogen.PerformanceforgasificationofMSW,foodwasteandpoultry
wastewerecomparedtoexperimentaldata.Parameterstudiesleadtofindingsthatshowed
highertemperaturefavorsCOandH2productionandsteamadditionatanoptimumrange
0.15–0.3 for steam-to-biomass ratiocanenhanceH2yield (Ramzanetal.,2011).Another
modelbasedonminimizingGibbsfreeenergywasdesignedtopredictsyngascomposition
usingsteamgasificationofdifferentbiomassforFischer-Tropschsynthesis.Itwasobserved
that increase in gasification temperature from 750 – 950 °C increases yield of CO but
decreasestheyieldofCO2andCH4(Palaetal.,2017).Endothermicreactionsarefavorableas
temperatureincreasesdrivingchemicalreactiontotherightside.Meanwhile,steamaddition
benefitedH2andCO2yield.
Therearealsostudiesthatintegratesthegasificationprocesswithotherprocessessuchas
powergeneration.PlasmagasificationofMSWandplasticsolidwasteatdifferentblending
ratiowassimulatedby(MazzoniandJanajreh,2017)foranIntegratedPlasmaGasification
CombinedCycle(IPGCC)tostudytheeffectofvaryingoxygenratioandsteamratioinplasma
gas.Thestudysuggestedthatathighersteamratioresultedinincreasedhydrogencontent
insyngas,whilehigheroxygenratioleadtolowersyngasyieldcausedbyformationofH2O
andCO2.SimilarplasmagasificationmodelusingGibbsfreeenergyequilibriumapproachwas
used tosimulatedifferent industrialwastesuchas shredded tires,plywoodwithdifferent
gasifyingagent,airandsteam.Electricalefficiencyfromthegasproductswasstudiedbyan
IPGCC. Steam addition contributed to the increase in hydrogen yield(Valmundsson and
Janajreh,2011).However,thereisalimitationinamountofsteamascoolingeffectmaytake
placethusreducingefficiency.AmodelcalledEquipPlasmaJet(EPJ)modelasshowninFigure
2 was developed for estimation of syngas production of a plasma gasification
Page 14
9
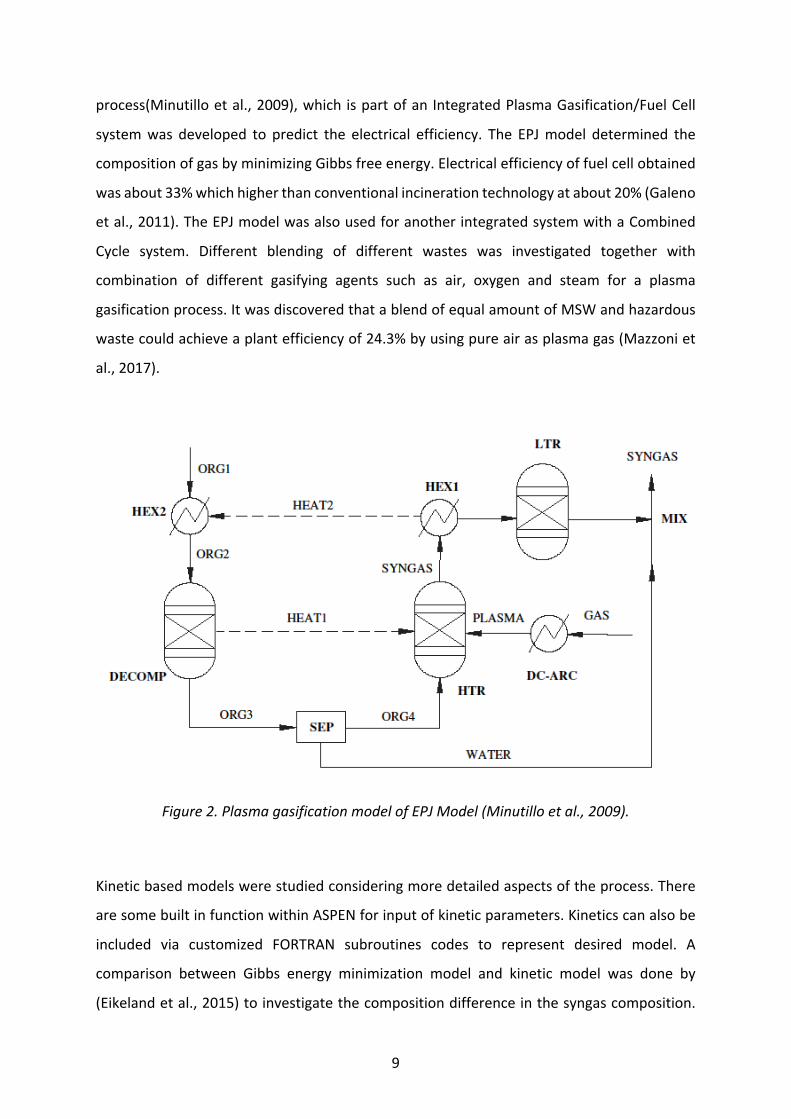
process(Minutilloetal.,2009),which ispartofanIntegratedPlasmaGasification/FuelCell
systemwas developed to predict the electrical efficiency. The EPJmodel determined the
compositionofgasbyminimizingGibbsfreeenergy.Electricalefficiencyoffuelcellobtained
wasabout33%whichhigherthanconventionalincinerationtechnologyatabout20%(Galeno
etal.,2011).TheEPJmodelwasalsousedforanotherintegratedsystemwithaCombined
Cycle system. Different blending of different wastes was investigated together with
combination of different gasifying agents such as air, oxygen and steam for a plasma
gasificationprocess.ItwasdiscoveredthatablendofequalamountofMSWandhazardous
wastecouldachieveaplantefficiencyof24.3%byusingpureairasplasmagas(Mazzoniet
al.,2017).
Figure2.PlasmagasificationmodelofEPJModel(Minutilloetal.,2009).
Kineticbasedmodelswerestudiedconsideringmoredetailedaspectsoftheprocess.There
aresomebuiltinfunctionwithinASPENforinputofkineticparameters.Kineticscanalsobe
included via customized FORTRAN subroutines codes to represent desired model. A
comparison between Gibbs energy minimization model and kinetic model was done by
(Eikelandetal.,2015)toinvestigatethecompositiondifferenceinthesyngascomposition.
Page 15
10
Reactionratestosimulateactualreactionsinthegasifierweredefinedinthekineticmodel.
Considerationofrateofformationandresidencetimearefactorsthatwillaffecttheresultin
akineticmodel.Bothmodelsshoweddifferentoutcomesfromvaryingfactorssuchassteam
flowrate,reactiontemperatureandresidencetime.Resultscanvarybecauseofthekinetics
consideredasseeninanothermodelwhereafluidizedbedreactorforbiomassgasification
wassimulatedtakingintoaccounttarformationandcrackingbyincludingtarkineticsintothe
modelallowingvariationinfeedstockandgasifyingagentsuchasoxygenandsteam.After
comparingthemodelwithexperimentaldata,itwasconcludedthatmodelperformancecan
beenhancedbyconsideringtarformationandkinetics(KaushalandTyagi,2017).Comparably,
afluidizedbedreactorusedforbiomassgasificationprocesswasalsosimulatedthatfactored
in reaction kinetics and hydrodynamic parameters representing fluidized reactions at the
sametimeconsideringkineticsofchargasification.Validationofmodelwasdoneagainsta
lab scale experimental data. Both gasification temperature and steam-to-biomass ratio
contributed toahigherproductionofhydrogen.ERwas found tobeoptimumat0.23,of
whichhigherthanthatwoulddecreasethecarbonconversionefficiency(NikooandMahinpey,
2008).
A semi detailed kineticmodel was used to simulate a biomass gasification of wood in a
bubbling fluidized bed. Empirical correlations and reaction kinetics of pyrolysis,
hydrodynamics parameters were applied to obtain more accurate results while also
consideringtarformationinthemodelbecauseitisoneofthecrucialparttocommercialize
gasification(Beheshtietal.,2015).Studyshowedthermalcrackingoftarisbetteratincreasing
ER. Gasification temperature increase led to an increase in yield of H2 and CO because
endothermicreactionsarefavorableathighertemperature.Steamadditionalsocontributed
tohigherhydrogenyield.
Anothermodelonfluidizedbedgasificationofwoodwassimulatedbyincorporatingexternal
Fortran code into Aspen Plus blocks to customize the model. Reaction kinetics and
hydrodynamicparameterswereconsideredinthemodeltobetterrepresentreactionsinthe
fluidizedbedgasifier.Themodelthenwasusedtoexamineeffectsofdifferentparameters
suchasair-fuelratio,steam-fuelratioandgasifiertemperature.Increaseamountofairnot
Page 16
11
only reducesyieldof combustible fraction,H2andCObutalso introducedmoreN2which
decreasestheoverallcalorificvalueofsyngas.Steam-fuelratioincreasehelpedinproducing
moreH2andCOfacilitatedbymoresteamreformingreactions.Carbonconversionimproved
byincreasinggasifiertemperatureshownintemperaturerange600–1000°C(Begumetal.,
2013).
Break down of different reaction zones in a gasification process allows more in depth
reactionstobeconsideredalthoughthezonesmayoverlapinanactualprocess.(Paulsetal.,
2016)developedamodel for a gasificationofwoodybiomass in abubbling fluidizedbed
taking intoaccounthydrodynamics,gasificationkinetics,extensivepyrolysisreactions,and
tarformationkinetics.Amorerealisticapproachconsideringmoreempiricalcorrelationsfor
pyrolysisandchargasificationresultedinmoreaccurateresultscomparedtooriginalmodel
by(NikooandMahinpey,2008)intermsofH2andCOcomposition.However,CO2andCH4
compositionpredictionwere lessaccurateduetheirsmallcomposition.Detailedmodelof
woodgasificationwasdevelopedbybreakingdownintoreactionzonesfordrying,pyrolysis,
secondaryreactionsandchargasificationbyincorporatingFortransub-modelsintoexisting
modelwhileatthesametimeconsideringmorecompoundsinthereactions.Themodelalso
includedsyngascleaningsystemforremovalofinorganicsandparticles,andwatertreatment.
Resultsobtainedwasthesyngascomposedofmajorcompounds21%H2and42%CO,with
calorificvalue12.5MJ/kg(Francoisetal.,2013).Anotherdetailedmodelofdualfluidizedbed
forbiomassgasificationbyimplementingchemicalreactionsfordifferentreactionzoneswith
external Fortran file to simulate operation of a fluidized bed reactor. The model also
consideredtarformationbygroupinginto4differentgroupsoftar,namelybenzene,phenol,
naphthaleneandtoluene(Abdelouahedetal.,2012).ItwasconcludedthatpredictionofCO,
CO2andH2yieldisdependentonthekineticofthewater-gasshiftreaction,whileresultof
methaneandtarcorrespondswellwithexperimentaldata.Hence,asmoredetailssuchastar
compoundsandchargasificationareconsidered,thepredictionofthemodelcanbemore
accurate.
Page 17
12
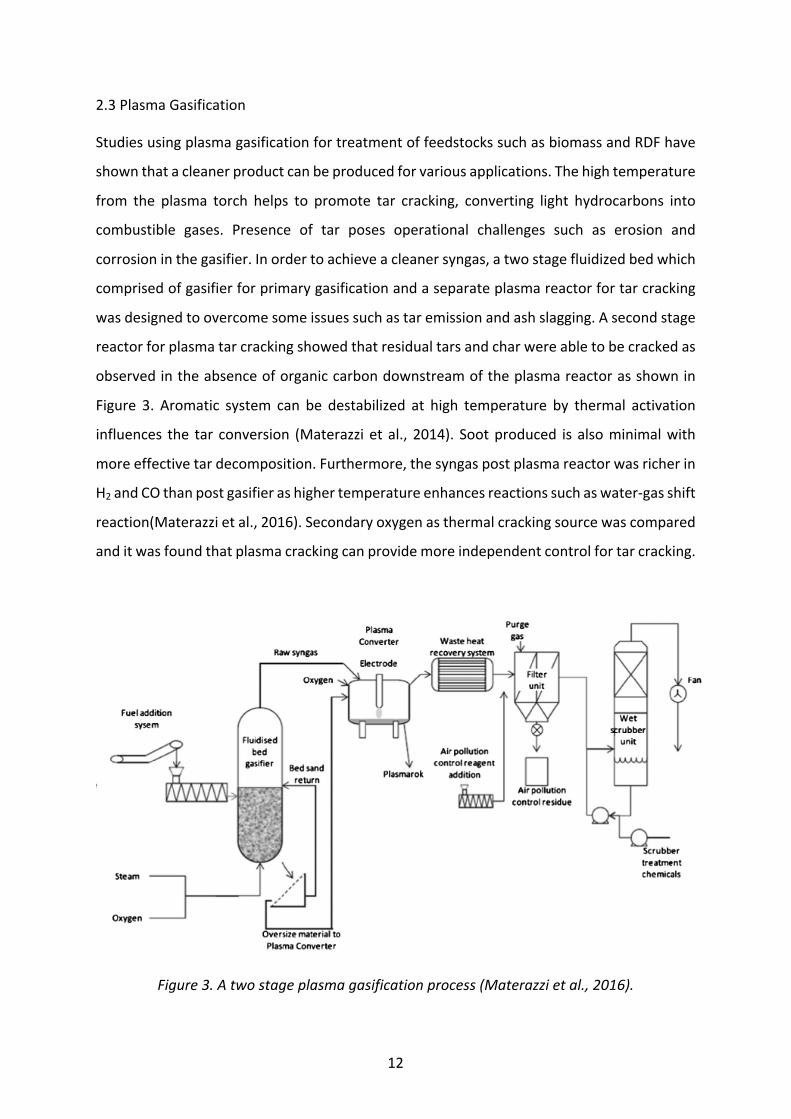
2.3PlasmaGasification
StudiesusingplasmagasificationfortreatmentoffeedstockssuchasbiomassandRDFhave
shownthatacleanerproductcanbeproducedforvariousapplications.Thehightemperature
from the plasma torch helps to promote tar cracking, converting light hydrocarbons into
combustible gases. Presence of tar poses operational challenges such as erosion and
corrosioninthegasifier.Inordertoachieveacleanersyngas,atwostagefluidizedbedwhich
comprisedofgasifierforprimarygasificationandaseparateplasmareactorfortarcracking
wasdesignedtoovercomesomeissuessuchastaremissionandashslagging.Asecondstage
reactorforplasmatarcrackingshowedthatresidualtarsandcharwereabletobecrackedas
observedintheabsenceoforganiccarbondownstreamoftheplasmareactorasshownin
Figure 3. Aromatic system can be destabilized at high temperature by thermal activation
influences the tar conversion (Materazzietal., 2014). Sootproduced is alsominimalwith
moreeffectivetardecomposition.Furthermore,thesyngaspostplasmareactorwasricherin
H2andCOthanpostgasifierashighertemperatureenhancesreactionssuchaswater-gasshift
reaction(Materazzietal.,2016).Secondaryoxygenasthermalcrackingsourcewascompared
anditwasfoundthatplasmacrackingcanprovidemoreindependentcontrolfortarcracking.
Figure3.Atwostageplasmagasificationprocess(Materazzietal.,2016).
Page 18
13
AtestreactorwasusedtoassessplasmagasificationofRDFconsistedofpaper,wood,plastic
andorganicmaterialwhichwerepelletized for feeding into the system.Plasma torchcan
preventtemperaturefluctuationsfromthetimedependentexothermicreactionsbyallowing
independentcontrolofheatinput.Slagproducedfromthereactorwasalsotestedandwas
determined to be suitable as secondary building materials according to Flemish
legislation(Lemmensetal.,2007).
TheGasplasmaprocess, a two-stage thermal treatment system for thermal conversionof
wastedevelopedbyAdvancedPlasmaPowerwassimulatedinASPENPlusforvariouswaste
materialssuchaslandfillminedwaste,MSWandindustrial.Syngasexitingplasmaconverter
showed negligible content of benzene which can be a good indicator for tar removal
effectiveness.Calcia-alumina-silicarichslagasobtainedfromtheirgasificationprocesswent
throughleachingteststoinvestigatesuitabilityasaggregatematerialsanditwasfoundthat
pollutantlevelswerefarbelowhazardouslimit(Rayetal.,2012).
Plasmagasification is seen tohave thepotential to treat solidwastebecauseofability to
drasticallyreducewastevolumeandharmfulimpuritiesthusisbeingusedforvarioussolid
wastefromdifferentsources.Syngasproducedfromplasmagasificationofsolidwastefor
highpurityH2productionsinaH2recoverysystem.Dioxinslevelmeasurementswellbelow
regulatory standards of Korea, USA and EU indicated that plasma treatmentwas able to
decomposeorganicscontainedinwaste.Carbonconversionefficiencyof97%wasachieved
suggestingthatplasmatreatmentcanbeefficientintreatmentofwaste(Byunetal.,2011).
DCplasmatorchwithH2O/Arwasusedforplasmagasificationofbiomassandwasteresulted
insyngaswithhighcontentofH2andCOandnegligibletarcontent.Sufficientresidencetime
andoptimumtemperatureinthereactorleadtolowCO2concentrationdespiteCO2being
used as oxidizing agent (Hlina et al., 2014). Plasma gasification application was also
investigatedontreatmentof solidwaste fromUnitedStatesAirForceBasicExpeditionary
Airfield Resources Base in a small reactor where major products obtained are H2 and
CO(Vaidyanathanetal.,2007).MixtureofMSWandrawwoodarepre-treatedusingsteam
Page 19
14
mechanicalheattreatment(SMHT)wereusedafeedstockforaplasmagasificationreactor.
TheSMHTturnedMSWintorefusedderivedbiomass,andmixturewithrawwoodresultedin
acompost-likeformwhichismoresuitableforgasification(Shieetal.,2014).Studyshowed
thatincreaseintemperatureandadditionofsteamcontributedtotheincreaseofH2yield
whichsubsequentlyincreasedtheenergyyieldofsyngas.
2.4TarCracking
BesidesthemainproductgasessuchasCOandH2,gasificationalsoresultsintarswhichcould
jeopardizetheprocessbyproblemssuchaserosionandcorrosiononturbinesandengines
thusmakingsyngasthatisproducedfromagasificationprocessundesirablefordirectusage.
C10H8andC7H8werechosentorepresent tarcompounds inastudytomodel thethermal
removaloftarsathightemperatureusingplasmatorch.Tarcrackingmodelisasshownin
Figure 4. Themathematicalmodelwas based on a CSTRmodel that considered different
kinetics of tar cracking process. Comparison between equilibriummodel that is basedon
Gibbsenergyminimizationmethodandkineticmodelshowedthattarconversionwasnear
completion forbothcases.Sensitivityanalysison influenceof incomingtemperature from
gasifier showed that increase in gas temperature from gasifier would increase the
temperatureofgasexitingtarreactor.Tarcompositioncanaffectthecompositionofsyngas,
anditwasshownatdifferentoverallC10H8contentwhereathighercontentledtoarisein
CO and H2 composition. However, it also increases the soot content in the output gas
(Fourcaultetal.,2010).
Page 20
15
Figure4.TarCrackingModel(Fourcaultetal.,2010).
AnotherstudyontarthermalcrackingusingaCSTRmodelalsopredictedsimilaroutcomeof
tarconversionofC10H8andC7H8taking inaccountreactionkinetics.Thestudyshownthat
increasedinplasmatorchpowernotonlyincreasedtarconversionbutalsoincreasedtheLHV
ofthesyngas.CharparticlesconsideredinthismodelalsocontributedhighercontentofCO
andH2.OverFiringAiradditionalsoenhancedtarconversionbutaffectsthetemperaturedue
torise inoxidation,decrease inLHVand increaseofsootcontent insyngas(Mariasetal.,
2016).
AtwostageFluidizedBedplasmagasificationprocesswasusedtostudytarevolutionusing
RDFasfeedstock.Comparisonoftarcontentpost-FluidizedBedGasifierandpost-plasmatar
reactor showed high conversion of tar, where in equilibrium model showed complete
conversionwhileplasmathermalmodelshowedbetween95–99%conversionofdifferent
tar compounds (Materazzi et al., 2014). The system showed an effective method of gas
cleaning,higherconversionofcarbonandhigheryieldofCOandH2.
Page 21
16
2.5Melting
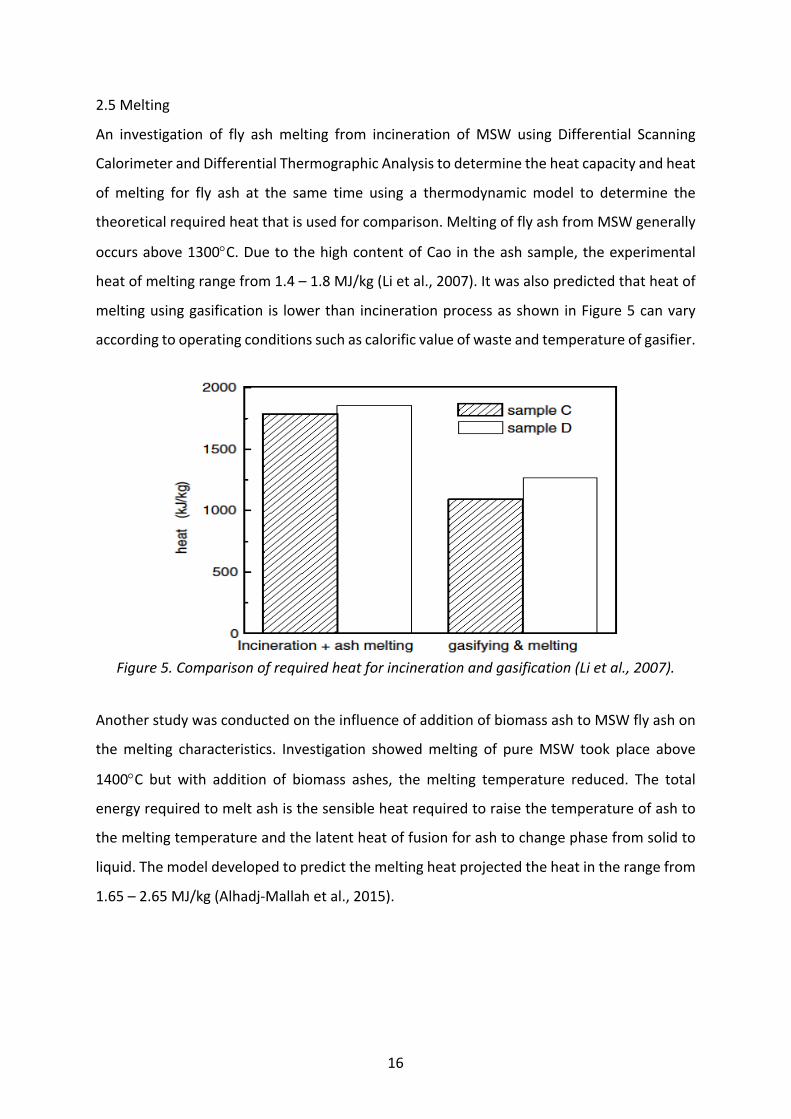
An investigation of fly ashmelting from incineration ofMSW using Differential Scanning
CalorimeterandDifferentialThermographicAnalysistodeterminetheheatcapacityandheat
ofmelting for fly ash at the same time using a thermodynamicmodel to determine the
theoreticalrequiredheatthatisusedforcomparison.MeltingofflyashfromMSWgenerally
occursabove1300°C.DuetothehighcontentofCaointheashsample,theexperimental
heatofmeltingrangefrom1.4–1.8MJ/kg(Lietal.,2007).Itwasalsopredictedthatheatof
meltingusinggasification is lowerthan incinerationprocessasshowninFigure5canvary
accordingtooperatingconditionssuchascalorificvalueofwasteandtemperatureofgasifier.
Figure5.Comparisonofrequiredheatforincinerationandgasification(Lietal.,2007).
AnotherstudywasconductedontheinfluenceofadditionofbiomassashtoMSWflyashon
themelting characteristics. Investigation showedmelting of pureMSW took place above
1400°C but with addition of biomass ashes, themelting temperature reduced. The total
energyrequiredtomeltashisthesensibleheatrequiredtoraisethetemperatureofashto
themeltingtemperatureandthelatentheatoffusionforashtochangephasefromsolidto
liquid.Themodeldevelopedtopredictthemeltingheatprojectedtheheatintherangefrom
1.65–2.65MJ/kg(Alhadj-Mallahetal.,2015).
Page 22
17
3.METHODOLOGY
3.1PlasmaGasificationProcess
Aplasmagasificationcomprisedofafixedbedupdraftgasifierandaplasmatarreactorwas
developedbyScanArcPlasmaTechnologiesABinHofors,Swedenusedtotreatsolidwasteis
showninFigure6.Solidwasteisfedfromthetopofthegasifierwhilepreheatedairorsteam
asgasifyingagentisfedfromthebottomsideofthereactor.Theproductfromgasifierwhich
containsvolatilegases,moistureandtargoestoaseparateplasmatarreactorwhereahigh
temperatureplasmaisusedfortarcracking.Acleansyngasisproductattheendwhichis
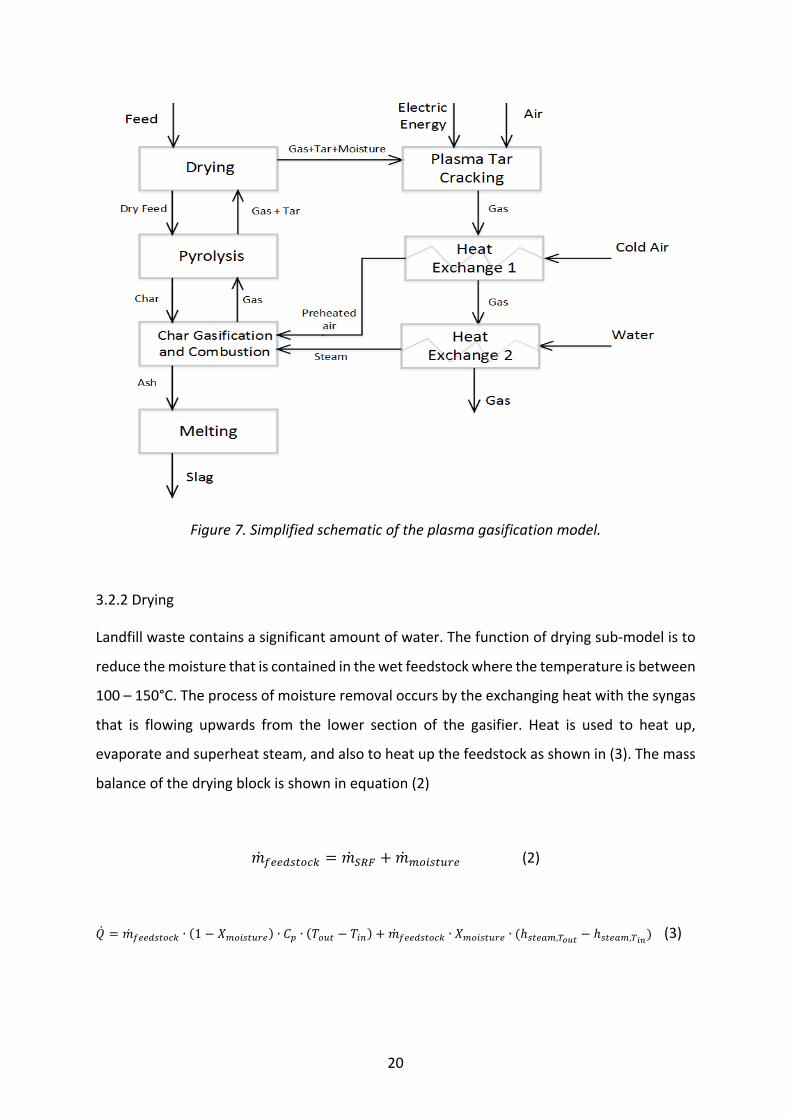
suitableforvariousapplications.Meanwhile,asimplifiedschemeofthemodelisshownin
Figure7,whichwillbeusedfordevelopmentoftheASPENPlusmodel.
Figure6.Schematicoftwostageplasmagasificationmodel.
Page 23
18
3.2PlasmaGasificationModel
3.2.1Feedstockproperties
The feedstock used for the purpose of this study is excavationwaste from a landfill site
locatedatMont-Saint-Guibert,Belgium.Thewastewasprocessedbysorting,screeningand
millingthatresultedinapowder-likefractionthatconsistsofRDFandinertmaterials.The
compositionoftheRDFisshowninTable1whiletheultimateandproximateanalysesare
showninTable2.
Table1.MaterialCompositionofRDF
Component,wt%
Plastics 21.46
Wood 11.90
Paperandcardboard 2.38
Textilesandfibres 0.94
Combustiblefraction 21.15
Metals 5.49
Inert(soil,glass,etc.) 36.69
Page 24
19
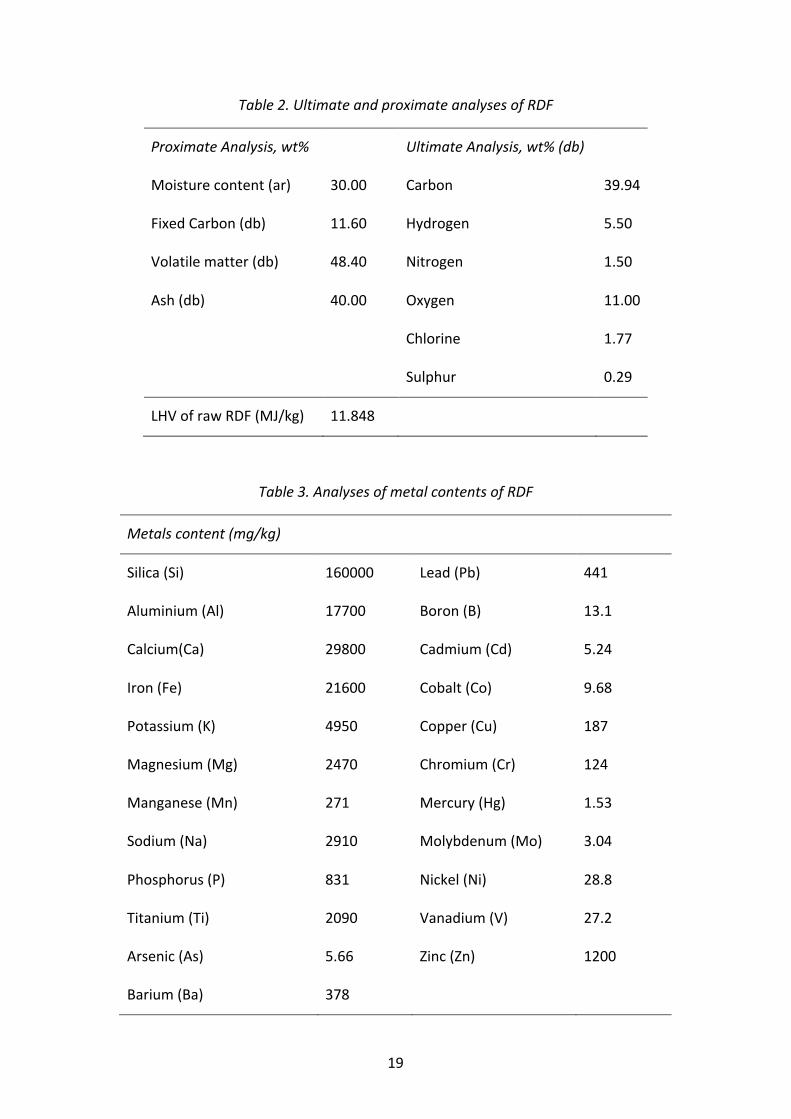
Table2.UltimateandproximateanalysesofRDF
ProximateAnalysis,wt% UltimateAnalysis,wt%(db)
Moisturecontent(ar) 30.00 Carbon 39.94
FixedCarbon(db) 11.60 Hydrogen 5.50
Volatilematter(db) 48.40 Nitrogen 1.50
Ash(db) 40.00 Oxygen 11.00
Chlorine 1.77
Sulphur 0.29
LHVofrawRDF(MJ/kg) 11.848
Table3.AnalysesofmetalcontentsofRDF
Metalscontent(mg/kg)
Silica(Si) 160000 Lead(Pb) 441
Aluminium(Al) 17700 Boron(B) 13.1
Calcium(Ca) 29800 Cadmium(Cd) 5.24
Iron(Fe) 21600 Cobalt(Co) 9.68
Potassium(K) 4950 Copper(Cu) 187
Magnesium(Mg) 2470 Chromium(Cr) 124
Manganese(Mn) 271 Mercury(Hg) 1.53
Sodium(Na) 2910 Molybdenum(Mo) 3.04
Phosphorus(P) 831 Nickel(Ni) 28.8
Titanium(Ti) 2090 Vanadium(V) 27.2
Arsenic(As) 5.66 Zinc(Zn) 1200
Barium(Ba) 378
Page 25
20
Figure7.Simplifiedschematicoftheplasmagasificationmodel.
3.2.2Drying
Landfillwastecontainsasignificantamountofwater.Thefunctionofdryingsub-modelisto
reducethemoisturethatiscontainedinthewetfeedstockwherethetemperatureisbetween
100–150°C.Theprocessofmoistureremovaloccursbytheexchangingheatwiththesyngas
that is flowing upwards from the lower section of the gasifier. Heat is used to heat up,
evaporateandsuperheatsteam,andalsotoheatupthefeedstockasshownin(3).Themass
balanceofthedryingblockisshowninequation(2)
𝑚+,,-./012 = 𝑚456 + 𝑚809./:;,(2)
𝑄 = 𝑚+,,-./012 ∙ 1 − 𝑋809./:;, ∙ 𝐶B ∙ 𝑇0:/ − 𝑇9D + 𝑚+,,-./012 ∙ 𝑋809./:;, ∙ (ℎ./,G8,IJKL − ℎ./,G8,IMN)(3)
Page 26
21
3.2.3Pyrolysis
Pyrolysisalsoknownasde-volatilizationoccursbyheatingwithoutpresenceofoxygenthat
leadstodecompositionintotwomaincomponents,namelyvolatilematterandchar.Volatile
matter considered as shown in (4) consists of mainly gases such as𝐻Q, 𝐶𝑂, 𝐶𝑂Q, 𝐶𝐻S , tar
(𝐶TU𝐻V,𝐶W𝐻V,𝐶X𝐻X),whilecharisprimarilyfixedcarbonandash,wherecompositioncanbe
obtained from proximate and ultimate analysis of landfill waste. Process of pyrolysis is
sustainedbyheatfluxfromthegasificationatthelowerpartofgasifier.Thesub-modelfor
pyrolysiscanbewritteninaone-stepglobalreaction(4).
𝑅𝐷𝐹 → 𝐺𝑎𝑠(𝐻Q, 𝐶𝑂, 𝐶𝑂Q, 𝐶𝐻S, 𝐻𝐶𝑙, 𝐻Q𝑆) + 𝑇𝑎𝑟(𝐶TU𝐻V,𝐶W𝐻V,𝐶X𝐻X) + 𝐶ℎ𝑎𝑟(4)
Itisexpectedthatthetemperatureofupperzoneishighthustarcanexitthegasifierasvapor
andenterthetarcrackingreactor.
3.2.4CharCombustionandGasification
Theprocessofdryingandpyrolysisresultincharasaproductandcharisbeingtreatedas
fixedcarbonandash.Charwillundergogasificationandpartialcombustioninthepresence
ofairasgasifyingagenttoform𝐶𝑂and𝐶𝑂Q.Partialcombustionisrequiredasgasification
reactionsbeingexothermicreactionswillsupplytherequiredheatfordrying,pyrolysisand
meltingprocess.Reactionsconsideredinairgasificationareshownintable4.Thisprocess
willapplytheGibbsfreeenergytheorywherephaseandchemicalequilibriumisassumed
becauseof thehigh temperature fromthechar combustion.Change inGibbs freeenergy
definesifareactionisspontaneousorotherwise.WhentryingtodetermineGibbsfreeenergy
atafixedtemperatureandpressure,itcanbewrittenas(5).Inordertoobtainequilibrium
composition,Gibbsfreeenergyhastobeminimizedandfinallyachieve(6).
𝑑𝐺.d./,8 = 𝑑𝐻.d./,8 − 𝑇𝑑𝑆.d./,8(5)
𝑑𝐺.d./,8 = 0(6)
Page 27
22
Table4.Charcombustionandgasificationreactionsconsidered.
Reactions Type
R1 𝐶 + 𝐶𝑂Q → 2𝐶𝑂(Boudouardreaction) Endothermic
R2 𝐶 + 𝑂Q → 𝐶𝑂Q(Combustion) Exothermic
R3 𝐶 + 0.5𝑂Q → 𝐶𝑂(Combustion) Exothermic
3.2.5Melting
Ashproduced fromchar gasification consistsof inorganic componentsof the feedstock is
melted by the heat from partial oxidation process. The high temperature obtained from
combustionissufficienttomelttheashintoslagthatflowsoutatthebottomofthegasifier.
Ashcanbeassumedtoconsistsof70%𝑆𝑖𝑂Q,13%𝐶𝑎𝑂,9%𝐹𝑒Q𝑂k8%𝐴𝑙Q𝑂k,according to
metalcontentsinTable3.Heatcapacityofashcanbecalculatedaccordingtoequation(7)
(Zhangetal.,2013)andLatentheatof fusionofash isalsocalculated inasimilarmanner
basedonvaluesfrom(Fontetal.,2017),(Lietal.,2007),(Patnaik,2003).
𝑐B,G.n = 𝑥9𝑐B,9D9pT (7)
3.2.6PlasmaTarCracking
Tar inthefixedbedupdraftgasifier iscarriedoverfromthegasifiertotheplasmareactor
alongwiththegasesproducedfrompyrolysisandchargasificationprocess.Inthepyrolysis
processattemperaturerange200–500°C,tarisproducedandleavesupwardsintocooler
regionsabovewhileexchangingheatwiththefeedstock,thusconversionoftarintogasesis
low,thushighamountoftarispresentinthegas(ValderramaRiosetal.,2018).Inthismodel,
3majorcompoundsof tarswhicharenaphthalene, toluene,andbenzeneareconsidered.
Naphthalenewas selected since it is often found asmain compound in tertiary tar from
biomassandwastegasificationand it isdifficult tocrackdue to its structureasPolycyclic
Aromatic Hydrocarbon. For benzene, it is commonly used to represent primary tarwhile
Page 28
23
Tolueneformedathightemperaturehasastablearomaticstructurefoundintars(Mariaset
al., 2016). Due to very high temperature of plasma, it is assumed that reaction reaches
equilibrium very fast. Products are obtained by minimizing Gibbs energy. Reactions
consideredinthetarcrackingreactorareshowninTable5wheremodelwasalsobasedona
fixedbedreactor.
Table5.Reactionsconsideredfortarcracking.
Reaction References
R4 𝐶TU𝐻V + 4𝐻Q𝑂 → 4𝐶𝑂 + 5𝐻Q (Jess,1996)
R5 𝐶W𝐻V + 𝐻Q → 𝐶X𝐻X + 𝐶𝐻S (Jess,1996)
R6 𝐶X𝐻X + 5𝐻Q𝑂 → 5𝐶𝑂 + 6𝐻Q + 𝐶𝐻S (Virketal.,1974)
R7 𝐶𝐻S + 𝐻Q𝑂 → 𝐶𝑂 + 3𝐻Q (Nozahic,2008)
R8 𝐻Q +12𝑂Q → 𝐻Q𝑂
(Turns,1996)
R9 𝐶𝑂 +12𝑂Q → 𝐶𝑂Q
(PetersenandWerther,2005)
R10 𝐶𝑂 + 𝐻Q𝑂 → 𝐶𝑂Q + 𝐻Q (PetersenandWerther,2005)
R11 𝐶𝑂Q + 𝐻Q → 𝐶𝑂 + 𝐻Q𝑂 (PetersenandWerther,2005)
R12 𝐶𝐻S + 2𝑂Q → 𝐶𝑂Q + 2𝐻Q𝑂 (PetersenandWerther,2005)
R13 𝐶𝐻S +12𝑂Q → 𝐶𝑂 + 2𝐻Q
(Turns,1996)
R14 𝐶X𝐻X +152𝑂Q → 6𝐶𝑂Q + 4𝐻Q𝑂
(Turns,1996)
R15 𝐶X𝐻X + 3𝑂Q → 6𝐶𝑂 + 3𝐻Q (PetersenandWerther,2005)
R16 𝐶W𝐻V + 9𝑂Q → 7𝐶𝑂Q + 4𝐻Q𝑂 (Turns,1996)
Page 29
24
Figure8.FlowsheetofplasmagasificationprocessinAspenPlus.
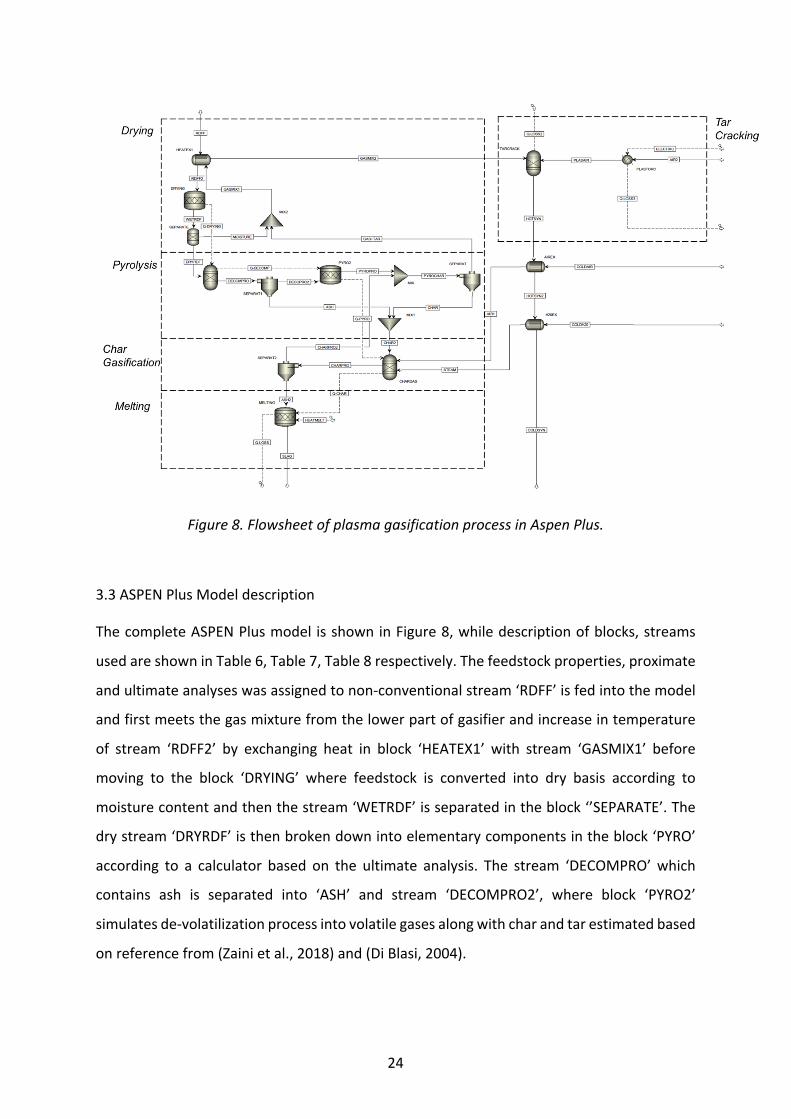
3.3ASPENPlusModeldescription
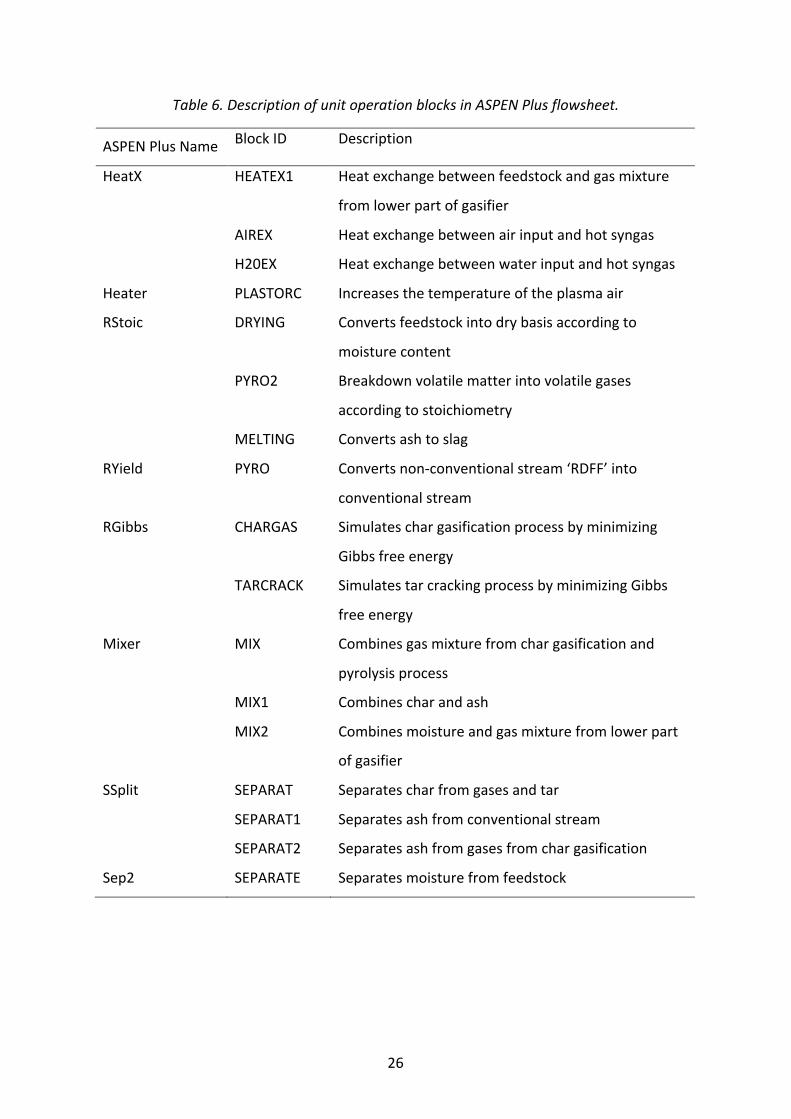
ThecompleteASPENPlusmodel isshowninFigure8,whiledescriptionofblocks,streams
usedareshowninTable6,Table7,Table8respectively.Thefeedstockproperties,proximate
andultimateanalyseswasassignedtonon-conventionalstream‘RDFF’isfedintothemodel
andfirstmeetsthegasmixturefromthelowerpartofgasifierandincreaseintemperature
of stream ‘RDFF2’ by exchanging heat in block ‘HEATEX1’ with stream ‘GASMIX1’ before
moving to the block ‘DRYING’ where feedstock is converted into dry basis according to
moisturecontentandthenthestream‘WETRDF’isseparatedintheblock‘’SEPARATE’.The
drystream‘DRYRDF’isthenbrokendownintoelementarycomponentsintheblock‘PYRO’
according to a calculator based on the ultimate analysis. The stream ‘DECOMPRO’which
contains ash is separated into ‘ASH’ and stream ‘DECOMPRO2’, where block ‘PYRO2’
simulatesde-volatilizationprocessintovolatilegasesalongwithcharandtarestimatedbased
onreferencefrom(Zainietal.,2018)and(DiBlasi,2004).
Page 30
25
Heatstreamsfordrying‘Q-DRYING’,decomposition‘Q-DECOMP’,pyrolysis‘Q-PYRO’andchar
gasification ‘Q-CHAR’ are connected between blocks to contain the enthalpy within the
system as source of heat for each process are dependent on the char combustion and
gasificationprocess.Thestreams‘ASH’and‘CHAR’separatedfromtheblock‘SEPARAT’goes
intotheGibbsblock‘CHARGAS’forcharcombustionandgasificationprocesswithgasifying
agent‘AIR1’ofwhichitsmassflowrateiscalculatedbasedonaspecificERthatiswithinthe
rangeoftypicalgasificationprocessandabletosupplysufficientheatfordrying,pyrolysis,
andmeltingwhiletakingintoaccounttheheatlossfromthegasifierstream‘Q-LOSS’.
Productofcharcombustionandgasification‘CHARPRO’containingashisseparatedinblock
‘SEPARAT2’wherestream‘ASH2’goingtothe‘MELTING’block.Productgasesonlystream
‘CHARPRO2’moves up the gasifier andmeet with stream ‘PYROCHAR’. An external heat
streamisaddedtotheblock‘MELTING’becausethemeltingheatrequiredformeltingash
intoslagiscalculatedmanually.
Thestream‘GASMIX2’goesintotheGibbsblock‘TARCRACK’forplasmatarcrackingprocess
withplasmaairheatedwithheatinput‘ELECTRIC’consideringaheatlossstream‘Q-LOSS3’
attheblock‘PLASTORC’while‘Q-LOSS2’istheheatlossfromthetarcrackingreactorfrom
thesensibleheatoftheoutput.Theresultingproductstream‘HOTSYN’proceedsforcooling
processatblock‘AIREX’whereenergylossisrecoveredtopreheatairforchargasification.
Theoutput‘HOTSYN2’thengoestotheblock‘H2OEX’toheatupwaterintosaturatedsteam
ifitisrequired.Thefinaloutputofsyngasstreamis‘COLDSYN’.
Page 31
26
Table6.DescriptionofunitoperationblocksinASPENPlusflowsheet.
ASPENPlusName BlockID Description
HeatX HEATEX1 Heatexchangebetweenfeedstockandgasmixture
fromlowerpartofgasifier
AIREX Heatexchangebetweenairinputandhotsyngas
H20EX Heatexchangebetweenwaterinputandhotsyngas
Heater PLASTORC Increasesthetemperatureoftheplasmaair
RStoic DRYING Convertsfeedstockintodrybasisaccordingto
moisturecontent
PYRO2 Breakdownvolatilematterintovolatilegases
accordingtostoichiometry
MELTING Convertsashtoslag
RYield PYRO Convertsnon-conventionalstream‘RDFF’into
conventionalstream
RGibbs CHARGAS Simulateschargasificationprocessbyminimizing
Gibbsfreeenergy
TARCRACK SimulatestarcrackingprocessbyminimizingGibbs
freeenergy
Mixer MIX Combinesgasmixturefromchargasificationand
pyrolysisprocess
MIX1 Combinescharandash
MIX2 Combinesmoistureandgasmixturefromlowerpart
ofgasifier
SSplit SEPARAT Separatescharfromgasesandtar
SEPARAT1 Separatesashfromconventionalstream
SEPARAT2 Separatesashfromgasesfromchargasification
Sep2 SEPARATE Separatesmoisturefromfeedstock
Page 32
27
Table7.AspenPlusmaterialstreams.
ASPENPlusStream StreamID Description
Material RDFF FeedstockflowRDF
RDFF2 HeatexchangeofRDFwithgasflow
WETRDF RDFmoisturecalculationusingstoichiometry
DRYRDF DryRDFwithoutmoisture
MOISTURE MoistureremovedfromRDF
DECOMPRO RDFdecomposedintoelementsaccordingtoproximate
andultimateanalysis
DECOPRO2 AshisseparatedfromdecomposedRDF
ASH Separatedashfromdecomposition
PYROPRO Productsformfrompyrolysisaccordingtostoichiometry
basedonexperiment
PYROCHAR Mixtureofgasesfrompyrolysisandchargasification
CHAR Charseparatedfromgasmixture
CHAR2 Mixtureofashandchar
CHARPRO Productfromchargasificationandcombustion
CHARPRO2 Chargasproductwithashseparated
ASH2 Ashseparatedfromchargases
SLAG Slagfrommeltedash
GAS+TAR Mixtureofgasesfrompyrolysisandchargasification
GASMIX1 Mixtureofgasesandmoisture
GASMIX2 GasmixesheatingincomingRDF
PLASAIR Heatedcarriergasforplasmaconverter
AIR2 Carriergasforplasmaconverter
COLDAIR Airinputforchargasificationandcombustion
AIR1 Preheatedairforchargasificationandcombustion
COLDH2O Waterinputforsteamgasificationwhenrequired
HOTSYN Productgasfromtarcracking
HOTSYN2 Productgasafterheatexchangeforpreheatedair
COLDSYN Productgasafterheatexchangewithwater
Page 33
28
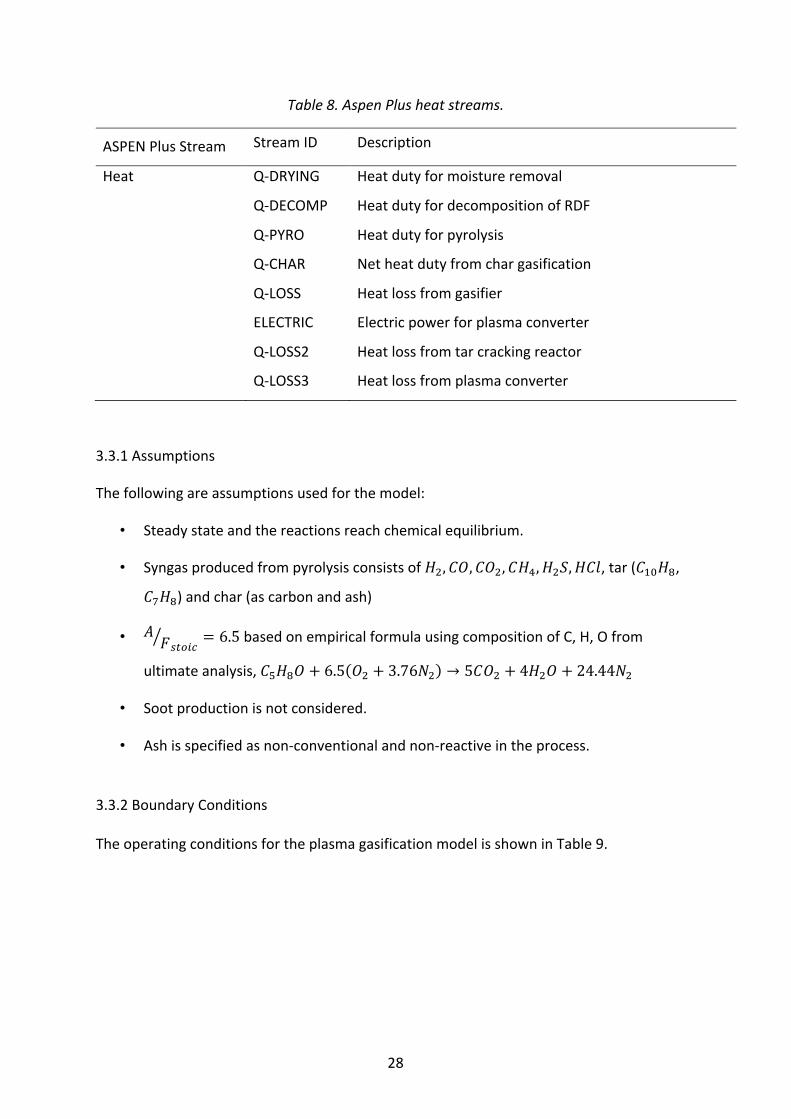
Table8.AspenPlusheatstreams.
ASPENPlusStream StreamID Description
Heat Q-DRYING Heatdutyformoistureremoval
Q-DECOMP HeatdutyfordecompositionofRDF
Q-PYRO Heatdutyforpyrolysis
Q-CHAR Netheatdutyfromchargasification
Q-LOSS Heatlossfromgasifier
ELECTRIC Electricpowerforplasmaconverter
Q-LOSS2 Heatlossfromtarcrackingreactor
Q-LOSS3 Heatlossfromplasmaconverter
3.3.1Assumptions
Thefollowingareassumptionsusedforthemodel:
• Steadystateandthereactionsreachchemicalequilibrium.
• Syngasproducedfrompyrolysisconsistsof𝐻Q, 𝐶𝑂, 𝐶𝑂Q, 𝐶𝐻S, 𝐻Q𝑆, 𝐻𝐶𝑙,tar(𝐶TU𝐻V,
𝐶W𝐻V)andchar(ascarbonandash)
• 𝐴𝐹./091 = 6.5basedonempiricalformulausingcompositionofC,H,Ofrom
ultimateanalysis,𝐶v𝐻V𝑂 + 6.5 𝑂Q + 3.76𝑁Q → 5𝐶𝑂Q + 4𝐻Q𝑂 + 24.44𝑁Q
• Sootproductionisnotconsidered.
• Ashisspecifiedasnon-conventionalandnon-reactiveintheprocess.
3.3.2BoundaryConditionsTheoperatingconditionsfortheplasmagasificationmodelisshowninTable9.
Page 34
29
Table9.Boundaryconditionsforplasmagasificationmodel.
RDFFeed(kg/hr) Flowrate(kg/hr) 1000 Pressure(bar) 1 Temperature(K) 298GasificationAir,𝑀yG.9G9; Flowrate(kg/hr) 1325.88 Pressure(bar) 1 Temperature(K) 873 EquivalenceRatio 0.208Gasifier Pressure(bar) 1 Temperature(K) 423-1773PlasmaAir,𝑀BzG.8GG9; Flowrate(kg/hr) 406.89 Pressure(bar) 1 Temperature(K) 298PlasmaTorch Power(kW) 500HeatLoss(%) ShaftGasifier 5 TarCrackingReactor 5 PlasmaConverter 30
3.4ParameterStudies
TwodifferentparameterswereinvestigatedusingtheASPENPlusmodel,namelyairflowrate
andpreheatedairtemperature,whichisshowninTable10.Dimensionlessnumberisusedto
betterrepresentthestudiedparameterofairflowrate.Amountofactualairperkilogramof
RDFcomparedtothestoichiometricamountcanberepresentedasequivalenceratio(ER):
𝐸𝑅 = |}~�M~M�/����
(|}~�M~M�/����)�LJM�(1)
Page 35
30
Table10.ParametersthatwerestudiedintheASPENPlusmodel.
EffectofEREffectofPreheated
AirTemperature
GasificationAir,𝑀yG.9G9; (kg/h) 1300-1950 1325.88
PlasmaAir,𝑀BzG.8GG9; (kg/h) 406.88 406.88
PreheatedAirTemperature,𝑇B;,n,G/G9; (K) 873 373-1173
Plasmapower,𝑃BzG.8G(kW) 500 500
DimensionlessParameters
ER 0.2–0.3 0.208
Page 36
31
4.RESULTSANDDISCUSSION
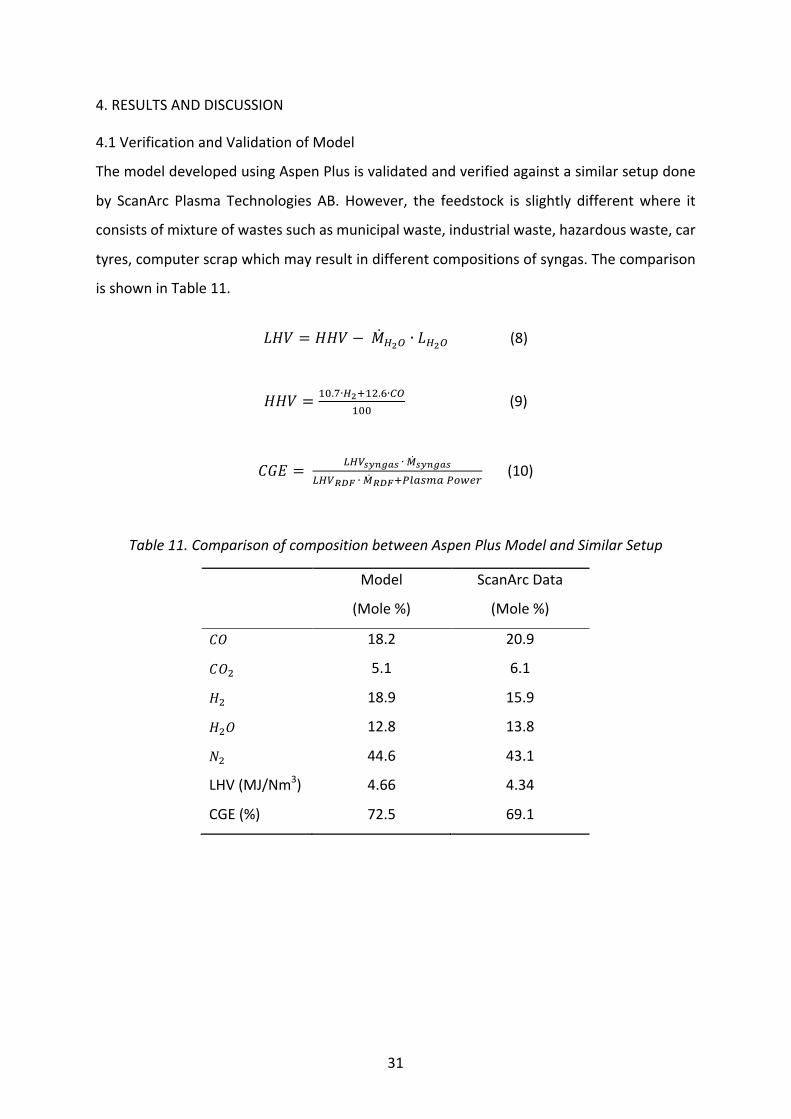
4.1VerificationandValidationofModel
ThemodeldevelopedusingAspenPlusisvalidatedandverifiedagainstasimilarsetupdone
by ScanArc Plasma Technologies AB.However, the feedstock is slightly differentwhere it
consistsofmixtureofwastessuchasmunicipalwaste,industrialwaste,hazardouswaste,car
tyres,computerscrapwhichmayresultindifferentcompositionsofsyngas.Thecomparison
isshowninTable11.
𝐿𝐻𝑉 = 𝐻𝐻𝑉 −𝑀��� ∙ 𝐿���(8)
𝐻𝐻𝑉 = TU.W∙���TQ.X∙��TUU
(9)
𝐶𝐺𝐸 = �����N}~�∙|��N}~�������∙|�����zG.8G�0�,;
(10)
Table11.ComparisonofcompositionbetweenAspenPlusModelandSimilarSetup
Model
(Mole%)
ScanArcData
(Mole%)
𝐶𝑂 18.2 20.9
𝐶𝑂Q 5.1 6.1
𝐻Q 18.9 15.9
𝐻Q𝑂 12.8 13.8
𝑁Q 44.6 43.1
LHV(MJ/Nm3) 4.66 4.34
CGE(%) 72.5 69.1
Page 37
32
4.1.1SyngasCompositionPreandPostTarCracking
Figure9showsthecomparisonbetweenthegascompositionbeforeandafterthetarcracking
reactor.ThefigureshowedthatbothH2andCO2increasedfrom16.96%to18.90%and3.57%
to5.05%respectivelywhileCOandH2Ofellfrom18.64%to18.24%and15.54%to12.80%
correspondingly.BothCH4andtarcompoundsarecompletelyconverted.TheriseofH2 is
attributedtotheconversionoftarcompoundsaccordingto(R4),(R6),(R7),(R15),(R16)from
Table5.Thissuggeststhatplasmatarcrackingoflighthydrocarbonsuchastarcompoundsis
beneficial shouldasyngasofhigherH2yield isdesiredbesidescleanersyngasthatcanbe
utilisedwithoutmuchposttreatmentofsyngas.Bythesametoken,thedeclineinH2Ocould
berelatedtothedecompositionoftarcompoundsbymoistureinthegasthatexistassteam,
thus contributing to the increment of H2 during tar cracking. This is consistent with the
findings by (Materazzi et al., 2016). On the other hand, the drop in CO and rise in CO2
contradictswiththefindingsof(Materazzietal.,2014).Thiscouldbeassociatedbythe(R10)
wheretheactivationenergyislowerthan(R11)accordingto(Fourcaultetal.,2010)andthe
excessairthatissuppliedasplasmaair.
Figure9.Comparisonbetweensyngascompositionbeforeandaftertarcracking.
0
5
10
15
20
H2 CO CO2 H2O CH4 TAR
Mole%
Pre-TarCracking Post-TarCracking
Page 38
33
4.2MassandEnergyBalance
Amassandenergybalancefortheplasmagasificationmodelwasdoneasshownin.while
Table12showsthematerialbalanceforthesystemandTable13showstheenergybalance
ofthesystem.Meanwhile,aSankeydiagramshowingtheflowofenergyisillustratedinFigure
11andthedistributionofenergyoutputisshowninFigure12.Theplasmapowersuppliedas
aninputtothesystemwasabout13%ofthetotalenergyinputandtherestcamefromthe
RDF.Thechemicalenergyofsyngascomprisedof68.36%,thesensibleheatwas24.30%,total
heatlossincludingheatinslagwas7.34%.Thus,thisgivesthesystemathermalefficiencyof
about92%.
Figure10.MassandEnergyBalancediagramforplasmagasificationsystem.
Page 39
34
Table12.MassbalanceofAspenPlusmodel.
Input kg/h Output kg/h
RDF 1000 Syngas 2432.01
GasificationAir 1325.88 Slag 300.76
PlasmaAir 406.89
Total 2732.77 Total 2732.77
Table13.EnergybalanceofAspenPlusmodel.
Input MJ/h Output MJ/h
RDF 11848.00 Syngas(ChemicalEnergy) 9329.94
PlasmaPower 1800.00 SensibleHeatofGas 3316.25
Slag 65.77
HeatLosses
Gasifier 225.25
TarCrackingReactor 170.79
PlasmaConverter 540.00
Total 13648.00 Total 13648.00
Figure11.Sankeydiagramshowingflowofenergyforplasmagasificationsystem.
Page 40
35
Figure12.Piechartshowingdistributionofenergyoutput.
4.3ResultsofParameterStudies
4.3.1EffectofER
As defined according to equation (1), ER is the ratio of actual air-fuel ratio against the
stoichiometricair-fuelratioforcompletecombustion.Inthisstudy,ERwasvariedfrom0.2–
0.3, where𝑀yG.9G9; is varied from 1300 – 1950 kg/h at a fixed𝑇B;,n,G/G9; at 873K. The
influenceofERonthecompositionofsyngasisshowninFigure13andontheLHVandCGEis
shown in Figure14. It canbeobserved that as ER increased,CO2 content rosewhileCO
decreased.Thisoccurreddue to increasedcombustion reactionwhereCO2was favoured.
Similarly, for reduction of H2 content where oxidation was favoured, thus increased the
formation of H2O. The increase of overall N2 content was attributed by the increased in
𝑀yG.9G9;andbeinginert.ThedropinCOandH2,atthesametimedilutionofN2,causedthe
LHVofsyngasandsubsequentlyCGEtodecline.TheLHVrangedfrom3.15–4.73MJ/Nm3
whileCGErangedfrom53.64–72.95%.Similartrendswereshownby(Favasetal.,2017),
(Begumetal.,2014),(Beheshtietal.,2015).
Page 41
36
Figure13.EffectofincreasingERonsyngascompositionatT����������=873K
Figure14.EffectofincreasingERonLHVandCGE.
0
0.1
0.2
0.3
0.4
0.5
0.6
0.200 0.220 0.240 0.260 0.280 0.300
Syngasco
mpo
sition(M
oleFractio
n)
ER
H2 CO CO2 N2 H2O
2
2.5
3
3.5
4
4.5
5
40%
50%
60%
70%
80%
0.200 0.220 0.240 0.260 0.280 0.300
LHV(M
J/Nm
3)
CGE
ER
CGE LHV
Page 42
37
4.3.2EffectofPreheatedAirTemperature
Preheating air helps in increasing efficiency of gasifier by reducing energy required from
gasification.Thus,airinputorERcanbereducedallowingloweramountofpartialcombustion
whichmayleadtoincreasingamountofCO2.ReductioninERhelpsretainthesyngascalorific
valuewithinCO.Thepreheatedairtemperatureusedinthemodelis873K,whileairinputis
fixed at 1325.88 kg/h. Investigation on effect of𝑇B;,n,G/G9; on the model, the range of
temperaturefrom373–1173Kwasstudiedatthespecifiedflowrateforchargasificationand
combustion. Based on the boundary conditions fixed for the model, the heat of partial
combustionrequiredforallprocesseswasdeterminedandisplottedagainstthesensibleheat
frompreheatedairatthesaidrangeoftemperatureasshowninFigure15.Thegraphshows
thatas𝑇B;,n,G/G9;increases,theportionofheatrequiredfrompartialcombustionofchar
decreases,therebyloweringERfortheprocess.AsshowninFigure16,theminimumERat
higher𝑇B;,n,G/G9;decreases.Hence,thistranslatestoincreasingLHVandCGEasshownin
Figure17whereitshowstheminimumLHVandCGEforateach𝑇B;,n,G/G9;whichisableto
meettheheatdemandofgasification.Thisphenomenaisfoundtobesimilarwith(Mathieu
andDubuisson,2002)and(Dohertyetal.,2009).LHVwasfoundtobeintherangeof3.96–
5.03MJ/Nm3whileCGEwasintherangefrom64.19–76.25%.
Page 43
38
Figure15.Heatofpartialcombustionrequiredfromair(ER=0.208)atdifferentT����������
Figure16.GraphshowinglowestpossibleERatdifferentT����������.
0%
20%
40%
60%
80%
100%
0
200
400
600
800
1000
1200
373 473 573 673 773 873 973 1073 1173
HeatofP
artia
lCom
bustion(M
J/h)
PreheatedAirTemperature(K)
Hgasification Hpreheatedair
0.17
0.18
0.19
0.2
0.21
0.22
0.23
0.24
0.25
373 473 573 673 773 873 973 1073 1173
ER
PreheatedAirTemperature(K)
LowestER
Page 44
39
Figure17.EffectofT����������onLHVandCGEaccordingtolowestpossibleERateach
T����������.
60%
62%
64%
66%
68%
70%
72%
74%
76%
78%
3
3.5
4
4.5
5
5.5
273 473 673 873 1073 1273
CGE
LHV(M
J/Nm
3)
PreheatedAirTemperature(K)
LHV CGE
Page 45
40
5.CONCLUSION
Thereisnodoubtthatlandfillwastemayposeahugechallengeinalongrun.However,with
advancementoftechnology,aprocesssuchasplasmagasificationcouldbethekeyintackling
theissue.Nevertheless,continuousinvestigationoflandfillwasteisrequiredtoenhanceour
understandingonthesubject.Hence,ASPENPlusisagoodplatformtostudytheperformance
oflandfillwasteinaplasmagasificationprocesswhiletakingintoaccountmassandenergy
requirements.Thestudywasabletoprovideanestimateofmaterialandenergyinputsfor
the process. Composition of syngas obtained showed that the application of plasma tar
crackingwas able to achieve a cleaner gaswith a higherH2 content and reasonable LHV
despite RDF containing high amount of ash. Theoutcome also depends on the feedstock
composition.Limitationsofthemodelsuchasfixedoperatingtemperaturesofblocklimits
thecompositionchanges.Parameterstudyshowedthatsimilartoothersetupsofgasification,
alowerERismorefavourableforasyngaswithhigherLHV.Ontheotherhand,preheating
air by recovering heat from the output is advantageous from overall thermal efficiency
perspective and also reducing the heat required from partial combustion of char. In
conclusion, plasma gasification has potential in treating landfill waste at the same time
contributingtowardsthecirculareconomy.
Page 46
41
6.FUTUREWORK
Intermsofinputdata,duetolackofinformationoncharandtarcontent,bothcharandtar
contentwasbasedonliteraturestudies.However,bothcanbeaffectedbythepropertiesof
thefeedstock.Someactualexperimentaldatawouldgiveabetterestimationforthemodel.
From the aspect ofmodel, perhaps the char gasification and tar crackingmodels can be
performedusing kineticsmodel insteadof equilibriummodel and compare the results to
understandtheinfluenceofkinetics.Moreparameterscanbeinvestigatedusingthemodel,
suchaseffectofplasmapower,effectoftarcrackingtemperature.
Page 47
42
7.REFERENCEAbdelouahed,L.,Authier,O.,Mauviel,G.,Corriou,J.P.,Verdier,G.andDufour,A.(2012)
'DetailedModelingofBiomassGasificationinDualFluidizedBedReactorsunderAspenPlus',Energy&Fuels,26(6),pp.3840-3855.
Alhadj-Mallah,M.M.,Huang,Q.,Cai,X.,Chi,Y.andYan,J.(2015)'Vitrificationofmunicipalsolidwasteincinerationflyashusingbiomassashasadditives',EnvironTechnol,36(5-8),pp.654-60.
Begum,S.,Rasul,M.,Akbar,D.andCork,D.(2013)'AnExperimentalandNumericalInvestigationofFluidizedBedGasificationofSolidWaste',Energies,7(12),pp.43-61.
Begum,S.,Rasul,M.G.andAkbar,D.(2014)'ANumericalInvestigationofMunicipalSolidWasteGasificationUsingAspenPlus',ProcediaEngineering,90,pp.710-717.
Beheshti,S.M.,Ghassemi,H.andShahsavan-Markadeh,R.(2015)'Processsimulationofbiomassgasificationinabubblingfluidizedbedreactor',EnergyConversionandManagement,94,pp.345-352.
Bosmans,A.,Vanderreydt,I.,Geysen,D.andHelsen,L.(2013)'ThecrucialroleofWaste-to-Energytechnologiesinenhancedlandfillmining:atechnologyreview',JournalofCleanerProduction,55,pp.10-23.
Byun,Y.,Cho,M.,Chung,J.W.,Namkung,W.,Lee,H.D.,Jang,S.D.,Kim,Y.S.,Lee,J.H.,Lee,C.R.andHwang,S.M.(2011)'Hydrogenrecoveryfromthethermalplasmagasificationofsolidwaste',JHazardMater,190(1-3),pp.317-23.
Commission,E.2011.RoadmaptoaResourceEfficientEurope.COM(2011)571Final.Bruxelles:EUCommission.
DiBlasi,C.(2004)'Modelingwoodgasificationinacountercurrentfixed-bedreactor',AIChEJournal,50(9),pp.2306-2319.
Doherty,W.,Reynolds,A.andKennedy,D.(2009)'TheeffectofairpreheatinginabiomassCFBgasifierusingASPENPlussimulation',BiomassandBioenergy,33(9),pp.1158-1167.
Eikeland,M.S.,Thapa,R.K.andHalvorsen,B.M.'AspenPlusSimulationofBiomassGasificationwithKnownReactionKinetic',ProceedingsName,149-156.
Favas,J.,Monteiro,E.andRouboa,A.(2017)'Hydrogenproductionusingplasmagasificationwithsteaminjection',InternationalJournalofHydrogenEnergy,42(16),pp.10997-11005.
Font,F.,Afkhami,S.andKondic,L.(2017)'Substratemeltingduringlaserheatingofnanoscalemetalfilms',InternationalJournalofHeatandMassTransfer,113,pp.237-245.
Fourcault,A.,Marias,F.andMichon,U.(2010)'Modellingofthermalremovaloftarsinahightemperaturestagefedbyaplasmatorch',BiomassandBioenergy,34(9),pp.1363-1374.
Francois,J.,Abdelouahed,L.,Mauviel,G.,Patisson,F.,Mirgaux,O.,Rogaume,C.,Rogaume,Y.,Feidt,M.andDufour,A.(2013)'Detailedprocessmodelingofawoodgasificationcombinedheatandpowerplant',BiomassandBioenergy,51,pp.68-82.
Galeno,G.,Minutillo,M.andPerna,A.(2011)'Fromwastetoelectricitythroughintegratedplasmagasification/fuelcell(IPGFC)system',InternationalJournalofHydrogenEnergy,36(2),pp.1692-1701.
Page 48
43
Hlina,M.,Hrabovsky,M.,Kavka,T.andKonrad,M.(2014)'Productionofhighqualitysyngasfromargon/waterplasmagasificationofbiomassandwaste',WasteManag,34(1),pp.63-6.
Hogland,W.,Hogland,M.andMarques,M.'EnhancedLandfillMining:Materialrecovery,energyutilisationandeconomicsintheEU(Directive)perspective'.InternationalAcademicSymposiumonEnhancedLandfillMining.Houthalen-Helchteren,Belgiump,233-247.
Hogland,W.,Marques,M.andNimmermark,S.(2004)'Landfillminingandwastecharacterization:astrategyforremediationofcontaminatedareas',JournalofMaterialCyclesandWasteManagement,6(2).
Jani,Y.,Kaczala,F.,Marchand,C.,Hogland,M.,Kriipsalu,M.,Hogland,W.andKihl,A.(2016)'CharacterisationofexcavatedfinefractionandwastecompositionfromaSwedishlandfill',WasteManagRes,34(12),pp.1292-1299.
Jess,A.(1996)'Mechanismsandkineticsofthermalreactionsofaromatichydrocarbonsfrompyrolysisofsolidfuels',Fuel,75(12),pp.1441-1448.
Jones,P.T.,Geysen,D.,Tielemans,Y.,VanPassel,S.,Pontikes,Y.,Blanpain,B.,Quaghebeur,M.andHoekstra,N.(2013)'EnhancedLandfillMininginviewofmultipleresourcerecovery:acriticalreview',JournalofCleanerProduction,55,pp.45-55.
Kaartinen,T.,Sormunen,K.andRintala,J.(2013)'Casestudyonsampling,processingandcharacterizationoflandfilledmunicipalsolidwasteintheviewoflandfillmining',JournalofCleanerProduction,55,pp.56-66.
Kaushal,P.andTyagi,R.(2017)'AdvancedsimulationofbiomassgasificationinafluidizedbedreactorusingASPENPLUS',RenewableEnergy,101,pp.629-636.
Keche,A.J.,Gaddale,A.P.R.andTated,R.G.(2014)'SimulationofbiomassgasificationindowndraftgasifierfordifferentbiomassfuelsusingASPENPLUS',CleanTechnologiesandEnvironmentalPolicy,17(2),pp.465-473.
Lemmens,B.,Elslander,H.,Vanderreydt,I.,Peys,K.,Diels,L.,Oosterlinck,M.andJoos,M.(2007)'Assessmentofplasmagasificationofhighcaloricwastestreams',WasteManag,27(11),pp.1562-9.
Li,R.,Wang,L.,Yang,T.andRaninger,B.(2007)'InvestigationofMSWIflyashmeltingcharacteristicbyDSC-DTA',WasteManag,27(10),pp.1383-92.
Li,Y.,Zou,K.,Yang,T.,Li,R.andChi,Y.(2013)'CombustiblesolidwastegasificationgascharacteristicssimulationbasedonAspenPlus',JournalofRenewableandSustainableEnergy,5(5).
Marias,F.,Demarthon,R.,Bloas,A.andRobert-arnouil,J.P.(2016)'Modelingoftarthermalcrackinginaplasmareactor',FuelProcessingTechnology,149,pp.139-152.
Materazzi,M.,Lettieri,P.,Mazzei,L.,Taylor,R.andChapman,C.(2014)'Tarevolutioninatwostagefluidbed–plasmagasificationprocessforwastevalorization',FuelProcessingTechnology,128,pp.146-157.
Materazzi,M.,Lettieri,P.,Taylor,R.andChapman,C.(2016)'PerformanceanalysisofRDFgasificationinatwostagefluidizedbed-plasmaprocess',WasteManag,47(PtB),pp.256-66.
Mathieu,P.andDubuisson,R.(2002)'Performanceanalysisofabiomassgasifier',EnergyConversionandManagement,43(9-12),pp.1291-1299.
Mazzoni,L.,Ahmed,R.andJanajreh,I.(2017)'PlasmaGasificationofTwoWasteStreams:MunicipalSolidWasteandHazardousWastefromtheOilandGasIndustry',EnergyProcedia,105,pp.4159-4166.
Page 49
44
Mazzoni,L.andJanajreh,I.(2017)'Plasmagasificationofmunicipalsolidwastewithvariablecontentofplasticsolidwasteforenhancedenergyrecovery',InternationalJournalofHydrogenEnergy,42(30),pp.19446-19457.
Minutillo,M.,Perna,A.andDiBona,D.(2009)'Modellingandperformanceanalysisofanintegratedplasmagasificationcombinedcycle(IPGCC)powerplant',EnergyConversionandManagement,50(11),pp.2837-2842.
Monkare,T.J.,Palmroth,M.R.andRintala,J.A.(2016)'CharacterizationoffinefractionminedfromtwoFinnishlandfills',WasteManag,47(PtA),pp.34-9.
Nikoo,M.B.andMahinpey,N.(2008)'SimulationofbiomassgasificationinfluidizedbedreactorusingASPENPLUS',BiomassandBioenergy,32(12),pp.1245-1254.
Niu,M.,Huang,Y.,Jin,B.andWang,X.(2013)'SimulationofSyngasProductionfromMunicipalSolidWasteGasificationinaBubblingFluidizedBedUsingAspenPlus',Industrial&EngineeringChemistryResearch,52(42),pp.14768-14775.
Nozahic,F.(2008)Productiondegazdesynthèseparinteractionsàhautetempératuredugaz,desgoudronsetdurésiducarbonéissusdelapyrolysedebiomasses.InstitutNationalPolytechniquedeToulouse.
Pala,L.P.R.,Wang,Q.,Kolb,G.andHessel,V.(2017)'Steamgasificationofbiomasswithsubsequentsyngasadjustmentusingshiftreactionforsyngasproduction:AnAspenPlusmodel',RenewableEnergy,101,pp.484-492.
Patnaik,P.(2003)Handbookofinorganicchemicals.McGraw-HillNewYork.Pauls,J.H.,Mahinpey,N.andMostafavi,E.(2016)'Simulationofair-steamgasificationof
woodybiomassinabubblingfluidizedbedusingAspenPlus:Acomprehensivemodelincludingpyrolysis,hydrodynamicsandtarproduction',BiomassandBioenergy,95,pp.157-166.
Petersen,I.andWerther,J.(2005)'Experimentalinvestigationandmodelingofgasificationofsewagesludgeinthecirculatingfluidizedbed',ChemicalEngineeringandProcessing:ProcessIntensification,44(7),pp.717-736.
Power,A.P.(2018)GasplasmaProcessOverview.Swindon,UnitedKingdom.Availableat:http://advancedplasmapower.com/solutions/process-overview/(Accessed:31May2018.
Quaghebeur,M.,Laenen,B.,Geysen,D.,Nielsen,P.,Pontikes,Y.,VanGerven,T.andSpooren,J.(2013)'Characterizationoflandfilledmaterials:screeningoftheenhancedlandfillminingpotential',JournalofCleanerProduction,55,pp.72-83.
Ramzan,N.,Ashraf,A.,Naveed,S.andMalik,A.(2011)'SimulationofhybridbiomassgasificationusingAspenplus:Acomparativeperformanceanalysisforfood,municipalsolidandpoultrywaste',BiomassandBioenergy,35(9),pp.3962-3969.
Ray,R.,Taylor,R.andChapman,C.(2012)'Thedeploymentofanadvancedgasificationtechnologyinthetreatmentofhouseholdandotherwastestreams',ProcessSafetyandEnvironmentalProtection,90(3),pp.213-220.
Shie,J.-L.,Chen,L.-X.,Lin,K.-L.andChang,C.-Y.(2014)'Plasmatrongasificationofbiomasslignocellulosicwastematerialsderivedfrommunicipalsolidwaste',Energy,66,pp.82-89.
Turns,S.R.(1996)Anintroductiontocombustion:Conceptsandapplications.NewYork:McGraw-Hill.
Vaidyanathan,A.,Mulholland,J.,Ryu,J.,Smith,M.S.andCirceo,L.J.,Jr.(2007)'Characterizationoffuelgasproductsfromthetreatmentofsolidwastestreamswithaplasmaarctorch',JEnvironManage,82(1),pp.77-82.
Page 50
45
ValderramaRios,M.L.,González,A.M.,Lora,E.E.S.andAlmazándelOlmo,O.A.(2018)'Reductionoftargeneratedduringbiomassgasification:Areview',BiomassandBioenergy,108,pp.345-370.
Valmundsson,A.S.andJanajreh,I.'PlasmaGasificationProcessModelingandEnergyRecoveryFromSolidWaste',ASME20115thInternationalConferenceonEnergySustainability,PartsA,B,andC,361-368.
Vautmans,H.(2015)UnlockingtheresourcepotentialinEurope’s150,000+landfills:MEPonOctober12,2015Availableat:http://eptoday.com/unlocking-the-resource-potential-in-europes-150000-landfills/(Accessed:26March2018.
Virk,P.,Chambers,L.andWoebcke,H.(1974)'Thermalhydrogasificationofaromaticcompounds':ACSPublications.
Wanka,S.,Munnich,K.andFricke,K.(2017)'LandfillMining-WetmechanicaltreatmentoffineMSWwithawetjigger',WasteManag,59,pp.316-323.
Wolfsberger,T.,Aldrian,A.,Sarc,R.,Hermann,R.,Hollen,D.,Budischowsky,A.,Zoscher,A.,Ragossnig,A.andPomberger,R.(2015)'Landfillmining:ResourcepotentialofAustrianlandfills--Evaluationandqualityassessmentofrecoveredmunicipalsolidwastebychemicalanalyses',WasteManagRes,33(11),pp.962-74.
Zaini,I.N.,Weihong,Y.andJönsson,P.G.'PyrolysisofSolidRecoveredFuelfromLandfilledWaste:GasandOilProductComposition',4thInternationalSymposiumOnEnhancedLandfillMining,Mechelen.
Zhang,Q.,Wu,Y.,Dor,L.,Yang,W.andBlasiak,W.(2013)'AthermodynamicanalysisofsolidwastegasificationinthePlasmaGasificationMeltingprocess',AppliedEnergy,112,pp.405-413.