Report of the APO Seminar on Processing andUtilization of LegumesJapan, 9–14 October 2000
Published by the Asian Productivity Organization1-2-10 Hirakawacho, Chiyoda-ku, Tokyo 102-0093, JapanTel: (81-3) 5226 3920 • Fax: (81-3) 5226 3950E-mail: [email protected] • URL: www.apo-tokyo.org
Disclaimer and Permission to Use
This document is a part of the above-titled publication, and is provided in PDFformat for educational use. It may be copied and reproduced for personal use only.For all other purposes, the APO's permission must first be obtained.
The responsibility for opinions and factual matter as expressed in this documentrests solely with its author(s), and its publication does not constitute anendorsement by the APO of any such expressed opinion, nor is it affirmation of theaccuracy of information herein provided.
Bound editions of the entire publication may be available for limited purchase.Order forms may be downloaded from the APO’s web site.
PROCESSING ANDUTILIZATION OF
LEGUMES
2003Asian Productivity Organization
Tokyo
Report of the APO Seminar on Processing and Utilization of Legumesheld in Japan from 9 to 14 October 2000(SEM-23-00)
This report has been edited by Dr. Sundar Shanmugasundaram, Plant Breeder and Director,Asian Vegetable Research and Development Center, Tainan, Republic of China.
The opinions expressed in this publication do not reflect the official view of the APO. Forreproduction of the contents in part or in full, the APO's prior permission is required.
The phenomenal economic growth in Asia and the Pacific in recent decades hasresulted in significant improvements in living conditions in the region, as reflected in peopleexpanded choices of the food they eat. Lifestyle changes have also occurred due to otherfactors, including increased interest in better health. All of these developments havecontributed to major shifts in food consumption patterns, and more people are expressing apreference for healthier foods. In this context, legumes are playing an increasingly importantrole as people rediscover their high nutritive value and health-enhancing features.
Soybeans, for example, are the most common legume and are now being hailed as themiracle food of the future. Recent claims about their anticarcinogenic effects are stirringglobal interest in the commodity. Several processing and packing technologies are now beingdeveloped to maximize the potential of soybeans. Soy-based food initiatives are beingpursued to address nutritional issues such as the development of low-cost, soy-fortified or-blended food, promotion of soy milk in school lunch programs, and fortification of soy saucewith iron.
The potential of legumes for meeting food requirements is great. However, in additionto developing the technologies for manufacturing legume-based products that are acceptableto consumers, there is also a need to undertake innovative marketing efforts and to educatethe public about their benefits.
To discuss the present situation of legume processing and utilization in membercountries and to identify measures to add more value-adding processes to legume products,the Asian Productivity Organization (APO) organized a Seminar on Processing andUtilization of Legumes from 9 to 14 October 2000 in Japan. This publication is acompilation of the papers and proceedings of the seminar. I hope that it will serve as a usefulreference on the subject in APO member countries.
The APO is grateful to the Government of Japan for hosting the seminar, in particularto the Ministry of Agriculture, Forestry and Fisheries for providing financial and technicalassistance, to the Association for International Cooperation of Agriculture and Forestry forimplementing the program, and to the resource speakers for their valuable contributions.Special thanks are due to Dr. Sundar Shanmugasundaram for editing the present volume.
Part II Resource Papers1. Present Situation and Economic Importance of Legumes in
Asia and Pacific Region……………… Sundar Shanmugasundaram . . 172. Traditional Processing and Utilization of Legumes
…………………………………………………… Saipin Maneepun . . 533. Modern Processing and Utilization of Legumes – Recent Research
and Industrial Achievements in Soybean Foods in Japan –…………………………………………………… Akinori Noguchi . . 63
Part III Country Papers1. Bangladesh………………… Md. Amiruzzaman and Md. Shahjahan . . 792. Republic of China………………………………… Wen-Lian Chen . . 913. India (1)……………………………………………… Jarnail Singh . 1064. India (2)………………………………………………… Nawab Ali . 1175. Indonesia…………………Ignatius Suharto, H. Adang Kadarusmen
and Catharina Danajanti . 1466. Islamic Republic of Iran……………… Mohammad Reza Jahansooz . 1577. Republic of Korea……………………………………… Suk-Ha Lee . 1658. Malaysia………………………………………… Norijah Mohd Nor . 1749. Mongolia………………………………… Enkhtaivan Gombosuren . 187
10. Nepal……………………………………………… Hari D. Lekhak . 19411. Pakistan……………………………………………… Saeeda Raza . 20512. Philippines………………………………… Olivia M. Del Rosario . 22413. Sri Lanka……………………………… Nandanie Daya Ediriweera . 23414. Vietnam…………………………………………… Le Thanh Hiep . 244
Part IV Appendices1. List of Participants, Resource Speakers, and Secretariat . . . . . . . . . . . . 2952. Program of Activities . . . . . . . . . . . . . . . . . . . . . . . . . . . . . . . . . . . . . . 299
- 3 -
SUMMARY OF FINDINGS
INTRODUCTION
The Seminar on Processing and Utilization of Legumes which was organized by theAsian Productivity Organization (APO) and hosted by the Government of Japan was held inTokyo from 9 to 14 October 2000. The program was implemented by the Association forInternational Cooperation of Agriculture and Forestry (AICAF) in cooperation with theMinistry of Agriculture, Forestry and Fisheries (MAFF). Fourteen participants from 13member countries, and three resources speakers from the Asian Vegetable Research andDevelopment Center (AVRDC), Thailand and Japan attended the seminar.
The objectives of the seminar were to: 1) discuss the present status of legume process-ing and utilization in member countries; and 2) identify measures for promoting more value-adding activities in legumes. The seminar consisted of the presentation and discussion ofresource papers, as well as country papers and field studies in Ibaraki and Tochigiprefectures. The resource papers focused on the following topics: 1) Present Situation andEconomic Importance of Legumes in Asia and Pacific Region; 2) Traditional Processing andUtilization of Legumes; and 3) Modern Processing and Utilization of Legumes – RecentResearch and Industrial Achievements in Soybean Foods in Japan –. The country paper, onthe other hand, presented the present situation of legume production and consumption, aswell as future prospects of legume processing and utilization in respective countries.
The highlights of the seminar are presented below.
HIGHLIGHTS OF RESOURCE PAPERS
Present Situation and Economic Importance of Legumes (Sundar Shanmugasundaram)The Asia and Pacific region is home to three billion people. Arable land, however, is
limited, so countries are preoccupied with how to ensure self-sufficiency in cereals, the staplefood crops. Legumes have been branded as secondary crops. They have always beenrelegated to marginal lands and given only meager inputs. The risks associated withproducing these crops have also been high and research to improve legumes has beenminimum. Resources have mostly gone instead to cereals.
After the Green Revolution, national and international research programs in Asia beganturning their attention to legumes, due to the following reasons: 1) legumes play a major rolein household food security; 2) they are the major source of protein, fat, supplemental energyand, more importantly, micronutrients (legumes complement the cereal diet of Asians);3) they are the primary source of protein for vegetarians and resource poor rural and urbanpeople; 4) they provide cash income to rural populations; 5) they help improve the soil forsustainable agriculture; 6) they diversify cropping systems (provide an alternative to cerealmonocropping); 7) they have a wide range of uses as food, feed and raw material forindustrial products; and 8) they are attractive to health-conscious consumers and medicalpractitioners. To ensure household “nutritional” security, governments and internationalagencies should provide a positive policy environment and financial support to increaselegume production in the region, and quicken the pace of the “slow runners” as pulses beforehave been branded.
- 4 -
Plants provide almost 80 percent of the protein in the developing world. In almost allAsian countries, the major source of protein is legumes. Area, production and productivityof pulses have begun to show positive growth. Research is beginning to pay off. Farmersare recognizing legumes as important cash crops and countries are beginning to recognizelegumes’ export potential (which results in a spillover effect of increased domestic supply).Prices might decrease slightly, but this could be more than offset by significantly higheryields from improved cultivars. Area and production of pulses have increased in People’sRepublic of China, India, Myanmar, Pakistan, Cambodia, Laos and Vietnam. These increaseshave come primarily through productivity and area increases, especially in China, Myanmarand Vietnam.
The increase in total production was mostly due to the increase in area and productivityof dry beans. Mung bean, a short-duration legume, has contributed significantly to thisincrease. Improved mung bean cultivars from national programs and from AVRDC havebeen well accepted by farmers in China, Pakistan, Myanmar, Thailand, Indonesia,Philippines, Lao PDR, Cambodia and Vietnam.
The area and production of chickpea and pigeon pea increased between 1989 and 1999.Only a limited number of countries cultivate and consume these long-duration crops.Improved cultivars from national programs and International Crops Research Institute for theSemi-Arid Tropics (ICRISAT) are used by farmers in the region, but production growth hasbeen modest. Lentil production in Asia dropped between 1989 and 1999, but area andproduction of lentils have increased in Myanmar. The increase in production of groundnutwas minimal between 1989 and 1998 in Asia. In recent years, groundnut has faced manycompetitors, such as rapeseed, sunflower, oil palm and soybean. Aflatoxin and other healthconcerns are inhibiting consumption. The production in China, India, Myanmar and Vietnamhas been stable.
Soybean is the king of the legumes. China dominates in area and production. Growthstems mostly from productivity increase and to a limited extent through area increase. In thepast 20 years, India recorded spectacular increases in area and production of soybean. Froma meager 3,000 ha in 1969, cultivated area increased to more than six million ha by 1999.Increased soybean production helped alleviate an edible oil crisis in India. Soybean meal isalso exported, earning for the country valuable foreign exchange. Myanmar, Pakistan andVietnam are also emerging producers, with increased area and production. Indonesia willcontinue to import limited quantities of soybean to supplement domestic production to meetdomestic demand. Japan, Korea and Taiwan will be major importers of soybean for food, oiland feed. Among the Pacific countries, Australia and New Zealand play a minor role inlegume production. They make slight increases where they have comparative exportadvantage.
Half the world’s population consumes half the world’s pulses. Asia’s share of thisconsumption increased in 1998. Of the amount of soybean consumed as food in the world,almost all is consumed in Asia. The amount of soybean consumed as food in Asia increasedin 1998. Asia accounts for more than half of world groundnut (food) consumption. Asia’sshare of world groundnut (food) consumption increased to 58 percent in 1998.
There is an urgent need to increase per capita availability of pulses, which declinedfrom 23.7 kg in 1960 to 11.4 kg in 1998. Both area and productivity of legumes mustincrease. Pulses area can be expected to increase in India, Bangladesh, Pakistan, China, LaoPDR, Cambodia, Myanmar and Vietnam. Chickpea and pigeon pea will show very modestincreases. However, dramatic increases in area and productivity of mung bean can beexpected. Because mung bean is a short-duration crop, it can easily take the place of fallow
- 5 -
periods. Improved mung bean cultivars from national programs and AVRDC will helpincrease production in many Asian countries in the next 10-20 years. Consumers andproducers in China, Pakistan and Myanmar are already enjoying the benefits of theseimproved cultivars. More benefits will follow in these and other countries, such asBangladesh, Lao PDR, Cambodia and Vietnam. People from all income groups areconsuming more legumes, but demand could be increased through development of attractivenew processed products. And demand could be expected to rise if consumers are informedabout the important micronutrients and nutraceutical properties in mung bean and otherpulses. Increased demand would help stabilize prices.
Continued strong support for both basic and applied research on various legumes,especially mung beans and soybeans, are required at the national and international levels inAsia to maintain momentum generated by current improvements. In this regard, training forresearchers and extension staff at both levels should be offered. International conferencesshould be organized periodically to facilitate the exchange of knowledge generated byresearch. In-country demonstrations of improved cultivars and improved productiontechnologies should be organized for farmers. A decision-making tool for various legumesshould be developed to assist farmers and traders. Socio-economic research should focus onthe factors responsible for adoption and non-adoption of improved technologies, includingcultivars. The impact of the improved cultivars and improved technology over traditionaltechnology should also be assessed. Farmers should be educated to the fact that better landand timely application of appropriate agri-inputs are needed to exploit the high potential yieldof improved cultivars. Research to improve the micronutrient and protein status of childrenand young women should be undertaken. The importance of alleviating nutrient deficiencythrough a food-based approach should be emphasized.
By eliminating the beany flavor of soybean, consumption of soybean as a food couldbe increased in many Asian countries. Vegetable soybeans have very little beany flavor.Probably vegetable soybeans could be used as a forerunner to the introduction of othersoybean products to South Asia. Soybean flour can be used to enrich other legume or cerealflours and locally produced products. There is a wide range of indigenous underutilizedlegume crops. It is essential to investigate the potential usefulness of these indigenousspecies as food, feed, fiber, raw material for industrial and medicinal products.
Traditional Processing and Utilization of Legumes (Saipin Maneepun)The food legumes can be divided into two groups: pulses and oilseeds. The pulses
group includes dry seeds of cultivated legumes which are traditional food. The oilseedsgroup used primarily for their oil content consisting of soybean and peanut, that representroughly 73 percent and 17 percent, respectively of the total world production of grain legumecrops. Post-harvest losses of legumes in developing countries amount to about 20-25 percent.
In 1999/2000, the world soybean production will decrease slightly due to unpredictableeffects of consumers’ concern about genetically modified soybeans. To achieve nutritionalbalance, cereals and legumes need to be consumed in the approximate ratio of 65 (cereal) to35 (legume). The problems in producing dry legumes are the poor grain quality, highproduction cost, low productivity and inefficient marketing. Most farmers in developingcountries are small landholders, and they usually grow legumes after cereal crops such asrice, corn and sorghum. Post-harvest handling, transportation and storage are the mostimportant factors to consider in producing quality dry legumes. Inefficient post-harvesthandling of legumes in developing countries has affected grain quality. Most farmers in
- 6 -
developing countries dry their mature beans under the sun. Several locally made threshing,shelling and grading machines have been introduced by local merchants.
The traditional processed soybean food products known in Southeast Asia can beclassified into two categories: 1) non-fermented and 2) fermented. The former includessoybean milk, tofu or soybean curd and yuba. Soybean milk can be prepared at home bygrinding whole soybean with water and straining to make rich, creamy milk-like liquid called“soy milk”. The product has a unique, beany flavor, which is a well-accepted beverage inSoutheast Asian countries. Tofu is closely associated with soy milk. Yuba is a sheet-likecoagulant formed on the surface of warm soy milk as it cools. The lifted sheet of soybeancontains emulsified oil from soy milk and has high protein with a delicate flavor. Theproduction is still at the cottage scale and industry level technology is yet to be developed.Fermented soybean products include soy sauce and soy paste. Both soy sauce and soy pasteproducts have to be processed through the fermentation step of “koji” production. Mostfermented soy products are processed into both soy sauce and soy paste in the ratio 70:30,60:40 and 50:50 depending on the market requirements. Other fermented soybean productsare fermented soybean, fermented white soybean and imitation fried pork rind.
Peanut is prepared for direct consumption by boiling, drying, roasting andconfectioning. Peanut bar and coated roasted peanut products are processed by using modernequipment. The products are packed in good quality packaging to control moisture and airto prolong shelf life.
About 73 percent of mung bean production is used for local consumption. The largestprocessing industry is transparent noodle production and starch extraction, which accountsfor about 20 percent. Transparent noodles are processed from mung bean starch.
Bean sprouts are produced from mung beans and blackgrams. The product is producedfor fresh market and for daily consumption. Bean sprouts are processed on a home or cottagescale, using traditional technology.
The soybean industry has introduced a number of new infrastructure and technologieswhich have, and will continue to have, significant impact on farming methods, bulkcommodity storage, handling and distribution. Direct utilization of soybean in the foodindustry include full fat soyflour for baking, soy-based beverages, and snack foods.Texturized vegetable protein (TVP) made from soyflour using single and twin screw cookerextrusion is available in dry forms.
Peanut processing technology has been developed similar to soybean. Peanut flour isobtained from oil extraction process. Various snacks developed from peanut bases arepacked in attractive packaging. Peanut butter processing is quite a large industry.
A mung bean cracking machine, a grinder which separates liquid and solid, a starchseparator, a starch mixer and a noodle machine have been developed for making transparentnoodles.
At present, modern biotechnology to produce soybeans with herbicide resistance hasincreased public awareness on biosafety and food safety. Consumers around the world havedifferent views towards the technology. Labeling has become a major issue. However,specific method to determine genetically modified organisms (GMO) and geneticallymodified foods (GMF) requires more scientific information to make labeling possible. Grainswould be the fastest track to increase production capacity to meet the world population needs.
Modern Processing and Utilization of Legumes (Akinori Noguchi)In Japan, 5 million mt of soybeans are imported annually. However, 4 million mt are
consumed for edible oil production resulting in more than 3 million mt of defatted soybean.
- 7 -
About 90 percent of defatted soybeans is used in livestock feed because of shortages of feedresources in the country. According to the Food Balance Sheet, the domestic soybeanproduction was less than 120,000 mt whereas the amount of imported soybean was 4.8million mt. Domestic consumption of soybeans according to use was as follows: feed,110,000 mt; seed, 3,000 mt; industrial use, 3,901,000 mt; waste, 120,000 mt; gross food,785,000 mt; and net food, 785,000 mt.
In general, soybean foods are considered as subsidiary items to the principal foods(e.g., cooked rice) in Japan. The continuous decline in rice consumption has been reducingthe demand for soybean foods, especially among young Japanese, due to the change in theirfood habits. Since the early 1980s, Japanese food markets have been in the age of gluttonyand the food companies continue their efforts to diversify their soybean products by makingnew ingredients such as substitutes for meat proteins and extenders and improving the qualityof final products. Therefore, soybean food companies are very eager to open new markets,and thus putting a great deal of effort into food research on soybean foods.
The major traditional soybean foods in Japan are miso, soy sauce, tofu and itsderivatives. In 1998, the consumption of each soybean product was, not so different from theprevious years, as follows: miso, 165,000 mt; soy sauce, 26,000 mt; tofu and its derivatives,494,000 mt; fermented soybean, 122,000 mt; shimi-tofu, 30,000 mt; and others, 101,000 mt.Domestic soybean has been used mainly for making foods due to its higher content ofprotein, large seed size and good taste. The consumption pattern was 44 percent for tofu, 30percent for cooked beans and side dishes, 13 percent for fermented soybean and 9 percent formiso and other products. Data suggest that the market size of traditional foods of soybeanis not likely to increase so much in the future in Japan.
The production of food derived from vegetable proteins such as meat extenders andmeat analogues value has grown to about 61,000 mt in 1997 (41,000 mt from soybean and20,000 mt from wheat), according to the Japan Association of Vegetable Protein Foods.However, the market of these foods in Japan is being met.
The following technologies are expected to create new products from soybean andcreate a new market for them: extrusion cooking, high pressure cooking, ohmic heating andothers.
The twin screw extruder has attracted the attention of researchers and foodmanufacturers because of its high capability in material transportation as compared to a singlescrew type. The better mixing, kneading, heat exchange and self-cleaning functions of twinscrew extruders also provide an incentive to develop such food technology in order toovercome the difficulties associated with the single screw type. Recent development of twinscrew extruders provides us with new applications in various food processing, especially towet processes. One company mixed the defatted soy flour with potato starch and extrudedthe mixture at relatively higher moisture content with twin screw extruder. The extrudateswere found to have very fine well aligned fibrous structure upon rehydration in hot water.Another company extruded the mixture composed mainly of soy protein and obtained meat-like products successfully accepted in the market. The idea of a cooling die also promotesthis development and enables us to process fish and animal meats which has been thought tobe impossible to be texturized with the extruder.
High pressure cooking applies hydrostatic pressure of several hundreds MPa on foodsfor the purpose of sterilization, protein denaturation, control of enzyme and chemicalreactions, homogeneous defrosting at low temperature and others. The soy milk remainedliquid within the range of examined pressure and its viscosity increased when the time of
- 8 -
pressurization was less than 10 minutes. However, 500 MPa for 30 minutes solidified the soymilk. Soy milk showed better emulsifying and stability properties but had poor capacity.Additionally the content of SH residue in soy milk increased a little under anaerobicpressurization. The hard-type tofu could be made from the pressurized soy milk with CaCl2.Electrophoresis and isoelectro-focusing techniques revealed that soy proteins weredissociated while some of them were coagulated by high pressure. Fluorescence analysis alsoshowed that soy proteins were modified by high pressure, having larger hydrophobic regions.After pressure treatment, soy milk showed higher affinity to beany flavor components andsaponin which would lead to better use of soy milk in soy foods.
High pressure cooking is characterized by the following: 1) the transfer of highpressure is spontaneous and does not depend on the shape of materials; 2) high pressurecooking is free from the problem of mechanical deterioration of materials caused by theagitation necessary for the homogeneous and quick heat transfer; 3) high pressure could bemaintained by the mechanical method and saves the energy needed for cooking; and 4) therelease of high pressure could be achieved instantly which makes the cooking controllable.
When food products contain sufficient water and electrolytes to pass electric current,ohmic heating could be used to generate heat within the food products by the passage of analternating current. The method enables the solid phase or viscous liquids to be heated as fastas thin liquids, thus making it possible to use HTST techniques on solid or viscous foods.The results clearly indicated that ohmic heating provides quick temperature rise in plants andprotein solutions. The major benefits of ohmic heating are summarized as follows:1) continuous production without heat-transfer surfaces; 2) rapid and uniform treatment ofliquid and particulates, with minimal heat damage and residence-time differences; 3) ease ofprocess control with instant shutdown; 4) reduced maintenance costs; 5) environmentallyfriendly system; and 6) ideal process for shear-sensitive products. Some Japanese tofumanufacturers are interested in these characteristics of ohmic heating and have started toexamine its potential for tofu making.
Soy protein can form the translucent gel. The process involves defatted soybeanextract being dialyzed against distilled water at 7.5 pH. The dialysate is a transparentsolution having less beany flavor. After heating, the desalted soybean extract keepstransparency even in the presence of salt (NaCl). When the desalted soybean extract,preheated under salt-free condition is heated again in the presence of NaCl (0.2 M), it givesa translucent gel at a lower concentration than that of non-heated desalted soybean extract.The translucent gel is melted by the following heating and gellified again by cooling, that is,this gel is cold-setting and gel-sol transition is reversible, which is confirmed by themeasurement of dynamic viscoelasticity. Desalted soybean extract preheated under salt-freecondition could give a gel at room temperature or lower temperature only by addition of salt,and is not precipitated by the incubation at 4ºC, which is different from native soybeanprotein.
HIGHLIGHTS OF COUNTRY PAPERS
Legumes form one of the largest families of flowering plants but only a handful ofthem are grown extensively in Asia and the Pacific such as soybeans, peas, lentils, beans andpeanuts. They constitute healthy and versatile food as they produce many of the nutrients thehuman body needs. Legumes are particularly high in protein, cholesterol-free, high in dietaryfibers and low in saturated fat. In addition to their being a major source of food and nutritionfor the population, legumes also contribute to agriculture and the environment. Their
- 9 -
nitrogen-fixing property, for instance, can enhance soil fertility and as crop cover, they canhelp prevent soil erosion. Legumes also have potential medical applications as some are saidto prevent or alleviate hypertension, diabetes and cancer.
Food legumes can be generally classified into pulses and oilseeds. In East Asia themost important legume grown and consumed is soybean. In other Asian countries it iseconomically less important although in recent years the commodity has grown inimportance, particularly, due to its potential contribution to enhancing food nutrition security.In some countries it is a recently introduced crop.
Legumes comprise an important part of the Asian diet, being consumed usually incombination with cereals. Pulses, in particular, have been considered as the cheapest sourceof protein in South Asia and have traditionally been consumed by the rural poor.Accordingly, cereal-based diets have been improved in terms of overall nutritional value withthe supplementation of pulses. Legumes have been used to address specifically the problemof protein-calorie malnutrition in a number of countries.
In general, however, legumes have been given lesser priority as they still account fora relatively small share of the diet in most Asian countries. Despite this, the production,particularly of pulses, has generally increased though not substantially, during the lastdecade. Productivity levels, however, have remained low compared to world averages. Thisindicates that a significant part of the production increases could be attributed more to areaexpansion. The crops are usually cultivated after rice. In some cases, it may be grown inpoor or marginal lands. In a few countries (e.g., Iran and Mongolia), climatic conditions haveserved to increase the variability of production, as well as to limit the choice of crop varieties.In East Asia and a few other countries (e.g., Malaysia, Sri Lanka and Thailand), productionof pulses has gone down due to a number of factors such as increased costs of production,shortage of labor and low returns to investments. Many of the countries in fact have beenimporting a significant amount of their legume requirements, particularly soybeans, for bothhuman consumption and animal feeds.
Except for a few countries like the Philippines, consumption of legumes has had a longhistory. Consumption especially in South Asia is usually in processed form. Thus, mungbean and other pulses are traditionally consumed as dhal although recently people areconsuming more bean sprouts in these countries. In East Asia, consuming legumes asvegetables is more common. Thus, legumes such as soybean and peanut are prepared forconsumption by boiling, drying, roasting and confectioning.
In the case of soybean, a variety of processed food products are produced in the region.These products are generally classified into non-fermented and fermented. The major non-fermented products include soybean milk, soybean curd (tofu), soy cheese, yuba, soy flourand bean sprouts. Fermented products, on the other hand, include soy sauce, soy paste,fermented tofu and fermented whole bean. Each country has its own local names for thesetraditional products. Peanut processing has been developed in similar fashion as in soybean.The processed products come mainly in the form of snack foods. Mung bean, aside from itsuse as bean sprouts, is also processed to produce transparent noodles and starch.
The introduction of modern technologies has improved invariably the processing andutilization of legumes in the region. For instance, in Taiwan the beany flavor of soybeanmilk has been removed by enzyme inhibition and oxygen exclusion thereby enhancing theacceptance of the product by consumers. Improved packaging using tetra pak and additionof flavoring has also increased demand. The potential industrial and medical uses of legumesare also being increasingly exploited, particularly, in those countries where non-food benefits
- 10 -
are receiving greater attention. To be sure, improved and low-cost technology packages havealso been developed to enhance traditional processing of legumes. For example, mechanicaldryers and power-operated cleaners and graders introduced in India and other countries, haveserved to improve the quality and safety of the products.
Despite these achievements, however, a number of problems and issues are affectingthe processing and utilization of legumes in the region. Among these are: 1) significantamount of post-harvest losses, particularly, during storage and milling of grain legumes;2) lack of support services, particularly, credit and marketing; 3) inadequate supply of highquality and reasonably priced raw materials; 4) mycotoxin contamination and pesticideresidue in vegetables; 5) lack of appropriate storage facilities; 6) need to develop moresuitable and efficient processing and packaging technologies; 7) social and cultural taboosand lack of consumer awareness of the nutritional value of legumes which has hindered theirwider utilization; and 8) low profitability/returns of legume production compared to othertypes of farming. A potential issue that is yet to affect most of the developing countries inAsia is the current controversy on GMO. A few countries in the region like Japan, Korea andTaiwan are addressing the GMO issue already. In Korea, for instance, labeling of GMOproducts will be required by March 2001 in the case of soybean, corn and soybean sproutsand by March 2002 in the case of potato.
Legume production, processing and utilization are expected to expand in the future asfurther economic development takes hold in the region and as changing lifestyles compelmore and more people to consume healthier foods. This will, however, require theundertaking of more programs to improve the quality of processed food products. In thisregard, developing countries will need to strengthen the necessary systems for qualitycertification in order to improve the competitiveness of the legume industry. Such systemswill increasingly become important with the increasing globalization trend and growingconcern for food safety and sustainability issues. Another important factor to consider willbe the profitability issue. To improve the returns in legume production, a more supportivepolicy environment will be vital. It will involve, among others, the provision of appropriateprice incentives, adequate research and development (R&D) support, more effectivetechnology transfer mechanism, better access to credit and improved post-harvest facilities.New product development will be market-driven and in this connection, market studies willbe important. There will also be a need to obtain more knowledge about the nutritional/functional properties of legumes.
FIELD STUDIES
For their field studies, the participants visited the following sites, namely: 1) NationalFood Research Institute in Tsukuba; 2) Fuji Oil Co., Ltd. in Tsukuba; and 3) Taishi FoodCompany in Nikko.
The highlights of these visits are presented below:
National Food Research InstituteThe National Food Research Institute (NFRI) was established in 1934 as the Rice
Utilization Laboratory mainly to develop new rice-based food products from the surplus ricethat was mounting up during this period. As the Institute assumed wider functions it wasrenamed as the Food Research Institute in 1949 and as the National Food Research Institute,its present name, in 1972.
- 11 -
The Institute, which is one of the research institutes under the MAFF, is the onlynational research institution conducting post-harvest research in the country. It covers a widerange of research activities from basic to applied. The main research areas are: 1) analysisof food components and food quality; 2) evaluation and utilization of food materials;3) technology development for food processing and distribution systems; and 4) elucidationand utilization of biological functions for new food materials. The Institute has about 130scientists and research staff working in eight technical divisions and two administrative andplanning divisions. However, it also provides research and training facilities to researchersfrom private companies, institutions and universities including doctoral and masteralstudents. All in all, therefore, at present there are some 400 people working in the Institute.
The eight technical divisions and their corresponding major research area are:
1) Food Science Division – physiological and biochemical properties of carbohydrates,proteins and lipids;
2) Food Analysis and Assessment Division – development of new methods for foodanalysis and quality evaluation;
3) Food Function Division – elucidation and evaluation of physiological functions of foodcomponents;
4) Post-harvest Technology Division – development of biological, chemical and physicalprocesses to preserve quality and safety of food during distribution;
5) Food Materials Research Division – development of new technology for processingof agricultural products and waste;
6) Applied Microbiology Division – utilization of microorganisms and enzymes for foodprocessing;
7) Biological Function Division – engineering and biotechnology of bio-molecules andcells; and
8) Food Engineering Division – development of new technology for food production andprocessing using physical and engineering methods.
Fuji Oil Co., Ltd.The company is an intermediate food ingredients manufacturer which was established
in Osaka in 1950. Since its founding, the company has focused its attention on oils and fatssuch as coconut and palm oils in creating its own unique products. The company was thefirst in the world to commercialize its fractionation and enzyme transesterificationtechnologies which were used to complete hard butters that improved the properties ofchocolate such as its melting characteristics and shelf life.
Fuji Oil is part of the Fuji Group of Companies which comprises 10 overseascompanies located in seven different countries and 10 companies located in Japan. TheGroup is engaged in the following businesses: 1) oils and fats processing; 2) chocolateingredients; 3) confectionery and baking ingredients; 4) processed food product ingredients;5) soy protein; 6) processed soy protein food products; 7) soy milk; 8) new materials/ingredients; and 9) household and home cooking products. Fuji Oil itself has three divisions:Oils and Fats, Confectionery Materials and Protein.
In developing its soybean-based products Fuji Oil initially focused on defatted soybeanand it was the first domestic company to develop an isolated soy protein. The companyexpanded the nutritive potential of the latter and its applicability as a flavorful and functional
- 12 -
food ingredient. In focusing also on carbohydrates of soybeans, Fuji Oil developed water-soluble soy polysaccharides which have a diverse range of functions and applications.
The Company uses high purity soy protein to create processed food products that canbe stored for long periods in the refrigerator and that can be cooked easily without losingtheir shape such as tofu burgers and soy steaks. In developing new ingredients the companyis working on the latest approach to soy peptide by using enzyme hydrolysis technologies.It is also now venturing into the development of non-food products.
The Fuji Group produces and sells their specialty intermediate food ingredientsdeveloped from its own R&D facility in Tsukuba which the participants had a chance to visit.The consolidated net sales of the Group amounted to ¥141.7 billion during the fiscal yearending March 2000.
Taishi Food CompanyThe company began its business as Kudo Shoten in Aomori Prefecture in 1940. It was
reorganized in 1964 and became the present-day Taishi Food Company. The company hasfour plants. The newest one located in Nikko which the participants visited started operationsonly in 1998. Taishi produces soybean-based food products such as soy milk, tofu and natto.The company purchases its raw materials both locally (mainly from Hokkaido) and fromabroad (mostly from Canada) due to research studies that show that “northern soybeans” arerich in natural nutrients, particularly, isoflavones. Taishi is a top producer of tofu in thecountry. Its Nikko plant produces soy products mainly for the Kanto market which includesmetropolitan Tokyo.
The Taishi plants are all located near national parks to take advantage of the presenceof natural spring water sources which are important for enhancing the quality and safety ofthe company’s products. The new factory in Nikko has in fact adopted the HACCP (HazardAnalysis and Critical Control Point) management system to produce safe, worry-free,healthful and genuine products. Its factory administration policy puts emphasis on threeareas: 1) maintenance of the safety and good health of employees; 2) keeping harmony withthe environment; and 3) continuing improvement of the quality and safety of the products.
Taishi has set new standards for making tofu to offer consumers a healthy andenjoyable experience and a proper diet. These standards include: 1) use of only isoflavone-rich “northern soybeans” grown in Hokkaido and Canada; 2) use of only natural hybridsoybeans (strictly no GM beans are used); 3) production of the freshest tofu by using onlywater, beans and bittern (magnesium chloride); 4) use of healthful additive-free productionmethods; 5) use of an automated production line that is safe and clean to ensure that the tofuremains fresh for at least 10-15 days; and 6) development of “petit” tofu which is availablein three flavors (plum, perilla and sesame) to appeal to feminine taste.
CONCLUSION
Given the continuing population growth and the still low per capita consumption oflegumes in Asia and the Pacific, the prospects for further expanding legume processing andutilization in the region appears bright. To achieve this, however, some priority needs to begiven to legumes in national development programs, particularly, as these crops attain greaterimportance in the food and nutrition security of developing countries and also as thesecountries are able gradually to exploit the non-food benefits and uses of legumes. There willfurther be a need to improve the knowledge about bioavailability, particularly, of micro-
- 13 -
nutrients in legumes to be able to develop healthier and more nutritious processed foodproducts. At the same time, consumer awareness about the food and health properties oflegumes will need to be promoted. Consumer acceptance of legume-based processed foodswill also require improvement in their palatability. In all this, it is essential that relevantnational programs be developed more holistically involving closer collaboration amongscientists of various disciplines.
The seminar provided the participants an opportunity to review the present situationof legume processing and utilization in their respective countries. It also gave them a chanceto learn in greater detail current processing technologies being developed and applied by thegovernment and private companies in Japan. The seminar discussions, in particular, raiseda number of important issues which will need to be addressed by individual countries and bythe region as a whole. In this regard, the participants felt that more attention and priorityshould be given to legumes in light of their increasingly important role in meeting the foodand nutrition requirements of their respective countries.
- 17 -
1. PRESENT SITUATION AND ECONOMICIMPORTANCE OF LEGUMES IN ASIA ANDPACIFIC REGION
Sundar ShanmugasundaramPlant Breeder and DirectorProgram I – Vegetables in Cereal-based SystemAsian Vegetable Research and Development CenterTainan, TaiwanRepublic of China
INTRODUCTION
The Asia and Pacific region has more than half of the world’s population – about threebillion people – but less than 3 percent of the world’s arable land. The major focus ofagricultural research in Asia since the 1960s has been cereals (wheat, rice and maize).Thanks to the Green Revolution, the region was sufficient in food energy (ESCAP, 1985).Protein-calorie malnutrition remains, however, a disturbing problem in developing countries(FAO, 1985), and almost two billion people in the world suffer micronutrient deficiency (Aliand Tsou, 1997).
By the year 2020, the population of Asia (excluding Japan) is expected to be at 4.42billion, up from 3.31 billion in 1995, a 33.5-percent increase. Asia is expected to account for60.5 percent of this population rise (Andersen, et al., 1999). New evidence has confirmedthat anemia, the result of inadequate intake of iron, is widespread among women, especiallypregnant women (76 percent), and children (63 percent). Legumes, including annualoilseeds, are high in protein, micronutrients, vitamins, minerals and plant fibers. In addition,legumes are able to fix nitrogen from the air (through their symbiotic association with therhizobium bacteria), and they are adaptable to a variety of cropping systems. Legumes arethe major source of protein and constitute an important supplement to the predominantlycereal-based diet of Asians (Singh, 1988). Cereals are deficient in amino acid lysine, whichis compensated for by the surplus in legumes, while legumes are deficient in sulfur-containing amino acids, which is compensated for by a relative surplus in cereals(Thirumaran and Seralathan, 1988) (see Box 1 for a list of various legume crops. Many arecommonly referred to as pulses in South Asia). Unfortunately, high-yielding varieties(HYVs) of Green Revolution cereals have taken over much of the area once devoted tolegumes. Due to their low yield, risks involved in production, and poor return, legumes havebeen neglected. For example, per capita yield of wheat increased significantly from 1961 to1972, but in the same period, per capita yield of legumes decreased. In the absence ofsufficient domestic supply, importation met the demand for protein in most Asian countries.For example, Pakistan was forced to spend much-needed foreign exchange to import legumesto supplement domestic production (Ali, et al., 1997). Nearly 80 percent of dietary protein
- 18 -
Box 1. List of Various Legume CropsRepresentatives of the legume family of crops
can be found on all continents. Asia is a center oforigin of some food legumes. The economicallyimportant legumes belong to the subfamilyPapilionoideae. In South Asia, the economicallyvaluable legumes include chickpea (Cicer arietinum),pigeon pea (Cajanus cajan), mung bean (Vignaradiata var. radiata), adzuki bean (Vigna angularis),cowpea (V. unguiculata), lentil (Lens culinaris), mothbean (V. aconitifolius), rice bean (V. umbellata), horsegram (Kerstingiella uniflora), khesari (Lathyrussativus), broad bean (Vicia faba), lima bean(Phaseolus lunatus), common bean (P. vulgaris),garden pea (Pisum sativum), runner bean (P.coccineus), groundnut, peanut (Arachis hypogaea),soybean (Glycine max), winged bean (Psophocarpustetragonalobus), and yard-long bean (V.sesquipedalis). Except for the major legumes, such aschickpea, pigeon pea, groundnut, peas, broad bean andsoybean, the other beans including mung bean andblack gram have been grouped under dry beans andstatistical data for many of them are unavailable.
Source: Kyi, et al., 1997
in the developing world is plantprotein, compared to 43.4percent in developed countries,which consume mostly animalprotein (Paroda, 1995). In2000, the per capita proteinsupply per day from vegetablesources in Asia was 49.8 gm,compared to 21.2 gm fromanimal sources. Asian countriesconsume mostly plant protein(Table 1). Invariably, cerealsprovide the major share ofenergy and protein. Legumesare supplementary sources ofcalories, protein and fat inseveral Asian countries (Table2). Therefore, the importanceof legumes in improvingnutrition cannot be understated,especially when you considerthat legumes help improve theincome of farm households,diversify cropping systems andsustain the productivity ofagricultural land.
While population growth has increased the demand for food, rising prosperity hasincreased demand for quality food. At the same time, migration to urban centers and changesin life style, due to education and job prospects, have changed food habits and dietarypatterns. People want convenience foods, and they are becoming increasingly health-conscious. There is a need, therefore, to diversify food products made from legumes andoilseeds to meet the needs of modern, evolving consumers.
Kyi, et al., 1997 stated that although pulses are not known for their global or regionaleconomic importance, they do constitute the third largest processing market in India.Because most legume species are local, and grown only in a few countries, they are oftenlumped together under the category ‘pulses’. Given their many names, sorting out whichpulse is from one country to the next, even within a country like India, can be difficult.Internal trade in pulses and even international trade goes unregistered (Kyi, et al., 1997).Soybean, an internationally traded commodity, is somewhat of an exception. Very good dataare available on this crop for the U.S.A., Brazil and Argentina, but are unavailable for othercountries. Because the price of soybean is determined in international trade, it can be usedto calculate the value of soybean in other countries, as can the value of soybean oil and meal.
This paper presents current trends in production and consumption of legumes in theAsia and Pacific region, and compares them to a decade ago. It also projects future prospectsand issues related to legume processing and utilization in the region. Wherever data areavailable, economic aspects are briefly discussed.
- 19 -
Table 1. Source of Food Energy, Protein and Fat Supply forDifferent Countries in Asia, 2000
Source: FAO, 2000, from Mariana Campeanu, Statistician/FAO (personal communication), November 2002.
* The countries included in Asia are Afghanistan, Bahrain, Bangladesh, Bhutan, Cambodia,China, Cyprus, Gaza Strip, India, Indonesia, Islamic Rep. of Iran, Iraq, Israel, Japan, Jordan,DPR Korea, Rep. of Korea, Lao DPR, Lebanon, Macau, Maldives, Mongolia, Myanmar,Nepal, Pakistan, Philippines, Saudi Arabia, Sri Lanka, Syria, Thailand, Turkey, Vietnam andYemen.
- 21 -
CURRENT TRENDS IN PRODUCTION
Total PulsesThe area, production and productivity of pulses will be discussed separately from that
of groundnut and soybean. Similarly the data for Asia will be presented separately from thatof the Pacific or Oceania. For a recent review of production, consumption and marketing ofpulses, readers are referred to three recent publications (Sinha and Paroda, 1995; Kumar,1998; and Kyi, et al., 1997). The annual growth rates were calculated for each of thelegumes. For pigeon pea, the trend reported by Nene, et al. (1990) is presented due to lackof annual data. And because cowpea is a very minor crop in Asia, annual data areunavailable to calculate trend.
In 1989, 35.61 million ha were planted to pulses in Asia (33 countries)*, representing50.92 percent of world pulse production area. Farmers in Asia produced 24.04 million mt,or 43.61 percent of world pulse production. Average yield was 675 kg/ha. South Asia(comprising Bangladesh, Bhutan, India, Maldives, Nepal, Pakistan and Sri Lanka) accountedfor 72.3 percent of production area and 61.7 percent of production; Japan, China and Korea,13.78 percent of area and 22.18 percent of production; and Southeast Asia (comprisingCambodia, Indonesia, Lao PDR, Myanmar, Philippines, Thailand and Vietnam), 5.17 percentof area and 6.40 percent of production. India dominated with 65 percent of the productionarea and 56 percent of the production in Asia. Worldwide, India led with 34.4 percent of areaand 24.84 percent of production (Table 3). Has the situation changed in 10 years?
In 1999, total area planted to pulses in Asia was 38.06 million ha, an increase of 6.88percent over 1989. This amounts to 53.87 percent of world area, an increase of 2.95 percentover 1989 (FAO included Armenia, Azerbaijan, Georgia, Kazakhstan, Turkmenistan andWest Bank in its data for 1999, but these are not reported in Table 3 because their totals areinsignificant). Pulse area increased substantially (14.5 percent annually) in Myanmar, wherepulses rank third in importance and are being promoted vigorously as an important source offoreign exchange earnings (Kyi, et al., 1997). India targeted production at 17.45 million mtin 1995 (Kyi, et al. 1997), but the 1999 production, at 16.1 million mt, fell well short of thatmark. Twelve countries recorded a significant decrease in area planted to pulses (Table 3).Pulse production in Asia reached 28.84 million mt in 1999, a 19.96-percent increase from1989. This represents 2.5 percent annual growth rate. Despite a 0.2-percent annual decreasein area since 1989, production in China increased annually by 1.5 percent, owing to a 1.7-percent annual increase in productivity. Rising land values and labor costs are responsiblefor declining trends in pulse area and production in Taiwan, Japan and Korea. In some Asiancountries, such as Cambodia, HYVs have yet to make an impact and, therefore, productionis in decline (Table 3). In 15 countries, pulses productivity grew 1-5.9 percent annually,while in all of Asia, pulses productivity increased from 675 kg in 1989 to 780 kg in 1999,which represents an annual growth rate of 1.8 percent (Table 3).
- 22 -
Table 3. Area, Production, and Productivity of Pulses in Asia, 1989 and 1999Area (000 ha) Production (000 mt) Productivity (kg/ha)
Asia 35,582.8 37,979.8 0.6 24,027.3 29,753.5 2.5 675 783 1.8Source: FAO Production Yearbook, and FAOSTAT statistics database accessed September 2000, FARO, Rome, Italy.Note: * GR = average annual growth rate.
- 23 -
Table 4. Area, Production, and Productivity of Dry Beans in Asia, 1989 and 1999Area (000 ha) Production (000 mt) Productivity (kg/ha)
Asia 13,615.5 14,859.3 0.1 7,235.1 9,954.5 1.3 531 670 1.2Source: FAO Production Yearbook, and FAOSTAT statistics database accessed September 2000, FAO, Rome, Italy.Note: * GR = average annual growth rate.
- 24 -
Area and Production1,200 Yield 1,000
9001,0001,000 800Yield (kg/ha)
700Area (000 ha)800600650
600 500Production (000 mt)474455
400400
379300200200
106 100410 0
1980-81 1990-91 1994-95 1995-96 1996-97 1997-98 1998-99 Year
Dry BeansAmong the pulses, dry beans (Phaseolus and Vigna spp.) account for one of the largest
groups (FAO data). In 1989, India dominated with total area of 9.6 million ha, 72 percentof total dry bean area in Asia and 37.9 percent of world dry bean area. In 1999, althoughtotal dry bean area in India increased by about 340,000 ha, it represented only 66.4 percentof the dry bean area in Asia (Table 4). But on a worldwide basis, its position remained aboutthe same as in 1989. The increase in area and production between 1989 and 1999 for Asiawas primarily due to the remarkable jump in area in Myanmar, from 322,900 ha to 1,674,701ha, 16.6 percent annual growth. China, Indonesia, Iran, Nepal, Pakistan, Philippines andVietnam had modest annual production growth of 1.6-6.4 percent. Production in Sri Lankadeclined 7.7 percent annually (Table 4). Taiwan, Japan, and Korea experienced decline,which is expected to continue, due to the reasons mentioned earlier.
Production of dry beans in Asia increased 1.3 percent annually from 1989 to 1999, dueto increases in yield per unit area and a slight increase in area planted. The data indirectlyshow that legumes are catching up with cereals. Farmers are adopting improved cultivars andintensive cultivation practices because of better returns and lower risk. Myanmar’s 18.8-percent annual growth in production is a shining example. That increase was the result ofyield increases for mung bean (green gram) (720 kg/ha in 1996-97 compared to 307 kg/hain 1980-81) and pigeon pea (576 kg/ha in 1996-97 compared to 389 kg/ha in 1980-81), whichspurred increases in planted area. Mung bean and pigeon pea area increased from 41,000 haand 68,000 ha in 1980-81 to 474,000 ha and 283,000 ha in 1996-97, respectively (Bahl1999). Mung bean area is expected to reach 650,000 ha in 1997-98 and one million ha in1999-2000 (Table 4 and Figure 1). A new mung bean cultivar from the Asian VegetableResearch and Development Center (AVRDC), VC1973A, with high yield, uniform maturityand resistance to diseases, occupies almost 90 percent of the mung bean area in Myanmar(Source: Bahl, 1999; Consultancy Report, FAO RAPA, Bangkok, Thailand; and Dr. R. T.Opeña, 1999).
Figure 1. Area, Production and Yield of Mung Bean in Myanmar,1980-81 to 1998-99
Source: Bahl, 1999 and R. T. Opeña, 1999.
- 25 -
Out of 19 countries producing dry beans in 1999, all but eight recorded positive growthin production compared to 1989 (Table 4). A 7.7-percent reduction in annual growth rate ofdry bean production was observed in Sri Lanka. Of the 19 countries, India, DPR Korea, Rep.of Korea and Sri Lanka recorded a decrease in annual growth rate in yield per unit area from1989 to 1999, while the other countries had growth in yield per unit area (Table 4).
The yield potential of mung bean in China has been reported as 4,500 kg/ha (Xuzhenand Lifen, 1993). Five high-yielding cultivars, namely; Zhong Lu #1 (VC1973A), Zhong Lu#2 (VC2917A), E Lu #2 (VC2778A), Su Lu #1 (VC2768A), and Yueh Yin #3 (VC1628A),were released and extended to farmers (Huanyu and Zhizong, 1993). In 1989, the areaplanted to Zhong Lu #1 reached nearly 267,000 ha, about 45 percent of the mung bean area.This was the first mung bean cultivar released for nationwide cultivation in China since 1949(Xuzhen, 1993; and Xuzhen, et al., 1993). Average yield has risen 15-45 percent, andfarmers commonly obtain a yield of 2,500 kg/ha. Such increases have resulted in increasedmung bean area. In 1988, Babu and Hallam predicted that, given the rapid improvement inmung bean production, China would emerge as a mung bean exporter. Their predictionbecame a reality. The same authors projected that demand for mung bean in 1995 would farexceed supply. Some 1.8 million mt was predicted, but production reached 2.9 million mtin 1995, which exceeded predicted demand of 2.1 million mt (Tickoo and Satyanarayan,1998; and Babu and Hallam 1988).
Working in collaboration with AVRDC, Pakistan has developed nine improved mungbean cultivars since 1983 (Shanmugasundaram, 1988; and Ali, et al., 1997). These cultivarshave a yield potential of up to 1,800 kg/ha, compared to the local cultivars’ 1,000 kg/ha. Thenew HYVs are early maturing (about 60 days compared to 90 days for the local cultivars),are uniformly maturing (so that they can be harvested in one picking), and, more importantly,they are resistant or tolerant to mung-bean yellow mosaic virus (MYMV), a serious yield-limiting disease in South Asia. A survey showed that more than 50 percent of Pakistanifarmers are using the improved mung beans (Ali, et al., 1997). Yield of new cultivar NM92,for example, is 55 percent higher than the local cultivar, and the return to farmers is four-times higher due to a 25-percent reduction in cost of production. Because no insecticide isneeded to control MYMV, it is also friendly to the environment. Moreover, rotation of mungbean with wheat helped to improve wheat yield (Ali, et al., 1997).
PeasThe total area planted to peas in 1999 was 1.69 million ha, with a 3-percent annual
growth from 1989 (Table 5). Out of five countries, Myanmar and India had substantialannual growth rates of 9.7 percent and 5.3 percent, respectively. Area decreased significantlyin Bangladesh and China (Table 5). Total production of peas has grown 3.8 percent perannum since 1989. All countries where there was a growth rate increase in area had a growthrate increase in production. Yield per ha in Asia grew at 0.8 percent per annum from 1989to 1999 (Table 5).
ChickpeaThe total chickpea area (11 million ha) in Asia in 1999 was 29 percent of the total
pulses. Between 1989 and 1999 the area and production of chickpea increased at the rate of3 percent and 4.7 percent per annum, respectively. The major chickpea producing countriesare India, Pakistan, Turkey, Iran, Bangladesh and Myanmar. They accounted for nearly 98percent and 95.4 percent of the total area and production, respectively, in Asia in 1999 (Table6). Between 1989 and 1999, the yield per unit area increase per annum was 1.7 percent forAsia as a whole. India, Nepal, Pakistan and Syria had 1.6-3.4 percent annual increase in
- 26 -
productivity (Table 6). The yield potential of chickpeas in China was 3,300 kg/ha and thatof pigeon peas in India was 800 kg/ha. National programs and the International CropsResearch Institute for the Semi-arid Tropics (ICRISAT) have developed improved HYVs ofboth the crops and it is likely that they have been adopted by farmers. In some countries,such as Pakistan, Nepal and India, positive results with HYVs are forthcoming.
Table 5. Area, Production and Productivity of Dry Peas in Asia, 1989 and 1999
CountriesArea (000 ha) Production (000 mt) Productivity (kg/ha)
Asia 8,965.0 11,042.0 3.0 6,730.0 8,488.5 4.7 751 769 1.7Source: FAO Production Yearbook and FAOSTAT statistics data base accessed September
2000.Note: *GR = percent average annual growth rate.
Pigeon PeaBangladesh, India, Myanmar and Nepal are the only major producers of pigeon pea.
Pigeon pea yields more energy, protein and beta-carotene per ha than other major pulses(Nene and Sheila, 1990; and Jambunathan, et al., 1991). India dominates the scene with 92percent of the total area and 94 percent of total production (1999 figures). Since 1970, thearea planted to pigeon pea has increased steadily in India, but productivity has remainedstatic at 400-800 kg/ha (Nene and Sheila, 1990). The planted area in Myanmar was morethan quadrupled from 1989 to 1999. The yield of pigeon pea increased from 776 kg/ha in1989 to 787 kg/ha in 1999, and pigeon pea area increased from 3.6 million ha in 1989 to 3.8million ha in 1999 (Table 7). Increase in production has come primarily from increase in areain Myanmar, Nepal and Bangladesh (Table 7).
- 27 -
Table 7. Area, Production and Productivity of Pigeon Peas in Asia, 1989 and 1999
CountriesArea (000 ha) Production (000 mt) Productivity (kg/ha)
Asia 3,575.5 3,787.1 -0.3 2,774.8 2,981.3 1.2 776 787 1.5Source: FAO Production Yearbook and FAOSTAT statistics data base accessed September
2000.Note: *GR = percent average annual growth rate.
LentilThe total area and production of lentils in Asia dropped at the rate of 0.1 percent per
annum between 1989 and 1999 (Table 8). India accounted for 40-44 percent of lentil areaand 42-43 percent of the lentil production in Asia in 1989 and 1999, respectively. Between1989 and 1999, while planted area increased 2.2 percent per annum, there was a 1.7-percentannual increase in production in India. During the same period, productivity increased 0.4percent per annum. Therefore, the increase in production came from increase in area planted.
Table 8. Area, Production and Productivity of Lentils in Asia, 1989 and 1999
CountriesArea (000 ha) Production (000 mt) Productivity (kg/ha)
Asia 2,722.6 2,463.4 -0.1 1,693.3 2,079.0 -0.8 622 844 -0.6Source: FAO Production Yearbook.Note: *GR = percent average annual growth rate.
CowpeaAlthough cowpea is not a major crop in Asia, cowpea area was more than doubled and
production was tripled between 1989 and 1999 (Table 9). The major force behind theseincreases was Myanmar. Cowpea area in that country quadrupled and production grew eight-fold between 1989 and 1999 (Table 9). Area, production and productivity for Myanmarshowed an impressive positive annual growth (Table 9).
- 28 -
Table 9. Area, Production and Productivity of Cowpea in Asia, 1989 and 1999
CountriesArea (000 ha) Production (000 mt) Productivity (kg/ha)
Asia 52.4 117.0 12.1 30.4 93.4 14.3 580 798 2.0Source: FAO Production Yearbook.Note: *GR = percent average annual growth rate.
In summarizing pulses in Asia, India remains a major country in terms of area andproduction. However, India imports about 600,000 mt of pulses (worth US$240-300 million)annually to meet domestic demand. India has begun to export a small amount (40,000 mt,worth about US$16-20 million). Pakistan imports about 50,000-100,000 mt, while Sri Lankaimports about 35,000 mt annually (Kyi, et al., 1997). Although India has begun shippingmodest exports, for the near term, India will continue to import pulses to meet domesticdemand. Even though the area planted to pulses decreased in China, production of severalpulses showed an increasing trend. Introduction of improved high-yielding mung beancultivars from AVRDC has dramatically changed the position of China, from a net importerto a net exporter of dry beans. In technologically advanced countries, such as Japan, Korea,and Taiwan, both area and production of pulses have decelerated due to increased cost ofproduction, non-availability of labor, low return on investment and high value of land. In theabove countries, pulses are no longer economically viable crops. This trend is expected tocontinue in these countries. It is very clear from the data that Myanmar is emerging as a newstrong market player with steady growth in area and production of various pulses. Myanmarexported about 578,000 mt of pulses, worth US$232-300 million in 1995-96 (Kyi, et al.,1997). Similarly, Vietnam is also expected to show positive growth in production. India,Pakistan, Sri Lanka, Nepal and Bangladesh will be net importers of pulses. China, Myanmar,Thailand and Vietnam will be net exporters. India has the potential to substantially improveproduction, particularly of dry beans (as we will discuss later) with new improved HYVs.Whether India will take advantage of this improved technology and adopt appropriate policyto accomplish such a breakthrough remains to be seen.
GroundnutGroundnut area in Asia increased from 13.4 million ha in 1989 to 14.1 million ha in
1999. Asia accounted for 65.5 percent of the total world groundnut area in 1989, but thatfigure had dropped to 56.9 percent by 1999 (Table 10). Of the 16 countries listed in Table10, seven had positive growth in area. Significant to mention on the positive side areCambodia, China, Lao PDR, Pakistan and Vietnam, while Rep. of Korea, Japan andPhilippines are worth noting on the negative side. In 1989, China, India, Indonesia,Myanmar, Thailand and Vietnam accounted for 93 percent of groundnut acreage in Asia. By1999, that figure had risen to 97.8 percent. Together they accounted for 98.7 percent of theAsian production in 1989 and 97.8 percent in 1999 (Table 10). Asia accounts for 66 percentof world groundnut production. Most of the countries showed positive annual growth inproductivity of 1-4.5 percent (Table 10). Again, it is likely that improved HYVs, developedby national programs in association with ICRISAT, contributed to the increase.
- 29 -
Table 10. Area, Production, and Productivity of Groundnuts (in shell) in Asia, 1989 and 1999Area (000 ha) Production (000 mt) Productivity (kg/ha)
Asia 13,429.6 14,058.9 -0.4 15,560.6 21,784.0 3.0 1,159 1,400 3.4Source: FAO Production Yearbook.Note: * GR = average annual growth rate.
- 30 -
SoybeanThe world area planted to soybean jumped from 58.6 million ha in 1989 to 71.9 million
ha in 1999. Production increased from 107.3 million mt to 154.3 million mt, and averageyield increased from 1,829 kg/ha to 2,148 kg/ha in the same period. In Asia, 15.3 million mtwere produced from 12.8 million ha in 1989, and 23 million mt were produced from 16.9million ha in 1999 (Table 11). The area planted to soybean in China remained static duringthe period, while area in Taiwan, where soybean production is no longer profitable, areadecreased to an insignificant level. Taiwan imported US$512.6 million worth of soybean in1990 and US$857.5 million worth (Council of Economic Planning and Development, 2000)in 1997. The increase was due to a rise in price, to US$7.42 per bushel (Soyatech, Inc.,1998). In Taiwan, grain soybean production has been replaced by production of high-valuevegetable soybean for export to Japan (Benziger and Shanmugasundaram, 1995).
Japan imported 4.35 million mt of soybeans in 1989-90 and 5.06 million mt in 1997-98, valued at around US$1.88 billion and US$2.11 billion, respectively (Ministry ofAgriculture, Forestry and Fisheries [MAFF], Japan, 1989-90 and 1997-98). Korea alsoimports substantial quantities of soybeans. Japan, Korea and Taiwan will continue to importsoybean for food, oil and animal feed.
Only 3,000 ha was planted to soybean in India in 1969. In 1989, planted area was 2.13million ha. Planted area increased at a rapid 10.8-percent per annum between 1989 and 1999,when it reached nearly 6.5 million ha. Production increased 14.1 percent per annum in thesame period, from 1.72 million mt to 6.5 million mt. Growth of soybean in India since 1990-91 is shown in Figure 2. India now ranks fifth in total area and production worldwide(Paroda, 1999). Myanmar and Pakistan recorded 13 percent and 15.8 percent annualincreases in area, respectively, while soybean production in these two countries grew 14.6percent and 29.8 percent, respectively. Cambodia, Iran, Nepal and Vietnam also recordedincreases in area and production. Most of the other South and Southeast Asian countries hadnegative growth (Table 11). There is still considerable scope to increase production in Asiawith improved varieties and management practices.
Various Legumes in Pacific CountriesIn the Pacific, only Australia cultivates virtually all of the major legumes, such as dry
beans, chickpeas, cowpeas and soybeans. Australia and New Zealand produce both lentilsand peas. Australia, Fiji Islands, Papua New Guinea, Tonga and Vanuatu cultivate groundnut(Table 12). Between 1989 and 1999, the area of dry beans and chickpeas in Australiaincreased at an annual rate of 7.7 percent and 6.0 percent, respectively, while productionincreased at 13.2 percent and 2.8 percent, respectively (Table 12). Cowpea area in Australiawas static and production declined slightly during this period, due to decrease in productivity(Table 12). Soybean area in Australia declined 2.3 percent per annum, while productionincreased by 4 percent per annum, during the period. The production increase was primarilydue to a 2-percent per annum increase in productivity (Table 12).
Australia recorded a remarkable increase in area and production of lentils, from 3,000ha and 4,000 mt in 1989 to 70,000 ha and 76,000 mt in 1999. The increase in production wasmainly due to area. Productivity declined slightly during the period (Table 12). In contrast,the area and production of lentils declined in New Zealand, but productivity was unchanged(Table 12). There was very little change in the area and production of peas in both Australiaand New Zealand (Table 12). Area planted to groundnut increased 0.9 percent annually inAustralia between 1989 and 1999, and production increased 3.8 percent per annum (Table12).
- 31 -
Table 11. Area, Production, and Productivity of Soybeans in Asia, 1989 and 1999Area (000 ha) Production (000 mt) Productivity (kg/ha)
Source: FAO Production Yearbook.Note: * GR = percent average growth rate.
- 33 -
Area and Production Yield8,000 1,600
1,400Production (000 mt)
7,000
6,000 1,200Yield (kg/ha)
5,000 1,000
Area (000 ha)4,000 800
3,000 600
2,000 400
1,000 200
0 01990-91 1995-96 1997-98 1998-99 Year
Figure 2. Growth in Area, Production and Yield of Soybean in India
Source: Paroda, 1999.
The major pulse importing countries are India, Pakistan and China. The majorexporters are China, Australia, Thailand and, recently, Myanmar. Myanmar exported about578,000 mt of pulses in 1995-96 (to Bangladesh, India, Japan, Malaysia, Pakistan andSingapore), up from 93,000 mt in 1985-86 (Kyi, et al., 1997). Myanmar’s domesticconsumption rose from 528,000 mt in 1985-86 to 775,000 mt in 1995-96. Pakistan importsmainly from Australia, China and Myanmar. Sri Lanka is also a net importer of pulses.
CURRENT TRENDS IN CONSUMPTION ANDUTILIZATION OF LEGUMES
Pulses are an important part of the diet in South Asia, and to a certain extent inSoutheast Asia. They are a major source of protein for the vast majority of vegetarians andthe economically poor and the rural population. Half the world’s population consumes halfthe world’s pulses. Asia’s share of this consumption increased in 1988.
Soybean is a major protein crop, while both groundnut and soybean are rich in fat(soybean fat is cholesterol-free). Except for these two crops, legumes are high incarbohydrates. Soybean, black gram, mung bean (green gram), moth bean, horse gram andchickpea are valuable sources of calcium. Soybean and several other legumes are rich in iron(Table 13).
PulsesIn 1989, consumption of pulses as food amounted to 32.2 million mt, 58.4 percent of
world production. In the same year, 13.9 million mt was used as feed and 3.8 million mt wasused as seed. It is alarming to note that nearly 4.5 percent of total production was lost tospoilage, and insect and rodent damage. In Asia, out of 24.8 million mt of pulses producedin 1989, 20.1 million mt was used as food, 1.7 million mt as seed and 2.7 million mt as feed.Some 3.6 percent was wasted (Table 14).
- 34 -
Table 13. Protein, Carbohydrate and Fat Content of Legumes and Pulsesper 100 gm Dry Weight
In 1998, world production of pulses was nearly 56 million mt, out of which 34.6million mt (61.8 percent) was consumed as food, 13.9 million mt was used as feed, 3.8million mt were used as seed and 2.5 million mt were wasted. World pulse consumption rose7.5 percent between 1989 and 1998.
Out of 26.2 million mt of pulses produced in Asia, 19.4 million mt was consumed asfood in 1998. The amounts used as feed, seed and waste were 4.4 million mt, 1.8 million mtand 0.92 million mt, respectively (Table 14). The annual per capita supply of pulsesexceeded 10 kg in India, DPR Korea, Lebanon and Turkey in 1989 and 1998 (Table 14). Percapita availability of pulses in India, however, has declined since 1961 (Figure 3). Per capitaconsumption of pulses in China amounted to 5.5 kg in 1990 (Gai and Jin, 1995), far short ofthe 18-kg recommended by FAO, but higher than the 2.8-kg in 1989 and the 1.7-kg in 1998reported by FAO. The major producers and consumers of pulses are listed in Box 2. Annualper capita consumption of pulses in urban Pakistan rose to 9.0 kg in 1993, compared to 6.36kg in 1986. During the same period in rural Pakistan, annual per capita consumption rosefrom 6.0 kg to 7.9 kg (Kyi, et al. 1997).
Among the Pacific countries, Fiji had the highest per capita supply (7.7 kg) of pulsesin 1989, followed by Solomon Islands (6.8 kg). These islands nations’ many citizens ofAsian descent are the major consumers of pulses. Per capita supply in Australia was 4.9 kgin 1989. It rose to 6.4 kg in 1998, attributed to demand from Asian immigrants and exportpotential.
In 1982, von Hoppen reported income and price elasticities for pulses and other foodsfor different income groups in rural and urban areas in India. He reported that the incomeelasticity for pulses was around 1, suggesting that as income increases, the demand for pulsesincreases (except for the highest income group for which income elasticity was less than 1).The price elasticity for the poorer sector of the population was around -1, which suggests thatwhen prices rise, people in this group reduce considerably their intake of pulses.
- 35 -
Table 14. Consumption of Pulses in Asia, 1989 and 1998(Unit: 000 mt)
Source: FAO Food Balance Sheets, 1999 and FAOSTAT statistics data base (accessed September 2000).
- 36 -
kg/day80
69.070
6052.2
50
37.541.6
40 36.6
30
20
10
0 Year1961 1971 1981 1991 1993
Box 2. Major Countries Producing and Consuming Pulses in Asia-Pacific Region
Pigeon pea Cajanus cajan India, BangladeshChickpea Cicer arietinum India, Pakistan, Bangladesh, Nepal, Afghanistan, IranLentil Lens culinaris India, Pakistan, Bangladesh, Nepal, IranMung bean Vigna radiata India, Thailand, Myanmar, Sri Lanka, Indonesia,
Philippines, China, Bangladesh, Pakistan, Sri LankaBlack gram Vigna mungo India, Pakistan, Sri LankaPea Pisum sativum Ira, Pakistan, India, BangladeshCowpea Vigna unquiculata India, Bangladesh, Philippines, ChinaLathyrus Lathyrus sativus India, Bangladesh, NepalGroundnut Arachis hypogaea India, China, IndonesiaSoybean Glycine max China, Japan, Korea, Taiwan, Thailand, Philippines,
Indonesia, India, VietnamDry bean Vigna vulgaris JapanWinged bean Psophocarpus
tetragonoloba Papua New Guinea, ThailandSource: Kyi, et al., 1997
Figure 3. Per Capita Availability of Pulses in India
Source: Kumar, 1998.
A 1998 survey showed that between 1977 and 1987, consumption of pulses by the ruralpoor in India increased more than did the consumption by higher income groups and urbanpoor (Kumar, 1998). Using the national poverty line, Kumar (1998) classified the very poorand the poor as the ‘poor group’ and the non-poor and non-poor higher as the ‘high-incomegroups’. The high-income groups consumed more pulses in absolute terms than did the
Figure 5. Expenditure and Price Elasticities for Pulse in Rural and Urban Indiafor Different Income Groups Based on Food Characteristic Demand System
Source: Kumar, 1998.
poorer groups, regardless whether in rural or urban areas (Figure 4). The income elasticitiescalculated were similar to those calculated by von Hoppen in 1982. Increased income willprompt rural and urban poor to consume more pulses, but increased income will have verylittle effect on pulse consumption by high-income groups. The expenditure and priceelasticities observed by Kumar (1998) in India were as expected. Own price elasticities forpulses were negative. Deaton (1997) reported the price elasticity of pulses on their own pricewas -0.57 in Maharashtra, close to the average reported for India by Kumar (1998).Expenditure elasticities declined with increase in total expenditure (Figure 5).
Figure 4. Annual Per Capita Pulse Consumption in India
Source: Kumar, 1998.
- 38 -
Box 3. How Pulses Are Used in India and PakistanChickpea is the major pulse crop in India and Pakistan. Chickpea is called
garbanzo bean in the West. It is used to make a variety of preparations, some of whichare main dishes and others are snacks. Roasted and fried chickpeas are used as snackfoods. Chickpea as dhal is a common dish in the rural and urban areas. Chickpea issoaked in water for a couple of hours and the water is drained. Then the chickpea iscooked with vegetables and eaten with rice or wheat breads. Chickpea flour is used eitheralone or in combination with rice flour to make a variety of sweet and salty and spicysnacks that are popular with evening tea. Such snacks are also popular during specialfestivals and festive occasions, such as weddings.
Pigeon pea is primarily used as dhal to go with rice or used to make soups.
Kumar’s (1998) study assumed that demand for pulses is relatively high price elasticfor poor income groups, yet as a whole in India, demand for pulses is price inelastic, ataround -0.5 (Kyi, et al., 1997). Based on these seemingly contradictory signals, it isimportant to differentiate between various species and qualities (Kyi, et al., 1997).
Demand for pulses in the Asia and Pacific region, based on population and incomegrowth, is predicted to increase 3-3.5 percent annually. This would require 3.5-4 percentannual growth in pulse production or importation (Nandi, 1995).
Trade in pulses is important in the region. Expanded domestic and international tradewill benefit producers and consumers (Kyi, et al., 1997). It is estimated that around 60million mt of pulses valued at US$15 billion enter the international market annually (Kyi, etal., 1997). The authors cited demand in South and Southeast Asia, the Middle East and, toa lesser extent, in Africa and Latin America (it is worth noting that pulses also serve as reliefcrops in times of disaster [Gai and Jin, 1995]).
Pulses are usually consumed in a processed form. The ways pulses are used in Indiaand Pakistan are shown in Box 3. The method used to prepare pulse noodles in Myanmar isgiven in Box 4. Although mung bean and other pulses are traditionally consumed as dhal inIndia, people are learning about bean sprouting (especially mung beans), which is commonlyused in China (Chen, et al., 1988).
Pulses are 11-14 percent seed coat (husk), 2-5 percent germ, and the remainderendosperm (Kyi, et al., 1997). In dhal production, the husk is removed and the bean is split.The maximum theoretical recovery from milling pulses is around 87-89 percent. In practice,traditional milling recovers only about 65-75 percent. Modern milling methods can recover82-85 percent (Kyi, et al., 1997). The byproducts of pulse milling include broken grains (6-13 percent), germ and powder (7-12 percent), and husk (4-14 percent). The byproducts arefed to poultry, cattle, horses, swan and elephants. Broken mung bean and black gram grainsare milled into flour, used for making papad, a fried snack food (side dish). Byproducts fetchless than the dhal price. For example, husks fetch about 30 percent of the dhal price (Kyi,et al., 1997). The seeds of improved mung bean cultivars are twice as large as the seeds oftraditional cultivars. It would be interesting to study the husk-to-dhal ratio and recovery ratesof the new cultivars compared to the old ones. In addition to dhal, a number of snack foodsand extrusion products are made from pulses. Creativity is essential in developing foodproducts that will attract consumer attention and please varied taste buds.
- 39 -
Mung bean is a very popular pulse and has diverse uses. It is used as dhal; to makecurries; sweet and salty soups; is broiled and toasted with onion, chili and salt; in sweetand salt pongal (rice preparation); and patties and sweets of different kinds (Thirumaranand Seralathan, 1988; and Singh, et al., 1988). In Thailand, mung bean is used to makemini sweet desserts (Prabhavat, 1988) of different shapes like vegetables and fruits.Mung bean noodles and breads are also common (Chiang and Chiu, 1988). Mung beansare prescribed for patients in the hospitals and served with bread.
Lentils are primarily used as dhal, and are also roasted and used as snacks.Black gram is also a rich source of protein. Black gram is an important ingredient
to make the popular breakfast food items called idli, dosa and uttappam in India. Riceand black gram are soaked independently in water for a few hours. The husk from blackgram is removed. The rice and black gram are ground (wet grinding) separately and thenmixed together. Salt is added to taste and the mix is fermented overnight. The next dayit is ready to be used to make steamed bread called idli or pancake-like fried bread calleddosa or uttappam. The above dishes are popular breakfast dishes in South India, but nowthey have become very popular all over India, served in the morning and in the evening.
From author’s own observations
Box 4. Making Noodles from Pulses in MyanmarPulses, such as chickpea, pigeon pea, black gram, etc. can be used to make noodles.
Soybean, lablab bean, and horse gram cannot be used for noodles. Well-cleaned pulsesare first soaked in water for 24 hours and stirred occasionally. After draining, pulses areground with a sour starter solution obtained from a previous batch. Then it is settled ina small tank and the liquid is removed. The residual meal is transferred into a wooden tubfor eight hours; it is then transferred into a cloth bag which is hung up to drain for about15 hours. Then, the material is put into tanks in an airtight room for sulfur fumigation,after which the product is allowed to dry for two days, and then fumigated again. Afterthe second fumigation, the product is mixed with a sago solution (starch solution) andextruded into boiling water. The noodles are taken out of the hot water after five minutes,when they are soft, and put into cold water. After that, the noodles are put into an airtightroom for sulfur-fumigation again. The noodles are then dried on poles or drying racks for1-2 days. A typical pea noodle mill uses about 70-100 baskets of pulses daily as rawmaterial, and operates 200-300 working days/year. All of the processes are manual.Grinding is the only mechanical process; it uses electric motors. Generally, one basket(31 kg) of pulses yields 7.4-8.2 kg of noodles. There are 32 mills in Monywa, two inMandalay, two in Shwebo and two in Bago divisions in Myanmar.
Source: Kyi, et al., 1997
- 40 -
Million mt28 7
2454
20
16
12
8 Year1995 2000 2010 2020
Figure 6. Household Demand for Pulses in India
Source: Kumar, 1998.Soybeans
Domestic soybean supply in Asia amounted to 15.4 million mt in 1989; 8.3 million mtconsumed as food and 13.4 million mt processed. Domestic supply jumped to 24.7 millionmt in 1998; 13.1 million mt consumed as food and 23.1 million mt processed. Of the amountof soybean consumed as food in the world almost all is consumed in Asia as food (Figure 7).In India in 1989, about 85.6 percent of production (4.3 million mt) was processed for oil. Themeal (2.41 million mt) was mostly exported, earning US$500 million. The amount useddirectly as food was only 4.8 percent. About 600,000 mt of edible oil comes from soybeanannually (Ali, 1996). India has more than 150 soybean solvent extraction plants and 60 soy-food manufacturing units (Ali, 1996). It is heartening to note that between 1989 and 1999,consumption of soybean as a food in India increased from 85,000 mt to 857,000 mt (Table15). India is self-sufficient in vegetable oil due to the introduction and expansion of soybean.But in Indonesia, in addition to domestic production of 13.2 million mt, another 65,000 mtwere imported and used as food in 1989. In 1998 there was a 10-percent increase in theamount used as food in Indonesia. In contrast, in China in 1998 the amount used for food andfor processing was 57 percent and 67 percent, respectively, in relation to domestic production(Table 15). Of course, in China soybean is a traditional source of protein. It is also a majorsource of calcium and other micronutrients. Chinese consider soybean a health food. Butfor Indians, pulses are the main protein source. The beany flavor of soybean is a major factorinhibiting the widespread use of soybean as a food in India and the rest of South Asia(Shanmugasundaram, et al., 1998; and Shanmugasundaram and Tsou, 2000).
In Japan, Rep. of Korea and China (Taiwan), the amount used for food and processingchanged little in the past decade. Various soy-foods and processed products consumed indifferent countries are shown in Box 5.
- 41 -
Table 15. Consumption of Soybean in Asia, 1989 and 1998(Unit: 000 mt)
Box 5. The Common Uses of Soybean in AsiaThe uses of soybean as food can be grouped into three categories: 1) fresh; 2) fer-
mented; and 3) non-fermented. Fresh green soybean pods are harvested when the seedis full just before the pods turn yellow. Edamame, as it is called in Japan, is popular asa snack with beer or sake. Water is first boiled with a little bit of salt. The whole greenpods are put in the water and cooked for 5-6 minutes and the water is immediatelydrained. The beans in the pod are ready to eat. The shell is discarded. The green beanscan also be shelled and cooked with any other vegetable or meat of choice, just like peas.We can call this tropical pea. Small seeded soybeans are used to make sprouts, which canbe used as a vegetable year-round. Large black seeded soybeans are cooked with rice inKorea to enhance appearance and flavor.
Fermented soy-foods include soy sauce, miso soup, natto, tempeh in Indonesia,and fermented tofu. Soy sauce is a flavor enhancer. Large seeded soybeans with highprotein are preferred for making miso. Small seeded soybeans are required for makingnatto. Black seeded soybeans are fermented and used as a garnish. Tempeh is preparedusing Rhizopus oryzae and R. oligosporus. It is the main protein source for the majorityof Indonesians. It is rich in riboflavin, vitamins B6 and B12, biotin and folate. Non-fermented soy-foods include soy milk, an important source of calcium, especially inChina. Various kinds of tofu are consumed in Asia. It is popular with soups and salads.Fried tofu is also a delicacy. Soybeans are roasted and served as a snack, like peanuts, inNepal. Such roasted soy nuts are becoming popular in other countries as well. Soybeanprotein film called yuba is used in a variety of preparations. Soybean is an essentialingredient in the preparation of imitation meat. Other soybean products – soy flour, soynoodles, soy ice cream and soy protein isolates – are also popular in Asia.
Source: Shanmugasundaram and Tsou, 2000
Figure 7. Amount of Various Legumes Consumed as Food
- 43 -
The use of soybeans as food increased by 72 percent in Australia between 1989 and1998. Although the amount of soybean used in the Pacific countries is small, there has beena significant increase in consumption (Table 16).
Table 16. Consumption of Soybean, Groundnuts and Pulses as Food in Pacific Countriesin 1989 and 1998
Source: FAO Food Balance Sheets, 1999 and FAOSTAT statistics data base (accessedSeptember 2000).
GroundnutAsia accounts for more than half of world groundnut (food) consumption. Asia’s share
of world groundnut (food) consumption increased to 58 percent in 1998 (Figure 7). China,Indonesia, India and Japan are the major groundnut-consuming countries in Asia (Table 17).In China, half is processed food and the other half is consumed directly as food. InIndonesia, 95 percent of the domestic supply is consumed as food. In India, only 7.5 percentof the domestic supply is consumed as food and 78 percent is processed (Table 17). Theprocessed products are also consumed as human food. Groundnut meal is used as animalfeed.
The quantity of groundnuts consumed as food in Australia dropped between 1989 and1998. During the same period, consumption in New Zealand and Fiji increased (Table 16).
FUTURE PROSPECTS IN PRODUCTION,PROCESSING AND CONSUMPTION
PulsesReviewers of pulse production in Asia come up with the same findings: production
has been stagnant for a long time (Singh, 1988; Paroda, 1995; and Sinha, 1995). Asmentioned, annual per capita availability declined from about 23.7 kg in the 1960s to 11.4kg in 1998. Sinha (1995) has argued that food habits have changed as a result of increasedincome and purchasing power. People are consuming more milk, vegetables, fruits and meat.Therefore, energy and protein requirements are being met by diverse foods rather than pulses.Food habits in Asia are changing, as a result of urbanization, job opportunities for womenand other socio-economic factors. Fast foods and convenience foods are replacing laborioustraditional foods. At the same time, surveys (Kumar, 1998; and Kyi, et al., 1997) clearlyshowed that pulse consumption increases with increased income. Increased supply leads tolower prices and higher consumption by the poor, who get their protein primarily from pulses.
- 44 -
Table 17. Groundnut Consumption in Asia between 1989 and 1998
Asia 4,286 6,187 1.4 1.8Source: FAO Food Balance Sheets, 1989 and 1998.
Kumar (1998) projected that demand for pulses in India would amount to 13.2-14.1million mt in 2000 and 22.9-26.7 million mt in 2020, due to growing population, butdepending on GDP growth (Figure 6). India produced 13.4 million mt of pulses from 22.6million ha in 1994-95. Self-sufficiency in pulses would require an increase in productivityand area. The average pulse yield in 1994-95 was 593 kg/ha. To achieve the productiontarget of 16.1 million mt, 21.4 million mt and 27.8 million mt using 21.7 million ha, yieldwould have to increase to 742 kg/ha, 987 kg/ha and 1,282 kg/ha in 2000, 2010 and 2020,respectively (Kumar, 1998). That said, improved, short duration varieties, already available,should lead to some expansion of pulses into cereal-based production systems. India’sNational Commission on Agriculture (NCA) has revised the above estimates due to post-harvest losses and seed and feed requirements to 26.3 million mt, 27.8 million mt and 30.9million mt for the GDP growth of 4 percent, 5 percent and 7 percent, respectively (Kumar,1998).
Despite efforts to eradicate poverty, millions of people in Asia and Africa still live inpoverty. For these people, pulses will continue to be the major source of protein andmicronutrients. Governments in Asia should, therefore, work to improve pulses and increasepulse production.
So, what is the scope for increased pulse production in the Asia-Pacific region?Chickpea and pigeon pea are the major pulse crops and India is the major cultivator andconsumer, followed by Pakistan and Myanmar. Considering that only a few countries usechickpea and pigeon pea (Box 2; and Sinha, 1995), and considering that they are longduration crops with limited use, their production is expected to increase only slightly. Withinthe region, Myanmar is emerging as a serious new player. A steady increase in production,specifically for export, is expected from that country (Kyi, et al., 1997).
- 45 -
Many countries in the region have an interest in mung bean production, utilization andtrade (Sinha, 1995), and compared to other pulses, the production, yield and area of mungbean showed a significant positive trend in the post Green Revolution era (Singh, 1988),largely due to mung bean’s short crop duration. Mung bean production in Asia grew 4.5percent annually (nine times that of all pulses) between 1974-76 and 1984-86 (Singh, 1988).The yield and area of mung bean increased at a steady 2-percent per annum in the sameperiod.
Multi-location trials (supported by the Department for International Development,U.K., and the United States Agency for International Development) conducted by AVRDCin six South Asian countries in 1997-99 identified promising cultivars with 55-65 days cropduration, with yield potential of up to 2,000 kg/ha in India, Bangladesh and Sri Lanka. Theyare also either resistant or tolerant to MYMV, the most serious disease affecting mung beanin the region. AVRDC developed these MYMV-resistant, high-yielding, early andsynchronously maturing, bold seeded cultivars in collaboration with Pakistan. A newcultivar, Pusa Vishal, has been released for northeastern India, the main site of the GreenRevolution in India. Farmers there grow wheat, then fallow their fields for about 65 days andthen grow monsoon rice. As a result of extensive cultivation of rice, underground water israpidly being depleted. It is a serious concern. Punjab Agricultural University has identifieda new mung bean cultivar from the recent network trials: SML668 matures in 55-60 days,so it can easily fit between wheat and rice. Or it can be grown instead of rice, and earn thesame income as rice. There are 10 million ha lying fallow where the new cultivar can beplanted. There is, therefore, an excellent prospect for increased mung bean production inIndia. SML668 was also found to do well between wheat and rice in northeasternBangladesh.
Sinha (1995) has discussed at length the factors to be considered in improving the yieldof pulses. At AVRDC, plant breeders, pathologists and physiologists worked together toincrease mung bean yield. Fundamental physiological studies showed that a plant type wasneeded that could give a high number of pods per plant, regardless of plant population density(AVRDC, 1975). A plant population density of 350,000-400,000 should be maintained(MacKenzie, et al., 1975). The plants should have plenty of vegetative growth prior toflowering and then stop vegetative growth so that they can focus on efficient translocationof photosynthates to the developing seeds. Research at AVRDC showed that the majorsource of dry matter for seed yield in mung bean is the photosynthate produced during thepost-anthesis period, rather than dry matter translocated from storage in other plant partsduring the vegetative period (Kuo, et al., 1978 and 1980). Harvest index was higher in earlymaturing cultivars. AVRDC was able to select such genotypes with early maturity andMYMV resistance.
Even on marginal land, improved cultivars outperform traditional cultivars, mainly dueto disease resistance. But mung beans have become a high-value cash crop, and thereforethey warrant good management. Mung bean HYVs truly deliver high yields when grown inthe appropriate seasons with optimum inputs supplied at the right time. It is equallyimportant not to plant mung bean after another legume in the cropping system, since it willseriously affect yield (Kuo, et al., 1981). Considering mung bean’s potential, extensionpersonnel and farmers should be trained how to grow it.
As mentioned earlier, product diversification is important to attract consumers in orderto create more demand for the raw material. May be recipes could be exchanged: idli, dosaand vada from South India are gaining popularity in other parts of India and even abroad.
- 46 -
Soybean and GroundnutSoybean is a ‘global commodity’ grown in more than one hundred countries.
Numerous food, feed, fiber and medicinal and industrial products are produced usingsoybean. Today, soybean is a key source of protein and edible oil. Prior to 1940, soybeanwas produced and used mainly in China, Japan and Korea, and to a lesser extent in othercountries in Asia. It is only in the past 60 years that the area and production of soybean hasmushroomed in North and South America. It was only in the past decade that India emergedas a major player – from insignificance in the 1960s, India has grown to occupy fifth in areaand production worldwide.
The yield potential of soybean in tropical and temperate countries varies from 3,500kg/ha to 6,000 kg/ha (Paroda, 1999). It is predicted that major yield gains can be expectedfrom conventional breeding, biotechnology research and improved management practices.India has 166 soybean processing plants crushing about 52,000 mt/day. It is projected thatIndia will have around 8 million ha and 10 million ha producing around 10 million mt and12 million mt of soybean in the year 2000 and 2010, respectively. Although the soybeanprocessing industry in India has developed more than 19 soybean-based products and istrying to promote soybean as food, acceptance by the traditional consumer will be slow.Soybean will remain primarily an edible oil crop and meal exports will rise. The animal feedindustry is expected to expand in pace with demand for meat, especially poultry, as incomesin India increase due to better employment opportunities.
Soybean area and production in China grew 1 percent annually between 1989 and1999. China’s population increases by 13 million annually, so demand for soybean isprojected to rise: for food, for the government’s Soybean Action Plan to supply soybean milkto school children and to meet the expected growth in meat consumption (now 40kg/capita/year). Area is projected to increase to 9 million ha by 2020. In the past decade,soybean productivity increased 1 percent per annum. Productivity in the next 20 years isexpected to appreciate substantially (Ming and Lianzheng, 1999). Production in 2020 isexpected to reach 20 million mt from anticipated yield of 2,000-2,400 kg/ha.
The growth of soybean in China (Taiwan), Japan, Democratic People’s Rep. of Korea,Rep. of Korea and Thailand will slow or decline. Most of these countries will remain netimporters of soybean. Myanmar, Lao PDR, Cambodia and Vietnam are expected to registerpositive growth in area and production. Soybean will continue to be a major source ofprotein food in Indonesia, and imports will continue to supplement domestic production.Soybean will remain a dynamic crop in the region and even challenge the other regions ininternational trade.
Saio (1999) reviewed the current developments in soy-food processing. The use ofsoybean as functional food (for long-term nutrition and health needs) is increasing (Worrel,1999). The major factor inhibiting soybean’s utilization in South Asia is beany flavor(Shanmugasundaram and Tsou, 2000), but beany flavor can be minimized genetically and byprocessing.
Through the efforts of AVRDC, vegetable soybean is becoming a popular high-valuecrop in several countries (AVRDC, 1998; and Carter and Shanmugasundaram, 1999)Vegetable soybean is called edamame in Japan and maodou in China. Between 1979 and1983, only 19 countries evaluated AVRDC vegetable soybeans. But in 1998, 50 countrieswere evaluating them. Twenty improved vegetable soybean cultivars have been officiallyreleased in 11 countries for domestic consumption and export. For many of these countriesit is a brand new crop (Shanmugasundaram and Tsou, 2000).
- 47 -
Box 6. Underutilized LegumesThere are many legumes that are used as food. Some native species used locally
in some Asian countries are listed below. Some of these are also used in other parts of theworld.
Bambara groundnut Vigna subterrance Used as a pulseYam bean Pachyrhizus species Tubers are used as a vegetableLupins Lupinus species High proteinRice bean Vigna umbellata Food, fodderWinged bean Psophocarpus tetragonalobus MultipurposeAdzuki bean Vigna angularis Widely used in Japan as foodFaba bean Vicia faba FoodMoth bean Vigna aconitifolia FoodFrench bean Phaseolus vulgaris VegetableHorse gram Macrotyloma uniflorum FoodHyacinth bean Lablab purpureus Popular in south AsiaGrass pea Lathyrus sativus FoodLima bean Phaseolus lunatus VegetableJack bean Canavalia ensiformisSword bean Canavalia gladiataZombi pea Vigna vexillataPillipesera Vigna trilobata Fodder
Source: Male, 1994
World groundnut production increased from 23 million mt in 1989 to 33.7 million mtin 1998. Groundnut production in Asia grew 2 percent annually in this period. The majorincreases came from China, Myanmar, Pakistan and Vietnam. World consumption ofgroundnut as a food increased from 8 million mt to 10.8 million mt in the same period. Asiaaccounted for 59 percent of world groundnut (food) consumption in 1998. Health-relatedconcerns about groundnut in many countries could affect its production and utilization(Fletcher, et al., 1992). Production in China, India, Cambodia and Vietnam might riseslightly, for domestic consumption and export. In other countries, the production andconsumption will be static or decline.
Underutilized LegumesThere is a wide range of indigenous underutilized legume crops (Williams, 1993) (Box
6). It is essential to investigate the potential usefulness of these indigenous species as food,feed, fiber, raw material for industrial and medicinal products.
AcknowledgementsThe author expresses his sincere gratitude to Mr. Teruo Miyake and APO for invitation
to prepare this paper.The author would like to express his sincere appreciation to Drs. R. B. Singh and Eric
Kuenneman of FAO, Rome and FAO RAPA, Bangkok, respectively, for their assistance inaccessing the FAO database. The author is also grateful to Dr. Katinka M. Weinberger forcarefully reading the manuscript and offering useful suggestions. Thanks are due to Mr.David Abbass for editing the manuscript.
- 48 -
LITERATURE CITED
Ali, M., I. A. Malik, H. M. Sabir, and B. Ahmad, 1997. “The Mungbean Green Revolutionin Pakistan”, Technical Bulletin No. 24, AVRDC, Shanhua, Taiwan, Rep. of China,66 p.
Ali, M. and S. C. S. Tsou, 1997. “Combating Micronutrient Deficiencies through Vegetables– A Neglected Food Frontier in Asia”, Asian Food Policy 22 (1): 17-38.
Ali, Nawab, 1996. “Indian Soybean Industry”, in Alex Buchanan (ed.) Proceedings of theSecond International Soybean Processing and Utilization Conference, pp. 78-82, 8-13,Bangkok, Thailand, Institute of Food Research and Development, KasetsartUniversity, Bangkok, Thailand.
Andersen, Per Pinstrup, Rajul Pandya Lorch, and Mark W. Rosegrant, 1999. “World FoodProspects: Critical Issues for the Early Twenty-first Century”, 2020 Vision FoodPolicy Report, International Food Policy Research Institute, 32 p.
AVRDC, 1975. AVRDC Progress Report ’75, AVRDC, Shanhua, Taiwan, Rep. of China,60 p.
----------, 1998. International Consultation Workshop on Mungbean: Proceedings of theMungbean Workshop, 7-11 September 1997, New Delhi, India, edited by S.Shanmugasundaram, AVRDC, Shanhua, Taiwan, Rep. of China, 198 p.
Babu, S. C. and A. Hallam, 1988. “Economics of Mungbean Production, Utilization andTrade – A Time Series Analysis”, in S. Shanmugasundaram and B. T. McLean (eds.)Mungbean: Proceedings of the Second International Symposium, pp. 440-449,AVRDC, Shanhua, Taiwan, Rep. of China.
Bahl, P. N., 1999. The Union of Myanmar – Report of the Consultancy Mission on GrainLegume Production, FAO RAPA, Bangkok, Thailand, 22 p.
Benziger, Vincent and S. Shanmugasundaram, 1995. “Taiwan’s Frozen Vegetable SoybeanIndustry”, AVRDC Technical Bulletin No. 22, AVRDC, Shanhua, Tainan, Taiwan,Rep. of China, 15 p.
Campeanu, Mariana, 2002. Personal communication.
Carter, T. E. and S. Shanmugasundaram, 1993. “Vegetables Soybean (Glycine)”, in J. T.Williams (ed.) Underutilized Crops – Pulses and Vegetables, pp. 219-239, ChapmanHall, London.
Chen, C. Y., S. C. S. Tsou, and H. H. Wang, 1988. “Utilization Patterns of Mungbean in theChinese Diet”, in S. Shanmugasundaram and B. T. McLean (eds.) Mungbean:Proceedings of the Second International Symposium, pp. 498-507, AVRDC, Shanhua,Taiwan, Rep. of China.
- 49 -
Chiang, W. C. and T. P. Chiu, 1988. “Utilizing Mungbean Starch Processing By-products:A Preliminary Study”, in S. Shanmugasundaram and B. T. McLean (eds.) Mungbean:Proceedings of the Second International Symposium, pp. 520-527, AVRDC, Shanhua,Taiwan, Rep. of China.
Council of Economic Planning and Development, 2000. Taiwan Statistical Data Book,Republic of Cina, 354 p.
Deaton, Angus, 1997. The Analysis of Household Surveys: A Microeconomic approach toDevelopment Policy, The John Hopkins University Press, 479 p.
ESCAP, 1985. Economic and Social Survey of Asia and the Pacific, Bangkok, Thailand.320 p.
FAO, 1985. The State of Food and Agriculture, Rome, 103 p.
----------, 1990. FAO Production Yearbook 1990, Vol. 44, Rome, 283 p.
----------, 1990. FAO Trade Yearbook for 1989, Rome.
----------, 1993. FAO Production Yearbook 1993, Vol. 47, Rome, 254 p.
----------, 1996. Food Balance Sheet for 1992-94 Average, Rome.
----------, 1996. FAO Production Yearbook 1996, Vol. 50, Rome, 235 p.
----------, 1998. FAO Production Yearbook 1998, Vol. 52, Rome, 233 p.
----------, 1999. FAO Trade Yearbook for 1997, Rome.
Fletcher, S. M., P. Zhang, and D. H. Carlay, 1992. “Groundnuts: Production, Utilization andTrade in the 1980s”, in S. N. Nigam (ed.) Groundnut: A Global Perspective, pp. 17-32, Proceedings of an International Workshop, 25-29 November 1991, ICRISATCenter, Andhra Pradesh, India.
Gai, J. and W. Jin, 1995. “A Report on Production, Research and Development of PulseCrops in China”, in S. K. Sinha and R. S. Paroda (eds.) Production of Pulse Crops inAsia, pp. 93-100, RAPA Publication No. 1995/8, FAO, Bangkok, Thailand.
Gopalan, C., B. V. R. Sastri, and S. C. Balasubramanian, 1989. Nutritive Value of IndianFoods, p. 156, National Institute of Nutrition, Indian Council of Medical Research,India.
Huanyu, Zhang and Wang Zhizong, 1993. “High-yielding Cultivation of Zhong Lu #1 in theRed Loam Region of Hunan”, in Chen Xuzhen, Wang Youtian and Charles Y. Yang(eds.) The Study and Application of AVRDC Mungbean in China, pp. 114-117,AVRDC/ARC, Bangkok, Thailand.
- 50 -
Jambunathan, R., S. D. Hall, P. Sudhir, V. Rajan, and V. Sadhana, 1991. Uses of TropicalGrain Legumes, Proceedings of a Consultants Meeting, 27-30 March 1989, ICRISATCenter, India, 350 p.
Kumar, P., 1998. “Food Demand and Supply Projections for India”, Agricultural EconomicsPolicy Paper 98-01, Indian Agricultural Research Institute, New Delhi, 141 p.
Kuo, C. G., M. C. H. Jung, and S. C. S. Tsou, 1978. “Translocation of 14C-Photosynthate inMungbean During the Reproductive Period”, HortSci. 13(5), pp. 580-581.
Kuo, C. G., F. H. Hsu, J. S. Tsay, and H. G. Park, 1980. “Variation in Specific Leaf Weightand RuDP Case Activity in Mungbean”, Can. J. Plant Sci. 60, pp. 1059-1062.
Kuo, C. G., M. H. Chou, and H. G. Park, 1981. “Effect of Chinese Cabbage Residue onMungbean”, Plant and Soil 61, pp. 473-477.
Kyi, Hla., Mruthunjaya, Naseer Alam Khan, Rupasena Liyanapathirana and J. W. T.Bottema, 1997. Market Prospects for Pulses in South Asia: International andDomestic Trade, Working Paper 27, The CGPRT Centre, Bogor, Indonesia, 101 p.
MacKenzie, D. R., N. C. Chen, T. D. Liou, H. B. F. Wu, and E. B. Oyer, 1975. “Responseof Mungbean [Vigna radiata (L.) Wilczek Var. radiata] and Soybean [Glycine max (L.)Merr.] to Increasing Plant Density”, J. Amer. Soc. HortSci. 100(5), pp. 579-583.
Male, B., 1994. Underutilized Grain Legumes and Pseudo-cereals – Their Potentials inAsia, FAO RAPA, Bangkok, 162 p.
Ming, Lu, and Wang Lianzheng, 1999. “State of the Soybean Industry in People’s Republicof China”, in Proceedings World Soybean Research Conference VI, pp. 1-4, compiledby Harold E. Kauffman, University of Illinois, Urbana-Champaign.
Ministry of Agriculture, Forestry and Fisheries, 1989-90. 66th Statistical Yearbook ofMAFF, Statistics and Information Department, Association of Agriculture and ForestryStatistics, Japan, 947 p.
----------, 1997-98. 74th Statistical Yearbook of MAFF, Statistics and InformationDepartment, Association of Agriculture and Forestry Statistics, Japan, 621 p.
Naing, T., 1995. “Production of Pulse Crops in Myanmar”, in S. K. Sinha and R. S. Paroda(eds.) Production of Pulse Crops in Asia, pp. 141-145, FAO RAPA Publication No.1995/8, Bangkok, Thailand.
Nandi, B. K., 1995. “Nutritional Considerations Towards Production of Pulses in the Asia-Pacific Region”, in S. K. Sinha and R. S. Paroda (eds.) Production of Pulse Crops inthe Asia, pp. 15-24, FAO RAPA, Bangkok, Thailand.
- 51 -
Nene, Y. L. and V. K. Sheila, 1990. “Pigeonpea: Geography and Importance”, in Y. L.Nene, Susan D. Hall and V. K. Sheila (eds.) The Pigeonpea, pp. 1-14, C.A.BInternational, U.K.
Opeña, R. T., 1999. Personal communication.
Paroda, R. S., 1995. “Production of Pulse Crops in Asia – Present Scenario and FutureOptions”, in S. K. Sinha and R. S. Paroda (eds.) Production of Pulse Crops in Asia, pp.1-13, FAO RAPA Publication No. 1995/8, Bangkok, Thailand.
----------, 1999. “Status of Soybean Research and Development in India”, in Proceedings ofthe World Soybean Research Conference VI pp. 13-22, compiled by Harold E.Kauffman, University of Illinois, Urbana-Champaign.
Prabhavat, S., 1988. “Mungbean Utilization in Thailand”, in S. Shanmugasundaram and B.T. McLean (eds.) Mungbean: Proceedings of the Second International Symposium, pp.508-519, AVRDC, Shanhua, Taiwan, Rep. of China.
Saio, K., 1999. “Current Developments in Soybean Processing in East Asia”, in Proceedingsof World Soybean Research Conference VI, pp. 372-379, compiled by Harold E.Kauffman, University of Illinois, Urbana-Champaign.
Shanmugasundaram, S., 1988. A Catalog of Mungbean Cultivars Released Around theWorld, AVRDC, Shanhua, Taiwan, Rep. of China, 20 p.
Shanmugasundaram, S., Miao-Rong Yan, Ray-Yui Yang, and S. C. S. Tsou, 1998. “ThreeNear Isogenic Triple Null Lipoxygenase Soybean Lines for the Tropics andSubtropics”, in Andrew James (ed.) Proc. of 10th Australian Soybean Conference, pp.31-35, CSIRO, Australia.
Shanmugasundaram, S. and S. C. S. Tsou, 2000. “Quality Traits of Soybean for Food Usein Expanding Its Utilization in Asia”, in Proceedings of the Third InternationalSoybean Processing and Utilization Conference, p. 583-586, Korin Publishers, Ltd.,Japan.
Singh, R. B., 1988. “Trends and Prospects for Mungbean Production in South and SoutheastAsia”, in S. Shanmugasundaram and B. T. McLean (eds.) Mungbean: Proceedings ofthe Second International Symposium, pp. 552-559, AVRDC, Shanhua, Taiwan, Rep.of China.
Singh, V. P., A. Chhabra, and R. P. S. Kharb, 1988. “Production and Utilization ofMungbean in India”, in S. Shanmugasundaram and B. T. McLean (eds.) Mungbean:Proceedings of the Second International Symposium, pp. 486-497, AVRDC, Shanhua,Taiwan, Rep. of China.
Sinha, S. K., 1995. “Status of Pulses in the Asia-Pacific Region – Production, Research andDevelopment”, in S. K. Sinha and R. S. Paroda (eds.) Production of Pulse Crops inAsia, pp. 25-59, FAO RAPA Publication No. 1995/8, Bangkok, Thailand.
- 52 -
Sinha, R. S. and R. S. Paroda, 1995. Production of Pulse Crops in Asia, FAO RAPAPublication No. 1995/8, Bangkok, Thailand, 248 p.
Soyatech, Inc., 1998. Soya Bluebook Plus, ME, U.S.A., 400 p.
Thirumaran, A. S. and M. A. Seralathan, 1988. “Utilization of Mungbean”, in S.Shanmugasundaram and B. T. McLean (eds.) Mungbean: Proceedings of the SecondInternational Symposium, pp. 470-485, AVRDC, Shanhua, Taiwan, Rep. of China.
Tickoo, J. L. and A. Satyanarayan, 1998. “Progress in Mungbean Breeding Research withSpecial Emphasis on Disease and Insect Resistance, Constraints and FutureDirections”, in S. Shanmugasundaram (ed.) International Consultation Workshop onMungbean: Proceedings of the Mungbean Workshop, pp. 58-77, 7-11 September1997, New Delhi, India, AVRDC, Shanhua, Tainan, Taiwan.
von Hoppen, M., 1982. “Prospects for Grain Legumes in Asia”, in Grain LegumesProduction in Asia, pp. 191-212, Asian Productivity Organization, Japan.
Williams, J. T., 1993. Underutilized Crops – Pules and Vegetables, Chapman Hall, London,247 p.
Worrel, C., 1999. “The Use of Soy-foods and Soy-based Ingredients in Functional Foods”,in Proceedings of World Soybean Research Conference VI, pp. 372-379, compiled byHarold E. Kauffman, University of Illinois, Urbana-Champaign.
Xuzhen, Cheng, 1993. “Research and Utilization of AVRDC Mungbean Lines in China”,in Cheng Xuzhen, Wang Youtian and Charles Y. Yang (eds.) The Study andApplication of AVRDC Mungbean in China, pp. 7-13, ARC/AVRDC, Bangkok,Thailand.
Xuzhen, Cheng and Lin Lifen, 1993. “High-yielding Cultivation Technique for Mungbean”,in Cheng Xuzhen, Wang Youtian and Charles Y. Yang (eds.) The Study andApplication of AVRDC Mungbean in China, pp. 88-93, ARC/AVRDC, Bangkok,Thailand.
Zhang, H. Y. and Z. H. Wang, 1993. “High-yielding Cultivation of Zhong-Lu #1 in the RedLoam Region of Hunan”, in Compilation of Papers on Technology and Utilization ofAVRDC-improved Mungbeans in China, pp. 114-118, ARC/AVRDC, Bangkok,Thailand.
- 53 -
2. TRADITIONAL PROCESSING ANDUTILIZATION OF LEGUMES
Saipin ManeepunDirectorInstitute of Food Research and Product DevelopmentKasetsart UniversityBangkokThailand
INTRODUCTION
Legumes have been widely grown and seeds of legumes are used for human food, toprovide calories and protein. Leguminosae is one of the three largest families of floweringplants, comprising nearly 700 genera and 18,000 species. The legumes used by humans arecommonly called food legumes or grain legumes. The food legumes can be divided into twogroups, the pulses and the oilseeds. Pulses group consists of dried seeds of cultivatedlegumes, which have been eaten for a long time. The oilseeds group consists of thoselegumes used primarily for their oil content that may be extracted by pressing or by solventextraction. The oil is known as vegetable oil and is used as cooking oil. The residue, called“oil cake”, normally has high protein content and is used as food and animal feed. Generally,legumes can be classified into those that are relatively low and high in edible oil. Severalcrops from both the groups may be eaten raw as cooked or green vegetables, but invariablyare harvested as dried grains.
The most widely cultivated legumes are the two principal oilseeds: soybean andpeanut. In 1999, they represent about 75 percent and 16 percent, respectively of the totalworld production of grain legume crops. The other dried legume grains, mung bean,chickpea, pigeon pea, cowpea, etc. represent only 9 percent in the same year (Table 1).Legume cultivation in developed countries is mechanized, starting from planting, harvesting,handling, storage and processing. But legume cultivation in developing countries usetraditional methods and they incur post-harvest losses of about 20-25 percent. The traditionalprocessing and utilization of legumes also require more research attention.
PRESENT SITUATION AND ECONOMIC IMPORTANCE OF LEGUMES
The production of legumes in the world is increasing (Table 1). However, legumeproduction could be increased more to meet the market demand. In 1998/99, United StatesDepartment of Agriculture (USDA) has estimated the world soybean production to be around154.32 million mt, a decrease of about 5.5 million mt from 1993 to 1998. The United Statesis the largest producer and has increased production from 73.18 million mt to 75.03 millionmt due to the expansion of soybean production in corn and wheat fields. But in Brazil,Argentina and China, soybean production decreased in 1999 compared to 1998 (Table 1).
- 54 -
In 1999/2000, the world production of soybean will be slightly lower due to the unpredictableeffects of genetically modified soybeans being questioned by the consumers.
Table 1. World Production of Grain Legumes, 1993-99(Unit: 000 mt)
Source: Agricultural Statistics of Thailand 1998/99.Note: Figures in parentheses are the percentage of world production of legumes.
World production of peanut in 1999 was around 33.1 million mt (Table 1). The majorworld peanut producers are China, India, the United States, and Argentina, with a productionof about 36.11 percent, 28.37 percent, 5.99 percent, and 2.43 percent, respectively. In1998/99, USDA estimate of world production of peanut was about 27.76 million mt, anincrease of about 3.87 percent from 1997/98 due to increase in production by China, Indiaand the United States. The production of other legumes has been quite variable dependingon their availability and price. The major legumes in Thailand are soybean, peanut and mungbean (Table 2) (Agricultural Statistics of Thailand, 1998/99). The soybean productiondecreased since 1995 due to high production cost, low yield and lower return. The farmerscould earn higher income from other crops.
Table 2. Major Legumes (Grains) Production in Thailand, 1994-99(Unit: mt)
Source: Agricultural Statistics of Thailand 1998/99.
Since 1995, the demand for soybean in Thailand has increased by 18.34 percent whilethe local production declined and the import increased to 70.69 percent in 1998. In 1999,Thailand imported 870,000 mt of soybean grain for oil extraction and 1.3 million mt ofsoybean meal for animal feed. Due to the growth of animal industry, the demand for soybeanmeal will increase. The projection is the import of grain soybean and meal will reach 3million mt in 2001.
- 55 -
India produced 7 percent and 2 percent of world production of chickpea and pigeonpeas, respectively. To achieve nutritional complementarity, cereals and legumes need to beconsumed in the approximate ratio of 2:1. The consumption of cereals and legume has beeninvestigated on all continents. For example, rice with soybean in Southeast Asia, sorghumor millet plus chickpea or pigeon pea in South Asia, sorghum or millet with cowpea inSahelien countries and maize with lima beans in Latin America have been studied (Hulse,1991). The FAO statistics indicate in Latin America the total production of cereals andlegumes is in the ratio of 70:30. Across Asia the ratio is closer to 90:10. In recent yearslegume production is declining, possibly due to the greater appeal of higher yield cereals tofarmers. In most areas legumes are grown on poor land and given less attention than themore profitable cereal grains. Cereals are also processed to have more variety.
The other dried legumes production in Thailand is quite variable. From 1994 to 1999,peanut production increased about 2.04 percent since this legume is used locally as aningredient in various food products. The export of peanut has also declined by about 28.76percent due to its higher price, compared to that from neighboring countries. In 1998/99,about 1,660 mt of processed peanut products were exported (about 98 percent to Malaysia).
There are two types of mung bean being cultivated in Thailand; mung bean and blackmatpe bean. Mung bean production was declining from 1994 to 1998, primarily due to laborshortage. In 1998/99, the government launched a promotion campaign to grow mung beaninstead of the second rice crops. As a result, the mung bean production increased. Mungbean is used for starch, vermicelli and bean sprout production. In 1998, local consumptionof mung bean was about 180,187 mt or 95.54 percent of total production.
In 1994, black matpe bean was the major legume exported from Thailand. However,in 1999, mung bean was the major export legume followed by black matpe bean (Table 3).Japan, India and Pakistan are the key markets for Thailand black matpe bean.
Table 3. Legumes (Grains) and Their Products Export from Thailand, 1994-99(Unit: mt)
Source: Agricultural Statistics of Thailand 1998/99.
The problems in producing dried legumes are: 1) maintaining the good grain quality;2) high production cost; 3) low productivity; and 4) difficulty in marketing. Most farmersin developing countries are small landholders, and they usually grow legumes after the cerealcrops like rice, corn and sorghum. Post-harvest handling, transportation and storage are themost important factors limiting the product quality of dried legumes.
- 56 -
TRADITIONAL PROCESSING AND UTILIZATION OF LEGUMES
Inefficient post-harvest handling of legumes in developing countries affects the grainquality. Traditional practices still employ manual labor. When post-harvest machineryreplaced the manual operation, especially in the rural area several problems wereencountered. Generally, 95 percent of bean production was sold directly to the localmerchants, and the rest was sold through local middlemen or truckers.
Most farmers in developing countries dry their mature beans under the sun. Localmerchants introduced several threshing, shelling and grading machines. Some farmer groupshave their own local versions of the machines, if they can obtain a better price. Improvedinfrastructure, roads and markets could facilitate the farmers to improve their bean qualityand price.
SoybeanThe traditional processed soybean food products in Southeast Asia can be classified
into two categories: non-fermented and fermented.
1. Non-fermented Soybean Productsa) Soybean milk – Soybean milk can be prepared at home by grinding whole soybean
with water and straining to make rich, creamy milk “soy milk”. The product has aunique, beany flavor, which is a well-accepted beverage in Southeast Asian countries.The processing technology for soy milk is well-developed and therefore packaged soymilk is available through food stalls. At the local market, soy milk is usually dispensedfrom large stainless steel urns. At present, plain, sweetened and flavored soy milk inultra heat treated (UHT) packaging is also available. Instant soy milk powder has alsobeen developed for convenient use. Pasteurized soy milk can be stored in therefrigerator for a week.
Soy milk factories use sophisticated equipment and market them in tetra packsand plastic bottles and their shelf life is about six months. The indigenous soy milktaste, texture and flavor in those containers are still retained, as traditional products inthe fresh market. At present, three large companies are producing and marketing soy-products. Bean quality is the major problem. The factories purchase the bean throughcontractors and store them in their own warehouses. Local soybean is the best rawmaterial for soy milk processing, even though the factories have to store the beans,paying interest and rent. Normally, the factories have to stock their grain supplies forabout four months. The arrangement to purchase soybeans has to start early in theseason, since the premium grade is in high demand.
The market potential for soy milk is expected to expand and even compete withsoft drinks, especially in the Thai market.
b) Tofu or soybean curd – Tofu is prepared from soy milk. After coagulating soy milkwith coagulant, the curd is separated from the water and pressed into blocks or rolls.There are several soft/hard gels like products promoted in the market; white hard curd,yellow hard curd, white soft and soft curd in plastic bags.
Based on production capacity of tofu industries they are classified into twotypes.
i) More than 1 mt of grain used daily – about 200 factories; andii) Less than 1 mt of grain used daily – more than 5,000 factories.
- 57 -
The tofu production is considered as a cottage and small-scale enterprise. Thereare two to three medium-size factories investing in more sophisticated machines toproduce packaged firmer curd or pressed tofu in airtight plastic containers andmarketed in the supermarket. Their shelf life under refrigerated storage is about oneweek.
The factories buy premium grade grain from local farmers for tofu production.The market potential of tofu products is expected to expand in the future. With thedevelopment of more varieties tofu is made with different taste, texture and flavor.
c) Yuba – A sheet-like coagulant, yuba forms on the surface of warm soy milk as it cools.The soybean sheet contains emulsified oil from soy milk, high protein and a delicateflavor. Yuba production is a cottage industry. The film is formed at the surface ofsoybean milk, which is boiled until the sheet of film is thick enough, and then it isremoved from the surface of soy milk by using a stick. The wet sheet is placed overa sheet of thick cloth, and air-dried by hanging them on a bamboo pole. The yuba isused for wrapping meat and vegetable fillings in Chinese cuisine.
2. Fermented Soybean ProductsThere are several fermented soybean products available in the local markets. In
Thailand, most fermented soy-products are similar to Chinese soy-fermented products suchas soy sauce, soypaste, tao-si (fermented black-skin soybean), thua-nao (natural fermentedsoybean), and sufu (fermented curd). The processing still employs traditional methods. Eachfermented product has a specific aroma, flavor and taste, that consumers could distinguishsince they are quite familiar with those characteristics.a) Soy sauce (Si-iu) – Several factors should be considered to produce quality fermented
soy sauces. The soy sauce should have a bright reddish-brown to dark-brown color,with a salty taste, unique sharp flavor and aroma. It is made by hydrolyzing cookedsoybean, with the addition of wheat or rice, by enzymes during mold and bacterialfermentation.
A two-stage fermentation is required to produce soy sauce. The first stage is kojiproduction followed by second stage, called aromi fermentation and the last step ispreparation of the extract. Production of koji is an aerobic solid-state moldfermentation by Aspergillus oryzae for 3-4 months. Aromi fermentation is an aerobicfermentation at 20-22 percent (w/v) brine solution by mixed cultures of halophilicyeast and lactic acid bacteria (Charoenthamawat, 1997). The perfect fermentation ofaromi should produce a bright reddish-brown color, pleasant aroma and salty taste.
b) Soy paste (Tao-cheow) – The soy paste is semi-solid, light brown to dark brown color,salty taste with specific flavor and aroma. Using microorganisms; Aspergillus oryzae,Lactobacillus delbrulckii, Pediococcus halophilus, Saccharomyces sp. Koji productionwas developed. After the first stage of koji fermentation, about 3-4 months, the liquidwas separated for production of soy sauce. The resulting paste-like solid part is packedin bottles and pasteurized. Soy paste can be kept for many years, but the flavor willimprove if the product is kept for a year.
Most fermented soy products are processed into both soy sauce and soy pastewith the ratio 70:30, 60:40 and 50:50 depending on the market requirement(Maneepun, et al., 1997). There are more than 100 soy sauce and soy paste factoriesin the country, of which only five factories have large production capacity. The marketfor both fermented soy products is growing at an annual rate of 15-20 percent.
- 58 -
c) Fermented soy curd (Tao-hu-yi) – Fermented soy curd is a soft cheese-type productwhich is made from cubes of soybean curd by the action of fungal culture,Actinomucar elegans. The product has a yellowish or red color, salty taste withcharacteristic aroma. Yellowish color type is eaten directly as a relish and the redcolor type is cooked with vegetables or meat. Making fermented soy curd involvesthree steps; preparing tofu, molding and brining.
The surface of soybean curd is applied with pure culture of appropriate fungus,then it is incubated at 20ºC for 3-7 days. The product needs to age for about 40-60days to develop the specific flavor and aroma.
d) Fermented whole soybean (Thua-nao) – Thua-nao is a traditional non-salted soybeanfermented like Japanese natto by mixing with microbial cultures and is widelyconsumed in the northern part of Thailand. The products available in the market areof two types:
i) Brownish-yellow paste with a slight salty taste and strong smell, and has ashelf life of about two days; and
ii) Brown dried chips with the same taste and smell and has a shelf life of twomonths.
The soybeans soaked in water are cooked in low heat for 3-4 hours until thebeans are soft and the water is drained. The beans are placed on a layer of banana leafon a bamboo tray and covered with banana leaves. The beans are allowed to fermentnaturally for 3-4 days until the beans are covered with a sticky, viscous and colorlessgum. Small quantity of paste is used to make small ball of one to one and half inchesdiameter and they are processed to form thin chips, sun dried and marketed.
Through research, it was found that use of mixed culture fermentation ofoligosaccharides, utilizing Bacillus subtilis and vitamin B12 producing Bacillusmegaterium, has improved the quality of thua-nao. Soybean oligosaccharide sugarutilizing Bacillus was isolated from various sources of thua-nao. Bacillus subtilis B4was found to produce the best proteolytic activity, as well as soybean sugar-utilizingproperty, among 120 Bacillus isolates. Mixed fermentation of Bacillus B4 and Bacillusmegaterium under optimum conditions, could improve the quality of thua-nao byenhancing more digestible soybean proteins, soybean sugar, as well as vitamin B12content in the fermented masses (Yongsmith, 1999). Factors affecting the fermentationare currently examined to produce a more sanitary and uniform product.
Thua-nao is considered as an inexpensive high-protein food that could be easilyproduced, and if properly prepared has a long shelf life. Thua-nao paste and chipscontain 16.9 percent and 36.8 percent of protein and 7.4 percent and 14.8 percent fat,respectively. Due to high vitamin B12 thua-nao products have become popular amongvegetarian population.
e) Imitation fried pork rind (kap-mu-tiem) – Fried pork rind is a well-known snack thatis widely consumed in the northern part of Thailand. Imitation fried pork rind has beendeveloped by inoculating tofu with Mucor zychae, dried and fried.
The kap-mu-tiem is commonly processed by the home-scale industry. Soakedsoybean is ground with water and strained through a coarse cloth to separate theextracted soy milk from the insoluble residue. The milk is heated to a boil and cooledto about 50ºC. Calcium or magnesium sulfate is added to coagulate the protein.Finally, firm cake-like curd (tofu) is formed by shaping the coagulated protein in awooden box with a weight on the top to press out the whey. Tofu is cut into
- 59 -
11.0×2.5×1.5 cm and then inoculated with the mold, Mucor zychae. The inoculatedtofu pieces are incubated at 22-23ºC or room temperature for 24 hours. The pieces aredried at 90ºC for four hours to stop mold growth. The mycelium is washed off with10 percent saline water, and then slowly dried again at 40ºC for 12-18 hours. Theproduct has to be fried before being consumed (Kuruwana, et al., 1980).
Kap-mu-tiem is considered an inexpensive high-protein food and a good sourceof B-vitamin. Fried kap-mu-tiem has 44 percent protein, 42 percent fat and 1-2 percentmoisture. This fermented soy food is quite popular among the population, who enjoyconsuming kap-mu-tiem for health reasons.
Peanut ProcessingPeanut is predominantly utilized within Thailand. A few processed products such as
roasted, dried, boiled peanut cake are exported. Research relevant to selection of peanutvarieties with low aflatoxin has been undertaken. Research also focused on post-harvestpractices to prevent microbial contamination (Maneepun, 1991). Boiled, dried, roasted andconfectionery peanuts are used for direct consumption. Vendors use simple packaging. Thepeanut factories undertake shelling, boiling, drying and oil extraction. About 117 shellingfactories handle a capacity of more than 55,000 mt per year. Ten boiling and drying factoriesuse 15,600 mt per year. Thirty-four oil extraction factories use about 30,000 mt of shelledor 45,000 mt of unshelled peanuts, and produce about 10,000 mt of peanut oil.
Peanut oil extraction industry normally uses hydraulic or screw press and solvent withan extraction capacity of about 85-90 percent of total oil extraction. Peanut cake containingabout 50 percent protein is used for animal feed, since it is a low-quality product. Bothrefined and unrefined peanut oil are available in the local market.
Peanut bar and coated roasted peanut products are processed and packaged usingmodern equipment to keep them fresh and to prolong their shelf life. Such new products withdiverse flavors and texture could become major snack foods for export to neighboringcountries.
Mung Bean and Black Gram processingAbout 73 percent of domestically produced mung bean is used for local consumption.
The largest processing industry is transparent noodle and starch extraction, which accountsfor about 20 percent. Since transparent noodles are processed from mung bean starch, it isusually recovered from noodle processing. Traditional noodle processing is still popular.Recently modern machines for starch extraction has been developed. The recovery of starchis low with traditional technologies. To increase the recovery rate, wet and dry millingtechnologies have been developed. Wet milling is commonly employed in most industriesand the residue from milling extraction is used for animal feed. The technology to recoverbyproduct (bean residue and waste liquor) has been developed. The residue is used formaking high protein food. However, at present, protein residue is utilized only as animalfeed. The utilization of protein from these noodle factories is commonly practiced in thePhilippines, Taiwan and China.
Bean sprouts are processed from mung beans and black grams. Bean sprouts areproduced daily to have them fresh. Traditional technology is used at home level or cottageindustry level. In the canning factories, bean sprouts are packed with mixed vegetables foroverseas market, but the market is still small.
- 60 -
Many colorful and attractive desserts are prepared from mung bean for localconsumption. These preparations are done at household and cottage levels. Mung bean flourfrom wet-milling technology is processed as a secondary food product, for further processing,which is available in the local market. This flour is used as stuffing in various dessertproducts.
Ten mung bean-milling factories, export mung bean products. Most milling factoriesemploy traditional technology, and after milling losses are about 30 percent. Since polishedmung bean has potential market in Japan and Middle East countries, some technologies fromIndia and Taiwan to polish mung bean has been imported and used. Polished mung bean hashigher value than unpolished mung bean, use of machines will improve efficiency andquality.
MODERN PROCESSING AND UTILIZATION OF LEGUMES
SoybeanThe soybean industry has introduced a number of new technologies that have, and will
continue to have, significant impact starting with farming methods, bulk commodity storage,handling and distribution infrastructure. Soy meal and oil are the fundamental products ofsoybean, from which most other processed soy-related products are derived. In processing,the beans are first cleaned to remove foreign material. They are then dried and cracked intosmall pieces and dehulled. The resulting pieces are heat conditioned and rolled into “flakes”that are ready for oil extraction. Oil is extracted from soybean flakes by using hexanesolvent. The protein-rich flakes are conveyed to toasters and are dried and ground while thecrude soybean oil is degummed and refined for edible and non-edible uses.
Soybean meal serves as the basic protein source and is mixed with corn for use asanimal feed. It is also processed into high-value food items such as soy flour, soy grits andsoy protein isolates. Soy hulls are used in high fiber breads.
Refined soybean oil is used throughout the world in such edible products as cookingoil, salad dressings, margarine, shortening and mayonnaise. The degumming process alsoyields lecithin, which is widely used in the candy and baking industries.
Soybean is also used in several food industries as full fat soy flour for baking, soy-based beverages, snack foods and a myriad of traditional foods such as soy sauce, tofu, misoand tempeh. Led by soy milk and tofu, the United States soy food industry has been growingby an annual rate of 35 percent over the past few years and is expected to sustain a growthof 15-20 percent for at least the next 10 years.
Texturized vegetable protein (TVP) made from defatted soy flour using single- andtwin-screw cooker extrusion, is available in dry forms. Various styles of TVP can be foundin granules, flakes, chunks or slices. The product has low moisture and has a long shelf life.It can be kept in an airtight container at room temperature for several months. TVP must bereconstituted with equal quantity of water before use, and it can also be used as a meatsubstitute in main dishes and processed foods.
There are various technologies for developing soy flour, protein isolates, concentratesthat can be incorporated in thousands of processed foods such as baked goods, meat products,protein drinks, soup bases and gravies.
Peanut IndustryPeanut processing technology has been developed similar to that of soybean. Peanut
flour is obtained from oil extraction process. The flour (meal) protein concentrate and isolate
- 61 -
for human consumption has to be prepared from edible-grade peanuts. The specific use ofmeal in various processed food products to improve nutritional quality has been developed,but the products are not as popular as soybean. Canned boiled peanut and frozen boiledpeanut have been promoted in the global market. Various peanut-based snack foods arepacked in attractive packaging. Peanut butter processing is quite a large industry. Thequality of peanut butter has improved substantially since its discovery and initialmanufacture. Good practices in storage, handling, processing and packaging have resultedin a product that is consistently high in quality. Good quality, nutritional value, economy,and preferred flavor continue to make peanut butter a popular food product.
Mung Bean Noodle ProcessingMung bean cracking machine, a grinder that separates liquid and solid, a starch
separator, a starch mixer and a noodle machine have been developed for making transparentnoodles which are widely consumed in South-East Asian countries. The development ofthese economical machines is for the small noodle industry. The noodle characteristics areevaluated for texture and color. The diameter of noodle is consistently about 0.5-1.5 mm.
FUTURE PROSPECTS AND ISSUES INLEGUME PRODUCTION AND UTILIZATION
Improved soybean varieties in the future should help the farmer to reduce the cost ofproduction and increase the productivity. Improved management technology should addressthe no-tillage production of legumes. Farmers should be able to choose varieties based onthe soil type, moisture conditions, and biotic stresses.
Biotechnology developed herbicide resistant soybeans have brought considerablecontroversy among the public. Bio-safety, food safety, and environmental concerns are themajor issues. There is a need to have cost effective technologies to detect geneticallymodified organism (GMO) and genetically modified food (GMF) so that labeling of suchitems can be effective.
Although biotechnology is a tool to increase world food production, there is an urgentneed to educate the public. It may take time. Cereal and grain legume combination is anexcellent one to combat growing hunger and malnutrition due to population growth.
REFERENCES
Charoenthamawat, P., 1997. Fermented Soy Food Products in Training Course onAgricultural Products Processing and Quality Control, Ministry of Education andCulture, Indonesia, 1 July-10 October, 8 p.
Hulse, J. H., 1991. “Nature, Composition, Utilization of Gram Legumes”, in S. D. P. Hall,Vithal R. Sidher, and V. Sadhana (eds.), Use of Tropical Grain Legumes – Proceedingof a Consultant Meeting, pp. 11-27, 27-30 March 1987, International Crops ResearchInstitute for the Semi-Arid Tropics (ICRISAT), Patancheru, Andhra Pradesh, India.
Kuruwana, P., S. Phapavat, W. Varanyanond, and S. Reungmaneepaitoon, 1980. “Kap-Mu-Tiem”, Food, 12 (1):43-51.
- 62 -
Maneepun, S., 1991. Prospect for Post-harvest Handling, Utilization and Processing ofFood Legumes and Coarse Grains (FLCG) in Thailand, RAS/89/040 Working Groupin Post-harvest Handling, and Coarse Grain (FLCG), 18-23 August, Chiang-mai,Thailand, 29 p.
Maneepun, S., S. Vatanutchariya, S. Taksinavisuth, W. Varanyanond, B. Sutsukon and S. V.Langley, 1997. Project on the Study and Database Development of Soybean and OilCrop: Research on Soybean Industry, Office of Agricultural Economic, Ministry ofAgriculture and Cooperatives, pp. 24-27 and 46-50, 30 December, Bangkok, Thailand.
Ministry of Agriculture and Cooperatives. Agricultural Statistics of Thailand 1998/99,Center for Agricultural Information, Office of Agricultural Economics, AgriculturalStatistics No. 31/2543.
Yongsmith, B., 1999. “High Vitamin B12 Fermented Soybean (Thua-nao) by Mixed Culturesof Bacillus sp.”, Proceeding of World Soybean Research Conference VI, 694-695.
* This paper was presented to the APO Seminar by drawing largely from the draft that theauthor was preparing for the JIRCAS Integrated Research Project in India.
- 63 -
3. MODERN PROCESSING AND UTILIZATION OFLEGUMES – Recent Research andIndustrial Achievements in Soybean Foods in Japan –*
Akinori NoguchiDirectorCrop Production and Postharvest Technology DivisionJapan International Research Center for Agricultural Sciences (JIRCAS)Ministry of Agriculture, Forestry and Fisheries (MAFF)Tsukuba, IbarakiJapan
INTRODUCTION
In Japan, five million mt of soybeans are imported annually. However, four millionmt are used for edible oil production resulting in more than three million mt of defattedsoybean. About 90 percent of defatted soybeans is used as livestock feed due to shortage offeed resources in Japan. According to the Food Balance Sheet (MAFF, 1996), the domesticsoybean production was less than 120,000 mt whereas the amount of imported soybean was4.813 million mt. Domestic consumption of soybeans for feed, seed, industrial use, waste,gross food and net food in 1996 was 110,000 mt, 3,000 mt, 3,901,000 mt, 120,000 mt,785,000 mt, and 785,000 mt, respectively.
In general, soybean foods are considered as subsidiary items for the principle foods(e.g. cooked rice) in Japan. The continuous decline in rice consumption results also inreduced demand for soybean foods, especially among young Japanese, due to the change intheir dietary habits. Since the early 1980s, Japanese food markets have been stagnant and thefood companies continue to diversify their soybean products by making new products suchas substitutes for meat proteins and extenders and improving the quality of final products.Therefore, soybean food companies are putting a great deal of effort into food research onsoybean foods so that they can gain new markets. The recent research on the functionalityof soybean foods and their hydrolyzed intermediates, encourages soybean food companiesto continue their research efforts.
This paper will review the recent research and industrial achievement in soybean foods,including the major traditional foods in Japan.
TRADITIONAL USE OF SOYBEAN
Major traditional soybean-based foods are miso, soy sauce and tofu.
- 64 -
Rice Miso and Wheat MisoKoji starter
Activator, salt and waterRice Miso
Soybean Miso
Rice FermentandCure
MixSteamSoybeans
Koji starterActivator, salt and waterWheat
Wheat Miso
Soybean Miso
Koji starterSoybeans
Salt and water
Salts
W ater
Soy Sauce M aking
Mixing
Stea ming
Roast and Grind
Koji M aking
Soybean
W heat
Koji Starter
Co m pressionFresh
Soy SauceHeating Inspction Bottling Shipping
M oro mi
Miso“It’s Mom’s Taste” is the way people describe the taste of miso. Both the taste and
color of miso change according to the place of origin. Figure 1 shows the processes of misomaking from different materials.
Figure 1. The process of Miso making
Soy SauceIt takes time to brew the natural ingredients for “Soy Sauce”, much like the aging of
fine wines and cheeses. Wheat grains are roasted and crushed while soybeans are softenedby steaming (Figure 2). A special seed starter is added to the wheat and soybean mixture andleft to sit for three days. This forms a dry mash called koji. The koji is combined with saltand water to form moromi, which is fermented in large tanks until it reaches its full flavor.Moromi is then poured onto cloths, folded and pressed in order to obtain the raw soy sauce.The extracted soy sauce is refined and pasteurized, and the finished product is packaged inbottles.
Figure 2. Outline of Soy Sauce Making
- 65 -
Figure 3. Yuba MakingFigure 4. Shimi-tofu
TofuTofu is made using the following method: tofu grade soybeans are soaked overnight
in water. After draining the water, a small quantity of boiling water is poured, the beans arepulverized. The mash is ladled into boiling water, like dumplings, and allowed to boil gentlyfor about 10 minutes. This stage of the process is crucial since enzymes of the bean areinactivated during boiling. The resulting slurry is filtered to obtain soy milk and the residualmaterial is called okara. A small amount of either calcium sulfate (CaSO4) or magnesiumchloride (MgCl2) is added to coagulate soy milk. In this regard, the Chinese have been usingcalcium salts mined from mountain quarries for over 2,000 years. That salt is the pure formof gypsum. On the other hand, the Japanese traditionally use sea salt that contains smallquantity of magnesium chloride (MgCl2). After the coagulant is introduced, the milkseparates into curds and whey. The curds are gently scooped off the top of the whey andladled into a mould lined with cheesecloth. The forming container has many small holes toallow drainage of the whey.
Typical derivatives from soy milk or tofu making are “yuba” and “shimi-tofu”. Therelatively thick soy milk is poured into a shallow pan and heated to evaporate the water. Athin film formed on the surface of soy milk is gently removed and then dried. It is called“yuba”. This process of dry-denaturation of soy milk results in cross-linking of proteins. Asthe film is pulled up (Figure 3), the remaining soy milk is concentrated with its carbohydratesand therefore, the films at early stage have fine texture and high quality.
Shimi-tofu (Figure 4) is prepared from soy protein curd. The curd is cooled to below0ºC to form small ice crystals. As ice crystals grow, protein is concentrated and closeproximity of reactive proteins allows additional linkages. The frozen curds are thawed toexpel excess water, forming dried compound having sponge-like texture called shimi-tofu.
The consumption of each soybean product in 1998 was not so different from theprevious years, and is as follows (in mt): miso, 165,000; soy sauce, 26,000; tofu and itsderivatives, 494,000; fermented soybean, 122,000; shimi-tofu, 30,000; and others, 101,000.The domestic soybean has been used mainly for making foods due to its higher proteincontent, matched size and good taste. The consumption pattern was 44 percent for tofu, 30percent for cooked beans and side dishes, 13 percent for fermented soybean and 9 percent formiso and other products. Data suggest that the market size of traditional foods of soybeanis not likely to increase very much in the future in Japan.
- 66 -
Soybean Soy Milk
ProteinCurd
IS P
Oil
Fiber
Granule Textured
Powder Fibrous
Peptide
W ater solublleFibers
T V P
Food Ingredients from SoybeanAs shown in Figure 5, soybeans are used to make various products such as meat
extenders and meat analogues with well-controlled nutritional value.
Figure 5. Soybean-derived Ingredients
According to the Japan Association of Vegetable Protein Foods, the production of foodderived from vegetable proteins in Japan was about 61,000 mt in 1997, consisting of 41,000mt from soybean and 20,000 mt from wheat by materials and 45,000 mt of texturizedvegetable protein (TVP) and 29,000 mt of powder by product form.
Extrusion cooking is widely used to make TVP in Japan. Some novel technology andresearch related to soybeans processing in Japan are described below.
EXTRUSION COOKING
The twin-screw extruder has attracted the attention of researchers and foodmanufacturers because of its high capability in material transportation as compared to thesingle screw type. The better mixing, kneading, heat exchange and self-cleaning functionsof twin-screw extruders also provide an incentive to develop such food technology in orderto overcome the difficulties associated with the single screw type. Recent development oftwin-screw extruders provides us with new applications in various food processing, especiallyto wet processes. The idea of a cooling die also promotes this development and enables usto process fish and animal meats that could not be texturized with the extruder in the past.
Fate of protein in extruders can be summarized as follows: the material is transportedto the first heating zone where the proteins are reacted, denatured and separated from othercomponents (e.g., oil and carbohydrates). Then they are fragmented into small coagulatedparticles. These particles are melted at higher temperatures and deformed by the shear stressimposed by the screw movement and the die. While the melted materials pass through the
- 68-
suggest that the -S-S- exchange reaction at higher water contents occurs at neutral pHbecause the extrudates show the highest strength at pH 7 and higher protein solubility in abuffer containing SDS + 2-mercaptoethanol. When DSF is extruded at various watercontents (20-60 percent) and different residence times at constant barrel temperature, theextrudates have lower solubility at lower water content and/or longer residence time. NearInfrared Analysis (NIR) shows the higher absorbance of -NHCO- for DSF processed at lowwater content in the high pressure cell.
These results suggest that two protein reactions, probably -S-S- and isopeptidebonding, compete with each other under the given conditions and that the latter likely takesplace at lower water content and/or longer heating time. Isopeptide bonding is a kind ofcondensation reaction, just like amino acid polymerization which prefers dry conditions.Artificial peptide bonding should be avoided in order to maintain digestibility of products(Hurrel and Carpenter, 1977).
The thermoplastic property of protein at higher temperatures enables us to apply aninjection moulding method to make a large meat lump. Isobe and Noguchi (1988) designeda special moulding and confirmed its high potential for DSF, deboned chicken and fish meat.
Wet extrusion is opening the way for fish and meat products. For example, one of themembers of the R&D Association texturized the minced meat of Alaska pollack to a new crabmeat analogue, “Kanikama”, using the twin-screw extruder equipped with a cooling die. Thisproduct and its derivatives are gaining great success in the Japanese markets. Figure 7 showsthe attractive product and its finely aligned string structure. Kanikama has been made bycutting sheets of fish protein curd into thin strings and bundling them to have a similar sizeto natural crab muscle. However, this company transformed fish proteins into more finelyaligned strings (<60 :m) with wet extrusion and the resulting Kanikama is improved in thebreaking strength by 1.5 times over the current Kanikama. It also possessed very similartexture to the natural one.
Ido, et al. (1993) examined the formation of fibrous structure in processed cheese usingtwin-screw extruder. They used two types of cheese, both contained whey proteinconcentrate (WPI [whey protein isolate]: protein content 75 percent). Gouda cheese ripenedfor two weeks and Emmental cheese ripened for eight months. The mixtures were fed intotwin-screw extruder and cooked at 70-90ºC then cooled to approximately 45ºC in a low-shearkneader and subsequently stretched to obtain fibrous structure. The mixture cooked at 70ºCand 80ºC showed better fibrous structure than that processed at 90ºC. A decrease infibrousness occurring when cheese was cooked at 90ºC was due to mutual adhesion ofprotein strings by heat. WPI probably protects the individual protein strings formed in cheesefrom their fusion by being absorbed to them and hence reducing their hydrophobicity, asshown in Figure 8.
There still remain some uncertainties in twin-screw extrusion cooking for foodmanufacturers. The large capital investment needed makes the industry hesitant to get twin-screw extruders in spite of the high potential of this technology. In short, the future of twin-screw extrusion cooking in Japan depends upon its being more economical with regard toflexible, optimum and automated operation, which can be accomplished by further researchto produce new foods.
- 69-
Initial A fter 3h
w ith W P I (5% )W P I: W hey P rotein Isolate
repulsion
W P I
Pressure range (MPa)200 400 600 800 1,000
Sterilization
Extraction
Control ofenzyme reaction
Food processing
Enhancement of chemical reaction
Control of ice growthDefrosting at low temperature
Anti-freezing process
Figure 8. String Formation and Its Protection with WPI
HIGH PRESSURE COOKING
Use of pressure in food processing gets less attention than thermal processing. It isbecause the test apparatuses for food research have been developed only recently. Inaddition, the high pressure range has hardly any relevance to food processing. However,recent advances in equipment are expected to make this technology more feasible for foodcompanies with the understanding that pressure can be momentary and equally applied to anyform and composition of food without leaving any physical damages or any pressure energyafter its release. The technique applies hydrostatic pressure of several hundreds MPa onfoods for the purpose of sterilization, protein denaturation, control of enzyme and chemicalreactions, homogeneous defrosting at low temperature and others. High pressure cooking isbased on cold isostatic pressing (CIP) originally developed for ceramics process and achievedby applying high pressure to the foods through the surrounding water or other liquids.
Figure 9. Pressure Range for the Applications
- 70-
Sterilization is mainly accomplished through heat treatments as one of the mostimportant processes involved in food manufacturing. Depending on the components of thematerials handled, however, one may try all possible means in order to avoid undesirablechanges and losses of components during thermal processing. For example, there are high-grade types jams that contain a fairly high proportion of strawberry which keep their originalform. Because of their high viscosity, the homogeneous and quick heat transfer in the jamcould not be achieved and thus such jams must be stirred well for long period during thermalsterilization. Longer stirring and heat treatment cause damages to strawberry, namelychanges in color and flavor.
High pressure sterilization does not cause thermal degradation and losses of heatsensitive components (vitamins, color pigments and aromas). High pressure equally sterilizesthe inside and the surface of foods, regardless of their shapes, and also reduces the necessaryenergy to one-tenth of that used in usual heat treatments. Until now, many researchesbelieved that high pressure affects proteins and cell membranes of microorganisms. It islikely that proteins are changed at $300 MPa and cell membranes are forced to change itsphysical state from liquid to solid at $100 MPa due to the increase of the melting point ofphospholipids under higher pressure. Generally, it is felt that the primary site damaged byhigh pressure is the cell membrane of microorganisms (Morita, 1975).
It should be noted that the necessary level of high pressure is variable depending onthe composition and pH of food. Higher concentrations of sugars, salts and amino acidsreduce the effects of high pressure on foods. Furthermore, the amounts and distribution offree water are the key for proper sterilization by high pressure. Recent research revealed thatmicroorganisms become more sensitive to high pressure at relatively higher (60-80ºC) orlower (>-20ºC) temperatures. Some spores could germinate under high pressure of about 100MPa and are inactivated at intermittent pressure of about 600 MPa. Hayakawa, et al. (1994)found that the oscillatory pressurization was more effective against B. stearothermophilusspores than the continuous process. However, the germination process is still unclear and notall spores germinate by applying pressure.
Bridgman (1914) reportedly carried out the first research on protein denaturation byhigh pressure. In Japan, Suzuki and Suzuki (1962, 1963, 1965) have done a number ofstudies on protein, demonstrating that protein denaturation occurred at 300 MPa, and that atabove 700 MPa, the changes became irreversible. Recent studies on high pressure cookinghave been expanded to cover fish protein (Yoshioka, et al. 1992 (1982?), seafood (Kimura,1994) and egg protein (Honma, 1994). Honma (1994) examined the binding of fresh meatswith egg white at 500 MPa at 20ºC for 10 minutes and found out that the prepared meats werenot separated from each other even after cooking at 200ºC. Pork meat could be processed byhigh pressure in order to make a new product like raw ham, that was well-accepted uponsensory evaluation (Honma, 1994).
Kajiyama, et al. (1995) applied high pressure (<500 MPa) to soy milk and examinedits protein changes. The soy milk remained as liquid within the range of examined pressureand its viscosity increased when the time of pressurization was less than 10 minutes.However, 500 MPa for 30 minutes solidified the soy milk. Soy milk showed betteremulsifying and stability properties but had poor capacity. Additionally the content ofsulfhydryl (SH) group residue in soy milk increased a little under anaerobic pressurization.The hard-type tofu could be made from the pressurized soy milk with CaCl2. Electrophoresisand isoelectrofocusing techniques revealed that soy proteins were dissociated while some ofthem were coagulated by high pressure. Fluorescence analysis also showed that soy proteins
- 71-
Figure 10. Bread Bodies Prepared with Ohmic Heating for Bread Crumbs Making
were modified by high pressure, having larger hydrophobic regions. After pressuretreatment, soy milk showed higher affinity to beany flavor components and saponin whichwould lead to better use of soy milk in soy foods.
High pressure cooking is characterized by: (1) the transfer of high pressure isspontaneous and does not depend on the shape of materials; (2) high pressure cooking is freefrom the problem of mechanical deterioration of materials caused by the agitation necessaryfor the homogeneous and quick heat transfer; (3) high pressure could be maintained by themechanical method and saves the energy needed for cooking, and; (4) the release of highpressure could be achieved instantly which makes the cooking controllable.
OHMIC HEATING
Generally, the thermal processing of food products involves heat transfer into the foodfrom hot surroundings, the driving force being the temperature gradient between the foodproducts and its surroundings. Heat transfer in liquid foods mainly takes place by convectionprovided the liquid is not too viscous. However, in processing particulate foods, the solidphase is only heated by conduction which is a much slower process than convection due tothe lower thermal conductivity of most foods (Sweat, 1986). The quality deterioration offood products during thermal processing could be minimized by a high temperature shorttime (HTST) process. However, there may be an upper temperature limit for avoidingovercooking of food’s surface.
When food products contain sufficient water and electrolytes to pass electric current,ohmic heating could be used to generate heat within the food products by the passage of analternating current. The method enables the solid phase or viscous liquids to be heated as fastas thin liquids, thus making it possible to use HTST techniques on solid or viscous foods.One of the industrial achievements of this technology in Japan is the production of 60 percentof the annual production of bread crumb using ohmic heating (Figure 10). The companiesclaim that such method saves production cost by reducing the necessary energy for heat andsimplifies the system.
The solid food such as plant tissue is composed of individual cell units separated bycell walls and membranes. The major component of cell membrane is phospholipid and
regarded as an electrical condenser. Therefore, it is likely that the frequency of thealternating current becomes one of the key parameters for quick heating by reducing theimpedance of plant tissue. On the other hand, the fish protein gel ‘kamaboko’ prepared fromAlaska pollack is reported to have a heating rate dependent on the frequency of alternatingcurrent, in spite of the fact that the gel does not have any membrane structure showing 7.5times the heating rate at 10 kHz compared with that in hot water (90ºC). These resultssuggest that the state of liquid components in the matrix will also be one of the key points forquick ohmic heating.
The following section focuses on effects of alternating current frequency on heatgeneration in the plant tissue and also the heating rate of egg albumin solution and its changeduring ohmic heating.
Imai, et al. (1995) extracted a cylindrical sample (30×30 mm) from the middle of theradish, which was perpendicular to its vascular bundle, and applied a sine wave of variablefrequency (50 Hz-10 kHz) of 20-40 V/cm through a titanium electrode (Figure 11). Of thefrequencies examined, 50 Hz gave the sharpest initial rise of temperature and the shortesttime to raise the temperature at the mid-part of radish to 80ºC. The heating rate above 60ºCwas linear for all frequencies. The pressurization (400 MPa, 25ºC, for 10 minutes) of radisheliminated the sharp initial increase of temperature observed at 50 Hz, and gave an almostlinear rise of temperature similar to those above 60ºC.
Figure 11. Schematic Diagram of the Ohmic Heating Setup
When radish was treated with a square wave (10 ms with 10 ms interval) of 45 V/cmfor 30 seconds, its impedance decreased and never recovered even after storage at roomtemperature for 20 hours. Upon treating at 50 Hz and 40 V/cm until its mid-part reached30ºC, or heated to 80ºC in hot water and then cooled to 30ºC, 1H-NMR imaging analysisshowed more free movement of liquid components than in the untreated radish. These resultssuggested that the initial rapid heating at low frequency was caused by the electroporationof tissue membrane of radish, resulting in reduction of its impedance. The breaking strengthof the ohmic heated radish revealed that the original rigidity was maintained at its outer parteven after heating. However the radish cooked in hot water was wholly softened, especiallyin the outer part.
- 73-
Temperature (ºC)100 50 Hz 500 Hz 10 Hz5 kHz
80
60
40
20
0 Time (second)0 400 800 1,200
Figure 12. Center Temperature Profile during Ohmic Heating at 40 V/cm
Ohmic heating of egg albumin solution (10 percent w/vol) was also examined by Imai,et al. (1995) at 50 Hz-10 kHz under constant 10 V/cm. The heating rate of solution wasalmost constant and slightly increased as the frequency increased. The gel formation wasobserved at about 75ºC and the heating rate was rather increased above this temperatureirrespective of frequency used. The solution and gel showed almost the same impedance atthe examined temperature (20-90ºC) and frequency (10 Hz-100 kHz). When theconcentration of egg albumin was reduced to 2 percent w/vol, this solution gave no gelformation and showed constant heating rate at over 75ºC. The breaking strength of gelsshowed little difference among the gels prepared by boiling water or ohmic heating. Theseresults suggested that the liquid components are not compartmentalized in the gel and thatthe sudden increase of heating rate above 75ºC was caused by the reduction of heat transferin gel at its phase change into gel. Imai, et al. (1995) also examined effects of ohmic heatingon fresh egg white at the same conditions as that of the egg albumin solution. The fresh eggwhite did not show any sudden increase of heating rate until it reached 90ºC. However, thehomogenized fresh egg white and its soluble part separated beforehand, showing the slightlyreduced heating rate and its sudden increase at about 60ºC. They concluded that thegelatinous component of fresh egg white such as ovomucin repressed the transfer ofgenerated heat during ohmic heating.
These results clearly indicated that ohmic heating provides quick temperature rise in plantsand protein solutions. The major benefits of ohmic heating are summarized as follows: (1)continuous production without heat-transfer surfaces; (2) rapid and uniform treatment ofliquid and particulates, with minimal heat damage and residence-time differences; (3) easeof process control with instant shut down; (4) reduced maintenance costs; (5)environmentally friendly system; and (6) ideal process for shear-sensitive products. SomeJapanese tofu manufacturers are interested in these characteristics of ohmic heating and havestarted to examine its potential for tofu making.
- 75-
Hurrel, R. F. and K. J. Carpenter, 1977. “Advances in Experimental Medicine and Biology”,Protein Cross-linking, Nutritional and Medical Consequences, Vol. 86B, p. 225,Friedman. M. ed. Plenum Press, New York.
Ido, K., T. Nishiya, K. Tatsumi, and H. Yamamoto, 1993. J. Japanese Soc. Food and Tech.,40, 170.
Imai, T., K. Uemura, N. Ishida, S. Yoshizaki, and A. Noguchi, 1995. Int. J. Food Sci.Technol., 30, 461.
Isobe, S. and A. Noguchi, 1988. Nippon Shokuhin Kogyo Gakkai Shi, 35, 471.
Kajiyama, N., S. Isobe, K. Uemura, N. Ishida, and A. Noguchi, 1995. International Journalof Food Science and Technology, V. 30, 147-158.
Kimura, I., 1994. Foods and Packaging, 35, 428.
Kitabatake, N., Y. Fujita, and S. Tokumaru, 1997. Soy Protein Res. Com., Jpn., V. 18, p. 31-36.
Kitagawa, M. and K. Nishi, 1988. Scientific reports of the Hokkaido Fisheries ExperimentalStation, 31, 63.
Morita, R. Y., 1975. Bacteriol. Rev., 39, 144.
Suzuki, C. and K. Suzuki, 1962. J. Biochem., 54, 214.
Food legumes are species belonging to family Leguminosae, that may be consumed bypeople or domestic animals, commonly as mature dry seeds. The grain legumes, or pulses,can also be consumed in certain instances as immature green seeds, or as green pods as avegetable. The two oleaginous legume crops, groundnut (Arachis hypogaea) and soybean(Glycine max) are grown primarily for processing into edible oils. The protein residues arelargely used as animal feed.
The grain legumes are important foodstuffs in most of the tropical and subtropicalcountries, where they are second only to cereals as a source of protein. The grain legumesare rich in protein (average 12-40 percent) and can be considered as a natural supplement tocereals. Although they are usually deficient in the essential amino acids methionine andcystine, they contain adequate amounts of lysine, whereas cereals are deficient in lysine, butcontain adequate amounts of methionine and cystine. The food legumes are also importantin cropping system because of their ability to fix nitrogen that increase the overall fertilityof the soil, thus partially replacing the use of expensive nitrogenous fertilizers. For example,a vigorous growing food legume such as the cowpea (Vigna unguiculata) can add as muchas 45 kg/ha of nitrogen to the soil, which is equivalent to 112 kg/ha of urea, or 255 kg/ha ofammonium sulphate.
PULSES IN BANGLADESH
A large number of pulses are grown and consumed in Bangladesh. The main ones are:lathyrus, lentil, chickpea, black gram and mung bean. The combined output of all otherpulses, which include pigeon pea, cowpea, pea, soybean and other minor crops, however,does not exceed 510,000 mt annually.
Pulses in Bangladesh are traditionally grown during the dry winter months except forsome beans which are raised around homestead. The land used for cultivating pulses,classified on the basis of water regime, falls into three categories:
C Level, marginal, unirrigated land where pulses are cultivated as a sole crop or as amixed crop with various cereals and oilseeds such as wheat, barley, millet, mustard,and linseed;
C Low-lying areas where lentil and lathyrus may follow deep-water paddy; and
- 80 -
C Relatively terraced land, subject to periodic drought, unsuitable for any cereal oroilseed crop in the rabi (winter) season.
Pulses have been considered poor man’s meat since they are the cheapest source ofprotein for the underprivileged people who cannot afford animal proteins. Pulses containtwice the protein content of cereals, they contain more protein, on weight-to-weight basis,than egg, fish and red meat. Cereal-based diets supplemented with pulses have improvedoverall nutritional value.
Pulses contain moderate amounts of minerals, particularly calcium and iron. It ispossible to meet the total mineral requirement of the body merely by consuming requiredamounts of pulses. Pulses can provide all the B vitamins lost in polished rice. It is wellknown that the availability of vitamins B and C is enhanced when pulses are sprouted. It isunfortunate that sprouted pulses are not commonly consumed in Bangladesh.
LathyrusLocal name: KhesariLathyrus sativus L.
Lathyrus is an annual, well-branched, semi-spreading to spreading herb.Pods are flat, oblong, slightly bulging over the seeds, 2.5-4.5 cm in length, 0.6-1.0 cm
in width. Dorsal part of pod is 2-winged, shortly beaked having 3-5 seeds.Lathyrus plant is tough enough to tolerate flooding and drought. Tolerance to flood
and drought has made it a very popular crop in drought-prone areas where heavy rains mayoccur for brief periods.
1. Harvest and Post-harvest PracticesThe leaves turn yellow and pods turn grey when mature. Pod shattering is common
when the crop is not harvested in time. The mature plants are normally pulled out or cut witha sickle near the base. The plants are then stacked and allowed to dry in the field in thethreshing floor for 7-8 days. The plants are spread out in the threshing floor and beaten withsticks. It is common practice to use cattle for trampling to help thresh the pods. The seed isthen winnowed and cleaned. Seeds are dried for 1-2 days before they are stored. Most of thefarmers’ lathyrus crop is stored for domestic use, only a small part is sold. The seeds can bestored without difficulty in ways similar to other pulse crops. Hay making is not practicedin Bangladesh.2. Use
The grain is used as complementary or sole source of calories and proteins, mostly bythe poor and landless laborers. The grains can be boiled whole but most often they areprocessed through a ‘dal’ mill to obtain solid dal. Dal is the most common item sold in theretail markets. The flour, made by grinding either whole or split seed, is also sold in themarket as ‘basan’. In many parts of Bangladesh, roti (unleavened bread) made out of khesariis a staple for landless laborers during the lean periods. The lathyrus dal and ‘basan’ areoften used to adulterate chickpea ‘basan’. There are reports that lathyrus seeds are alsoreported to be used in homeopathic medicine and its leaves are used as green vegetable.
LentilLens culinaris Medik
Pods are oblong, laterally compressed, bulging over the seeds, measuring 1.2-1.4 cm,rounded at base with a short beak at tip.
- 81 -
Seeds are lens shaped, about 4-8 mm in diameter. Color varies from light grey, brown,greyish-brown to greyish-black with speckles (marbled). Cotyledons are yellow to orangein color. The hundred seed weight may vary from 2-4 gm.
1. Harvest and Post-harvest AspectsPod shattering is common in lentil, therefore harvesting is done before all pods are
fully mature. Harvesting is done 15-20 days after the end of flowering and the plant and podsbegin to turn yellow and brown, respectively. The plants are either pulled out along with theroots or cut at the ground level. The crop is left to dry in the field or in the threshing floorfor about 6-7 days. When pods are brittle, the plants are beaten with sticks to remove thepods and break the pod wall. Later, the secondary threshing is performed by trampling withbullocks. The winnowed seeds are dried in sun for a day or two before they are taken homefor storage or to the village for marketing.2. Uses of Lentil
Lentil seeds (whole, decorticated, or as ‘dal’) are cooked and consumed. The largeseeded types are normally used as whole seeds. The small seeded types are used for making‘dal’. Several dishes are prepared from lentil in different countries. The ground flour oflentil is also used in some parts as a substitute for chickpea flour (besan).
The straw, broken stems and pod walls make excellent food for cattle. The youngplants may also be used for grazing as green fodder.
Black GramVigna mungo (L) Hepper
Seeds are oblong, measuring about 3 mm. Seed color varies from olive green to greyto black. Seed weight varies from 4 gm to 6 gm/100 seeds. Germination is epigeal.
1. Harvest and Post-harvest PracticesThere are two ways to harvest black gram. In the synchronous types where all the pods
mature synchronously, harvesting is done when most pods have turned black. The plants arepulled out or cut at the ground level with a sickle, then stacked for 6-8 days in small bundlesfor drying in the field or on the threshing floor. When the plants are dry and the pod wallsare brittle, the plants are spread on the threshing floor and beaten with sticks. Then cattle areallowed to trample on the plants to thresh.
Many local cultivars are non-synchronous, pod maturity extends over long periods.Pods have a tendency to shatter when left on the plants for a long time. The seeds may sprouton the plant itself, during the rainy season. Under these circustances, though time-consumingand labor-intensive, mature pods are picked manually. Two to three hand pickings may berequired (sometimes up to six pickings) to realize full yields.
In some areas pod picking is done once or twice and the remaining green plants areeither allowed for grazing by cattle, or cut for fodder or hay making. Green plants may beploughed into the soil as green manure to improve soil fertility. Storage of the grain issimilar to the other pulses.2. Uses
Black gram is one of the important pulses, providing grain for human consumption andfodder for cattle. The seeds are cooked commonly as de-husked, split or whole dal. Theblack gram dal is used to prepare several snacks.
- 82 -
Black gram is grown for fodder in many parts of the country. It is also the mostcommonly used green manure crop to enrich depleted soils.
The broken stems and pod walls remaining after threshing are used as cattle feed.
Mung BeanVigna radiata (L.) Wilczek.
Pods are linear, cylindrical, slightly bulged over the seeds, 5.0-9.0 cm long.
1. Harvest and Post-harvest PracticesThe harvest and post-harvest practices for mung bean and black gram are similar.
2. UsesMung bean seeds are used either whole or split into dal for several dishes. Mung bean
sprouts are also used to a limited extent. Mung bean dal is used to prepare sweets, and is alsofried in oil for use as a snack. Young seedlings serve as nice vegetable.
The green plant is used as animal fodder in many areas. It is also a good green manurecrop. The dried stems and shells remaining after threshing are also used as cattle feed.
ChickpeaCicer arientinum L.
Pods are ellipsoid, inflated, with dense glandular hairs, 14-25 mm long, and 8-15 mmwide.
Seeds are angular and beaked, 6-10 mm long, 77 mm wide. Seed coat color may bebrown, yellow, black or white with orange or pinkish tinge, sometimes with black spots.Surface of seed coat may be wrinkled or smooth. Cotyledons are yellow or pinkish yellow.
1. Harvest and Post-harvest PracticesIn Bangladesh, when rains occur during later stages, the subsequent water-logging may
lead to forced maturity. Leaves start yellowing, followed by yellowing of pods, and laterthey fall off. Chickpea is usually harvested when most of the pods are yellow and leaves turnyellow. Harvesting is generally done by pulling out whole plants or by cutting with sicklesat ground level (around big towns and cities, the whole chickpea plant with pods are sold inthe market for eating in green form).
The harvested mature plants are bundled and transported to threshing floor, or near-to-home drying yard. Plants are allowed to dry for 5-6 days until the pod wall becomes brittle.The bundles are spread out on the threshing floor and beaten with sticks to break the pods.After initial threshing, the partly threshed stems are trampled by cattle. Seeds mixed withsmaller stem parts and pod walls are winnowed to get clean seeds. They are dried on thethreshing floor before storage.2. Use
The young leaves are used as a vegetable. The green seeds from young pods are eateneither raw or cooked. The mature seeds are cooked as whole seed or after making ‘dal’. Theseeds can also be eaten after soaking in water overnight. Parched seeds are used as snacks,and in food preparation. The ‘besan’ is used for preparation of several salt and sweet dishes.
The dried and broken stems and pod walls after threshing serve as good cattle feed.Whole grains are soaked and fed to horses. The seed coat after milling for ‘dal’ is also goodas cattle feed.
- 83 -
Pigeon PeaCajanus cajan (L.)
The pods are flattened, slightly curved or straight, and bulging over the seedsmeasuring 6-12 × 0.8-1.5 cm, with a conspicuous beak. They are hairy, and their color variesfrom light green, green to purple with blotches. Pods contain 2-8 seeds.
Seeds are round or oval, slightly laterally compressed and flattened at the hilum. Seedsmay be white, with speckles, to yellow, brown chocolate or grey. The cotyledons are lightyellow to yellow brown.
1. Harvest and Post-harvest PracticesGreen pods are hand-picked when used as a vegetable. For grain at maturity whole
plants are cut at the base.The pods may be hand picked at maturity when a second ratoon crop is needed. The
cut plants are left in the field for drying. Sometimes the plants are tied and stacked in anupright position to facilitate drying of the pods. When the pods are completely dry, the plantsare spread on the threshing floor and beaten with sticks to separate the seeds from pods. Theseeds are dried after winnowing.2. Uses
Pigeon pea is a multipurpose plant. All plant parts are used in some form or other.The young leaves and shoots are used as fodder. Green pods are used as a vegetable
in many countries. The mature seeds may be cooked for consumption. Majority of peopleuse the pigeon pea after de-husking and splitting of cotyledons to make dal.
The husk and pod walls are used as cattle feed. The stems are used as fuel by ruralfamilies. In fact, many farmers cultivate pigeon pea mostly for use as fuel.
Pigeon pea is also used to rear silkworm and lac insects.
CowpeaVigna unguiculata (L.) Walp.
Pods vary in size, shape, color and texture. They may be pendant, erect or spreading,linear, crescent shaped or coiled; slightly laterally compressed or near cylindrical, slightlybulging over the seeds. Length may vary from 9.0 cm to 25.0 cm (even up to 100 cm), 5-12mm in width, with or without a curved beak. Color varies from yellow, light brown, topurplish-brown. Each pod contains 6-20 seeds.
Seeds vary in size, shape and color. They are mostly square-shaped, oblong, frequentlylaterally compressed, 5.0-9.0 × 4.0-8.0 mm. Color varies from white, cream, light-brown,grey with mosaic, with a brown ring around hilum. Cotyledons are white to yellowish-whitein color.
1. Harvest and Post-harvest PracticesThe green pods can be harvested for vegetable purposes within 12-15 days after
flowering. The pods mature in about 20-25 days after flowering. Mature pods are yellowish-brown. Maturity of pods is not synchronous in many cultivated types. One to two handpickings may be needed. However, in synchronous and determinate types, most pods maturesimultaneously. The plants are either pulled out by hand or cut at the base. The pods andplants are then allowed to dry in the sun for 7-8 days. When pods start breaking with littlepressure, threshing is done by beating with a stick or occasionally by trampling with cattle.
- 84 -
Green pods and seeds are used as vegetables. The dry seeds are used as a pulse. Itmay be cooked as whole or after removing the seed coat. It is not normally split to make‘dal’. Cowpea is also used as fodder and green manure.
PeaPisum sativum L.
Pods are 3.5-15.0 cm in length and 1.5-2.0 cm wide, flat or cylindrical, shortly stalked,straight or curved, beaked, reticulately veined when mature. Color varies from yellowish-green, grey, to purplish-grey. Young pods are fleshy and waxy; pod wall is lined withparchment like membrane. Pods contain 2-10 seeds.
Seeds are globose or globose angular, smooth or slightly wrinkled, 4-8 mm in diameter;color varies from white, green, orange-brown, to brown, with brown, or violet spots. Hilumis small, elliptic, light colored. Hundred seed weight varies from 15 gm to 25 gm.Cotyledons are light yellow.
1. Harvest and Post-harvest PracticesPeas for vegetable purpose are harvested at green pod stage for home consumption and
marketing. At maturity, the leaves and pods turn yellow. The plants are normally pulled outby hand and stacked for drying in sun. Pods are threshed by beating with sticks after they arefully dried. The seeds are then winnowed and cleaned, then dried before storage.2. Uses
Young pods are harvested for getting tender green seeds as vegetables.
GroundnutArachis hypogaea
The size of pods range upto about 8 × 2 cm. Each pod contains on average two seedsand occasionally more.
1. Harvest and Post-harvest PracticesEarly and late harvesting equally reduce yield. So care should be taken to determine
the optimum time for harvest. Pods are mature when kernels are fully developed. Maturationis indicated when test shows varietal color and seed coat wall inside the pod shows darkstreaks. Thus regular inspection is necessary to determine maturity.
The harvesting operation consists of digging, lifting, clearing, sun-drying andthreshing. The farmers in Bangladesh harvest manually.2. Uses
The whole nuts are roasted and are eaten directly with relish. Since the oil is good forhuman skin, it is used in the preparation of high quality soaps, hair lotions, cosmetics andtoiletries. There is, however, no oil extraction in Bangladesh.
SoybeanGlycine max (L.) Merr.
Pods vary in length from 3 cm to 9 cm, color normally yellow-grey or black. Seednumber varies between 2-5 with an average seed weight of 15-40 gm/100 seeds.
1. Harvest and Post-harvest PracticesAt maturity, leaves turn yellow and fall off. The pods turn brown and dry. A few
varieties have a tendency to shatter, so harvesting must be done at the right time. Commonlyfarmers pull the plants by hand and stack them for drying. However, it is advisable to cut the
- 85 -
stems at the base and leave the roots in the soil as this helps to improve the soil nitrogenlevel. The dried plants are spread on threshing floor and beaten with sticks. Winnowingshould be done carefully so that minimum damage occurs to the seed coat. The seed shouldbe dried thoroughly before storage.2. Use of Soybean
Soybean is rich in both protein and oil than any other legume crop. In Bangladesh,soybean could not become popular as a direct food either as whole seed or split dal. Themajor limitations of soybean for human consumption are indigestion, flatulence and stomachdisorders. Soybean contains some anti-nutritional factors such as trypsin inhibitors,haemagglutinins, saponins, and flatulents such as stachyose and raffinose. BangladeshCouncil for Scientific and Industrial Research (BCSIR) has developed recipes for use inBangladesh for several traditional food items using soybean seeds. Some of them are soymilk, soy bread, soy biscuits and soy chapati. A few industries have started manufacturingsome of these items for marketing.
PROCESSING OF PULSES
Milling of pulses involve removal of the outer husk and splitting the grain into twoequal halves. Generally, the husk is much more tightly held by the kernel of some pulsesthan most cereals. Therefore, de-husking of some pulses poses a problem. In Bangladeshthe de-husked split pulses are produced by traditional milling methods. In traditional pulsemilling, the loosening of husk by conditioning is insufficient. Therefore, a large amount ofabrasive force is applied for the complete de-husking of the grains which results in highlosses in the form of brokens and powder.
It is, therefore, necessary to improve the traditional milling to increase the total yieldof de-husked and split pulses and reduce the losses.
Traditional Dhal MillingThere is common processing method for all pulses. General operations of dry milling
include cleaning and grading, rolling or pitting, oiling, moistening, drying and milling.
Cleaning and GradingPulses are cleaned free of dust, chaff, grits, etc. and graded according to size by
rotating sieve type cleaner.
PittingThe clean pulses are passed through an emery roller machine. In this unit, husk is
cracked and scratched. This is to facilitate the subsequent oil penetration process forloosening of husk. The clearance between the emery roller and cage (housing) graduallynarrows from inlet to outlet. As the material is passed through the narrowing clearance,mainly cracking and scratching of husk takes place by friction between pulses and emery.Some of the pulses are de-husked and split during this operation which are then separated bysieving.
Pretreatment with OilThe scratched or pitted pulses are passed through a screw conveyor and mixed with
edible oils such as soybean oil (1.5-2.5 kg/mt of pulses). Then they are kept on the floor forabout 12 hours for diffusion of the oil.
- 86 -
ConditioningConditioning of pulses is done by alternate wetting and drying. After sun-drying for
a certain period, 3.5 percent moisture is added to the pulses and tempered for about eighthours and again dried in the sun. Pulses are finally dried to about 10-12 percent moisturecontent.
De-husking and SplittingEmery rollers, are used for the de-husking of conditioned pulses. About 50 percent
pulses are de-husked in a single operation (in one pass). De-husked pulses are split into twohalves. The husk is aspirated off and de-husked. Split pulses are separated by sieving. Thetail pulses and unsplit de-husked pulses are again conditioned and milled as above. Thewhole process is repeated two to three times until the remaining pulses are de-husked andsplit. The machines used for de-husking are either power-driven disc type sheller ‘chakki’or emery-coated roller machine.
Blowers are used for aspiration of husk and powder from the products of the discsheller or roller machine. Split dhals are separated from the unhusked and whole pulses withthe help of sieve type separators.
All pulse crops, except small quantities of chickpeas and peas, are de-husked beforeconsumption. Generally, pulse crops contain around 75 percent clean grain which isconsumed as food and 20 percent bran (coating around the grain) which is used as animalfeed; the remaining 5 percent is lost during processing on account of foreign matters (dustand dirt, chaff, particles of dried plants, stalks, non-seed etc.) which are separated/blown offbefore processing, and lost via evaporation of moisture and abrasion.
Pulses may be processed manually as well as mechanically. The growers generallyprocess the pulses manually for home consumption (including farm-labor). A study showedthat 17 percent of total pulses produced is consumed by the growers, and approximately 75percent of that is processed manually by the family members. Hence, approximately 13percent of total pulses produced is processed manually, and the remaining 87 percent isprocessed mechanically. However, cowpea, is primarily processed manually by theconsumers. A sizeable quantity of black gram is also processed manually by professionalhuskers in some areas.
Manual processing may be done with the help of “Jata” “dhenki”, mortar and pestleand simply two pieces of stones or wood. “Jata” is made of two pieces of disc-shaped stonesone placed over the other. At the time of processing the lower stone remains stationary whilethe upper stone is rotated clockwise. The pulses are passed through a hole in the upper stone;the equipment is then operated manually with the help of a vertical handle fixed with theupper stone. The husk/bran is separated from the grains by rubbing and constant pressure ofthe two stones.
The quantity of pulses processed manually by the respondents of the study varied fromless than one maund to over four maunds (Table 1).
Recovery of Dal, Bran and Milling Loss under Manual ProcessingAs mentioned earlier, the recovery of dal and bran and the extent of milling loss vary
with the type of pulse crops, extent of moisture and foreign matter contents and the natureof processing. Table 3 shows the proportion of dal, bran and the milling loss under manualprocessing in survey areas.
- 87 -
Table 1. Quantity of Pulses De-husked in a SurveyQuantity De-husked Number of Respondents Percentage
Less than one maund* 5 91-2 maunds 11 192-4 maunds 19 33Above 4 maunds 21 37Not reported 1 2Total 57 100
Note: Maund = 37.32 kg.
Table 2. Time Required for Manual Processing of Pulses(Unit: Minute)
The huller and roller are used for de-husking, the roller is used for the lentil crop.After de-husking, the fan is used for blowing off dust and separation of bran/husk fromgrains. The sieve is used for cleaning dust, dirt, chaff etc. from the crop as well as gradingof pulses into different sizes – small, medium and large. It is a very important equipmentsince milling of different sizes results in higher percentage of broken, which in turn reducesthe market price of dal.
The capacity of dal mills covered under the study varied from 180 mt to 1,147 mt perannum, based on one shift of eight hours per day and 300 working days in a year. Thecapacity of different size mills are shown in Table 4.
Table 4. Distribution of Dal Mills in the Study Area According to CapacityCategory Capacity Number Percent of Total Mills
Small Below 375 mt 12 34Medium 375-750 mt 13 37Large 750-1,125 mt 9 26Extra large More than 1,125 mt 1 3
Total 35 100
Capacity varies with the pulse crops processed, the number of motors and the spaceavailable within the mill. Some pulse crops may be de-husked quickly but others requirehulling several times. According to the millers the lentil crop requires hulling 5-6 timeswhile lathyrus and chickpea may be de-husked in one hulling. As a result the same millwhich may handle 3.75 mt of lathyrus per day can handle only 0.75 mt of lentil.
Storage FacilitiesAll mills have storage facilities. Some mills have storage space inside the mills; while
most mills have separate storage facilities, depending on the volume handled, either ownedor rented. Three types of storage are used by the millers.
Type I: Cemented floor, wall and roofType II: Semi-cemented floor, brick wall and cast-iron (CI) sheet roofType III: Brick floor, CI sheet wall and CI sheet roof.
The mills which operate on their own account store pulses from one day to six months;three mills stored up to seven days, four mills up to 15 days, six mills up to one month, threemills up to two months, seven mills up to three months and five mills for more than threemonths.
The storage loss is mainly due to rodents (56 percent), followed by insects (18 percent)and mold (16 percent); some loss was ascribed to weight loss due to evaporation of moisturefrom the crop.
In order to prevent/minimize storage loss, the millers use trap and rat killers to controlrats, and use pesticides to control insects and pests. A few mills also use “neem leaves” to
- 89 -
control insects and pests. Some mills also mentioned drying and re-drying of their stock andproper ventilation in storage godowns to minimize storage loss.
Milling Cost of PulsesThe main items of cost consist of (in order of importance):
1) electricity/power;2) labor on account of handling, grading/cleaning, bagging etc;3) interest on borrowing;4) salaries to mill employees and other expenses incurred in connection with the
operation of the mill;5) repair/replacement of machineries/parts; and6) depreciation on plant, machineries & structures.
The cost for the above for different pulses are shown in Table 5.
Table 5. Item-wise Breakdown of the Average Milling Cost of Pulses, 1992(Unit: Taka per maund of whole pulses)
The proportion of husk is primarily determined by its thickness/weight in relation tothe grain; to some extent bran may be allowed if it also includes small broken and foreignmatters.
Recovery of dal (grain) is highest in the case of lentil followed by mung bean, andlowest in lathyrus. It is natural that in case the grain size is bigger and the bran is thin outturnof dal/grain will be higher. It was reported that recovery of dal/grain from the importedAustralian chickpea was 75-77 percent due to large size, as against 71.17 percent in case ofsmaller size local chickpea.
Constraints of MillersInadequate supply of pulses, lack of fund, power failures, unstable price of pulses/dal
and admixture of foreign matters have been mentioned as constraints by most of the millers.They also mentioned the transportation problem, improper operation of the mills, lack ofmarket information, storage problems, law and order situation and labor problems but theywere low in importance. Government control and regulations, restrictions imposed bydifferent authorities which affect business, licensing and control by multiple agencies havealso been mentioned by a few mills with very low importance.
Suggestion by MillersIncreasing local production of pulses to ensure adequate supply to the mills, provision
of bank loan to the mills for procurement of pulses, improvement of the supply of electricityand improvement of transportation facilities have been suggested by most of the mills toimprove the situation.
REFERENCES
Chakraverty, A., 1998. Postharvest Technology of Cereals, Pulses and Oilseeds, Oxford andIBH Pub. Co., New Delhi, India.
Department of Agricultural Marketing, 1998. Production, Storage, Processing andMarketing of Pulses in Bangladesh, Dhaka, Bangladesh.
Gowda, C. L. L. and A. A. Kaul, 1982. Pulses in Bangladesh, BARI-FAO, Dhaka,Bangladesh.
Kaul, A. K. and M. L. Das, 1986. Oilseeds in Bangladesh, Ministry of Agriculture,Government of Bangladesh, Dhaka, Bangladesh.
Kay, D. E., 1979. Food Legumes, Tropical Products Institute, London, U.K.
Ministry of Planning, 1998. Statistical Yearbook of Bangladesh, Government of Bangladesh,Dhaka, Bangladesh.
- 91 -
2. REPUBLIC OF CHINA
Wen-Lian ChenSenior Food ScientistFood Industry Research and Development Institute (FIRDI)Hsin-chu, Taiwan
INTRODUCTION
Soy milk, tofu and soy sauce are well-known typical traditional Chinese legume foods.Processing and utilization of legume foods in China has a long history. Because of war,people from different regions of mainland China came to Taiwan. They brought their foodpreparation skills with them. In addition to famous soybean foods, many other kinds oflegume foods are also processed in Taiwan. In recent years, modern processing technologiesare used in preparing legume foods. The nutritional value and health benefits of legumefoods are better understood than before. Phytochemicals in legumes have various functionaleffects to women and elderly. People can either consume legume foods daily or they can takepurified phytocemicals from legumes as pills. People are concerned about animal protection.Due to this reason, some people like to become vegetarians. Other people are vegetarians dueto religious reasons. People may consume more legume foods in the future. One day, thesetraditional Chinese legume foods may become a worldwide food. Although the processingtechnologies have been very much improved in Taiwan, still many problems remain to besolved. Taiwan would like to learn new technologies developed in other countries. Theymight help us to solve these problems.
THE ROLE OF LEGUMES IN THE FOOD CONSUMPTION IN TAIWAN
Legumes are consumed daily in Taiwan. In 1956, the legumes consumption per personper year was 11 kg. In 1996, the consumption rose to 32 kg, an increase of almost threetimes. During the same period, the consumption of rice and sweet potato decreased sharplyfrom 133 kg and 64 kg down to 59 kg and 3 kg, respectively, while the consumption of otherfood items all increased many times as shown in Table1. In the same period, theconsumption of calorie per person per day increased from 2,262 cal to 3,076 cal, animalprotein consumption increased sharply from 13.5 gm to 49.6 gm, vegetable proteinconsumption increased slightly from 40.4 gm to 46.8 gm, and oil consumption increasedsharply from 37.3 gm to 135.5 gm (Table 2). The major sources of vegetable protein and oilare legumes, especially soybean and peanut.
THE PRODUCTION AREA OF LEGUMES IN TAIWAN
The area planted to legumes is decreasing in Taiwan (Table 3). The area planted tosoybean, adzuki bean, peanut, pea and kidney bean have all decreased. Only the area plantedto vegetable soybean increased slightly. The farm prices of peanut, adzuki bean and mungbean were much higher than that of rice and sweet potato (Table 4). Although the prices of
- 92 -
legumes were higher than that of rice, since the production cost of legumes are high, they areno longer competitive. The prices of locally produced legumes are higher than that of theimport ones. When Taiwan joins the World Trade Organization (WTO) in the near future,the trade of agricultural products will be open to all foreign countries. Then, cheap legumesfrom foreign countries will get into local markets, and the local production of legumes mayshrink even further. The land use concept is changing in Taiwan. Farm is not for agriculturaluse. This concept may result in the decrease in area planted to legume.
Table 1. Changes in Itemized Food Consumption During the Past 40 Years in Taiwan(Unit: kg/person/year)
Most legumes consumed in Taiwan were imported from foreign countries. The importand export of soybean, peanut, pea, vegetable soybean, kidney bean and broad bean in thelast five years are shown in Tables 5-10, respectively. Soybean, pea, kidney bean and broadbean were all dependent on import. Peanut was the only protected crop with no import in thelast three years. Vegetable soybean was the only export crop with an average export amountof 30,000 mt a year. The import of soybean decreased suddenly in 1998, due to the incidenceof foot-and-mouth disease of swine. In that year, the total import of soybean was two millionmt, among which 61.3 percent was from the United States, 23.8 percent from Brazil, 13.3percent from Argentina and 1.6 percent from Paraguay. The import of pea, kidney bean andbroad bean, as well as the export of vegetable soybean were quite stable over the years. Morethan 80 percent of the imported soybeans were used for soybean oil extraction, and less than20 percent were directly used for foods. For the quality improvement of soybean foods, thefood-grade soybeans were compared with the soybeans for oil extraction. Both the qualityand the yield of soybean foods prepared with food-grade soybeans were better than thoseprepared with the soybeans for oil extraction. For substantial supply of food-grade soybeansrequire new arrangements.
Table 5. Changes in Import and Export Quantities of SoybeanDuring the Last Five Years in Taiwan
Legume foods have a long history in China. Taiwan has a variety of legume foods.Soybean foods are a typical example. We can summarize soybean foods as follows:
Whole SoybeanVegetable soybean – spiced and frozenSeasoned and dried soybeanRoasted and spiced soybeanSweetened soybeanFermented soybeanFermented black soybeanSoybean sprout
Soy MilkTraditional soy milk with typical beany flavorModern non-beany flavor soy milkReconstituted soy milk from soy protein isolateAseptic pack soy milk – tetra pack, combiblock pack, polythylene terephalate (PET)bottle packSterilized soy milk – polyproplylene (PP) bottle pack, glass bottle pack, metal can packRefrigerated soy milk – pure pack, plastic bottle packInstant soy milk powder
Soft Soybean Curd or ToflowerTraditional soft soybean curd coagulated with gypsum and sweet potato starchModern soft soybean curd coagulated with edible gumsPudding-type soft soybean curd
TofuTraditional tofu coagulated with gypsumPackaged tofu coagulated with glucono-delta-lactoneFrozen tofuFrozen tofu prepared from soy protein isolateDeep-fried tofuDeep-fried tofu for sushiSeasoned and dried deep-fried tofu for snackStinky tofu: deep-fried or steamed
- 96 -
Fermented tofu: prepared with soybean kojiwith rice kojiwith ankaby direct growth of mold on tofu
Firm TofuPlain-color firm tofuCaramel-colored firm tofuSeasoned and dried firm tofu for snack
Yuba or Soy Milk FilmChicken rollVegetarian chicken meatDeep-fried yuba
Textured Soy ProteinVegetarian hamMeat analogue
Soy SauceSoy sauce from soybean and wheatSoy sauce from black soybean and wheat flour
MisoThere is no product like Japanese natto or Indonesian tempeh in Taiwan.
Peanut, adzuki bean and mung bean are processed into many kinds of legume foodsin Taiwan. They are listed as the following:
1. PeanutProcessed peanut include roasted peanut with husk, salted peanut with husk, steamed
and dried peanut with husk, frozen cooked peanut with husk, roasted peanut kernel, peanutgrits, peanut flour, peanut candy, peanut oil, peanut butter, peanut dumpling, peanut ice bar,peanut ice cream, rice-and-peanut milk, canned peanut with gluten, canned peanut with milk,peanut cake, and deep-fried peanut.2. Adzuki
Processed adzuki bean products are: bean paste dumpling, bean paste bread, adzukibean ice bar, adzuki bean ice cream, adzuki bean and agar agar cake, adzuki bean soup,adzuki bean ice, red turtle cake, sweetened and dried adzuki bean.3. Mung Bean
Processed mung bean products are: mung bean soup, mung bean and rice soup, mungbean paste cake, mung bean starch vermicelli, mung bean starch gel, mung bean powder andmung bean sprout.
THE IMPORT AND EXPORT OF LEGUME FOODS
Most legume foods prepared in Taiwan are consumed locally. The importance ofprocessed foods in international trade has disappeared in Taiwan. Instead, high-techelectronic products have taken their place. The import and export quantities of soy sauce,miso, peanut butter, adzuki bean paste, protein concentrate and textured protein in the lastfive years in Taiwan are shown in Tables 11-15, respectively. Every year, Taiwan importshigh-price soy sauce and exports low-price soy sauce in large quantities. The import of miso
- 97 -
and peanut butter are larger than the export. The imports were fairly stable, and the marketseems to be saturated already. Adzuki bean paste is produced entirely for export, but thequantity exported is decreasing every year. This was due to the difficulty of wastewatertreatment. Many producers have moved their production line to foreign countries. Taiwanimports protein concentrate and exports textured protein. The import of protein concentrateis quite stable in quantity, mainly from the United States, but now also from mainland China.The export of textured protein has increased about four times in the last five years.
Table 11. Changes in Import and Export Quantities of Soy SauceDuring the Last Five Years in Taiwan
YearImport Export
Amount (mt) Value (NT$ 000) Amount (mt) Value (NT$ 000)
Vegetable SoybeanFrozen vegetable soybean is the number one frozen vegetable for export from Taiwan.
The quality is good and the price is high in Japanese market. Every year the farmers usehigh-quality soybean seeds selected by local agricultural experimental stations for the rawmaterial production. The management of farming, such as how to use the fertilizer and thedensity of planting, is also under the guidance by the experts from the stations. Importedmechanical harvesters are used to harvest the soybeans. They save labor and improve thequality of soybeans harvested. In the factory, a sorter separate sticks and leaves, a washercleans the soybeans, a continuous cooker-cooler blanches and cools the soybeans, and anindividual instant quick freezer freezes the blanched soybeans. After automatic packaging,the products are stored in a cold room.
Every year, the industry has a meeting with Japanese buyers to exhibit new products,and to discuss the extension of the business. They maintain excellent mutual communication.In recent years, the export of frozen vegetable soybean from mainland China increasedrapidly, and the quantity is already larger than that from Taiwan. The producers have alsodeveloped the local market in Taiwan, and seasoned vegetable soybeans have becomepopular and are now a hors d’oeuvre in most restaurants in Taiwan.
Seasoned and Dried SoybeanSeasoned and dried soybean is consumed as a snack. The processing includes soaking,
cooking with seasonings, hot air drying, and packaging after cooling. The texture of theproduct is tender and chewy.
- 99 -
Roasted and Spiced SoybeanRoasted and spiced soybean is also consumed as a snack. The processing includes
roasting, mixing the hot soybeans with liquid spice, and packaging after cooling. The textureof the product is crispy. Black soybeans and the kernels of vegetable soybeans are also usedas raw material for roasted and spiced soybean.
Sweetened soybeanSweetened soybean is a dish for breakfast. The processing includes soaking, cooking
to make it soft, adding sugar, and cooking again. The product is sweet with good soybeanflavor.
Fermented Soybeans (Taosi)Fermented soybean is generally used as a starter, but fermented soybean in brine is also
consumed as a condiment. The processing includes soaking overnight, cooking for 4-5 hourswithout pressure, draining and cooling, mixing with a half weight of parched wheat flour,inoculating with short- or medium-stalk Aspergillus oryzae, incubating for three days, andfinally drying in air, or aging in 18 percent brine. Fermented black soybean is more popularin Taiwan, because of its specific flavor after aging.
Soybean Sprout and Mung Bean SproutSoybean sprout is a fresh vegetable consumed like mung bean sprout. The processing
includes soaking, draining, spreading and keeping in a dark humid room for a few days, andspraying water periodically for germination and sprouting. Plant hormones are used tocontrol the growth of root. Mung bean sprout and soybean sprout are main fresh vegetablessupplied during typhoon season, when other vegetables are destroyed by typhoon and needa period of time to grow.
Soy MilkSoy milk is very popular in Taiwan. In traditional method of processing, soybeans are
washed and soaked in water for a suitable period of time, ground in a stone mill with coldwater, cook the slurry to boiling, filter through cloth, and add sugar before consumption.Some food processing factories belonging to farmers associations package the soy milk inglass bottles and sterilize them using the above method. About 30 years ago, this was thecommercial soy milk in Taiwan.
In 1971, the Pulse Company introduced the Illinois process and aseptic processingequipment to make non-beany flavor soy milk. The product “Pulse Milk” was the first tetrapack soy milk in Taiwan. Due to technological and quality problems the processing line wasclosed after running for a few months. The Pulse Company was taken over by the PresidentCompany, and the new product was called “Honey Soy Milk” with strawberry, milk, egg,coffee, or malt flavor. There is no beany flavor in the flavored soy milk. The PresidentCompany enjoyed a big success on these products. In recent years, the Company alsoproduces traditional refrigerated soy milk packaged in plastic bottles or pure pack. WeiChuan Company produces traditional soy milk packaged in tetra pack. Two other companiesproduce different types of soy milk packaged in combiblock. One of them uses reconstitutedsoy milk from soy protein isolate. Another company produces aseptic soy milk packaged inPET bottles. There are many other producers packaging sterilized soy milk or black soybeanmilk in plastic bottles.
- 100 -
There are many small soy milk shops at every corner of the streets. They produce soymilk every morning and sell it by themselves.
The Illinois process uses blanching and homogenization to make non-beany flavor soymilk. Mr. Kuo’s process uses two-stage blanching to make non-beany flavor soy milk. Mr.Liao’s process uses de-aerated water to soak and grind soybeans, and injects steam to thegrinder during the grinding process.
Many years ago, there was one company in Taiwan producing instant soy milk powderand exported it to other countries as a functional food or for cosmetic use. But now it hasbeen replaced by instant adlay powder for export market.
There is a potential market for aseptic soy milk packaged in “bag in box” for foodservice use. But no one produces such a product. There is a fantastic soy milk-makingmachine sold in Taiwan. By using it, consumers can make soy milk very easily at home, andthe soy milk is then cooked in a rice cooker to prevent charring.
Soft Soybean Curd or ToflowerTraditional soft soybean curd is prepared by pouring hot soy milk straight into a
suspension of gypsum and sweet potato starch. The curd is formed on standing withoutstirring. After cooling in water, the curd is stored in a refrigerator. The curd is consumedwith syrup containing cooked peanuts or ginger extract. A new type of soft soybean curd isprepared by adding edible gums to hot soy milk, mixing, and packaging in plastic containerswhen the mixture is still hot. After cooling, the coagulated product is stored in a refrigeratorand consumed cool. A mixed powder of gypsum, sweet potato starch and other ingredientsis available. Consumers can prepare soft soybean curd with this mix at home.
TofuTofu is also very popular in Taiwan. The processing includes soaking, grinding with
cold water, cooking the slurry to boiling, filtering the slurry to separate okara, adding asuspension of gypsum into the hot soy milk with gentle stirring, and allowing it to stand forthe curd to set. The curd is then poured into a cloth spread in a mold, and pressed at asuitable pressure for shaping. After taking the cloth off, the tofu is cut into cubes forconsumption or selling on local market. Traditionally, tofu is produced at night and sold inthe morning. It is because tofu is a food very easy to get spoiled, and its shelf life is veryshort. In 1992, a small automatic tofu-making equipment was introduced into Taiwan fromJapan. It saved labor and the quality of tofu was improved. Some tofu are chilled beforemarketing. Now tofu can be produced in the daytime, and sold all day long. Japanesepackaged tofu was introduced to Taiwan in 1982. Although its characters were different fromtraditional tofu, local consumers preferred them. But currently there are only three producersproduce this product in Taiwan. The coagulant of packaged tofu is glucono-delta-lactone.A new type of frozen tofu is prepared with emulsified soy protein isolate. Its price is higherthan traditional frozen tofu. No one is producing aseptic packaged tofu in Taiwan.
Deep-fried tofu is very much preferred by many people for its flavor and texture. Itis also used in the manufacture of sushi. For sushi preparation, its elasticity should be strongenough. It needs better technology to control the heat treatment of soy milk. So, only a fewmanufacturers can produce it.
Seasoned and dried deep-fried tofu is a snack. The deep-fried tofu is cooked withseasonings, such as sugar, salt, monosodium glutamate, pepper or other spices, and then driedwith hot air. The product is sweet, salty and spicy. If the product is over-dried, it becomes
- 101 -
too hard to eat. But if the product is soft and too wet, it is not easy to keep it away frommolding. So, how to control the drying is the key technology. Hurdle technology is appliedin processing this product.
Stinky tofu is prepared by putting tofu in a stinky liquid for a few hours and then deep-fried or steam-cooked. Although the smell of the product is not good, once people try thetaste of it, most people like it. The preparation of the stinky liquid is by natural fermentationand hydrolysis of organic materials. So, the sanitation is out of control, and pathogenicmicroorganisms might be present in the liquid. Our Institute developed a pure culture methodto prepare the stinky liquid. But the smell of the pure culture is not the same as that ofnatural fermentation. It appears that it is necessary to add some other pure microorganismsinto the culture for fermentation to make it stinky.
Fermented tofu is also called sufu or Chinese cheese. Like cheese, there are manykinds of fermented tofu. It is prepared by growing mold (Actinomucor) directly on tofu, orby putting one layer of tofu upon one layer of rice koji (Aspergillus), or soybean koji, or redrice koji (Monascus), to form multi-layers, and a liquid is added. The liquid may be salty orsweet, or with rice wine added. Today, consumers are concerned about the salt content ofthe product.
Firm TofuFirm tofu is a meat analogue, and is also a cheap protein source. The processing of
firm tofu is the same as soft tofu, except that the curd is first cut into small pieces to removepart of the whey, before putting it into the mold. The pressure applied upon the mold ishigher, and the pressing time is longer. Traditionally, the product is sold under ambienttemperature. So, its shelf life is less than one day. But the retailers want to sell the productat least for three days. The producers cook the firm tofu in a solution of H2O2 to meet therequirement, which results in H2O2 residue in the product. But Taiwan’s food sanitation lawdoes not allow such H2O2 residue. The solution to this problem is to sell the refrigeratedproduct, but this is still practically difficult for the retailers.
Seasoned and dried firm tofu is another kind of snack tofu. It is an intermediatemoisture food, very easy to get infected with mold. Preservatives are added to avoid thegrowth of mold. But the amount of preservatives added is often higher than the limitpermitted by regulation. The hurdle technology is also used to solve this problem.Humectant is added to lower the water activity of the product. Acidulant is added to lowerthe pH. Preservative is added within regulatory limit. Oxygen scavenger is packed in theplastic bag. Mild heat treatment is applied after packaging. The shelf life of the product isthus extended to about four months.
YubaYuba is a film formed on the surface of soy milk when it is cooked without boiling.
Yuba can be processed into many delicious vegetarian foods. Usually the production of yubaby traditional method is not enough to meet the requirement of market. Therefore, theproducers need an automatic method of yuba preparation. A continuous drum-drying methodwas developed at FIRDI. This method has been commercialized, and now there are fourproducers using this method. But the characters of drum-dried yuba are different fromtraditional yuba. FIRDI also developed a continuous method, which continuously picks upthe film from the surface of hot soy milk. Only one factory is using this method. Now FIRDIis trying to use twin-screw extrusion to make yuba continuously. A T-die is used to form the
- 102 -
film. As the film is still too thick, efforts are made to make it thinner. The new technologyis not extended to the industry yet.
Textured Vegetable ProteinTextured vegetable protein (TVP) with very fine fiber structure was developed in
Japan. From this TVP, a very high-quality vegetarian ham was produced in Japan andexported to Taiwan. The market size of this product is growing year by year. Under thecooperation of government, university, industry and research institute, we developed thetwin-screw extrusion technology and it is commercialized by the industry. The price of TVPin Taiwan came down rapidly, and the market grew quickly. Now there are four TVPproducers, and more than 20 vegetarian ham and meat analogues producers in Taiwan. Theyare competing seriously for the local market, and are also trying to find foreign markets.
The process by twin-screw extrusion includes mixing of the ingredients, such as soyprotein isolate, wheat flour and gluten, and using a twin-screw extruder to texturize themixture, while water is pumped into the extruder. The screw profile should be found out bymany tests. The temperatures of barrel and die, the screw speed, the feed rates of powder andwater are the control parameters of the extrusion. Products of different shapes can beobtained by using different dies. The extruded TVP is then dried in a hot-air drier. Thequality of the extruded product can be tested very quickly by putting the TVP in boilingwater, and observing its texture.
Tofu Whey and OkaraTofu whey and okara are the liquid and solid wastes of soybean processing,
respectively. Tofu whey is usually treated as wastewater, while okara is used as feed foranimals. FIRDI has developed a soft drink from tofu whey by adding citric acid, flavorings,sugar and carbon dioxide. It is yet to be commercialized, since none of the tofu factorieshave the facilities to produce the drink. Furthermore, tofu producers also have difficulty tosell the soft drink with tofu. FIRDI imported an okara drier to dry wet okara to a powder,and use the dried powder in processing cakes and cookies, to find the suitable amount ofokara powder in the formula. But it is not useful for the industry, since the local bakerieshave other cheaper raw materials.
Soy SauceSoy sauce is produced in large, medium and small scale in Taiwan. In large-scale
production, the industry is using the technology and equipment developed by Japanesecompanies. Soybean and wheat are the raw materials. In small- and medium-scaleproduction, traditional technology and equipment are used. Black soybean is the rawmaterial. Soybeans are soaked, cooked and mixed with roasted wheat and seed mold,incubated for koji fermentation, mixed with brine, aged, pressed, and pasteurized to obtainrefined soy sauce.
Soy sauce may also be prepared by acid hydrolysis of defatted soybean. Thecompound called 3-monochloro-1,2-propanediol is a carcinogen, which can be detected inacid-hydrolyzed soy sauce. In the European market, the allowed residue of 3-monochloro-1,2-propanediol in soy sauce is very low. If the content is higher than this level, the productis prohibited to enter the market. In Taiwan and foreign countries, people prefer naturallyfermented soy sauce due to health reasons. Low sodium soy sauce has become more popularthan before among aged people.
- 103 -
MisoMiso is a condiment and a soup base. The processing has been kept almost the same
as before. Soybeans are soaked in water, cooked and cooled, mixed with rice koji and salt,and aged for a certain period. Some peptides in miso have been found to have somefunctional benefits for controlling hypertension. But the salt content of miso is fairly high.
Peanut Flavor in Peanut ProductsPeople like processed peanut flavor, but the flavor disappears quickly. How to retain
the flavor during storage is the main research objective. Addition of natural antioxidant isa choice. The use of superheated steam to roasted peanuts is another choice. Excludingoxygen during processing and storage may be helpful. Packaging with oxygen barrier filmmay also have some effect.
Adzuki Bean PasteAdzuki bean paste is a product for export. It is used as stuffing in the baking industry.
The processing includes soaking the beans, cooking to make it soft, grinding, filteringthrough a pulp finisher to separate pulp from starch, washing the starch with water at leasttwice, pressing in a bag to separate water, and then cooking with sugar and oil. The amountof wastewater produced during the processing of adzuki bean paste is very large. Itsbiological oxygen demand (BOD) is high and difficult to treat. Due to the wastewaterproblem, many producers moved their facilities to foreign countries. Therefore, theproduction and export of adzuki bean paste decreased in recent years. High potential inducedstatic electric field developed in Japan may improve the treatment of wastewater, but it is notyet used in Taiwan.
Mung Bean Paste, Pea Paste and Kidney Bean PasteThe processing of mung bean paste, mung bean starch vermicelli, pea paste and kidney
bean paste has the same problem as in making adzuki bean paste. Dried paste is used as anextender in the processing of meat products.
Food industry now is a low profit traditional industry in Taiwan. New investments goto high-tech industry or potential bio-tech industry. The progress of technology in foodindustry has slowed down in recent years.
POTENTIAL MEDICAL USE OF LEGUME FOODS
Consuming soybeans fermented with more than 30 strains of lactic acid bacteria andyeasts has the effect of prevention or therapy of some cancers. There are many kinds ofphytochemicals in soybeans, that are activated by fermentation. Consuming tablets madefrom seeds of Canavalia ensiformis DC. (Jack bean, sword bean) can cure some cancers.These are hot topics of health news in the media. The price of sword bean has jumped fromNT$20/kg to NT$2,000/kg. Legume foods have potential medical use in the future.
THE PROBLEMS OF LEGUME PROCESSING
Although modern food science and technology are used in the processing of legumefoods, the following problems still remain unsolved:
- 104 -
1. Separation of oil and protein on the surface of packaged and sterilized soy milk inbottles.
2. Stability of tofu, firm tofu and snack tofu in storage is always a problem.Microorganisms grow easily on tofu, firm tofu and snack tofu. In traditional market,these products are not packaged and refrigerated.
3. Stability of processed peanut in storage is a problem. Good peanut flavor disappearseasily and off-flavor appears in these products.
4. Waste water treatment is a serious problem in the processing of tofu, firm tofu andbean paste.
5. Handling okara in soymilk, tofu and firm tofu industry is a problem.6. Difficulty in the development of new legume food products.7. To confirm the functionality of health foods is difficult.8. After Taiwan joins WTO, the sources of raw materials will be globalized. Then, to
buy high-quality and low-price raw materials may become a new problem.
THE MUSEUM OF LEGUME FOODS
Da C, in Tao Yuan County of Taiwan, is famous for its seasoned firm tofu. The VicePresident of Republic of China, Annette Lu, is the former governor of Tao Yuan County. Shehas an idea to build a museum of legume foods in Da C. This museum will be built in a park.She has the budget from the Council of Cultural Affairs. So the museum is currently beingdesigned and planned. A garden of legumes will be established. The history of legume foodswill be introduced. Ancient tools and modern equipments for tofu and soy sauce processingwill be exhibited. Nutritional value of legume foods will be publicized.
THE FUTURE ROLE OF LEGUME FOODS IN TAIWAN
In Taiwan, the consumption of animal protein is already higher than that of vegetableprotein. For health point of view, however, consumption of vegetable protein should beincreased. But the consumption of traditional legume foods is almost saturated, and it is veryhard to further increase the consumption of traditional legume foods. Therefore it isnecessary to develop new legume food products in order to increase the consumption.Development of western type foods, such as soy yogurt, soy cheese, soy ham and soysausage, may be a good choice.
Taiwan will join WTO, more legumes may be imported from foreign countries at lowercosts. The quality of imported legumes must be as high as possible. The farmers may havea chance to produce perishable vegetable legumes for local fresh food market. The importedvegetable legumes will not be able to compete with fresh locally produced legumes.
In addition to the current understanding of the nutrition of traditional legume foods,additional health benefits have been discovered, and as a result more people may like toconsume traditional Chinese legume foods. Soy milk, tofu and other soy foods may becomeworldwide foods, and Taiwan may have a chance to export our high quality traditionallegume foods in the future.
Taiwan has been importing more than 200 million mt of soybean every year. Most ofthem are genetically modified soybeans. We understand the benefits of genetically modifiedsoybeans, but we are not sure about the safety or the risk of consuming genetically modifiedsoybeans. At present, our government does not have any regulation on geneticall modified
- 105 -
organisms (GMO). The industry uses the imported soybeans. So far there is no evidence thatgenetically modified soybeans are harmful to human health. If there is any evidence thatgenetically modified soybeans may cause diseases, the government and the public will bevery much concerned.
ACKNOWLEDGEMENTS
I thank Prof. Wei-Hsien Chang very much for his reviewing and correcting the Englishword by word and Mrs. Hsiang-Wen Chang for her help in preparing the tables.
REFERENCES
Chang, Hsiang-Wen and Wen-Lian Chen, 1999. “Effects of the Application of HydregenPeroxide on the Preservation of Firm Tofu”, Journal of Food and Drug Analysis, 7(3):215-223.
Chen, Steve, 1989. “Principles of Soy-milk Production”, in E. W. Lusas, D. R. Erickson, andW. K. Nip (eds.) Food Uses of Whole Oil and Protein Seeds, American Oil ChemistrySociety.
Chen, Wen-Lian, 1993. “Fermented Soyfoods”, Encyclopedia of Food Science andTechnology, John Wiley and Sons.
Hwang, Sam-Long, Li-Huang Chen, and Wen-Lian Chen, 1998. “Studies on the Processingof Texturized Vegetable Protein using Twin-screw Extrusion: (I) Effect of ProcessingVariables on the Quality of Texturized Vegetable Protein”, Food Science 25(3): 331-343.
----------, 1998. “Studies on the Processing of Texturized Vegetable Protein using Twin-screw Extrusion: (II) Effects of Raw Material Formula and Additives on the Qualityof Texturized Vegetable Protein”, Food Science 25(4): 394-405.
Kao, Fuh-Juin and Wen-Lian Chen, 1998. “The Application of Okara and Waste Liquid ofYuba on Cookies”, Food Science 25(5): 580-590.
Messina M. and V. Messina, 1994. The Simple Soybean and Your Health, Avery PublishingGroup, Garden City Park, New York, U.S.A.
Smith A. K. and S. J. Circle, 1978. Soybean: Chemistry and Technology, the AVIPublishing Company, Inc., Westport, Connecticut, U.S.A.
William Shurtleff and Akiko Aoyagi, 1983. The Book of Tofu, Ten Speed Press, Berkeley,Califonia, U.S.A.
- 106 -
3. INDIA (1)
Jarnail SinghProfessorDepartment of Processing and Agricultural StructuresCollege of Agricultural EngineeringPunjab Agricultural UniversityLudhiana
INTRODUCTION
Grain legumes occupy an important place in human nutrition due to their higher proteincontent than cereal grains. They are particularly important for major segment of populationin developing countries who cannot afford animal protein due to high costs. Majority ofIndians are vegetarians and they depend largely, for a major part of their dietary protein, ongrain legumes (pulses). Grain legumes, complement cereals and make an ideal combinationto provide protein quality matching that of animal products (Mehta and Singh 1989).Legumes contribute a major portion of lysine in the vegetarian diet. They are also fairly goodsources of vitamins like thiamine, niacine and riboflavin and much needed iron, but relativelypoor source of calcium and sulphur containing amino acids. Nutritive studies have shownthat inclusion of various legumes in the cereal based diet can solve the protein caloriemalnutrition and promote growth especially of the underweight children. To achieveoptimum nutritional complementarity cereals and legumes need to be eaten in an approximateratio of 3:1 i.e. 75 gm of rice or wheat and 25 gm of legumes (Narasimha, 1993). Post-harvest technology of grain legumes involves cleaning, storage, milling and packagingoperations. Grain legumes are processed and utilized in a number of ways such as dry seeds,fried seeds, cooked dhal etc.
GRAINS LEGUMES GROWN IN INDIA
India grows a variety of grain legumes (Table 1).
Grain Legume Production in IndiaGrain legume production remained static between 10.6 million mt to 13.7 million mt
in the past few decades (Table 2). The factors limiting the production and availability oflegumes are climatic and ecological, non-availability of high yielding varieties, properresearch support, socio-economic factors and constraints in post-harvest technology.
Protein Content of Grain LegumesGrain legumes contain about 12-51 percent protein and therefore they are excellent
source of protein (Table 3). A wide variation in protein content can be observed not onlyamong species but also between cultivars within species (Swaminathan and Jain, 1973;Jambunathan and Singh, 1980; Singh, et al., 1989; and Mehta and Singh, 1989).
- 107 -
Table 1. Grain Legumes Grown in IndiaCommon Name Vernacular Name Common Name Vernacular Name
Chickpea Bengal gram Moth MothPigeon pea Arhar or tur, red gram Cowpea LobiaBlack gram Mash or Urd Cluster bean GuarGreen gram Moong or mung French bean Frasbean/kidney beanLentil Masur Soybean SoybeanField peas Masar Horse gram Gram (kabuli)
Table 2. Production of Grain Legumes in IndiaYear Production (000 mt)
Nutritive Value of Grain LegumesAlthough grain legumes are rich in protein their nutritive value is limited by the
deficiency of sulphur containing amino acid (Table 4). Low digestibility is another factorcontributing to their poor nutritive value. Besides, most of the legumes in raw form containa wide variety of anti-nutritional factors or toxic principles. In addition, many of the grainlegumes cause flatulence. Fortunately, most of the anti-nutritional factors are heat labile andare destroyed during cooking.
Use of Grain LegumesUses of grain legumes in India are as follows:
- 108 -
Table 4. Essential Amino Acid Content of Proteins from Major Grain Legumes(Unit: gm/16x8N)
1. ChickpeaThis is a multipurpose pulse crop. The tender leaves as well as the raw grains are used
as vegetable. When ripe, the grain is split into two parts and consumed as dhal. Roastedgram alone or in combination with popped rice is also a popular food item. Gram flour isused extensively in the preparation of Indian sweets and snacks.2. Pigeon Pea
This is largely consumed in the form of split pulse (dhal).3. Black Gram
It is consumed in the form of dhal (whole grain or split, husked or un-husked). It is thechief constituent of ‘Papad’ and ‘Bari’ which makes a delicious snack and curry,respectively. In the southern part of the country husked dhal is grounded into a fine paste andmixed with equal quantity of rice flour and allowed to ferment to make idli and dosa.4. Green Gram
Green gram is used as whole grain or split, husked or un-husked in a variety of ways.Sprouted seeds are used for preparing curry or a savory dish. ‘Mung’ pudding (‘halwa’) isvery nutritious and is commonly served as dessert. Split and de-husked mung, fried andsalted are served as snacks with drinks.5. Lentil
The grain is used as ‘dhal’ with or without husk.6. Peas
Peas are consumed in a variety of ways: the fresh ones (garden peas) are used asvegetables and are processed for canning. The dry one (known as field peas) is used as dhaleither as whole grain or in split form.7. Moth
Moth is consumed as pulse either whole or split. The whole grain is fried and mixedwith other savory dishes and served as snacks with drinks.8. Cowpea
Cowpea is used as ‘dhal’ either whole or split and as flour. The young green pods areused as vegetables.9. Cluster Bean
The green and tender pods of cluster beans are used as a favorite vegetable. The greenpods are cut into bits and cooked with potatoes that make a delicious dish. Pods preservedafter drying are eaten after frying. It is commercially used for gum extraction.
- 109 -
10. French BeansThe green and tender pods are used as a vegetable. The green pods are cut into one cm
pieces and cooked with potatoes or cooked with other vegetables. Dry beans are used aspulse (Bolaria, 1982).
Balanced DietBalanced diets of moderately active adult Indian men and women as recommended by
Indian Council of Medical Research is given in Table 5. Total calorie intake of an adult manand woman is 2,800 kcal and 2,200 kcal per day, respectively.
Table 5. Composition of Balanced Diet of Adult Indian
stones, dusts, immature grains and weed seeds. They are cleaned with rotary screen orvibratory screen cleaner cum grader. Lighter impurities are blown off with the help ofblower/air aspirator. Large-size impurities are removed with scalper and small-sizeimpurities pass through the sieve and are removed.
StorageGrain legume production is seasonal. Therefore, storage of grain legumes is necessary
to meet the year round demand throughout the year. Safe storage therefore, helps to maintaincontinuity of supply. Although grain legume production is seasonal processing/millingcontinues, grain legumes in commercial quantities are stored in modern storage structure i.e.flat godowns and silos so that the loss during storage can be minimized.
Domestic level grain legume storage containers are traditional. The traditionalcontainers are improved and replaced by modern airtight metal bins that are easily availablein a variety of sizes. The metal bins can also be easily fumigated. About 80 percent of thestorage loss is due to insects, rodents and microorganisms. Grain legumes are specificallyattacked by bruchids at the time of maturity itself. At high humidity and temperature (rainyseason) conditions bruchids are difficult to control. Farmers cannot store grains even for seed
- 110 -
purposes. The loss caused by bruchids may range from 10 percent to 30 percent (Singh andVerma, 1995). Most of the storage loss takes place at farmer’s level. Studies are conductedto control insect infestation of pulses using biogas fumigation in metal bins.
1. Controlled Atmosphere StorageDifferent atmospheric conditions viz. CO2 level of 60 percent, 70 percent and 80
percent, O2 level of 4 percent, 7 percent and 10 percent and N2 level of 16 percent, 23 percentand 30 percent were evaluated at 0.4 kg, 0.6 kg and 0.8 kg/cm2 pressure level and air flowrate of 58 ml/min. to control pulse beetle and rice weevil (S. oryzae) in green gram. Theexposure time was 24 hours, 36 hours and 48 hours. The relative humidity (RH) andtemperature were 71 percent and 30 ± 2ºC, respectively. It was observed that mortalityoccurred at higher CO2 level and lower levels of O2.2. Thermal Treatment
Exposing grain legumes to 70-80ºC temperatures for short duration can control insectinfestation. The insects are killed at high temperature.3. Ventilation
Commercial storage structures should have arrangement for forced ventilation in orderto prevent moisture accumulation and development of heat spots in the storage structures
MillingMilling is a general term and it refers to the reduction of grains into meal or flour.
Milling is an overall process and it includes size reduction, hulling, scarification, polishing,sorting, mixing and in some instances, also refers to certain chemical reactions. Throughmilling outer husks are removed and the grain is split into two equal halves. The kerneltightly holds the husk. Therefore, de-husking poses a problem. The method of alternatewetting and drying is used to facilitate de-husking and splitting of pulses. In India the de-husked split grain legumes are produced by traditional methods of milling. In traditionalmilling methods the loosening of husk by conditioning is insufficient. Therefore, a largeamount of abrasive force is applied for the complete de-husking of the grains that results inhigh losses in the form of broken and powdered grains. The yield of split pulses in traditionalmills is only 65-70 percent in comparison to 82-85 percent potential yield. De-husking is aprocess, that reduces the fiber content and improves appearance, texture, cooking quality,palatability and digestibility of grain legumes. Pre-milling treatment plays an important rolein improving dhal recovery. The proportion of seed coat, cotyledon and embryo in differentlegumes is given in Table 6.
Table 6. Proportion of Seed Coat, Cotyledons and Embryo in Relation toWhole in Different Legumes
Pre-milling TreatmentPre-milling treatments are given to affect the gums present in between seed coats and
cotyledon in order to: (a) loosen the husk; (b) ease of milling; (c) reduce breakage; and(d) improve the quality of split. The following four methods are used in pre-milling:
1. Dry MethodThe dry method includes application of oil and water. In this method cleaned and
graded grains are subjected to pitting to increase soaking. Then pitted grains are mixedthoroughly with 1 percent oil and spread for sun drying in thin layer for 2-3 days. At the endof drying 2.5 percent water is sprayed and mixed thoroughly. For tempering grains areheaped overnight. Then grains are milled with roller machine.2. Wet Method
In wet method, red earth slurry is applied on pulses. The grains are thoroughly mixedwith a paste of red earth after soaking in water for about 12 hours and heaped for about 16hours. The grains are spread in thin layer in drying yards for 2-4 days. Then dried red earthis removed by sieving. The grains are then milled on power operated stone or emery-coatedvertical chakki. This method resulted in 95 percent de-husked and 75 percent dhal yield.Wet milling process is popular in South India. This method requires 5-7 days to completeprocessing for a batch of 6-7.5 mt.3. Thermal Treatment
The cleaned grain legumes are conditioned in two passes in a dryer (Louisiana Stateuniversity [LSU] type) using hot air at about 120ºC for a certain period of time. After eachpass the hot pulses are tempered in the tempering bins for about six hours. Such hot airpreconditioning of grains helps in loosening the husk significantly.4. Chemical Treatment
The use of chemicals have demonstrated the potential to replace oil treatment toachieve at least the same and in some cases more recovery than traditional methods. Sodiumbicarbonate and sodium chloride were used to treat pigeon pea grains. The grains soaked in4-6 percent sodium bicarbonate solution for 0.5-1.0 hour and dried at 65ºC to 10-15 percentmoisture content gave 95 percent hulling efficiency and dhal yield was 80 percent.Possibility of using enzymes for treatment was also studied since some enzymes may breakhemicelluloses, pentoses, hexoses etc. present in germ and seed coat, thus enhancing the easeof husk removal. The process is yet to be developed as complete package. Studies haveshown that acetic acid (vinegar) was found to be effective for loosening the husk of pigeonpea.
The flow chart of wet and dry milling are shown in Figures 1 and 2. The two basicsteps involved in both the processes are: (i) preconditioning of grain legumes; and (ii)milling by de-husking and splitting of the grain into two cotyledons followed by aspirationand size separation using suitable machines.
General Milling Processes:There is no common processing method for all types of pulses. Some general
operations of milling methods are described:
- 112 -
Grain legumes
Cleaning Chaffs, dirts, etc.
Soaking
Mixing with red
Conditioning
De-husking and splittingMixture of husk, small
broken and powder
Grading Broken
De-husked split dhal
Grain legumes
Cleaning Chaffs, dirts, etc.
PittingMixture of husk and
brokens (feed)
Pretreatment with oil
Conditioning
De-husking and splittingMixture of husk, broken
and powder
Polishing
De-husked split dhal
Figure 1. Flow Chart of Wet Milling Grain Legumes
Figure 2. Flow Chart of Dry Milling Process
- 113 -
1. Cleaning and GradingGrain legumes are cleaned to remove dust, chaff, grits etc. and graded according to size
by hand-operated and power-operated cleaners and graders.2. Pitting
The cleaned grains are passed through an emery roller machine. In this unit, husk iscracked and scratched. This is to facilitate the subsequent oil penetration process forloosening the husk. The clearance between the emery roller and cage (housing) graduallynarrows from inlet to outlet. As the material is passed through the narrow clearance, mainlycracking and scratching of husk takes place by friction between grains and emery. Some ofthe grain legume seeds are de-husked and split during this operation, which are thenseparated by sieving.3. Pretreatment
The scratched or pitted grains are passed through a screw conveyor and mixed withsome edible oil like linseed oil (1.5-2.5 kg/mt of pulse). Then they are kept on the floor forabout 12 hours for oil to diffuse. The different types of pretreatment as recommended areapplied in order to have better milling yield.4. Conditioning
Conditioning is accomplished through alternate wetting and drying of grains. Aftersun-drying for a certain period 3-5 percent moisture is added to the grains and tempered forabout eight hours and again dried in the sun. Addition of moisture to the grains can beaccomplished by allowing water to drop from an overhead tank on the grains that are passedthrough a screw conveyor. The whole process of alternate wetting and drying is continuedfor 2-4 days until all grains are sufficiently conditioned. Grains are finally dried to about 10-12 percent moisture content.5. De-husking and Splitting
Emery rollers known as gota machines are used for de-husking of conditioned grains.About 50 percent grains are de-husked in a single operation (in one pass). De-husked grainsare split into two halves. The husk is aspirated off and sieving separates de-husked splitgrains. The tail grains and unsplit de-husked grains are again conditioned and milled asabove. The whole process is repeated two to three times until the remaining grains are de-husked and split.6. Polishing
Polish is given to the de-husked and split grain legumes by treating them with a smallquantity of oil and/or water.
Milling MachinesDuring pre-milling treatment loosening of husk from cotyledons takes place. But
removal of husk and splitting of grains is achieved by means of various machines, whichwork on principles of: (a) compression; (b) shear; (c) abrasion; and (d) impact.
1. Chakki or Disc-shellerHand-operated chakkies are used for de-husking and splitting grains since olden times
in domestic and traditional milling. It consists of two cylindrical stones – one stationary andthe other rotated by means of a wooden handle. Unhusked or full grains are fed from thecenter and de-husked grain and split dhal is recovered at the periphery of the cylinder.Improved power operated chakkies or emery-coated roller machines have been used for de-husking operation.
- 114 -
2. Cylindrical Concave De-huskerIt consists of a tapered carborundum roller. The diameter increases from feeding to
discharge end, thus reducing the annular space between the roller and cylindrical screencasing. Reduction in the annular space increases the pressure on the grains and thusgradually increase the de-husking rate as grains move forward. The metal screen casing hasa 2-mm diameter circular perforation through which husk and powder is discharged (Singhand Sokhansanj, 1984).3. Rubber Roller Sheller
It consists of two rollers rotating in opposite directions with different speed. Whengrains are passed through the rollers, they are subjected to shear and compression leading tohusk removal. As husk is more tightly attached to cotyledons in case of legumes, rubberroller sheller can be used only to a limited extent. However, the machine causes minimumscouring and can be used to polish split legumes.4. Huller
Commonly used Engelburg rice huller can also be used for dhal milling. It consists ofribbed iron cylinder on rotating shaft in a concentric cylindrical housing. Bottom of thehousing is provided with slots for removing the husk. It is used for milling black gram andgreen gram in some South Indian dhal milling industries. In case of difficult to mill grainlegumes it causes heavy losses in the form of broken and powder.
Sequence of OperationsPitting or scratching of grain legumes is done using a roller machine. A worm mixer
is used for oiling as well as watering the pitted grains. De-husking is done by power-drivendisc type sheller, ‘chakki’ or emery-coated roller machine, which is known as gota machine.The emery roller is encased in a perforated cylinder. The whole assembly is normally fixedin a horizontal position. The Engelburg type rice hullers are also used for de-husking or toreturn unhusked grains.
Cone-type polisher or a buffing machine is employed to remove the remaining remantsof husk and to give a fine polish to the finished dhal. The cone polisher is similar to thepolishing machine used for polishing rice. The buffing machine is fitted with a rotatingpaddle having leather straps that can remove the last patch of husk and can give a fine polishto the de-husked polisher. Sieves are also employed for grading dhals.
Milling PerformanceGrain parameters such as size, shape and moisture content play an important role in
deciding the milling performance and quality of milled grains. Milling operations yield dhal(50-80 percent), grits (5-20 percent), husk (10-25 percent) and powder (7-20 percent)depending upon the legume crop and method of milling. Milling performance also dependson other factors viz. pre-milling treatment, energy inputs, handling, storage and machinery.Among them, the type of machinery helps to reduce the losses, decides the conveniences andimproves the profit of the user. Techniques for de-husking and splitting are well known forcenturies. However, it is important to identify the appropriate system to obtain maximumyield of the product in desired form with ease of operation, optimum energy costs and lessdrudgery (Kulkarni, 1993). The maximum recovery and recovery of dhal using modern andtraditional method is given in Table 7.
- 115 -
Table 7. Maximum Possible Recovery of Splits and Average Dhal (Splits) Yieldfor Various Food Legumes
Air PollutionThe flying dust from material handling and polishing of grains create a lot of dust
inside the milling plant. By providing dust collection system at the point of dust generationsystem makes the atmosphere inside the milling plant dust-free.
PackagingGrains after cleaning, grading and milling are packed in polyethylene bags of different
capacities for sale in the market. The polyethylene bags are sealed to provide modifiedatmosphere conditions to the product.
TECHNOLOGICAL GAP
(i) Production and productivity of grain legumes in India is static and its availability percapita is decreasing.
(ii) There is a need to improve the post-production technology of grain legumes so thatits losses may be reduced to a minimum.
(iii) Traditional milling technology of grain legumes needs to be modernized.(iv) Milling causes quantitative and qualitative losses. There is a need to develop
suitable and efficient processing technology.(v) Eighty percent of the grain legumes produced is consumed as dhal/fried grains
(whole/split/milled). There is a need to develop suitable products from grainlegumes.
(vi) There is a need to develop suitable packaging technology for processed grainlegumes.
REFERENCES
Bolaria, T. S., 1982. Country reports on the status of grain legume production India, GrainLegumes Production in Asia, APO Tokyo.
- 116 -
Jambunathan, R. and U. Singh, 1980. “Grain Quality of Pigeon-pea”, SymposiumInternational Workshop on Pigeon-pea, Vol. 1, p. 351, 15 December (10),International Crops Research Institute for Semi-arid Tropics, India.
Kulkarni, S. D., 1993. “Development of Food Legumes Machinery in India”, NationalSeminar on Dhal Milling Industry in India – Its Future Needs, p. 118-138, NationalProductivity Council (NPC).
Kurian, P. P., 1977. “Grain Legume Milling Technology”, paper presented at FAO ExpertsMeeting on Grain Legume Processing, Central Food Technological Research Institute(CFTRI), Mysore.
Mehta, S. L. and S. P. Singh, 1989. “Nutritional Quality of Grain Legumes – Present Status”,National Symposium on New Frontiers in Grain legumes Research and Development,Directorate of Pulses Research, Indian Society of Pulse Research and Development(ISPRD), Kanpur.
Narasimha, H. V., 1993. “Quality Changes During Processing of Legumes”, NationalSeminar on Dhal Milling Industry in India – Its Future Needs, p. 78-90, NPC, NewDelhi.
Salunkhe, D. K., S. S. Kadam, and J. K. Chawan, 1985. Post-Harvest Biotechnology of FoodLegumes, p. 29-52, CRC Press Inc., Boca Raton, Florida, U.S.A.
Singh, D. and S. Sokhansanj, 1984. “Cylinder Concave Mechanism and Chemical Treatmentfor Dehulling Pigeon Pea”, Agril. Mech. in Asia, Africa and Latin America 15 (2): 53-58.
Singh, Jai and P. Verma, 1995. Status of Pulse Milling in India, p. 22, Central Institute ofPost Harvest Engineering and Technology (CIPHET) Ludhiana.
Singh, S. P., S. L. Mehta, and W. C. Singhal, 1989. “Biochemical Approaches in Crop PlantEvaluation”, Indian Journal of Plant Genetic Resources 1(1&2): 111.
Swaminathan, M. S. and K. K. Jain, 1973. Nutritional Improvement of Food Legumes byBreeding PAG, p. 61, UNO, New York.
- 117 -
4. INDIA (2)
Nawab AliProject DirectorSoybean Processing and Utilization CentreCentral Institute of Agricultural EngineeringBhopal
INTRODUCTION
Food is essential for the survival of humans. Cereals and legumes form staple food formajority of the Indian people. Cereals account for about 50 percent of the total dietaryproteins of the world (Table 1). The share of food legumes and animal products in totalworld protein resources is about 25 percent each. The grain legumes containing low oil (1-5percent) and high protein (20-30 percent) and carbohydrates (50 percent and more) are calledpulses and those having high oil (30-50 percent) and low protein (20-30 percent) are knownas oilseeds in India. Soybean and groundnut are the two most cultivated legumes of theworld and represent roughly 64 percent and 13 percent, respectively of the total worldproduction of food legumes (Table 2). Share of pulses is 23 percent. In India, the pulses arethe second major source of dietary proteins (27 percent) after cereals (55 percent) and theshare of animal protein 18 percent (Table 3). Pulses are grown on marginal/poor lands andgiven less input than cereals which are more profitable and versatile.
Table 1. Global Production of Major Food Commodities andTheir Contribution Towards Protein Supply in 1998
Total 305.0 9.0 27.5 100.0Source: IASRI/Indian Council of Agricultural Research (ICAR), 1999; and Directorate of
Economics and Statistics (DOES), 2000.
Pulses are grown as food crops for their protein content and the oilseeds like soybeanand groundnut are grown as commercial crops for their oil contents. The oil is extractedeither by heat and pressure (mechanically) and/or by solvent extraction. The residual cake/meal, rich in protein, is used mainly for animal and aqua feed. However, where appropriatetechnology and hygiene control is maintained, the cake/meal can be made edible for humanconsumption. Legumes are next to cereals in terms of their economic and nutritionalimportance as human food resources. The ability of legumes to fix atmospheric nitrogen insoil-crop ecosystem is one of their unique and beneficial characteristics among all plantspecies. In addition to being a relatively inexpensive source of dietary proteins, legumespossess other desirable attributes such as abundance of complex carbohydrates, ability tolower serum cholesterol in humans, high fiber content, low fat content (excluding oilseeds),high concentration of polyunsaturated fatty acids (particularly the essential fatty acids,linoleic and linolenic), long shelf life and the diversity of foods that can be made from them.Legumes also contain several bioactive compounds whose beneficial effects in human healthneed to be fully exploited.
There has been a decline in real income and purchasing power of the majority of Indianpopulation specially those who are below poverty line and such people are about 40 percentof total population. This has deprived them of the financial access to pulses and animalproducts for dietary protein. For some reasons, in many other parts of the world especially
- 119 -
in the tropics, consumption of pulses is associated with poverty, although it is accepted inIndia where religion or local/social customs prevent consumption of meat or animal products.Since most legumes contain less than optimal amount of sulphur amino acids, there is atendency to consider them as nutritionally inferior to meat, fish or egg, in spite of the manyhealth promoting properties of properly processed and cooked legumes. This paper gives abrief account of processing and utilization of pulses, groundnut and soybean in India andsuggests the future strategy as to how to make best use of the legumes.
STRUCTURE
The grains of food legumes are similar in structure but differ significantly from eachother in size, shape, color and thickness of the seed coat. Legume seeds have two majorparts; seed coat and the kernel (embryo and cotyledons). Pigeon pea, chickpea, black gram,green gram and horse gram have a seed coat accounting for 12-15 percent of the total weightof the grain where as it is in the range of 8-11 percent for lentils, French bean, kidney bean,pea, soybean and cowpea (Table 4). On an average, pulses (including soybean) contain 11percent seed coat, 2 percent embryo and 87 percent cotyledons. The embryo has two partsknown as hypocotyl and plumule. Legume proteins are of two types – storage and structural– more versatile and useful in the Indian diets. Storage proteins (70-80 percent) occur withinthe cells in discrete protein bodies. About 20-30 percent are the structural proteinsresponsible for cellular activities including synthesis of structural and storage proteins. Thecotyledons, account for 93 percent of methionine and tryptophan of the whole seed, while theseed coat is the poorest in these amino acids. The embryo is rich in methionine andtryptophan but it contributes only about 2 percent of their total quantity in the seed (Kapoorand Gupta, 1977). Legume proteins are deficient in methionine and trytophan (Table 5).
Table 4. Different Fractions of Food Legume(Unit: Percent)
The carbohydrates in legume seeds range from 24 percent in winged bean to 68 percentin cowpea. Starch is the most abundant in legume carbohydrates and varies from 24 percentin wrinkled peas to 56 percent in pinto beans. Legumes contain an appreciable amount ofcrude fiber. Cellulose and hemicellulose are the major constituents of crude fiber. It has ahypocholesterolemic effect. Nearly 80-90 percent of crude fiber is present in the seed coat.
CHEMICAL COMPOSITION AND MAJOR NUTRIENTS
The chemical composition of food legumes vary and it is governed by the cultivar,geographical location and growth conditions. Legumes are good sources of dietary fiber andminerals. Legumes are rich in protein, carbohydrates and oil. Protein and lipid contents indifferent legumes are given in Table 6. They also contain good amount of dietary fiber andmineral. Proteins can be classified into three basic groups: globulins (70 percent), albumins(15 percent), and glutelins (15 percent). These protein fractions include essential and non-essential amino acids. All legume proteins have less than optimal content of sulphur aminoacids, cystine and methionine and in some tryptophan is also deficient. Amino aciddeficiency can be met by consuming large amount of legumes or by taking a mixture oflegumes or by employing the complementary that exists between high sulphur amino acidcereals and legumes, especially the soybean. Digestibility of legume proteins is poor.However, it can be improved through heat-treatments like cooking, autoclaving, roasting, etc.The poor digestibility is due to the presence of protease inhibitors (Tobin and Carpenter,1978), deficiency of sulphur amino acid (Bressani, 1975), presence of polyphenols and otheranti-metabolites and tertiary structure of native proteins. It is important that this less-than-optimal digestibility of legume be taken into consideration when one is attempting to meetnutritional requirements of humans with diets which are essentially legume-based.
The major constituent of pulses is carbohydrates and it ranges from 24 percent inwinged bean to 68 percent in cowpea. Starch is the principal carbohydrates and it varies from24 percent in wrinkled peas to 56 percent in pinto beans. Minor amounts of lower molecular
- 121 -
weight carbohydrates such as sucrose and sucrosyl oligosaccharides are present. Theoligosaccharides include raffinose, stachyose and verbascose and they are associated withflatulence. It is the major hindrance to large-scale acceptance of legumes as food. Digestibleenergy coefficient for most legumes as well as mixed diets containing legumes are generallybetween 85-90 percent of the gross energy of the dry legume seed whereas metabolizableenergy values are 75-85 percent.
Table 6. Protein and Lipid Contents of Major Food Legumes(Unit: Percent)
Dietary fibers are necessary to prevent various diverticular and degenerative diseases.Recommended daily intake levels range between 25-50 gm of fiber. Legumes are excellentsources of dietary fibers. It ranges from as low as 6 percent in peanuts to as high as 25percent in kidney beans and green gram (Paul and Southgate, 1978; and Kamath andBelavady, 1980). Low dietary fiber intake is linked with increased incidence of cancer of thecolon and rectum, diverticular disease, coronary heart disease, diabetes and gallstone inaffluent societies of the West (Burkitt and Trowell, 1975). A concentrated source of dietaryfiber from soybean is obtained by processing de-hulled and defatted soy flakes. It has 65-75percent dietary fiber (Salvin, 1988). Only 13 gm of soy fiber can provide 10 gm of dietaryfiber in food whereas it takes 23 gm of wheat bran; 58 gm of oat bran; 502 gm of apple; and735 gm of lettuce to provide 10 gm of fiber. The physiological benefits of soy fiber and otherdietary fiber sources are increased fecal bulk and its moisture; reduced plasma cholesterol andpositive influence on blood glucose and insulin concentration.
The hypocholeslterolemic effect is attributed to the dietary fiber fraction of legumes(Cummings, 1978; and Hellendoorn, 1979) because of its high content of pectins, gums andgalactants. Dietary fiber also absorbs bile salt. It is aided by saponins.
- 122 -
ANTI-NUTRITIONAL FACTORS
Legumes also contain some anti-nutritional factors (ANFs) like trypsin inhibitor andothers. These are chemical substances which, although non-toxic generate adversephysiological responses and interfere with the utilization of nutrients. ANFs are proteaseinhibitors, lectins, goitrogens, antivitamins and phytates, saponins, oestrogens, flatulencefactors, allergens and lysinoalanine (Liener, 1981). Some other ANFs are cyanogens, favismfactors, lathyrism factors, amylase inhibitors, tannins, aflatoxins and pressor amines.Although only a few legumes may contain all these ANFs, many contain a few of them. Mostof the ANFs are heat-labile and since humans only consume legumes after cooking, it wouldnot constitute any major health hazard. Heat stable compounds such as polyphenols andphytates are, however, not easily removed by simple soaking and heating. These could bereduced by germination and/or fermentation. Legumes are rich source of polyphenoliccompounds. Till recently, some of these (e.g. tannins), were considered as anti-nutrients dueto their adverse effects on protein digestibility. However, nowadays, there is considerableinterest in the antioxidant activity of these compounds and in their potential health benefits,especially in the prevention of cancer and cardiovascular disease (Menon, 2000). Dark-colored legumes like red kindney beans, black beans, black gram and soybean have higheramount of these polyphenolic compounds.
PRODUCTION AND PRODUCTIVITY
The total production of food legumes in the world in 1998 was 246 million mt (Table7). Out of this, pulses account for 57 million mt (23 percent of total food legumes includingsoybean and peanuts). World production of groundnut was 31 million mt and that of soybeanwas 158 million mt. In 1998-99 India produced 30.91 million mt of food legumes, out ofwhich pulses were 14.81 million mt (Table 8). The other food legumes are groundnuts, 9.16million mt; and soybean, 6.94 million mt. The annual production of food legumes in Indiaduring 1990s were 30 million mt. In this the share of pulses, peanut and soybean were 15million mt (50 percent), 9 million mt (30 percent) and 6 million mt (20 percent), respectively.Productivity of pulses, peanuts and soybean in India during 1998-99 was 622 kg/ha, 1,210kg/ha and 1,100 kg/ha, respectively (Table 9) against the world average yield of 840 kg/ha(pulses), 1,300 kg/ha (peanuts) and 2,240 kg/ha (soybean). Soybean yield in India is verylow. Details of yield of food legumes in India during the last few decades are given in Table10. The yield of pulses in India has increased from 441 kg/ha in 1950-51 to 622 kg/ha in1998-99 (41 percent). Similarly for peanut, it has increased from 775 kg/ha to 1,210 kg/ha(56 percent). For soybean, the increase in yield has been from 426 kg/ha in 1970-71 to 1,100kg/ha in 1998-99 (158 percent) (Table 10).
Table 7. World Production of Food Legumes During 1990s(Unit: Million mt)
India’s population increased from 238 million in 1901, to 845 million in 1991 andcrossed the one billion mark at the turn of this century. The concept of protein requirementhas undergone a drastic reorientation by the nutritionists. Since the nutritive value of proteinvaries according to the amino acid content, the protein requirement are now linked withreference protein in the egg, which is 100 percent utilized in the body. Since all the dietaryproteins are not first class, the conversion ratio of a mixed diet containing an animal proteinis also taken as 80 percent. A vegetarian diet has a conversion ratio 65 percent of referenceprotein. It is generally safe to assume that one gram of seed protein per kilogram of bodyweight (0.1 percent) is required for a balanced diet. For the present Indian population of onebillion consisting of children, young, adult and aged persons, the total dietary proteinrequirement (TPR), @50gm/person/day, is:
For six billion people in the world is 18.25 × 6 = 109.50 million mt (about 110 million mt).The total protein production of plant and animal origin in the world is about 330 million mtand that in India is 27.5 million mt (Table 11). On a global basis, 75 percent of the proteinis derived from plant sources and 25 percent from animal (Table 11). It indicates that thereis no shortage of dietary proteins but the problem is that of physical and financial access tothese proteins in the developing countries, especially for those who are living below povertyline.
Table 11. Plant and Animal Protein Production in the World During 1999-2000and the Share of India
(Unit: Million mt) Protein Source World India India’s Share in the World (percent)
Total 330 27.5 8.3Source: FAO, 1998; and DOES, 2000.
LEGUME PROCESSING
Different operations involved in primary processing of legumes are cleaning, grading,drying/conditioning, storage and milling. Each operation has a definite purpose to achieve.These operations are common to most of the legumes and are briefly described:
- 125 -
Cleaning: It is done to remove impurities. Cleaned grains result in best quality endproducts and also minimize the unit cost of operation.
Grading: It helps to get a uniform mass of grains facilitating finer adjustment ofmachines for desirable outputs. It also helps in reducing the cost of operation.
Drying: It is done to condition the grain to a desirable moisture content for milling orstorage.
Storage: It is done to meet the daily domestic and commercial requirements of grainlegumes till the next crop is harvested.
Milling: It is done to transform grain legumes into products which are fit for humansand/or animals.
PULSES
Pulses are the major dietary protein source in India. As of now, the annual productionof pulses in India is about 15 million mt. India is one of the major pulses growing countriesof the world sharing about 26 percent of the world pulses production. Per capita per dayavailability of pulses in India has declined since 1950-51/1960-61 from 60/70 gm to 38 gmin 1998-99 (Table 12). To meet the present domestic requirements, around 15.5 million mtof pulses are required. At present, this is met by import of about 0.5 million mt of pulses,annually. The projected demand of total pulses by 2007 AD has been worked out at 20million mt and it would be about 30 million mt by 2020 AD.
Table 12. Per Capita Net Availability of Food Grains in India(Unit: gm/day)
Year Cereals Pulses Total Per Capita Net Availability ofFood Grains (kg/year)
Source: IASRI, 1999; and DOES, 2000.Note: * Estimated.
Production and YieldThe trends in production and yield of pulses at national level show an overall increase
(Table 13). Production of total pulses has increased from 8.41 million mt in 1950-51 to about15 million mt in 1998-99 and during the same period, the yield has increased from 441 kg/ha
- 126 -
to 622 kg/ha. The major pulses grown in India are chickpea, pigeon pea, black gram, greengram, lentil, peas and lathyrus (Table 14). Share of chickpea in total pulse production inIndia is about 45 percent and that of pigeon pea, black gram and green gram are 19 percent,10 percent and 8 percent, respectively. During 1998-99, India produced 14.81 million mt oftotal pulses (Table 15). The major States, producing more than 15 percent of total productionof pulses are, Madhya Pradesh (24.1 percent), Rajasthan (16.5 percent), Uttar Pradesh (15.3percent) and Maharashtra (15.2 percent). Other States produce 5 percent or less. Pulses areunder severe pressure from other remunerative crops.
Table 13. Production and Yield of Total Pulses in IndiaYear Production (million mt) Yield (kg/ha)
Source: DOES, 2000.Note: * Pulses include chickpea, pigeon pea, black gram, green gram, lentil, peas,
cowpea, cluster bean, horse gram, kidney bean and lathyrus.
Through the national agricultural research network under the aegis of the IndianCouncil of Agricultural Research (ICAR), stable high-yielding pulse/legume varietiesresistant to pests and diseases have been developed for various agro-ecological situations andnon-traditional areas. Early maturing varieties for green gram and black gram for the spring/summer season after harvest of potato, sugarcane and wheat under assured irrigation and anearly maturing variety of pigeon pea for rainfed areas have been developed, causing a drastictransformation in cropping patterns. Weed management is important and affects yield by 25-30 percent during kharif. Pre-emergence herbicides are most efficient in controlling seasonalweed flora.
StorageStorage of pulse grains is done at farmers, traders and industries levels. Appropriate
technology for handling and storage of pulses have been developed (Ali and Srivastava,1993). The safe storage moisture for pulses are 10-12 percent. Storage also affects thecooking quality of whole and split pulses. For small-scale storage of pulses, reasonablyairtight metallic bins are quite suitable. Large silos are commercially available for large-scalestorage of pulses. Split pulses in 1 kg, 5 kg, 10 kg and 25 kg packages are available in themarket at retail shops.
Factors Affecting Milling Performance of LegumesThe milling of legumes is done to transform the grains into split (dhal) without any
breakage of cotyledons. The milling characteristics of grains depend on type and variety ofthe legumes which influence thickness, texture and waxiness of husk; thickness of gum layerbinding the seed coat to the kernel; shape, size, uniformity and hardness of the grain; and
- 128 -
storage condition. Grain legumes are of various shapes and sizes having different hardness.Some grains are shriveled. All these and similar characteristics of legume seeds play a vitalvole in their milling performance and dhal yield and therefore warrant attention duringmilling.
Processing TechnologyAbout 75 percent of total pulses produced in India are milled into splits (dhal). It is
done at domestic, cottage and small- to medium-scale industries. Losses during milling atdomestic and cottage levels are high, 10-15 percent. Low-cost machines giving betterrecovery of splits (dhal) have been developed and need to be popularized. Capacity of suchmachines is 1-2 mt/day and the cost ranges between Rs.30,000-50,000 (US$800-1,000).
The major operations involved in pulse processing are cleaning, grading, drying,milling, packaging, handling and storage, except where they are used green. Many of theoperations are performed at farm level using traditional practices and equipments.Improvement and low-cost technology packages have also been developed for legumes.Hand/power-operated cleaners and graders with replaceable sieves are commerciallyavailable. Mechanical dryers using biomass, solar energy and electrical energy are availablebut sun-drying is the most common practice.
About 10-25 percent of pulses is converted into dhal at the domestic level and the restsold in the market at low price for conversion into dhal by organized pulse milling industries.Dhal milling is the third largest food grain processing industry in India after rice and wheatmilling. Dhal milling basically consists of removal of the pericarp seed coat, which isattached to the cotyledons through a layer of biochemically complex gum. Pre-millingtreatment involves loosening the pericarp from cotyledons through chemical, mechanical orheat treatment. In modern machines the pretreatment step is an integral component of thedhal milling plant. There are about 11,000 pulse mills with an average capacity of 10-20 mtper day.
Milling of pulses at domestic level is done by splitting the pretreated pulses betweentwo stone discs (one stationary and the other rotary). Wet and dry methods of pretreatmentare practiced for loosening the husk. In the wet method, cleaned and graded pulse is steepedin water for a few minutes to overnight. The steeped pulse is then sundried to about 10percent moisture. The dried pulse is tempered for 1-5 days before milling. Normally 2-4milling operations are required to achieve more than 90 percent de-husking.
In the dry method, the cleaned grains are scratched/pitted by abrasion and smeared withoil and water. For easy to mill pulses (chickpea, pea and lentil), oil smearing is not required.These oil-water smeared grains are tempered (stored in a heap) for 1-5 days. The pittinghelps in absorption of oil-water which diffuses between husk and cotyledons and thusweakens the gum bond. These treated grains are dried to 10-12 percent moisture beforemilling. The process of pretreatment and milling continues until de-husking and milling iscomplete (3-7 passes). The application of edible oil varies from 50-400 gm/100 kg of grainand water from 4 kg/100 kg to 20 kg/100 kg depending upon the legume and region. Thesepractices have evolved through experiences.
The hand-operated stone mills (chakki) have a capacity of 30-50 kg/hour with headdhal recovery of 45-55 percent, breakage or 25-45 percent and de-husking efficiency of 80-95percent. The cost of the machine is low (Rs.500 or US$10-15) and it is locally available.The processing of dhal at the rural level is gradually declining since it is not economical due
- 129 -
to low output and poor quality of dhal. There has been a concerted effort to develop a low-cost pulse de-huller, which can be popularized at the village level.
An inverted cone type machine was developed at the Central Food TechnologicalResearch Institute (CFTRI), Mysore. The machine eliminates the use of oil and water forpretreatment and, thus, reduces total milling time. The machine consists of an emery-coatedinverted metal cone fixed to a vertical shaft rotating inside a conical wire mesh screen. Theclearance between the rotor and casing is adjustable according to the size of grains. Thecapacity of the machine is 50-70 kg/hour at 60-70 rpm and it is operated manually. Power-operated dhal mills also have been developed at CFTRI with output capacity of 150-200kg/hour. In all these machines pretreatment of pulse grains is not required.
Small capacity burr mills for dhal have been developed at several research centers.These are usually 1-2 hp low-cost machines with dehulling, splitting and aspiration facilities.In these machines stone discs or hard rubber-coated discs are used. De-hulling is by atrritionor abrasion action. The cost varies from Rs.30,000-50,000 (US$800-1,000) with capacityranging from 100-200 kg/hour. These machines require conventional pretreated (water + oil)grains. A salt treatment method has also been developed for conditioning the grain. Thegrains are soaked in 6 percent sodium bicarbonate salt solution for 45-50 minutes and driedto 10-11 percent moisture before de-hulling. Salt treatment helps in loosening the pericarp.In some cases the grains are pitted before applying salt treatment or water soaking to hastenthe absorption of salt, water or oil.
In spite of the fact that pulse pretreatment techniques have been refined and low-costmills developed, these have not become popular among villagers for processing of dhal. Thepulses are milled by the organized sector only. These units are scattered mostly in North andCentral India and adopt dry milling technology. In the south, the wet method of milling isgenerally adopted and capacity is smaller. The regional distribution of mills is given in Table16.
Table 16. Region-wise Capacity Distribution of Commercial Dhal Mills in India
The commercial dhal mills consist of cleaning and grading units, pitting, pretreatmentand drying units, tempering, de-hulling, winnowing, splitting, bagging and packaging units.The cost of the plant depends upon the capacity and the degree of automation introduced formaterial handling (Table 17).
About 75 percent of total pulses produced are processed by commercial dhal mills.There is no standardization for specifications of various components and methods of oil/watertreatment. The dhal milling industries in India have so far remained neglected. One of thereasons may be family ownership of these mills. The working environment is very poor inthese industries in respect of dust and noise pollution.
- 130 -
Table 17. Approximate Cost of Commercial Dhal Mills in IndiaDegree of Automation Capacity (kg/hour) Cost (Rs. 000)
1. Home ScaleIt mainly involves loosening of husk and splitting. Different methods are adopted for
de-husking. For pigeon pea, it starts with cleaning, washing, sun-drying (one day), crackingof seed coat in manually-operated stone mill, oil treatment (200-400 gm/100 kg), keeping ingunny bags for two days, water application (10-20 percent), sun-drying, milling by hand-pounding or in a stone mill or chakki. Alternately, grains are washed and soaked for 2-8hours followed by sun-drying for one day, heaping overnight, and milling. Or, cleaning,treating with red-earth, heaping overnight with cover, shade-drying (one day) and milling.Either of the processes with little variation, is followed for other pulses. Dhal yield by theseprocesses is very low (65 percent or so).2. Commercial Scale
Two methods, conventional and modern are in practice. However, most of the dhalmills, still use conventional/traditional methods. The process followed in such mills varyfrom mill to mill, place to place and State to State and no standard or common process is inpractice. Though the sequence of operations such as pre-milling treatment, de-husking,conditioning and splitting is generally common, large variation exists in the steps followedin the operation itself. Operations followed in traditional dhal mills are given as under:Cleaning andgrading
Raw pulses are cleaned by removing dust, dirt, foreign material, off-sized, immature and infested grains and graded. The dockage varies 2-5percent. It depends on crop, season, etc.
Pitting Whole pulse grains after cleaning are passed through abrasive rollermachine for scratching of seed coat to facilitate the entry of oil/water inthe grain during pre-milling treatment. Two to 5 percent grain get de-husked during pitting
Oil and watertreatment
Edible oil is applied to difficult to mill pulses for loosening of husk.The quantity of oil used varies from mill to mill and State to State anddepends mainly on the type and size of the grains, variety, moisturecontent, etc. It is estimated that about seven million mt of pulses requireoil treatment. The quantity of oil used is estimated to be 21,000 mt (300gm/100 kg) worth Rs.630 million or US$14 million. Though a majorpart of this oil forms an edible portion of the product the actual oilconsumption is not affected. Hence, saving of such oil by processmodification/development is the only answer.
- 131 -
Water treatment, which varies with crop and place, is given to grains toachieve expansion for loosening of husk through drying whencotyledons shrink in size. More the water applied, longer would be theprocess/drying time and more energy requirement for drying. Somemillers apply water and oil simultaneously. This reduces the totalprocessing time.
Tempering Treated grains are heaped and covered and left for 12-18 hours. It helpsin penetration of oil/water into the cotyledons after oil/water mixing andequilibration of grain temperature after drying in the sun. At someplaces, wooden/cement tanks are used for tempering the treated grains.
Drying Normally sun-drying is followed. Drying period varies from one day tofive days depending upon weather conditions. Some dhal mills areequipped with dryers for continuous operation of the mill especially inthe rainy season and/or unfavorable weather conditions.
De-husking andsplitting
De-husking of pulse grains is a preparatory operation for splitting. Incase of pulses (green gram, black gram, cowpea) having thin seed coat,there is a tendency to split them before de-husking. This needs manypasses for complete de-husking and adds to breakage. De-husking ispreferably achieved by subjecting the grains to abrasive force andsplitting by attrition and/or impact. Generally 3-9 passes are requiredfor milling of different pulses and this depends on the type of pulsecrop, pre-milling treatment, grain size, variety, etc.
Husk separationand grading
Husk is separated with aspirator and sold as livestock feed. Some findbrokens go along with the husk and if separated, can yield extra quantityof dhal for human consumption. Grading adds to the quality of theproduct.
Polishing Splits (cotyledons)/dhal and some of the pulse grains, namely blackgram, green gram, lentil, and peas are polished to add luster and shineto the product. Dhal is polished in different ways such as nylon polish,oil/water polish, color polish, etc. Some consumers prefer unpolisheddhal.
A survey of few pulse mills in India, processing pigeon pea, was done (Patel, et al.,2000). The major change found in the presently followed system and the old method is thedrying step after pitting and oil treatment/conditioning. In the old method, after every pittingoperation edible oil treatment was given and the grains were exposed to sun-drying for oneday. Then next day further pitting continued till the whole grain got de-husked. On the otherhand, in the presently followed process the sun-drying is not carried out after pitting and oiltreatment. But after mustard oil treatment, the grains are stored in a bin for about 24 hourswhich leads to loosening of husk. Then next day further pitting is carried out. Thecumulative removal of material from the grain during the complete process of dhal millingwas found to be 28.9 percent on dry weight basis. This resulted into 71.1 percent recoveryof dhal on dry weight basis.
In view of the details reported potential for technology upgradation exists in case ofpulse milling industry. The ultimate aims of technology upgradation are to get higher
- 132 -
recovery of dhal, increased efficiency of existing machines, reduced processed time, airpollution control inside the mill, as well as energy saving in the processing operations.
Utilization of PulsesLegumes/pulses are utilized alone, milled and mixed with cereals, salted and
sweetened. Legumes are consumed in various ways: as immature grain (green, roasted,boiled, fried and crushed and cooked); as mature dried grain (boiled, boiled and fried, cookedas dhal, germinated). De-husked splits (cotyledones) as dhal/sambar or converted into flourand then used in a number of preparations. Processes involved in preparation and use ofgrain legumes are soaking, cooking, roasting, puffing, extrusion cooking, germination,fermentation, canning and expression and expelling. The utilization pattern of legumes canbe grouped as follows.
C Green pulses (fresh, boiled and roasted);C Sprouted and germinated (boiled and fried);C Puffed and roasted (spiced/salted);C Milled and cooked (steamed, boiled and fried); andC Fermented products (idli, dosa, dhokla etc.)
Grain Legume Utilization PatternChickpea As immature grains in pod after roasting. De-husked green and tender
grains are consumed after boiling or frying or as crushed and cookedsnack. Also used in curry.As mature grains, it is used as whole seed or splits (dhal) or flour. Thechickpea flour is used for making fermented dish dhokla and in anumber of fried products/snacks. It is most versatile among pulses.
Black gram It is used as whole seed or de-husked splits (cotyledons) for makingdhal. Black gram is extensively used in fermented products like idli,dosa, hopper and papad.
Green gram It is used in curry. Sprouted beans are also consumed. Roasting andfrying of whole seeds or splits (cotyledons) is a popular way in India toprepare snack products which are usually spiced. Unspiced products arealso available.
Pigeon pea It is primarily used for making dhal (cooked splits) and samber (cookedand spiced splits). Both dishes are soup-like in consistency andappearance and are prepared from de-husked cotyledons that are cookeduntil tender and seasoned with spices. Sambar contains addedvegetables (optional) such as eggplant, drum stick, carrots, tomato,potatoes, green peas, etc.
Peas, lentil,kidney bean, etc.
These are generally used as whole seed for making curry. Dhal isprepared from de-husked peas and lentil.
Crop residue andbyproducts
The crop residues like leaves and grain byproducts such as seed coat,germ and broken cotyledons are used as animal feed.
- 133 -
Losses During MillingIn pigeon pea, yield of dhal was found to be only 76 percent against an estimated yield
of 84 percent (Khare, et al., 1966). The 8-percent loss was in the form of broken and huskincluding embryo. The loss of peas from birds in the mill and sun-drying yard and rodentsin stores were found to be sizable. Infestation by insects also reduces dhal yield. Duringcotyledon splitting, embryo loss and breakage of edges of cotyledons occur. Method ofmilling used, greatly influences the loss during milling. In order to reduce the milling loss,it is advisable to clean and grade the grains and perform de-husking and splitting as twodifferent operations and follow improved method of milling developed by various researchand development (R&D) organizations. Following needs further attention towardsmaximizing the yield of dhal.
C Increasing the efficiency of de-husking.C Adjusting of milling machinery to suit each grain legume.C Separating husked and unhusked grains properly.C Proper loosening of gums and mucillages and their influence on grain milling.C Improving the splitting efficiency of de-husked/pearled grain.C Recovering and refining the edible portion of byproducts.C Controlling the noise and dust in dhal mills.
With the above improvements, improved milling efficiency can be expected and betterquality dhal can be obtained under hygienic mill environments. Losses during soaking,cooking, germination, fermentation, roasting, baking, etc. also occur. These could beminimized by optimizing the operational parameters for yield and quality of end products.
Consumption Pattern of Pulses and Other FoodsPulses enjoy the distinction of being protein-rich food and form an important
constituent of diets of the people of India. The average level of consumption of various fooditems, including pulses, and different nutrients derived from them, for rural and urbanpopulation groups are given in Table 18 (Rao and Gowrinath Sastry, 1993). Data indicatedthat:
C Cereals like rice, wheat, and millets are staple foods and constitute the bulk of thefoods consumed by the population. Their consumption was more in the ruralhouseholds than the urban population groups.
C Consumption levels of income-elastic, protein-rich and protective foods such as pulses,milk, vegetables, flesh foods, and oils were much lower in low-income group (LIG)households than in those of high income group (HIG).
C Among the varieties of pulses consumed, pigeon pea, chickpea and black gram (urd)were quite common. Of all the types, pigeon pea was the most favored pulse by all theincome groups. The share of other less common pulses, such as horse gram, lathyrus,lentil tended to be higher in the rural households.
Nutrient intakes showed a positive relationship with socioeconomic status (Table 19).Intakes of all nutrients were higher among the HIG, while the lowest intakes were seen inslum dwellers (SD). The LIG and industrial labor (IL) groups showed more or less similarlevel of intake, and always trailed behind the middle income group (MIG), which in turn
- 134 -
Table 18. Average Intake of Foodstuffs in Different Urban and Rural Groups of India(Unit: gm/capita/day)
Socio-economic Group Cereals Pulses LeafyVegetables
(C) Balanced diet* 460 40 40 60 50 150 40 80Source: National Nutrition Monitoring Bureau (NNMB), 1984; and Rao and Gowrinath Sastry, 1993.Note: * Least cost balanced diet recommended by Indian Council of Medical Research (ICMR) (1981) for adult sedentary male.
Table 19. Average Intake of Nutrients in Different Urban and Rural Groups in IndiaSocio-economic
followed the HIG. Compared to the levels recommended by the ICMR Expert Committeeon Recommended Dietary Allowances in 1981, the daily per capita consumption unit intakesof protein were adequate (above 55 gm) in all the urban socio-economic and rural groups,except SD for whom there was a marginal deficit. The average daily levels of energy intake,however, fell short of RDA (10 megajoules) in all the groups except the HIG. The extent ofdeficit in the LIG and IL group was around 10 percent, and in the slum population it wasabout 20 percent.
Apart from the quantitative aspects of consumption, the quality of food consumed isof great importance to health and nutrition. Nutrition experts suggest that in order to bewholesome and nutritionally adequate, the diet has to be balanced. It should contain varioustypes of such foods as cereals, pulses, vegetables, roots, and tubers, not only in adequatequantities but also in the right proportions.
According to the Expert Committee the ratio of the protein derived from the cereals tothat obtained from pulses should be between 4:1 or 5:1 so that the protein quality of the dietis not compromised.
The traditional practice of consuming pulses along with the staple food prevalent inthe country is thus scientifically sound. However, the quantities of pulses consumed,particularly in relation to cereals, by the households of lower socio-economic groups in therural and urban areas are not only below the community averages, but also below theprescribed levels in the ICMR’s ‘balanced diets’ for an average Indian. The HIG and the MIGconsuming relatively more than the suggested proportion of pulses, the worst off being therural households and SDs (Rao, et al., 1986).
There is a positive relationship between pulse consumption and income. There is alsoa wide inter-State variations in pulse consumption. The lowest daily consumption of 12 gmwas in Kerala, while the highest level of 45 gm was in Karnataka closely followed byMadhya Pradesh. The data also seem to corroborate the observation that the higher pulse-consuming states are also the larger pulse-producing States, notably Madhya Pradesh andKarnataka, and the adjoining States that have vast tracts of semi-arid and non-irrigated croplands where pulses are cultivated.
Pulse availability during the past several decades, suggest a drop in availability duringthe 1970s, 1980s and 1990s as compared to 1950s and 1960s. The present (1999-2000) percapita per day net availability of cereals and pulses are 430 gm and 40 gm, respectively(Table 12). It therefore, suggests a higher ratio of cereals to pulses, reflecting diets relativelyinferior in protein quality.
GROUNDNUT
Groundnut is also known as peanut, earthnut and monkey-nut. Groundnut is one of thenature’s most nutritious seeds and one of the world’s most popular and universal crops,cultivated in nearly 100 countries in all six continents. The peanut is one of the majorsources of edible oil and proteins for humans and animals. The groundnut is not a true nutbut rather a legume much like the bean or a pea (Nwokolo and Smartt, 1996). It is an annualherb, a member of the family Leguminosae. India is the second world’s largest producer ofpeanut after China, accounting for nearly 30 percent of total world production and togetherwith China account for about 68 percent of world production (Table 20).
- 136 -
Table 20. World Production of Groundnut in 1997-98Name of the Country Production (million mt)
China 10.00India 8.00U.S.A. 1.59Senegal 0.72Argentina 0.43Sudan 0.40South Africa 0.17Brazil 0.15Others 4.97Total 26.43
Source: Soytech, 1998.
Proximate CompositionGroundnut kernel shell represents about 75 percent of the dry weight of the pod
(unshelled peanut), where as the shell comprises the other 25 percent. The two fleshycotyledons comprise 93 percent by weight of the kernel and the germ and testa comprise 4percent and 3 percent of kernel weight, respectively. The chemical/proximate compositionof groundnut components/products is given in Table 21. The cotyledons are the mainnutrient storage tissue and are a concentrated source of lipids, protein and dietary energy,whereas the shell is high in crude fiber, a structural carbohydrate. Peanut butter isexceptionally well balanced in nutrient content.
Table 21. Chemical Composition of Peanut and Its Products(Unit: gm/100 gm)
Source: United States Department of Agriculture (USDA), 1986.
Groundnut kernels are rich in oil (45-50 percent) and protein (25-30 percent) and havea high energy value. The production of groundnut in India is about nine million mt with anaverage yield of one mt/ha. Kernels are used for oil extraction, foods and as an ingredientin confectionery products. The residual cake is processed largely for use as animal feed butalso for human consumption. The haulms are used as fodder. The major groundnut-producing States in India are Gujarat (28.2 percent), Tamil Nadu (21.4 percent), AndhraPradesh (21 percent), Karnataka (13.4 percent) and Maharashtra (6.9 percent). State-wiseproduction of groundnut in India is given in Table 22. The highest yields is in Tamil Nadu,1,632 kg/ha.
- 137 -
Table 22. State-wise Production of Groundnut in India During 1998-99State Total Production (million mt) Yield (kg/ha)
Food Uses of GroundnutIn India about 80 percent of total groundnut production is used for oil extraction and
the 20-percent for food/snacks as roasted, salted or fried nuts. Peanut butter has also beendeveloped. Hygienically produced groundnut cake/defatted meal, can be used to prepareacceptable bakery products such as bread, biscuits, cookies, etc. Fortified groundnut flour(5-10 percent) could be used for making such products. The major uses of groundnut are:
Type of Use DescriptionEdible oil Oil is extracted from groundnut kernels using either mechanical
expellers or solvent extraction or a combination of both. The crude oilis then refined, bleached and deodorized for use. Cake/meal is used inlivestock feed.
Processedkernels
The kernels are roasted/fried/steamed and consumed as snack foods.Sometimes steaming and roasting of pod itself is done and then kernelsare taken out manually/mechanically and utilized.
Chikki andladdu
Roasted kernels along with jaggery/sugar.
Protein isolatesand compositeflour
Peanut protein isolates are used in a number of food preparations forprotein enrichment. Composite flour is prepared using tapioca flour (75percent) and peanut flour (25 percent).
Poustik atta(nutritious flour)
It has two formulations. One has 75 percent whole wheat flour, 17percent tapioca flour and 8 percent peanut flour. It is used wheretapioca flour is available in plenty. Second formulation has 90-95percent whole wheat flour and 5-10 percent groundnut flour. Both theformulations have been accepted by the consumers.
Infant andweaning foods
A nutritionally sound infant food based on peanut protein isolate andskim milk powder has been developed. It has 26 percent protein.
Miltone It is a milk-like product or milk analog made from 50 percent liquidisolate and 50 percent milk. It has proved successful in school feedingprograms.
- 138 -
Research NeedsThe extraction of oil using mechanical pressers leaves 6-8 percent oil in the cake.
Hence, it is necessary to improve the efficiency to bring down the oil content in the cake toabout 3 percent. Such expellers have been developed and are now being promoted. Theresidual cake/meal is dark grey in color, rich in pigments, and contains phenolic compoundsand fiber. It is, therefore, not fit for human consumption. Since the cake/meal contains 40-50percent good quality protein, it is necessary to refine and make it edible. Roasting parametersneed to be optimized. Commercial preparation of groundnut based food products underoptimized conditions would help to enhance food uses of groundnut.
SOYBEAN
Soybean is a legume crop originated in China and now it is grown all over the worldfor its oil and protein. The major soybean growing countries of the world are the UnitedStates, Brazil, China, Argentina and India (Table 23). North and South America produceabout 80 percent of total world production though most of the germ plasm have come fromChina. Global soybean production during 1990s has been in the range of 105-155 millionmt with an average yield of 2 mt/ha (Table 24). Soybean cultivation in India dates back to1000 AD. The soybean production in India in 1999-2000 is about 6 million mt with anaverage yield of 1,000 kg/ha (Table 25). Nearly 64 percent of the total production was inMadhya Pradesh (Table 26).
Table 23. Major Soybean-producing Countries of the World, 1997-98Country Production (million mt) Productivity (mt/ha)
Table 25. Production of Soybean in India During 1990s and Beyond(Unit: Million mt)
Production Year Production Production Year Production1990-91 2.60 1995-96 4.991991-92 2.49 1996-97 4.851992-93 3.39 1997-98 5.001993-94 4.75 1998-99 5.501994-95 3.93 1999-2000 6.00
Soybean is an excellent health food. It contains about 40 percent good quality protein,20 percent oil, 0.4 percent lecithin, and other nutrients (Table 27) and has a great potentialto combat protein-calorie malnutrition in India at an affordable cost. Soy foods are nutritious,economical and provide many health benefits. Use of 5-25 percent of soybean along withcereals gives maximum nutritional advantages. However, due to the presence of some anti-nutritional factors, it requires careful processing to make it fit for human and animalconsumption.
Table 27. Nutritional Composition of Soybeans
Nutrients Proximate Value ofEdible Protein (gm/100 gm)
Whole beans or partially/fully defatted cake/meal are used for making various soy-based food and feed products (Table 28). Soybean fortification enhances the nutritive valueand functionality of foods and feeds. Soy products like oil, texturized soy protein (TSP), soy
- 140 -
milk, soy paneer (tofu), soy yogurt, soy flour, soy-fortified bakery products, and health foodsare gaining good acceptability among the people in India because of economic and healthbenefits. Also the use of soy meal as protein source in poultry, piggery and aquaculture feedis increasing. Soybean Processing and Utilization Center (SPU) at the Central Institute ofAgricultural Engineering (CIAE), Bhopal has developed a number of soy-based foodproducts and technology that are being promoted (Table 29). The present day soybeanindustry has about 265 units which can be grouped as under:
Oil extraction plants 154Food manufacturing units 60Equipment manufactures 30Trading houses 15Government and other agencies 6Total 265
Table 28. Soybean Food Potential and Options – Technology and the ProductsSoybean Form Used Technology Products
Dehydration, size reduction, fer-mentation, separation, packaging,storage and marketing.
Dietary fiber, single cellproteins, citric acid, enzymes,alcohol.
Source: Ali, 1993.
Creation of domestic market for soy meal through its utilization in food, feed andpharmaceutical industry is essential for de-linking foreign dependence of Indian soybeanindustry. This requires need-based and high quality R&D in the area of soybean processingand utilization. Some of the suggested strategies for value addition and diversified uses ofsoy meal in domestic and export market are: protein-rich defatted edible soy flour to be usedin wheat and chickpea flours for higher protein content and better nutritional quality; soy-based high-quality and cost-effective poultry, aqua and cattle feeds; soy protein concentrates,isolates and hydrolysates to be used in food formulations for infants, children, adult and agedpersons; soy-based speciality food for diabetics, lactose intolerants, cancer and cardiovasculardisease patients, and export of value-added soy meal for food, feed and industrialapplications.
- 141 -
Table 29. Soy Products and Technology Available at SPU, CIAE, BhopalSoy Products and Technology (15):Soy dhal (processed soy splits) Soy milkSoy flakes Soy paneer (tofu)Soy flour Soy yogurtSoy-fortified biscuits Soy ice-creamSoy-fortified bread TempehSoy-fortified muffins Soy sattuSoy-fortified bun Okara-based burfi and gulabjamun
Source: Ali, 1995; 1997; and 1998.Note: *LSU = Louisiana State University.
Low-price and highly nutritive soy-based food and feed products ensure economicviability of soybean industry and promises household nutritional security and better healthin the near future.
FUTURE STRATEGIES FOR IMPROVEMENTS INNUTRITIONAL QUALITY OF FOOD LEGUMES
Pulses, peanut and soybean constitute about 13 percent of total seed/grain foods(cereals, pulses and oilseeds) in India and 10 percent at global level. Cereals contain 7-14percent protein whereas legumes have 20-40 percent. Lysine is the first nutritional limitingessential amino acid in most cereals, tryptophan is the second limiting amino acid in maizeand the threonine in other cereals. Legumes are deficient in methionine and cysteine. Themajor utilization problems of legumes and cereals and their possible causes are given inTable 30. In practice, cereals and legumes are eaten with other foods. The overall proteinquality of cereal – legume mixtures is better than that of either protein source alone due tothe complementary nature of their amino acid profiles.
- 142 -
Table 30. Utilization Problem of Legumes and Cereals and Possible CausesFoods Problems Causes
Legumes Incomplete Limiting amounts of methionine and cysteineIncomplete availability of Unknownamino acidsLow protein digestibility Nature of protein (?) protease inhibitors (?)Anti-nutritional factors Protease inhibitors, haemagglutinins,
Cereals Low protein content Limiting amounts of lysine, and in someIncomplete protein cereals tryptophan, threonine
Source: Nwokolo and Smartt, 1996.
Since cereals are the major dietary protein source (50 percent) world over, increasingthe protein content alone will improve the protein intake of a large number of people,especially those living in developing countries, where protein-calorie malnutrition isprevalent. For instance, an increase of 3 percent protein in rice without a decrease in grainyield will add an additional 2.4 million mt of protein in the diet of Indian rice-eating people,based on 80 million mt of total rice production in India during 1999-2000. Improving theprotein quality of rice grain will bring additional significant benefits.
There are three approaches to enhance the nutritional quality of seeds/grain legumes.These are biotechnology, processing and fortification. Biotechnology would help to altermethionine contents of plant seeds/legumes through the use of methionine-rich ormethionine-enriched protein genes driven by seed specific promoters. But they should bedevoid of allergens. Improving the digestibility of proteins and starch, reducing flatulence,altering fatty acid composition, minimizing formation of undesirable flavors and aromashould also be the future strategy. Processing technologies should help to transform rawgrains into useful products with a minimum nutritional loss. Innovative fortification ofcereals with legumes to improve protein content quality should ensure nutritional security.
RECOMMENDATIONS
The Government of India is concerned with problems of the dhal milling industries andpoor domestic utilization of soybean and its protein products. A number of studies have beensponsored by the Government of India to assess the production capacity, marketing,modernization constraints etc., of dhal milling industry. Major recommendations whichcould be considered for improving food legume processing and utilization are:
1. Modernization of the dehulling process, especially elimination of use of oils andintroduction of mechanical drying to reduce losses during sun-drying.
2. Reduction of processing and handling losses, which presently account for up to 15percent.
3. Improvement in the working environment within factories by adopting dust and noisecontrol measures.
- 143 -
4. Promotion of dhal processing units in rural areas to reduce cost of production, increasedhal recovery (freshly harvested pulses are easily dehulled) and increase ruralemployment.
5. Introduction of improved storage structures to reduce losses due to spoilage as well asinsect and rodent attack.
6. Modernization of packaging for bulk handling at sales outlets.7. Promotion of direct food uses of soybean to exploit its nutritional and health benefits.8. Popularization of use of roasted/fried/steamed groundnut kernels as snack foods. The
kernel may be partially defatted.9. Economic utilization of food legumes processing and use of byproducts in livestock
feed and other products.
REFERENCES
Ali, Nawab, 1993. “Diversification of Oilseeds and Their Byproducts Towards Food Usesin India”, in R. S. Paroda and M. Rai (eds.) Oilseeds in Asia-Pacific Region, pp. 143-160, FAO Regional Office, Bangkok.
----------, 1995. “Global Scenario of Soybean Production, Processing and Utilization”, AET19 (1-2): 18-27.
Ali, Nawab and P. K. Srivastava, 1993. “Conditioning, Storage and Milling of Food Grainsand Oilseeds”, AET 17(3-4): 1-5.
Bressani, R., 1975. “Legumes in Human Diets and How They Might Be Improved”, in M.Milner (ed.), Nutritional Improvement of Food Legumes by Breeding, Willy, NewYork, U.S.A.
Burkitt, D. P. and H. C. Trowell, 1975. Refined Carbohydrates Foods and Diseases,Academic Press, London, U.K.
Cummings, J. H., 1978. “Nutritional Implications of Dietary Fibre”, Am. J. Clin Nutr.,32:521-527.
Directorate of Economics and Statistics, 2000. Agricultural Statistics at A Glance, Ministryof Agriculture, Government of India. New Delhi.
FAO, 1998. Production Year Book 1998 (Vol. 52), FAO, Rome, Italy.
Gopalan, C., B. V. Rama Sastri and S. C. Balasubramanian, 1974. Nutritive Value of IndianFood, National Institute of Nutrition, Hyderabad, India.
Gupta, Y. P., 1982. “Nutritive Value of Food Legumes”, in S. K. Arora (ed.), Chemistry andBiochemistry of Legumes, Oxford and IBH Publishing Co., New Delhi.
- 144 -
Hellendoorn, E. W., 1979. “Beneficial Physiological activity of Leguminous Seeds”, Qual.Plants Plant Foods in Human Nutrition, 29:227-235.
IASRI, 1999. Agricultural Research Data Book, IASRI/ICAR, New Delhi.
Indian Council of Medical Research, 1981. Recommended Dietary Allowances (RDA) by theIndian Council of Medical Research (ICMR), New Delhi, India.
Kamath, M. V. and B. Belavady, 1980. “Unavailable Carbohydrates of CommonlyConsumed Indian Foods”, J. Sci. Food Agric., 31: 194-202.
Kapoor, A. C. and Y. P. Gupta, 1977. “Distribution of Nutrients in the Anatomical Parts ofSoybean and Different Phosphorus Compounds in Seed and Its Protein Fractions”,Indian J. Nutr. Diet, 41:100.
Khare, R. N., K. Krishnamurthy and S. V. Pingle, 1966. “Milling Losses of Food Grains –Studies on Losses of Pigeon-pea During Milling”, Bull Grain Tech., 4:125.
Kurien, P. P., 1977. “Grain Legume Milling Technology”, paper presented to FAO ExpertConsultation on Grain Legume Processing, November, CFTRI, Mysore, India.
Liener, I. E., 1981. “Factors Affecting the Nutritional Quality of Soy Products”, J. Am. OilChem. Soc., 58:406-415.
Menon, Krishnakumari, 2000. Legumes in Human Nutrition, 24(2): 21-32.
National Nutrition Monitoring Bureau, 1984. Urban Survey Report of the National NutritionMonitoring Bureau (NNMB), National Institute of Nutrition, Hyderabad, India.
Nwokolo, E. and J. Smartt (eds.), 1996. Food and Feed from Legumes and Oilseeds,Chapman and Hall, London.
Patel, N. C., V. K. Chandegara and M. N. Dabhi, 2000. “Pulse Milling Industry NeedsTechnology Upgradation”, Business Star, p. 508, June 2000.
Paul, A. A. and D. A. T. Southgate, 1978. “The Composition of Foods”, 4th revised andenlarged edition of MRC Special Report No. 297. HMSO, London.
Rao, N. Pralhad and J. Gowrinath Sastry, 1986. “Diet and Nutrition in Urban Areas”, Proc.of the Nutritional Society of India, 32:91-99.
----------, 1993. “Legume Consumption and Its Implication on the Nutritional Status of thePopulation in India”, Proc. of a Consultants Meeting on Uses of Tropical GrainLegumes, held 27-30 March 1989 at International Crops Research Institute for theSemi-Arid Tropics (ICRISAT Centre, Hyderabad, India.
- 145 -
Salunkhe, D. K., S. S. Kadam, and J. K. Chavan, 1985. “Chapter 7: Processing andUtilization”, in Postharvest Biotechnology of Food Legumes, pp. 109-140, CRC Press,Inc. Boca Raton, Florida, U.S.A.
Salvin, J. L., 1988. “Nutritional Value of Soybean Fibre”, in L. McCanny (ed.), SoybeanUtilization Alternatives, Proc. of a Conference by the Centre for Alternative Crops andProducts, 16-19 February, University of Minnesota, St. Paul.
Singh, G., 1993. “Production, Processing and Marketing of Food Legumes and CoarseGrains in India”, Proc. of a Workshop on Marketing and Processing of Food Legumesand Coarse Grains: Effects on Rural Employment in Asia, held in Serdang, Malaysia24-27 May.
Soytech. 1998. Soya Bluebook Plus – The Annual Directory of the World Oilseed Industry,Soytech Inc, ME 04609, U.S.A.
Tobin, G. and K. J. Carpenter, 1978. “The Nutritional Value of the Dry Bean – A LiteratureReview”, Nutr. Abstract Rev., 48:919-936.
USDA, 1986. “Composition of Food: Legumes and Legume Products”, AgricultureHandbook No. 8-16, Human Nutrition Information Service, Washington, D.C.
- 146 -
5. INDONESIA
Ignatius SuhartoDeanFaculty of Industrial TechnologyCatholic University of Parahyangan,H. Adang KadarusmanIr. MSc.University of Pasundan, andCatharina DamajantiDra., MM, Post Graduate onMaster of ManagementBandung
INTRODUCTION
Present Situation and Economic Importance of LegumesProcessing and utilization of legumes begin with research activities at laboratory,
continuing onto the pilot plant and ending finally at the commercial unit or the factory.Therefore, there is a need for the establishment of research and development organization inIndonesia and also in other developing countries not only to generate appropriate technologybut also to adapt research results and technology transfer to suit local conditions. Researchand development organizations should be provided with all modern equipments, financial,technical and qualified human resources and authority to guarantee appropriate outputs.Research results must be transferred to the commercial sector. In order for this to happen,existing traditional legume processing industries must ask themselves:
1. Where is the legume processing industry now in each member countries of APO?2. Where does the traditional legume processing industry move?3. How does the traditional legume processing industry get there?4. What is the next step in legume processing industry in each member countries of APO?
The above questions will be answered through the following objectives presented inthis paper: “to study the existing legume raw materials and appropriate technology to obtainlow-cost, high protein-rich foods for low-income group people in rural areas in Indonesia andother developing countries”.
The Impact of Economic Globalization and the Present Situation ofAvailability of Legume Raw Materials
The impact of the anticipated economic globalization in 2020 on the development ofscience and technology in legume processing can be seen in the productivity of the legumeprocessing industry. The higher the knowledge and capabilities of the people involved in thescience and technology development, the higher the productivity of the legume processingindustry. Productivity is a ratio of output to inputs:
Productivity gain is the rate of change in output with respect to input (Hamid Noori,1990). This international situation will affect each country differently. In Indonesia, thereis a gap between natural resources and human resources development for low-income groupin the rural areas. So the pressure of poverty is everywhere. Furthermore, protein-caloriemalnutrition is still a major problem in rural areas. This is due to the lack of quantity andquality of high-cost protein-rich foods, method of processing, food habits and also attitudes.However, the main problem is poverty, inequitable distribution of income and naturalresources, low legume productivity, and high population growth. A rise in the productivityof the legume processing industry could result in increased economic growth and productionefficiency. Legume processing industries can convert raw legumes into value-addedproducts. Productivity can be visualized by the following equation of the production system.
The Population TriangleAbout 80 percent of the Indonesian population of 200 million in 2000 are in the rural
areas which represent mostly low-income group. People in rural areas are still leading oldtraditional way of life. The rural population needs enough high protein-rich foods to supplydaily protein and calorie requirements. Protein-calorie deficiency is still widespread in ruralareas. A lack of adequate food and nutrition has a very close relationship to health andeducation. Protein-calorie malnutrition occurs due to lack of high protein foods andeducation. Food availability has four components, namely: calories, proteins, fats, and othernutrients. The economy of the Indonesia is still based on the production of primarycommodities from agriculture and other natural resources. A more intensive agriculturalsystem has many economic advantages, but it brings about many problems in the food chainsystem. Diversification of legumes into several high protein products can supply highprotein-rich food for low-income group. In the middle of July 1997 until now, the economiccrisis is still a major problem in Indonesia. The per capita income decreased from US$1,000in 1997 to US$800 in 2000. In the present situation, legume processing can act as a platformfor strategic development and utilization of locally available legumes as raw material to getlow-cost high protein-rich food for low-income group can help to maintain economic growthin Indonesia.
Change of stock is due to mechanical damage and microbial contamination. Legumeprocessing, marketing and consumption system is shown in Figure 1.
- 148 -
ImportImportIndonesia
Developed Countries
Handlingand Storage
Figure 1. Legumes Chain System
Productionof Legumes
Handlingand Storage
Processing andUtilization
Distributionand Marketing Consumption
Productionof Legumes
Processing andUtilization
Distributionand Marketing Consumption
Fermentation and Non-fermentation Technology
Population
Legumes and Soybean Traditional Legumes Industries
The relationship among legumes and soybean, fermentation and non-fermentationtechnology, and traditional legume industries, not only bring economic growth, but alsoimprovement in the quality of life of mankind (Figure 2). The higher the total population is,the higher the supply of legume processing and utilization. Therefore, the alternative sourcesof food supply should be identified. The use of fermentation and non-fermentationtechnology approaches for legumes will be very useful and is important for the low-incomegroup. Figure 2 shows that improvement in any one component depends on theimprovements in the other two. There are strong interrelationships among population, rawmaterial of legumes and the traditional legume processing industries. Therefore, it is notsufficient to identify and understand only one element, but it is essential to look at the fullpicture in a holistic way. Traditional legume processing is a very small-scale industry but itis essential to develop a dynamic traditional legume processing. Consequently, there will bea need for competition to obtain better price for traditional legume processing. Therefore,the issue is not total population, but how those variables in terms of fermentation and non-fermentation technology, legumes and soybean, and traditional legume processing industryand population relate to available resources. The population problem must deal with theother variables to eliminate mass poverty and protein-calorie malnutrition, to ensure moreaccess to resources. Human resources development can be improved by education to managethose variables. Fermentation and non-fermentation technology offer the better productivity,increased efficiency and decreased pollution through the modern legume processingtechnology.
Figure 2. The Population Triangle
The Organo-ware TriangleThe traditional processing and utilization of legumes need technology to process raw
material into new product. Due to the increasing demand for large quantities of legume
- 149 -
Techno-ware
Organo-ware
Human-ware Organo-ware
products in Indonesia, it is important to improve the traditional legume processing industry.Technology can be divided into four components, namely: facilities (techno-ware), skills(human-ware), technical knowledge potential (info-ware), and institution (organo-ware)(Figure 3). One of the major traditional legume processing industry challenges of theglobalization era is how to focus the integrated approaches of human-ware, techno-ware,info-ware and organo-ware, to increase export containing high technology and also toincrease productivity of traditional legume processing industries. Technology is the facilitiescenter of transportation system that can be developed and operated by human-ware usinginfo-ware. Techno-ware cannot be operated without human-ware. Scientific human resourcecan be produced by the university.
Figure 3. Organo-ware Triangles in terms of Human-ware, Infoware, Techno-ware
DEVELOPMENT OF PROCESSING ANDUTILIZATION OF LEGUMES IN INDONESIA
Traditional fermented food products in Indonesia are: tempe, kecap (soy sauce),oncom, tauco, and yogurt. All these food products are processed by simple methods.Traditional fermented foods are produced using microorganisms such as bacteria, fungi andyeast. Therefore, the roles of bacteria, fungi, and yeast will be focused in this discussion.Some of moulds or fungi which can be used for producing traditional fermented food are asfollows.
The isolation and identification of organisms isolated from fermented soybean (tempe)are Rhizopus sp., Aspergillus sp., Penicillium sp., Neurospora sp., and yeast strainTrichoderma sp. Most of the Rhizopus sp. strain isolated from tempe indicated protease andamylase activity. The protease enzymes produced by Rhizopus strain play an important rolein hydrolyzing the protein contained in soybean into more digestible amino acids. Amylaseis not produced by Rhizopus solonifer and Rhizopus oligosporus, but produced by Rhizopusoryzae. Even though protease plays an important role in tempe fermentation, experience hasshown that the consumers do not favor tempe made from Rhizopus oligosporus alone, ascompared to tempe fermented by mixed cultures. Aspergillus, Rhizopus and Penicillium areimportant for preparing soy sauce and tempe in Asia. Rhizopus oligosporus, and Rhizopusoryzae can be used for the tempe fermentation. The optimum temperature for Rhizopusoryzae is 30ºC. In Indonesia, legumes are important contributors of high protein foods to thedaily diet, especially for low-income groups in rural community. There are many well-knownvarieties of legumes, both non-toxic as well as toxic. The nutritive values of commonly usedlegumes (soybean, green gram, cowpea, peanut, red kidney bean) were analyzed and the dataare given in Table 1.
- 150 -
Table 1. Chemical Composition of Five Indonesian Legumes Purchased from Market(Unit: Percent)
Legume Energy (cal) Moisture Protein Fat Carbohydrate Fiber Ash
Source: Annual Report of National Institute for Chemistry, 1997-1998, ASEAN, LKN-LIPI, 1997-1998.
- 151 -
In general, legumes have a low fat content of about 1-2 percent (peanut and soybeanare exceptions).
Fermented Low-cost Protein-rich Foods from Legumes
1. Oncom ProductsOncom fermentation by Neurospora sitophyla – Peanut and pressed peanut cake can
be used as solid substrate for Neurospora sitophyla to produce oncom. Fresh oncom can beused for the production of oncom chip with a 0.2-cm thickness by applying the blanchingmethod and oven-drying at 70-80ºC. The fresh oncom is prepared using the following steps:oncom slicing, steaming, drying, grinding and sieving through 32 mesh. The oncom flour isprocessed further for preparing meat ball.2. Soybean Tempe Products
Soybean tempe is made by using soybean and Rhizopus oligosporus and Rhizopusoryzae. Total consumption is about 20,000 mt per week. Soybean tempe provide thecommon people with both economic and nutritional security. Protein content of soybeantempe is about 18.5 percent.3. Canned Tempe
Canned tempe has a longer shelf life than the fresh tempe. Thermal processing is usedin the preparation of second generation of tempe to destroy pathogenic microorganism. Theheat is applied atleast to destroy Clostridium botulinum completely because the spores aremost heat-resistant. It is necessary to evaluate the heat penetration at the slowest heatingpoint of tempe in the container. The graphical method is simple to observe the efficiency ofthermal processing by integrating the temperature-time relationships with sterilizing rate.The area under a lethal value of one, indicates the total lethality of process to be equivalentto the lethal time for any particular temperature. A lethal value of one, indicates that theprocess equivalent to a Fo value of 2.4 minutes or equivalent of thermal death time ofClostridium botulinum at a temperature of 121ºC for container (can) size of 10 cm indiameter, 6 cm in height and the sterilization process is completed with 1 kg/cm2 of pressure.Microbiological analysis is conducted by calculating the total plate count of canned tempetwo weeks after storage at 37ºC. The pH value of tempe is in the range from 5.2 to 5.8. Theinhibitor effect of acids on spoilage organism becomes apparent at pH 5.3, while Clostridiumbotulinum is inhibited at pH 4.5.
The following four tempe have been formulated:i) Sambal Goreng Tempe (fried tempe with chili sauce);
ii) Tempe Bumbu Rujak (tempe with coconut milk and other ingredients);iii) Bacem Tempe (boiled tempe with brown sugar, salt and other ingredients); andiv) Steak tempe
4. Soy Sauce Manufacturing TechniqueTwo kinds of soy sauce are known in Indonesia, namely, the sweetened soy sauce and
the salty soy sauce. Soy sauce is widely used to enhance the taste of Indonesian foods. Atpresent soy sauce is manufactured traditionally by fermentation process at home industryscale. A general scheme of soy sauce manufacturing using the whole soybean consistsusually the following steps: pretreatment of soybean; mold fermentation; brine fermentation;and processing after brine fermentation. The pretreatment usually consists of cleaning,soaking, cooking and draining of soybeans prior to mold fermentation. The problems in
- 152 -
manufacturing techniques exist mostly during mold and brine fermentation process, as wellas during processing after brine fermentation.5. Tempe Yogurt
Tempe yogurt can be produced by extracted tempe using Lactobacillus bulgaricus andStreptococcus lactis.6. Benguk Tempe
This benguk tempe (Mucuna pruriens), grows on less fertile soil. Tempe benguk ischeaper than soybean tempe. Tempe benguk is consumed as a side dish. Mucuna pruriensseeds in Indonesia can be divided into grey, black and spotted seed coat. Protein content ofbenguk tempe is about 10.2 percent (Haryoto, 1995).7. Kecipir Tempe (Winged Bean Tempe)
The fermentation process of winged bean tempe includes washing seeds, boiling forone hour, removing the seed coat, soaking for 24 hours in excess water, and sterilizing for30 minutes at 121ºC. The substrate is inoculated with Rhizopus sp. and incubated at 30ºC for2-3 days. Protein content of winged bean tempe is 17.5 percent (Haryoto, 1995).8. Winged Bean Yogurt
Winged bean milk can be used to prepare winged bean yogurt using Lactobacillusbulgaricus and Streptococcus lactis. Winged bean milk is sterilized at 100ºC for 20 minutesand the pH is adjusted to 8.5 by adding NaOH. About 5 gm Ca(OH)2 is added to removepeanut oil taste and also to destroy trypsin inhibitor (Haryoto, 1995).9. Winged Bean Sauce
Most of the strains which produce strong amylolytic and proteolytic activities areAspergillus spp. There are two fermentations involved, namely; the mold fermentation andthe brine fermentation.
The Formulation, Production, and Processing of Low-cost Non-fermentedProtein-rich Foods Using Legumes in Indonesia
The most serious dietary problem in Indonesia is lack of protein in adequate quantities,particularly protein suitable for infants, young children and other vulnerable groups.Considering that Indonesia has a high potential to produce protein-rich raw materials, a well-coordinated research program is needed. Research includes development of lowest protein-rich food using oilseed by products and preparation of tahu. The focus is on the preparationof infant food for the poor.
MODERN PROCESSING AND UTILIZATION OF LEGUMES IN INDONESIA
By increasing the social welfare of rural people, their demand for food will increase.Therefore, small-scale traditional legume industry should be upgraded to modern legumeindustry using Codex Alimentarius Commission, ISO 9000 and ISO 14000 (Figure 4).
The mission of the modern legume industry in Indonesia is to produce legume productsaccording to the international standards. The global market for legume products is becomingmore competitive and a number of factors will influence the future competitiveness ofIndonesia’s legume industry. The factors include quality, customer service, consumeracceptance, sanitation and quality system of industrial equipments, quality control and GoodManufacturing Practices (GMP). The legume processing equipment bought from foodprocessing unit vendors is not always designed and constructed according to legume industrysanitation standards. Fermentation and non-fermentation technology development in themodern legume industry may also influence total legume products development.
- 153 -
Small-scaleTraditional
Legumes Industry
1. Codex Alimentarius Commission2. Quality Assurance3. GMP4. ISO 9000 and ISO 140005. TQM1
6. HACCP2
Small-scaleMedium
Legumes Industry
Figure 4. Transformation of Traditional Legume Industry tothe Modern Legume Industry as a Passport to International Market
Source: Suharto, 1996.Notes: 1 TQM = Total Quality Management; and 2 HACCP = Hazard Analysis and
Critical Control Point.
Framework for Fermentation and Non-fermentation Technology DevelopmentA framework for fermentation and non-fermentation technology development is shown
in Figure 5. The fermentation and non-fermentation technology capabilities are designed andimplemented for the modern legume industry. Fermentation and non-fermentationtechnology development activities are defined. Efforts are made to create new fermentationand non-fermentation technology using new equipments, rather than to improve the existingtraditional legume industry. Traditional fermented legumes are derived with the help ofmicroorganism. Therefore, to achieve good fermentation the environmental factors thatinfluence the fermentation processes need to be considered. Rhizopus sp. has an optimumtemperature of 30-37ºC for its growth. In legume fermentation by controlling oxygen, it ispossible to increase microbial growth. Rhizopus sp. cannot grow without water. Microbesuse moisture from legumes for their growth. Most microorganisms prefer pH values 6.0-8.0for their growth. More nutrients are needed in the substrate when Rhizopus oligosporus andRhizopus oryzae are used as inoculum to prepare tempe. Rhizopus oligosporus producesmore proteolytic enzyme whereas Rhizopus oryzae produces more amylolytic enzyme. Underthis framework, development of each fermentation technology enriches the knowledge basefor production capabilities, fabrication of equipment, economic evaluation, management inengineering, management of technology and environmental management.
General Fermentation and Non-fermentation TechnologyThe clean legumes as received are dipped in hot water at 80ºC for 30 minutes. A mild
heating process at 80ºC is done to facilitate the removal of the seed coat of legumes andfurther processing. Overheating the legumes will destroy the amino acids lysine and cysteine.A hopper containing the legume seeds is delivered to a peeling machine where the legumeseed coat and kernels are transferred to a soaking tank. They are dipped in water containinglactic acid with pH value of 3.5 at room temperature for three hours. The slurry of legumeis then sent to separation tank to separate the legume in the hopper. The de-hulled legumeis cooled to room temperature and then it is inoculated with Rhizopus sp. in the ratio of 3 gminoculum per kg of legume. The de-hulled legume containing inoculum Rhizopus sp. ismoved to a stainless steel tray and heaped to a height of 4-5 cm. The stainless steel traycontaining raw legume is incubated at 32-35ºC for 24-30 hours. The fresh tempe is obtained24 hours after incubation.
- 154 -
Fermentation and non-fermentationtechnology development capabilities
Knowledge andknow-how required
Knowledge about productionproblems and conditions
Fermentation and non-fermentationequipment development Production experience in the factory
Learningbefore doing
Learningbefore doing
New fermentation andnon-fermentation equipment
Capabilities and expertiserequired for legume production
Legume production capabilities
Figure 5. Capabilities and Expertise in Bioprocessing and Equipmentin the Modern Legume Industry
“Learning before doing” is carried out to solve activities in a small scale beforeembarking on large-scale production. Once large-scale legume production starts, additionalimprovements on electrical and steam problems related to fermentation of legume may occur.Therefore, large-scale legume production may bring about changes in bioprocessing,equipment design, and worker’s skill. These problem-solving activities that arise afterlegume production are termed “learning by doing”.
Fabrication of EquipmentThe traditional legume industry has been known and disseminated by the Javanese
people for several hundred of years as a home level industry. The average capacity is 50 kglegume per day using different types of processing. Fermentation and non-fermentationtechnology need to be modernized in Indonesia to improve the image of the industry. Thetraditional legumes industry does not meet the modern quality standards such as ISO 9000,ISO 14000. Biopressing and the use of modern equipment should be disseminated to legumeindustry in Indonesia to ensure first, second and third generation legume products such asfresh legumes, field tempe and legumes flour as well as antioxidants, respectively. Themodernization of the traditional legume industry will allow the small legume industry tosupply the highest quality legume product to the large modern food industry that uses legumeas raw materials for formulating infant food, army food, cholesterol-free food, super snackfood to improve the nutritional status (Suharto, 1996). Harmonization in terms of efficiencyof production, efficiency of water use, treatment and utilization of legume waste for food andanimal feed, the application of ISO 9000, ISO 14000 must be carried out by both traditionallegume and the modern legume industry. Such harmonization arises by the use of appropriate
- 155 -
legume technology derived from the standardized materials, energy, scientific knowledge,and labor intensity. Labor intensity in the modern legume industry is still the most importantelement in eliminating social problems. A supply of legume is transported by a belt conveyorinto a hopper. The hopper containing legume is transported by electric hoist and dipped inhot water at 80ºC for 30 minutes in the stainless steel tanks. Legume handling equipment iscompleted with an electric hoist to carry the hopper. The hopper can act as a storage placefor intermediate products. A correct foundation design for heavy equipment vibratingmachines is an important factor that must be considered and implemented. A peelingmachine for soaked legume will separate the seed coat and de-hulled legume. A dipping tankcontaining water and lactic acid solution is to dip de-hulled legume and seed coat for threehours. Electric hoist can bring this hopper containing seed coat and de-hulled legume to aflotation tank in order to separate the seed coat and de-hulled legume. The de-hulled legumein the hopper is transported through an electric hoist to a retort. A non-agitating batch retortis used to sterilize de-hulled legume at 100ºC for 10 minutes. This retort consists of doublejackets which can accommodate the hopper of the de-hulled legume. The retort is verticalor top loading requiring less floor space than horizontal or side loading retort. The sterilizedde-hulled legume is transported through a conveyor which can act as cooling system to themixers. The properties of the sterilized de-hulled legume and inoculum in size, density,surface, moisture content have a tendency to cluster.
FUTURE DEVELOPMENT OFLEGUME PROCESSING AND UTILIZATION
There is a need to develop infant’s weaning food using legumes because legumes arecheap, high in protein, and legumes can grow well in most areas. The interaction betweenuniversity and legume industry should continue using the approach of vertical and horizontaltechnology transfer.
CONCLUSIONS
The study of legumes was conducted to obtain information on the present status oflegumes in Indonesia, with respect to their cultivation, production, processing and utilization,farm management, traditional and modern legume industry. The results can hopefully beused as a directive for improvement of legume processing and utilization in Indonesia.Legumes can be used for the production of low-cost protein-rich fermented and non-fermented foods for low-income people in rural areas. The locally available raw materialsin Indonesia such as yellow soybean, black soybean, red bean (Vigna angularis), andPhaseolus coccineus L. are used for fermented protein food products utilizing Rhizopus sp.and Neurospora sp. Fermented and non-fermented legume products can be used for thefortification of staple food in Indonesia to increase the protein content. Formulated non-fermented legume can be made by the extrusion procedure. Formulated food using non-fermented food such as corn-soy-winged bean mix has to be evaluated using nutritive andbiological evaluation to obtain the protein efficiency ratio, net protein utilization andbiological value. There is a need to develop food for infants using legumes, which in thefuture can be industrially produced on a large scale.
- 156 -
ACKNOWLEDGEMENT
I would like to thanks to Mr. Teruo Miyake, Director of Agriculture Department, AsianProductivity Organization in Japan and National Productivity Organization in Jakarta whohave assisted me to attend the Seminar on Processing and Utilization of Legumes from 9 to14 October 2000 in Tokyo, Japan.
REFERENCES
ASEAN, 1997, 1998. “ASEAN Project on Soybean and Protein-rich Food”, LKN-LIPI,1997, 1998, Annual Report, Bandung, Indonesia.
Haryoto, 1995. “Tempe dan Kecap Kecipir”, Kanisius, Yogyakarta.
Noori, Hamid, 1990. Managing the Dynamic of New Technology, Prentice Hall.
Suharto, Ignatius, 1996. “Global Transfer of Food Technology in Small-scale TempeIndustry”, in Proc. of the Second International soybean Processing and UtilizationConference, pp. 377-381, Bangkok, Thailand.
- 157 -
6. ISLAMIC REPUBLIC OF IRAN
Mohammad Reza JahansoozStaff Member andSecretary of Pulses ResearchFaculty of AgricultureThe University of TehranKaraj
INTRODUCTION
Grain legumes, after cereals, are the main crops grown in Iran and they play animportant role in agriculture and food production of Iran. Legumes have nitrogen fixingability, and they are relatively a cheap source of protein. Compared to other grains, legumesreceive a better price in the market. They are consumed with rice, meat and vegetables inmaking soups and other kinds of food. They are used to make cookies. Legumes are alsoutilized as canned food.
Due to the importance of grain legumes, the Government of the Islamic Republic ofIran initiated agricultural development plan. Legumes have a special emphasis in the plan.Several institutions such as Tehran University, the research organization of the Ministry ofAgriculture are involved in research on different aspects of grain legumes production.
The area under grain legumes in Iran is around 1,000,000 ha. The most important grainlegumes in Iran are: chickpea (Cicer arietinum L.), lentil (Lens esculenta), different varietiesof bean (Phaseolus vulgaris L.) such as white, red and spotted; cowpea (Vigna unguiculataL.), pigeon pea (Cajanus cajan), green gram (Vigna radiata var. radiata L.), black gram(Vigna mungo), pea (Pisum sativum) and field bean (Vicia faba). In this report, growth inproduction and consumption, problems and issues in processing, utilization of legumes,research and innovations in improving production, and future prospects of legumes arepresented.
ARABLE LAND AND THE PRODUCTION OF GRAIN LEGUMES IN IRAN
Despite the yearly fluctuations, the area planted to grain legumes had an increasingtrend (Figure 1).
In 1979, the area under grain legumes was 207,000 ha, while in 1999 it increased to935,000 ha. Some of the possible reasons for this growth were: higher price of grainlegumes compared to other field crops, increase in demand for grain legumes, and it is amajor source of protein for people.
According to the statistics in 1992, about 1,120,000 ha was planted to grain legumes.However, due to surplus production and lack of export opportunities, the cultivated areadecreased for the three subsequent years. Since 1995, the increase in the price of grainlegumes resulted in resumption of growth of cultivated area.
Chickpea, common bean and lentil were the major crops with 574,560 ha, 114,615 haand 19,563 ha, respectively. About 81.9 percent of the cultivated land is rainfed.
Irrigated AreasIn 1998, 173,602 ha of legumes were irrigated in contrast to 114,876 ha in 1989. In
1992, a maximum of 269,516 ha of legume area were irrigated (Figure 2).
Figure 2. Irrigated Areas under Grain Legumes
Rainfed AreasThe grain legumes are mostly grown under dryland conditions in Iran (Figure 3). Grain
legumes occupy about 15 percent of the total cultivated dryland. From 1989 to 1998, thegrain legumes area in the dryland increased slightly (Figure 3).
- 159 -
000 ha1,200
1,000
800
600
400
200
Year01989 ‘90 ‘91 ‘92 ‘93 ‘94 ‘95 ‘96 ‘97 ‘98
000 mt800
700
600
500
400
300
200
100
Year01979 ‘81 ‘83 ‘85 ‘87 ‘89 ‘91 ‘93 ‘95 ‘97 ‘99
Figure 3. Rainfed Areas Under Grain Legumes
Legume Production in IranThere was an increasing trend in grain legumes production in Iran from 1989 to 1998
(Figure 4). The increase in legume production has been mainly due to the increase in plantedarea.
Figure 4. Grain Legumes Production
Irrigated Grain LegumesThe production of irrigated legumes was around 250,013 mt in 1998. Irrigated legume
production in Iran had a positive growth (Figure 5). The average yield of legumes is around500-600 kg/ha (Figure 6). The average yield of irrigated legumes was 1,029 kg/ha in 1989and it increased to 1,440 kg/ha in 1998 (Figure 7). The average yield of irrigated legumeswas more stable than rainfed legumes (Figure 7). The average yield of different legumesunder rainfed and irrigated condition is given in Table 1.
- 160 -
000 mt350
300
250
200
150
100
50
0 Year1989 ‘90 ‘91 ‘92 ‘93 ‘94 ‘95 ‘96 ‘97 ‘98
Figure 5. Grain Legumes Production Under Irrigationkg/ha700
600
500
400
300
200
100
0 Year1990 ‘91 ‘92 ‘93 ‘94 ‘95 ‘96 ‘97 ‘98 ‘99
Figure 6. Average Yield of Grain Legumeskg/ha
1,600Irrigated
1,400 Rainfed
1,200
1,000
800
600
400
200
0 Year1989 ‘90 ‘91 ‘92 ‘93 ‘94 ‘95 ‘96 ‘97 ‘98
Figure 7. Average Yield of Irrigated and Rainfed Grain Legumes
- 161 -
000 ha500
450400350
300250200
150100
50
0 Year1989 ‘90 ‘91 ‘92 ‘93 ‘94 ‘95 ‘96 ‘97 ‘97
Table 1. Average Yield Range of Rainfed and Irrigated Grain Legumes(Unit: kg/ha)
Rainfed Grain LegumesThe yield of grain legumes is very much affected by rainfall. Therefore, in dry years,
the production of grain legumes dramatically decreased (Figure 8). Due to the large shareof rainfed grain legumes, the rainfall has considerable effect on the total production of grainlegumes in Iran.
Figure 8. Grain Legume Production Under Dryland Conditions
EXPORT AND IMPORT OF GRAIN LEGUMES IN IRAN
The amount of legumes imported by Iran is decided by the domestic production, worldmarket price and government policies. From 1989 to 1998, Iran imported about 74,531 mt.In 1993, 1996 and 1997 there were no imports.
UTILIZATION AND CONSUMPTION OF GRAIN LEGUMES IN IRAN
Grain legumes are the second major source of food after cereals. They are consumedwith rice, meat and vegetables, mainly for making soups. They are also used in preparingcookies.
Chickpea is the most important food legume in Iran. Demand for chickpea hasincreased steadily with population growth and reduction in per capita availability of othersources of protein. A popular chickpea dish is abgosht. In ghymeh khoresht, a traditionaldelicacy eaten with rice, a desi-type chickpea, mainly in the form of split pea is used.
- 162 -
kg/capita/year10
8
6
4
2
0 Year1988 ‘89 ‘90 ‘91 ‘92 ‘93 ‘94 ‘95 ‘96 ‘97
The food industry sector of Iran produces only 4,340 mt of canned peas, 3,250 mt ofgreen bean and 17,197 mt of pinto bean, which is much less than what is directly used bypeople.
Legume consumption fluctuated between 4.6 kg/caita/year in 1988 to 9.1kg/capita/year in 1997 (Figure 9).
Figure 9. Legume Consumption
PROBLEMS AND ISSUES IN PROCESSING ANDUTILIZATION OF GRAIN LEGUMES
Nearly 82 percent of grain legumes in Iran are produced under rainfed conditions. Thedistribution and the total rainfall under semi-arid conditions are very unpredictable.Therefore, farmers take risk in producing grain legumes.
Lack of sufficient number of planting and harvesting machines, lack of varietiesresistant to biotic and abiotic constraints are other problems in grain legume production. Dueto high price of grain legumes (up to seven times greater than cereals) in market, and thecultural and social role of grain legumes in the diet of Iranians the canned grain legumes arenot so popular in Iran.
RESEARCH ACTIVITIES AND INNOVATIONS IN IRAN
The new era in grain legumes research started with a “Grain Legume Project” inTehran University in 1968. Pure line selection commenced from 14,000 native and importedlines of different grain legumes. The general goals of grain legume project in Iran are:
1. Increase the yield by increasing the number of pods per plant;2. Improve the quality traits such as palatability, cooking properties and the amount of
protein;3. Incorporate disease, pest, cold and drought resistance;4. Select for early maturity (especially for dryland conditions);
- 163 -
5. Identify suitable plant type for mechanical harvesting; and6. Select non-shattering.
The breeding methods used to improve the above mentioned characteristics include:introduction of new varieties, bulk and pure line selection, hybridization and selection usingpedigree, bulk, single seed descent and back cross method; mutation; and application of plantbiotechnology and genetic engineering.
The ongoing grain legume project has introduced a number of varieties in the past threedecades.
Today many other institutions such as Ferdowsi University, the research organizationof the Ministry of Agriculture, the Atomic Energy Organization are working on differentaspects of grain legumes production.
FUTURE ROLE OF LEGUMES IN FOOD PRODUCTION
In recent years, Government of the Islamic Republic of Iran has established a fewdevelopmental plans in agriculture sector. The basic goals of these plans are:
A) The qualitative goals:i. Improving the quality of legumes as a food substitute for meat through new varieties.
ii. Improving the shape, color, taste and marketing value of the grain legumes.iii. Introducing new varieties with resistance to biotic and abiotic constraints.
B) Two options are considered to address the quantitative goals:i. Increasing the cultivate area – The area under different grain legumes should increase
from 959,000 ha in 1998 to 1,068,000 ha in 2004. The irrigated and rainfed areasshould increase 19,500 ha and 89,500 ha, respectively. In the second option, thedevoted areas to grain legumes should increase from 959,000 ha to 1,048,000 ha. Theirrigated and rainfed areas should increase 19,500 ha and 69,500 ha, respectively. Inthe second option, the total production of grain legumes should increase by aiminghigher yields per unit area than the first option. For example, chickpea cultivation canbe introduced to fallow land in rainfed zones, which are under fallow-cereal rotations.
ii. The second option is increasing the yield per unit area.
Considering the first option, the yield of irrigated chickpea should reach from 1,234kg/ha to 1,270 kg/ha, and with the second option it should reach 1,543 kg/ha. The yield ofrainfed chickpea should reach from 391 kg/ha to 406 kg/ha, and with the second option itshould be 488 kg/ha.
With the first option, the yield of irrigated lentil should change from 999 kg/ha to 1,037kg/ha, and with the second option, it should reach 1,500 kg/ha. The yield of rainfed lentilshould reach from 425 kg/ha to 448 kg/ha and with the second option, it should reach 485kg/ha.
Considering the first option, the yield of common bean should reach from 1,576 kg/hato 1,663 kg/ha and with the second option, it should reach 1,747 kg/ha.
In the case of other grain legumes with the first option, the yield should reach from1,099 kg/ha to 1,146 kg/ha, and with the second option, it should reach 1,400 kg/ha.
To improve the yield, the following agronomic methods are proposed: appropriateseed rate, application of fertilizer and use of farm machinery. Crop insurance policy will beintroduced. In case of chickpea, a type of sowing, which is called Entezari will be
- 164 -
encouraged. Field surveys are being made to examine the potential for expanding the areasunder Entezari system in different provinces.
The Ministry of Industry has issued several licenses for construction of new foodlegume processing factories. They are expected to produce 1,550 mt of canned pea, 1,770mt of green bean and 10,240 mt of chickpea. The Ministry is also planning to improvepacking and storage of grain legumes. Moreover, the Ministry is considering to establishdifferent biotechnology institutions. International collaboration such as the current APOseminar, gives an opportunity to gather more information on processing and utilization oflegumes, and other activities which will have direct effect in improving the quality andquantity of food and nutrition in Iran.
- 165 -
7. REPUBLIC OF KOREA
Suk-Ha LeeAssistant ProfessorDivision of Plant ScienceSeoul National UniversitySuwon
Legumes are a major source of dietary proteins and calories in the world. In Korea,rice has been the major cereal crop since ancient times. Legumes are an important source ofprotein when animal proteins become scarce.
Legume crops are cultivated in small areas along the bunds of rice field or in mountainslopes. Efforts were made to have self-sufficiency in legumes.
Traditionally soybean, adzuki bean, mung bean, groundnut, peas, cowpea, and others,have been grown and rotated with other crops. The biological nitrogen fixation ability oflegume crops may help maintain or enhance soil fertility.
Agriculture in Korea, at present, faces the following problems: 1) rapidly decreasingrural population that is aging; 2) high dependency on rice technology; 3) low degree of self-sufficiency in food; and 4) increased environmental concerns in rural areas.
This paper describes the current status on socio-economic trends, production, demand,utilization, major research achievements, and future role of legumes in food production andagricultural development in Korea. In addition, food-safety issues arising from geneticallymodified plants are also presented.
SOCIO-ECONOMIC TREND
During the last 40 years due to progressive economic growth, great changes haveoccurred in Korea. The structure of Korean agriculture has also changed dramatically. From1960 to 1970 more than 70 percent of the population in Korea were engaged in agriculture,forestry, fishery, and sericulture. Afterwards most population moved and are nowconcentrated in the secondary and tertiary industry due to the movement in national economy.Using 1980 as the base the farm population decreased by 39 percent and 61 percent,respectively in 1990 and 1999 (Table 1).
Table 1. Major Economic Indicators of Korean AgricultureEconomic Indicators 1980 1990 1999
Farm population (000) 10,827 6,661 4,210Agriculture share of total population (percent) 28.4 15.5 9.0
Cultivated land area (000 ha) 2,196 2,109 1,899Land area per farm (ha) 1.01 1.19 1.37Land utilization ratio (percent) 125 113 111
- 166 -
The proportion of agriculture sector has fallen from 28.4 percent in 1980 to 9.0 percentof the total population in 1999. Such decrease in agricultural population has caused laborshortage in rural areas. The labor shortage resulted in remarkable increase in wage rateswhich in turn significantly decreased land utilization. The land utilization ratio was 136percent in 1973, and has decreased to 125 percent and 111 percent in 1980 and 1999,respectively (Table 1). Agriculture’s share of the GNP declined dramatically between 1980and 1999.
The total land area in Korea is about 9,927 ha. Most of the total land area is forestland. About 20 percent of the total land area is arable. The average farm size per farmhousehold, where paddy and upland crops are grown, was only 1.37 ha in 1999. The increasein the farm size from 1980 to 1999 is likely due to the decrease in the number of farms ratherthan the actual increase in farm area.
The income gap between rural and urban areas has to be solved. To increase incomeof rural people, priority should be given to increase their income from agriculture. The grossand net income from soybean, maize, and groundnut in 1998 were compared with other cashcrops (Table 2). Although the cash crops such as red pepper and sesame require more laborthan food crops, farmers prefer cash crops due to higher income from cash crops. Incomefrom soybean and groundnut production were fairly low when compared to that of redpepper. Due to low income, the acreage of legume crops decreased.
Table 2. Comparison of Average Income of Soybean, Groundnut, Maize, and Rice,with Other Cash Crops in Korea, 1998
In 1965 when the international trade of legumes was limited, Korea was 100 percentself-sufficient in legume production. However, industrial development led to rapid declinein legume area and production (Table 3). Compared to 1980 area under mung bean andadzuki bean decreased more than 60 percent resulting in 55 percent and 60 percent decreasein production, respectively. During the same period soybean area and production decreasedonly 35 percent and 23 percent, respectively (Table 3). These decreases were mainly due tolow income from legumes compared to red pepper. Yield per unit area of legumes hasincreased through the improvement of new legume varieties and improvement of culturaltechniques.
- 167 -
Table 3. Area, Production and Productivity of Legume Crops in KoreaCrop Year Acreage (000 ha) Yield (mt/ha) Production (000 mt)
Among all the legume crops, soybean is the most important crop in Korea. In 1965,Korea was self-sufficient in soybean production. The domestic demand for soybean wasmore than doubled in a decade. The demand for soybean grew significantly to reach a peakof 1.855 million mt in 1997. The domestic production slumped to an all time low of 156,000mt (Table 4). Low cost of imported soybean and high cost of domestic soybean were themajor factors for the above trend. In 1999, Korea produced 166,000 mt of soybean. It is lessthan 10 percent of the domestic requirement. Therefore, more than 90 percent of thedomestic demand was met by import from the United States and China.
Adzuki bean, mung bean, kidney bean as well as cowpea are considered as minorlegumes and are produced in limited area.
During the last 20 years, the total demand (or consumption) increased from about733,000 mt in 1980 to 1,644,000 mt in 1998, while the national production decreased from257,000 mt to 156,000 mt during this period. Recently, Ministry of Agriculture and Forestryin Korea launched a national soybean production program to increase the domesticproduction of soybean for food use in the future.
Total soybean consumption in Korea is projected to be 1.87 million mt in 2004, ofwhich 1.276 million mt will be for animal feed, while 486,000 mt and 92,000 mt will be forindustrial use and human food, respectively.
- 168 -
Table 4. Total Production, Demand, Supply, and the Ratio of Self-sufficiency ofSoybean in Korea
IMPORT AND EXPORT OF SOYBEAN IN KOREA AND IN THE WORLD
Major soybean producing countries in the world are the United States, Brazil,Argentina, and China. These four countries account for nearly 90 percent of the worldsoybean production. The European Union (EU) is the largest importer of soybean in 1997(15.5 million mt) (Table 5). It is interesting to note that Japan, China, and Korea in Asia, arealso major soybean importers. The United States is the largest exporter of soybean. RuralEconomic Research Institute in Korea reported that the current trend in international soybeanimport and export will continue in the next decade.
Table 5. Current Status of Soybean and Future Prospects of World Trade(Unit: Million mt)
Import Export
1997 2000 2003 2007 1997 2000 2003 2007
EU 15.5 15.8 15.5 15.3 U.S.A. 26.7 27.4 28.2 29.9Japan 4.9 5.0 5.1 5.1 Argentina 2.1 1.7 2.0 2.5Mexico 3.1 3.8 4.2 4.8 Brazil 7.0 7.7 7.7 8.1China 3.0 3.9 4.5 5.4 China 0.2 0.2 0.1 0.1Korea 1.6 1.5 1.6 1.7Total 37.6 40.2 41.5 44.3 Total 39.4 40.2 41.5 44.3
Korea is one of the major importers of soybean in Asia. Soybean import increasedover the years (Tables 4 and 5). Due to improved standard of living in the past 20 years, themeat consumption in Korea has increased. Increase in soybean import in Korea was mainlydue to high demand for animal feed as well as for human consumption. As shown in Table6, out of the total imported soybean, 80 percent was used as animal feed while only 20percent is used for food and other uses.
- 169 -
Table 6. Yearly Change of Soybean Import in Korea(Unit: 000 mt)
Soybean seed is rich in protein and oil and is extensively used for human consumption.Recent revelation of health benefits of soybean in the diet has stimulated widespreadconsumption of soybean foods. In Korea soybeans are used in a large variety of ways, suchas soybean curd, soy milk, soybean sprout, fermented food products, and soybean cookedwith rice.
Soybean CurdSoybean curd is a popular product prepared by precipitating the protein using calcium
or magnesium salt to boiled soy milk, followed by pressing out the whey. Genotypicdifferences in the yield and quality of soybean curd have been reported. The major differencein quality was noted in the texture of soybean curd. Curd hardiness was influenced by saltconcentration, phytic acid content, and the ratio of 7S and 11S globulin in soybean seed.Soybean cultivars with a dark hilum are undesirable for soybean curd production. Cultivarswith high protein content are necessary to produce high protein soybean curd and to obtainhigher curd yield.
A major quantitative trait locus (QTL) for seed protein content that accounts forapproximately 50 percent of the protein was found in the variety Danbaekkong. This QTLin Danbaekkong can increase the seed protein by 3 percent. This QTL can be utilized todevelop soybean variety for making curd or soy milk in the future.
In 1997 a total of 131,000 mt of soybean was used in Korea for soybean curdproduction.
Soy MilkSoybean milk is a traditional soybean product and is widely consumed in Korea.
However, it is unacceptable to some people due to its beany flavor and objectionable after-taste.
In manufacturing soybean milk, heat treatment has been used to remove the beanyflavor. The beany flavor is due to the oxidation of linolenic acid by lipoxygenase during soymilk production. Soybean seed lipoxygenase isozymes have been eliminated geneticallythrough breeding using soybean germ plasm provided by Dr. Kitamura.
Daidzein, genistein, and saponin were other compounds identified to be responsiblefor the objectionable bitter taste. There is genotypic difference for the composition andcontent of these chemical compounds. Most commercial cultivars appear to be well-suitedfor soy milk production except for the beany and bitter tastes. A yellow hilum is preferred.Through industrial process, beany flavor has been eliminated. The bland soy beverage hasbecome a well-established commercial product in Asian countries such as Hong Kong, Japan,
- 170 -
Singapore, Taiwan, and Thailand. The bland beverage is also popular in Korea. In 1997, anestimated of 27,000 mt of soybean was used for soy milk producion.
Soybean SproutSoybean sprouts are popular food in the Orient, especially in Korea. Sprouted soybean
is a year-round vegetable.In Korea soybean sprouts are generally prepared by the following procedure:
i) soybean seeds are soaked in water at room temperature for 4-5 hours, washed, and spreadin several layers in a tray with small holes at the bottom for water drainage; ii) the tray is thencovered with a cloth and placed in a dark room; iii) seeds in the tray are watered 3-4 timesa day; iv) after 6-7 days at room temperature, the sprouts reach a length of about 8 cm; andv) they are then washed, de-hulled, and are ready for serving. Sprouting results in the rapiddisappearance of oligosaccharides, raffinose, and stachyose, that normally cause flatulence.
Small-size seeds, <12 gm per 100 seeds are preferred for sprout production. Smallseeds germinate better and yield more sprouts than large seeds. The most important traits ofsoybean sprouts include good hypocotyl length, good germination and water absorption rate,and high sprout yield.
Soybean genotypes differ in sprout yield, hypocotyl length, and percent seedgermination. Although there were significant genotypic variation in traits associated withsoybean sprout, soybean breeders have neglected selecting for germination-related traits toimprove sprout production. Selection for these traits has been limited due to multiple genecontrol, as well as the time-consuming and expensive procedures for measuring these traits.In addition, the quality determination of soybean sprout requires a large amount of seed andit is a destructive procedure.
In 1997, a total of 61,000 mt of soybean seed was used in Korea for soybean sproutproduction.
Soybeans for Cooking with RiceSoybean is soaked in water for several hours prior to heating, then the soybean is
mixed with rice and boiled. Such soybean and rice combination provides a nutritionallybalanced diet (carbohydrate from rice and protein and fat from soybean). Higher seed sugarcontent, large seed size (more than 300 mg/seed), green seed embryo, black seed coat andrapid moisture imbibition ability are preferred traits of soybean for cooking with rice.
Soybean UtilizationSoyfood processing companies in Korea prefer imported soybean due to its low price
compared to domestically produced soybean. However, consumers for home-made soysauceand soy paste, and some soybean processing companies will purchase and use domestically-produced soybean. The demand for domestically-produced soybean is expected to graduallyincrease due to the public controversy over genetically modified agricultural products.
The total amount of soybean used for food use in Korea in 1997 was 486,000 mt. Ofwhich about 33 percent was domestically produced and 67 percent was imported (Table 7).The home-made food utilized 23 percent while the processed food used 77 percent of thesoybean (Table 7).
Rapid mechanization of soy-food manufacturing industry occurred in the last half ofthis century in Korea. The development of soybean food industry was closely associated withthose of many other industries. Depending on the types of soy-food industry, the size of
- 171 -
enterprise was determined. A total of 83 enterprises were involved in producing soy saucewhich accounted for about US$0.32 billion. Six hundred enterprises for soybean curd, fourfor soy milk, and 2,300 for soybean sprout accounted for US$0.60 billion, US$0.11 billion,and US$0.40 billion, respectively (Table 8). It is obvious that a large number of smallenterprises produce soybean sprouts compared to those of soy milk.
Table 7. Food Uses of Soybean in Korea, 1997Soybean Amount (000 mt) Ratio (percent)
Total supply 486 100.0Domestic 160 32.9Imported 326 67.1
Soybean breeding for improving food quality in Korea is restricted to selection forsingle-gene characters such as elimination of seed lipoxygenases or modification of 7S and11S globulins in soybean seeds. Recently, QTL associated with cooking and food processingqualities of soybean have been identified.
Joint research between crop scientists and food scientists have identified importantcharacters of soybean seeds according to the soy-food type. Soybean germ plasm andsegregating population have been screened for these characters.
With the World Trade Organization Agreement as well as diversification of soybeanutilization in Korea, research priority is the development of soybean varieties based on soy-food types. Only nine soybean varieties for soy sauce and two for soybean sprout productionhave been developed in the 1980s. A total of 44 new soybean varieties have been developedsince the early 1990s, of which 18 varieties were to make soy sauce, 13 for soybean sprout,seven for cooking with rice, and six for use as vegetable soybean (Table 9).
- 172 -
Table 9. Soybean Varieties Released in KoreaSoy-food Type 1970s-80s Early 1990 Late 1990 Total
Biotechnology is often cited as a panacea to feed the growing population and to protectthe environment. Indeed, the potential for higher yields and a reduction in the use ofpesticides and herbicides through biotechnology lend credence to the claim. However, dueto food safety, consumer groups have been against GMO (genetically modified organisms)food products in Korea.
More than half of the soybean varieties developed recently by private seed companiesin the United States have a roundup ready gene, indicating that it is beneficial to soybeangrowers. In the United States, total acreage with GM soybean has increased from 1,500,000ha in 1996 to 6,500,000 ha in 1998. Korea imports more than 90 percent of its soybean frommajor soybean-producing countries such as the United States and therefore, most of thesoybean for human consumption in the near future will be GM soybeans.
- 173 -
Consumer groups are pressing for mandatory labeling of bioengineered foods in Korea.Labeling of GMO products has now been accepted by the government. Labeling of GMOproducts is required for soybean, corn, and soybean sprout by March 2001, and for potato byMarch 2002. If more than 3 percent of GMO was used to make foods, mandatory labelingis required.
A number of private companies rather than government research institutes in Koreahave developed and are marketing kits for use by grain-importing companies and others toidentify GMOs. There are two scientific methods in commercial use for detecting geneticallymodified field crops. One method involves testing for specific proteins that have beenincorporated through biotechnology into a crop. The other is based on the detection of DNAsequence inserted into the crop. However, currently, there is no single, rapid or inexpensivetest to verify whether a crop or crop sample is free of genetic modification.
Benefits from biotechnology will accrue slowly but steadily for farmers, food designersand ultimately, consumers, as bioengineering becomes more widespread. Regulations mayhelp consumer acceptance. Public should be better educated and better informed about thepros and cons of biotechnology.
- 174 -
8. MALAYSIA
Norijah Mohd NorAssistant Agriculture OfficerDepartment of AgricultureKompeks Pertanian Bukit TemiangBeseri Perus
INTRODUCTION
Malaysia is a tropical country situated in the middle of South East Asia. It covers anarea of about 330,400 km2 occupying Peninsular Malaysia on one side and the East Malaysia,which comprises the states of Sabah and Sarawak in northwestern coastal area of BorneoIsland. Peninsular Malaysia is separated from East Malaysia by 720 km of South China Sea.Malaysia has tropical rain climate. The mean temperatures during day/night are 32ºC and22ºC, respectively. The average rainfall is about 2,540 mm per year, with a maximum of5,088 mm and a minimum of 1,650 mm. Humidity is always high and ranges between 70percent and 98 percent. The supreme Head of State is Yang Di Pertuan Agong and the Headof Government is the Prime Minister. The population of Malaysia is about 23 million.
Major Crops in MalaysiaOil palm, rubber, cocoa and coconut are the four major estate crops occupying 2.06
million ha, 1.18 million ha, 0.42 million ha and 0.32 million ha, respectively. Rice is thestaple food and it is cultivated in 0.6 million ha. Tobacco, fruits, pepper and pineapple areother crops.
PRESENT SITUATION AND ECONOMIC IMPORTANCE OFLEGUMES IN MALAYSIA
Legumes play a limited role as a contributor to employment, income generation, importsubstitution and export promotion in Malaysia’s agricultural development. The importantlegumes in Malaysia are groundnuts, soybeans, vegetable legumes, broad beans, lentil,chickpea, red bean, kidney bean, cover crops, and forage legumes. The main objective of thisreport is to assess the current situation and future prospects of major legumes production andimport.
Groundnuts
1. Currents SituationIn Malaysia, groundnuts are grown by smallholders in the states of Kelantan,
Terengganu, Kedah, Perak and Johor. The area planted to groundnuts declined from 5,000ha in 1980s to 286 ha in 1998. As a result, the production also declined from 2,795 mt in1994 to 1,287 mt in 1998 (Table 1).
- 175 -
Table 1. Acreage and Production of Groundnut (1994-98)Year Area (ha) Production (mt)
The main reasons for the decline in area planted to groundnut are:a. shortage and high labor cost for planting and harvesting.b. more profitable crops replacing groundnut.c. lack of storage facilities.d. cheap imported groundnuts.2. Import and Export of Groundnuts
The demand for groundnuts is on the rise, especially in the past five years. Thedomestic production cannot meet the demand. Therefore, the demand was met by import.The import and export value of groundnut between 1995 and 1999 steadily increased (Table2).
Table 2. Import and Export of Groundnut (1995-99)(Unit: RM*)
Source: Department of Statistic, Malaysia.Note: * RM = Malaysian Ringgit.
Groundnut products are also imported. In 1999, the total value of groundnut productsimported was about RM12 million (Table 3), compared to the export value, which was onlyabout RM2 million.
Table 3. Malaysia’s Import and Export of Groundnut Products (1995-99)(Unit: RM)
3. ProspectsGroundnut cultivation faces several constraints. First, labor shortage and high labor
cost; second, if the operations are to be mechanized, then the production area has to beincreased to lower the cost; and third, finding a suitable, large and contiguous land area formechanized groundnut cultivation.
With a yield of 2.5 mt/ha. and if the farm-gate price is RM1.00-1.20/kg, groundnutproduction could be profitable provided the cost of production is less than RM1.00/kg (Anon,1988). A new cultivar, MKTI – a cross between Virginia type (early bunch) and Spanish(Mat Jam) has been developed by Malaysian Agricultural Research and DevelopmentInstitute (MARDI) and it has a yield potential of 3.2 mt/ha (Lee, 1991). Its yield potentialand acceptance among farmers remains to be seen.
The potential and prospects for groundnut appear to be in secondary production. Thegrowing snack food industry serves as an excellent market avenue for roasted groundnuts,both shelled or unshelled in various flavors. The other avenue is in the peanut butterproduction.
SoybeansMalaysia does not produce soybeans. Its demand therefore is fully met by its import.
The soybean is imported mainly for making soy milk, bean curd and related foodstuff.The values in Table 4 show that the export and import of soybeans are increasing every
year, with the value of export much lower than the import for each year.
Table 4. Value of Import and Export of Soybean (1995-99)(Unit: RM)
Malaysia also imports a large amount of soybean products. In 1999, the total cost ofsoybean products imported was RM663 million while the export value was only RM390million. Table 5 shows the values of export and import of soybean products for the year1995-99.
1. ProspectsMalaysia will continue to be a net importer of soybean and its products. Even though
there is a potential for import substitution, production of soybeans in Malaysia will be aproblem due to labor shortage and high labor cost. Therefore, soybean production in thepresent system is economically inviable. New cost-effective technology is needed forsoybean production. Soybean can also be produced as a vegetable for human consumption.Malaysia can also opt to be a secondary producer of soybean products. The popular productsprocessed from soybeans are soy sauce, soybean milk, soybean curd, soybean oil and soybeanmeal. The potential and prospects for this business appear very encouraging.
- 177 -
Table 5. Malaysia’s Import and Export of Soybean Products (1995-99)(Unit: RM)
Other LegumesMany kinds of beans and peas belong to this group. Table 6 show the value of import
and export of other beans for the year 1995 –1999.
PetaiThe area planted to petai in Malaysia increased from 1994 to 1999. Petai is most
popular in Malaysia and is usually planted together with other fruit trees.Table 7 shows the area planted to petai (porlia specous) from1994 to 1998.
THE MAJOR USES OF LEGUMES IN MALAYSIA
GroundnutsMost of the raw groundnuts (Arachis hypogaea) produced in Peninsular Malaysia are
marketed in the form of fresh, unshelled nuts. The groundnuts are processed into dried andsalted nuts and boiled – ready to be consumed. Other uses of groundnuts in Malaysia are:
a. groundnut oil – mainly used for domestic consumption. It is used in the production ofmargarine and peanut butter.
b. cookies such as biscuits and cakes.c. used as basis in producing local delicacies such as rojak (Malaysian), pecal, and satay
gravy etc.d. used in small-scale industries (cottage industry) to make the local products such as
tempeyek and snacks.
SoybeanSoybean (Glycine max) is used as a side dish served with rice, as a beverage, as a
vegetable or as a cooking oil. In addition soybean can also be utilized for animal feed. Morespecific uses of soybean in Malaysia are:
a. soy drink – the processing of soybeans into soy drink can be done at home or on alarge scale (industrial). In this process, soybeans are soaked overnight whereby thebean size will be increased. The bean is then blended and water is added. Afterfiltering with the muslin cloth, the soy drink is boiled with sugar.
- 178 -
Table 6. Malaysia’s Imports and Exports of Other Legumes (1995-99)(Unit: RM)
Table 7. Area Planted to Petai (1994-98)(Unit: ha)
1994 1995 1996 1997 1998
Area 880 1,139 1,457 1,662 1,860
- 179 -
b. side dish with rice – examples include tempe (fermented soybean cake), tauhu(soybean curd), taucu (soybean paste) and kicap (soy sauce).
c. bean sprouts – popular as a local vegetable and can be produced in shortest duration(in about four days). Production is year-round and is promoted as a cottage industry.It has both domestic and export market.
d. vegetable-meat substitute – soybeans are a good source of high quality protein andtherefore used as a meat substitute for vegetarians. It comes in various flavors and soldin supermarket.
e. baby formula and cookies.f. vegetable soybeans are also produced and used in hotels for Japanese tourists.
Domestic market is also expanding.
Mung BeansMung bean (Vigna radiata) or green gram is locally called kacang hijau. It serves as
a valuable protein source for the people with rice-based diet. Traditionally, mung bean iscooked either whole or sprouted. Dry beans are usually prepared as soup, or cooked withsugar as a snack or dessert. Mung beans are also sprouted and cooked as a vegetable incombination with meat, shrimp and fish.
Vegetable LegumesExamples are sweet peas, long beans, french beans, four-angled bean and turi
(Sesbania grandiflora). They are consumed as a vegetable along with rice.
Legumes as Cover CropsCover crops such as Colopogonium cearulum, Colopogonium muconoides, Centrosema
pubescens and Pueraria javanica are mainly grown in oil palm and rubber estates. Covercrops are important because they can prevent soil erosion, fix nitrogen and add organic matterto the soil. It is estimated that an average of 2,671 mt of cover crops valued at RM15.2million is imported per annum into Malaysia.
Legumes as Animal FeedLegumes are rich in protein and therefore serve as excellent animal feed. Common
legumes grown in Malaysia are:
a. petai belalang (Leucaena leucocephala) – important as green forage for animals year-round with high protein content (22.9 percent). It can be dried to produce 15-20 mt/haper year.
b. Arachis pinto – grown as a cover crop and also as a source of protein for animals.Gross protein content is 15.6-18.7 percent.
c. peuro (Pueraria phaseoloides) – grown as a cover crop and also as an animal feed. Itsdried product per ha per year is estimated at 5-10 mt with gross protein content of 17.3percent.
Legumes in ForestryThe tallest tree in Malaysia is a legume; tualang (Koompassia excelsa), and it is the
highly priced Malaysian timber. Others are merbau (Intsia palembanica) and the ediblelegume forest fruit, petai (Porlia specous). Petai is an important legume in Malay culture.
- 180 -
It is often consumed raw, boiled, or cooked with other ingredients to be served with rice.Besides its multinational value, it is proven to have medicinal value such as prevention ofhigh blood pressure and diabetes.
Other LegumesSweet pea (Pisum sativum) is also used for making bean sprouts. Bean sprouts are
popular vegetable in Malaysia.
PROBLEMS/ISSUES THAT AFFECT THE PROCESSING ANDUTILIZATION OF LEGUMES IN MALAYSIA
Processing Problem1. Availability of suitable machinery for specific process.2. Technology know-how on processing itself.3. Handling of machinery.4. Proper storage to extend the shelf life of the beans.5. Packaging.6. Insufficient amount of raw materials for continuous processing – due to import.7. Increase in price of raw materials.8. Labor shortage.9. Low quality of raw material.
Utilization1. Lack of awareness, understanding and knowledge of nutritional value of legumes for
example, very few realize that soybean is an excellent source of protein.2. Ethnic preference – eating habits of different races. For example, taucu from soybean
is only popular among Chinese in Malaysia.3. Believes and taboos – for example, eating groundnuts can cause stomach upset.4. Reluctance to try a new kind of food or to change eating habits.5. Supply of product/raw material is only concentrated in urban areas. Not always
available in rural areas due to lack of distributor; low demand for legume products inrural areas; for example, soybean oil.
6. High price of the products.
PROCESSING OF FOOD LEGUMES
Processing of different legume products are shown in Figures 1-5.
- 181 -
Soybean
Selection
Remove the coat
Wash and soak in water, 12-16 hoursat normal temperature
Boil for one hour
Toss, cool and dry
Stir
Weigh and insert into plastic bagswith holes, then sealed
Ferment 38-48 hours at room temperature
Tempe
Selection
Figure 1. Production of Tempe (fermented soybean cake)
- 182 -
Bean
Clean and wash
Soak in water for six hours
Toss
Prepare germination box
Spread the soaked bean inside
Water it (three hours/day for three days)Scoop off the top layer and wash
Harvest
Bean sprouts
Figure 2. Processing of Bean Sprouts
- 183 -
Groundnuts from farm
Wash and toss
Sort out good beans
Water Put into a big work Salt (6 percent)
Boil (15 minutes)
Toss
Measure into tray
Put into drying barn
Heat until 45ºC for 24 hours untilthe humidity level reaches 8 percent
Increase until 60ºC and dry up further for threehours
Put into “Winnower Grader” machineto clean and standardize beans
Commercial groundnuts
Packing
Figure 3. Processing of Menglembu Groundnuts
- 184 -
Soybean
Wash and soak in water for 4-5 hours
Toss
Blend with some water
Measure up water until a required level(1:6)
Filter Residues
Soybean milk
Boil
Add siako powder at the rate 2.5 percentof the beans original weight
Stir the mixture well
Soybean milk curdle
Pour into squared-mold tray
Close and press
Take out from the mold
Cut into individual tauhu and soak
Tauhu
Figure 4. Processing of Tauhu (soybean cake)
- 185 -
Bean (without coat)
Roast for one hour
Cool down
Remove the thin layer using“testa remover”
Chop coarsely using “disc mill”
Salt and glycerylmonostearate
Blend thoroughly using “colloid mill”
Shift to the container
Oil – “palm stearin”Stir
Peanut butter
Fill in bottle and close
Keep at temperature 10ºC for one hour
Label
Keep at room temperature
Figure 5. Processing of Peanut Butter
PRESENT MAJOR INNOVATIONS INTRADITIONAL AND MODERN PROCESSING AND UTILIZATION
From manual, mechanical processing of soybean drink and ‘taufu-fa’ has beenintroduced to hasten and enhance production. Grinding and filtration are done by the samemachines.
For tempe, the traditional way to break the bean before fermentation process is byusing ‘Wooden Ponder’. The same ‘Wooden Ponder’ has been used for grinding mung beanto make mung bean flour. Mung bean flour is normally used for making traditional cakes.Now, most tempe producers are using stone grinder/miller to break the soybean or to grind
- 186 -
the mung bean. Stone grinder is one of the most popular equipment used by the smallproducer. Stone grinder has been used for other beans, like lentils (dhall), black bean, redbean and groundnuts – either to make fine flour or to crush the bean.
For heat treatment (heating process), the small producers still using gas burner to boilthe soybean extract. For medium-scale producers, normally they use steam injector to boilthe extract, which is much faster.
For taufu or taufu-fa, curdling process, siako is replaced by GDL (Gluco DeltaLactone) by most producers.
FUTURE ROLES OF LEGUMES IN FOOD PRODUCTION ANDAGRICULTURAL DEVELOPMENT
In the future, legumes play an important role in food production due to its contributionto protein nutrition. Legumes can be a substitute for animal protein. Area planted tovegetable legumes such as French beans, long beans, groundnuts and soybeans may expand.To reduce the import bill, some of the legumes will be grown extensively. Soybeans can beprocessed as animal feed. Legumes will continue to serve as cover crops in rubber and oilpalm estates.
Genetically modified organism (GMO) plants have not been introduced to Malaysiadue to opposition and concern from consumers.
REFERENCES
Anon, 1988.
Lee, 1991.
- 187 -
9. MONGOLIA
Enkhtaivan GombosurenHeadDepartment of Food Processing and ServicesInstitute of Food TechnologyMongolian Technical UniversityUlaanbaatar
INTRODUCTION
Mongolia lies in the northern part of the Central Asia plateau, and completelylandlocked between the Russian Federation and China.
The climate is defined as continental semi-arid with exceptionally sharp variation intemperature not only during the seasons but also in the course of a day. Unfavorable climaticconditions severely affect the food system.
About 80 percent of the land is suitable for agriculture, especially for animalhusbandry, while 10 percent is forest, mostly on steep slope and only very little arable land.It is constrained by a short 90-day growing season, with sharp temperature fluctuations, thatcan cause severe losses.
Mongolia is one of the most sparsely populated countries in the world. The 1999population was 2.4 million with an average growth rate of 2.5 percent (1985-91) down to 1.4percent in 1997.
Mongolia has more than 32 million heads of animals. About 76 percent of theagricultural outputs, and 48 percent of the GDP are produced by animal-husbandry sector,and 41 percent of the country’s manpower is in the agricultural area.
The national staple food is relatively simple with meat and meat products as well asmilk and dairy products. But, according to a survey by the National Research Center, theMongolian diet is dominated by meat and flour products. Between 1993-96, 56 percent ofthe total average daily energy intake was from flour products, 15.4 percent from meat andmeat products, 15.2 percent from butter, 7.7 percent from milk and milk products, 1.7 percentfrom rice, 1.5 percent from potatoes, and 1.3 percent from sugar.
GROWTH IN PRODUCTION AND CONSUMPTIONOF LEGUMES IN MONGOLIA
According to Chinese written records, legumes, especially soybeans were cultivatedas early as 2800 B.C. These documents give detailed information on cultivation, strains,harvesting, preservation, and use of soybeans together with other major crops such as wheat,barley, and millet. The place of origin is usually given as East Asia. But it seems likely thatprimitive Chinese discovered that the beans of wild soy plants were edible and graduallyimproved them into a cultivated crop through strain selection.
The Mongolians have had a long tradition of herding the cattle, hunting the wildanimals and cultivating crops in the steppes since ancient times. There are many historical
- 188 -
evidences that prove our ancestors, the Khunnu, would cultivate crops. For instance, fromfoundries from the Khunnu graves, burials and ruins agricultural tools, were revealed byanthropologists.
In chapter 152 of “Mongolian Secret History” it was noted that “… The Mongoliansliving near the Selenge river banks were breeding agriculture …” They would cultivatemainly grains, buckwheat, barley, black beans, green beans and harvest effectively, and cookvarious delicious meals based on the careful studies of each one.
Legumes are cultivated differently from place to place and used as food for cattle.Soybean, green beans, and black beans were very popular and oil was also extracted fromthem. Besides, they were used as fillers in cookies, flour and concentrate. The Mongoliansused soybeans and green beans for nutrition and medication. The significance of them wasmentioned in the ancient books and sutras. In “Genuine History of Meals and Drinks”,soybeans were noted as delicious and treatment tools for cancers and other diseases. Greenbeans were considered to be delicious cold meals and as vessel and vein penetrators.Soybeans were considered to make bones bigger and were fed to young cattle. To use themas fodder they would grind them and make flour or mix them with wheat and other crops.
During the socialist period with centrally planned economy legumes were not used forfood, instead they were used for cattle as fodder. Fodder protein deficiency can be solvedproperly by cultivating the legume crops. In 1970-80 agriculture and veterinary scientistsconducted a number of scientific researches on agro-technics of legumes and cultivation ofsoybeans. Many resolutions and decisions were proved to intensify the bean cultivation, andincrease the area for soybean.
The convenient territory for cultivating soybean seeds is the Khalkh River land. In thisarea from 1970 soybeans were cultivated in 63-930 ha, the yield was 300-450 kg/ha.According to the experiments, a soybean variety, Salut-216 originated from Amur region ofRussia was the best and it gave 1,980 kg/ha.
The reasons for the low yield of soybeans are:
1. Less precipitation, deficiency of moisture (humidity), and lack of proper irrigationsystem.
2. Extremely continental climate (semi-arid), soybean sprouts require more heat and theycannot stand the spring and fall cold.
3. Lack of weed control methods.4. Improper harvesting results in 30 percent or 150-200 kg/ha loss of seeds.
In 1983, the Ministry of Agriculture planned to cultivate soybeans in more than 10prefectures as Govi-Altai, Khovd, Selenge, Dornogovi and provided guidelines forcultivation and harvest. For this purpose about 40 mt of seeds were imported from abroad.Generally, soybeans are used in many different forms as forage crops. On the other hand, insoybean Rhizobium fixes the atmospheric nitrogen and it improves the soil structure andfertility.
In 1973, the resolution was approved by the Cabinet of Ministers, Mongolia (MPR),and it was on “Possession of the Khom Strait of Zavkhan Prefecture”. During that time, aproject of 32 million Tugriks (Mongolian money) (US$3 million) was appropriated to addressthe problems of cultivating soybeans and using them as food and fodder. As a result, duringthe project implementation, the malnourished children gained 2 kg weight after theyconsumed soy milk for a month.
- 189 -
Since the country shifted from the planned economy to a free market system it hasfaced a lot of difficulties, and there has not been any progress in soybean cultivation,production and consumption since then.
Mongolian Government gives significant importance in increasing the production ofplant products. In the program of Mongolian Government it is stated “… give the greatopportunities to the research study on composition, physical, chemical and technologicalcharacteristics of different types of crops, development of new technology on the researchbasis and production of eco-friendly, foods to satisfy customer’s demands …”
Acclimatization of rye has become very important for Mongolia. New productiontechnology is urgently needed so that assorted new bakeries can be developed using small-size flour mills. For this purpose, the effective and rationale use of grains like rye, barley,buckwheat etc. (except wheat) must be reconsidered.
In our situation, conducting research to develop products and introducing the results(outputs) into practice is essential.
The technology and the methods to enrich meat and dairy products using soybeanproteins have become very popular in highly developed countries.
Protein in soybeans is 30-40 percent; in meat, 18-22 percent; and in fish, 17-20 percent.It is obvious that soybeans have more protein than meat.
Outcomes of the StudyC More than 10 products (recipes) and technologies will be created and introduced into
practice using the new food crop.C Rye-processing and flour-producing technologies will be developed on the basis of
research on physical, chemical, and technological characteristics and composition ofrye flour and rye acclimatized in the Mongolian soil.
C The recipes and technology for bread production will be improved.C Technical instructions and standards for various products will be developed.C At Darkhan Agricultural Institute, research to develop new product using wheat, millet
and processed rice will be established.C Technologies and recipes for making and preserving flour from soybeans, green beans
and peas will be developed.C Technologies and recipes of soybean protein concentrates and oil will be developed
with the help of small factories.C New advanced technology to enrich meat and dairy products using vegetable oil (plant
oil) will be developed. The technology to produce soy milk and dairy products willbe developed.
In the above mentioned directives, a project on small food processing factory will bedeveloped. Trainings and conferences will be conducted according to the Law onTechnology Transfer in Mongolia.
The outcomes of the above mentioned measures will enable us to process new foodcrops and to compete in the market, produce competitive products and thereby, the peoplewill be provided with opportunities to consume domestic quality and reliable food.
- 190 -
NEW ADVANTAGES AND ADVANCES OF THE PROJECT
C In recent years, private sector and the agriculture sector have cultivated a lot of variousbeans, ryes, wheats, soybeans and peas but the problems of using them scientificallyas food have not been solved.
C To remedy the situation using scientists from domestic and international sourcestechnology based factories will be established to produce quality food products.
C Nutritious food product technology will be developed and introduced using smallfactories.
C Ways of heat processing, drying, pressing and purifying soybeans and peas will bedeveloped. Research will be focus on the preservation and protection of the rawmaterials and the ready made products. Physical, chemical and microbiologicalproperties will also be studied.
C New recipes and technology will be developed. Based on their specific characteristicsand chemical composition, new crops such as rye, and oat will be used for foodproduction. New outcome of the project will be licensed according to the Patent Law.
Economic, Scientific and Social Significance of the ProjectC On the basis of the strategic concepts of the scientific organizations plant originated
raw materials will be studied within the government program of Mongolia.C The traditional technology will be combined with scientific and eco-friendly
technologies.C Competitive and eco-friendly products will be produced.C Advanced technologies will be introduced into practice.C Legumes will be preserved properly within the “Green Revolution Program”.
PROCESSING AND UTILIZATION OF LEGUMES
Food and Agriculture Organization (FAO) of the United Nations and UNICEF havefrequently emphasized that production and food use of soybeans in the world should bepromoted not only in oriental countries, but also in other countries all over the world sinceit is one of the most important protein source.
When sufficient soybeans are produced to play an important role in the diets ofMongolians, making them palatable and attractive presents some problems. From varioustrials in the past several decades, several avenues were explored. One is to increase proteincontent and nutritional value by adding soybeans as traditional local diets. Another methodis to employ soybeans or products made from them as traditional foods. The next method isto eat foods made directly from soybeans as a substitute, attempts to simulate other foods.
Soy Milk TechnologyIn 1980-1982, as a result of scientific research conducted at the Veterinary Institute
“Soymilk Technology” was experimented and developed.The technology consists of the following stages: checking soybean seeds; cleaning;
soaking; drying; pressing; dissolving; boiling; and draining.
- 191 -
1. Checking Soybean SeedsTN-51-451-71 is strictly followed. The cleaned seeds should be 95 percent pure, the
moisture is 14 percent. Damaged seeds are not used for 1 kg of seeds, other seeds could be25, weeds no more than 15 pieces.2. Cleaning
The seeds are cleaned by OBP-20, OS-4, 5 type cleaning machine and the dust isremoved and cleaned. Small-size seeds – smaller than 3 × 15 mm, can be drained manually.3. Soaking
After cleaning, seeds are washed 1-2 times. The soybean seeds are put into a bucketand soaked in 25-30ºC water for 16-18 hours. To soak the seeds, 3 liters of water arenecessary for 1 kg of seeds. The level of water must be 3-4 cm higher than the seed surface.4. Drying
After that seeds are sifted and spread over the flat boards and dried for 1-1.5 hours, ithelps to remove seed coat easily.5. Pressing
To press seeds tools such as meat pressing machines can be used.6. Dissolving
To extract thick and fat milk like cow’s milk pressed seeds are dissolved in water 10:1(10 liters of water:1kg of seeds). Depending on the thickness, the amount of water can vary.7. Boiling
The dissolved liquid is boiled for 10-15 minutes. The milk-like product will be readywhen it is boiled and the odor and strange taste disappear.8. Draining
The boiled liquid is sifted at 70ºC to a bucket and the remains are washed and siftedwith hot water. As the liquid becomes similar to cow’s milk, it is called “soy milk”. One kgof soybeans yields 8-10 liters of milk.
According to the research, soy milk contains 4.1 percent of protein, 3.5 percent of fat,and 3.2 percent of carbohydrates. Soy milk can be broadly used for tea, cheese, yogurt, curdsand dried milk.
Soy Cheese TechnologySoy milk cheese is one of the important products that contains most protein and fat.
Dried cheese has 55 percent of protein and 28 percent of fat.In order to make cheese, milk is extracted from soybean seeds. Making cheese consists
of the following stages: preparing coagulating agent; cooling the milk at a certaintemperature; shifting the curd; pressing; and cutting.
Preparation StageCalcium sulfate is used to coagulate the milk. The amount of calcium sulfate depends
on the amount of milk. For example, for 10-15 liters of milk 4-5 liters of calcium sulfate isused. To prepare calcium sulfate 4-5 liters of fresh water are poured into an enamel saucepanand calcium sulfate is added 3-4 times by a table spoon, then stirred well and let it stand. Inthis way, calcium sulfate is used to coagulate the milk. Whey or a rennin ferment can alsobe used as the coagulating agent.
Milk is boiled, drained and then cooled till 50ºC. While cooling, the film is removed2-3 times. This helps soy milk to coagulate well.
- 192 -
Soybeans
GrindingAnti-foaming
Heating
FiltrationResidue
Soy milkCalcium sulfate
Coagulation
Molding
SoakingWhey
Soybeans
Soaking
Flow Chart of Cheese Production
1. CoagulationFor 10 liters of milk, cooled at a certain temperature, two-third of the calcium sulfate
liquid is slowly poured along the saucepan wall. After 2-3 minutes, it is stirred slightly. Ifmilk is not fully coagulated, the rest of the prepared liquid is added slowly bit by bit. In thisway, soybean milk is coagulated and the coagulated casein is formed, while the liquid isseparated above the curd.2. Draining
The curd is drained (sifted) and the liquid is extracted. The curd is taken away andsome salt is added to improve the taste.3. Pressing and Cutting
The curd wrapped in cotton (40 × 60 × 10 cm) is put in a box without bottom andpressed with the cover that could fit inside the box. Five to 10 kg weight will be placed onthe cover and the cheese is ready in 3-4 hours. Two kg cheese is made from 1 kg soybeanseeds with 55 percent moisture. Cheese yield can be different depending on the soybeanvariety and other factors.4. Preserving in Water
The ready-made cheese is kept in cold water and preserved in a cool place. Heatingand freezing can damage the quality of cheese. Where there is no refrigerator cheese can bepreserved only for three days.
Soybeans
- 193 -
Cheese can also be made using dry method.Cheese is used for food and also added to vegetable soup or as a main course in meals.
Cheese can be prepared in workshops, restaurants, canteens, coffee shops and homes.
Fodder Production Technology from SoybeanSoybean has an important role for increasing production of protein and strengthening
the fodder supply.The seeds of soybeans, as well as other parts of the plant are rich in protein.Soybean is a useful fodder for all domestic animals when it is in the form of green
fodder, grass, grass flour, sediment, milk fodder and so on. Good result was shown duringthe experiment to feed weak animals. Based on the results of the research and experimenta new technology to prepare fodder, which substitutes milk, using soybean has beendeveloped. The following steps should be taken during the processing: checking the seed;cleaning; milling and powdering; mixing and enriching; and packing and transporting.
1. Checking the SeedSoybean seeds can be used to prepare milk fodder. Receipt of seed should be
conducted according to the standard TN-51-451-71. The purity should be at least 95 percentand the moisture should be 14 percent. One kg of seed may contain 10-25 seed of otherplants, 5-15 seeds of waste plants but no weed seed is permitted.2. Cleaning
Winnowing machines such as OVP-20 and OS-4, 5 should be used to clean the seedsfrom chaff. The small size of seeds can be winnowed using the net not exceeding diametersof 3 × 15 mm.3. Milling and Powdering
Winnowed seeds are powdered by machines BDM and KDU-2. During the process,the net with the diameter of 1.5 – 2 mm is installed in the machine and the size of soybeanin the box should be regulated gradually. As bean flour contains huge amount of protein andoil, the powdering process should be repeated one or two times. Also this kind of flour canbe used as fodder for offspring.4. Mixing and Enriching
Fifteen kg of wheat flour, 5 kg of glucose or sugar, 2.5 kg of salt and organicsubstances will be added for each 100 kg of prepared fodder. 20M-1 machine is used toprepare fodder under the condition of farm and agricultural station. A piece of cloth is placedon the ground and the ingredients are mixed with hand. The mixing process should be done.When mixing the fodder with water, 20-25 gm fish oil or marmot oil, 10-25 gm Terramycincan be used.5. Packing and Storing
Prepared fodder should be packed in a paper bag not exceeding 15-20 kg and in sacksnot exceeding 25-30 kg. A label including manufacturer’s name, date, weight and supervisorcode is glued on the bag or sacks.6. Storing and Transporting
Powdered fodder should be stored in a warehouse with temperature not exceeding 10ºCon the shelves at a distance of 10-15 cm from each other. During transportation water,dampness and dust should be avoided.
- 195 -
genera and 26 species. Following 16 legumes taxa are found exclusively in Nepal. Most ofthem are distributed in the subalpine and alpine zones.
1. Astragalus nakaoi Kitam2. Astragalus stipulatus var. phulchokiensis H. Ohashi3. Caragana brevispina sub sp. tenzingii Vass4. Caragana campunulata Vass5. Colutea multiflora Ali6. Crotalaria kanaii H. Ohashi7. Indigofera trifoliata var. nepalensis H. Ohashi8. Millettia nepalensis R. N. Parker9. Oxytropis arenae-ripariae Vass
Introduced Species of LegumesMany species of legumes of economic importance have been introduced in Nepal
which are mostly cultivated in Terai or Mid Hills for firewood, fodder, grain legume,vegetable, fruit, fiber and ornamental purposes. About 16 genera of exotic legumes aremonotypic (with only one species). Following are the important introduced species.
Table 1. Introduced Legume Species of NepalScientific Name Common Name Use*
Vitna mungo (L.) Hepper Black gram F Vitna radiata (L.) R. Wilczek Green gram F Vigna umbellata (Thunb.) Ohwi and Ohashi Rice bean F Vigna unguiculata (L.) Walp. Cowpea F Acacia decurrens Willd. Silver wattle O Acacia fanesiana (L.) Willd. Sweet acacia O Acacia melanoxylon R. Br. Black wood acacia O Erythrina blakei Hort. Coral tree O Erythrina crista-galli L. Cockspur O Erythrina variegata L. Indian coral tree FdPhaseolus coccineus L. Runner bean F Phaseolus lanatus L. Lima bean F Phaseolus vulgaris L. Garden bean F Sesbania bispinosa (Jacq.) W. F. Wight FdSesbania grandiflora (L.) Poir Agasthi sesbania FdSesbania sesban (L.) Merr Fd
... To be continued
- 196 -
Continuation
Scientific Name Common Name Use*
Arachis hypogaea (L.) Peanut F Canavalia ensiformis (L.) Dc. Sword bean F Clitoria ternetea L. Butterfly pea F Cyamopsis tetragonoloba (L.) Tanbert. Cluster bean FdDelonix regia (Hook.) Raf. Peacock flower O Glycine max (L.) Merr Soybean F Lablab purpureus (L.) Sweet Lab-lab bean F Lens culinaris Medikus Lentil F Leucaena leucocephala (Lam.) D. Wit Ipil-ipil FdLupinus pubescens Benth. O Macrotyloma uniflorum (Lam.) Verdc. Horse gram F Pisum sativum L. Garden pea F Pithecollabium bigeminum (L.) C. Maritus Madras thorn O Stylosanthes guinensis (Abul.) Sw. F Tamarindus indica L. Tamarind O Wisteria sinensis (Sims.) D.C. Chinese wisteria M Mimosa pudica Sensitive plant M Senna tora Senna M Trifolium repens L. White clover Fd
Note: * F = food; Fd = fodder; O = ornamental; and M = medicinal.
Uncertain or Doubtful SpeciesThe taxonomic identity of the following legume species in Nepal are uncertain due to
lack of supporting evidence:
Four species each of Astragalus and CrotalariaThree species each of Caragana and IndigoferaTwo species of Cajanus
Economic ImportanceThrough screening 140 legume species in Nepal have been found to have potential
economic importance (Shrestha, 1999). The number of species used for various purposes areas follows: food, 18 species of grain legumes or pulses; fodder, 28 species; vegetables andfruits, 24 species; green manure, 16 species; fiber, nine species; medicine, 63 species;ornamental, 14 species; timber, 20 species; miscellaneous use, 18 species; and oilseed, sixspecies.
Grain LegumesGrain legumes are significant in Nepalese agricultural economy. They are important
as food and also for restoring the soil fertility through N fixation. Grain legume crops canbe grown even in N deficient marginal lands. More than a dozen leguminous crops arecultivated in Terai as well as hilly regions throughout the year. Grain legumes have adjustedwell to mixed/inter, sequential or relay cropping system.
- 197 -
Grain legumes rank fourth in terms of area and production after rice, maize, and wheat.Grain legumes cover 10.5 percent of the total cultivated area of Nepal. They are cultivatedin 308,008 ha with a total production of 228,840 mt and an average productivity of 734 kg/ha(Ministry of Agriculture and Cooperatives, 1999). The major legume crops of Nepal aregiven in Table 2.
Table 2. Important Legume Crops of NepalScientific Name Common Name Vernacular
Lens culinaris Medikus Lentil MasuroCicer arientinum L. Chickpea ChanaLathyrus sativus L. Grass pea KhesariCajanus cajan (L.) Millsp. Pigeon pea RaharVigna mungo (L.) Hepper Black gram MasVigna unguiculata (L.) Walp Cowpea BodiVigna radiata (L.) R. Wilczek Mung bean MungiVitna umbellata (Thumb) Ohwi and Ohashi Rice bean MashyangMacrotyloma uniflorum (Lam.) Verdc. Horse gram GahatGlycine max (L.) Merr. Soybean BhatmasPhaseolus vulgaris L. Garden bean SimiPhaseolus lunatus L. Lima bean Ghyu simiLablab purpureus L. Sweet Bean Tate simiVicia faba L. var. equina Hose bean Sano bakulaVicia faba L. var. faba Broad bean Thulo bakulaVicia angustifolia L. Black pod vetch Kutuli KosaPisum sativum L. Garden pea Thulo KerauPisum sativum L. var. arvense Field pea Sano Kerau
Distribution of lentil, pigeon pea, black gram, soybean, chickpea, mung bean,phaseolus beans and grass pea in Nepal is based on agro-ecological domain (Table 3).
Table 3. Distribution of Legume Crops in Different Agro-ecological ZonesAgro-ecological Zone Crops
Mid Hills Black gram, soybean, horse gram, lentil, rice beanHigh Hills Rice bean, phaseolus bean, field pea
Source: Nepal Agriculture Research Council, 2000.
Lentil, chickpea and grass pea are cultivated as winter crops and the rest as summercrops. Legumes in order of importance and production in Nepal are: lentil, chickpea, grasspea, black gram, pigeon pea and soybean. However, HMG Nepal has imposed a ban on thecultivation and marketing of grass pea since 1991-92 owing to the presence of a neurotoxinODAP [3-(N-Oxayl)-L-2, 3 diaminopropionic acid] that causes neurological disorder called‘lathyrism’ in human beings on its prolonged consumption.
- 198 -
The consumption of grain legumes in Nepal is about 10 kg/caput/annum which is verylow as compared to the standard FAO recommendation of 18 kg protein/caput/annum (50 gmprotein/caput/day).
Area, production and productivity of major grain legume crops in Nepal from 1988/89to 1997/98 are presented in Table 4.
Table 4. Area, Production and Productivity of Different Grain Legumes in NepalOver Years, 1988/89-1997/98
(Unit: Area = ha; production = mt; and productivity = kg/ha) Crops 1988/89 1997/98 Percent Increase
Total area 265,730 310,570 +16.87Production 156,680 211,250 +34.83Yield 590 680 +15.25
Source: Nepal Agriculture Research Council, 2000.Note: * Field pea, cowpea, broad bean, phaseolus bean, rice bean, mung bean, etc.
Distribution of area and production of major grain legumes are shown in Figures 2 and3, respectively.
- 200 -
(d) Straw used as feed for cattle.(e) It is a major export commodity.2. Cowpea(a) Green pods are used as vegetable.(b) Dry seeds are consumed mixed with other vegetables as a curry.(c) Water-soaked seeds fried in cooking oil, spiced with salt and consumed as snacks.3. Chickpea(a) Green seeds are used as vegetable.(b) Dry seeds are eaten raw after soaked in water for sometime. It is also boiled, roasted
or fried, spiced and salted and consumed as a snack.(c) Split seeds are used for the preparation of ‘dal’ or ‘dalmoth’.(d) Flour is called ‘beshan’ and is used for the preparation of snacks called pakauda, bari,
sweets etc.(e) Beshan is added to wheat, maize or other cereal flours as a protein supplement.4. Black Gram(a) It is popular in Nepalese hills and used as ‘dal’ (seeds whole or split, husked or
dehusked).(b) Flour is used to make ‘papad’ (a thin dry papery sheet prepared after adding spices and
salt) which are packed and marketed. They are deep fried in oil.(c) “Masyora’ (flour balls are prepared after mixing with a paste of rhizomes of coco-yam
(Colocasia esculenta) and giant taro (Alocasia indicum) mixed with spices and salt),dried balls are packed and kept for future use or marketed.
(d) Water-soaked seeds are ground and the paste is mixed with spices and salt and pattiesfrom them are fried in oil. The snack is called ‘bara’.
(e) Sprouted seeds are consumed as a vegetable or used in soup.(f) Straw is fed to the cattle.5. Broad Bean(a) Green pods are usually used as vegetable.(b) Roasted seeds are used as snacks.(c) Dried seeds are used both as vegetable and ‘dal’.(d) Broad bean has two varieties in Nepal.
(i) Vicia faba L. var. faba (broad bean): large seeds(ii) Vicia faba L. var. equina (horse bean): small- or medium-sized seeds. This is
grown in Terai as a pulse (dal) crop.(e) Seeds of small variety are fed to the cattle, especially horse.
It is well known that disease ‘favism’ (acute anemic condition) is caused byuncooked or partially cooked broadbeans or from inhaling pollen of this plant.
(f) Dairy cattle and poultry feed and fodder.(g) Rich in edible oil.6. Mung Bean(a) Dry seeds are used as ‘dal’ (split or whole, husked or de-hushed).(b) De-husked and split seeds are used for making ‘dalmoth’.(c) Flour is used for making ‘papad’, and other snacks like pakauoda, porridge, etc.(d) Being nutritious and easily digestible its soup and dal is recommended to sick people.7. Pigeon Pea(a) It is considered as an important tasty dal.(b) Green seeds are used as vegetable.
- 201 -
(c) Split seeds are used for making dalmoth.(d) Dry stem are used for making baskets meant for construction work.(e) Dry stems are used as firewood.8. Soybean
Soybean has recently attained importance as a food and industrial crop based on thebiochemical composition of its seed.(a) Green seeds are used as vegetable.(b) Green pods boiled with little water are very much liked by village people as snacks
(green beans from shelled boiled pod are delicious).(c) Fried seeds make a favorite snack either alone or mixed with pop corn.(d) Water-soaked seeds are fried with vegetable oil, and spices and salt are added to make
a delicious snack.(e) Soybean seeds are partially heated and oil is extracted. This oil is extensively used for
edible and industrial purposes.(f) Soy milk is of particular value for the infants and adults who are allergic to cattle milk.
Soy milk is also used as cattle milk for the preparation of curd, butter milk,cheese and other milk products. ‘Tofu’ preparation has been recently introduced inNepal which in gaining much popularity among the urban populace as a source ofvegetable dish.
(g) Soy flour is prepared from high quality yellow beans. It is used as an additive orextender to cereal flour which are deficient in protein.
It is also used for making biscuits, cakes and other bakery products, beverages,infant food and food for diabetics as a supplement with other cereal flours. Soybeanflour is used for making soy-nuts (small spherical salted balls made from the flour anddried) which are cooked mixed with other vegetables as a curry and consumed withrice or Chapati.
(h) Soy sauce is prepared from fermenting germinated seeds.(i) Soybean meal or cake left after the extraction of oil is used in formulating feed for
poultry and livestock.
Processing of Legumes in NepalNepal has no major legume processing industry so far. Legume-based industries are
categorized as cottage and small-scale industry whose production mostly depends on thetraditional technology. Following are the products of these industries.
(1) Pulse: Splitting and de-husking. Grit separation is done in small mills for marketingand export.
(2) Oil extraction: Soybean is employed for this purpose using traditional technology.(3) Flour: Chickpea, black gram, mung bean and soybean.(4) Dalmoth: Lentil, chickpea, mung bean and garden pea.(5) Soy-nuts and black gram nuts.(6) Soy milk, soy sauce.(7) Feed for poultry and livestock.
DISCUSSION
Winter legumes in Nepal are more important than summer legumes in terms of area andproduction. However, summer pulses are more in Hills and Mountains where they meet the
- 202 -
dietary protein need of the Hill people and contribute to the sustainability of the agriculturalsystem. Lentil, pigeon pea, chickpea, grass pea, cowpea and mung bean are major pulsesproduced and consumed in Terai whereas black gram, soybean, cowpea and horse gram aregrown mostly in the Hills and Hill Valleys.
The area, production and yield/ha of most of the grain legumes have steadily increasedin the recent years. However, the area and production of chickpea and grass pea havedeclined. Chickpea is regarded as a low grade pulse and therefore it has less demand and themarket price is also lower compared to lentil and pigeon pea which are considered as highgrade pulses. Due to the presence of toxin that causes athyrism HMG of Nepal banned thecultivation and marketing of grass pea since 1991-92. As a result, the area and productionof grass pea gradually declined. In spite of the ban, grass pea is still cultivated by many poorfarmers in their marginal lands since it withstands adverse conditions. It is also resistant todisease and it is easy to grow with minimum inputs. These poor farmers do not realize theeffect of the toxin causing lathyrism.
Lentil is cultivated in 53 percent of the total legume area and of the total grain legumeproduction, 54 percent is lentil (Figures 2 and 3). During the fiscal year 1997/98 and 1998/99Nepal exported pulses (mainly lentil) valued at US$1.51 million and 1.29 million,respectively (Ministry of Finance, 2000). In terms of production, pigeon pea, black gram andsoybean rank second, third and fourth, respectively. Although, soybean cultivation showsan increase in yield by 29.6 percent and production by 32.98 percent, yet, there isinsignificant (2.58 percent) increase in acreage (Nepal Agriculture Research Council, 2000).
Data presented in Table 4 shows average yield/ha of the major grain legumes increasedby 5.84 percent to 40.72 percent, respectively. From 1988/89 to 1997/98, it is mainly due toexpanded irrigation facilities and availability of seeds of improved varieties (NepalAgriculture Research Council, 2000).
Although cultivation of grain legumes showed a positive trend, it has not reached itsfull potential due to the following factors.
(1) Hill agriculture in Nepal has become a concern of female population due to themigration of male population to the cities and towns or to industrialized aliencountries for employment.
(2) Grain legume crops are mostly grown on marginal lands.(3) Non-availability of quality seeds in time, place and also in quantity as needed.(4) Lack of adequate field testing of suitable improved varieties for different agro-
ecological zones.(5) Unstable production, erratic market price, and inability of farmers to take risk.(6) Heavy loss during storage due to lack of know-how and facilities.(7) Grain legumes of industrial value such as soybean are given low priority because the
farmers do not get adequate opportunity to sell their product due to fewer number ofprocessing factories and lack of proper transportation.
(8) The most unfortunate factor which hinders the innovation of legume-based industryin Nepal is the socio-cultural taboo which still prevails in the society. People considerthat chickpea is the ‘food of horse’ and soybean is the ‘food of poor people’.Although, educated affluent people of the society are well aware of the dietary valueof these crops, still they hesitate to consume the pulses.
(9) Legume-based industries have a low profile in Nepal because the government hascategorized them as cottage and small-scale industry.
(10) Lack of application of modern technology in legume processing industries.
- 203 -
Considering the above constraints, it is high time for the government and people ofNepal to seriously transfer the modern technology from friendly developed countries topromote cultivation and processing of grain legumes so that people of Nepal can havenutritional security. It will also strengthen the national economy.
Draft document of the Department of Agriculture (Table 5) provides present and futurescenario regarding the demand, area of cultivation, production and productivity of grainlegumes from 1996/97 to 2020. It speculates that by 2020 the demand will increase by 5.24percent per year whereas the production will increase only by 4.2 percent per year, thuscreating a negative balance (Department of Agriculture, 1996). Therefore, to fulfill thisforseen gap, we will have to change the choice of the crop, land use system and themanagement of irrigation facilities. It is therefore suggested that soybean cultivation in Teraiand inner Terai should be enhanced, because these areas have great potential. Soybeanprocessing industries should be established keeping in view the increasing trend andpreference for consumption of soybean oil. Proportion of soybean oil import is high andthere is also a growing demand for oil cakes for feed industry.
Table 5. Projected Area, Production, Productivity, Demand and Supply ofGrain Legume for 1997/98-1999/2000
Source: Department of Agriculture, 1996.Note: * Productivity achieved.
There is no bio-safety issue in Nepal since genetically engineered soybeans have notbeen introduced so far.
Finally, keeping in view the existing status of grain legume utilization and processingin Nepal there is an urgent need for diversification and commercialization. In this context,the present seminar will help disseminate/exchange information on the diverse use of legumeand it is hoped that information and technical know-how thus acquired/disseminated couldinspire and encourage industrialists and farmers in Nepal. Legumes can significantlycontribute towards food and nutritional security.
REFERENCES
Department of Agriculture, 1996. “Area, Production and Productivity Projection”, a draftdocument of the Department of Agriculture, Kathmandu, Nepal.
- 204 -
Ministry of Agriculture and Cooperatives, 1999. Statistical Information in NepaleseAgriculture, Agricultural Statistics Division, HMG/MOAC, Kathmandu, Nepal.
Ministry of Finance, 2000. Economic Survey Fiscal Year 1999/00, HMG/MOF, Kathmandu,Nepal.
Nepal Agriculture Research Council, 2000. Annual Report of National Grain LegumeResearch Project (NGLRP), 1998/99, Kathmandu, Nepal.
Shrestha, K. K., 1999. “Diversity and Phytogeography of Legumes in Nepal”, in T. C.Majpuria and R. K. Majpuria (eds.), Nepal Nature’s Paradise pp. 595-620, M. DeviGwalior.
World Bank, 2000. Entering the Twenty-first Century, World Bank Report, 1999/00.
- 205 -
11. PAKISTAN
Saeeda RazaSenior Scientific Officer andProgramme LeaderFood Technology and Research LabsNational Agriculture Research CentrePakistan Agricultural Research CouncilIslamabad
INTRODUCTION
Food legumes are the economical source of protein, calories, some vitamins andminerals. Legumes are essential components in the diet of 700 million people in the world.Legumes are the richest source of protein among vegetable foods, and they are consumed inrelatively large amount when foods of animal origin are expensive or in short supply, andwhere religion or social circumstances prevent or restrict the consumption of meat.
Food legumes have several direct and indirect beneficial effects on agriculture. Theyimprove soil fertility through N fixation. In cereal-legume system legumes help improve theyield, reduce weed population and break the biotic pest and disease cycles in cereal crops.
Legumes also have medicinal properties. For example, alfalfa sprouts, flowers andleaves act as diuretic, lower cholesterol, balance hormones, alleviate anaemia, colon ordigestive disorders, skin problems and ulcers. Chickpea seeds are astringent, anti-bilious;fried seeds are diuretic and also for diabetic management. Lentils help to counteractconstipation and other intestinal problems. Lentils are also poulticed on ulcers or on slowhealing sores.
Out of 13,000 species in the family Leguminosae, 18 species are extensively cultivatedand consumed in certain parts of the world depending upon agricultural conditions andincome levels. Both raw and cooked food legumes have been consumed traditionally eitheralone or combined with cereals and other food groups. It is well established that the proteinsof food legumes and cereals are nutritionally complementary in respect of S-containing aminoacids and lysine, and a balanced blend or mixture of both grains has a greater nutritionalvalue than either ingredients alone.
The biological utilization of the nutrients is interfered by various anti-nutritionalfactors present in legumes. The poor digestibility of proteins and inhibitory effects forabsorption and utilization of calcium, iron and zinc are due to the presence of proteinaseinhibitors, polyphenols (tannins) and phytic acid in legumes. Legumes are mostly consumedafter processing. Processing detoxifies the toxins and improves the palatability.
In Pakistan cereals, wheat, rice and in some areas maize constitute the bulk of theaverage diet. The food legumes are of strategic importance for economy and for nutrition ofboth human and livestock. Agriculture in the country is confronted with the dual problemof low productivity of important grain legumes, stagnant and or declining productivity ofrice-wheat cropping system (RWCS), the predominant cropping system in Pakistan. Themain reason for this decline in productivity and utilization of legumes is the emphasis laid
- 207 -
and therefore, the demand is met by import from different countries. In 1997-98 theproduction of chickpea and mung bean was satisfactory. However, the production of otherpulses should be improved. The overall change in production from 1998-99 to 1999-2000was -4.4 percent for chickpea (gram), 7.4 percent for lentil (masoor), 3.1 percent for mungand -7.2 percent for mash (Government of Pakistan, 1999-2000). There is decrease inproduction of chickpea and mash while production of lentil and mung increased. Thecultivated area for chickpea increased from 1,076,900 ha to 1,088,800 ha, for lentil itdecreased from 57,800 ha to 56,500 ha, for mung increased from 199,500 ha to 200,300 haand for mash the area decreased from 45,800 ha to 41,500 ha over the past decade.
Table 1. Area, Production and Yield of Pulses in Pakistan During 1986-87 to 1998-99Year Area (000 ha) Production (000 mt) Yield (kg/ha)
Production of chickpea, lentil, black gram, khesari, and mung bean has either remainedstagnant or has declined over the past decade. Area and production of mung has increasedin recent years due to the introduction of short duration uniformly-maturing varieties grownunder canal irrigation. Cultivation of lentil and black gram was mainly concentrated inSialkot, Narrowal and Rawalpindi districts. Due to availability of irrigation water intraditionally rainfed areas of Sialkot, the farmers have shifted from pulses to wheat and ricecultivation since the farmers consider cereals as more stable crops than pulse.
AGRO-CLIMATOLOGY AND LEGUME PRODUCTION
In Pakistan there are four major seasons – winter, spring, summer and autumn. Out ofthe total area of 79.61 million ha, only 20.40 million ha are under cultivation. Approximately80 percent of the cultivated area is irrigated and the rest is rainfed (Government of Pakistan,1997-98). Because of the extensive and complex network of canal irrigation, over a levelground area, serious problems of salinity and sodicity have developed in the same area. Incultivated areas summer average night/day temperatures are 27-45ºC (May to July) andwinter average night/day temperatures are 5-20ºC (December to January). Sometimestemperature exceeds 45ºC and drops down to below 0ºC causing heat and cold stressproblems to crops.
- 208 -
Grain legumes are generally cultivated throughout the country but they are mainlyrelegated to marginal soils of rainfed areas except mung. Legumes are regarded as those thatrequire minimum agricultural inputs and labor. They are largely confined to subsistencefarming. Large-scale cotton farmers seldom grow grain legumes.
Groundnut is mainly grown as a rainfed sole crop during the summer monsoon period.Occasionally it is intercropped with sorghum or maize, and wheat usually follows groundnutin winter.
Groundnut area decreased from 102,000 ha in 1995-96 to 97,000 ha in 1998-99 causinga reduction in production from 112,800 mt in 1995-96 to 104,000 mt in 1998-99. Averageyield also decreased from 1,103 kg/ha to 1,067 kg/ha in 1998-99.
PRODUCTION CONSTRAINTS
Biotic and abiotic stresses affecting the vegetative growth and/or reproductive phaseresult in decreased yield.
Biotic Constraints
1. Chickpea1) Diseases
a) Ascochyta blight (Ascochyta rabie), a foliar disease causes 15-50 percent yieldloss.
b) Fusarium wilt is a serious disease of chickpea causing annual loss of about Rs.12million.
c) Root rot and wilt is a complex of diseases caused by several fungi. Wet root rotof chickpea is perhaps more common in areas where chickpea is grown after rice.
2) Insect pestsa) Pod borer (Helicoverpa armigera) is the most damaging insect and has
considerable economic importance in Pothohar region and in Sindh province.b) Semilooper is another pest of chickpea but is of less economic importance.
3) WeedsChickpea is sensitive to weed competition during seedlings and early vegetative
growth. Weeds cause considerable losses to the crop. The yield reduction due toweeds is 42-75 percent (Weed Program, National Agricultural Research Centre).
2. Lentil1) Diseases
a) Ascochyta blight may cause 30-40 percent reduction in lentil production.b) Rust (Uromyces viciae fabae) of lentil occurs in the foothill districts, where
precipitation is high.c) Vascular wilt (Fusarium oxysporum) is a disease commonly observed in most of
the lentil growing areas where the temperature is high. It causes an average of 5-10 percent yield loss.
2) Insect pestsThe lentil crops suffer little from insect damage. Mild attack of spiny lentil pod
borer has been observed.
- 209 -
3) WeedsWeed infestation is one of the most important constraint of lentil cultivation in
Pakistan. The slow growth habit of lentil allows fast growing weeds to smother thelentil crop and this result in 10-80 percent yield reduction.
3. Mung Bean and Black Gram1) Diseases
Both crops are infected by several diseases caused by fungi, bacteria, viruses andnematodes. Among them, yellow mosaic virus (MYMV), cerospora leaf spot, bacterialblight and charcoal rot are more common and serious in Pakistan which reduce grainyield by 16-20 percent in mung bean and 12-14 percent in black gram (Bashir andMalik, 1998). A severe epidemic of charcoal rot, a serious disease of both crops, maycause 100 percent yield loss.
2) Insect pestsHairy caterpillar is the most important insect pest of mung bean and black gram.
It feeds on leaves and causes 30-40 percent loss in grain yield. White flies effect isthrough transmission of viral disease (MYMV) rather than any direct effect on yieldreduction.
3) WeedsMung bean and mash bean are sown at the beginning or during the rainy season,
hence weeds could heavily infect these crops. On an average 10-20 percent yieldreduction can be attributed to weeds.
4. Khesari (Lathyrus)It is less affected by biotic stresses than other legumes. Foliar and root diseases and
insect pests cause only minor yield losses (Johansen, et al., 1994), but weed problem can beserious when the crop is grown for grain.5. Groundnut1) Vertebrate pests
Main biotic constraint is vertebrate pest, e.g. rats, birds, wild boar and porcupines.2) Diseases
Fungal pathogens cause early and late leaf spot.3) Insects
Thrips, jassids and aphids are important pests.
Abiotic ConstraintsRisk of crop failure due to abiotic stresses is high. Following are the main abiotic
constraints prevailing in Pakistan:
1. Drought StressGenerally grain legumes are grown under rainfed conditions. Occasionally scattered
and erratic rainfall distribution occurs and chickpea and lentil suffer from drought stressduring the vegetative as well as reproductive stage. Khesari (lathyrus) is a relatively drought-resistant legume and produces more reliably than other legumes under drought conditions(Johansen, et al., 1994; and Haqqani and Arshad, 1995).2. Excess Soil Moisture
Mung bean and black gram are usually affected as they are sown at or before the onsetof the monsoon. Chickpea following rice can encounter excess soil moisture. Khesari(lathyrus) is tolerant to water-logged conditions.
- 210 -
3. Frost DamageWhen temperature drops suddenly from 15ºC to below 0ºC as in Thal region the frost
damage occurs. In 1992-93 such situation occurred and the production dropped by 32percent.4. Nutrient Deficiency
In Pakistan chickpea is usually limited by phosphorus (P) deficiency and the cropresponds positively to P fertilizer application. Iron deficiency can be observed in somevarieties and it affects the yield.5. Salinity and Sodicity
All legumes grown in the country except lathyrus are sensitive to saline and sodic soilconditions. The germination of seeds is poor and the plants die prematurely at the seedlingstage. In moderately saline and sodic soils, the grain yield is drastically reduced.
SOCIO-ECONOMIC CONSTRAINTS
In Pakistan food legumes have usually been associated with poor soils, poor people andrainfed agriculture. They are subject to a host of biotic and abiotic stresses and thus becomerisky crops, hence farmers prefer staple cereal crops and cash crops rather than food legumes.The socio-economic constraints are as follows:
RiskFarmers consider legumes a risky crop since both biotic and abiotic stresses affect the
crop.
Low-income StatusLegume farmers are generally poor and have low purchasing power which hinders their
adoption of improved production technology. Due to lack of awareness, the growers do notrealize the significant role of pulses in farming systems.
Credit FacilityPoor farmers are unable to purchase high quality improved seed or other inputs needed
due to lack of credit facilities.
Organization LinkagesThe linkages between education, research, extension and the farmers have remained
tenuous which leads to low production of legumes.
Absence of Support Price and MarketingExcept for chickpea, support price for food legumes are non-existent. Cereals and
some cash crops have support price. Large fluctuations in market price for legumesdiscourage farmers to grow them. Farmers also have to sell the crops immediately at a verylow cost due to lack of proper storage facilities.
MechanizationLack of quality mechanization poses difficulties for planting and pre- and post-harvest
operations.
- 211 -
Lack of Improved Seed Production and Dissemination InfrastructureAlthough improved varieties of chickpea, lentil, mung bean and black gram have been
released by pulse breeders for commercial cultivation in Pakistan, the seed supplycorporations concentrate only on production of cereals seed. Since pulses are considered asminor crops, they are ignored by seed agencies. Both multinational private sectors andnational seed companies are interested only in hybrids.
EFFECTS OF ABIOTIC STRESS ON PULSE PRODUCTION (1987-99)
Until 1986-87 chickpea production increased to reach 583,000 mt and thereafter itdrastically decreased to 372,000 mt (-36 percent) due to severe drought in the main chickpeagrowing areas. Similarly the year 1992-93 was also crucial in the context that chickpea croponce again got a sort of severe fall and its production decreased to 340,000 mt (-42 percent)because of pest damage in Thal region. The year 1997-98 had a prolonged drought thatcurtailed chickpea production from 680,000 mt to 554,000 mt (-20 percent). The entire pulsesector rises and falls with the rise and fall of chickpea production resulting in the need toimport pulses to meet the domestic requirement.
CONSUMPTION AND PER CAPITA AVAILABILITY
Import of pulses in 1996-97 was lower (79,907 mt/Rs.1,133 million) because ofbumper chickpea crop and satisfactory mung bean production. But there is an increase inimport from 1997-99 (162,500 mt/Rs.2,687 million). The per capita availability of pulses(Table 2) indicates that it has increased from 5.00 kg/annum (1990-91) to 7.03 kg/annum(1998-99) and is attributed to increase in production of legumes.
Table 2. Per Capita Availability of Pulses in Pakistan During 1990-91 to 1998-99Year Availability (kg/annum)
Pulses constitute 5 percent of the national diet (Figure 2). FAO Food Balance Sheet(FAO, 1992-94) indicates that the total domestic legume supply was 814 mt, of which 629mt are locally produced, and 208 mt are imported. About 22 mt are exported. It provided604 mt for human food, 131 mt for animal feed, 64 mt for seed and 15 mt for other uses. Outof 2,400 calories required, pulses provide 44 cal/day; out of 58.9 gm of total protein 2.6 gmsupplied by pulses and of the 62 gm of total daily fat consumption pulses contribute 0.3gm/day.
- 213 -
Table 3. Products of Legumes Commonly Consumed in PakistanName of Legumes Product Ingredients
Puffed Salt or coated with sugarCurry Oil, spices, onion, garlicPulau Rice, spices, oilChaat Spices, green chilies, coriander, onion and curd
or tamarindSalted channa Salt (deep fried until crispy)
C) Split Seeds or Dal(desi chickpea)
Dal Salt, red chilies, fried onionKhichri Rice, oil, onion, salt, spicesShami kabab Meat, spicesHalwa Milk, oil, sugarSalted dal Salt and spices
D) Flour or basin Pakora Batter with spices, onion and potatoHalwa Roasted with ghee or oil, sugar, dry fruitDal sawayan Thick batter, noodles, saltBasini roti Mixed with wheat flourDahi pakorey Pakora, curd, salt and spicesDahi boondi Batter oil, boondi, curd, spices
Lentil (masoor) Namkeen dal Oil, saltBoiled dal Spices, waterSoup Rice, water, salt, spicesKhichri Rice, oil, salt, spices
Green Gram(mung bean)
Dal Spices, salt-fried onionKhichri Rice, salt with or without oilMungochian Spices, dipped into prepared curryBaryan Soaked dal, paste, mixed with spices, sun-dried
(they can be stored for a long time in airtightpacking), cooked in curry
Dahi bhalley Soaked dal, black gram (mash bean) and basen(chickpea flour), spicy curd
Sweet boondi Small droplets of slurry deep-fried and soakedinto sugar syrup for a short-time and air-dried
Noodles Soaked dal slurried, filtered through muslinclothes. Sedimented to remove protein oracidified (used as animal feed) starch paste isextracted as thread into hot water rapidly cooled
Sprouts Germinated seedsNamkeen dal Dal, oil, salt
Black Gram (mash, urd) Paaper Flour, saltPea (muttar) Mixed sabzi Other vegetables
Muttar qeema Meat, salt, spicesMuttar gosht Meat, curry, vegetablesMuttar pulau Oiled and spiced riceSalad Peas, other vegetables, salt, spicesSprouts Germinated seeds
2. PuffingPuffing of chickpea improves its flavors, modifies its texture and helps in dry or wet
grinding. For puffing seeds are soaked in water and then roasted on heated sand at 200-500ºC for 1-2 minutes. The roasted chickpea is generally rubbed against a coarse surface tobreak the husk, which is then removed by winnowing. Grains with 12-14 percent huskcontent are good for puffing.3. Grinding
Whole chickpea or dal is ground to flour, known as basen. The eating quality of manychickpea flour-based products depend on flour composition, the degree of fineness ofgrinding, mesh grades and cooking conditions.4. Germination
Germination allows whole beans to be eaten in a palatable form. The sprouts orhypocotyl emerges through the seed coat, which is usually split open during this process. Itfacilitates cooking by loosening the seed coat and it makes available vitamins and iron,improves the digestibility, and nutritive value of legumes protein is also improved. Soakingand germination reduces the anti-nutritional factors.
Utilization of ChickpeaGreen seeds are used as a vegetable. It is mixed with meat, other vegetables to make
curries, with rice to make “pulau” and after shelling the roasted pods and the seeds are usedas a snack.
The most common method is boiling, either in an open pan or pressure cooker toreduce cooking time. Seed size is important since it affects such processing operations ascleaning, de-cortication and sugar coating. Kabulis are preferred to desis. Split seeds or dalis cooked until tender and soft depending upon the desired texture of the finished product.Dal-based products are widely used in home and on commercial scale to make curry, khichri(rice + dal), etc.
In Pakistan chickpea is a major ingredient in snacks, such as pakoras and in sweets.It is also used in ground meatball preparation and for coating fried fish and chicken pieces.Dal sawayan (noodle-shaped) are also salted and deep-fried. Chickpea flour is also blendedwith wheat flour to bake basini roti, a bread commonly consumed by diabetic patients.
Many of the procedures adopted in product development have certain beneficial effectsas reducing anti-nutritional factors, flatulence sugars, softening of husk and increasingpalatability and aroma of the product.
Nutritive Value of ProductsIn practical dietetics, nutritive value and availability of dietary constituents are more
important in cooked food than in raw foods. The ingredients of desi and kabuli chickpeaproducts and their nutrient contents are given in Table 4. About 50-100 percent of dailycalcium requirements of adult males and females can be provided by 100 gm of dry chickpeaon dry weight basis. Roasted chickpea (100 gm) a missi roti can meet 50-100 percent of thedaily requirement of iron of adult male.
Nutritive Value of Chickpea-based MealsThe composition of some chickpea-based meals, commonly used in Pakistan and their
nutrient contents are given in Table 5. A meal containing wheat bread and dal can provide12 percent of total calories from protein, 55 percent from carbohydrate and 18 percent from
- 215 -
Table 4. Chemical Composition (Dry Basis) of Some Pakistan Chickpea Products
fat while for khichri 10 percent of total calories is derived from protein, 48 percent fromcarbohydrate and 32 percent from fat. Halwa provides 6 percent of the total calories fromprotein, 57 percent from carbohydrate and 32 percent from fat. It is evident that the first twomeals compare favorably with characteristic of a well-balanced diet (10-15 percent calciumfrom protein, 55-70 percent from carbohydrate and 20-30 percent from fat). The proteinvalues of wheat bread and chickpea dal meal and of khichri alone are adequate to meet theprotein requirement of children of 4-9 years and adult (Table 6).
Table 6. Protein Quality of Pakistani Chickpea-based Meals(Unit: Percent)
Halwa Suji + Besan 99 75 74 4.3Source: Khan and Eggum, 1978 and 1979.
Utilization of Green Gram (Mung)Green gram ranks second in production (90,500 mt in 1998-99). It is nutritious with
high digestibility and is free from flatulence due to low content of raffinose and stachyose.Green gram is valuable in the preparation of infant weaning foods.
Mung bean is often eaten whole after soaking and boiling. It is milled or split to makedal. Dal is also ground into flour, or paste mixed with spices, chopped onion, green peppers,and deep-fried into balls and then steamed into already prepared curry “mungochian”. Theyare also dipped into spiced curd “dahi bhalley”. Sweet balls are also prepared by mixingjaggery or cane sugar. Thread noodles from mung bean starch are also prepared. Paste(slurry) prepared from soaked seeds are filtered through muslin clothes, protein is separatedfrom starch by sedimentation or prepared by acidification. The protein fraction (gluten) isused as animal feed. The starch paste is extruded as thread into hot water, where it isgelatinized, rapidly cooled by passing into cold water and is air-dried to 13-14 percentmoisture. Mung bean sprouts are eaten as a salad vegetable or steamed, stir-fried or boiledand used as an addition to many oriental dishes. Sprouted mung beans are candied byimmersion in concentrated solution of honey or cane sugar. De-hulled seeds are deep-friedand salted to make snacks. Paste of dal mixed with spices, and made into small balls that aresun-dried to make biryani.
Utilization of Black Gram (Mash, Urd)Black gram may be eaten whole or split, husked or unhusked, as dal or as flour. The
protein in urd flour has particularly desirable baking characteristics, due to the presence ofa gelatinous globulin with glycoprotein fractions. The flour is used to prepare thin crisps orpuffed fried paste products, and to make spiced ball and biscuits used in sweet meat. Verythin pastes mixed with rice paste or alone are spread on clothes or plastic sheets and are sun-dried to make crispy “paaper” which are then deep-fried.
Utilization of Lentil, Red Dal or MasoorLentils are used, mainly in the form of dal, in the preparation of legume pastes and
soups. Flour prepared from ground seeds may be added to cereal flours, in the preparation
- 217 -
of infant food and in baked products. Khichri is often prepared from lentil dal flavored withfried onions and curry leaf.
Utilization of Pea (Muttar)Mostly used as a green vegetable, with other vegetables, with meat and minced meat.
Deep-fried seeds are used as snacks and cooked with rice to make “muttar pulau”. It is alsoused in salad after boiling and frying. Germinated seeds are good source of ascorbic acid(vitamin C) and vitamin B complex.
Utilization of Peanut (Groundnut)Groundnut is roasted and widely used in Pakistan as a snack. It is also used in
confectionery and baked products. Over 300 uses of groundnut have been developed as food,feed and in the manufacture of industrial products. These products have not been popularizedbecause groundnut production in Pakistan is low (104,000 mt in 1998-99), and mostlyutilized as oilseeds.
Utilization of SoybeanSoybean has been introduced to Pakistan in the early 1970s. Soybean is mostly used
as an oilseed. Some products introduced in the 1980s are soy-nut, tofu, milk, curry, soypakora, halwa, chaat, dal, but most people did not like them due to beany flavor, flatulenceand problems of longer cooking time.
NON-FOOD/ALTERNATE USES OF LEGUMES
ChickpeaChickpea starch is used in textile industry and in the manufacture of plywood. Indigo-
like dye is obtained from chickpea leaves. The stems and leaves have high concentration ofmaleic, malonic, citric and oxalic acids that are used in medicine.
Chickpea straw contains almost twice the amount of protein when compared withcereal straws. Seed coats obtained during de-hulling are also utilized as animal feed.
As a folk medicine leaves yield an acid exudate that is used as an aphrodisiac. It is alsoused for the treatment of bronchitis, diarrhea, dysentery, snake bite, and sunstroke.
LentilIt is a valuable green manure and used as a forage crop. Husks, dried leaves, and stems
are used as livestock feeds. Seeds are used as commercial starch for textile and printingindustries.
Medicinally it is used for constipation and other intestinal problems. It is alsopoulticed on ulcers and slow healing sores.
Black GramWhole plant is used as a forage crop and as a green manure. Mature seeds/husks are
used as livestock feed. Seeds contain a substance that is used in the food processing industryas emulsifiers, and as stabilizer for foams.
Green/Golden Gram (Mung Bean)Whole plant is grown as a green manure, hay or cover crop. Husks are soaked and
used as cattle feed. Seed is used as poultry feed. Seeds are used externally and internally for
- 218 -
paralysis, rheumatism, liver complaint, and cough syrups. Roots are considered to benarcotics.
GroundnutHay is valued as a livestock feed. Pelleted groundnut vines are superior to Bermuda
grass in digestible nutrients and possibly as a source of carotene. The shell is mainly usedas a fuel. Other uses are as filler for fertilizers, mulch for growing plant, litter for poultryhouses, abrasion for polishing steel, and aluminum insulation for farm building.
DEVELOPMENTS/INNOVATIONS IN TRADITIONAL ANDMODERN PROCESSING
Many traditional processing, especially for dal production, have been improved formore dal recovery and to have better quality. More than 70 percent of total seed is convertedto dal. Improvements in dal milling depend upon characteristics of locally available grainsand climatic conditions.
The husk adhere to cotyledons by a layer of gum and lignin which is removed by sun-drying, after the seed coat is loosened using small amount of water or oil may be applieddirectly to the grains. Alternatively the grains may be soaked in water for several hours tocondition them. The conditioned grains are coated with slurry of red soil and sun-dried for2-4 days. The soil is removed by sieving before they are de-hulled.
The conditioned seeds were decorted by mortars, or in hand-operated wooden or stone“chukkis”. Now modern abrasion milling machines have been produced and are periodicallymodified to have better quality of dal. De-husking and splitting are done separately by sharpedges. Water or oil is added to condition the de-husked grain and to loosen the bindingbetween the cotyledons, that are split in an impact type splitting machines. This techniqueyields maximum “splits” as unbroken, clean, polished dal with minimum loss of grain asbroken pieces and powder.
VALUE-ADDED PRODUCTS
Many legume products have been commercially developed, that are delicious, nutritiveand economical. The most important among them is the weaning foods. In Pakistanimported or multinational company products are not affordable to majority of the people.Therefore, researchers have developed many types of weaning foods and their nutritivevalues have been determined.
The legumes with high protein in combination with cereals have positive effect onchildren’s health. Germinated seeds are easily palatable, nutritious and easily digestible.Two recent weaning foods prepared by nutrition and Food Technology Research Labs(FTRL). Nepal Agricultural Research Council (NARC)/Pakistan Agricultural ResearchCouncil (PARC), Islamabad is named Pulcelac and Cepulac. Both are mixtures of rice anddifferent pulses. They were tested on children of 6-12 months of age at PIMS for a periodof six months. Weight, height and hemoglobin level were recorded and compared with othercommercially available baby foods like Cerelac, Farlac, etc. The children who had Pulcelacand Cepulac were found to be physically and mentally healthier than those who were fed withcommercial formula. FTRL-developed foods are 10 times cheaper than the commercial ones.
- 219 -
ElderlacAn instant, lentil-rice-vegetable soup prepared by FTRL mainly for old age people is
liked by all age groups as a soup. The name given to this instant soup is “Elderlac” i.e. oldaged, and it is easily prepared, highly digestible food and due to the presence of vegetablefibers it also controls constipation.
Chickpea MilkFTRL has also prepared chickpea milk in powdered form and given to children of age
4-12 months. The children not only gained weight but when fed to infants with persistentdiarrhea, they astonishingly recovered within 7-10 days. The important study was that theywere not lactose-intolerant babies.
FUTURE ROLE OF LEGUMES IN AGRICULTURAL DEVELOPMENT
Wheat and rice are important in Pakistan consequently RWCS dominates the farmingsystem. The continuous RWCS lowers soil nitrogen (N), phosphorus (P), boron (B) and zinc(Zn). Balanced application of fertilizer nutrients to realize the appropriate levels of yield isa considerable drain on farmers resources in view of their prices and limited availability.
To sustain the long-term productivity of RWCS, inclusion of a legume in the systemwill be very valuable. The beneficial effects of including legumes in cereal-based croppingsystem, whether as a succeeding or companion crop depends upon the type of legume, thepurpose for which it is grown and the management practiced.
Winter Legumes-based RWCSChickpea, lentil and khesari (lathyrus) are grown after rice with residual moisture.
Chickpea and khesari fit very well into RWCS in Sindh and Baluchistan as an alternative towheat. Bhatti (1987) reported that a rice-chickpea rotation gave maximum monetary returnfollowed by rice-lentil and rice-khesari. Khesari seeds can be broadcast even in the standingwater after rice harvest. Farmers can grow short duration, non-aromatic rice from June toSeptember and chickpea from end of September to early December. The relay croppedkhesari can also be used as an effective green manure for a seedling wheat crop. Berseembesides being a valuable fodder also improves soil fertility and provides an excellent formof weed control for subsequent rice and wheat crops. Recently practiced system ofintercropping berseem with sugarcane and plowing in the leftover fodder berseem as greenmanure improved the soil fertility.
Summer Legumes-based RWCSMung bean and mash bean as a summer crop can be grown in about two and a half
months from the first week of May to the 2nd week of July. “Sesbania aculenta” is thepotential green manure legume for the RWCS in Pakistan. The response of sesbania as agreen manure can be measured in terms of grain yield and it is more pronounced in rice ratherthan in wheat. However, the use of green manure crops has gone out of practice due to thehigh cost of labor, shortage of irrigation water and difficulty fitting these crops in theprevailing cropping system.
- 220 -
Biological Nitrogen FixationSurveys conducted on N2 fixation of chickpea, lentil, mung bean and black gram
revealed that the proportion of N2 fixed by chickpea was 75 percent (1994-95) and 81 percent(1995-96), 78 percent for lentil and 47 percent for mung bean and black gram (Aslam, et al.,1997; and Shah, et al., 1999). Development of short duration high-yielding and disease-resistant legumes cultivar could prove valuable in improving the production of these cropsas well as improving the soil health and quality. Pulse scientists in Pakistan have releasedfollowing improved varieties during 1980-95: eight chickpea; three lentil; six mung bean;and three mash (black gram). Stable sources of resistance/tolerance in chickpea (Dashat,Parbat and Hamsafar) for ascochyta blight and in mung bean (mung bean NARC-1) againstfungal diseases and MYMV have been found. One variety of lentil Shiraz-96 and twovarieties of chickpea Parbat-2000 and Hamsafar-2000 with high-yield have also beenreleased.
Through adopting new technologies, growing stress-resistant varieties and inter-cropping RWCS with legumes the productivity of legumes will be increased, which in turnis expected to improve the overall economy of the country (Table 7).
REFERENCES
Aslam, M., I. A. Mahmood, S. Ahmed, M. B. Peoples, and D. F. Herridge, 1997. “Surveysof Chickpea N2 Fixation in the Potohar and Thal Areas of the Punjab, Pakistan”, inExtending Nitrogen Fixation Research to Farmers’ Field: Proceedings ofInternational Workshop on Managing Legumes Nitrogen Fixation in the CroppingSystems of Asia, pp. 353-360, 20-24 August 1996, ICRISAT (International CropsResearch Institute for the Semi-Arid Tropics) Asia Centre, India.
Bashir, M. A. and B. A. Malik, 1988. “Diseases of Major Pulse Crops in Pakistan”, TropicalPest Management – A Review, Vol. 34, No. 3, pp. 309-314.
Bhatti, I. M., 1987. “Rice-Wheat Cropping systems Report, Sindh, Pakistan”, in Proceedingof the 8th Asian Rice Farming System Working Group Meeting, pp. 185-195,International Rice Research Institute, Los Baños, Philippines.
Government of Pakistan, 1997-98. Agriculture Statistics of Pakistan, Ministry of Food,Agriculture, Cooperatives and Livestock, Economic Wing, Islamabad.
----------, 1998-99. Agriculture Statistics of Pakistan, Ministry of Food, Agriculture,Cooperatives and Livestock.
Haqqani, A. M. and M. Arshad, 1995. “Crop Status and Gene Diversity of Grass Pea inPakistan”, in R. K. Arora, P. N. Mathur, K. W. Rieley and Y. Adan (eds.) LathyrusGenetic Resources in Asia: Proceeding of Regional Workshop, pp. 59-65, 27-29December 1995, Raipur, India, International Plant Genetic Resources Institute(IPGRI), Office for South Asia, New Delhi, India.
- 221 -
Table 7. Economic Outlook of Pulses Production, Consumption, Import and Export, During 1997-98 to 2009-10(Unit: 000 mt)
Sources: Kitchen Crops of Pakistan – Pulses, 1996-97; and Ministry of Food, Agriculture, Cooperatives and Livestock.
- 222 -
Johansen, C., B. Baldev, J. B. Brouwer, W. Erskine, W. A. Jermyn, L. Lijuan, B. A. Malik,A. A. Miah, and J. N. Silim, 1994. “Biotic and Abiotic Stresses ConstrainingProductivity of Cool Season Food Legumes in Asia, Africa and Oceania”, in F. J.Muehlbauer and W. J. Kaiser (eds.) Expanding the Production and Use of Cool SeasonFood Legumes, pp. 175-193, the Netherlands Kluwor Academic Publisher, Dordrecht.
Khan, M. A. and B. O. Eggum, 1978. “The Nutritive Value of Some Pakistani Diets”, J. ofSci. Food and Agriculture, Vol. 28, pp. 1069-1075.
----------, 1979. “Effect of Home and Industrial Processing on the Protein Quality of MashBeans”, J. of Sci. Food and Agriculture, Vol. 30, pp. 369-376.
Khan, M. A., N. Akhtar, I. Ullah, and S. Jaffery, 1995. “Nutritional Evaluation of Desi andKabuli Chickpea and Their Products Commonly Consumed in Pakistan”, InternationalJournal of Food and Nutrition, Vol. 46, pp. 215-223.
Malik, B. A., 1980. Grain Legumes Production in Asia, country paper presented inSymposium on Grain Legumes Production, 9-15 November 1980, Chiang Mai,Thailand, APO, Tokyo, Japan.
- 223 -
12. PHILIPPINES
Olivia M. Del RosarioUniversity ResearcherInstitute of Food Science and TechnologyUniversity of the Philippines at Los Baños (UPLB)College, Laguna
INTRODUCTION
Among the legumes, mung bean, peanut and soybean play important role in the life ofFilipino people (PCARRD-IDRC, 1992). They contain low-cost, high-quality protein.Legumes can supplement or substitute the daily protein requirement, which we usually obtainfrom expensive animal and marine sources. With the advent of neutraceuticals,phytochemicals and interest of people for low cholesterol diet, the consumption of legumeis expected to increase.
Another advantage of legume is that it can be grown in different parts of the countryand they have short maturity duration. It is an ideal crop for inclusion in cereal-basedfarming systems. Fertilizer application is not required for legumes since they fix atmosphericN through bacterial symbiosis.
However, domestic production of legumes is not enough to meet the growing localdemand. Therefore, the country has to import to narrow the gap between supply and demand.Recently, the government through the Department of Agriculture has prepared a research,development and extension program for legumes with the aim of promoting local productionand minimizing import.
LEGUME PRODUCTION
Area Planted with LegumesThe area planted to mung bean, peanut and soybean is shown in Figure 1. From 1991
the area planted to peanut increased from 39,060 ha to 47,642 ha in 1995. However, in 1996and 1998, the area declined significantly (28,737 ha and 24,700 ha, respectively). For mungbean, the area planted increased marginally from 34,259 ha to 36,420 ha in 1997 but declinedto 34,600 ha in 1998. For soybean, the area planted (2,000 ha) did not change from 1991 to1997.
Supply of LegumesMung bean production showed a downward trend from 1991 to 1993 and then
recovered in 1995 and remained constant at around 27,000 mt until 1998 (Figure 2) (NSO,1999). Import of mung bean showed an increasing trend. The amount of import equaled thetotal produced domestically.
Local production of peanut (Figure 3) showed increasing trend from 1991 (31,398 mt)to 1994 (36,574 mt). However, in 1996 the production began its decline to reach 24,954 mtin 1998. The decline in production is attributed to reduction in the area planted to peanut
from 47,647 ha to 28,737 ha. Import of peanut increased since 1991 (Figure 3). In 1994, theamount of peanut imported surpassed the local production. Soybean has the lowest localproduction (Figure 4) among the three legumes. Soybean production from 1991 to 1998ranged from 1,480 mt to 2, 979 mt. Soybean production was much higher in the late 1970sand 1980s ranging from 6,000 mt to 8,000 mt. Decline in local soybean production is dueto reduction in area planted.
Area (000 ha)50
1990 1991 1992 1993 1994 1995 1996 1997 1998Figure 1. Area Planted to Legumes
Mung bean consumption increased from 1990 to 1997 (Figure 5). As of 1997, the percapita consumption of mung bean is around 720 gm/year or 2 gm/day, which is still low. Percapita consumption of peanut (Figure 5) did not change much from 1992 to 1998, which isaround 1,200 gm/year or 2.5 gm/day. Consumption of soybean was much lower comparedto other legumes. Per capita consumption of soybean increased from 1990 (0.32 gb/day) to1997 (1.14 gm/day).
PRODUCTIONCONSTRAINTS
Import of large quantities of legumes by the Philippine legume industry is due toinadequate local production. Lack of quality seeds for planting and the farmer’s perceptionof low farm gate price are two major factors for decrease in area and production of legumes(National Legume Committee, 2000).
The annual value of imported beans alone is P=3 billion (US$66,670,000). If processedproducts like bean noodles and soybean meal, and soybean oil are included, the value wouldamount to P=14 billion (US$311,000,000) annually.
Supply (000 mt)140
- 226 -
Legume production is concentrated in a few selected areas. As a result, unexpecteddisturbances in these areas can affect the national supply.
Mung bean is grown as a cash crop in rice-based farming system. It is planted duringthe dry season either after the first rice crop towards the end of the year or after the 2nd ricecrop at the early part of the year. In view of this locally produced mung bean is onlyavailable during the first half of the year and traders resort to importation to provide the mungbean requirement for the second half of the year.
Peanut is grown as a cash crop in corn-based farming system. Peanut production areasare characterized by distinct wet and dry season. Peanut is planted after corn during dryseason. In view of this, if the farm gate price of corn is higher, the farmer can easily shifttheir production to corn. In some areas, peanut production declined due to higher price forcorn. El Niño phenomenon affected some of the peanut plantations in 1997-98 resulting inreduced production.
Area planted to soybean is small and therefore low domestic production. Shortage oftechnical experts as well as improved technology also contributed to the problem.
Lack of quality seeds and poor seed storage technology are other problems. Farmersbuy expensive imported unknown varieties in the retail market for planting. Imported mungbean varieties are not adapted to local conditions. In addition, the farmers could not storetheir own seeds due to potential infestation by storage pests and rapid deterioration of seedsin storage. Without proper storage, the seeds lose their viability in less than six months.
Another problem is low profitability. The average rate of return for mung bean was42 percent, based on the 1997 BAS (Bureau of Agricultural Statistics) survey of Ilocos Norte,Pangasinan and Tarlac. The average rate of return for peanut was only 17 percent. Thesituation aggravated by low farm gate price, high labor requirement for harvest and post-harvest operations and high harvest and post-harvest losses.
Farmer’s attitude is also another problem to establish a stable market. In 1989 LandBank contract farming section and Nestle, Philippines had a joint venture for soybeanproduction. With the help of Philippine Council for Agriculture, Forestry and NaturalResources Research Development (PCARRD), Nestle, Philippines contracted the farmers toproduce soybean with a guaranteed price. However, after harvest farmers sold their produceto other traders who offered higher farm gate price.
PROCESSING AND UTILIZATION OF LEGUMES
Mung BeanThe following are the traditional products from mung bean: mung bean noodles
“sotanghon”, mung bean sprout “togue”, filling material for moon cake “hopia” and otherbaked products, boiled mung bean, and toasted mung bean.
1. Mung Bean Noodles “sotanghon”The process involves the production of starch from soaked mung bean (Sin and Del
Rosario, 1974; and Frias and Del Rosario, 1987). Precooked starch is added to the raw starchand formulated to form slurry and extruded to form threads, which are cooked in 95ºC water.The wet noodles are placed in cold storage for sometime to strengthen them and then sun-dried. However, local production of mung bean noodles declined due to the cheaperimported bean noodles.
- 227 -
2. Mung Bean Sprouts “togue”Sprouted mung bean (Estioko, 1986; and PCARRD, 1991) is prepared by soaking the
mung bean overnight in water and then draining. The swollen seeds are placed in jars orbamboo baskets, lined with banana leaves. The seeds are kept in the dark and watered everyfour hours for three days. After three days, the seedlings are harvested and de-hulled byplacing the sprouts in plastic tray and then soaking it in a basin of water to allow the seedcoat to float and it will be removed. Sprout is consumed after boiling or as an ingredient inspring roll or sautéd vegetables. The problem with mung bean sprout is its perishability. Inpublic market it is usually sold in unrefrigerated condition.3. Moon Cake/Buchi Filling
Moon cake or “hopia” and “buchi” are very popular dessert and snack food. Mungbean is first soaked in water overnight, cooked in water, seed coat is removed and cookeduntil pasty and then sugar is added. The sweetened mung bean is placed inside a doughprepared from wheat flour for “hopia” and dough prepared from rice flour or sweet potatoflour for “buchi” and then baked or fried. The problem with moon cake filling is the removalof hulls.4. Boiled Mung Bean
Boiled mung bean is used in many dishes like soup with mung bean noodles, eitherwith other vegetables, or a meat or shrimp garnishing. Boiled mung bean is a popular dishon Fridays, and during Lent, wherein Filipinos, especially Catholics abstain from eating meat.Since boiled mung bean is perishable, housewives used to prepare it by directly boiling thedry seeds, which usually take 45 minutes to one hour to cook.5. Toasted Mung Bean
Mung bean is cleaned and toasted until brown. It is added in boiled glutinous rice withcoconut milk and sugar. The dish is called “sinugaok” or “tutong” which is specially eatenas dessert or as snack. Toasted mung bean is not commercially available.
Innovations on Processing and Utilization of Mung Bean
1. Quick Cooking Mung BeanThe process involves cleaning and sorting of mung bean, then soaking for 12 hours in
2 percent sodium tripolyphosphate solution, draining and air-drying for two hours androasting for 1.5 minutes in 1:10 (mung bean:sand ratio) at initial temperature of 250ºC (DelRosario, 1989). The seed coats are readily removed by hand after roasting. The estimatedcooking time of this quick-cooking legume is four minutes, which is much shorter than theusual 45 minutes to one hour cooking time to prepare boiled mung bean. However, there wasno taker of technology, probably due to the fact that raw mung bean is already expensive inthe local market and also due to the absence of commercial scale roaster (Del Rosario andGloria, 1987).2. Baby Food/Snack Food
A market survey in the Philippines revealed the absence of a low-cost baby food in themarket. Those available are expensive and manufactured from imported raw material. Theprocess involves preparation of mung bean flour, formulation with coconut milk, skim milk,sugar, water and rice flour, mixing, extrusion, and grinding. Biological value, net proteinutilization and digestibility index were comparable to the control diet, skim milk (DelRosario, et al., 1987).
- 228 -
When this extruded product is not ground, and is cut into pellet, it is called snack food.However, extending the technology to the private entrepreneurs is a problem since, nobodywants the invest on imported machines like extruder.3. Mung Bean Sauce
The process involves soaking of mung bean in water, boiling (8-10 minutes) until soft.Draining, cooling, mixing of roasted wheat flour, inoculation and incubation for 3-4 days atroom temperature, stirring daily, mashing and aging, harvesting and pasteurization. Thechemical components of soybean and mung bean sauces were similar with respect to specificgravity, total sugar and total extract obtained. Sensory evaluation of the sauces from mungbean showed higher scores for aroma, flavor and overall acceptance over soybean saucethough the differences were not statistically significant (Divina, 1983). Commercialapplication did not succeed since mung bean is more expensive than soybean.4. Ready-to-eat Sweetened Rice and Toasted Mung Bean (tutong or sinugaok)
This was developed by Ready Food Company. It is an instant soup, a mixture ofsweetened glutinous rice, mung bean and coconut milk. The product is packed in laminatedplastics. The package may or may not be heated before consumption. However it is notlocally available. It is produced by the company for export to countries like Saudi Arabia,the United States, etc. where there are large Filipino populations.
SoybeanTraditional soybean products may be classified into non-fermented and fermented.
1. Non-fermenteda. Soybean curd (tofu)
Two types of soybean curd are produced in the Philippines, the soft (toho) andthe hard curd (tokwa). The process involves the preparation of soy milk by boiling,cooling to 70-75ºC and addition of coagulant like calcium sulfate. After coagulation,the curd is placed in mold lined with cheesecloth and pressed to remove some of thewater. The soft and the hard soy curd are produced by varying the length of pressingtime or varying the weight for pressing used.
Most of the cottage industries producing tofu are situated in Metro Manila suchthat most of the tofu available in the provinces or rural areas are at least a day old.Tofu are transported without refrigeration. In view of this, tofu undergo deteriorationgiving off aroma. Such deterioration is the cause for limited acceptance of tofu bymost of the consumers, especially the younger generation.
One company is producing soft soybean curd in tube and in plastic container.The curd is set in the container which make use of calcium sulfate and deltagluconolactone as coagulant.
b. Soybean milkSoybean milk is an introduction from the Chinese that involves the extraction
of milk from pre-soaked soybean. The extract is boiled, and sugar and vanilla areadded and then packed in plastic. The former Department of Food Science developedthe process for Philsoy in which the hot formulated milk is filled in bottles andsterilized. Currently, instead of packaging the milk in bottles, it is now filled in plasticbags, cooled and kept frozen.
The P.U.C. Health Foods Adventist University of the Philippines came out withcanned soy milk called Soya Supreme. Nestle Philippines, Inc. introduced to the localmarket another powdered milk called Twin, which is mixture of soybean milk andcow’s milk.
- 229 -
c. TahoThis is a special type silken tofu in which the water is not pressed out of the
curd. It is eaten with caramelized sugar and flavorings like vanilla, and lemon. Thesoybean milk is cooked at about 70-80ºC. Calcium sulfate coagulant is added andallowed to set. Taho is served by scooping the curd and adding sugar syrup with sago,vanilla, and lemon. Calcium sulfate may be substituted with agar-agar to form the gel.The use of agar-agar, as gelling agent allows the manufacturer to place the product inice cream cups. It can also be flavored with preserved jackfruit (langka), yam (ube)etc. Nestle Philippine produced taho in cups.
d. TahureAfter the preparation of soybean curd “tokwa”, the cubed material is salted and
soy sauce and Taosi are added. This is used as an ingredient in sautéd fish or meat andvegetable.
e. YubaYuba is the edible film produced from soybean milk. The milk is heated in an
open kettle at about 90-95ºC without boiling and stirring. The film is allowed to formon the surface of the milk. It is harvested when the right thickness is attained and hungto dry. It is used as a wrapper in fish sausage called “kikiam.”
f. Soybean coffeeIt is prepared by roasting cleaned soybean. It is used as a substitute for coffee.
g. MisoThe local miso is not fermented. It is produced by cooking soybean until soft,
ground to a paste, salt and vinegar are added to taste. It is commonly used in differentfish stew (sinigang,) or as a dip sauce (pesa).
2. Traditional – fermented soybean productsThe most popular fermented soybean products are soy sauce, tausi and tahure. These
products are usually used as condiments for cooking.a. Soy sauce
Soaked soybeans are cooked and then coated with roasted wheat flour. Boiledrice, inoculated with Aspergillus oryzae is then added. The mixture is incubated untilit is covered with molds. Then it is placed in brine to continue fermentation for 6months. The filtrate from the fermented mass is the soy sauce. It is then pasteurized,formulated and bottled. Since the commercial method of soysauce preparation involvesa long process, protein hydrolyzate at present is used to make soy sauce.
b. TausiThe process is similar to the preparation of soy sauce except that fermentation
time is about two months only and, the brine solution added is just enough to cover thebean. The whole fermented mass is called Tausi. It is used in sautéed dishes of fish andpork.
c. TahurePreparation of tahure involves cutting of soybean curd (tofu) and inoculation
with Actinomucor elegance. It is placed in brine containing ground red rice (angkak).It is called sufu in Japan.
Innovative Processing and Utilization of Soybean
1. Soybean Ice CreamSoybean ice cream, is prepared from soybean milk. It is promoted by Accelerated
Soybean Processing and Utilization Project (ASPUP). There are three cooperatives
- 230 -
producing soybean ice cream in Northern Luzon. The long process with soy milk preparationhinders the adoption by small cooperatives. Unlike ice cream from cow’s milk, they justdissolve the skim milk and does not need extra equipment such as grinder and filter.2. Textured Plant Proteins from Full-fat Soy Flour
Textured plant proteins from full-fat soy flour was developed at the Institute of FoodScience and Technology, UPLB. Full-fat soy flour was texturized by thermoplasticextrusion, using a locally-fabricated extruder (Del Rosario, 1999).3. Dried Soybean Residue (Okara as Meat Extender)
The residue from soybean milk preparation is now used as extender in meat products(PCARRD, 1996). A small company toasted okara with wheat flour and sold as meatextender like textured vegetable protein.4. Soybean Spread (Peanut Butter-like Spread)
Peanut butter-like soybean paste, which could be used as sandwich spread wasdeveloped at the Institute of Food Science and Technology (Kalaw, 1992).5. Tofu as Meat Extender in Meat Products
Soybean curd is used in fresh and smoked sausage and meat loaves (Reyes, 1999).
PeanutTraditional peanut products can be classified into peanut in shell and shelled peanut
(Chavez, et al., 1995; R. R. Del Rosario, et al., 1995; O. M. Del Rosario, 1998; andDepartment of Agriculture Regional Field Unit No. 2, 1998).
1. Peanut in Shella. Fresh boiled peanut
Usually available during harvest season. Peanut in shell is soaked in water toremove the adhering soil and then cooked in water for 30-45 minutes. Salt, 30-45 gm-salt/liter of water is used. Vendors with pushcart or “pedicab” sell this product in thestreets of Manila.
b. Roasted in shell peanutCleaned and sanitized pebbles or sand are used for roasting. Others use
stationary oven. For commercial operation, a cylindrical thermostatically-controlledrotary roaster is used. Roaster temperature is 150-190ºC and peanuts are roasted for20-45 minutes.
2. Shelled Peanuta. Fried peanut with or without skin commonly called adobo
Peanut is deep-fried in oil with garlic then drained and fine salt is added. b. Dry roasted peanut
Instead of frying in oil, the peanut is baked in oven. When ground, it is used inFilipino cuisine “kare-kare”, a dish of tripe, tail or pork leg mixed with freshvegetables cooked in peanut sauce. It could be used for topping for “Lumpiangsariwa” (sautéd vegetables).
c. Sugar-coated peanutPrepared with refined sugar, condensed milk, water and margarine. Sugar syrup
and condensed milk is thickened and peanut is added and cooked until the crystallinesugar forms a coating around the peanut.
- 231 -
d. Peanut brittleIt is characterized by its brittle texture. Peanut may be whole or ground. Peanut,
corn syrup, sugar and water are cooked until stiff thread is formed and then bakingsoda and margarine is added to enhance the brittleness of the product. Others do notuse baking soda, instead, the product is rolled into a very thin sheet.
e. Peanut butterIt is a form of sandwich spread. The process involves grinding the roasted
peanut, and mixing with sugar, margarine or oil and salt. Due to the expensive priceof peanut, other companies add roasted rice during grinding to lower the cost ofproduction.
f. Peanut cakeA form of snack food, also called as brain food. Made by preparing sugar syrup,
which is moldable and filling it with sugar/peanut mixture, then rolling it with pressureto embed the peanut and sugar before crystallization.
3. Innovative Processing and Utilization of Peanuta. Cracker nut
It is a finger food. Roasted peanut is covered with dough and then baked givingthe product the crunchy texture. It comes in different flavors like barbecue, adobo, hotand spicy, etc.
b. Peanut sauce mix or kare-kare mixIt is produced by McCormick Philippines. It is a dry mixture of ground peanut,
rice flour that is ready to use peanut sauce mix for Filipino food called kare-kare. Iteliminates the hassle of grinding the peanut and rice together.
c. Peanut milk concentrateIt is developed by extracting the milk from peanut and adding sugar. It is then
cooked to concentrate, forming a condensed milk like product. For consumption, twoto three tablespoons of the concentrate is diluted to 200 mR for a ready-to-drink milk(Reyes, 1992).
d. Peanut filmIt is similar to yuba of soybean.
FUTURE ROLE OF LEGUMES IN FOOD PRODUCTION ANDAGRICULTURAL DEVELOPMENT OF THE PHILIPPINES
The growing population and the economic crisis in the country would further move toincrease the demand for legumes. This will provide the people with low-cost nutritious foodfrom legumes. The increasing awareness of people concerning nutrition and health oflegumes especially soybean encourages other institutions to conduct research on legumes.Research focus is on the improvement of traditional processing methods and products toincrease acceptability and nutritional value and development of new processing methods andproducts from legumes for village level and small-scale industry.
The government through the Department of Agriculture and its other agencies willpromote the increase in domestic production of legumes. The current National Research,Development and Extension Agenda for legume aim to expand production by increasing thearea planted with legumes, provide quality seeds for planting, improve the profitability oflegume production and improve the income and nutritional status of legume-growing regions.A network of seed production and distribution system will be developed. Appropriate and
- 232 -
cost-effective seed storage systems will be in place. Rhizobial inoculants will be provided.So far the use of genetically modified seeds to improve legume production has not beenstudied.
The increase in local production of legumes will not only provide low-cost nutritiousfood for the people but also encourage establishment of small-scale industries. This willeliminate the large importation of legumes which cost millions of dollars on the part of thePhilippine Government. Increased legume production will help stabilize the Philippineeconomy.
REFERENCES
Chavez, L. L., D. G. Sonido, and S. Y. de Leon, 1996. Peanut Products: A Manual ofProcedures, UPPCHEF, Inc., Diliman, Quezon City.
Del Rosario, O. M., 1998. Country report on Gender Role in Peanut Sector for HouseholdSecurity, 7-10 April, Bangkok, Thailand.
Del Rosario, R. R., 1989. “Processing and Utilization of Legumes with Particular Referenceto Mungbean in the Philippines”, paper presented in Consultants Meeting in Use ofTropical Grain Legumes, 27-30 March 1989, ICRISAT (International Crops ResearchInstitute for the Semi-Arid Tropics) Center, India.
Del Rosario, R. R., D. M. Flores, O. M. Maldo and N. S. Sabiniano, 1987. “Developmentof Rice-Mungbean Based Baby Food”, Phil. Journal of Food Science and Tech. 2(1&2), 95-109.
Del Rosario, R. R., O. M. Del Rosario, and N. Ohwada, 1995. Leaflets on PeanutProcessing, IFST, UPLB.
----------, 1999. “Texturization of Soybean Using a Locally Fabricated Extruder”, Ph.D.thesis, IFST, CA UPLB.
Department of Agriculture, 1998. Region 02 Technoguide: Peanut Tugegarao, RegionalField Unit No. 2, 1998.
Divina, R. D., 1983. “Influence of Varieties of Mungbean on the Quality of MungbeanSauce”, M.S. thesis, IFST, CA, UPLB.
Estioko, O., 1986. “Production of Mungbean Sprout”, B.S. thesis, IFST, CA, UPLB.
Frias, M. G. and R. R. Del Rosario, 1987. “Mungbean Starch Extraction and Some FactorsAffecting Quality”, B.S. thesis, IFST, UPLB.
Kalaw, R. D., 1992. “Production of Peanut Butter-like Product from Soybean”, B.S. thesis,IFST, CA, UPLB.
National Legume Committee, 2000. The National Research Development and ExtensionAgenda for Legumes.
- 233 -
National Statistics Office (NSO), 1999. Statistics Handbook of the Philippines.
PCARRD, 1991. The Phil. Recommend Mungbean.
----------, 1992. Legume and Nutrition Annual Report, IDRC (International DevelopmentResearch Center).
----------, 1996. Great Flavor of Soybean, Book Series No. 155, Technology Application andPromotion Institute (TAPI)-Department of Science and Technology (DOST).
Reyes, D. 1992. “Processing of Peanut-milk Concentrate”, B.S. thesis IFST, CA, UPLB.
Reyes, V. B., 1999. “Utilization of Soybean and In Fresh, and Smoked Chicken Sausage”,B.S. thesis, IFST, CA, UPLB.
Sin, I. S. and R. R. Del Rosario, 1974. “Studies on Processing of Local Noodles”, M.S.thesis, IFST, UPLB.
- 235 -
Area (000 ha)SoybeanGreen gramCowpeaBlack gramGroundnut
Grain legumes were freely imported prior to 1970. Since 1970, foreign exchangedifficulties and increasing world market prices progressively reduced the imports of grainlegumes. As a result, the local cultivation of grain legumes increased. Consequently, effortson production research have been intensified.
The area cultivated and production of grain legumes over the last decade is given inFigures 2 and 3. The area and production of green gram and cowpea declined sharply whilethe decline in soybean was small. The area and production of groundnut was static.
Figure 2. Area Under Grain Legumes from 1990 to 1999
The area under grain legumes dropped from 80,000 ha to 37,500 ha during the lastdecade. Production also declined from 58,000 mt to 35,000 mt. In contrast import of alllegumes increased tremendously from 32.600 mt to 4,446,000 mt.
The emergence of open economy and free trade policies as well as low productivity oflegumes are two major factors responsible for the decline in domestic production of legumes.Domestically produced grain legumes in Sri Lanka failed to offer a competitive price to theconsumer and a decent return to the farmer.
Import of soybean has been around 15,000 mt during the years 1991-94, decreased in1995, and increased in subsequent years. Dhal (Lens culinaris) and groundnut are the mostpopularly consumed legumes, which are imported over the last decade. The quantitiesimported have increased from 5,000 mt to 4,500,000 mt. Green gram and cowpea are theother important legumes. Soybean is the least preferred. The total supply of differentlegumes and the quantities used for food is shown in Figure 5. The difference betweensupply and consumption as food is that used as seed, and wastages.
- 237 -
Quantity (kg/capita/year)50
Green gramSoybeanTVPCowpea and dhalGroundnut
45403530
25201510
5Legumes0
kg/year gm/day cal/day Protein(gm/day)
Fat(gm/day)
Figure 6. Per Capita Availability of Legumes in 1998
Source: Food Balance Sheet, 1994-98.
VegetablesAnimalsProtein (gm)
60
50
40
30
20
10
Year01992 1993 1994 1995 1996 1997 1998
Figure 7. Per Capita Availability of Protein by Source, 1992-98
Per capita availability of legumes and protein from vegetables and animals are givenin Figures 6 and 7.
USES OF LEGUMES
Legumes serve as an excellent source of high quality protein in Asian diets. Lentils,green gram and groundnuts are popular food items in the Sri Lankan diet. Use of simple,nutritious, low-cost legume foods, providing both calorie and protein for children has longbeen well recognized.
- 238 -
Green gram is used either in the split form or in the grain form. Split lentils andcowpea are used to make a curry spiced with chilies and spices and is consumed with rice.Grain legumes high in protein content, is a natural supplement to cereals. Legumes aredeficient in methionine and cystine but rich in lysine while cereals are deficient in lysine buthave adequate methionine and lysine, complement each other in providing a balanced diet.
Black gram is usually used to prepare various breakfast/dinner and snack preparations,such as thosai, idli, wade, papadam, etc. Black gram flour or slurry is blended with riceflour, wheat flour and other spices for making the above preparations. Value-added blackgram products such as flour, and instant mixes for other preparations are commerciallymanufactured and are available in the market.
Groundnut is a very popular snack. Groundnuts are roasted with or without salt andsometimes mixed with spices such as chilies. Roasted and fried groundnuts are also used inthe preparation of snack mixtures. Green gram and cowpea are also boiled and eaten withgrated coconut for breakfast. Curried sprouted green gram is also popular. Green gram flouris used for making a variety of sweets. In all these preparations green gram and lentils arepreferred to other beans, since they can be cooked easily and the people are traditionally usedto consuming them.
Chickpeas are generally used in the boiled form as a breakfast food. Soybeans are theleast consumed as beans (0.04 kg per year). This is mainly due to the time and energyrequired to prepare soybean and due to its undesirable beany taste and flavor. Texturizedvegetable protein (TVP) from soybean has been accepted by consumers. The supply of TVPhas been steady at 6,190 mt in 1994, to 6,250 mt in 1998. Soybean oil is used as a source ofvegetable oil in the preparation of dishes. Soybean flour is used in the manufacture ofweaning food, and for enriching the bakery products. Fermented products such as soybeansauce, natto and tempe are used to a limited extent. Green pods of grain legumes are usedas vegetables. These are lima bean (Phaseolus lunatus), winged bean (Psophocarpustetragonalobus), and string bean (Phaseolus vulgaris).
PROCESSING PROBLEMS AND ISSUES
The decline in production of legumes in Sri Lanka over the past decade retarded thedevelopment of processing techniques due to decreased investments.
Pre- and post-harvest losses of grain legumes should be minimized. Although it is acomplex problem requiring multidisciplinary approach, there is a need to combine the currentand innovative technologies to minimize the problem. Various pests and microorganismsattack the legumes or legume products after harvest, in storage, during transportation to themarket, etc. A loss of approximately 10-15 percent has been reported for legumes. Theapplication of pesticides results in chemical residues in the food that are extremely hazardousto health.
Temperature, moisture, and oxygen content influence the post-harvest storability oflegumes. Establishment of efficient and effective post production storage system shouldcomplement the integrated sustainable crop production system. An integrated, environ-mentally friendly, safe pest management system, and proper pre- and post-harvest handlingof the corps, would minimize the post production losses and would improve the quality oflegume grains for utilization.
National level planning and coordination of research is required. Development of suchcoordination would identify the major constraints and the research needs. Lack of practical
- 239 -
application of research results and lack of market orientation of production and processingare other constraints. Improper post-harvest management of peanuts, results in theaccumulation of aflatoxins through fungal infection. It is a serious problem in marketingpeanuts. Therefore, quality control measures for peanuts beginning from the farm andsubsequently through harvesting, curing, shelling, storing and manufacture of value-addedproducts should be implemented.
Peanuts are semiperishable legume and could be stored for long periods under optimumconditions. But under unsuitable storage conditions, discoloration, and development ofrancidity develops rapidly due to insect and fungal attack and become inedible within a shorttime.
Innovations made in recent years are based on traditional consumption patterns. Newproducts are formulated using a blend of ingredients in order to provide better nutrition,wholesomeness, taste characteristics and convenience to the consumer. These products arecommercially manufactured on a small/medium scale partially utilizing modern technologies.These products can be categorized into weaning foods, protein-rich foods, and milledproducts (flour). Instant breakfast mixes, curry formulae, snack foods, etc. are other value-added products.
Nutritious Supplementary Foods
1. ThriposhaThriposha is a product manufactured by extrusion cooking of maize and soybeans and
blending with a fortified product called Instant Corn Soya Milk donated through USAID.The product Thriposha in the national language signifies the combination of triple
nutrient values. It is distributed free of charge through maternal child health centers, clinics,hospitals, primary and pre-schools, plantation estates, and social service institutions. It is anutrition intervention program by the Ministry of Health.
The ‘Thriposha’ contains about 20 percent protein, 6 percent fat, 60 percentcarbohydrates, 5 percent moisture and 380 kcal/100 gm.2. Samaposha
Thriposha (pro soy-product) is an off white powder manufactured using maize, rice,soybean and green gram. It is a 100-percent natural product free from chemical additives,flavors, colorings and preservatives. It can be used as a breakfast cereal and for thepreparation of traditional sweets.
Its proximate composition is: 19.6 percent protein; 6.7 percent fat; 64.4 percentcarbohydrates; 1.5 percent fiber; and it provides 396 kcal/100 gm. It is fortified withvitamins and minerals.3. Milkee
Milkee (pro soy-product) is a soy-powder prepared for cooking. It is a medium fat soy-flour containing 48 percent protein and 8 percent fat.4. Prosoya – Protein Food
Soybean grits, 100 percent natural product, free of chemicals, flavors, coloring orpreservatives. It is a product recommended for consumption in a curried form. It is used asan ingredient in the preparation of breakfast food, salads, vegetable/meat/fish curry. The
- 240 -
product has a protein content of 40 percent, 9.7 percent fat, 5.4 percent fiber and 366.9kcal/100 gm.5. ‘Nestle’ Cereal Green Gram
Cereal green gram is a product prepared from whole wheat, rice and green gram andenriched with vitamins. It is a breakfast cereal. It can be consumed by mixing with warmmilk or water. It has a proximate composition of 1.5 percent fat, 10.3 percent protein, 75.6percent carbohydrates, 7.1 percent dietary fiber, 2.6 percent minerals, 3.0 percent moistureand 356 kcal/100 gm.6. Positha – An Infant Weaning Food
Positha is a product developed by ITI. The ingredients are rice, mung bean,groundnut, sugar, vitamins and minerals. The product is an off-white powder with the tasteand flavor characteristics of roasted ingredients. The average composition of the product is15.5 percent protein, 7.0 percent fat, and 70.4 percent carbohydrates. It provides 406kcal/100 gm. The product is packed in two sachets.
The contents of the two sachets are mixed with boiled cooled water or milk to form asmooth paste and cooked over a slow fire for approximately 2-3 minutes until the desiredtexture is obtained.7. Instant Soy-products
These products were developed at ITI. Canned soybean in curry form is commerciallymanufactured.8. Canned Soybean in Curry Form
It is a 100-percent natural product free of chemicals. The ingredients are soybeans,curry powder, curry leaves, coconut milk, green chilies, chili powder, ginger, onion, garlicand salt. The proximate composition of the product is 21.0 percent protein, 9.29 percent fat,and 31.2 percent total solids.9. Canned Soybean Sprouts in Curry Form
It is also a product free of chemical additives. The ingredients are sprouted soybean,curry powder, curry leaves, coconut milk, green chilies, chili powder, ginger, onion, garlic,and salt. Proximate composition of the product is 33.6 percent protein, 24.7 percent fat, 5.2percent total ash, and 4.8 percent crude fiber.10. Canned Soybean ‘Tofu’ in Curry Form
The product, with extended shelf life of tofu, in curry medium is prepared using spices,curry leaves, coconut milk, curry powder green chilies, chili powder, ginger, garlic and salt.The proximate composition of 100 gm of canned tofu on wet basis is 20 percent protein, 23percent fat, 0.2 percent total ash and 13 percent total solids.11. Canned Soybean Cutlets in Curry Form
Soybean cutlets are formulated using soybean, garlic, onion and salt. Curry mediumis prepared using coconut milk, spices, onions, garlic, herbs, salt, tomato and hydrogenatedvegetable fat.12. Instant Mixes – ‘Thosai Mix’ and ‘Idli Mix’
Instant mixes of black gram flour, rice flour and wheat flour are commerciallymanufactured for the preparation of ‘Thosai’ and ‘Idli’ which are used as a main meal fordinner.13. Texturized Vegetable Protein
It is an extruded product prepared from defatted soybean flour with the addition offlavor. It contains approximately 50 percent protein.
- 241 -
14. Milled Products – Black Gram FlourMilled black gram flour is used in the preparation of ‘thosai’, ‘Idli’ and other snacks.
15. Blended Milks(a) Soy milk blended with cow’s milk is packaged in bottles or in flexible pouches and
sold in the market.The technical know-how for the manufacture of canned/bottled blended milk of
good organoleptic quality suitable for consumption have been developed by ITI forcommercialization. The ratio of saturated to unsaturated fatty acids in cow’s milk andsoybean milk are 61-39 percent and 14 percent and 86 percent, respectively. Theblended soy milk has the advantage of more balanced fatty acid composition.
(b) Soy milk blended with coconut milk in bottles or in flexible pouches for cookingpurposes.
The technical know-how for the manufacture of canned/bottled blended milk ofgood organoleptic quality suitable for cooking purposes have been developed by ITIand transferred to industry for commercialization. This product has the advantage ofa more balanced fatty acid composition of 71.8 percent saturated fatty acids and 28.2percent unsaturated fatty acids compared to 91.6 and 8.4 percent in coconut, and 14percent and 86 percent in soybean, respectively.
FUTURE ROLE OF LEGUMES IN FOOD SECURITY AND NUTRITION
It is well known that legumes are important crops in terms of food security, nutrition,agricultural development, and enhancement of economy. They rank next only to cereals.Legumes are generally grown on poor land and given less attention than cereals. Legumesand cereals supplement each other in the field and in providing wholesome nutritive food andhigh quality protein. They are also useful as rotation crops that improve soil fertility.Legumes therefore, play an important role in our agricultural system.
Cereals are converted both domestically and industrially into a variety of edibleproducts than legumes. A better knowledge and appreciation of the functional properties ofimportant legume constituents is essential for utilization and processing of legumes in themost advantageous manner. Functional properties of protein except for soybean protein ishardly known. Some of the functional properties of practical importance are water bindingcapacity, solubility, gel formation, lipid binding, foam evaluation, etc.
Legumes can contribute towards improving the economy through industrial processingand value addition. In considering industrial processing legumes high in lipids such assoybean, groundnut and those low in lipid content should be differentiated.
Manufacture of extruded products using composite mixtures of cereal and legume flourwould provide a different range of nutritious snack products to the consumer. Thecomposition of cereal/legume blend plays a vital role in the nutritional and functionalcharacteristics of final products produced by extrusion. Development of these productsshould take into consideration the local food habits and preferences of each country.
Food legumes play an important role in the nutrition of vegetarian population. Thenutrient composition of legumes is given in Table 1. Although soybean has proteinaseinhibitors which lowers the digestibility of legume proteins, they are often partly destroyedduring cooking.
- 242 -
Table 1. The Nutritional Composition of Different Legumes
Source: Tables of Food Composition, World Health Foundation of Ceylon.
The fatty acids in legumes are mostly unsaturated fatty acids. Oleic acid ispredominant in peanuts whereas linoleic acid is most abundant fatty acid in soybean.
Legume sprouts are used for human consumption in the orient for centuries, and theirhealth promoting effects are now well recognized. In terms of proximate composition,sprouts contain more protein than non-sprouted seed.
Green pods of legumes such as lima bean, string bean, and winged bean are used asvegetables. Green pods of soybeans are popularly used as a vegetable in Japan. Vegetablesoybean may have potential in Sri Lanka for use in salads and other food preparations.
The green seeds of many legumes are used as an ingredient in cereal-based recipes.Green peas are the most popular among these legumes and used in Sri Lanka to a limitedextent. Vegetable soybeans can find a similar use.
One of the major industrial food uses of legume is oil. In its natural state it is notcommercially acceptable. Oil must be extracted and refined to ensure optimum processingquality for intended uses.
Confectionary coatings – A blend of a fat with sweetener and other solids, which issolid at room temperature but melts near mouth temperature is often used to coat various fooditems. Such blends are called confectionary coating.
Salad oils – Oils for use in various kinds of salad dressings and spreads have two primerequirements, namely good oxidative stability and resistance to crystal formation atrefrigerator temperatures.
Lecithin with less than 1 percent moisture is obtained by drying the sludge from de-gumming the oil.
Isolated Soy Proteins (ISP)ISP are high quality protein food. ISP are the major protein fractions of soybeans
obtained in high purity from high quality de-hulled soybeans after oil extraction. ISP offers
- 243 -
nutritional, functional and economical advantages, while maintaining the desirable sensoryqualities necessary for consumer acceptance.
Legume Protein Flour and ConcentratesSoybean grits, defatted soybean flour, low fat soybean flour, and full fat soybean flour
are presently imported and used for the manufacture of weaning foods, texturized vegetableprotein, etc.
FeedSoybean meal after oil extraction is properly processed and used as animal feed.
Safety IssuesPesticide residues, genetically modified seeds and fungal toxins are the main food
safety issues concerning the utilization of legumes. Presently monitoring schemes are non-existent. However, limited laboratory facilities are available for testing pesticide residues andfungal toxins. Genetically modified foods are not allowed in Sri Lanka.
CONCLUSION
Food legumes containing 20-40 percent protein and 1-20 percent fat, 30-60 percentcarbohydrates and with energy values ranging from 320 kcal to 435 kcal/100 gm, aresupplementary to the cereal-based diet in Sri Lanka in providing a good quality protein.These vegetable proteins are offered at lower cost than animal proteins and are affordable tothe poor in the country. Legumes are traditionally well accepted by the people and thereforeplay an important role in fulfilling the nutritional security of the country.
Therefore, there is a great potential for Sri Lanka to develop an efficient productionand post-production system for developing the legume industry that will contribute to thesocio-economic development of the country.
- 244 -
14. VIETNAM
Le Thanh HiepLaboratory ManagerPost Harvest Technology InstituteHo Chi Minh City
INTRODUCTION
Vietnam is a tropical country and its climatic condition is favorable for year-round cropproduction. Agriculture plays an important role in Vietnam’s economy. Of the totalpopulation 76.5 percent is rural. About 78.9 percent (42.6 million) of the labor is also rural.Of the total land area 22.2 percent is cultivated. The agriculture sector provides about 30percent of the national economy (Lan, 1999). Development of leguminous crops in Vietnamhas enabled diversification of crops and diet of the people. A detailed report on theleguminous crops in Vietnam is lacking. This paper is one of the comprehensive reports onpopular leguminous crops in Vietnam.
PRODUCTION AND CONSUMPTION
Among the numerous legume crops in the family Leguminosae only a few arecommonly used and they play an important role in agricultural production in Vietnam. Theyare groundnut, soybean, mung bean, red cowpea, black mung bean, and white pea. A fewothers used as vegetables are snap bean and snow pea. The area planted to groundnut andmung bean and their production in relation to other crops from 1968 to 1973 are shown inTable 1. The area, production and the yield per unit area of legumes in relation to other cropsfrom 1976 to 1994 are shown in Tables 2, 3, and 4. Groundnut and soybean continue to bethe major crops with an increasing trend in area, production and productivity. NortheastSouth and North Central Coast are the two major groundnut growing areas (Table 5). On theother hand North Vietnam, Mountain and Midland, and South Vietnam are the major soybeangrowing areas (Table 6). Among the industrial crops groundnut ranks first and soybean ranksfourth.
SoybeanVietnam has a long history of cultivating soybean (Louriro Runphius, 1773).
Vietnamese people used a number of processed soy-foods such as tofu, soy milk, soy sauce,soy paste, soy curd, etc. and they provided part of the protein in their diet. They also usedsoybean for animal feed.
On a worldwide basis, the area planted to soybean in Vietnam is only 0.21 percent ofthe total world area for soybean. However, the soybean area in Vietnam increased to 121,000ha in 1995 from 39,400 ha in 1976 (Figure 1). The average yield per ha in 1997 was 1,100kg compared to 525 kg/ha in 1976 (Figure 2). Similarly the total production reached morethan 120,000 mt in 1995 compared to only 20,700 mt in 1976 (Figure 3). Nearly 77 percentof the total soybean area is concentrated in four main regions: Mountain and Midland; Red
- 245 -
Table 1. Area and Production of Main Crops in South Vietnam Before 1975(Unit: Area = ha; and production = mt)
River Delta (Pham, 1996; and Ngo, et al., 1999), Central Highlands and Northeast South(Figure 4). On the other hand, the production was dominated in Mountain and Midland, RedRiver Delta, Central Highlands and Mekong River Delta (Figure 5). The highest per ha yieldis 2,100 kg from Mekong River Delta in the south (Ngo, et al., 1999). Soybean is cultivatedin the spring (February to May – 29.7 percent production), summer (June to August – 31.3percent) and autumn (September to November – 22.1 percent) seasons (Pham, 1996; andNgo, et al., 1999).
The per capita availability of soybean in 1995 in Vietnam was 1.1 kg/year against 10.5kg for Indonesia and 0.4 kg for the Philippines. At present, soybean is used in the followingmanner in Vietnam.
a. Traditional processed food: tofu, soy paste, soy sauce, soy milk and soy curdb. Vegetable oil, shortening and mayonnaisec. Extrusion cooking and micronizingd. Animal feede. Fertilizer
Table 5. Production and Area of Peanut by Provinces
groundnut (Nguyen Khoa Chi, 1989). The area planted to groundnut, average yield andproduction increased gradually over the years. In 1993-94, the area increased to 246,600 hacompared to 160,000 ha in 1985 (Figure 6). The average yield and production increased to1,400 kg/ha and 350,000 mt in 1997 compared to 850 kg/ha and 95,000 mt in 1980,respectively (Figures 7 and 8). The average yield is higher in South Vietnam compared tothe North (Vo, et al., 1995).
Figure 6. Sown Area of Groundnut, 1976-97
Figure 7. Yield of Groundnut, 1976-97
The three major groundnut growing and producing areas in Vietnam are NortheastSouth, North Central Coast and North East (Figures 9 and 10). The last two regions haveabout 30-35 percent of the total area with an average yield of 1.2-1.5 mt/ha.
- 255 -
Mung BeanMung bean is a common legume crop in Vietnam. In the country side, the following
mung bean dishes are always used: mung bean cooked with glutinous rice; sweet mung beansoup; mung bean sprouts; and mung bean cake. Mung bean is nutritious and has higheconomic value. Mung bean is suitable for both domestic and export market since it iswidely consumed and the prices are quite stable (Pham, 1999). Mung bean is commonlycultivated in the Delta Region, Midland to Highland from the North to the South. Mung beancan be planted throughout the year. It is considered as a minor crop. Vietnam has about50,000 ha and the average yield is about 590 kg/ha. The yield is higher in the South than inthe North and in some Mekong Delta areas the yield is as high as 1,000 kg/ha. The followingfactors are responsible for the low yield:
C Mung bean is normally planted in poor soil, without irrigation and withoutmanagement inputs.
C Farmers use seeds of local varieties and seed quality is poor. There is no agency toproduce and provide good quality seeds.
C Farmers provide very low investment. Average investment is only US$13.9-14.3 whilefor groundnut it is US$24.6-26.4. For intensive inputs for mung beans, farmers shouldinvest US$37.5.
C Farmers lack management information.
Mung bean is primarily used as food in the domestic market. The direct use of mungbean includes sweet soup, cooked with glutinous rice, mung bean gruel, cake, beverages, andice cream. The processed mung bean products include flour, vermicelli, and sprouts. Mungbean is one of the ingredients in nearly all traditional cakes. The by-products of mung beanprocessing (hull, sludge) are used as animal feed. The stem and leaves are used as greenmanure.
Since the varieties are not pure and the quality is not up to the standard, there is verylittle export. For export, the purity for Grades I and II should be 94 percent and 89 percent,respectively with 14.5 percent moisture content. The acceptable level of defects for GradesI and II will be 4 percent and 8 percent, respectively.
Black Mung Bean, Red Cowpea and White PeaThe above three crops are very minor crops. They are planted in small areas scattered
around the country. They are generally used in processing sweet food. The direct useincludes sweet soup, gruel, cooked with glutinous rice and sweet meat. They are used asingredients in traditional cake. Nutritious flour is also prepared. They are used as greenmanure. A small quantity of red cowpea is exported.
Leguminous VegetablesA number of leguminous crops are used as vegetables (fresh, boiled, fried or steamed).
The commonly used vegetables are snap bean, snow pea, wing bean, and string bean.Normally they are planted in the household farm or home garden and are sold to the marketby farmers. They provide additional income to the farmers. Some of the above vegetablesare also included as ingredients in instant and canned foods. At present, export ofleguminous vegetables is negligible.
Other Leguminous CropsOther leguminous crops in Vietnam include horse gram, velvet bean, sword bean, wing
bean (Mekong Delta), lima bean (South Vietnam and Red River Delta), hyacinth bean,(Central Highland), siratro (Northeast South), bort (North Vietnam) and sesbania (MekongDelta for paper pulp). All of them are planted in small areas in scattered localities and usedin very small quantities primarily as animal feed and as green manure.
The chemical composition of some of the Vietnamese legumes and by products fromprocessed legumes is given in Tables 8, 9, 10 and 11.
TRADITIONAL PROCESSING AND UTILIZATION OF LEGUMES
Processing of legume results in value addition. Processing creates job opportunities.Processing helps in product diversification and makes it attractive to consumers.
SoybeanSoybeans are processed either with or without fermentation as shown below:
The names of fermented and non-fermented soy foods are given in Tables 12 and 13.
Fresh Soybean Curd (Tofu)As raw material soybeans with ivory-white shell, white meat, uniform and round bean
are prepared (Watanabe, et al., 1984). The procedure is shown in Figure 11.
Soy Milk (Watanabe, et al., 1984)The ingredients for soybean milk preparation are:
– Soybean: 0.3 kg (fresh, light color, round, thin hull)– Water: 5 R– Sugar: 0.7 kg– Salt: 0.1 kg
The procedure is shown in Figure 11.
- 257 -
Table 8. Chemical Composition of Some Vietnamese Legumes
Hama-nattoChina Jiang you Jiang Doufuru DouchiKorea Kang Jang Doen jan Chung-
Kochujang kook-jangThailand Siiu dam, wan Tauchieo Tauhuyi ThuanaoMalaysia Kecap Tauco TempehIndonesia Kecap Tauco Tempeh OncomPhilippines Tayo Tao si Tahuri
Source: Erickson, 1989; and FAO, 1993.
- 260 -
Table 13. Names of Non-fermented Soybean Foods in AsiaEnglish Vietnam Japan China Korea Thailand Malaysia Indonesia Philippines
Fresh soybean oâu nành Edamame Mao dou Put kongSoy milk Séa oN Tonyu Doujiang Kongkook, Namtauhu Suukedallai Suukedelai
nama-ageFrozen-driedSoy milk film oâu phù trúc Yuba Dou fu pi Fu chok Fu chokSoy cheese Tàu hé non Douhua Tauhaui TahoToasted soy flour Bôt oN rang Kinako Dou-fen Kang ka rau Bubuk kadeleSoybean sprouts Gía oN Daizu Huang dou ya Kong na Thuangok Taoge Toge
moyashi moal huato
- 261 -
Soybean
Soaking
Duration: 5-6 hours at 20-25ºCSoybean: H2O = 1:2.5NaCl: 0.75 gm/R soaking water
CoagulationCoagulant: ph 4-4.5Dosage: 20-30 percent of soy milk
Soy curd
Molding
Tofu
Figure 11. Procedure of Tofu
Yield: One kg raw material yields 2.8-3 kg tofu and 1.5-1.6 kg residue (for animal feed).
- 262 -
Soybeans
Soaking (duration: 3-4 hours)
Hull removal
Wet grinding
Filtration
Heating 20 minutes
Sugar, salt Soy milk
Soy flourStir in hot water 15-20 minutes
Supernatant (fat)
Deposit Stirring in hot waterStand ì
Figure 12. Procedure of Soy Milk
Soy Milk Film/Soy Liquid Sheet (Yuba) (Watanabe, 1984)Yuba is made from soy milk. In a cast iron/copper pan, soy milk is heated but not quite
to the boiling point. When the film forms on the liquid surface, it is lifted off with twobamboo sticks and is dried partly or entirely (sun-dried). Heating of the milk is continuedtill it produces another film, which is removed and dried. As one film after another is liftedoff, the protein and fat content of the milk drops. The outcome of this is weaker films of poorquality. To prolong the productivity of the process, from time to time, fresh soy milk isadded.
One kg soybean yields 550 gm dried “yuba”.
Soy Bean Sprouts (Watanabe, 1984)Soybeans with a 100-seed weight of less than 10 gm are soaked in water at room
temperature for 12 hours. Then they are spread out in a thin layer on a perforated rack or atthe bottom of a strainer on which a damp cloth has been spread out. The whole thing isplaced in a dark room at room temperature. Twice a day the beans are sprayed with sufficientwater. After 3-5 days the sprouts may reach a length of 3-5 cm.
One kg of soybean yields 7-9 kg bean sprouts.
Roasted/Toasted Soy Flour (Watanabe, 1984)The procedure includes the following steps:
a) Beans ÿ crushing ÿ soaking in 3-4 hours ÿ draining ÿ roasting ÿ milling ÿRoasted Full-fat Soy Flour
Soy flour is used to make soy flour milk (mix with sugar, water), soy flour cake (mixwith sugar, coconut milk), and soy flour wafer.
Soy Curd (Quang, 1988)Soybean curd is prepared as follows:
Ginger + Sugar + Water
Soy Sauce (Watanabe, 1984)The ingredients include soybean cake (or defatted soy beans), 10 kg; and salt, 8-9 kg.
The output is 30 liters of soy sauce with 10-13 gm N/R. The procedure is:
Fermented Tofu (Pham, 1996)The raw materials are soybean, alcohol, mould (Mucor). Chemical composition of
“Chao” is water (67-70 percent), total nitrogen (2-2.3 percent), ammonium nitrogen (0.2-0.5percent), (nitrogen) formaldehyde (0.8-0.9 percent), salt (5.8-6 percent), and lipid (8-9percent). The procedure is:
Fermented tofu is used directly or in making “Chao” sauce, as an ingredient of noodleand as an ingredient of noodle seasoning.
Soy Paste (Watanabe, 1984)“Túóng” is a traditional seasoning in Vietnam. In the countryside, every house has got
a soy paste jar. Nearly everyone knows how to make “túóng”. The famous brand names are:Túóng Bân, Túóng Cú oà (in Red River Delta); and Túóng Nam oàn (in Central).
1. Condensed TúóngThe raw materials include soy bean (5 kg), glutinous flour (1 kg), salt (0.12 kg), and
water (6 R). The product is a dense, sweet and salty taste (rather sour). The procedure is:
2. Diluted Túónga) In the North Vietnam
The raw materials include (kg):
- 265 -
Glutinous rice Soybean
Soaking (8-12 hours) Soaking (10 min.)
Steaming Roasting
Cooling (40ºC) Grinding
Mold Inoculation (2-3%) Cooking (with water 45-60 min.)
S a l t , Salted mold Water Salt Soaked ground soybean
Mixing
Fermentation
Aging (5-10 days) Salt, wine
Product
Waxy Rice Soybean Salt Water (R)
“Túóng” Bân 33 12 16 100“Túóng” Cú oà 30 9 13 100
The product is yellow with good smell and sweet and sour taste.Nutritive value is protein (4.5 percent), lipid (0.8 percent), carbohydrate (16.8 percent),
mineral (14.2 percent), salt (13.7 percent), vitamin B1 (450 unit/100 gm product).The procedure is:
9 8Removal of hull Wrapping in plastic bags or banana leaves
9 8Cooking (one hour) Inoculation
Rhizopus spp.
b) In the South Vietnam
Fermented Whole Seed/Whole Soybeans (Watanabe, 1984)The raw material is soybean (small seed size). The product is: moisture (64.7 percent);
protein (18.3 percent); lipid (2.78 percent); and carbohydrate (12.7 percent). The soybeansare fully covered by a white mold with characteristic good smell. The procedure is:
Yogurt (Thio, 1971)One liter of soy milk is boiled for a few minutes and then is left to cool to room
temperature. Then 80 mR of yogurt culture is well suspended in the milk.
- 267 -
Boiled (in brine 3%, in 45 min.)Roasted
With pod
Roasted with saltRoasted with sugarRoasted with “hung liu”Roasted with fish sauceMake candy, biscuit, ice cream
Direct use
Roasted
Groundnut
Pod removed
Ingredient of sweet soup, cooked glutinousrice,cake, casserole, ice cream, food for vegetarians
The suspension is kept at room temperature for 15-18 hours. As the yogurt made withsoy milk has a low carbohydrate content, addition of sugar is customary.
Groundnut (Thio, 1971)Processing and utilization of groundnut in Vietnam is shown below:
Groundnut is one of the most popular food in Vietnam. It is the daily food for workingclass, vegetarians; it is the cheap food for poor people; and it is one of the simplest food touse with beer. Groundnut is used in most Vietnamese dishes. In some dishes, it is a veryimportant additive, which enhances the delicacy of food. For example, roasted groundnutused in sweet soup, rice vermicelli, and cooked glutinous rice.
Production of Groundnut Paste/Butter (Nguyen, 1989)The procedure is: groundnut ÿ roasting at 160-170ºC ÿ cooling ÿ removal of hull
ÿ grinding ÿ mixing with sugar, salt ÿ Groundnut Paste/Butter (Bo dau phon)
Production of Groundnut Oil in Small-scale Industry (Nguyen, 1989) (Figure 13)The procedure is as follows:
Groundnut with pod ÿ removal of pod ÿ kernel ÿ crushing ÿ grinding ÿ paste ÿsteaming ÿ cool pressing ÿ Crude Oil Grade I ÿ Settling ÿ Refined oil
9Residue ÿ hot pressing (at 50-60ºC) ÿ Crude Oil Grades II and III
Dried mung bean flour 100 gm dried mung bean flour + 1.5 R water
Yield: 1 kg groundnut ÿ 0.85 kg ground groundnut1 kg ground groundnut ÿ 1.5-1.6 kg groundnut tofu (moisture, 70-72 percent)
92.2-2.4 kg fermented tofu from groundnut
Mung BeanProcessing and utilization of mung bean in Vietnam are as shown below:
Production of Vermicelli (Nguyen, 1984) (Figure 14)Vermicelli is produced using the following procedures:
Yield: 100 kg mung bean flour ÿ 70-75 kg vermicelli.
- 271-
Sprouts (Nguyen, 1984)The raw material includes good quality fresh mung bean with yellow meat; small and
undamaged beans without foreign matter.The procedure is as follows: Mung beans are soaked for two hours in water. Then
they are mixed with one spoon of CaSO4. They are crushed by hand to thin the bean. Nextthey are soaked overnight (use 100 R water for 10 kg beans) to absorb water and then drained.The drained beans are covered by a cloth for about one hour for germination. Husk ashes arepoured into a perforated container in a layer of 10 cm thickness then beans are poured ontothe layer of ash. And next a thin layer of ash again and finally, all of them are covered byjute or banana leaves. On the top, bricks are used for pressing (maximum 15 bricks) to limitthe extra development of length of sprouts. Every three hours, beans are sprayed with water.On the second day, when the sprouts begin to show, they are sprayed with coconut water.Three days later, sprouts can be harvested (Pham, 1999).
Yield: 1 kg mung beanProduct: Length of stem: 3-5 cm; of root #1.5 cm; of leaf #3 mm.
Width: 2.5-3 cmColor: white (stem); light brown (root); yellow (bean and leaves)Smell and taste: naturalTexture: brittle (crispy)
Dishes made from sprouts are:
Sprout pickle – sprouts (1 kg) + salt (20 gm) + sugar (30 gm) + vinegar or lemon juice;Sprout in brine – sprouts (10 kg) + salt (0.5 kg) + water (10 R) + chili (0.1 kg) + carrot (0.5
kg) + onion (0.5 kg) + garlic (0.1 kg).
Production of Mung Bean Flour (Pham, 1999)Procedure is as follows: Dry mung bean ÿ washing in water ÿ draining ÿ roasting
to yellow bean, good smell ÿ keep warm for about one hour ÿ removal of hull (bycrushing) ÿ grinding ÿ separating (by sieving) ÿ fine mung bean flour.
Mung bean flour is used to make cake, beverage and ice cream.
Beverage (or mung bean milk): mung bean flour (0.15 kg) + sugar (0.25 kg) + vanillin (0.5gm) + boiled water (1 R).
Ice cream: mung bean flour (0.1 kg) + sugar (0.4 kg) + pao flour (25 gm) + vanillin (5 gm)+ condensed milk (50 gm) + water (1 R).
Cake: mung bean flour (1 kg) + sugar (1.2 kg) + fat (0.7 kg) + vanillin
Use of Mung Bean in Making Traditional Foods (Pham, 1999)A number of intermediate materials (IM) are prepared from mung bean.
1) Mung bean flour is mixed with fat, sugar and they are moulded ÿ IM.2) Mung bean ÿ soaking (5-6 hours) ÿ removal of hull ÿ washing ÿ steaming ÿ
mixing with vanillin ÿ keep cool ÿ molding ÿ IM.
- 272-
IM is used as raw material to make: steamed mung bean cake; baked mung bean cake;steamed 5-layers cake; and candy. IM is condensed in sugar then is made round and is sun-dried.
Mung bean is also used in cooked glutinous rice.
1) Cooked glutinous rice is covered by steamed and ground mung bean and fat, mixingand crushing by hand until cooked glutinous rice grains are separated (Figure 15).
2) Cooked glutinous rice + steamed and ground mung bean + fat.3) Steamed and ground mung bean is pressed between two layers of cooked glutinous
rice.
All of them are put on the banana leaves.Mung bean is also used in sweet soups.
1) Whole bean sweet soup: bean (200 gm) is cooked with sugar (200 gm).2) Ground bean sweet soup is cooked from steamed and ground mung bean with sugar.3) Bean is cooked with sugar, “dao” flour.4) Steamed and ground mung bean + sugar + “tháo quá” + sesame seed.5) Cooked mixture of mung bean, sugar, tapioca, flour, lotus seed, peanut, mushroom,
dried coconut.6) Cooked mixture of steamed mung bean, pumpkin, sugar, tapioca starch, ginger.
Mung bean in traditional cake: Mung bean is an important ingredient (make fillingwhile coating is with cooked rice flour or cooked glutinous rice flour or cooked glutinousrice) in moon cake, etc.
Other beansLike mung bean, other beans (black mung bean, red cowpeas, white pea ...) is used to
make flour or to make traditional dishes such as:
C use in cooked glutinous rice: black mung bean, red cowpeas.C use in sweet soup: black mung bean, red cowpeas, white pea.C use in traditional cake: baked, steamed from black mung bean, red cowpeas; filling.C Use in sweet meat: white pea.
PROCESSING AND UTILIZATION OF VIETNAMESE LEGUMES– NEW TECHNIQUES
Production of Edible Oil and Oil-based Products fromSoybean and Groundnut Using Modern Industry
1. Processing of Refined OilThe raw material is crude soybean oil or crude ground nut oil.
- 273-
Jan. Feb. Mar. Apr. May June July Aug. Sept. Oct. Nov. Dec.Rice – Mekong Delta
Summer-autumn crop, Mekong Delta
Summer-autumn crop, Minh Hai province only
MaizeMain crop
Secondary crop
SoybeanSpring crop, Mekong Delta
Summer and summer-autumn crop, Southeastern area
Summer-autumn crop, Highland area
GroundnutMain crop, Southeastern and Highland areas
Secondary crop, Southeastern and Highland areas
Main crop, well-irrigated Southern area
Subsidiary crop, well-irrigated Southern area
Main crop, well-irrigated Southern area
Green BeanSummer-autumn crop, Southeastern and Highland areas
Autumn-winter crop, Southeastern and Highland areas
Winter-spring crop, Southeastern and Highland areas
Winter-spring crop, Mekong Delta
Spring-summer crop, Mekong Delta
Summer-autumn crop, Mekong Delta
Autumn-winter crop, Mekong Delta
Growth period Harvesting time
Figure 15. Seasonal Pattern of Crop Production andHarvesting in Southern Vietnam
- 274-
Crude oil9
Settling/filtration Impurities, wax9
De-gumming SludgeWater
9 9Chemical refining Physical refining
9NaOHNaCl
Neutralization Soup sludge9
Water Washing Crude oil9
Drying(de-watering/dehydration)
9Active carbonActive soil(in vacuum)
Decoloring Deodorizing
Sludge9
Filtration9
Vapor(in vacuum)
Deodorizing
9Filtration
Refined oil
Pod (husk) ÿ FuelKernelGroundnut ÿ Husking ÿ Classification and fanning
2. Processing of Crude Groundnut Oil (Nguyen, 1989)The procedure is:
3. Production of Vegetable Oil in Vietnam (Phan, 2000)Capacity of oil pressing of VOCARIMEX (National Company for Vegetable Oils,
Aromas and Cosmetics of Vietnam) with seven factories is 218,000 mt of raw material peryear and it utilizes 40 percent of domestic oilseed and meets 40 percent of the marketrequirement.
Gross output of groundnut oil is 9,000 mt per year (potential: 80,000 mt of crude oilper year).
Gross output of crude soybean oil is 15,000 mt per year from 102,000 mt raw material.
- 275-
Mixin
NaOH/Na2CO39Groundnut cake orSoybean cakeHClWater
Digestion Neutralization
Product Filtration Sludge9
Soy sauceSoy hull Groundnut cake Soy cake
Pressing (dehydration) Grinding9
9Mix with fillerPot
Soy hull9
Drying
9Grinding
9Mixing Packing Product
4. Production of Other Products (Phan, 2000)The other products include:– cooking oil: mix of refined coconut oil + ground nut oil + other oils.– dressing oil: use refined oil with low acid value (AV), light color and clear.– margarine, shortening: from refined soybean oil + groundnut oil + other oils.– oil used in production of canned food: using refined groundnut oil with very low
AV.– defoamer used in production of MSG, tofu: from groundnut oil.– groundnut cake, soybean cake: used in the production of seasonings, soy sauce,
animal feed.– crude groundnut paste: for export.
Production of Seasoning Sauce (Chemical Method) (Ngac, 1983)The seasoning sauce is produced as follows:
Production of Animal Feed (Ngac, 1983)
1. Imperfect FeedThe raw materials are the by-products of processing of soybean, groundnut, cereals ...
such as groundnut cake, groundnut sludge, groundnut pod (husk), soybean cake, soybeanhull, tofu sludge, soy sauce sludge ...
The procedure is:
- 276 -
Raw material
Intermediate product
Cleaning Impurities
Drying Grinding Sieving Mixed animal feed
99
9
2. Perfect FeedThe raw materials are:– By-products from processing of legumes.– By-products from processing, other products such as fish meal, bran, maize, and
vitamin.The procedure is:
Production of Canned Food
1. Groundnut Kernel Fried in Vegetable Oil (Groundnut Oil) (Quach, et al., 1996)The raw materials are: groundnut kernel, dry, fat, not damaged by molds or insects;
moisture, #10 percent; diameter of kernel, $7 mm; refined groundnut oil, AV#2; salt.The procedure is:
Raw material ÿ Classification ÿ Groundnut:Grade 1 (N$11 mm)Grade 2 (N=9-11 mm)Grade 3 (N=7-9 mm)
9 Drying to a moistureof 2-3 percent(at 75-80ºC for 7-8hours)
Grade 4(N<7 mm)
Dried groundnut ÿ removal of hull ÿ selection ÿ sound de-hulled kernel ÿ frying in oil(at 170-175ºC in 3-4 minutes) ÿ Selection ÿ Mixing with salt (1 percent of nut) ÿ canningÿ product 9
DefectsFormulation: for 1,000 kg product– Sound kernel: 1,300 kg– Refined groundnut oil: 100 kg– Salt: 11 kg.
2. Roasted Peanut Kernel in Can (Nguyen, et al., 1973)(a) Salted-roasted peanut
Raw material ÿ classification ÿ temperature raising (to 40ºC) ÿ mixing with brine(240 gm/R NaCl) ÿ drying (at 100ºC) ÿ roasting ÿ scenting with spices (0.5 percent)ÿ selection ÿ canning ÿ productSpices – Chinese anise flower: 8-10 parts
– Clove: four parts– Cinnamon: eight parts– Thao qua: one part
(b) Sweet-roasted peanut kernelThe procedure is the same with the above, but saccharin solution (6 gm/R; ratio of
solution:peanut = 1:12) is used instead of brine.
- 277 -
9 9Soybean Extruded soybean
WeighingCleaningDe-stoningFerrous material removal
Expelling
Oil Cake
9 9Storage Cooling
9 9De-hullingCoarse grinding Milling
9 9HullExtrusion Low fat soy meal
9Extruded soybean
9Cooling Milling Full-fat soybean meal (FFSBM)
(c) Roasted peanutRaw material ÿ classification ÿ roasting ÿ washing ÿ drying (at 80ºC in one hour)ÿ selection ÿ canningYield (for 1,000 kg product of each)
Raw Material (kg) RoastedPeanut
Sweet RoastedKernel
Salted RoastedKernel
Peanut Grade I 1,250Kernel Grade I 1,520 1,150Salt 25Saccharin 0.5Spices 5.0 5.0
3. Mung Bean Sprouts Pickle (Tran, et al., 1995)Raw material: sprouts with length of 5 cm, width of 3 mm.The procedure is: Sprouts ÿ selection ÿ washing ÿ draining ÿ scalding in citric
acid 0.1 percent at 80-85ºC in #1 minute ÿ quick cooling to room temperature ÿ mixingwith spices (garlic, chilies, pepper) and pickle medium (salt, sugar, acetic acid) in which solidpart is 55-60 percent of net weight ÿ canning (NW = 850 gm) ÿ pasteurization 15-10-25/100ºC.4. Natural Mung Bean Sprouts (Tran, et al., 1995)
Protein and fat content of researched product is lower than that for the foreign product,possibly due to poor quality of raw material used in the research.
Rice Mung bean Additive Soybean9 9 9
Cleaning Removal of hull Drying9
Removal of hull
9Mixing Moistening Extrusion Milling
9Product Packaging
Figure 16. Production of Instant Nutritious Powder for Infants
Source: PHTI, 2000.
- 279 -
Production of instant black mung bean meal is: Black mung bean ÿ washing ÿextrusion ÿ drying ÿ milling ÿ mixing with other ingredients ÿ packaging ÿ product.3. In FIRI – Ha Noi: Production of Baby Food (Truong, 1994)
The objective is to create a new low-cost weaning food by extrusion cooking for babiesin rural and highland areas with high quality using local available raw material solve themalnutrition problem in Vietnam.
The raw materials are rice, corn, soybean, mung bean, potato, malto-dextrin, milk,animal protein, vitamins, and minerals.
The products are:– The common type (cheap) can be supplied for all the children and expectant women
belonging to middle and lower income groups in rural areas.– Special type can be used for highly malnourished children.
They can produce 60 kg/hour.
Production of Soy Milk in Industry Scale with Automatic Processing Line(using imported technology and machines in Vinamilk, tribe co-companies)
The product is a “non-beany” soy milk. Based on the airless cold grinding ofsoybeans, lipoxygenase enzyme is kept dormant until it is inactivated by heating the soy milk.
Yield: 400-500 R/hour or 1,500-2,500 R/hour.
Research Activities of PHTI – Ho Chi Minh City in Processing andUtilization of Legumes
PHTI-HCMC (Ho Chi Minh City) was founded in 1988 as an institute belonging toMinistry of Agriculture and Rural Development. Located in South Vietnam, the largestagricultural production area in the whole country, PHTI has itself rapidly determined itsposition in a market economy and got the confidence of the society. Research andDevelopment (R&D) activities concentrated on post-harvest technology to serve the richMekong Delta and Northeast South regions. The research and development of post-harvestprocessing and utilization of legumes is an important objective of PHTI-HCMC.
1. Research on Production of Instant Vermicelli from Mung Bean Starch(a) Procedure: Mung bean ÿ soaking (four hours) ÿ removal of hull ÿ grinding ÿ
(b) Data on processing:– Ratio of mung bean:starch = 1:1.5– Gelatinization temperature: 85-90ºC– Gelatinization duration: 15 minutes– Yield: 50 kg mung bean ÿ 10 kg starch ÿ 7 kg vermicelli
(c) Research to reduce the cost of product – Vermicelli produced from mung bean has thebest quality, but it is expensive. To reduce the cost, research has replaced a part ofmung bean with potato starch and canna starch.
– Gelatinization and drying is performed on the belt-spreader (using saturated vapor)and drier made by PHTI-HCMC. Molding is performed using thread-makingmachine.
Research has produced vermicelli with the same quality but the cost of the product wasreduced by half.2. Treatment and Processing of Soybean by Micronizing (PHTI-HCMC, 1997)
The equipment used was micronizer model “Micro Red 10”; capacity, 750-1,000kg/hour; manufactured by Micronizing Co. (U.K.)
The objective is to use the micronizing method to activate the harmful Trypsininhibitors and hemagulitinins, to avoid the loss of lysine and thermal sensitive amino acids.
The procedure is as follows:
The quality of soybean before and aftermicronizing is (percent):
After micronizing, moisture and especially urease activity decreased considerably(well-done product); lipid content increased; and protein remained unchanged (nutritive valuewas unchanged or was enhanced).
3. Removal of Mung Bean Hull by Micronizing (PHTI-HCMC, 1997)Mung bean is very popular raw material for food processing for Vietnamese people.
The removal of hull in traditional way (soaking then manually panning-off) consumes a lotof time and it is difficult to store the de-hulled beans (because of high moisture content).
PHTI-HCMC conducted research to remove mung bean hull by micronizing to limitthe above inconveniences.
The procedure is: Mung bean ÿ removal of impurities (by fanning, sieving) ÿmicronizing (60 seconds) ÿ removal of hull (by fanning, sieving, separating) ÿ cooling ÿstorage.
Beans absorb infra-red radiation and become dry quickly. The cracks appear on theirsurface and then the hulls burst out. Bacteria and mold are also killed by high temperatureof micronizing process.4. Combination of Extrusion and Micronizing Technology to Produce Instant Mung Bean
Sweet Soup, Instant Black Mung Bean and Red Cowpea Sweet Soup(PHTI-HCMC, 1997)
The procedure is:
5. Research on Production of Instant Soybean CurdThe procedure is:
6. Reducing Mycotoxin Content in Agricultural Products (Le, 1994)Studies from PHTI-HCMC on mycotoxins in grain, food, and feed showed that the
principal mycotoxin in South Vietnam is aflatoxin. The aflatoxin content in groundnut cakeis always high (500-2,000 ppb). Aflatoxin in feed is also very variable.
PHTI-HCMC used two methods to lessen the aflatoxin content in agricultural products.7. Detoxification of Groundnut Cake by Ammonia
Ammonia (NH3) was used at high temperature, high pressure and at atmosphericpressure, room temperature to detoxify groundnut contaminated by high level of aflatoxin (upto 2,000 ppb).
Aflatoxin content (ppb) in groundnut cake before and after treatment are shown below:Sample Quantity (kg) Before Detoxification After Detoxification
(a) Using an aflatoxin binding substance to mix with contaminated feed before feedingThe bound aflatoxin cannot pass through the digestive tract to the blood so it is
not harmful to livestock. Polyplasdone (DSP Co.) was used to mix with feedcontaining 300 ppb aflatoxin B1. The dosage of polyplasdone is 200-400 ppm.
- 283 -
(b) Information program using the mass mediaA number of programs on radio and TV as well as articles in magazines and at
seminars, and exhibitions focus on aflatoxicosis and preventive measures. Ten yearsago, very few people were aware of aflatoxin. Nowadays almost all feed mills,livestock farm managers and technicians understand the danger of aflatoxicosis andhow to prevent it.
8. Rapid Detection of Aflatoxin in Groundnut, Crude Groundnut Oil, Peanut Paste,Soybean Extract Meal Using the Methods of BGYF(Bright Green Yellow Fluorescence), Minicolumn, TLC (Thin Layer Chromatography),Immuno-affinity Column (Tran, et al., 1996).
Since 1994, PHTI-HCMC promoted the use of BGYF test by feed mills and livestockfarms in South Vietnam. Though it has some limitations, the BGYF test has the potential tomonitor aflatoxin through out Vietnam more effectively.
Since 1989, with the aid of Department of Agriculture in Thailand, PHTI-HCMC hasstarted to use the minicolumn test to analyze aflatoxin semi-quantitatively. Use of aflatoxinminicolumn standards (50, 100, 200 ppb) enhanced the accuracy of the analysis. Theseminicolumn standards are calibrated by TLC. PHTI-HCMC has also promoted theminicolumn test for 20 feed mills, livestock, poultry farms in South Vietnam. This test issimple, cheap, needs few equipment and therefore all feed mills and farms throughout thecountry welcomed it for rapidly detecting on the site the raw material, products, feed whichwere contaminated with aflatoxin to have suitable treatments. Since 1993, Sigma Co. usedthe TLC method (based on AOAC-1990 method) as standard, the limit of detection is 5 ppb.At present, the research is focusing on the use of ELISA (enzyme-linked immunosorbentassay) test to detect aflatoxin in agricultural products. An immuno-affinity gel had beenrealized to quantitatively test for aflatoxin B1.9. Pesticide Residue Monitoring in Vegetables; Study and Application of
Rapid Biological Pesticide Residue (RBPR) Test in VietnamPHTI-HCMC has successfully applied the Taiwanese RBPR – acetyl cholinesterase
(AchE) inhibition test (with some modifications) to monitor the organophosphate andcarbamate pesticides residue in fresh vegetables. Seven most widely used pesticides inHCMC (Methamidophos, Monocrotophos, Diazinon, Dimethoate, Dichlorvos, Fenobucarb,Isoprocarb) have been shown to have strong inhibition action on AchE at the MRL(maximum residue limit) authorized by Vietnamese regulation (e.g about 1 ppm). This veryfast, simple, economical, sensitive and accurate test has efficiently served the extension workfor establishing HCMC “Safe Vegetables Production Zones” to screen clean vegetablesbefore they are sold on the market.
The principle of the method is: insect nervous system has AchE which plays animportant role in the transmission of nervous influx (nervous impulsion). Organophosphatesand carbamates can inhibit this enzyme and kill insects by damaging their nervous system.
The comparison between the classical method (GC, HPLC) and RBPR method isshown below:
GC, HPLC RBPR
Duration One week About two hoursCost/unit US$11-50/sample US$7/sample
10. Establishment of the Procedure for Analyzing the Quality of Exported Legumes(mung bean, soybean, peanut, red cowpea) (PHTI, 1999)
THE PROBLEMS OF PROCESSING ANDUTILIZATION OF VIETNAMESE LEGUMES
Mycotoxin Problem (Le, 1994)Unlike Northern Vietnam, the southern plain has two distinct seasons: dry and rainy.
The rainy season begins in mid-May and runs to the middle of November, but is wettest inJune-October when there are more than 15 days a month when the rainfall is 200-270 mm.It does not rain continuously everyday but intermittently.
The humidity of air is highest (>84 percent) from June to October. Temperatures arelowest between midnight and dawn.
The cropping system and seasons are given in Figure 15. For example, 50 percent ofannual groundnut production is harvested in July, when the rains are heaviest. Due totropical climate, shortage of warehouses and non-availability of appropriate means for drying,the post-harvest losses are high especially in the rainy season in Vietnam. Fungal infectionis responsible for a relatively high proportion of these losses. The problem of molds and theirtoxin (mycotoxin) is rather serious. It was shown that Aspergilli were one of the main sourceof aflatoxin in groundnut. The contamination by aflatoxin in some leguminous crops,especially groundnut and their products considerably affect the export (Table 14). Therehave been many incidences of poisoning of domestic livestock in recent years as a result ofconsumption of feeds contaminated with aflatoxin. HCMC Agricultural Department hasprohibited inclusion of groundnut cake in animal feeds. A lot of shipments of groundnut,crude groundnut oil, and peanut paste could not be exported or were returned due to aflatoxincontent over the allowable limit (>10 ppb). The export of instant processed peanut or refinedprocessed peanut products are quite low.
- 285 -
Table 14. Aflatoxin Contamination in Food and Feed in South Vietnam
Source: Le, 1994.Note: Figures in parentheses are percent.
High levels of aflatoxin (>100-125 ppb, even 500 ppb) were found in some samplesof groundnut in the market; aflatoxin in contaminated groundnut in North Vietnam is higherthan the ones from South Vietnam. Crude groundnut oil collected from factories has highlevel of aflatoxin (>100 ppb, in which: 50-60 percent is aflatoxin B1; 30-33 percent isaflatoxin G1 and B2; and G2 occupy 10 percent). After refining, aflatoxin content ingroundnut oil decreased considerably and nearly became negative. For soybean, thecontamination is very weak. In soy cake, the contamination is significant and variable.
The aflatoxin content in agricultural products varies with the season. The rainy seasonis conducive to the development of mold, and aflatoxin increases markedly (Table 15).
Table 15. Effects of Climate on Aflatoxin Contamination in Food and Feed(Unit: Aflatoxin average, ppb)
Practical ways to prevent aflatoxicosis include monitoring fodder moisture andaflatoxin levels and timely drying of newly harvested products. Driers are valuable in thisregard in rainy season.
Pesticides Residue in Vegetables (Tran, et al., 1999)Intensive vegetable farming relies heavily on new technology, mostly the use of
fertilizers and pesticides. Though some new, less toxic pesticides, such as pyrethroids havebeen used, about 30 percent pesticides used in HCMC suburbs belong to two neurotoxicgroups such as organophosphates and carbamates. Survey conducted by Department of PlantProtection showed that pesticide residues in many vegetable samples exceed the maximumresidue limit of FAO-WHO (1994) (Tables 16 and 17).
- 286 -
Table 16. Pesticide Residue in Some Domestic Leguminous VegetablesCrop Pesticide Times Exceed MRL Year of Analysis
So it not surprising that in Vietnam, there are many cases of food poisoning and it isa great concern for the government and public consumers. Therefore monitoring pesticideresidue in vegetables is necessary to protect the health of farmers and consumers.
For exported legumes, due to small quantity and due to strict regulations of importedcountries, the pesticide residue problem is not significant.
The Unstable Quality of Some Exported Vietnamese Legumes(in the form of raw material)
The Vietnamese legumes (soybean, mung bean, red cowpea etc.) cannot be exportedin large quantities and cannot attract good price due to unstable quality and non-uniformappearance (color, dimension, count per size, etc.), and grain characteristics (moisture,defects, foreign matter, etc.) A number of factors are responsible for the poor quality.
Mass Production of Legumes in VietnamIn general, except some areas specializing in soybean and groundnut cultivation
throughout the country, most legumes are still considered as a secondary crop. As a result,the investment for leguminous crops research is inadequate for breeding, cultivation,watering, plant protection, post-harvest preservation, and storage, etc. When investment isincreased 2.6-2.7 times, value will increase 3.0-3.2 times correspondingly (Pham, 1999).
Most of the legumes are processed for use as human food. Industrial use of legumesis limited. Very little quantity is exported. Aflatoxin problem is a constraint for export.
By-products from the processing of legumes (groundnut cake, soy cake, etc.) is utilizedchiefly as raw material for the production of animal feed; the research on utilization of themfor other industrial uses has not been seriously considered. Unfortunately, the quantity of theby-products is not so large, therefore every year Vietnam has to import a large quantity ofsoybean meal (300,000 mt) for use in producing animal feed.
Although Vietnamese legumes have numerous species, only a few of them (soybean,groundnut, mung bean and to a lesser degree, red cowpeas, black mung bean, white pea, and
- 287 -
other leguminous vegetables) are processed and utilized. The other leguminous crops areneglected although some of them have very high nutritive value and can become valuablecrops.
The modern legumes processing techniques have not been introduced and applied inVietnam: techniques of processing of soybean; production of soy protein (full-fat soy floursand grits, defatted or lecithinated, soy concentrates, soy protein isolates); production oftexturized products (spun and fiber-type products, extruder-texturized products); productionof dried soy milk and tofu; production of nut-like soy bean products (roasted, dessert topping,soy bean buffet); the production technology of peanut butter with international quality; thetechnology of processing of mung bean in industry scale. All the products processed fromthese techniques are imported from overseas.
Until now, all kinds of food for vegetarians (based mostly on legumes such as soybean,mung bean, groundnut, etc.) are imported from Taiwan, Hong Kong, and Singapore.
Although some research has been conducted on processing of legumes, rural peoplehave not adapted them. The processing in Vietnam is small scale and they are scattered allover the country.
PROPOSED PROSPECTS AND TRENDS OF DEVELOPMENT OFLEGUMES IN VIETNAM
Increasing the area for Leguminous Crops to Increase the Total ProductionSoybean area will be increased to 300,000 ha to increase production to 360,000 mt.
For groundnut, the area will be increased to 400,000-500,000 ha in 2005-10 from the presentlevel of 250,000 ha. New cultivation techniques will be used to stabilize and enhance theyield. Breeding will focus on developing new varieties with high-yield, good quality, goodresistance to the insects and good adaptation.
One ha of soybean can provide a quantity of protein enough for six persons per year.Therefore the increase in soybean area to 300,000 ha will provide protein source enough fortwo million persons and lipid source enough for five million persons every year. The mainrole of soybean is to solve the protein needs for human and domestic animal (to replace partof fishmeal) and to meet part of the demand for lipid in Vietnamese diet. Therefore, prioritywill be given for selecting soybean varieties with high protein. In addition, varieties suitablefor export (big size, uniform dimension, light yellow husk, etc.) should be selected andplanted in some areas specifically for export. Groundnut is also a promising crop becauseit has high economic value. It is an important food crop and an important source of proteinand lipid for most Vietnamese people, especially farmers. It can be planted easily and issuitable for the tropical climate. The forecast for production and export of soybean andgroundnut is given in Table 18.
Consumption of the plant-based food is the current trend. The numbers of vegetariansare increasing rapidly. People understand the value of plant-based food. People areconsuming more leguminous food instead of meat, seafood and other products. In thisconnection, processed soy foods and soy proteins will be very valuable.
Diversification of legume products will enable effective utilization. For example,protein content of various soy products differs tremendously (Figure 17). Strict qualitycontrol should be enforced through monitoring specifically aflatoxin level.
- 288 -
50% protein
70% protein90% protein
0% protein
4% protein8% protein
Table 18. Forecast of Production and Exportation of Groundnut and Soybean up to 2010
Crop UnitQuantity Rate of Increment
2000 2010 1996-2000 2001-10
Production*Groundnut
– Area 000 ha 260 320 2.48 2.10– Production 000 mt 300 380 4.6 2.7
*Soybean– Area 000 ha 110 120 1.92 0.87
Export*Groundnut 000 mt 160 280 7.7 5.7
Source: University of Agronomy, 1996.
Isolated Soy Protein Soy Protein Concentrate Soy Flour
Tofu Soy Milk Soy Oil
Figure 17. Protein Content of Soy Sources
Source: Hoogenkamp, 1998.
Through domestic and cooperative research with international centers production,aspects should be improved. Such improvement will result in more export, more profit forfarmers, and the country.
- 289 -
To limit the post-harvest losses, proper post-harvest technologies (storage,preservation, preliminary processing, processing, etc.) must be selected and applied.Integrated Pest Management IPM), drying, and micronizing technologies need to be selectedbased on the following:
– Low investment, low energy requirement, effectiveness and simplicity.– Suitable for different ecological areas and localities.– Effectively link traditional with modern techniques.
Finally, a national program on research, production and processing of legumes shouldbe set up to organize, to monitor, and to coordinate effectively the development ofVietnamese legumes so that they can contribute to the industrialization and modernizationof Vietnam agriculture in the new century.
REFERENCES
Bich Chi’s Factory. Dry Extrusion Cooking in Processing of Soybean and Nutritious Powderin Bich Chi’s Factory, Dong Thap Province (Vietnamese).
Chu, Pham Ngoc Son, et al., 1999. “Aflatoxin Contamination in Food and Feed in SouthVietnam”, CASE; Ho Chi Minh City.
Dong Thap Province, 1985. “Soybean – Local Standard 61 TCV-2-85” (Vietnamese).
Erickson, David R., 1989. Practical Handbook of Soybean, AOCS Press and UnitedSoybean Board, U.S.A.
FAO, 1993. “Use of Tropical Food and Oilseeds in agriculture and Food Industry”, Ha Noi(Vietnamese).
General Statistical Office, 1998. Statistical Yearbook 1997, Ha Noi (Vietnamese).
Hoang, Duc Nhu, 2000. “Production and Processing of Vegetable Oil”, Ho Chi Minh City(Vietnamese).
Hoang, Phuong. “Tofu”, An Giang Province (Vietnamese).
Hoogenkamp, Henk W., 1998. Vegetable Protein, Protein Technologies International, Inc.
Lan, Bui thi, 1999. Vietnam’s Agriculture in the Context of Regionalization andGlobalization: Opportunities and Challenges.
Le, van To, 1994. “The Mycotoxin Problem and Its Management in Grain in Vietnam”,ACIAR (Australian Council for International Agricultural Research) ProceedingsNo.60, 1995 (Post-harvest Technologies for Agricultural Products in Vietnam),Australia.
- 290 -
----------. Small-scale Processing of Agriculture Commodities to Reduce the Post-harvestLosses and Improve Live Condition of People in Vietnam, Ho Chi Minh City.
MARD. Vietnam Agriculture Before Its Opportunity of Investment and Development, HaNoi.
Ngac, van Dau, 1983. “Processing of Soybean and Groundnut into High Protein Food”, HaNoi (Vietnamese).
Ngo, The Dan, et al., 1999. “Soybean”, Ha Noi (Vietnamese).
Nguyen, Cong Huan, 1985. “Food Small Industry”, Ho Chi Minh City (Vietnamese).
Nguyen, Duc Tam, 1984. “Do It Yourself”, Tay Ninh Province (Vietnamese).
Nguyen, Huu Phuc, 1998. “The Traditional Food Fermentation Methods in Vietnam andAsian Countries”, Ho Chi Minh City (Vietnamese).
Nguyen, Khoa Chi, 1989. “Groundnut”, Ho Chi Minh City (Vietnamese).
Nguyen, van Thuong, et al., 1992. “Handbook of Nutritive Ingredients of VietnameseAnimal Feed”, Ha Noi (Vietnamese).
Nguyen, Van Tiep, et al., 1973. “Production Techniques of Canned Fruit and Vegetables”,Ha Noi (Vietnamese).
Pham, van Thieu, 1996. “Soybean – Planting and Processing Techniques”, Ha Noi(Vietnamese).
----------, 1999. “Mung Bean – Planting and Processing Techniques”, Ha Noi (Vietnamese).
Phan, Huu Trinh, et al., 1986. “Export Subsidiary Crop”, Ha Noi (Vietnamese).
Phan, Lieu, 2000. “Groundnut Production – The Main Trends in Processing andEnhancement of the Value of Groundnut in Vietnam”, Ho Chi Minh City(Vietnamese).
PHTI, Ha Noi, 1999. “Research on Manufacture of Full-fat Soybean Meal for AnimalHusbandry by Extrusion Technology”, Science Research Report, Ha Noi(Vietnamese).
PHTI-HCMC, 1997. “Food Processing Technology by Infra-Red Radiation”, ScienceResearch Report, Ho Chi Minh City (Vietnamese).
----------, 1999. “Management of Post-harvest Grain Quality”, Training Documents, Ho ChiMinh City (Vietnamese).
- 291 -
----------, 2000. “Research and Application of Advanced Technologies, Suitable Machinesto Process Agricultural Products with High Quality for Domestic Uses and Export”,Science Research Report, Ho Chi Minh City (Vietnamese).
Pro Soya Inc. Advanced Soy Milk Technology, Canada
Quach, Dinh, et al., 1996. “Post-harvest Technology and Processing of Fruit andVegetables”, Ha Noi (Vietnamese).
Quang, Nam, 1988. “The Popular Home-made Techniques”, Da Nang Province(Vietnamese).
Tan Binh Oil Factory. “Processing Line of Refined Vegetable Oil Production”, Ho Chi MinhCity (Vietnamese).
Thio, Goan Loo, 1971. Small-scale Processing of Soybeans and Some Applications, Bulletin294 of the Department of Agricultural Research, Koninklijk Institute, Voor De Tropen,Amsterdam.
Tran, Khac Thi, et al., 1995. “The Techniques of Planting and Exporting of ExportVegetables”, Ha Noi (Vietnamese).
Tran, van An and Duong Thanh Liem, 1996. The Aflatoxcosis Problem and Management ofAflatoxin in Feed in Vietnam, ACIAR Technical Report 3, Australia.
Tran, van An, et al., 1997. “Realization of An Immunoaffinity Gel for Aflatoxin B1Quantitative Determination”, Science Research Report, Ho Chi Minh City.
----------, 1999. “Pesticides Residue Monitoring in Vegetables – Study and Application ofRapid Biological Pesticides Residue Test (RBPR) in Vietnam”, Science ResearchReport, Ho Chi Minh City (Vietnamese).
Truong, thi Hoa, 1994. “Development and Improvement of Baby Food in Vietnam”, ScienceResearch Report, FIRI, Ha Noi.
University of Agronomy No. I., 1996. “Industrial Crops”, Ha Noi (Vietnamese).
Vo, Cong Hau, et al., 1995. “Groundnut”, Ho Chi Minh City (Vietnamese).
Watanabe, Tokuji, et al., 1984. The Book of Soybean, Japan Publications, Inc., Japan.
- 295 -
APO Seminar on Processing and Utilization of Legumes, 9 - 14 October 2000,Japan
1. LIST OF PARTICIPANTS, RESOURCE SPEAKERSAND SECRETARIAT
A. PARTICIPANTS
Country Name/Official Address
Bangladesh Dr. Md. AmiruzzamanPrincipal Scientific OfficerPostharvest Technology DivisionBangladesh Agricultural Research InstituteBari, JoydebpurGazipur 1701
Republic of China Mr. Wen-Lian ChenSenior Food ScientistFood Industry Research and Development Institute(FIRDI)331 Food Rd., Hsin-chuTaiwan 300
India Dr. Jarnail SinghProfessorDepartment of Processing and Agricultural StructuresCollege of Agricultural EngineeringPunjab Agricultural UniversityLudhiana
Dr. Nawab AliProject DirectorSoybean Processing and Utilization CentreCentral Institute of Agricultural EngineeringNabi Bagh, Berasia RoadBhopal 462038
Indonesia Dr. Ignatius SuhartoDeanFaculty of Industrial TechnologyCatholic University of ParahyanganJl. Ciumbuleuit 94-96Bandung 40141, West Java
- 296 -
Islamic Republic of Iran Dr. Mohammad Reza JahansoozStaff Member andSecretary of Pulses ResearchFaculty of AgricultureThe University of TehranKaraj
Republic of Korea Dr. Suk-Ha LeeAssistant ProfessorDivision of Plant ScienceSeoul National University103 Seoudun-DongKwonsun-Gu, Suwon 441-744
Malaysia Ms. Norijah Mohd NorAssistant Agriculture OfficerDepartment of AgricultureKompeks Pertanian Bukit Temiang02400 Beseri Perus
Mongolia Ms. Enkhtaivan GombosurenHeadDepartment of Food Processing and ServicesInstitute of Food TechnologyMongolian Technical UniversityUlaanbaatar 210646/520
Nepal Dr. Hari D. LekhakAssociate ProfessorCentral Department of BotanyTribhuvan UniversityKirtipur, Kathmandu
Pakistan Ms. Saeeda RazaSenior Scientific Officer and Programme LeaderFood Technology and Research LabsNational Agriculture Research CentrePakistan Agricultural Research CouncilPark Road, Chak ShehzadP. O. Box N1HIslamabad
Philippines Dr. Olivia M. Del RosarioUniversity ResearcherInstitute of Food Science and TechnologyUniversity of the Philippines at Los Baños (UPLB)College Laguna
- 297 -
Sri Lanka Dr. Nandanie Daya EdiriweeraHead, Agro and Food Technology DivisionIndustrial Technology Institute (ITI)363 Bauddhaloka MawathaColombo 7
Vietnam Mr. Le Thanh HiepLaboratory ManagerPost Harvest Technology Institute45 Dinh Tien Hoang St., District 1Ho Chi Minh City
B. RESOURCE SPEAKERS (alphabetical)
Dr. Saipin ManeepunDirectorInstitute of Food Research and Product DevelopmentKasetsart UniversityP. O. Box 1043, KasetsartBangkok 10903Thailand
Dr. Akinori NoguchiDirectorCrop Production and Post Harvest Technology Division(Research Planning and Coordination Division at present)Japan International Research Center for Agricultural Sciences (JIRCAS)Ministry of Agriculture, Forestry and Fisheries (MAFF)1-2 Owashi, Tsukuba CityIbaraki Pref., 305-8686Japan
Dr. Sundar ShanmugasundaramPlant Breeder and DirectorProgram I – Vegetables in Cereal-based SystemAsian Vegetable Research and Development CenterP. O. Box 42, ShanhuaTainan 741, TaiwanRepublic of China
C. SECRETARIAT
AICAF Mr. M. NakajimaManagerInternational Cooperation Division
- 298 -
Association for International Cooperation of Agriculture and Forestry (AICAF)19, Ichibancho, Chiyoda-kuTokyo 102-0082Japan
Tel: (813)3263-5208Fax: (813)3234-5137
APO Mr. Teruo MiyakeDirectorAgriculture Department
Dr. Muhammad SaeedProgram Officer (Agriculture)Agriculture Department
Asian Productivity OrganizationHirakawa-cho Dai-ichi Seimei Building 2F1-2-10, HirakawachoChiyodaku, Tokyo 102-0093, Japan
Presentation and Discussion on Topic I: Present Situation andEconomic Importance of Legumes in Asia and Pacific Region
by Dr. Sundar ShanmugasundaramAfternoon Presentation and Discussion on Topic II: Traditional Processing
and Utilization of Legumesby Dr. Saipin Maneepun
Presentation and Discussion on Topic III: Modern Processing andUtilization of Legumes – Recent Research and IndustrialAchievements in Soybean Foods in Japan –
by Dr. Akinori Noguchi
Tues., 10 Oct.Forenoon Presentation of Country Papers by ParticipantsAfternoon Continuation of Presentation of Country Papers by Participants
Wed., 11 Oct.Forenoon Presentation of Country Papers by ParticipantsAfternoon Continuation of Presentation of Country Papers by Participants
Thurs., 12 Oct.Forenoon Visit National Food Research InstituteAfternoon Visit Fuji Oil Co., Ltd.
Fri., 13 Oct.Forenoon Visit Taishi Food Inc.Afternoon Leave Utsunomiya for Tokyo


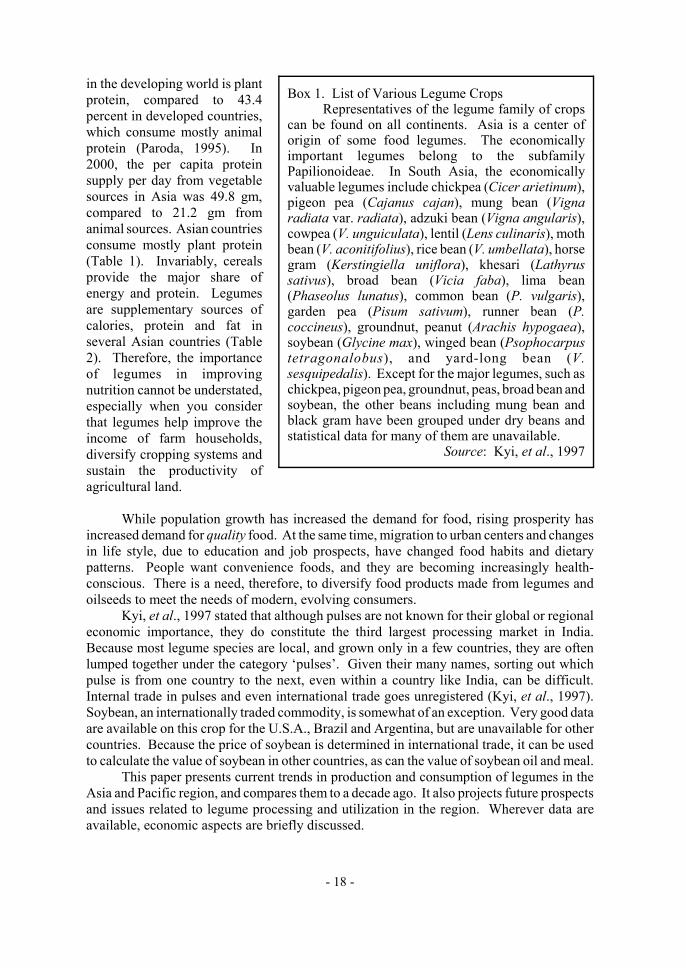


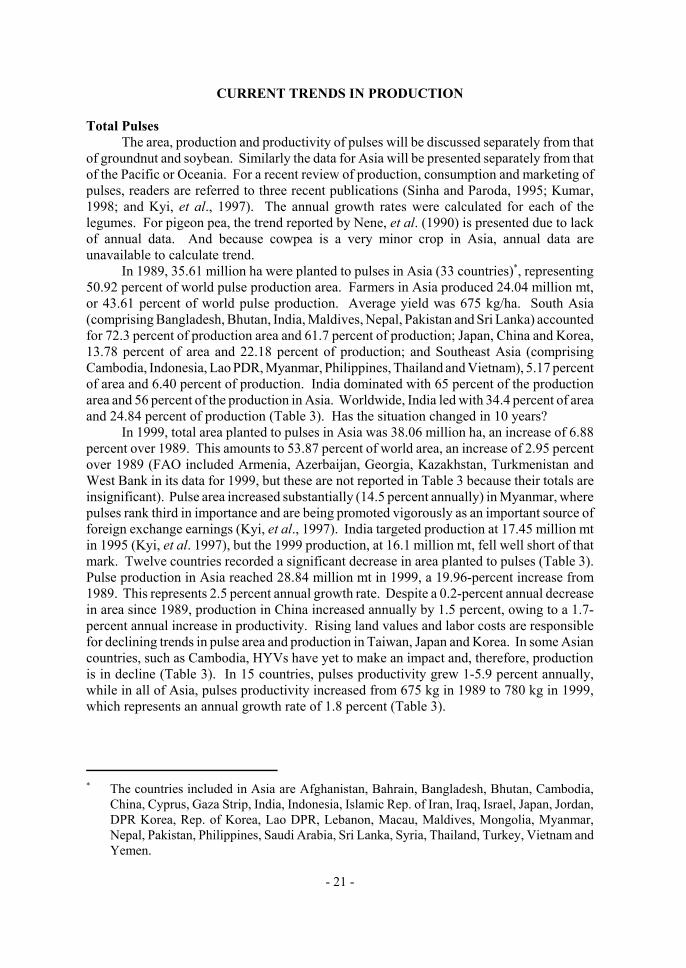

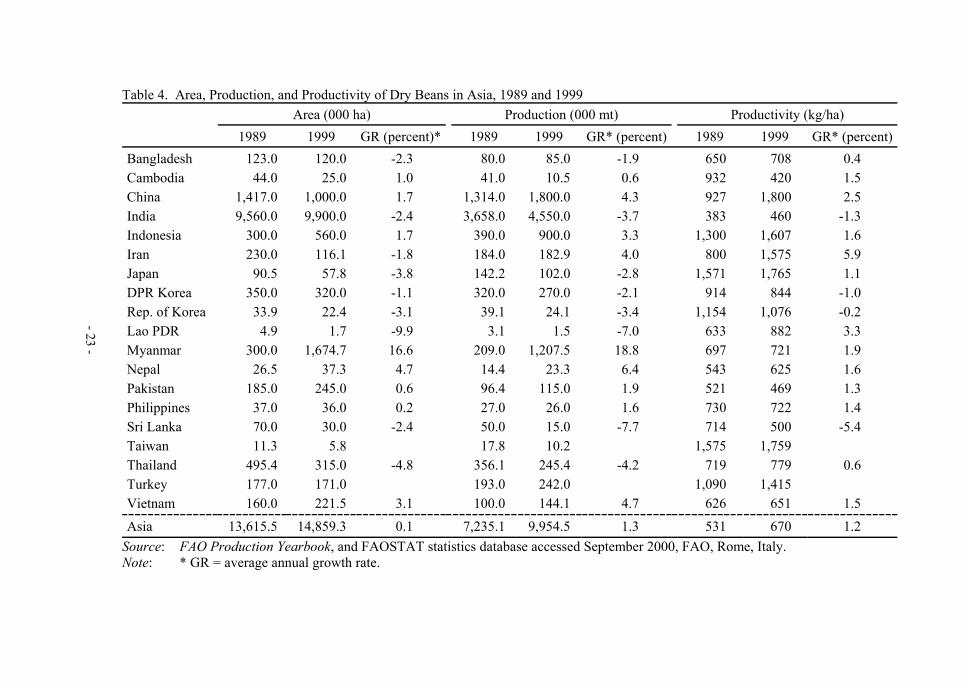
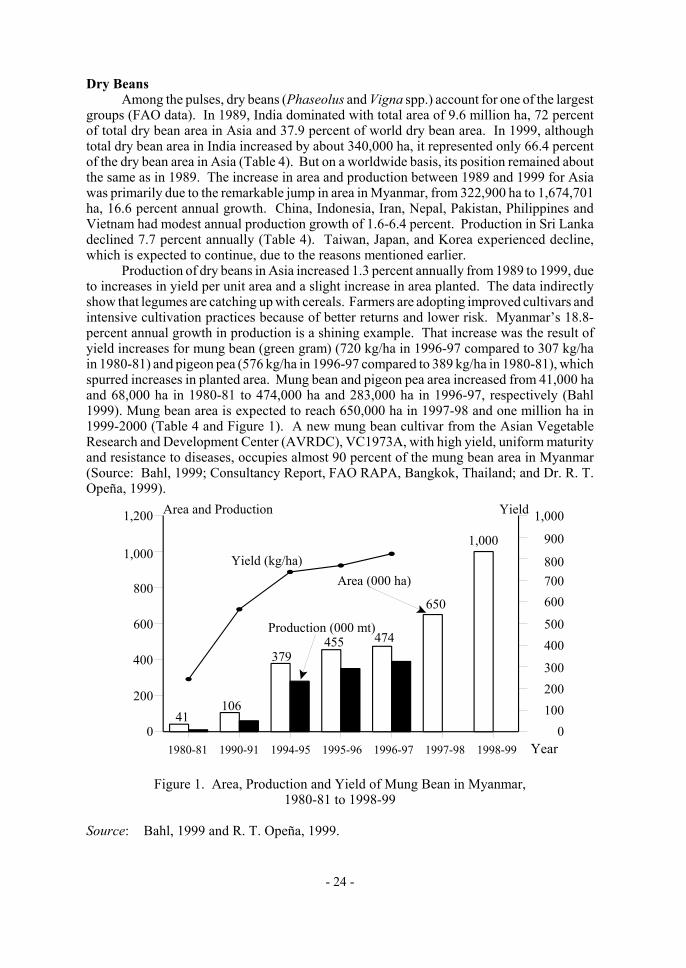


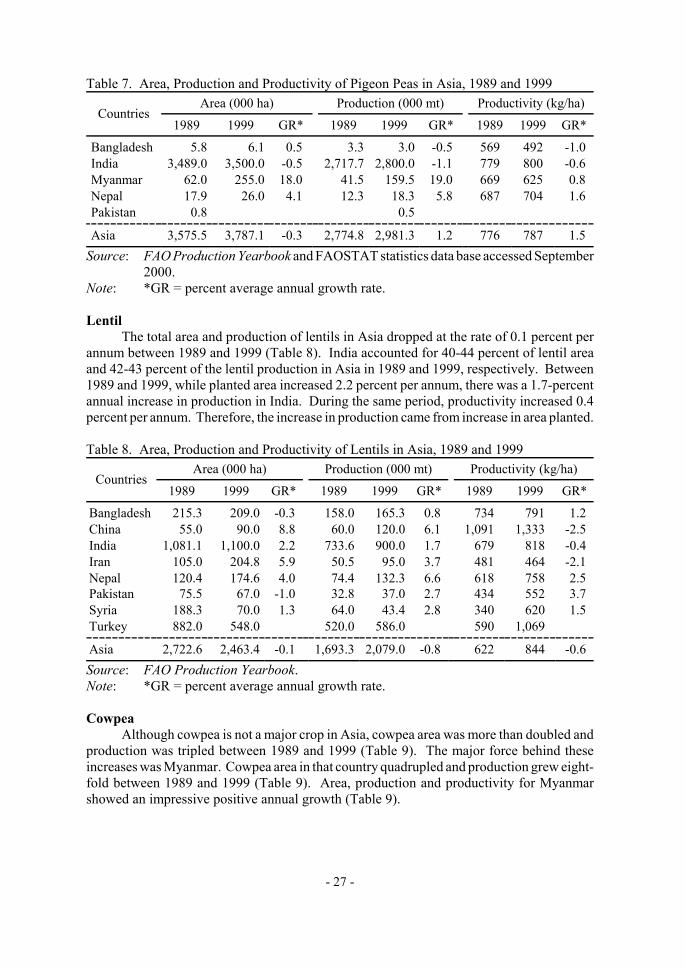
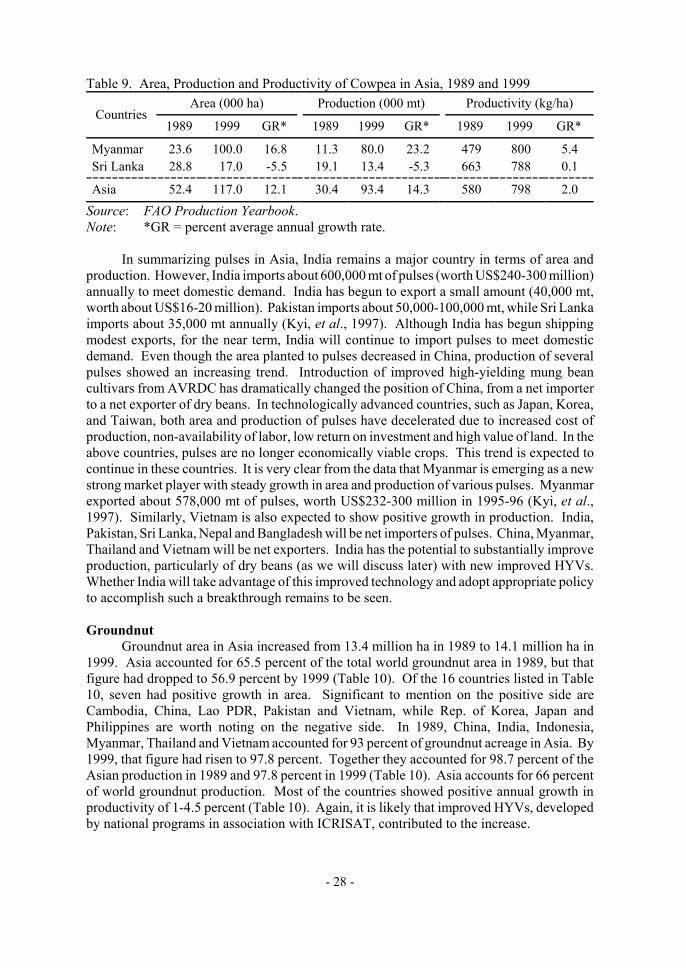


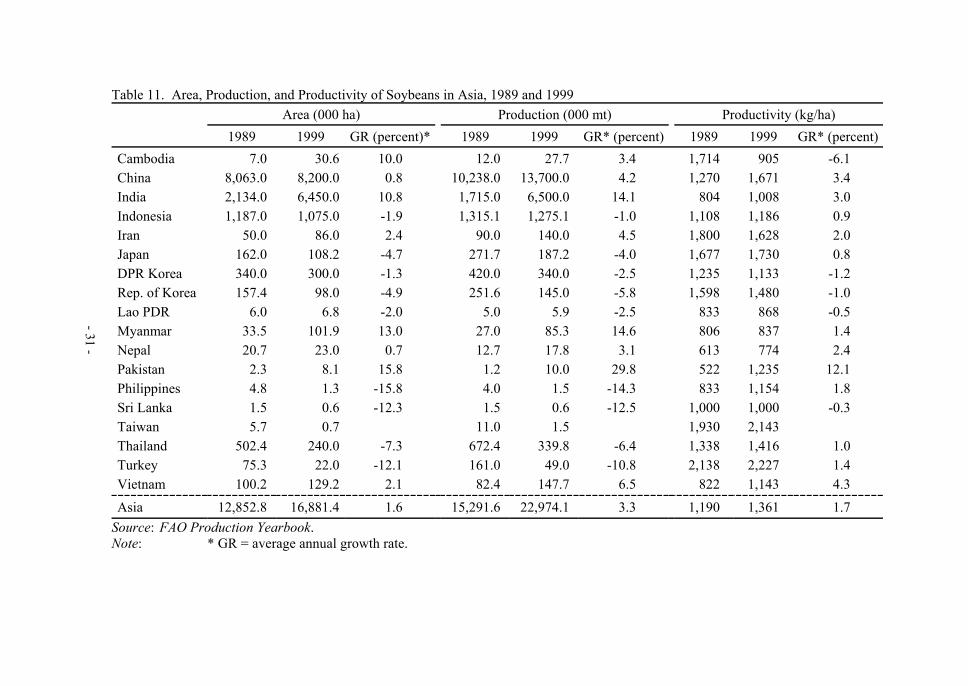
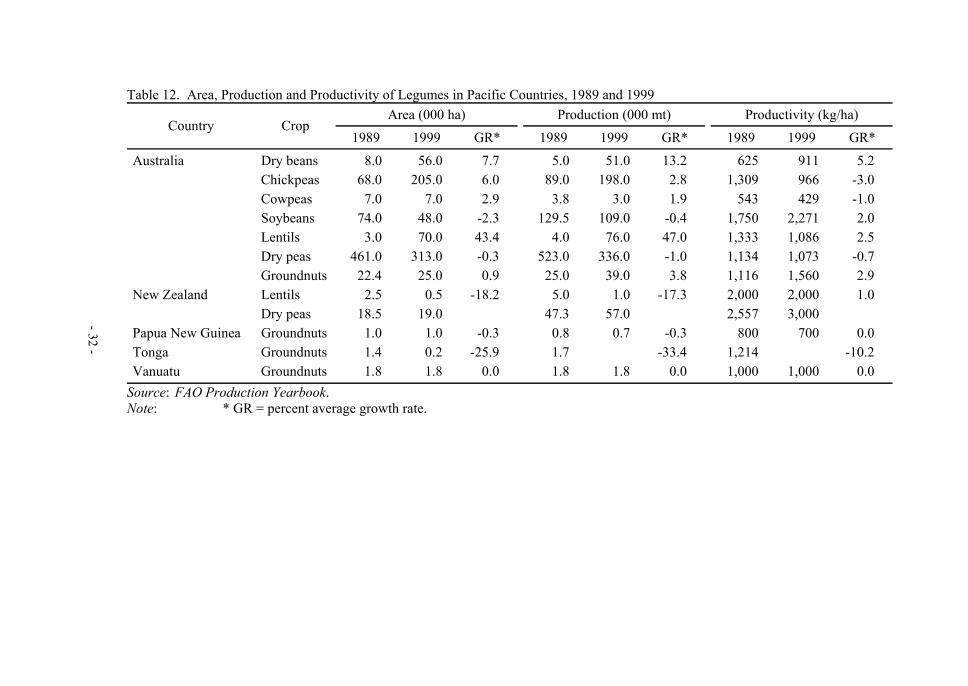

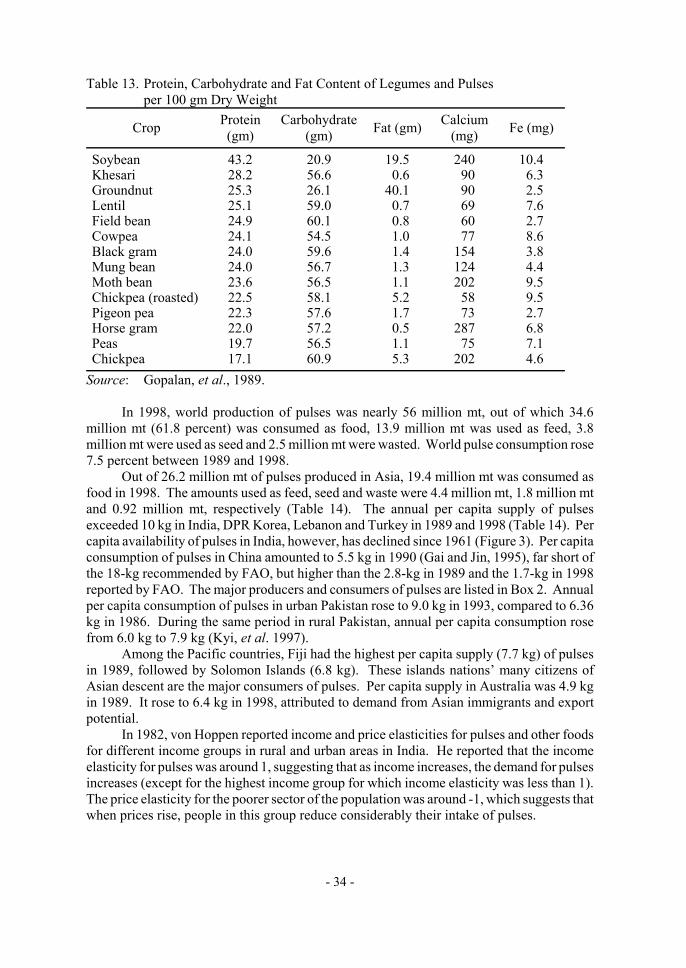
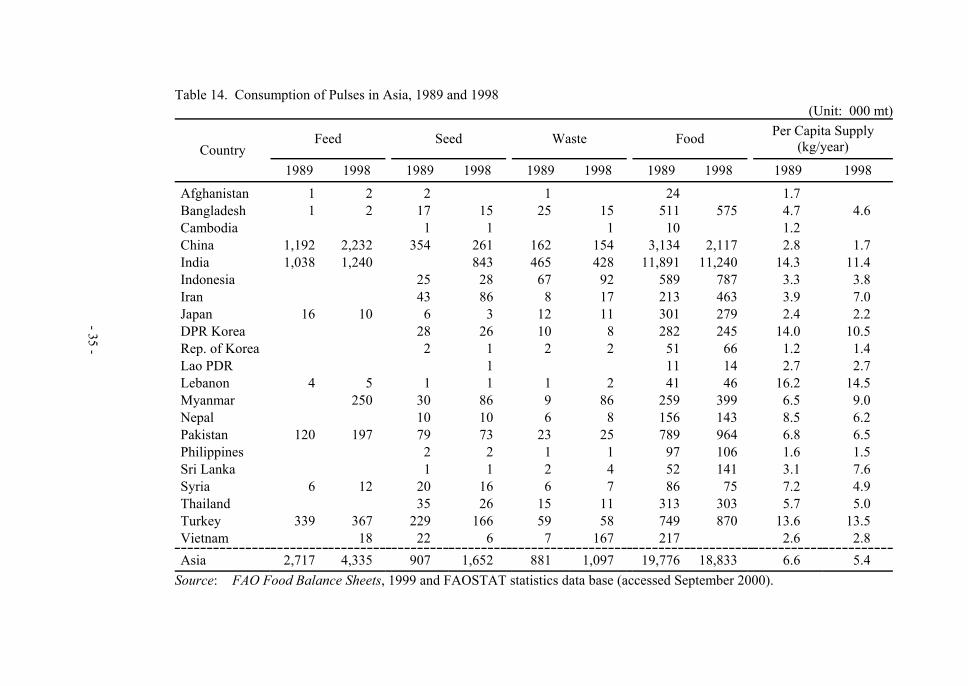

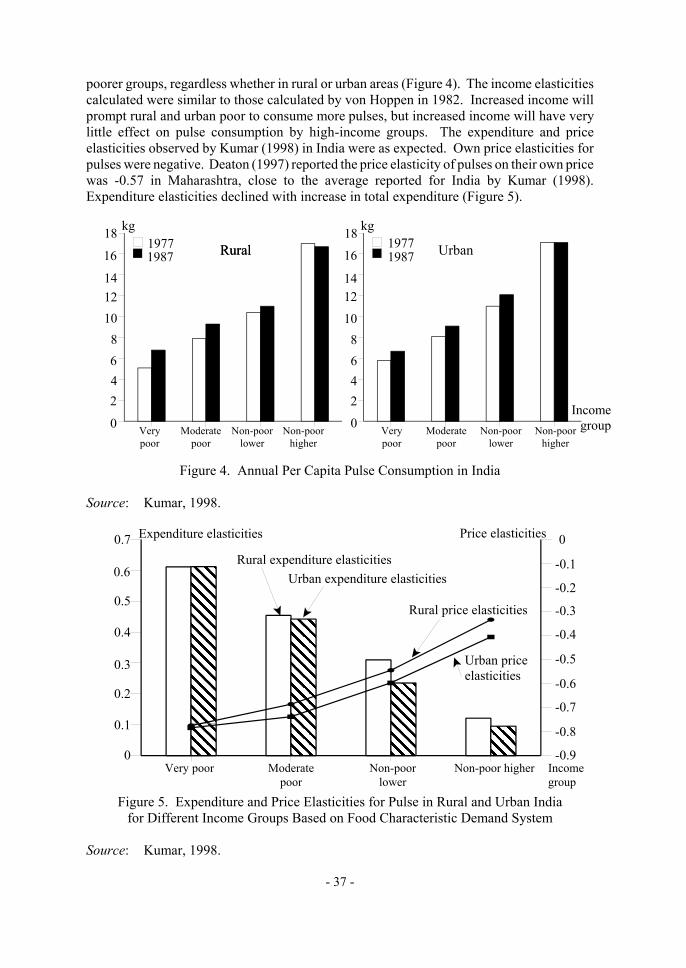
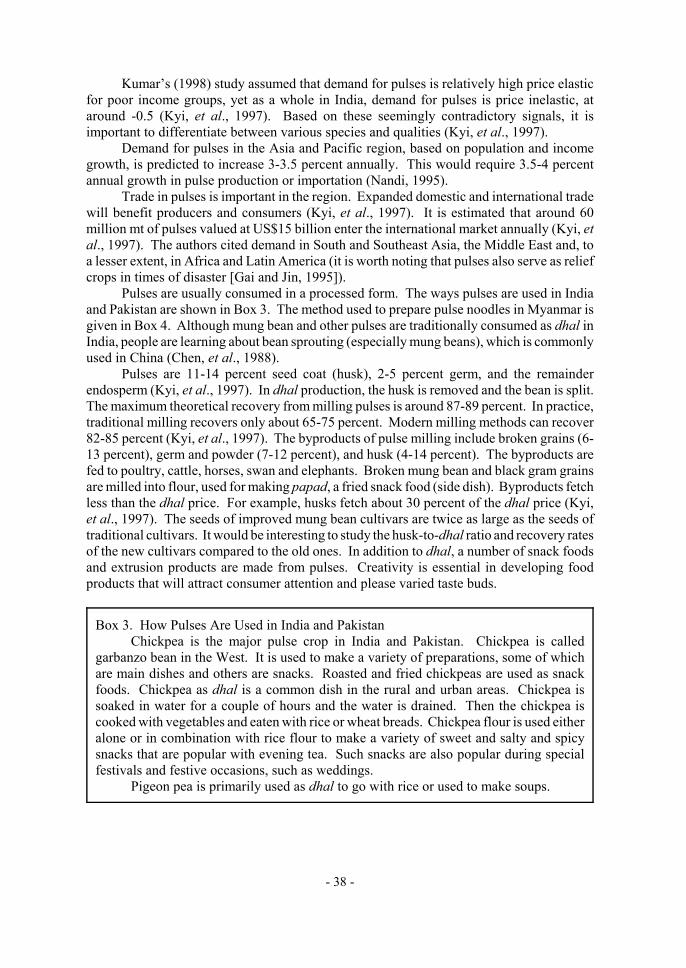
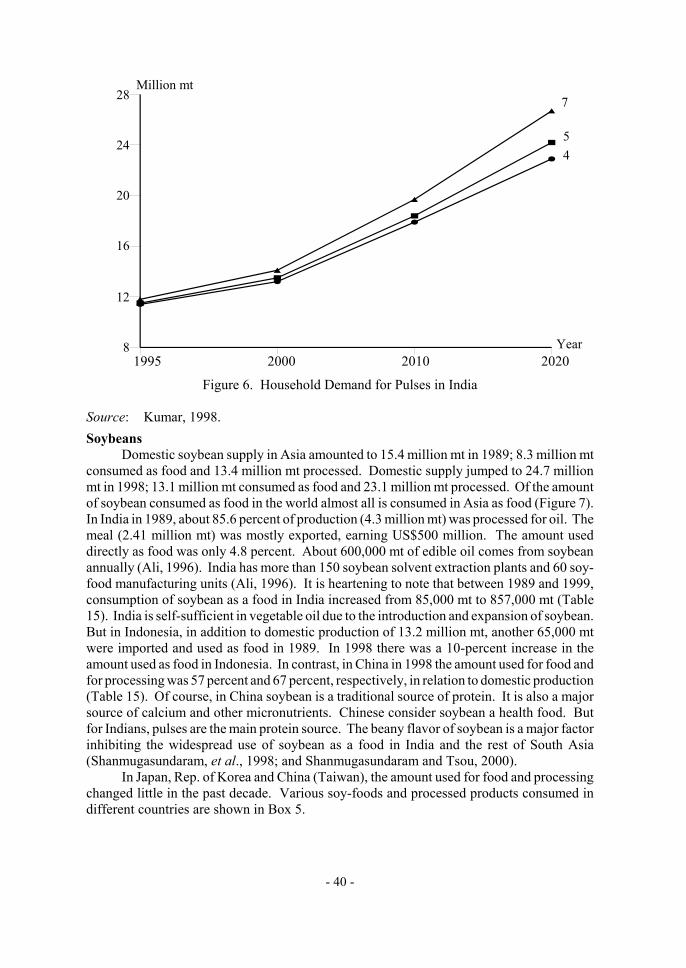
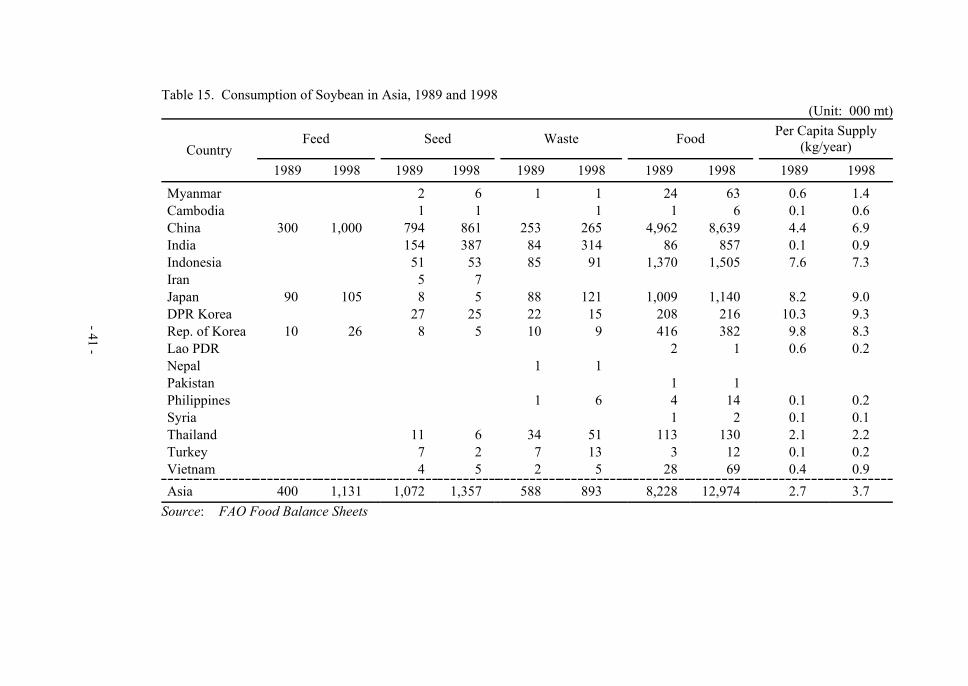
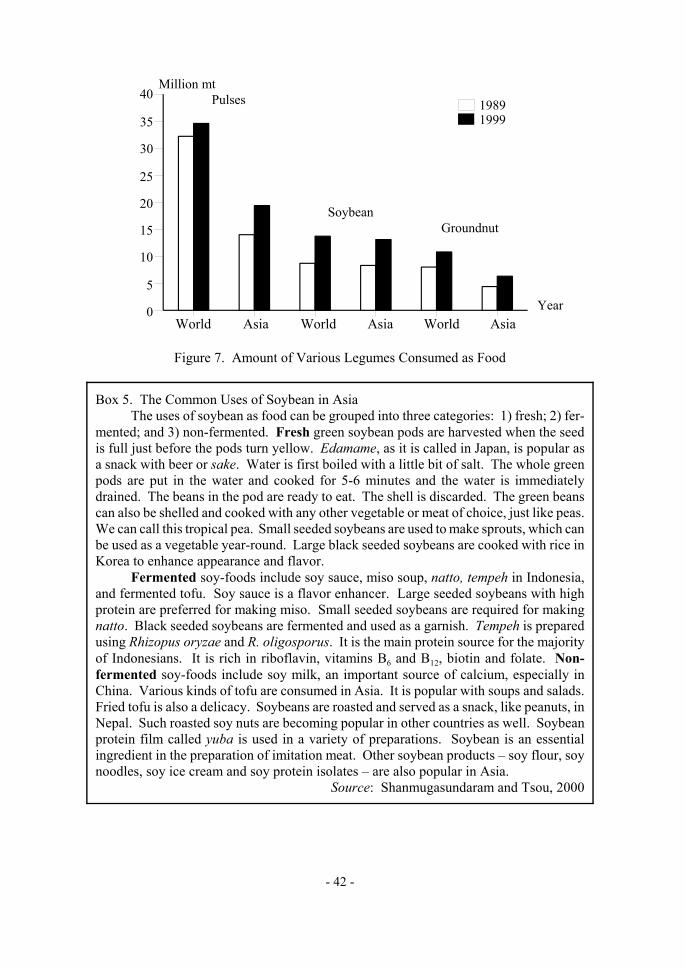

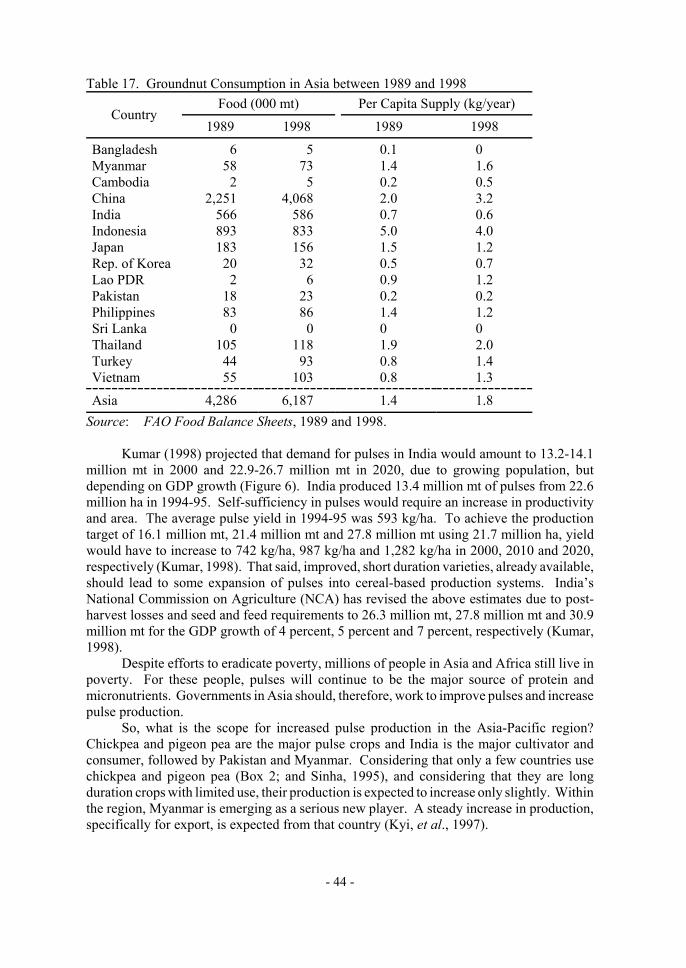


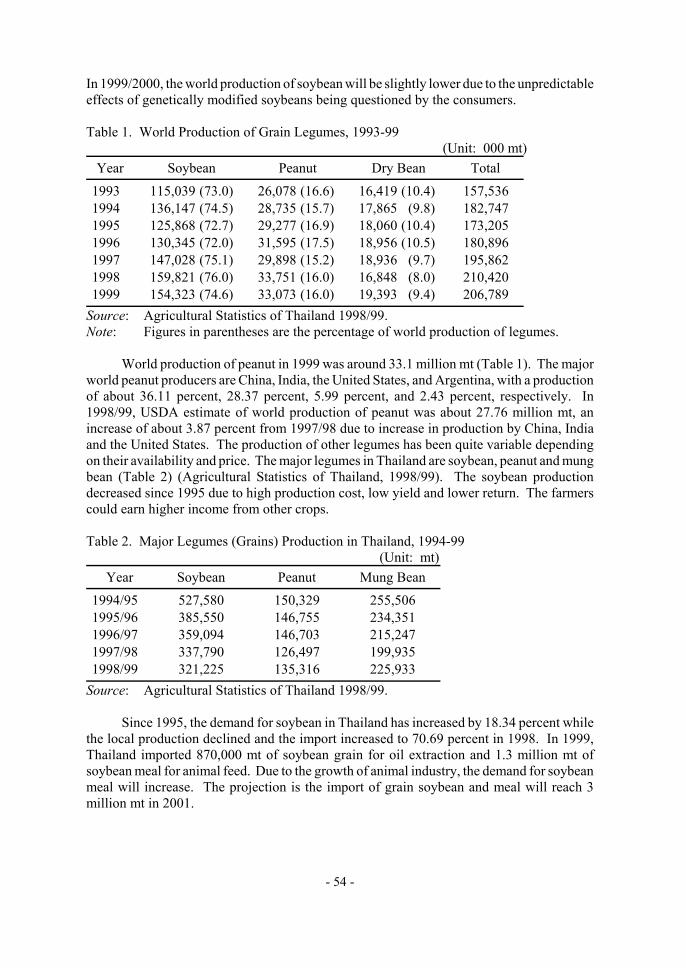
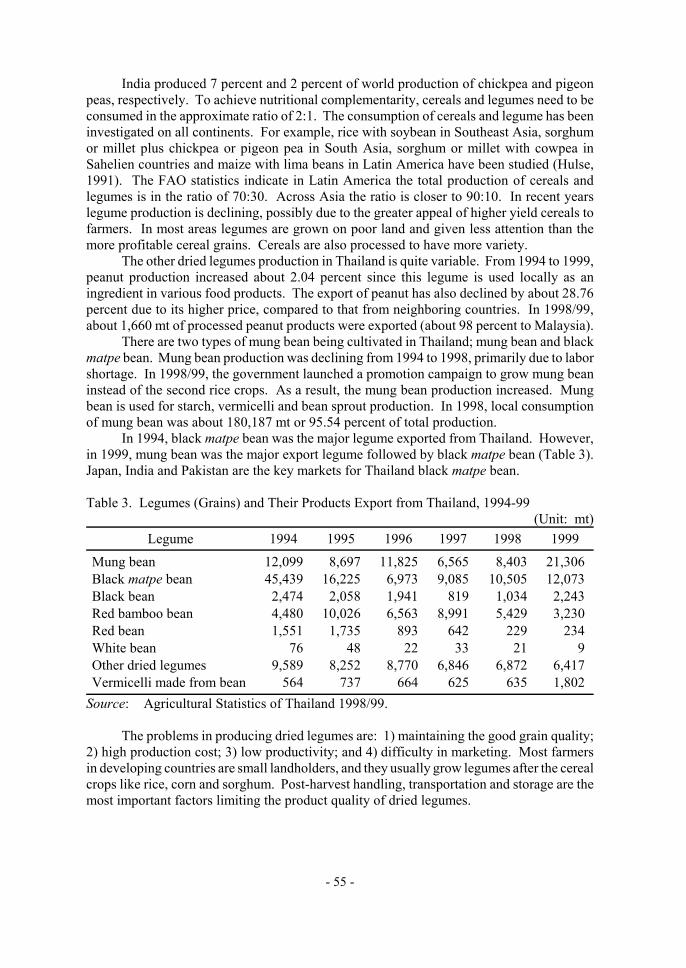


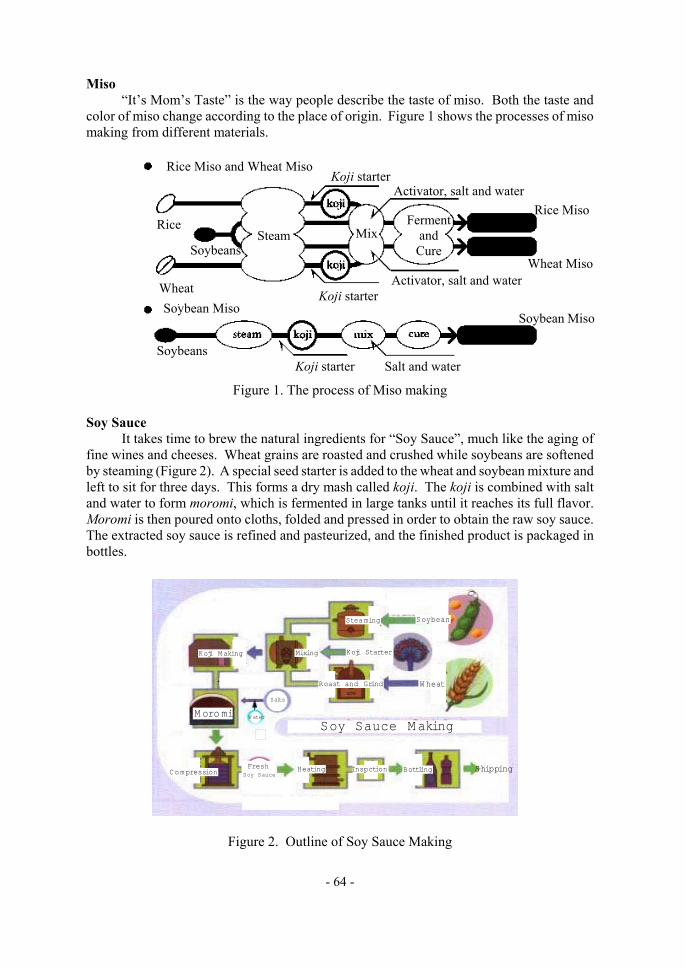
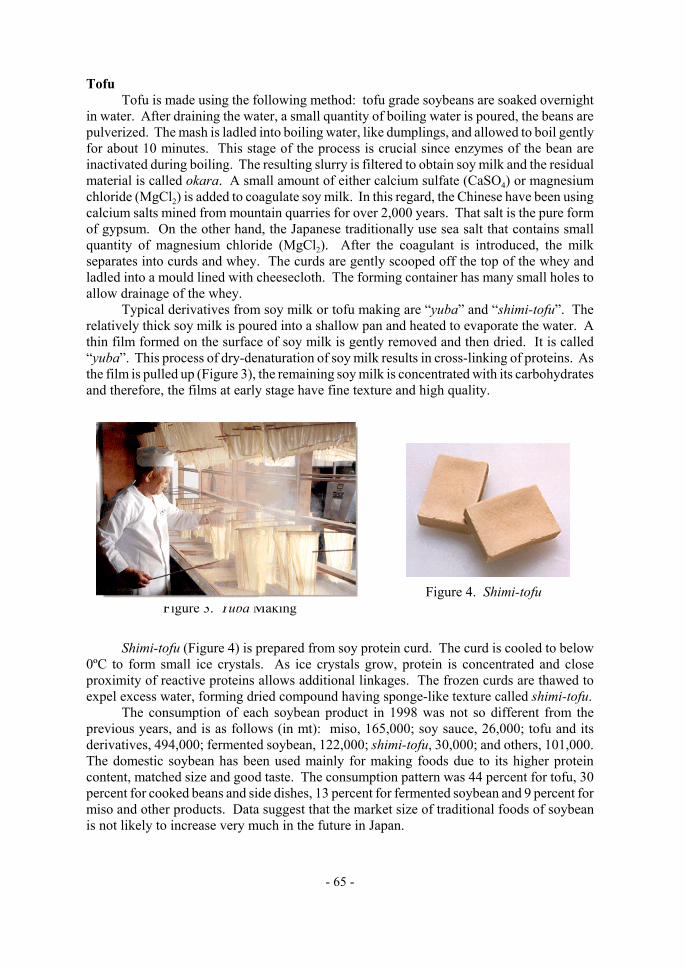
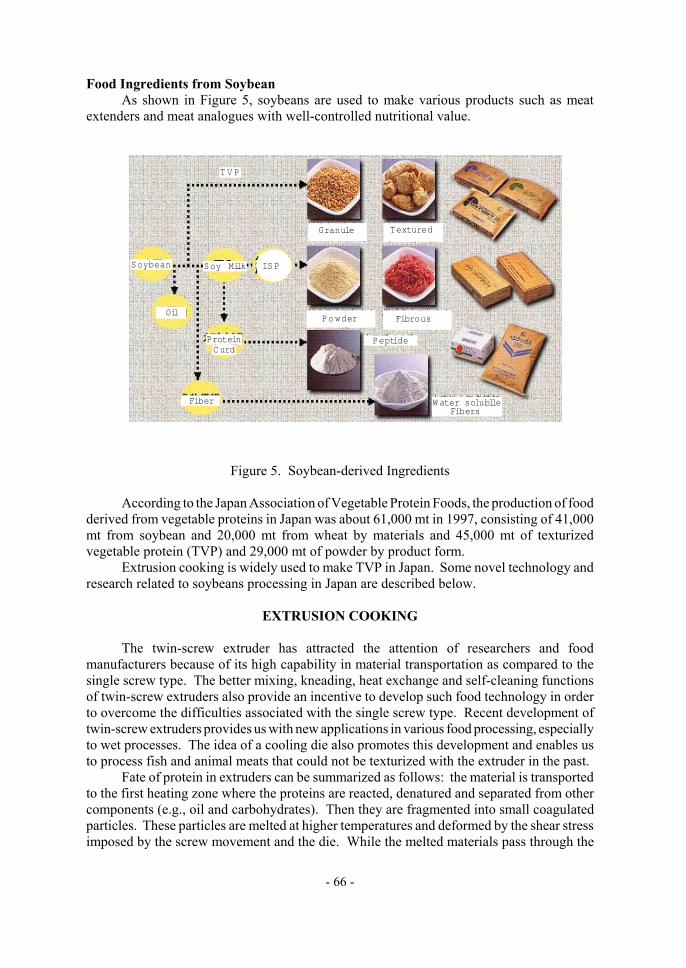
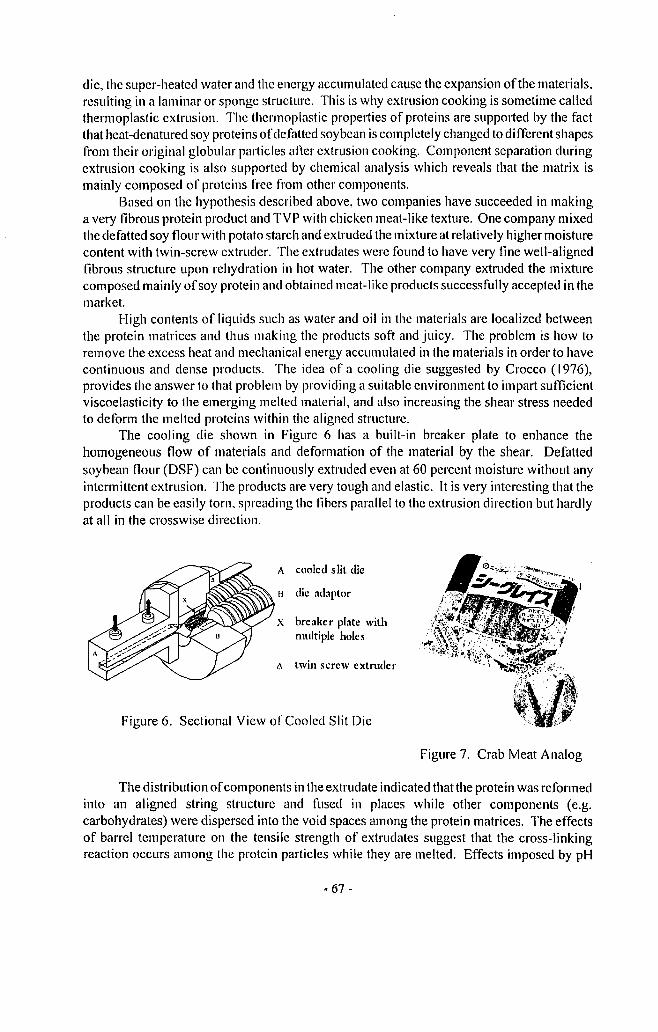


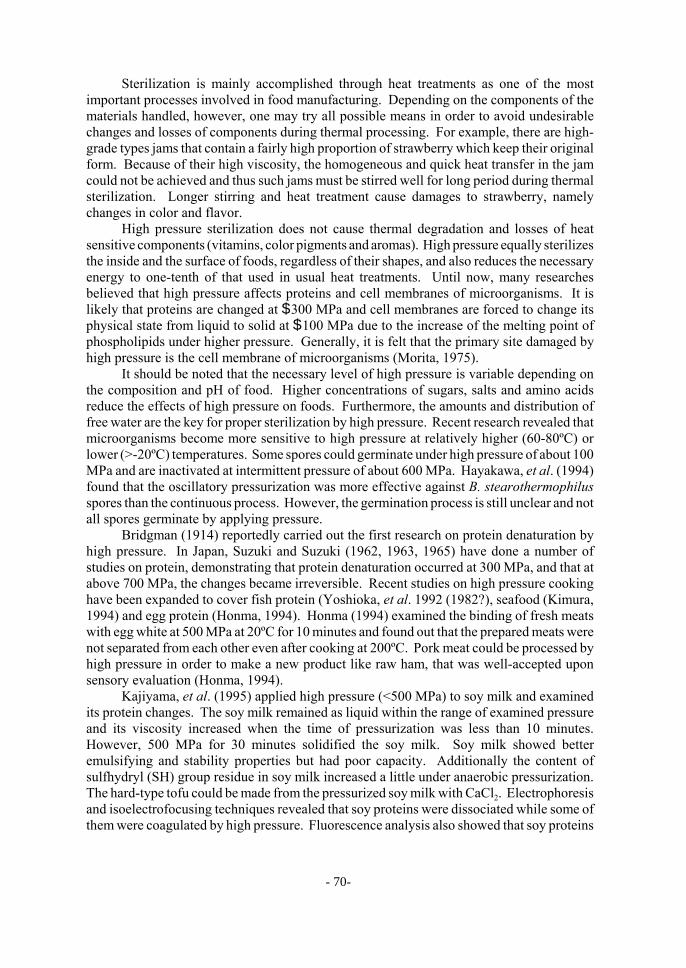

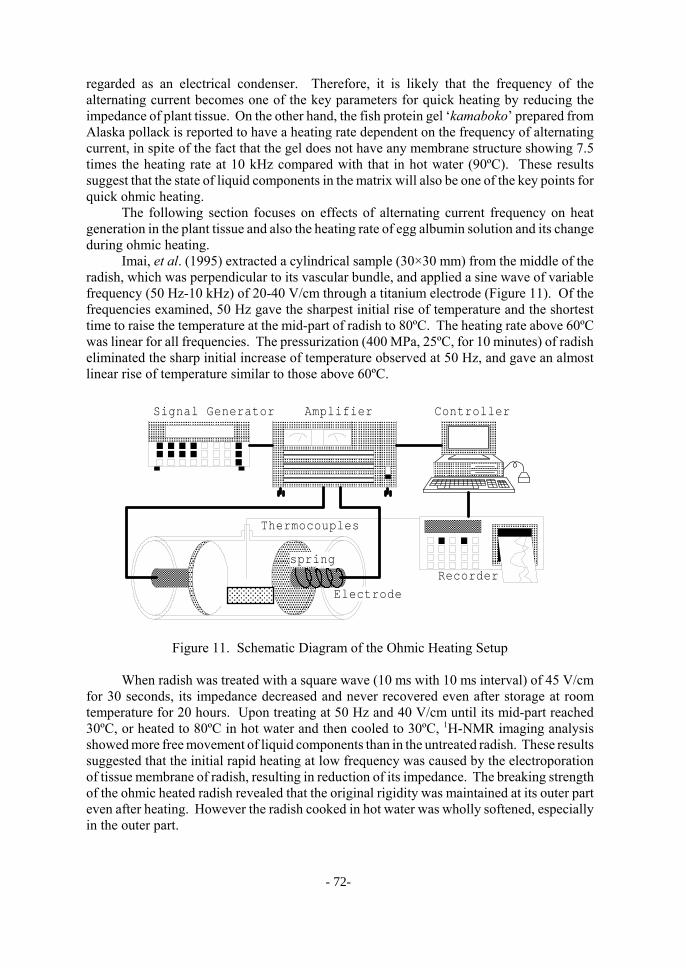


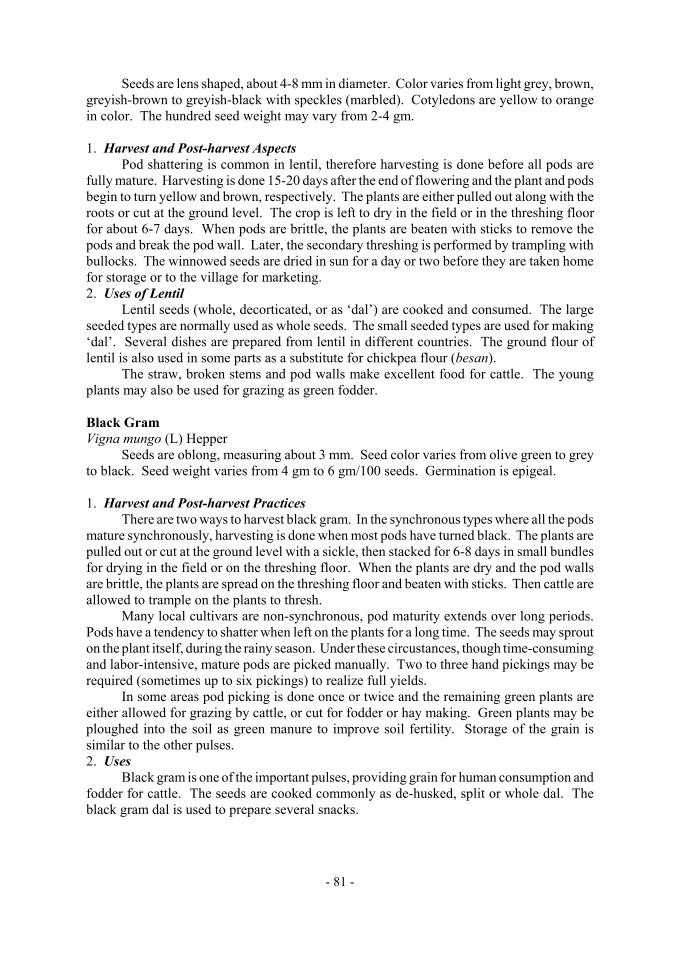
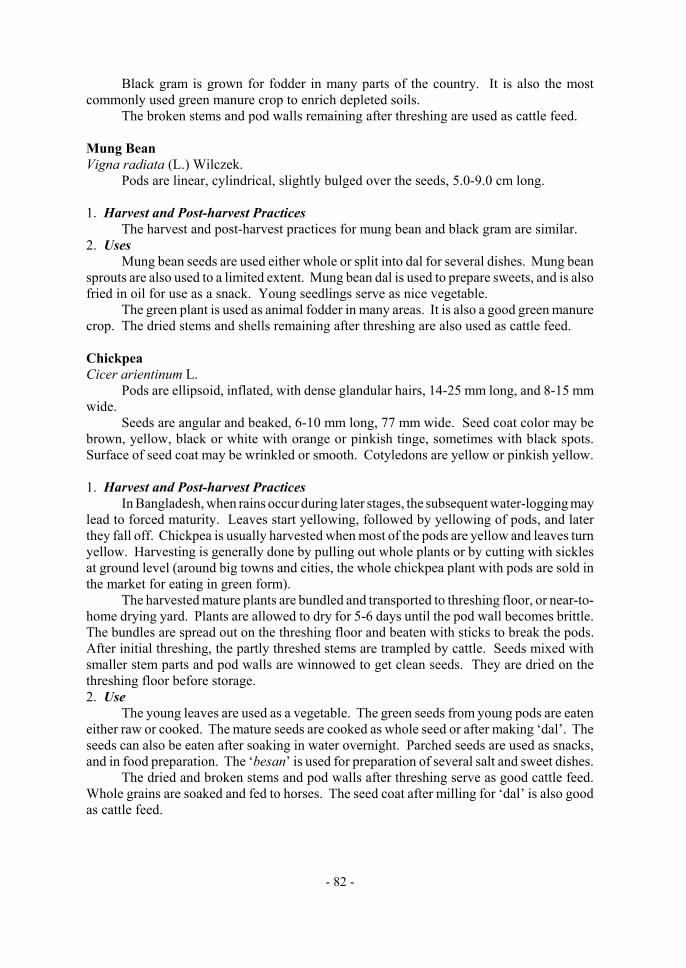
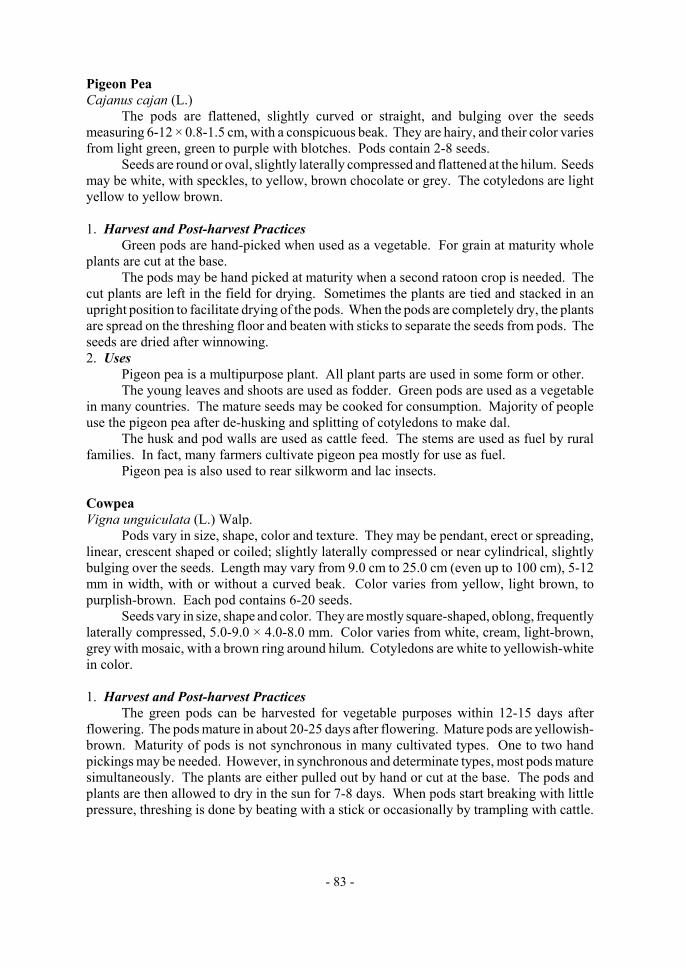
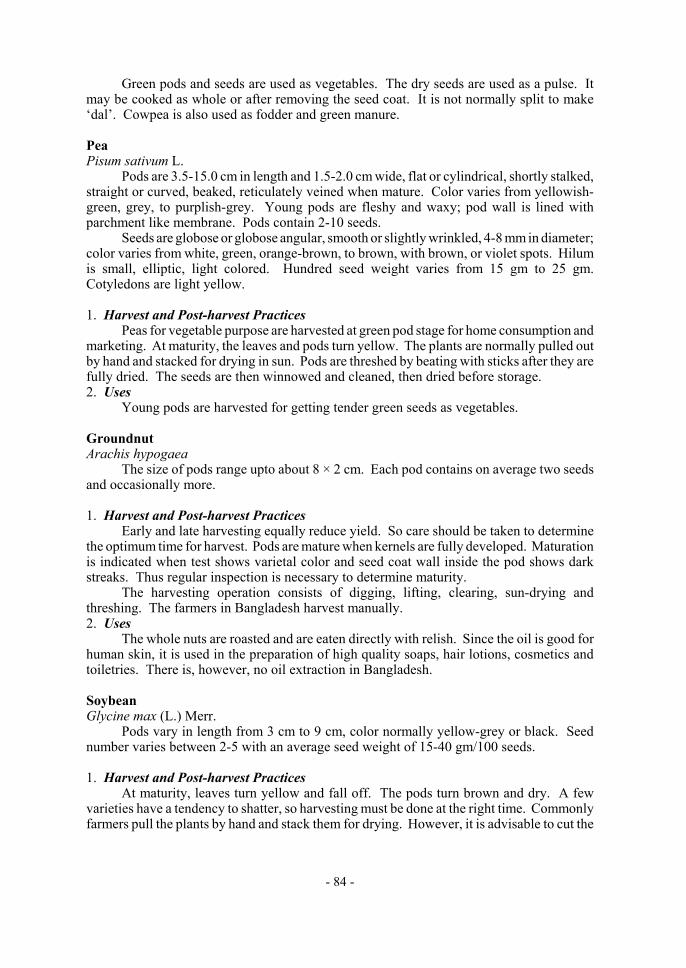
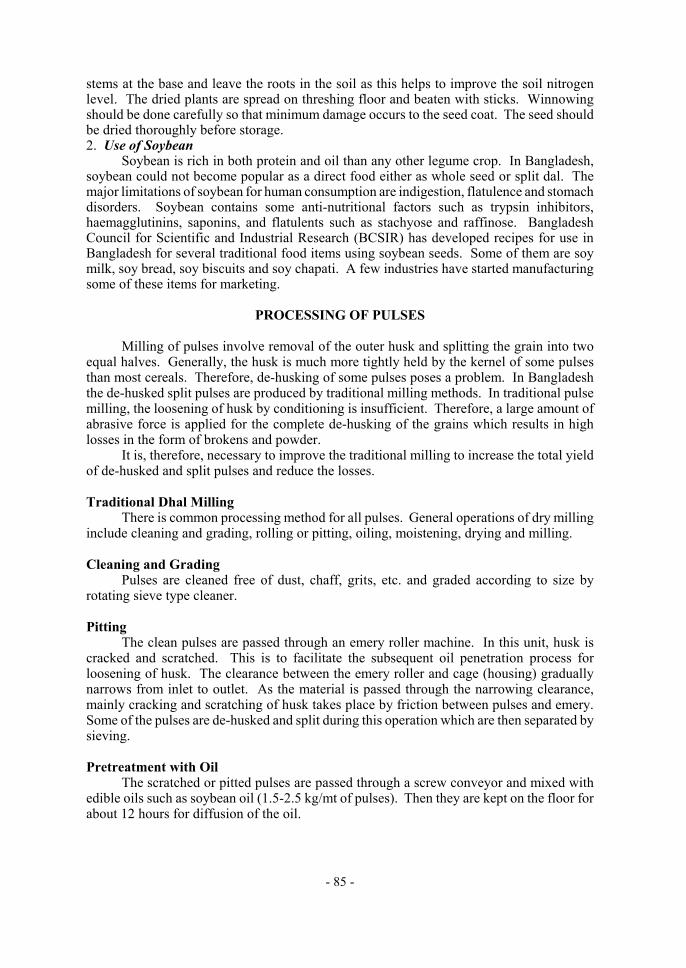


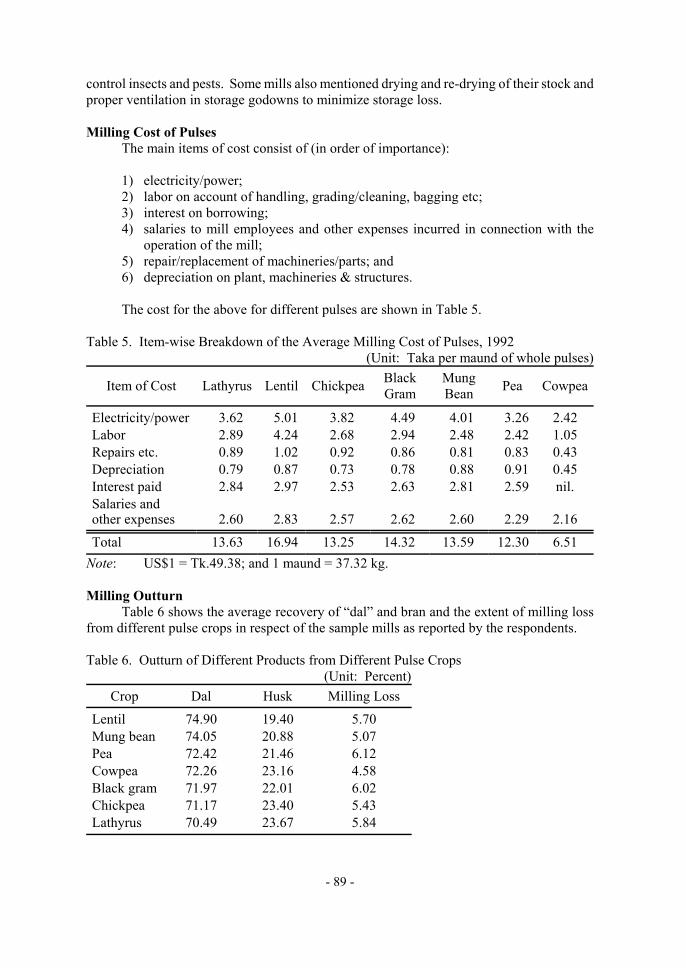

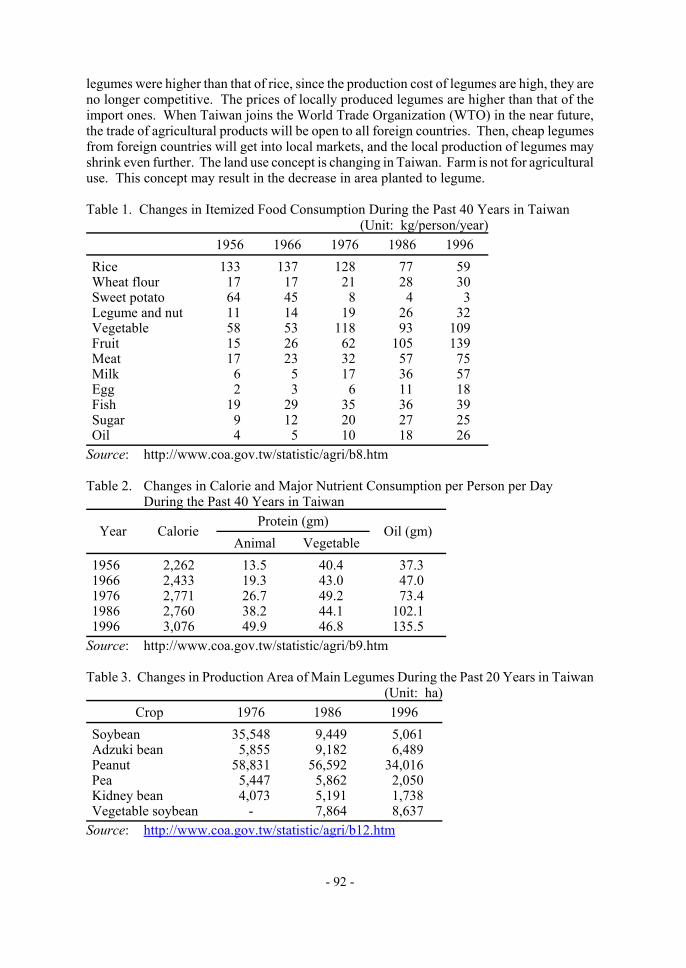


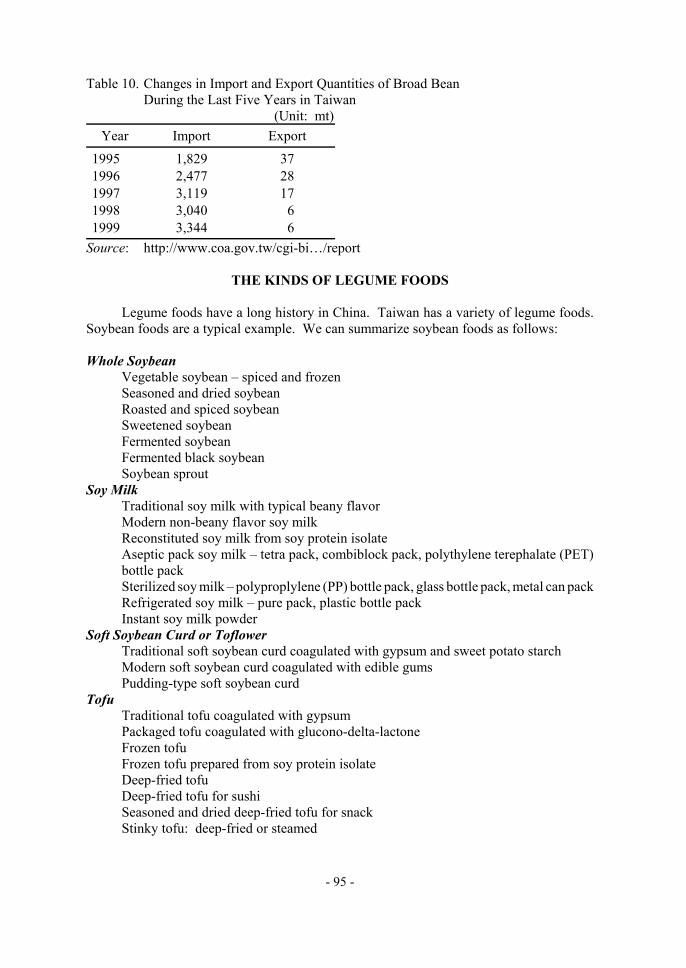
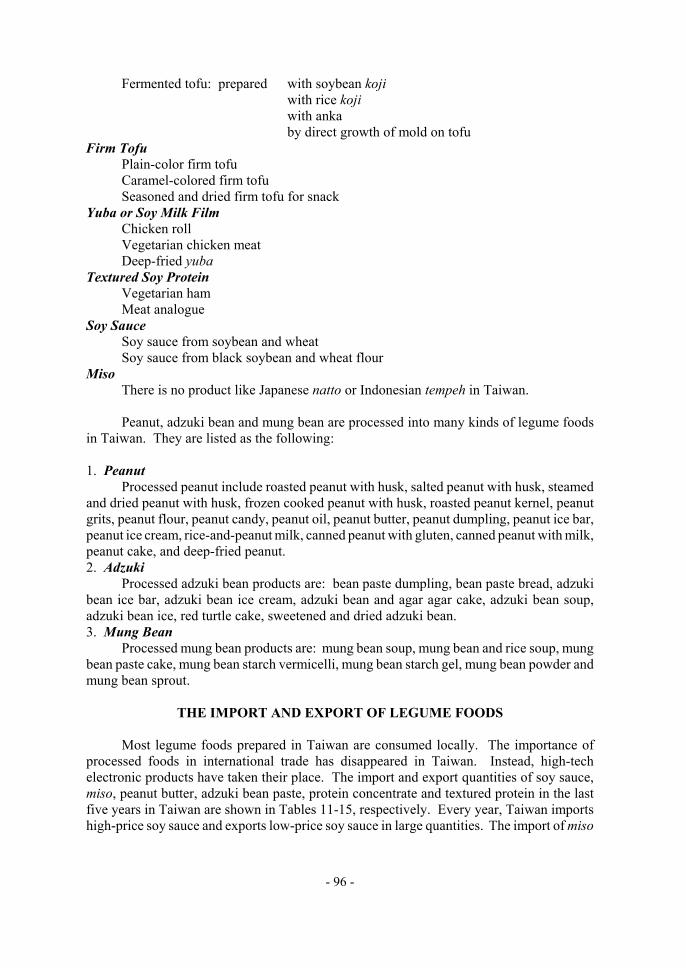
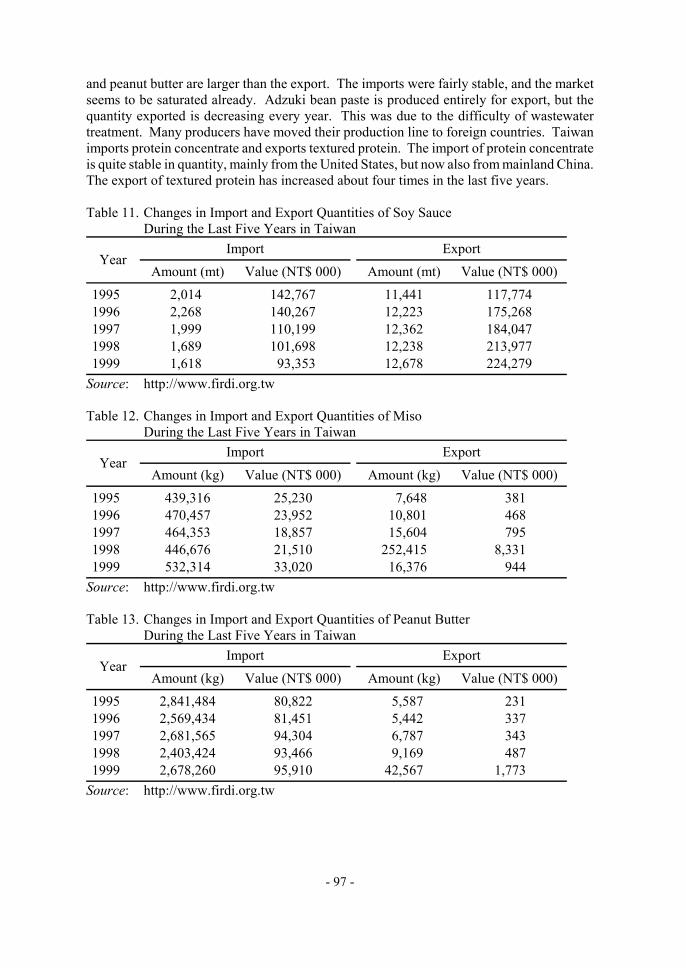
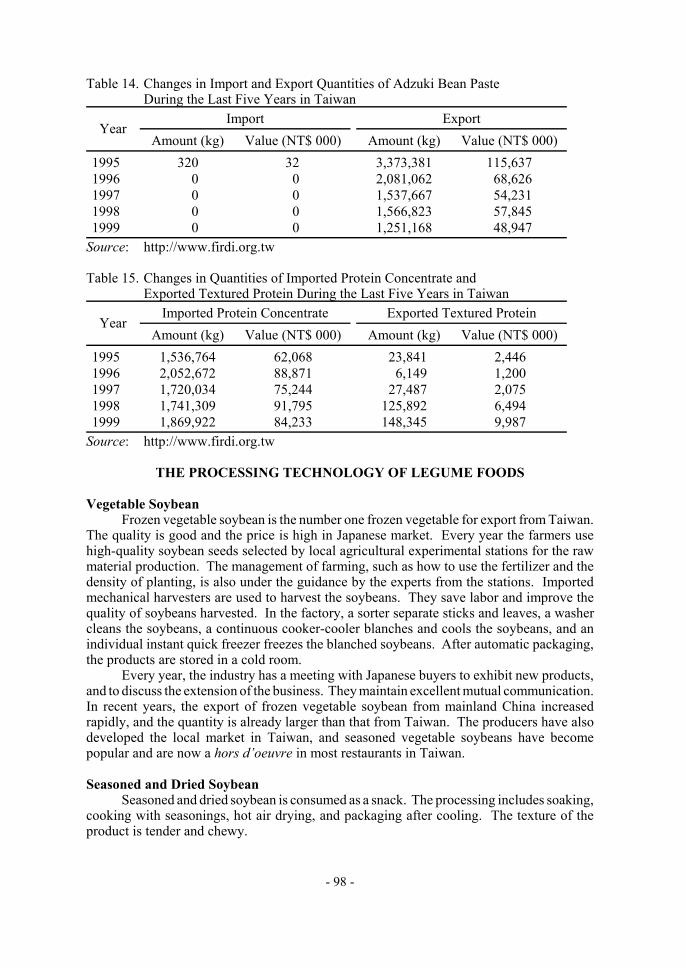


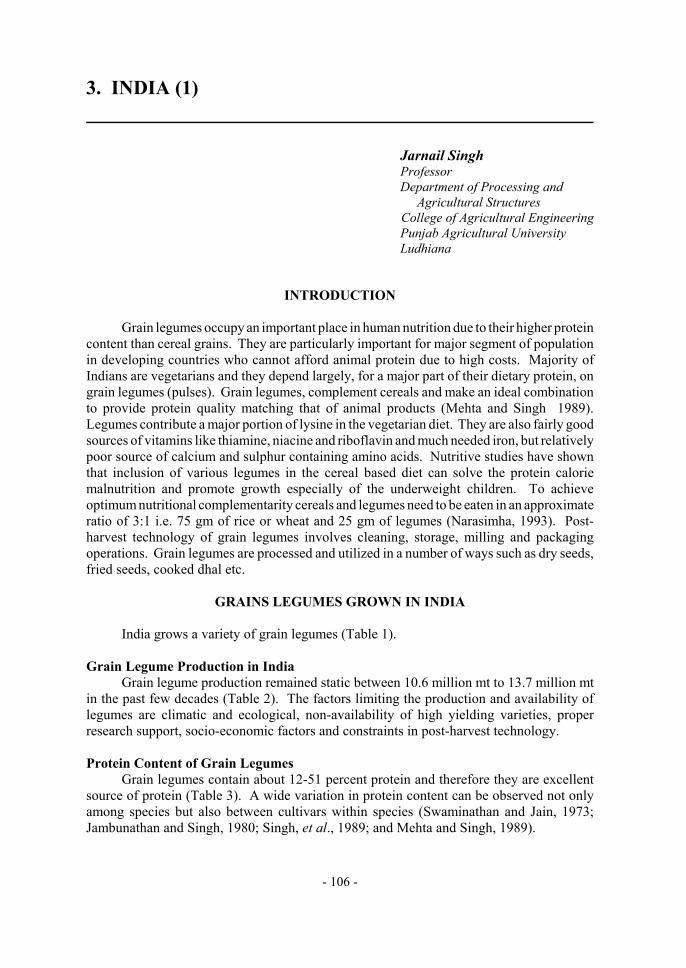

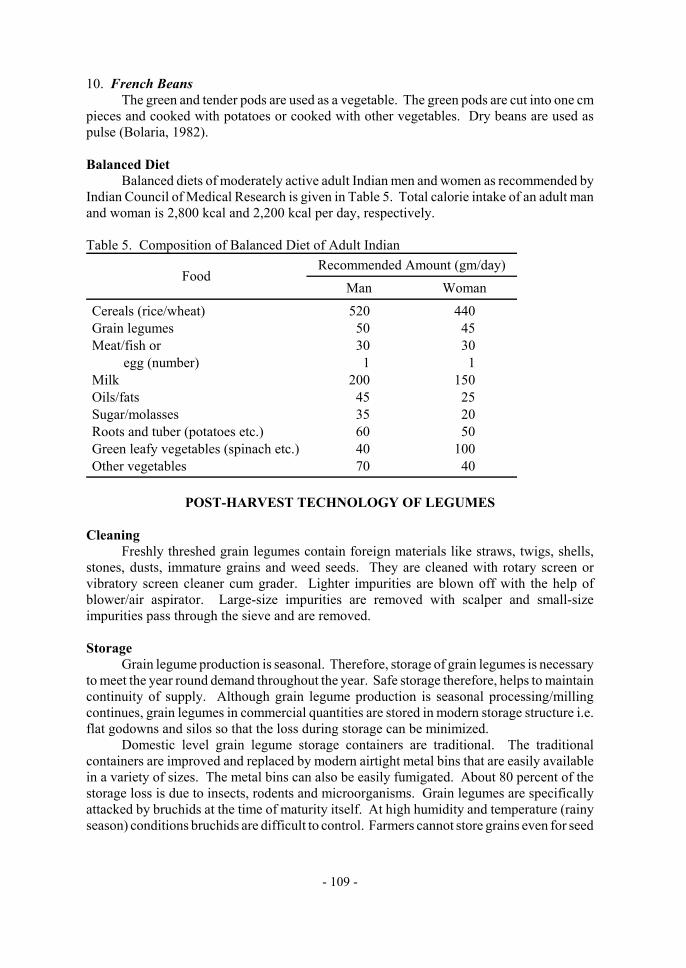
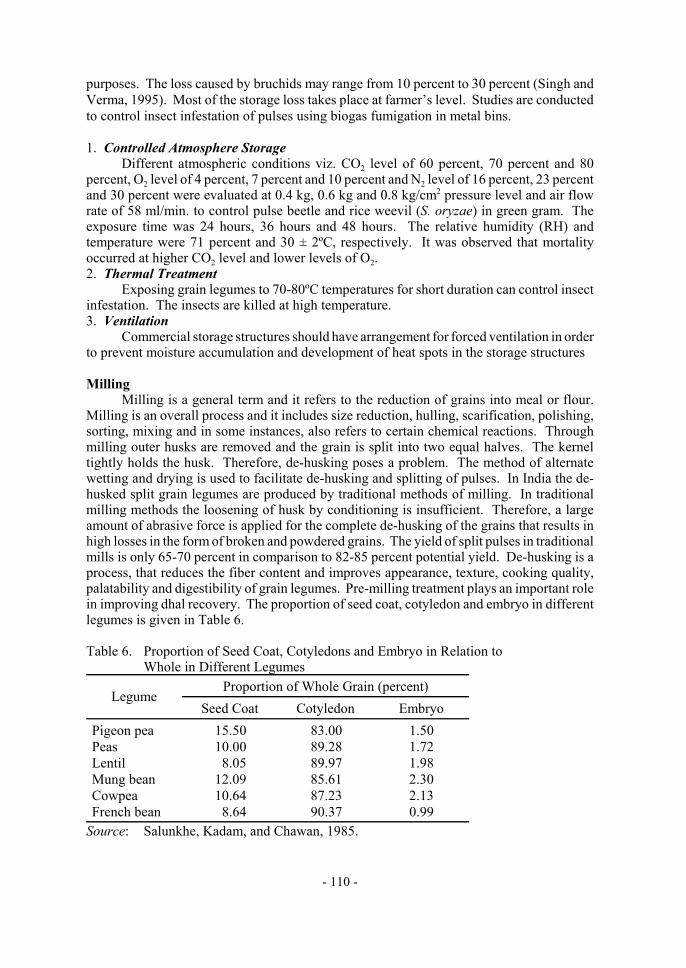
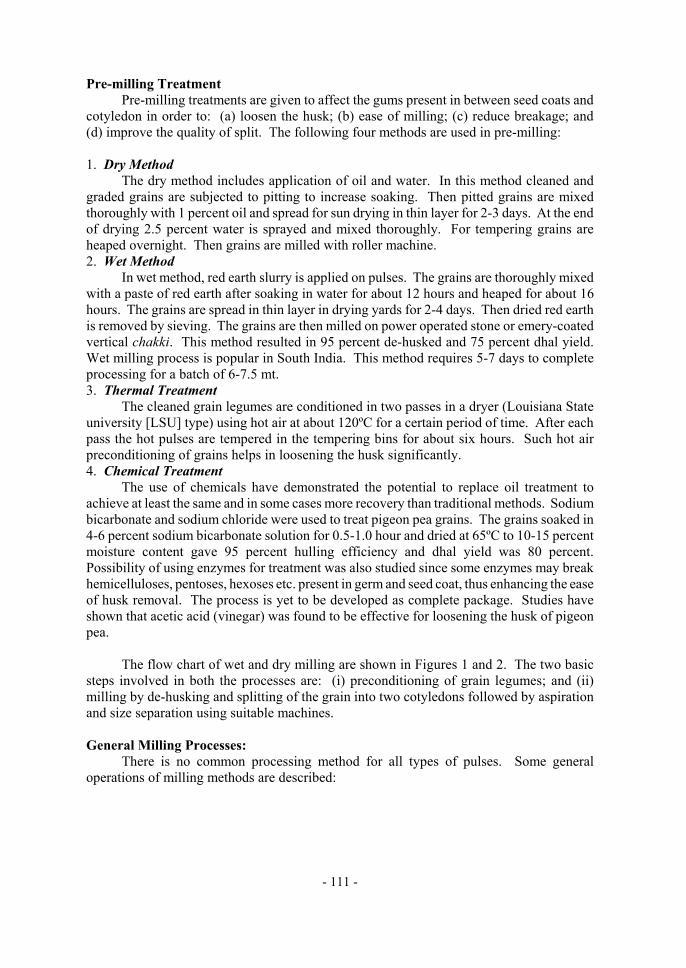
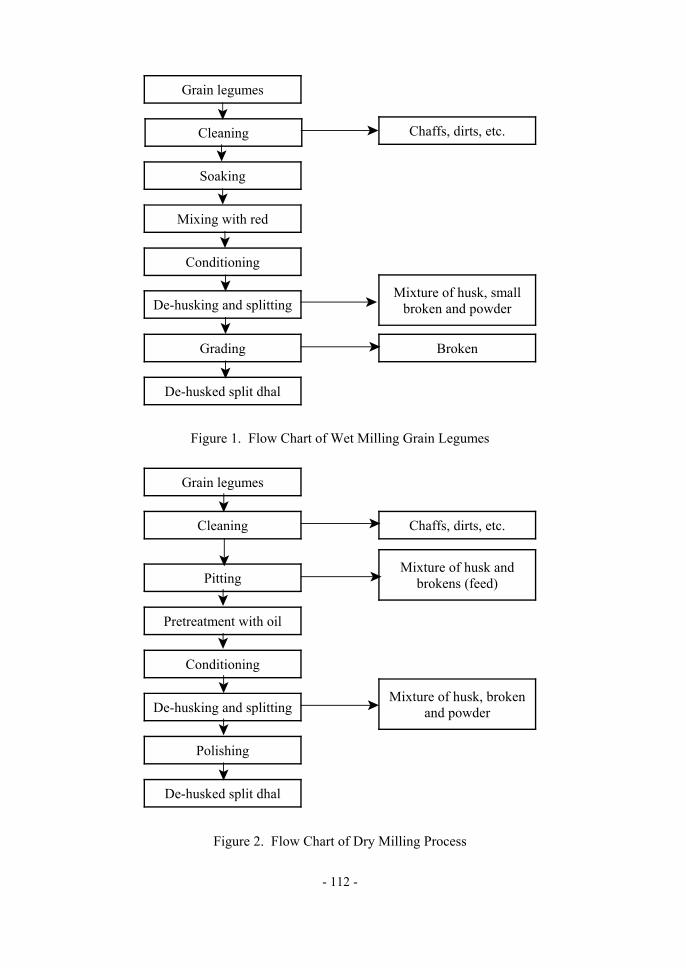

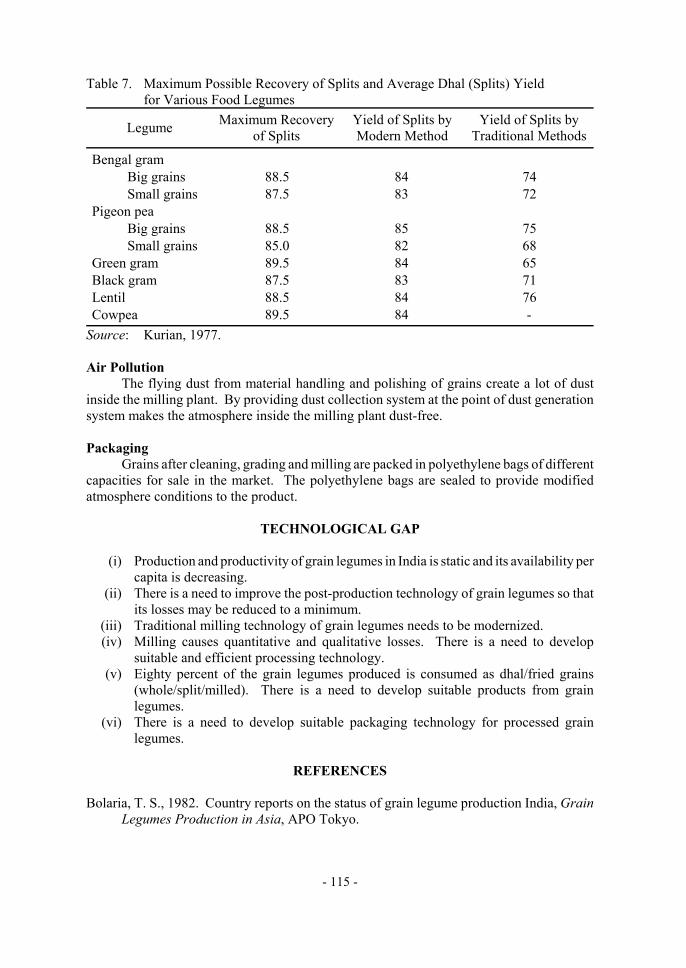
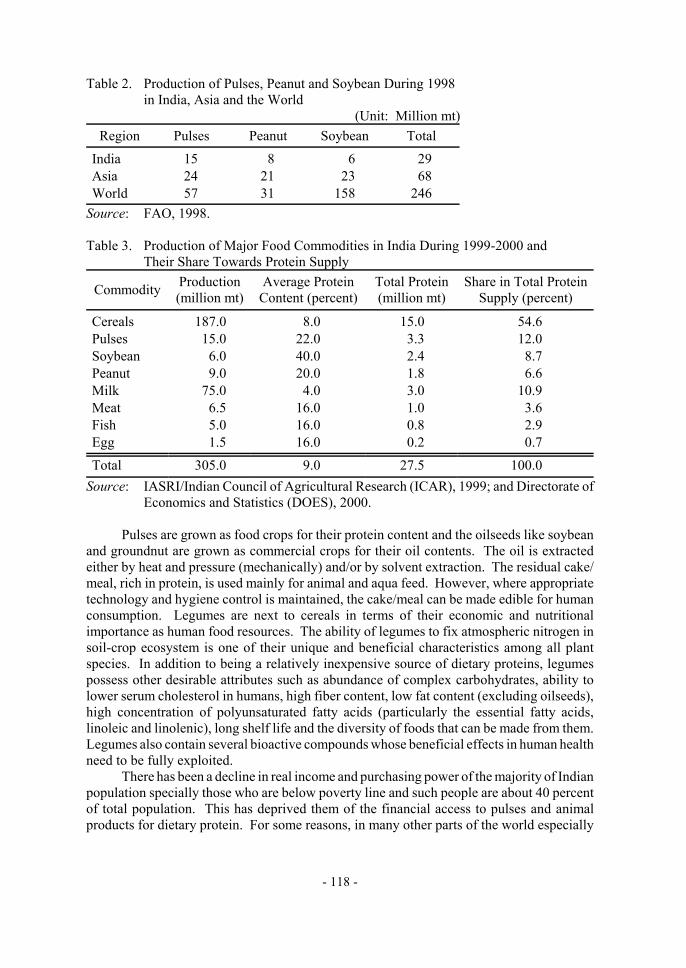


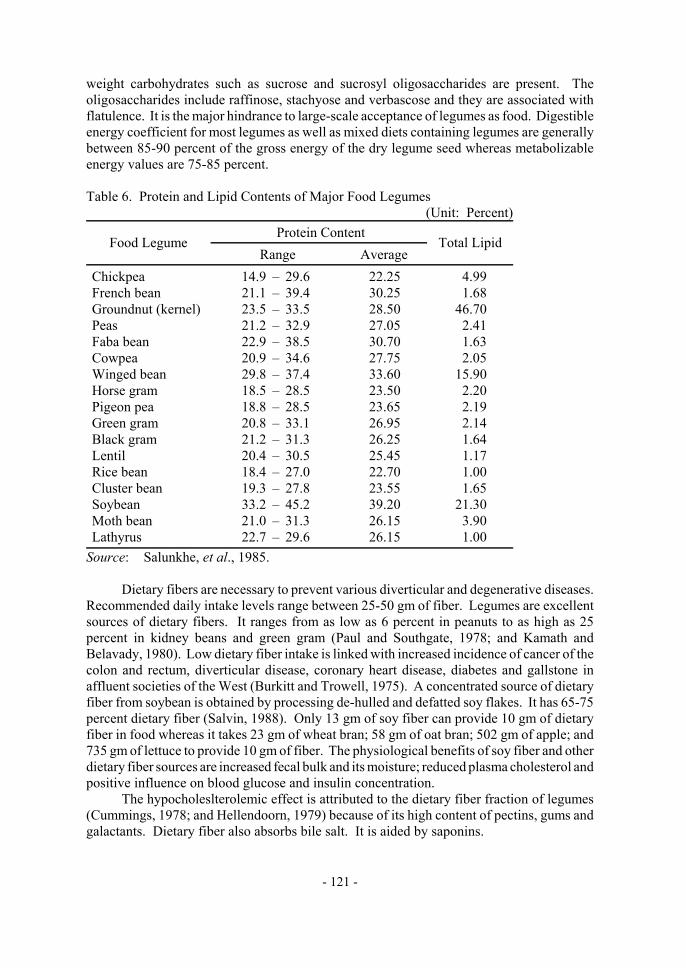


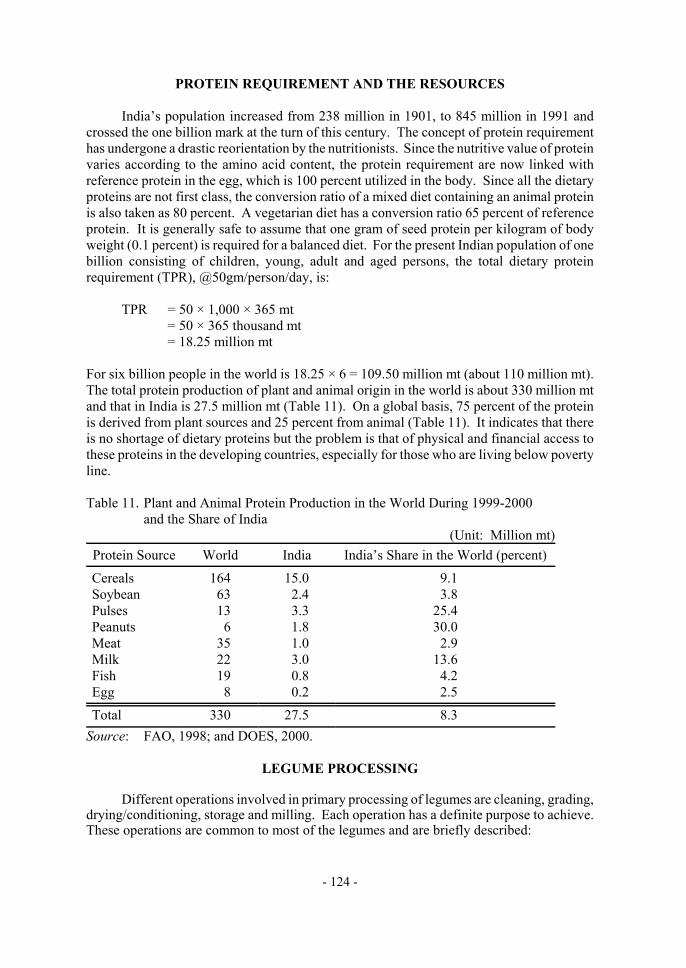


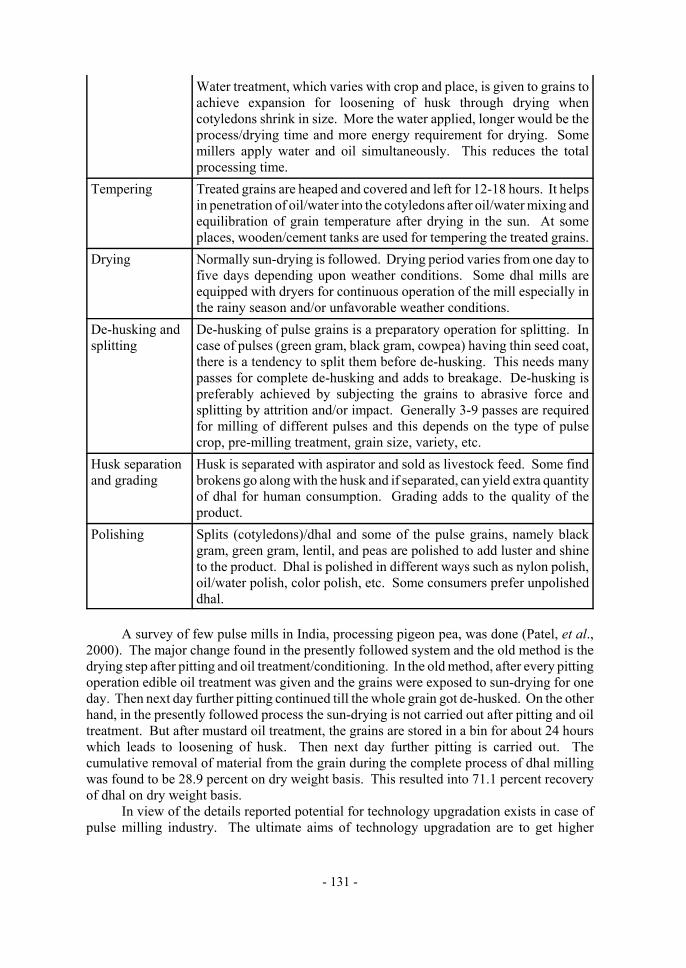


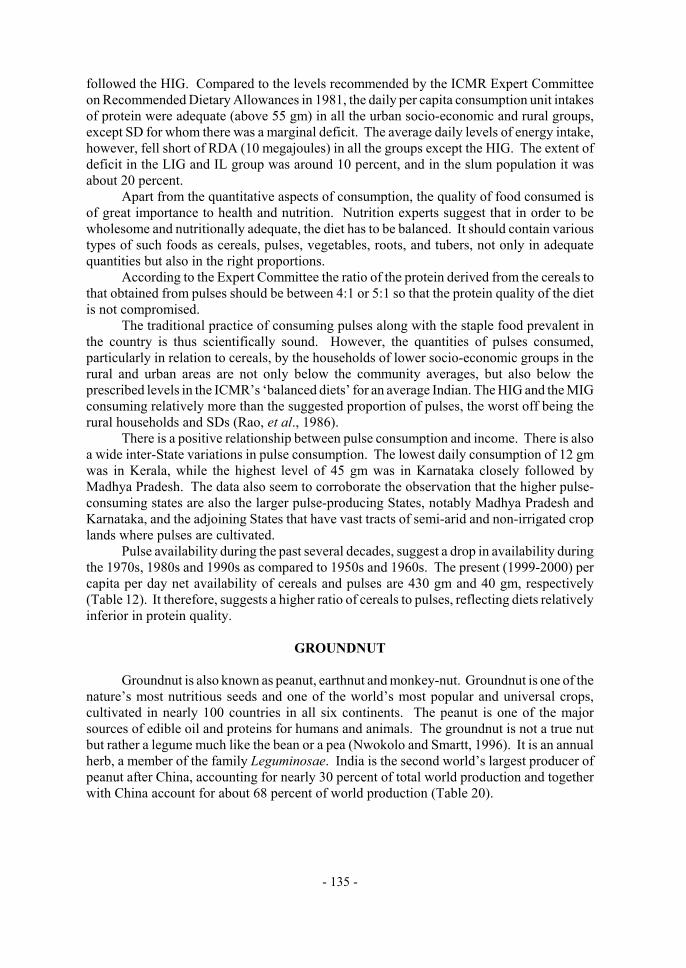
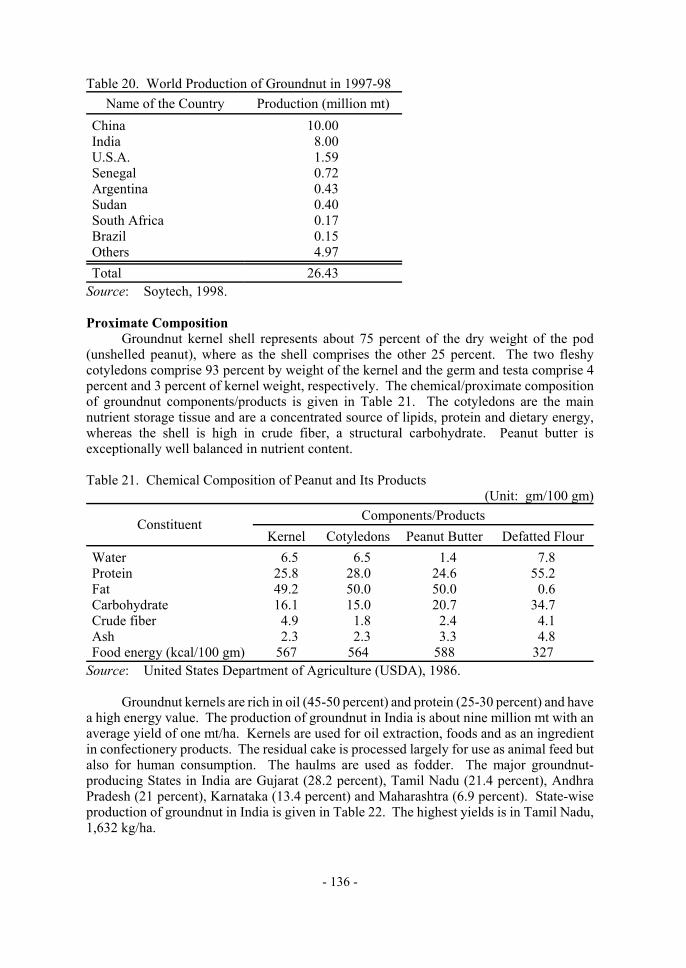
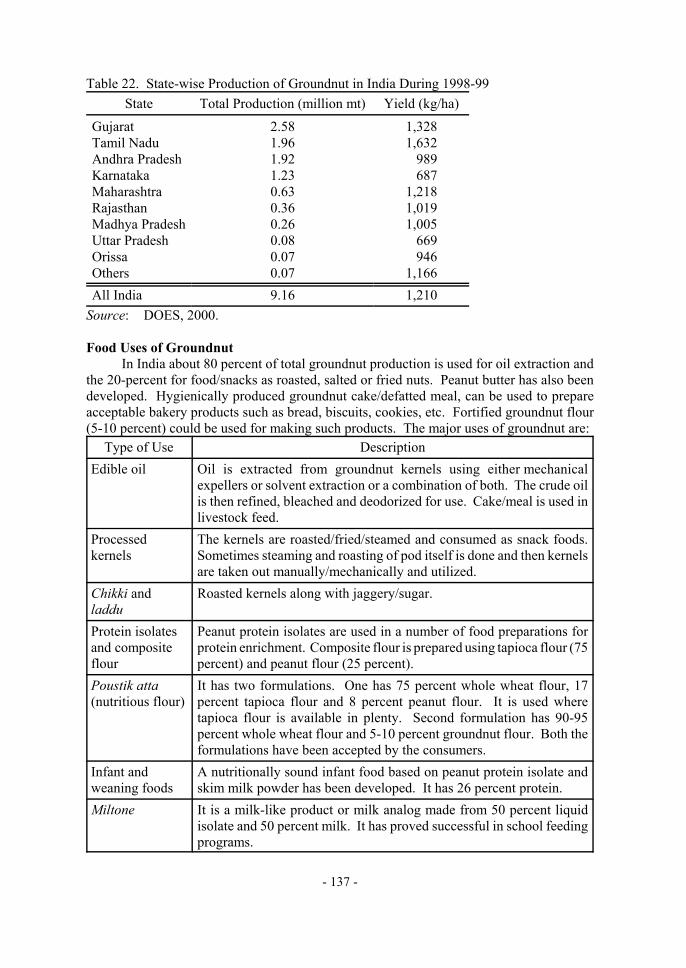
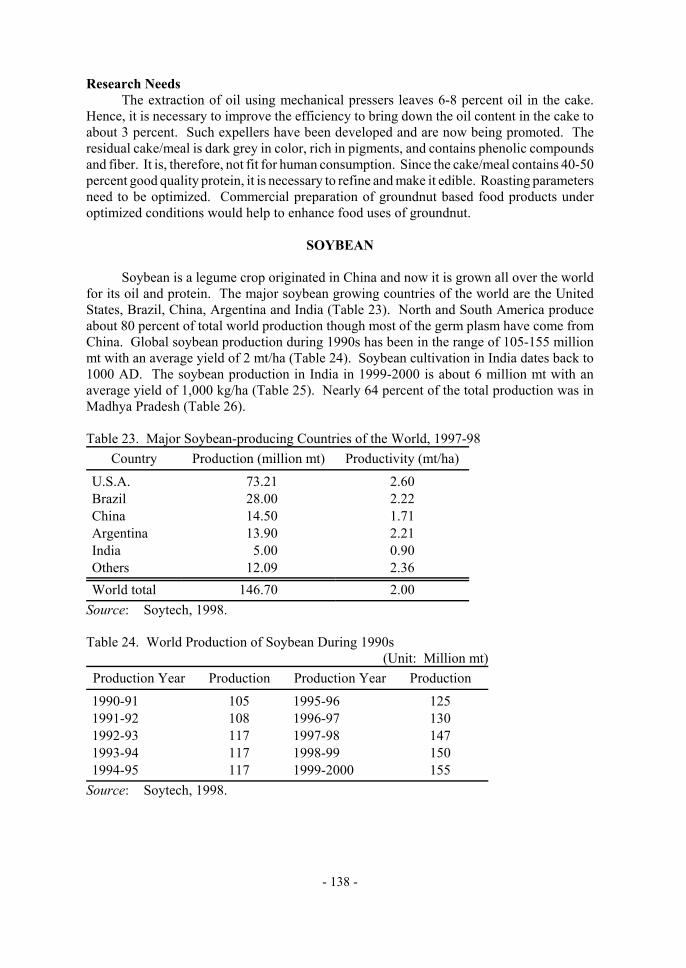
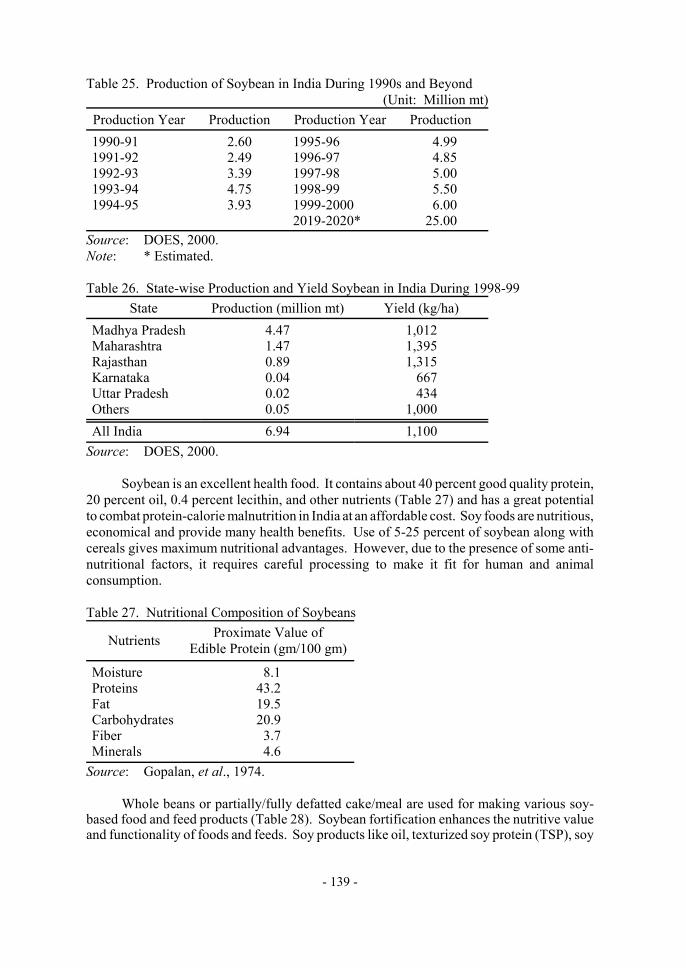

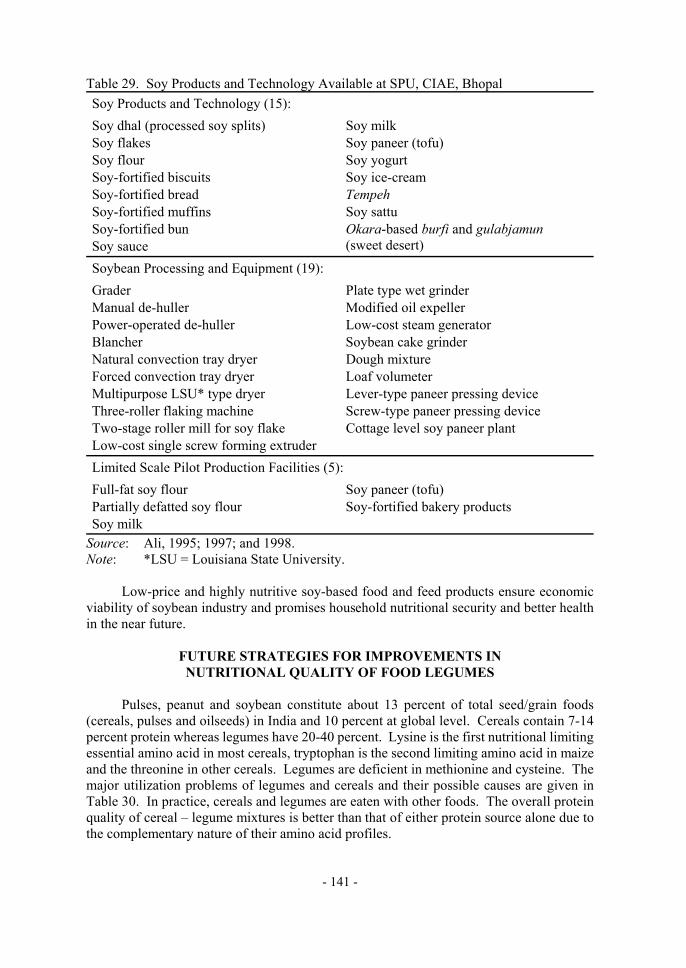
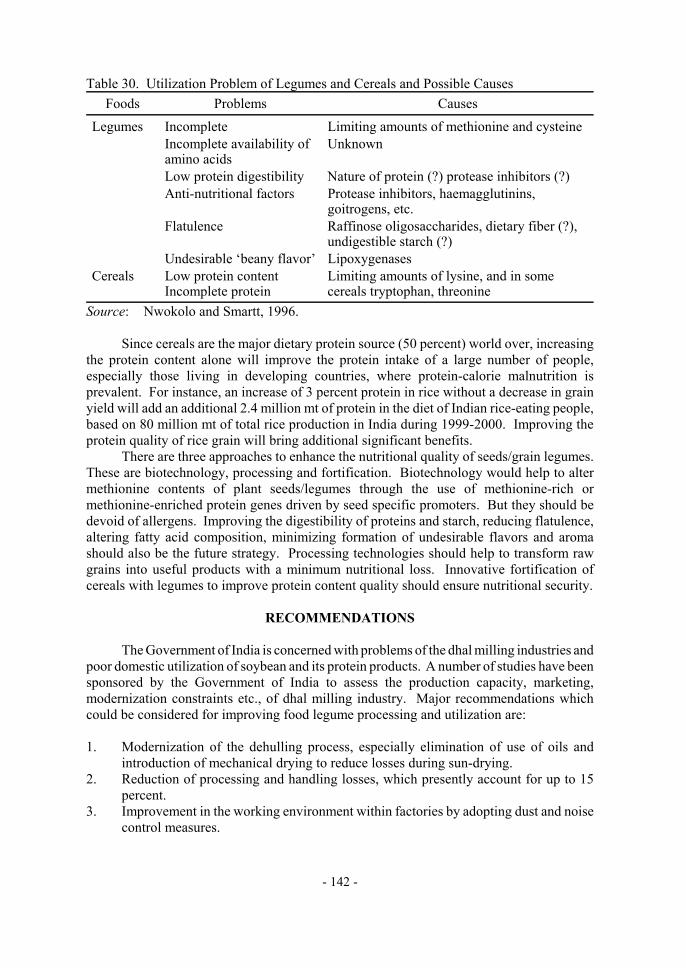


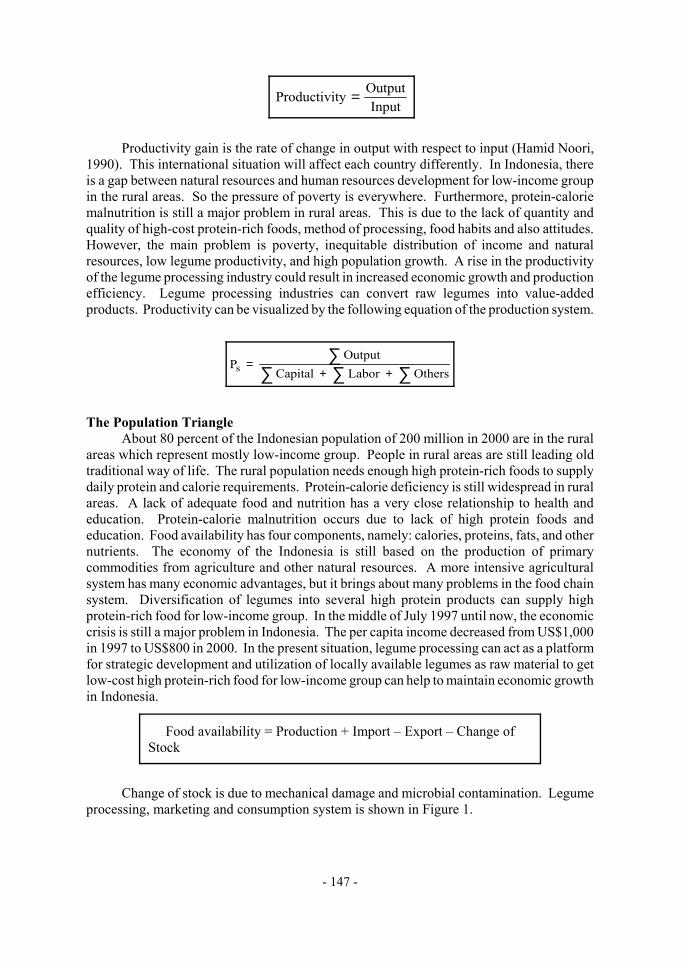
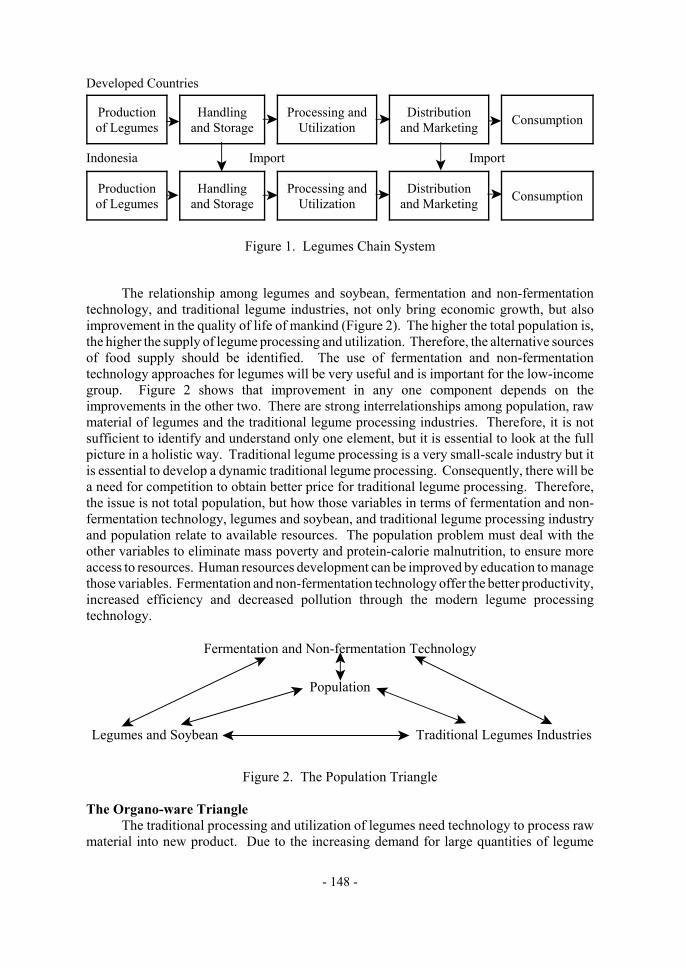
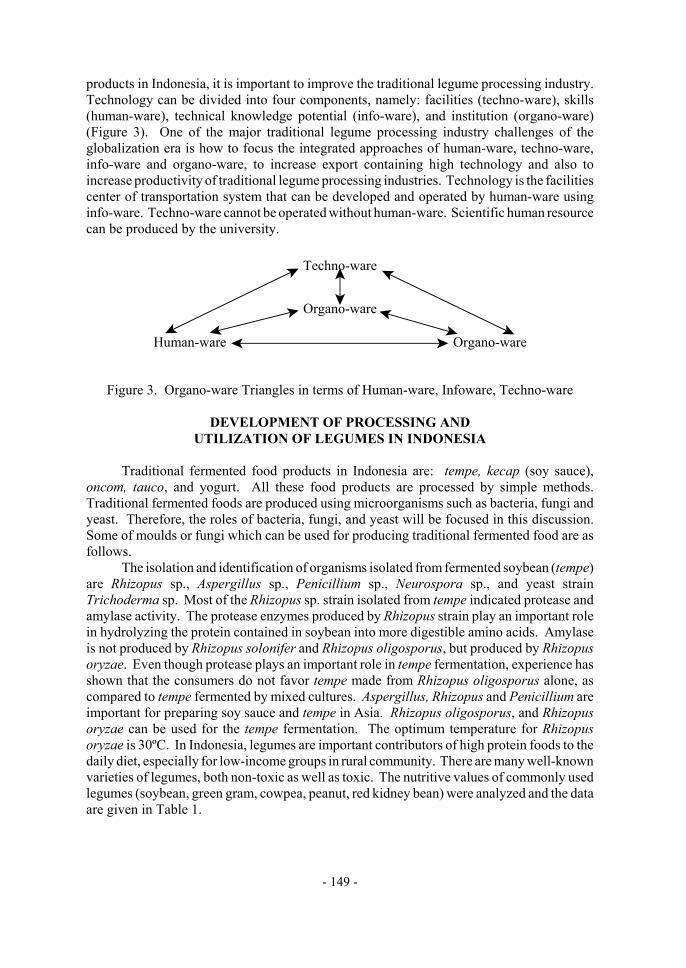
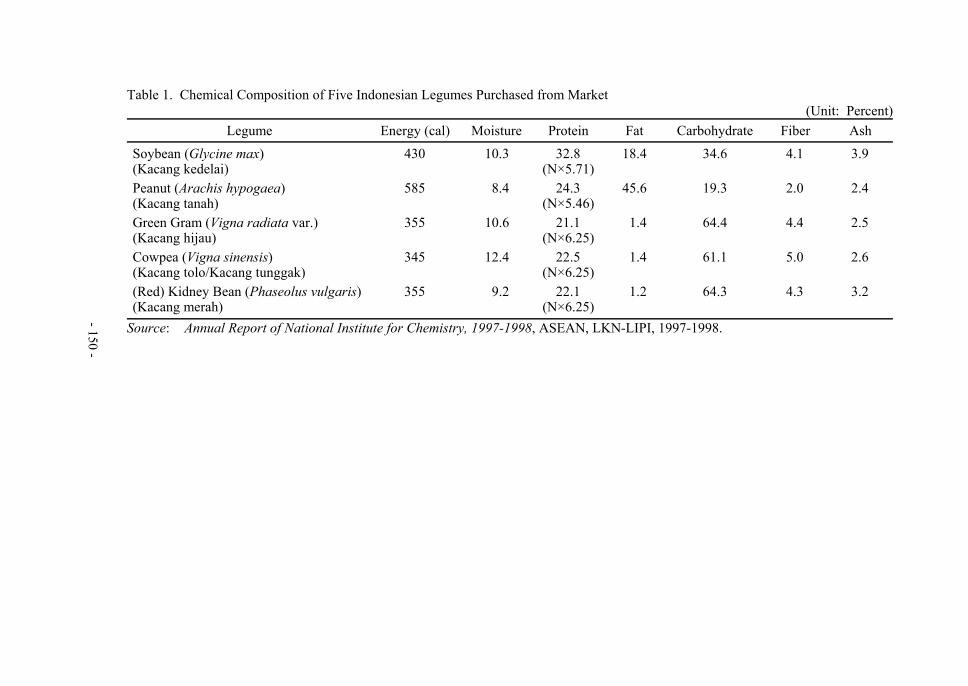
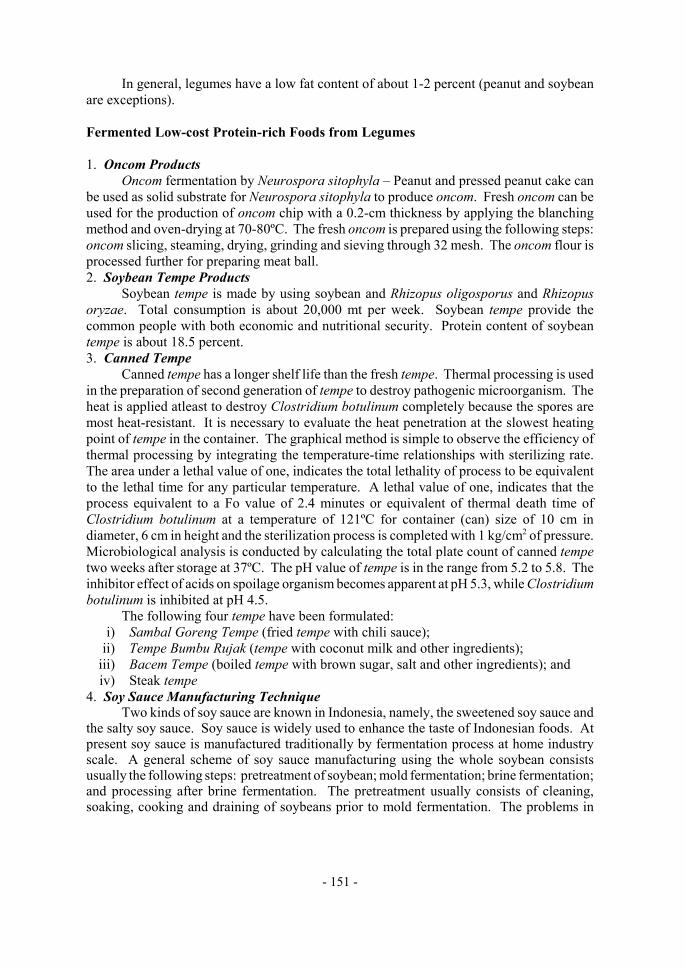
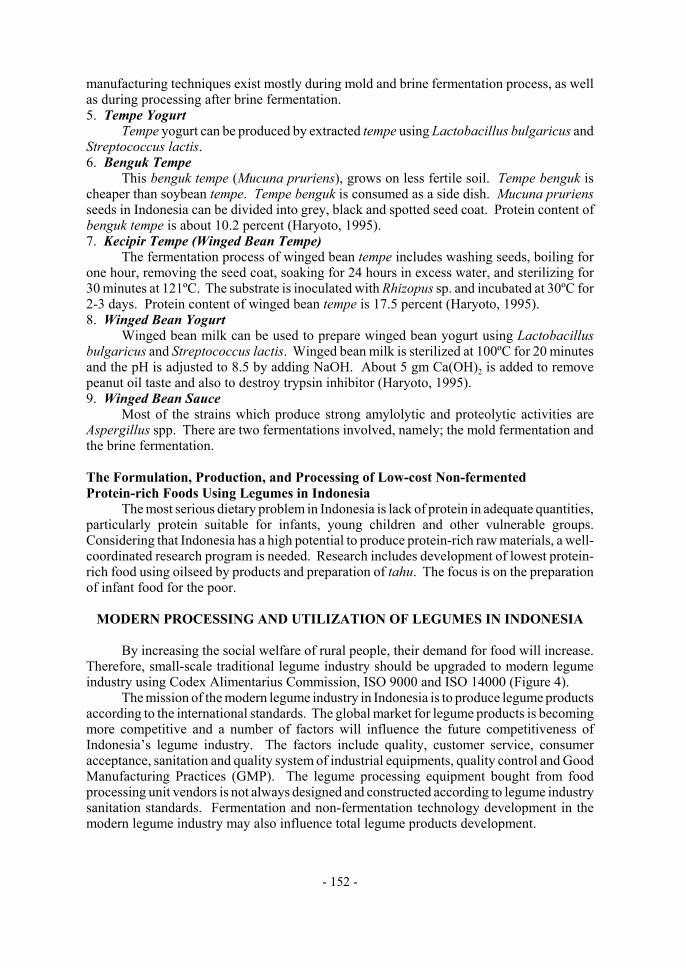
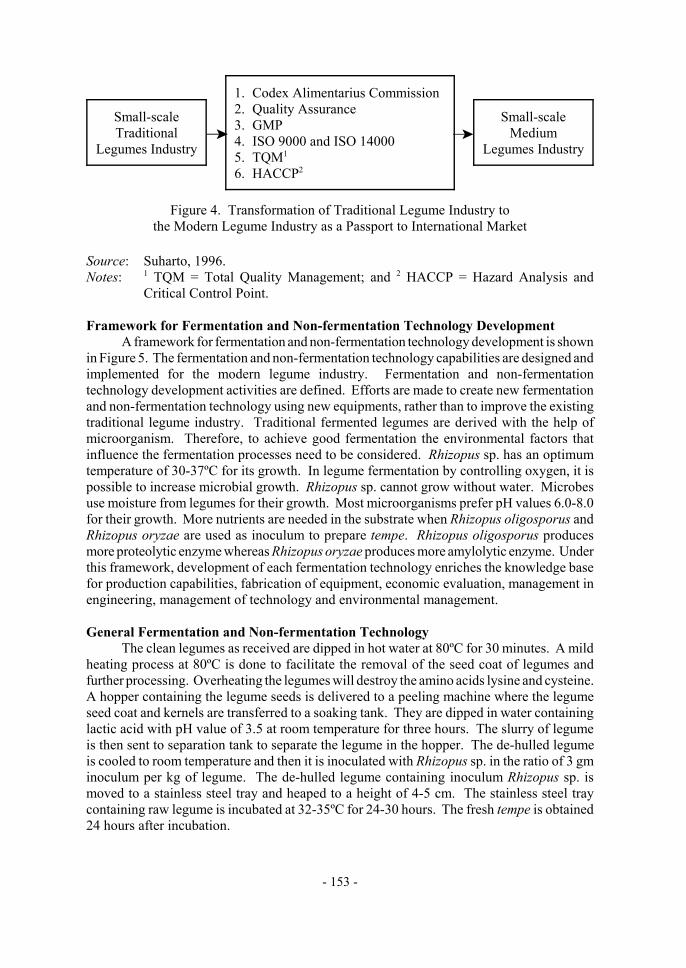
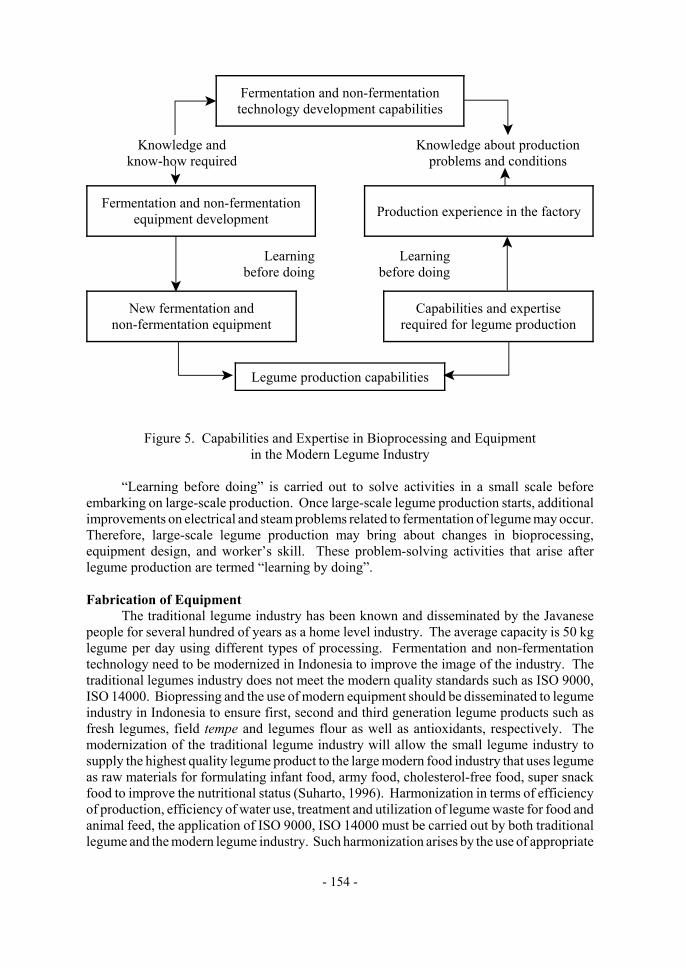

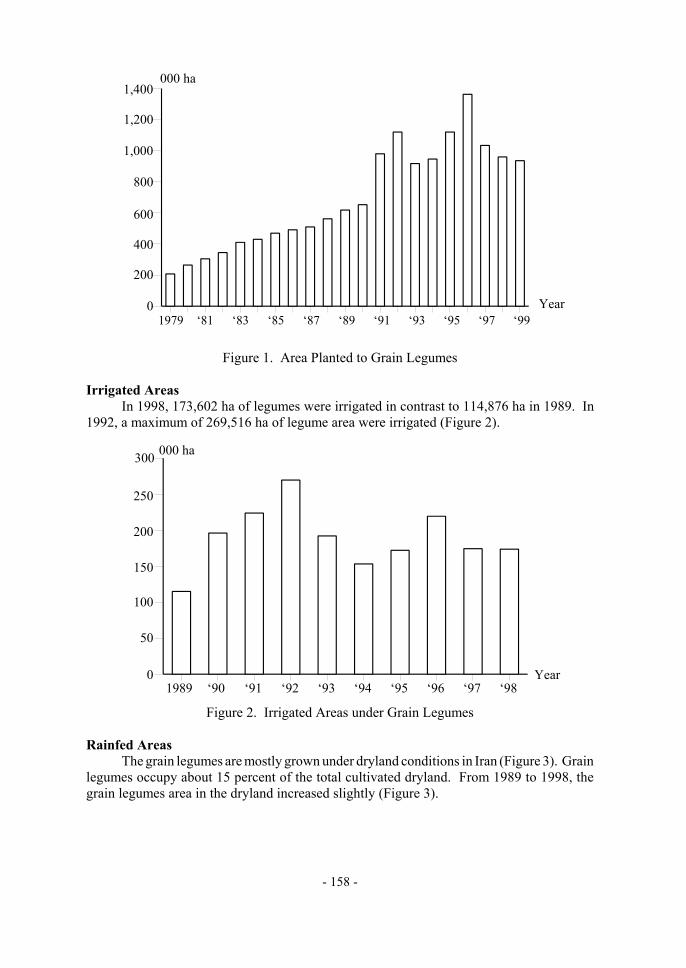
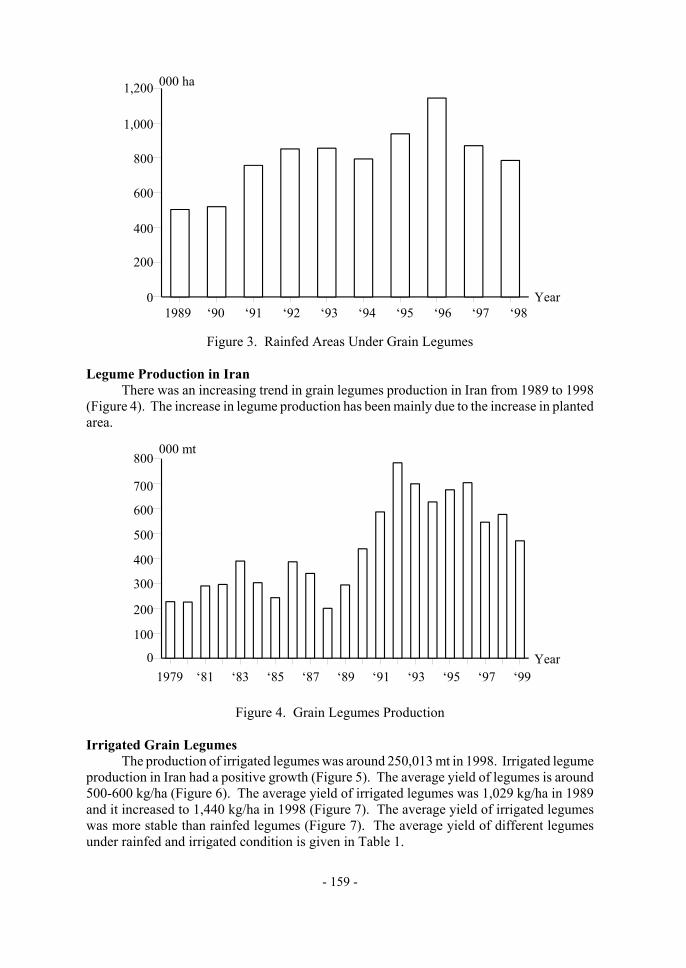
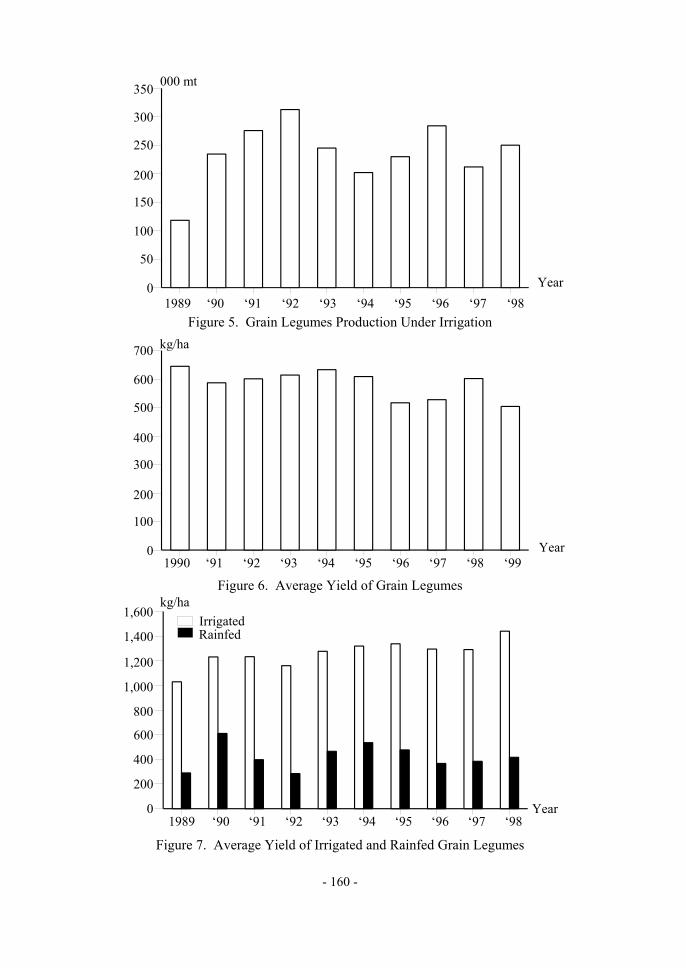
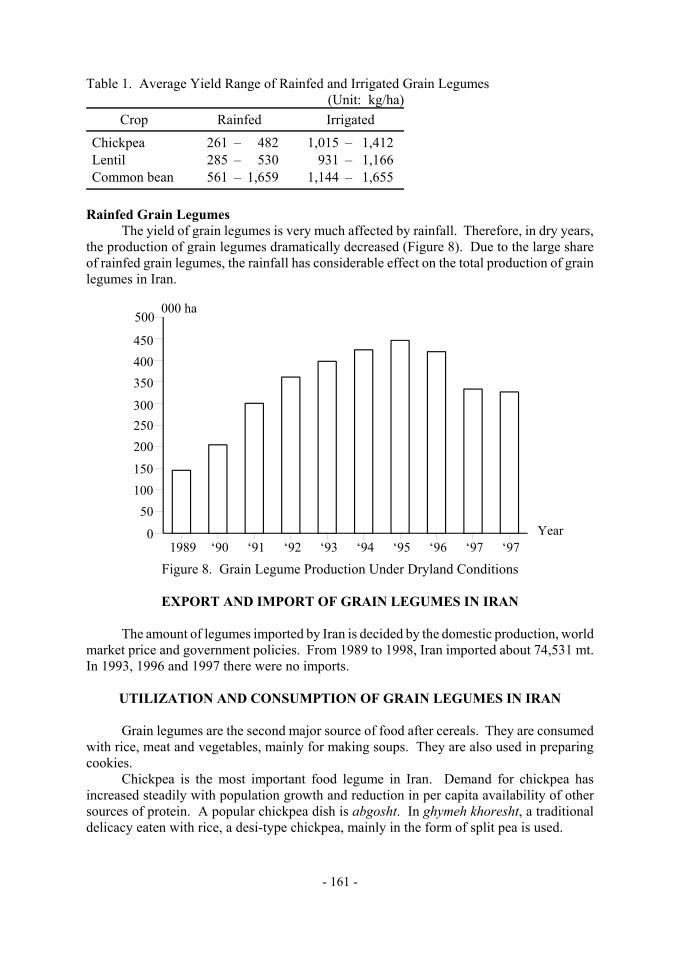


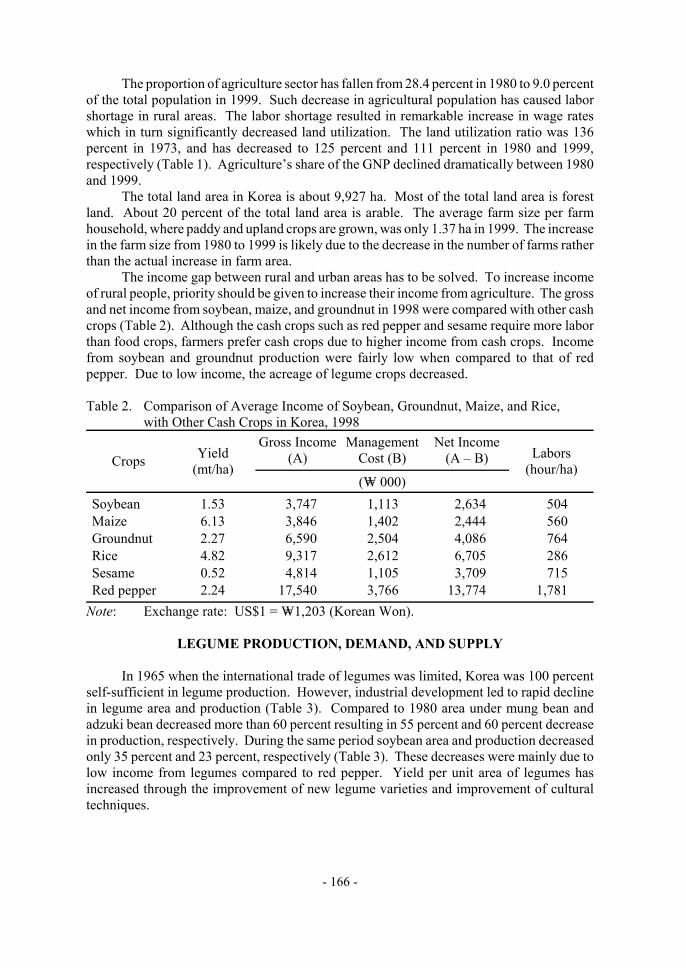
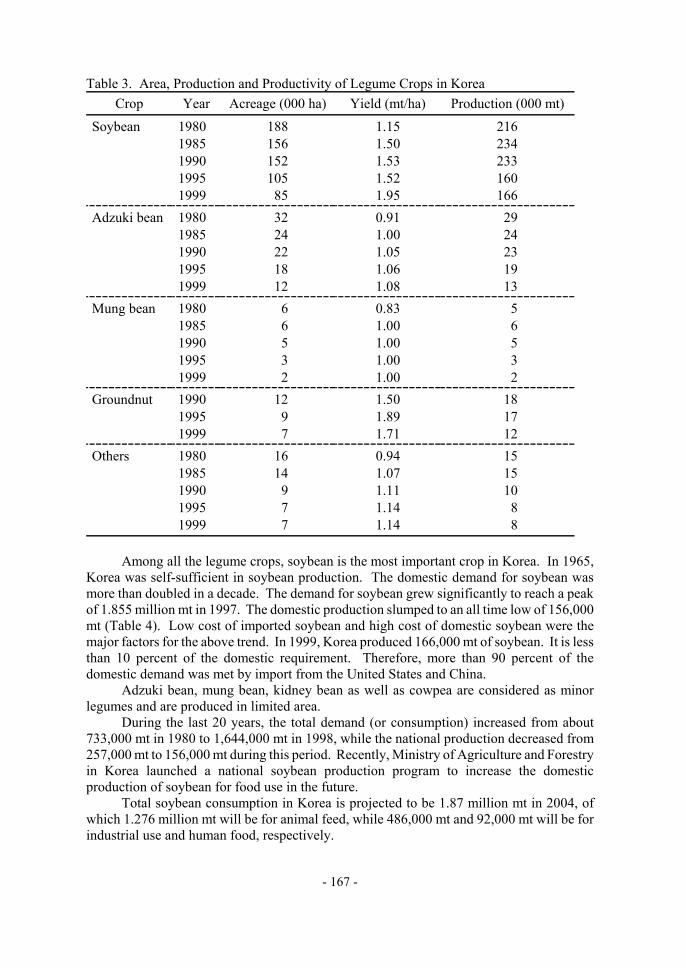
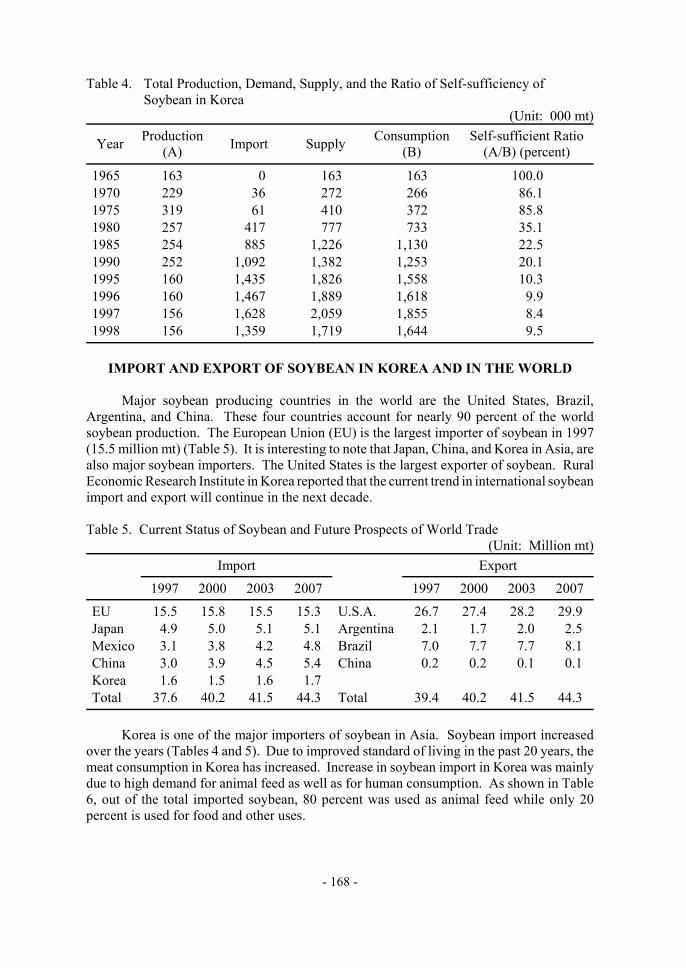
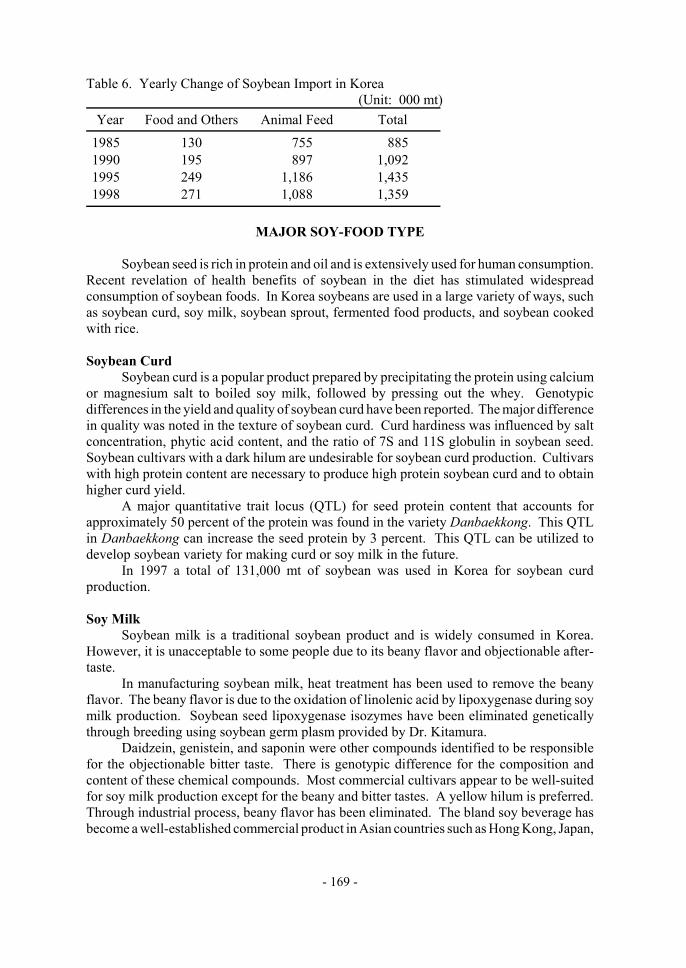
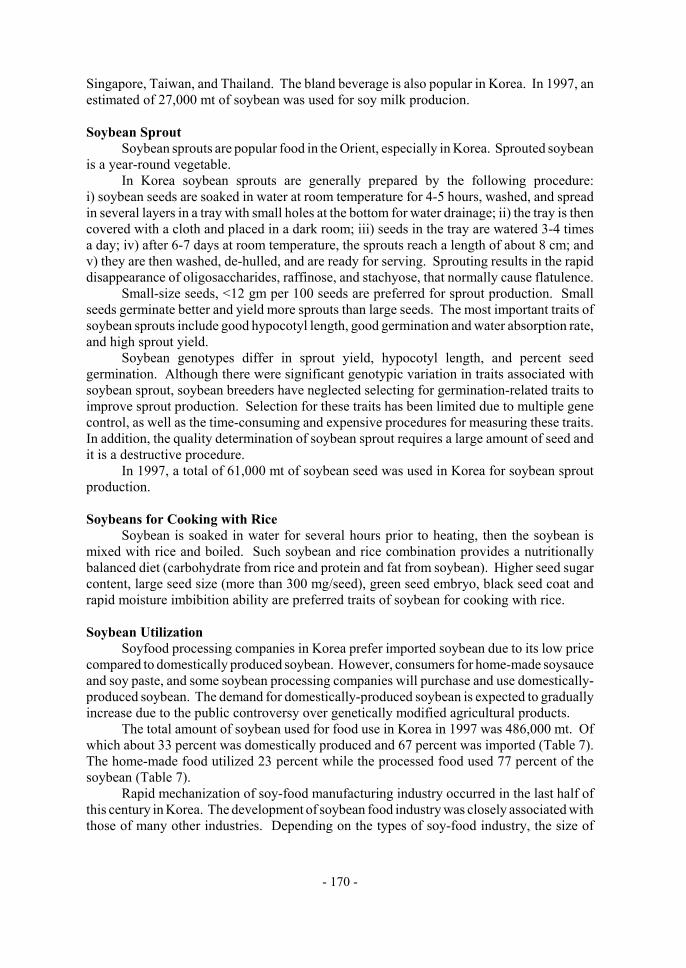
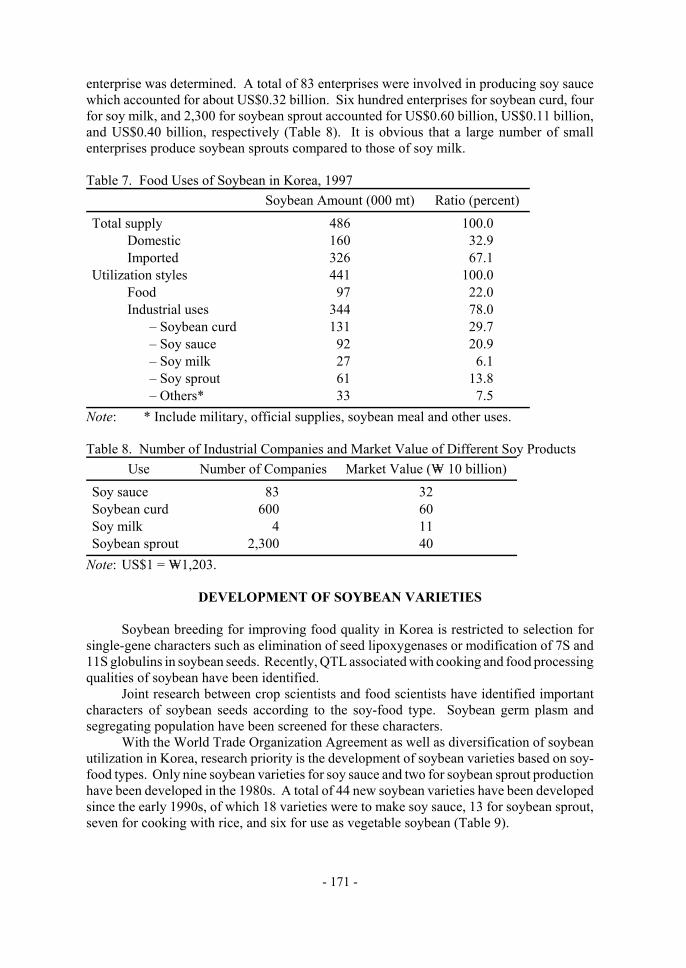
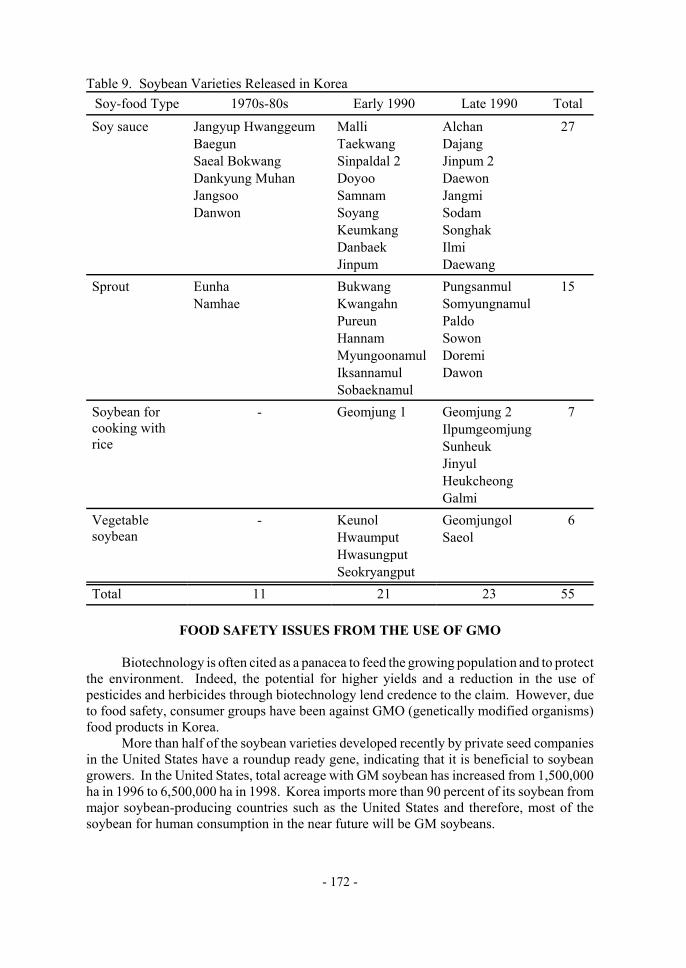

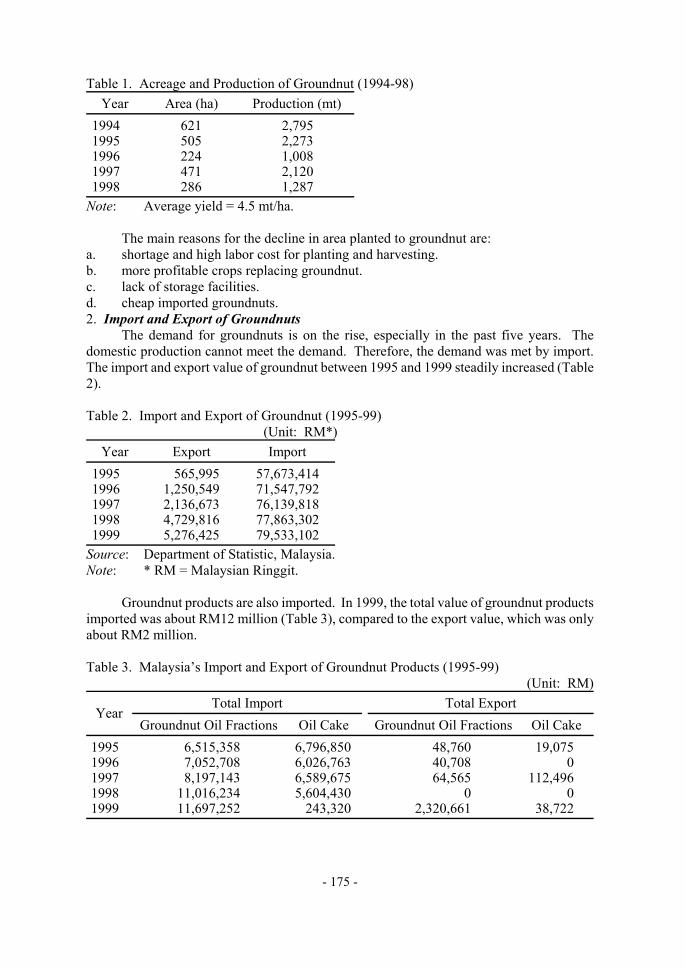

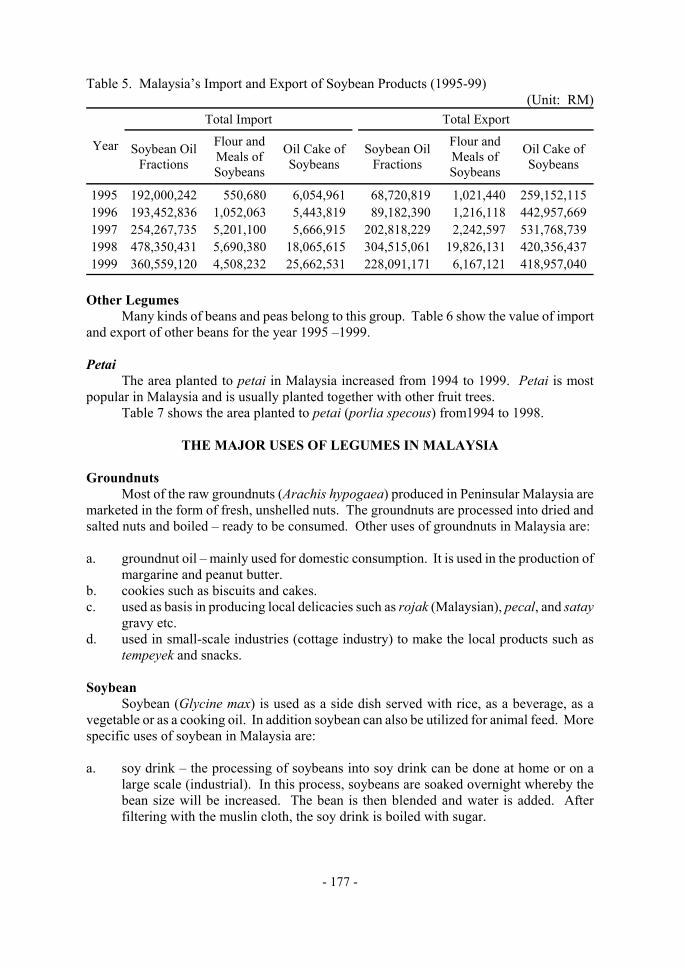

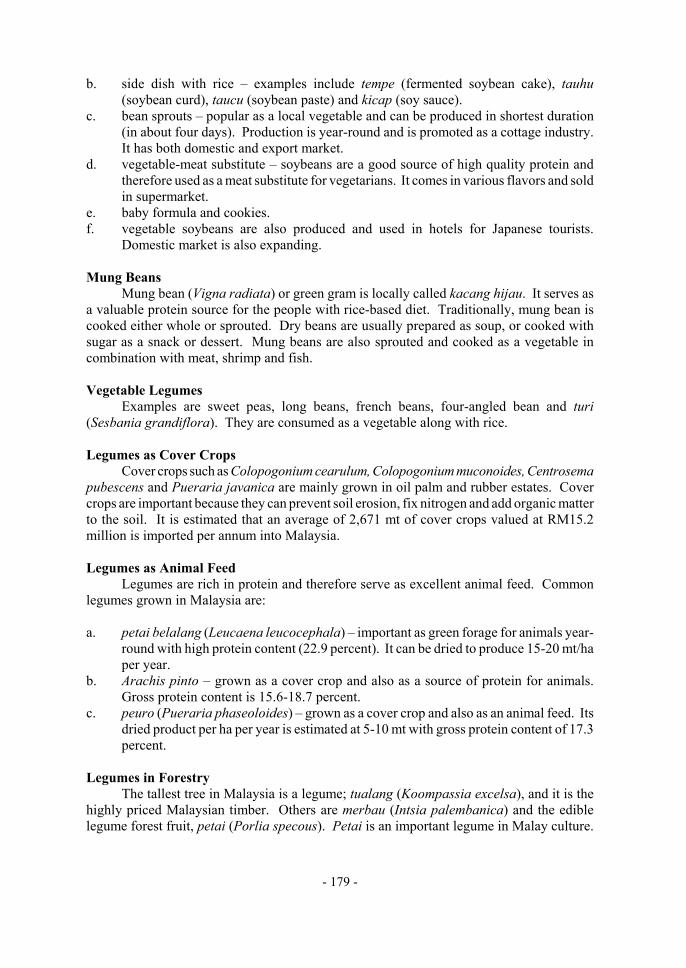
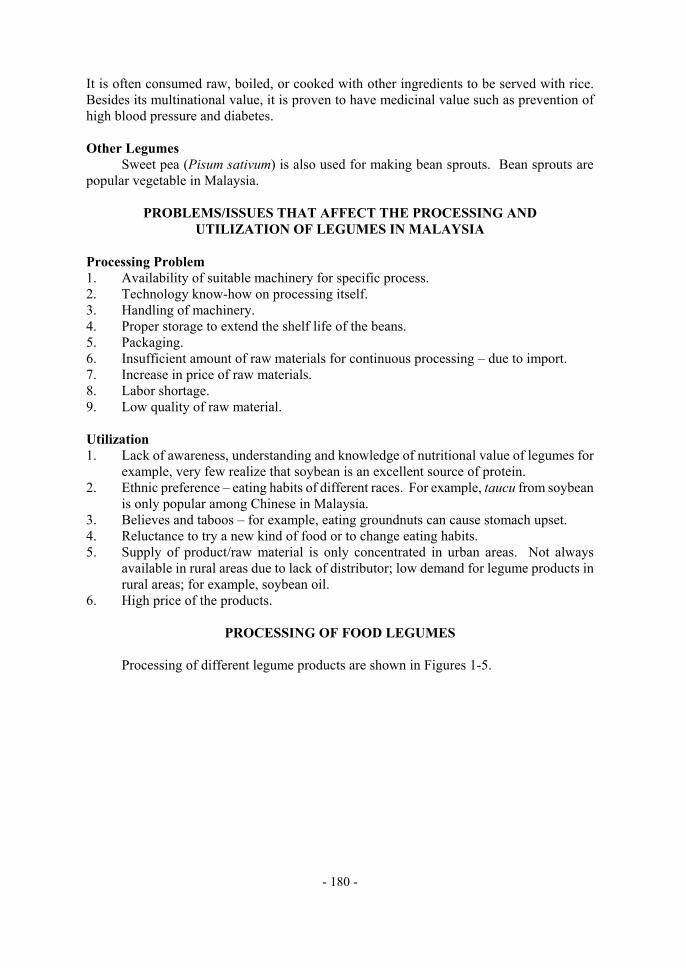

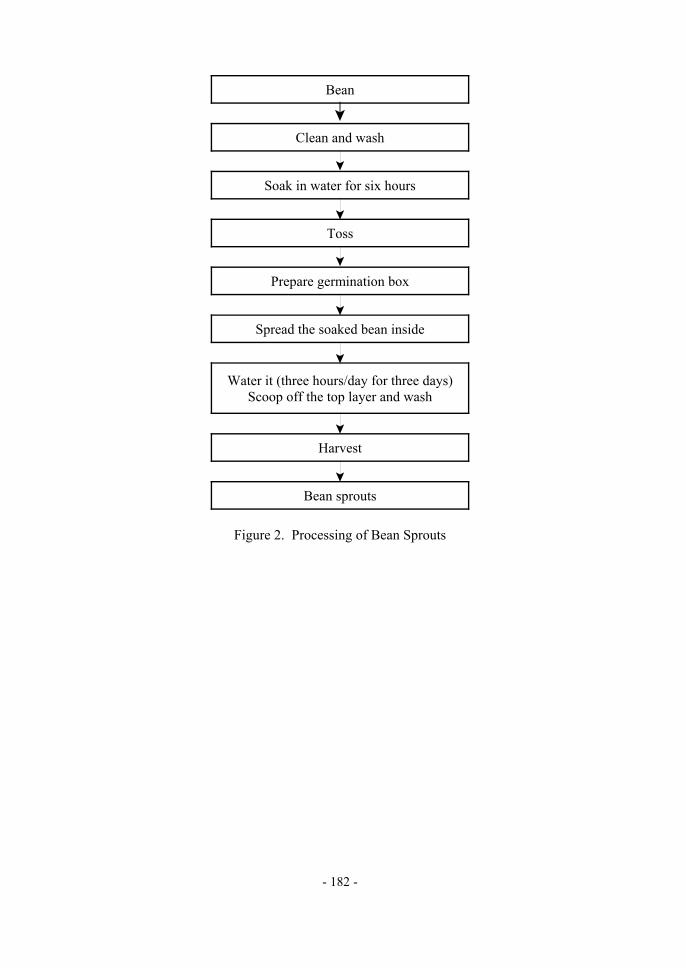
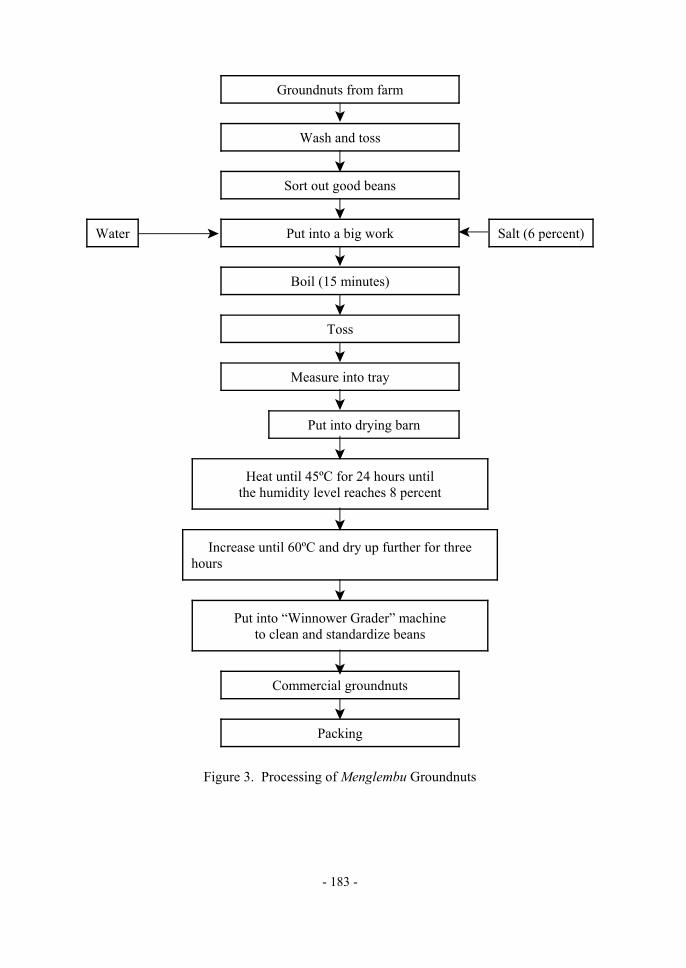
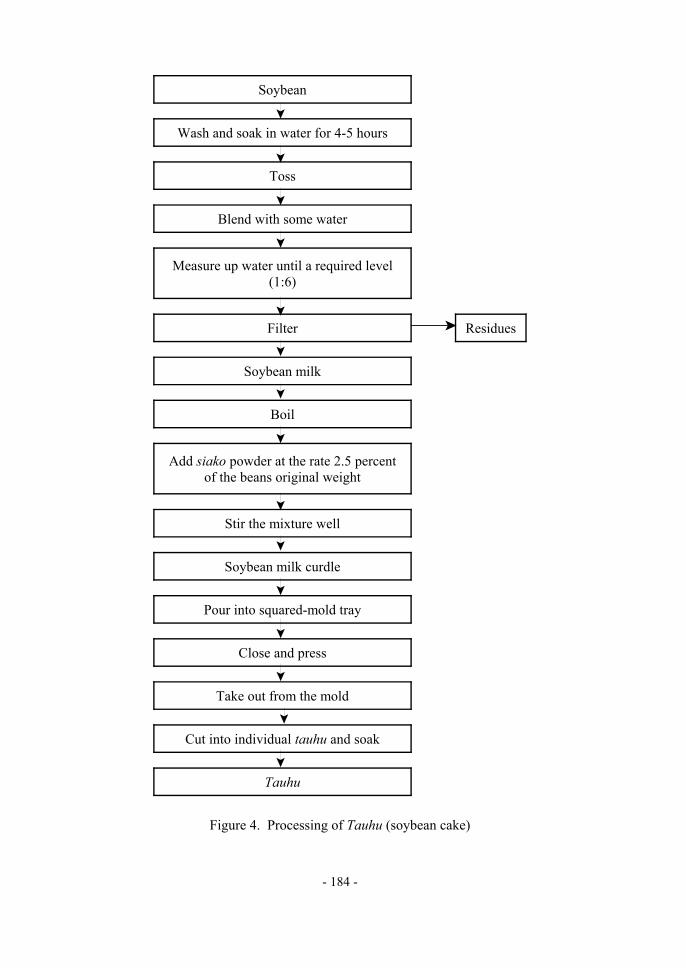


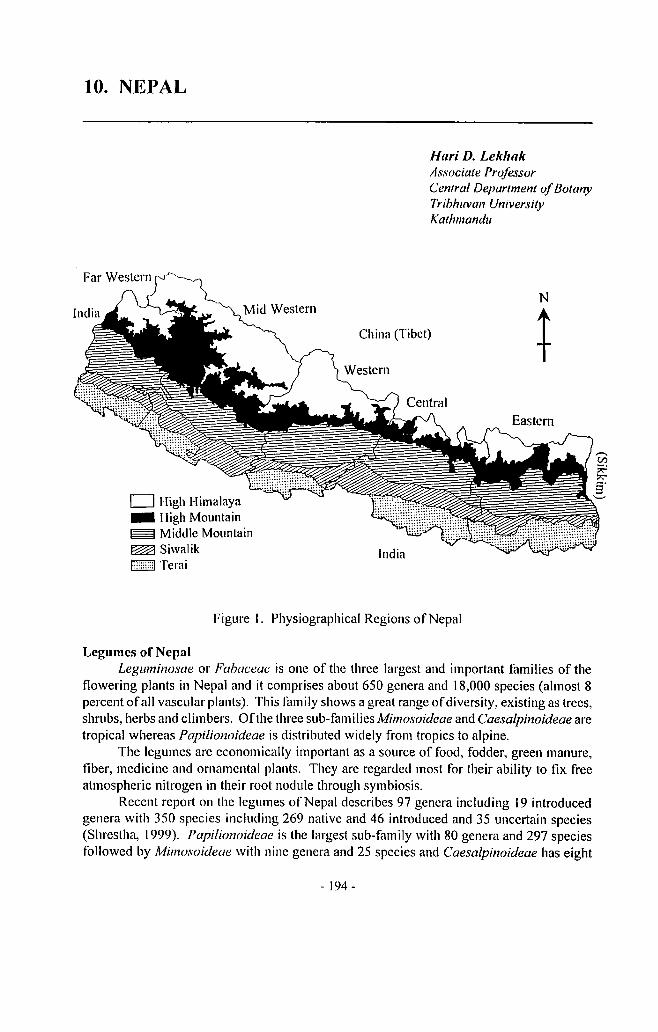
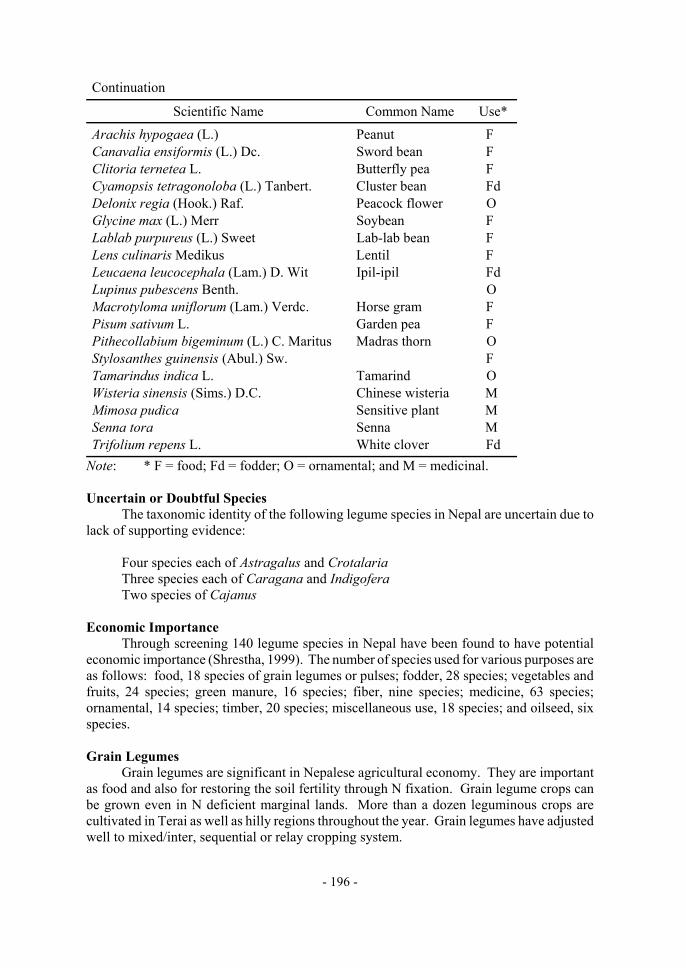
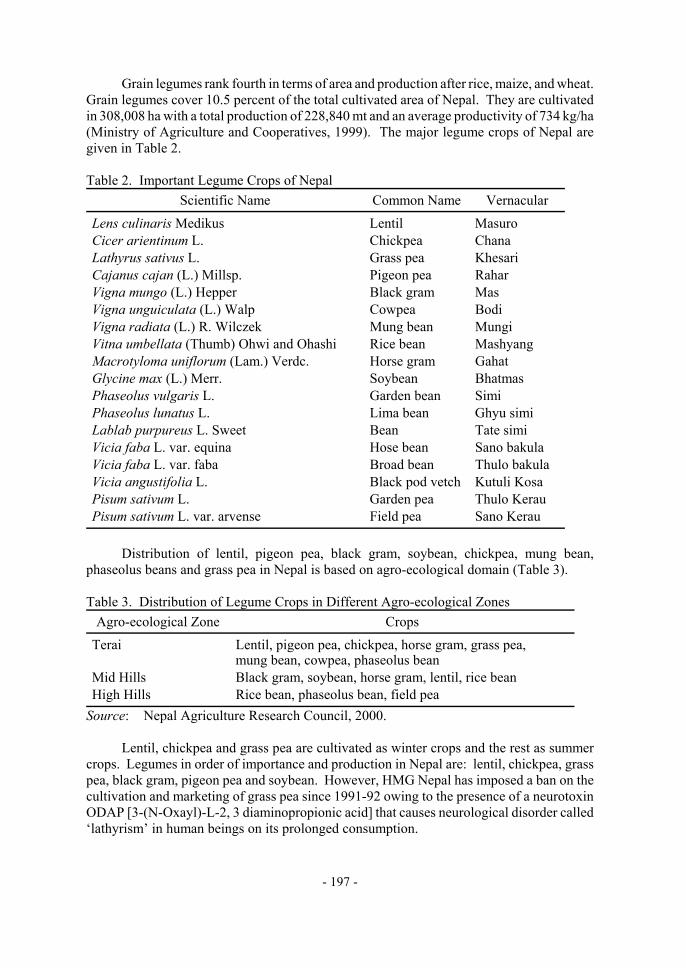

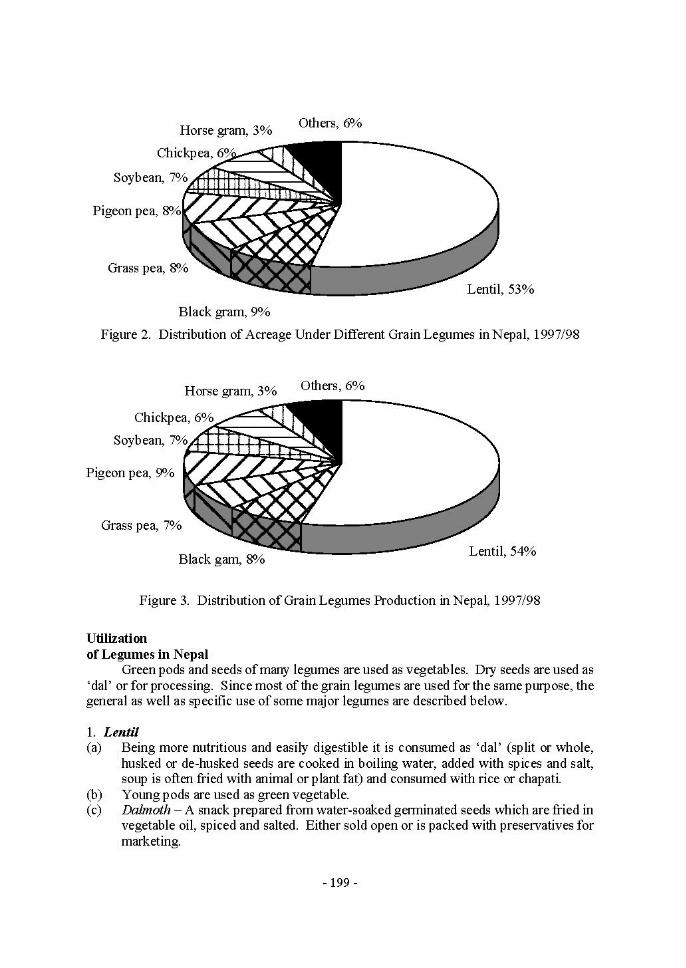


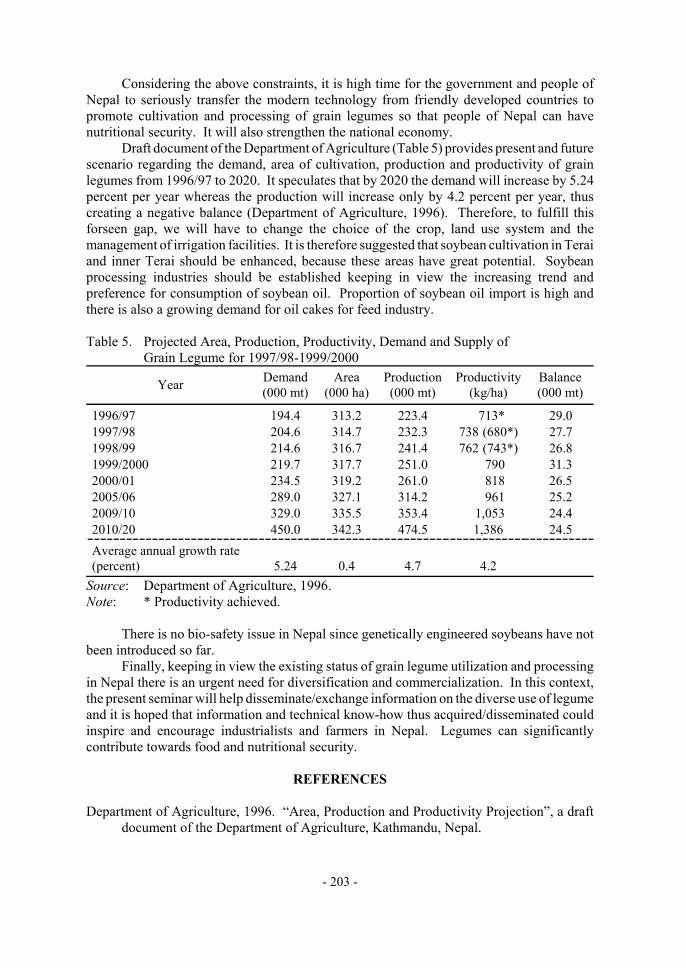
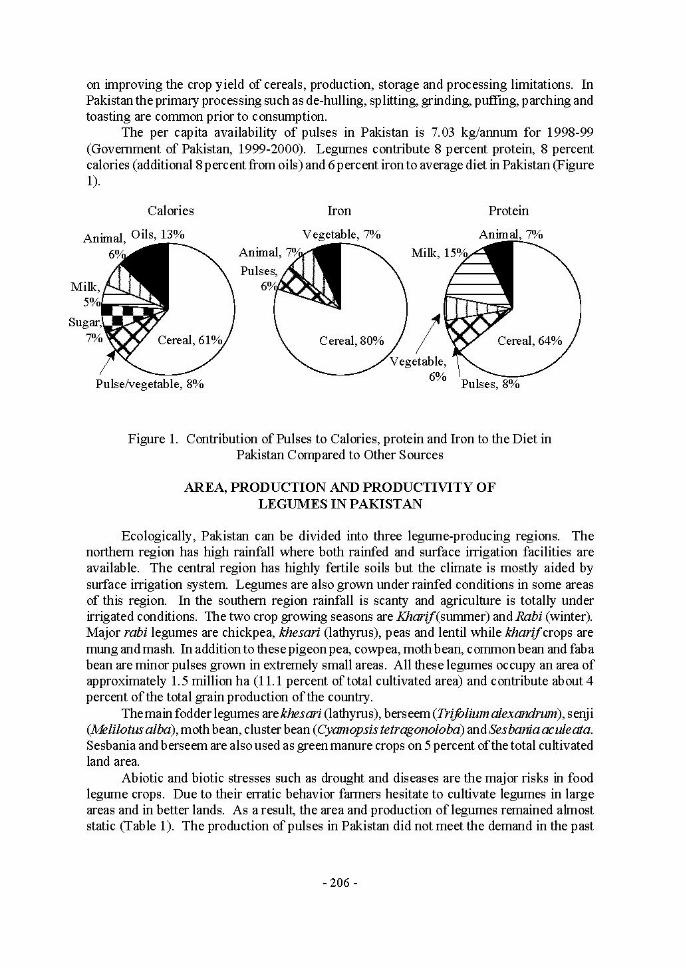
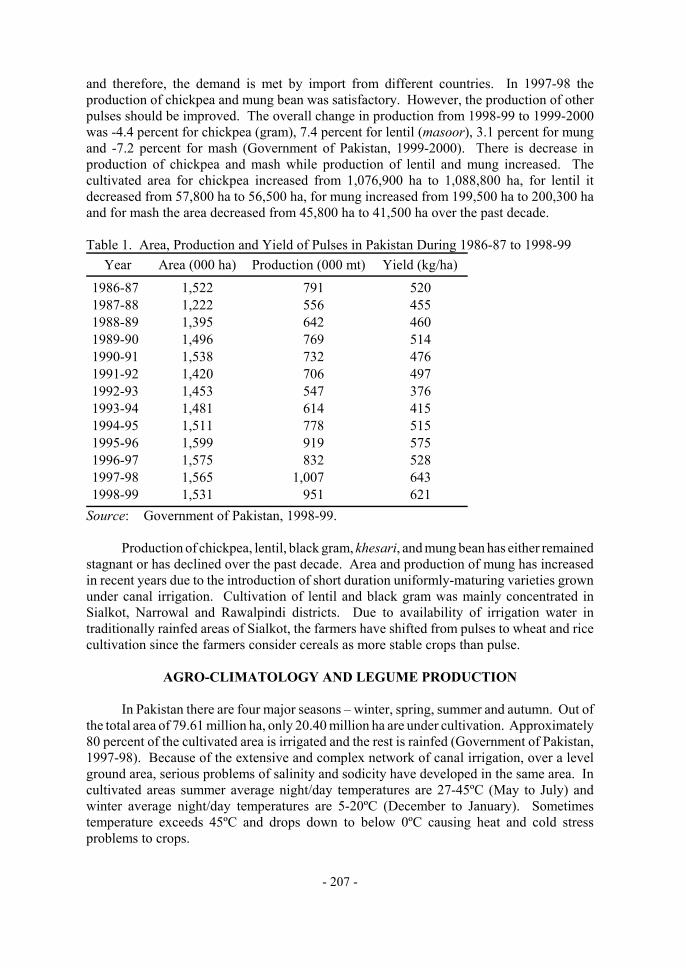


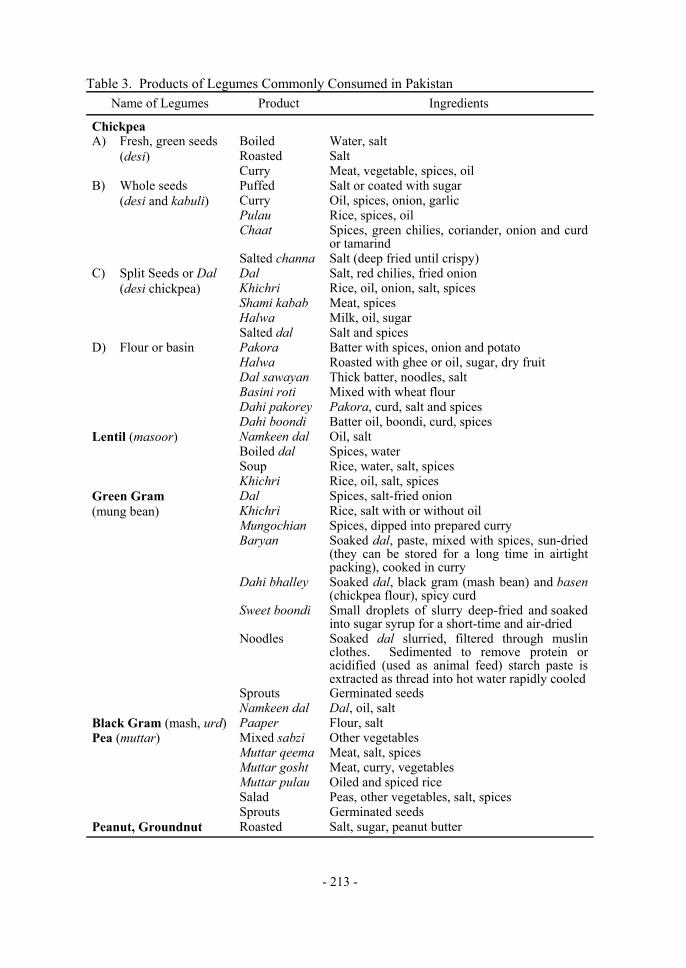

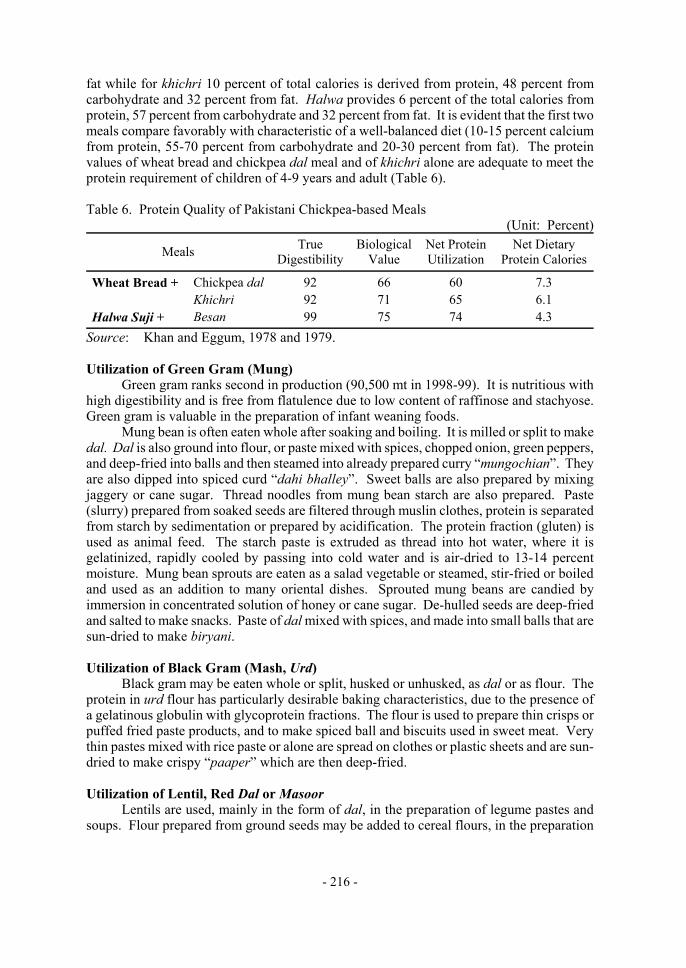
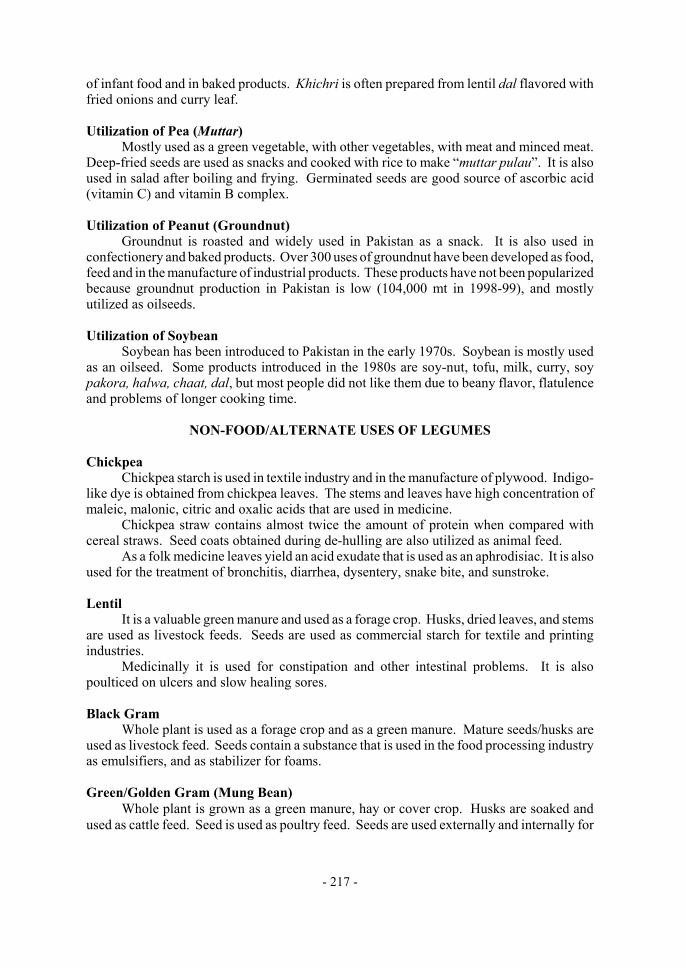
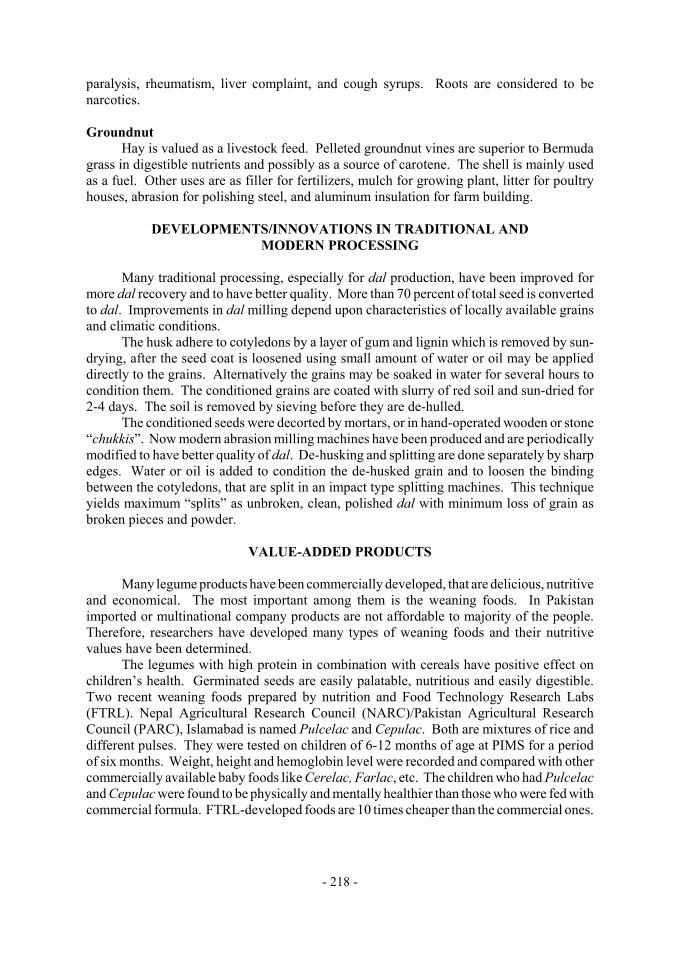

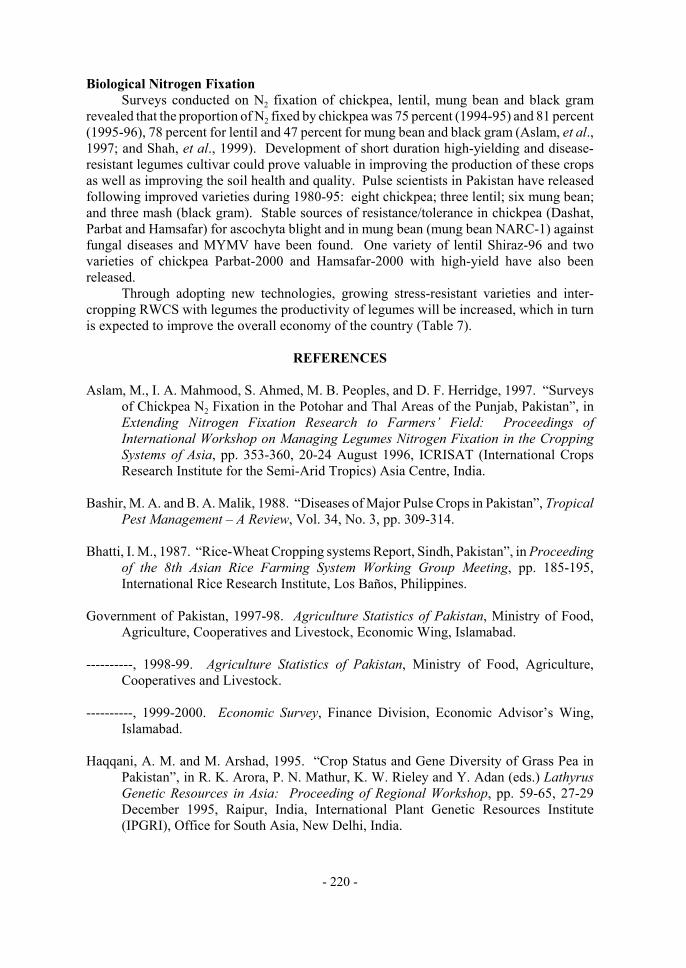
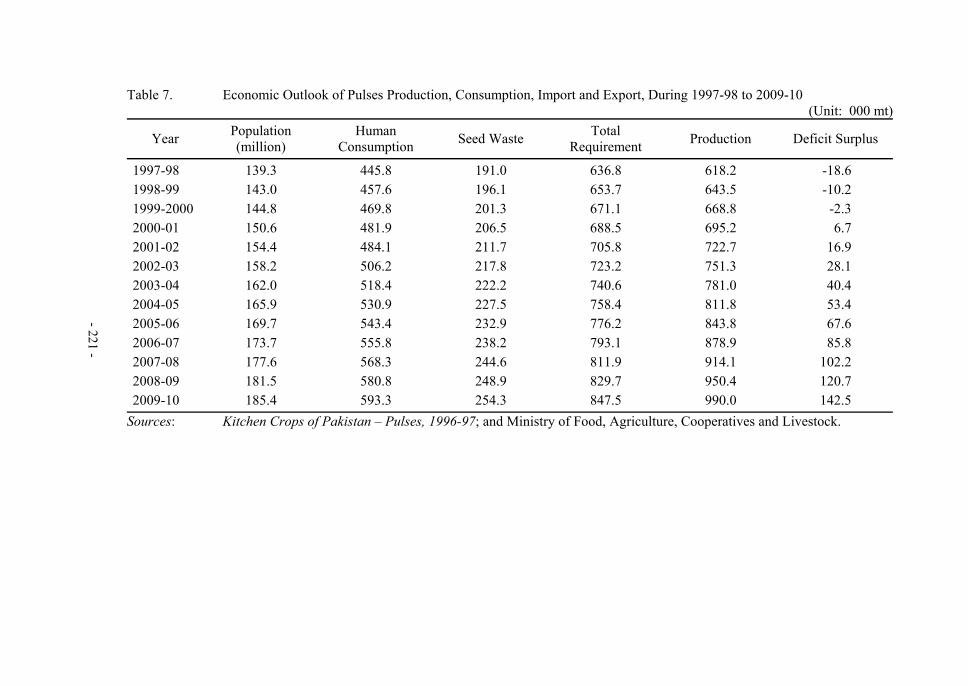
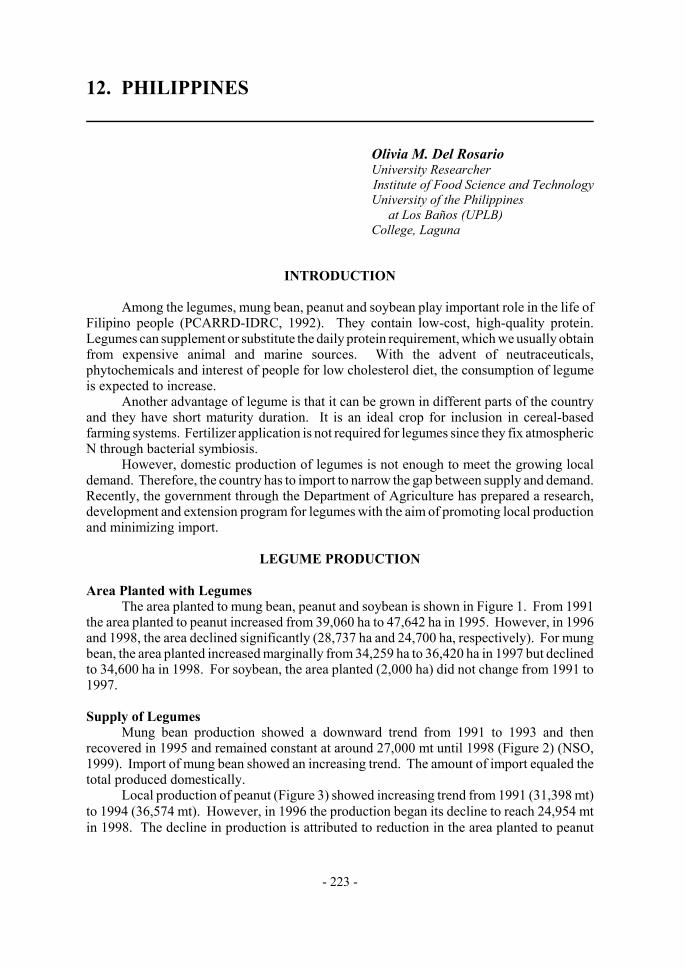
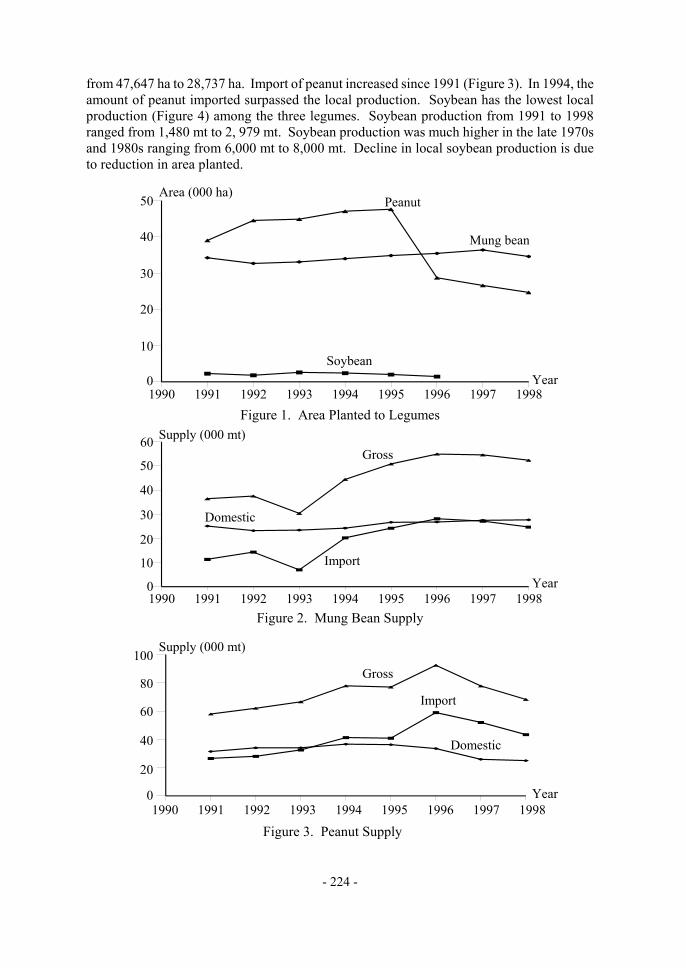
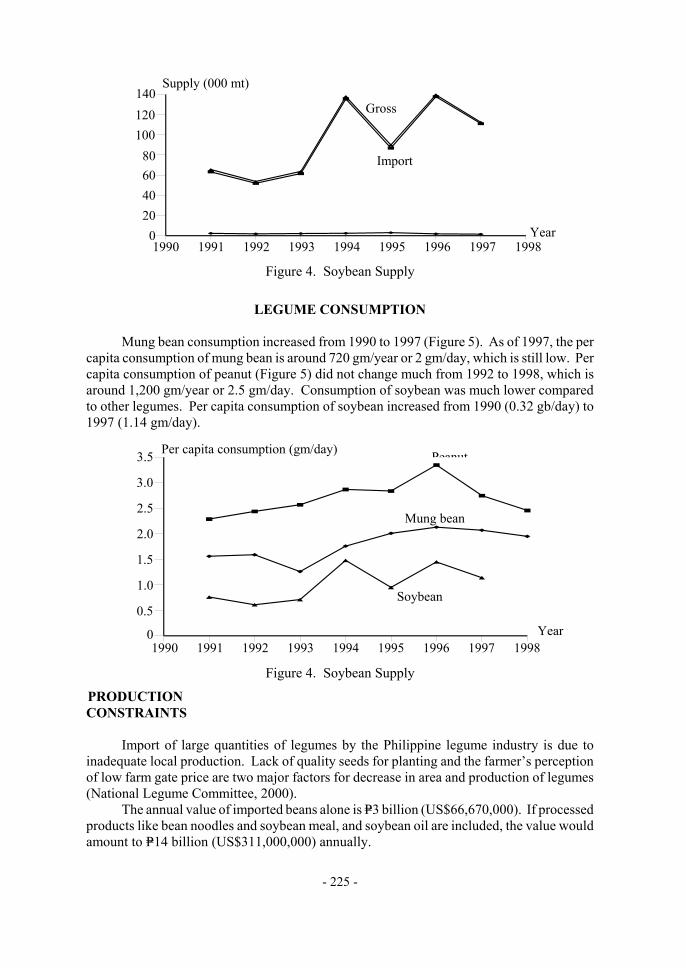
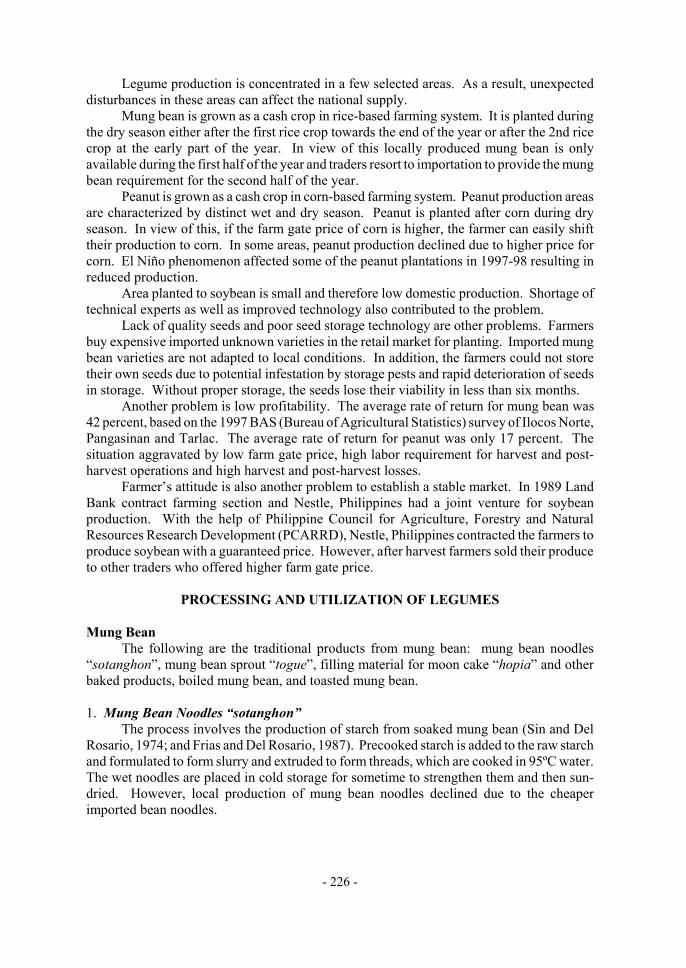
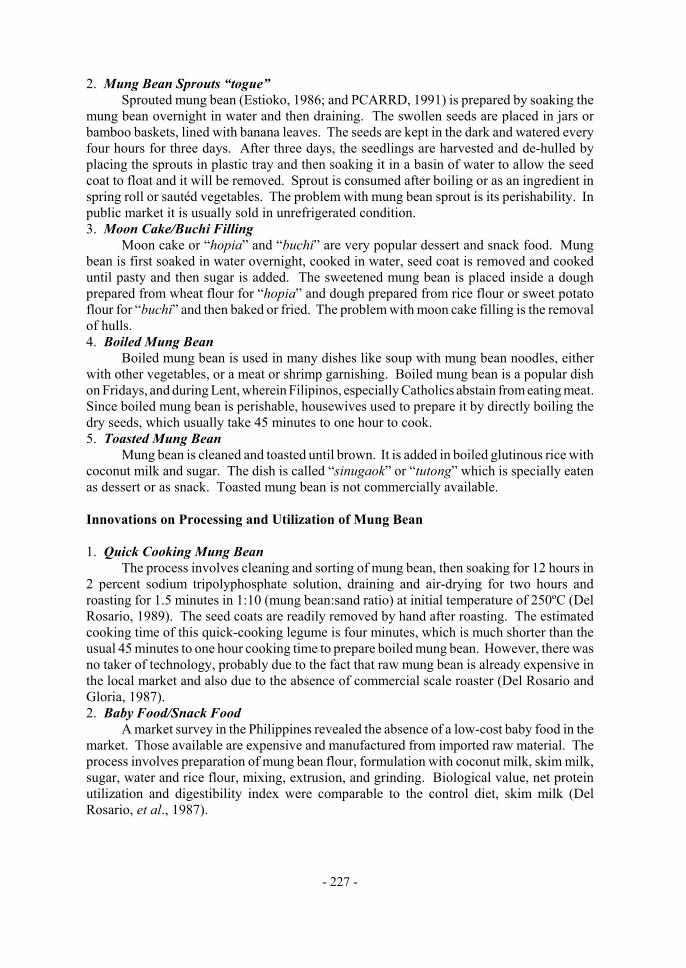


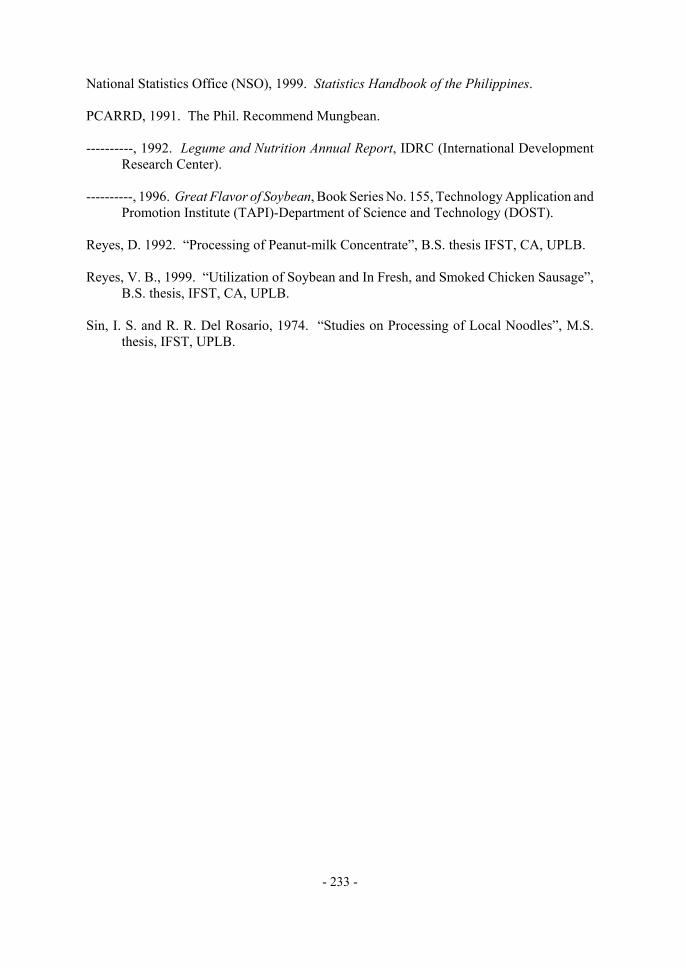
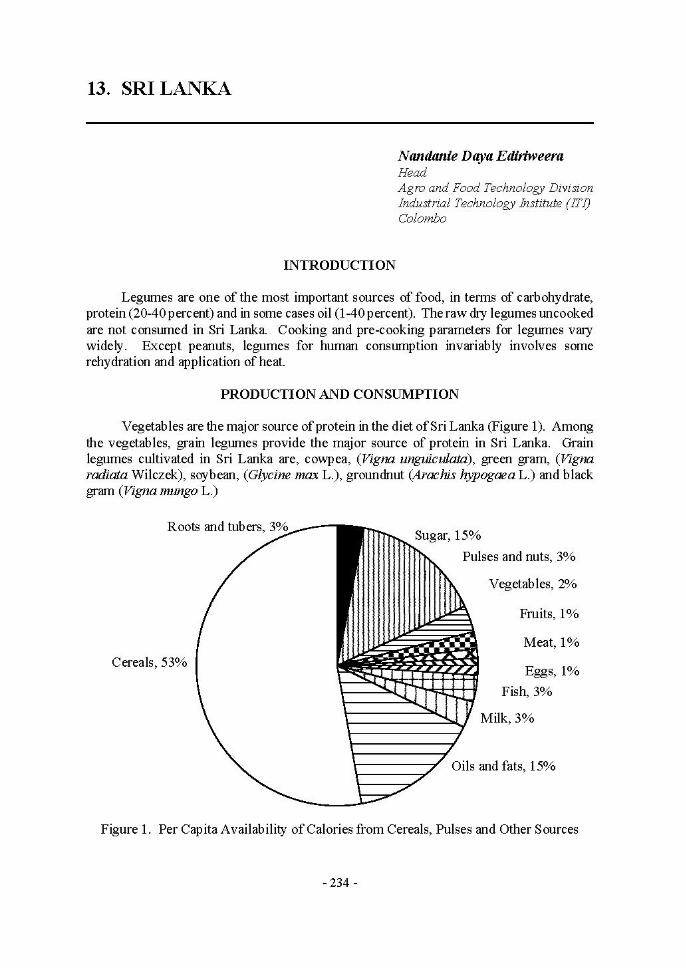
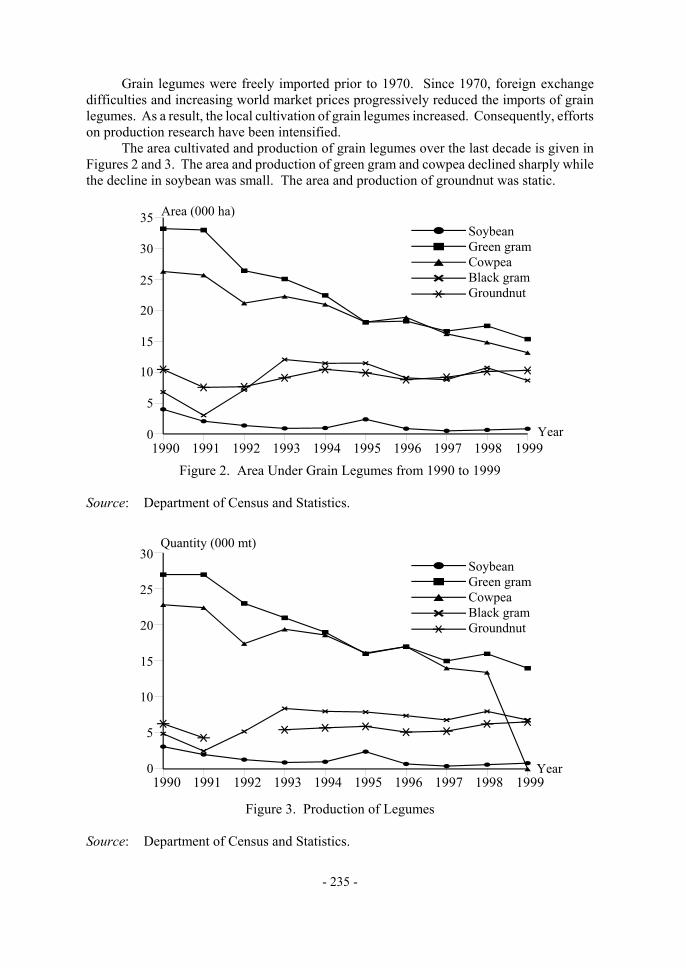
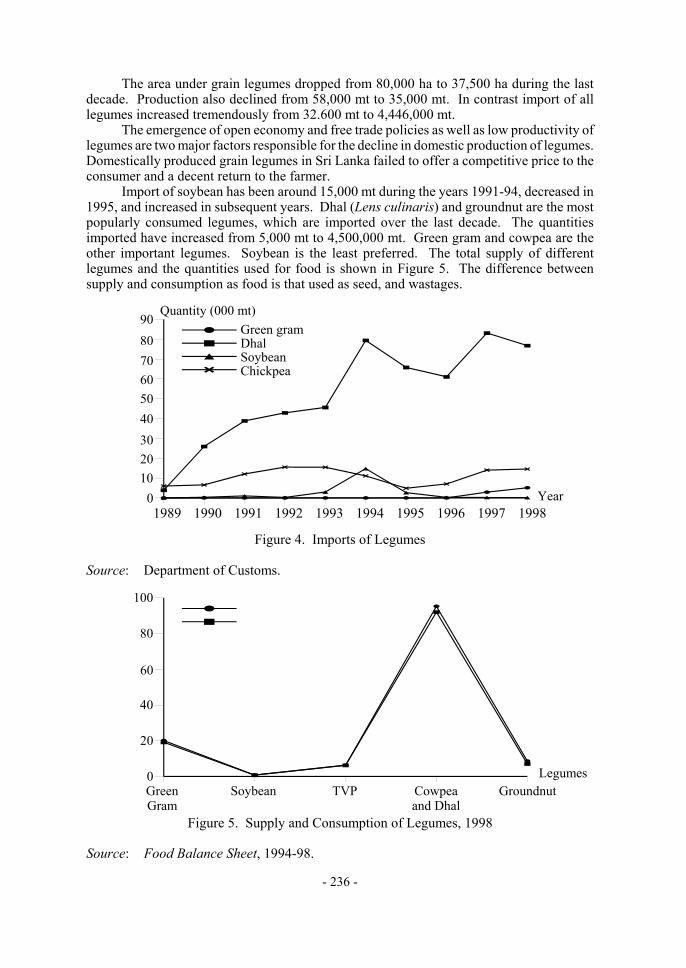

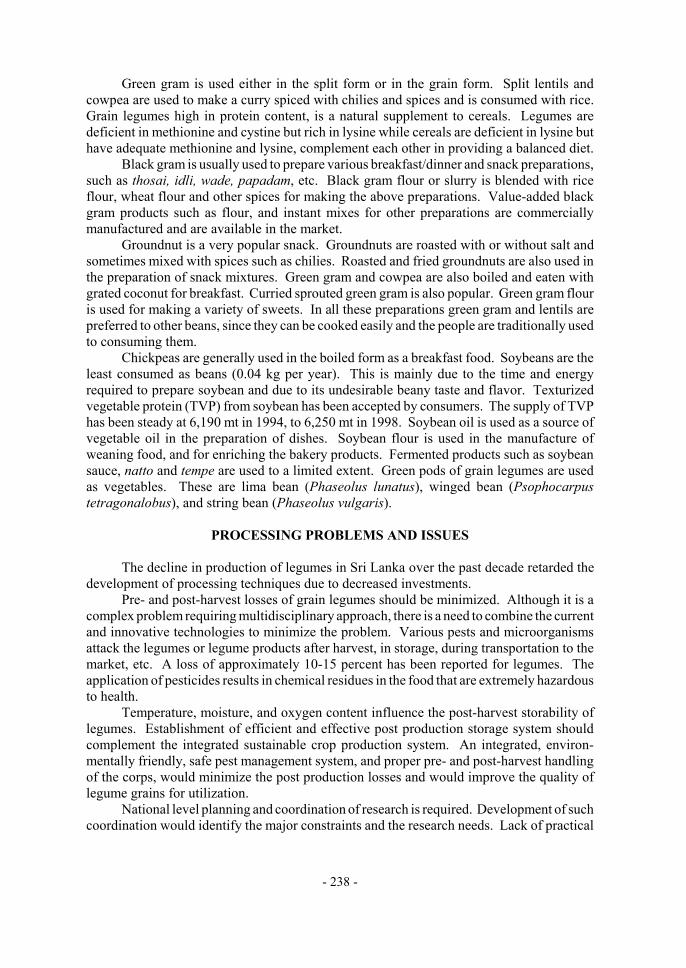


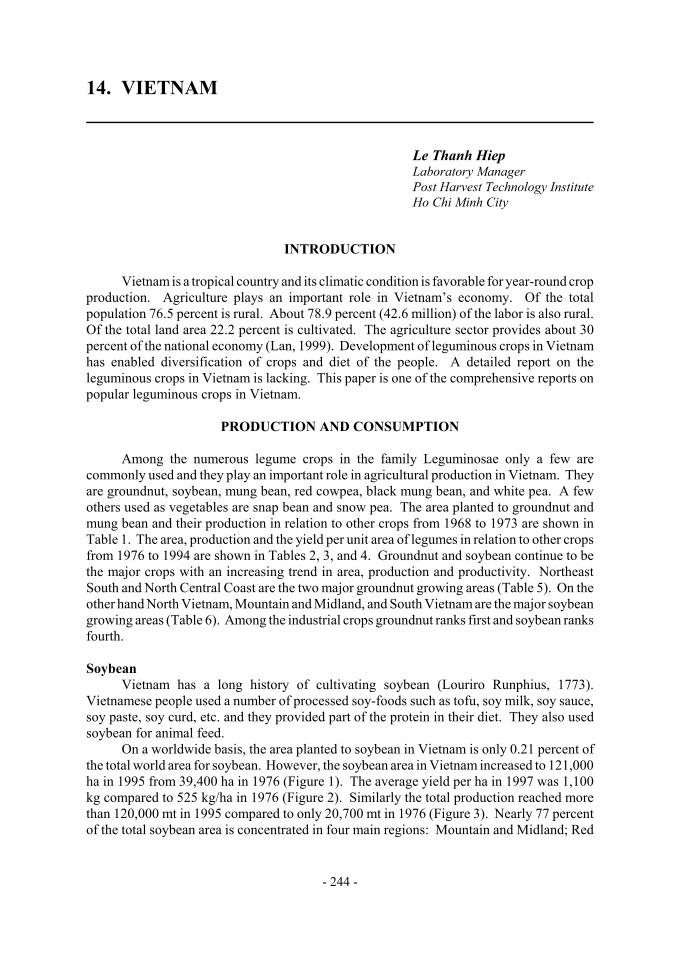

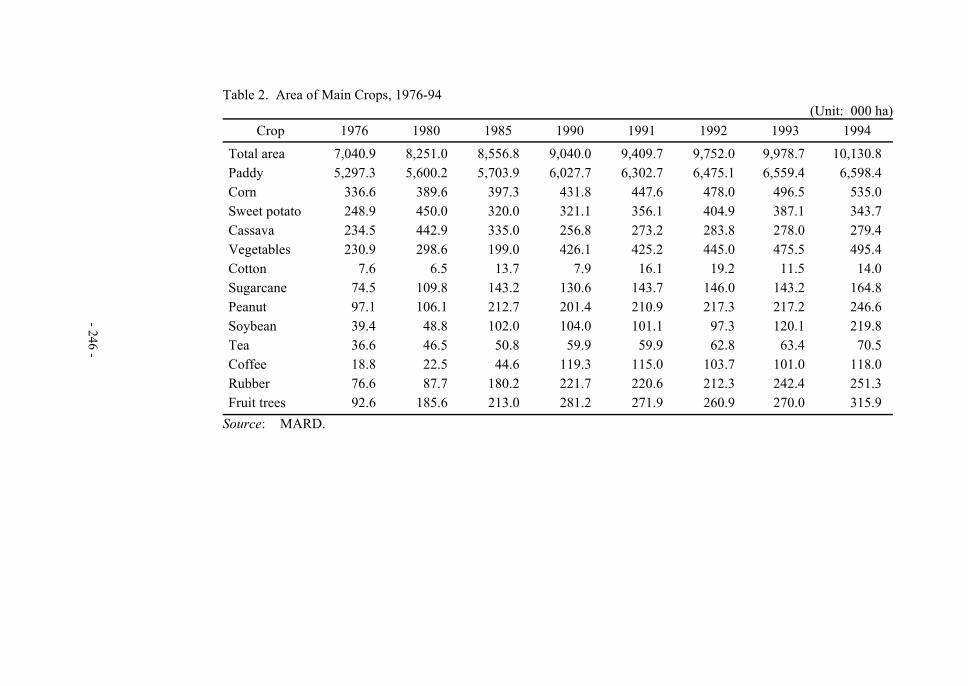
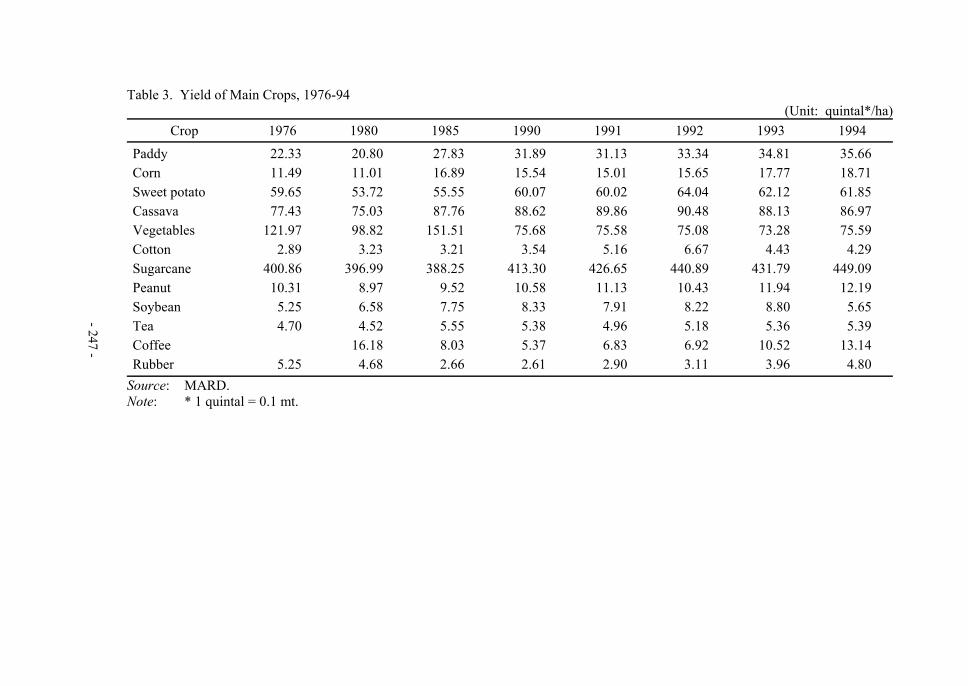
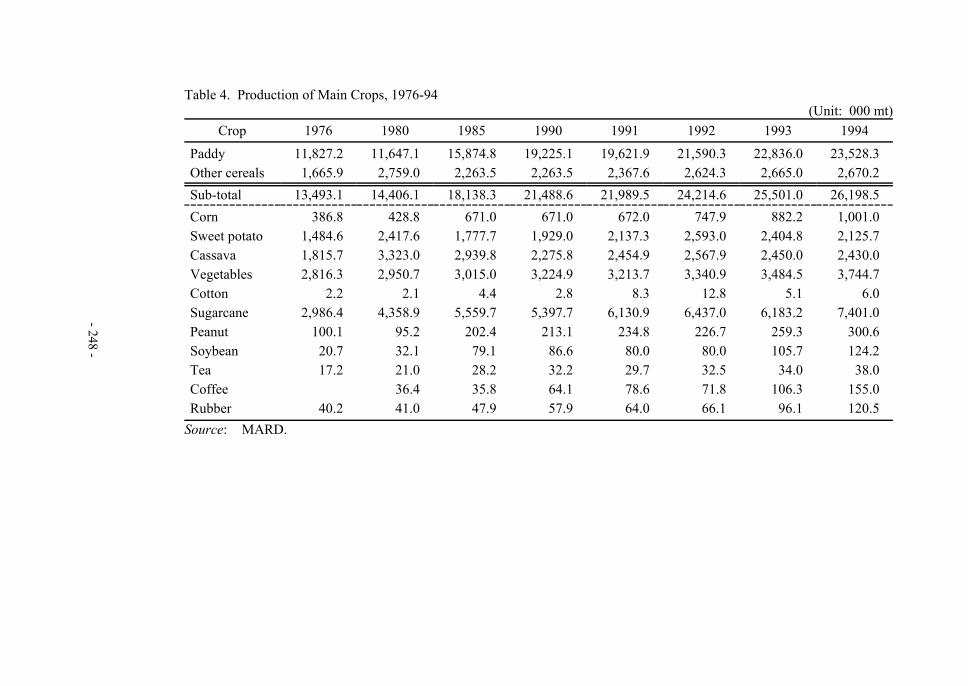


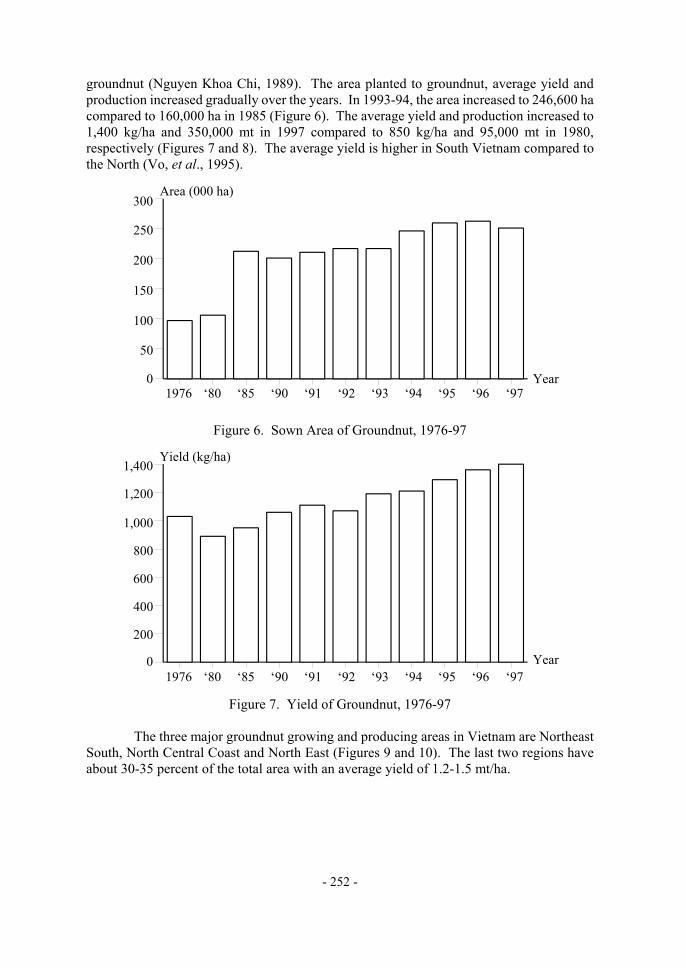
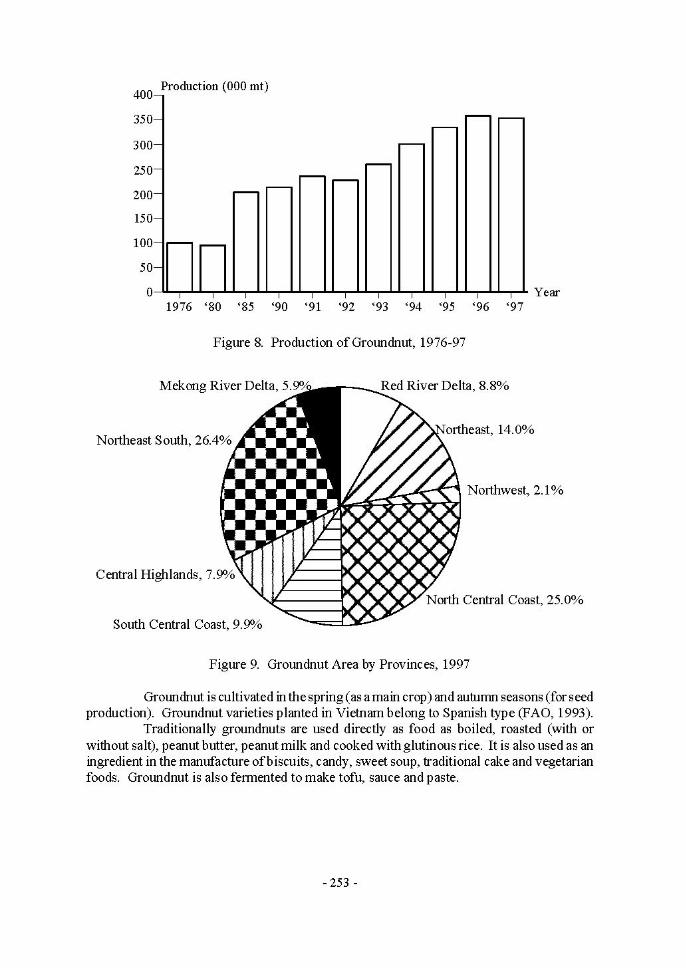
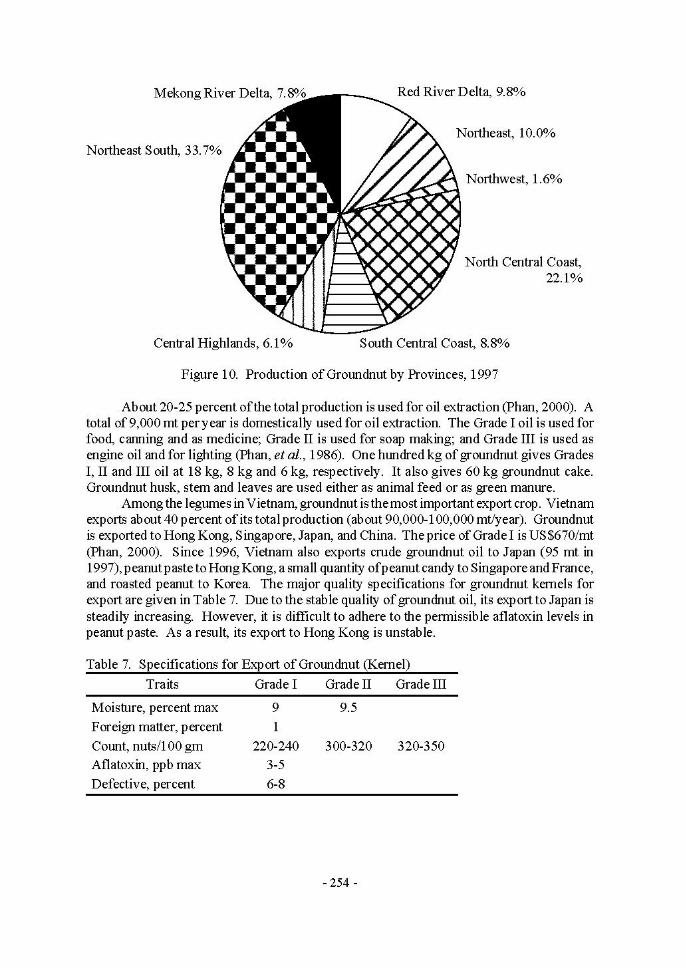

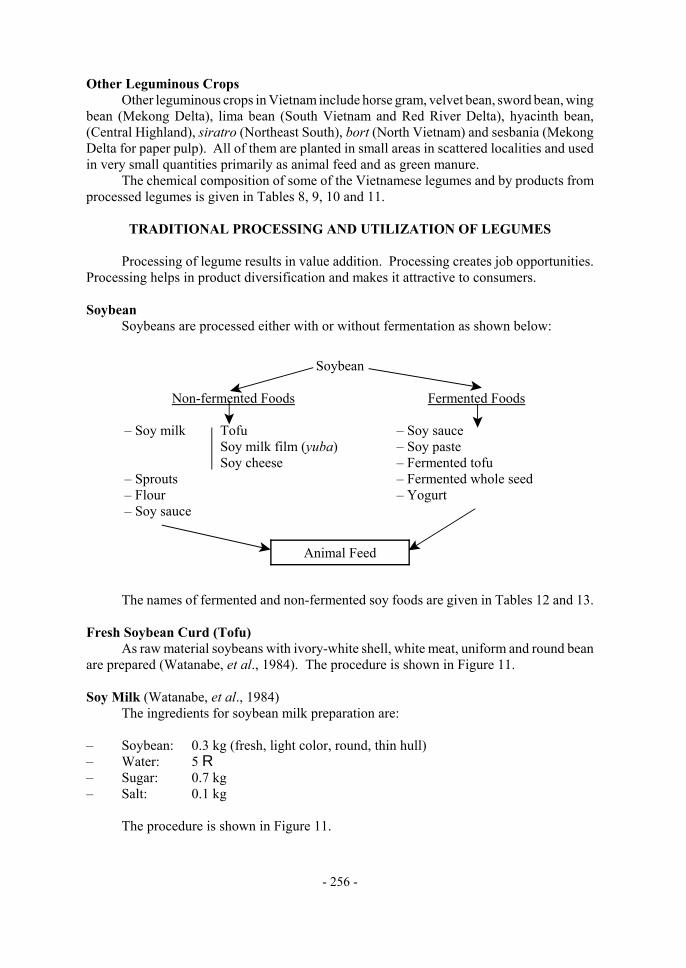
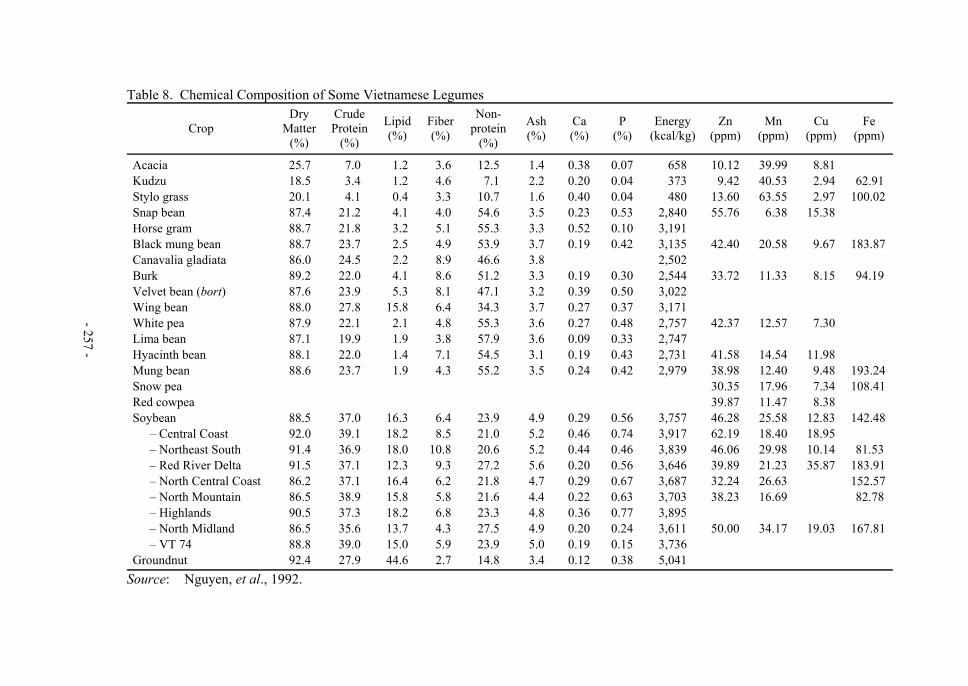
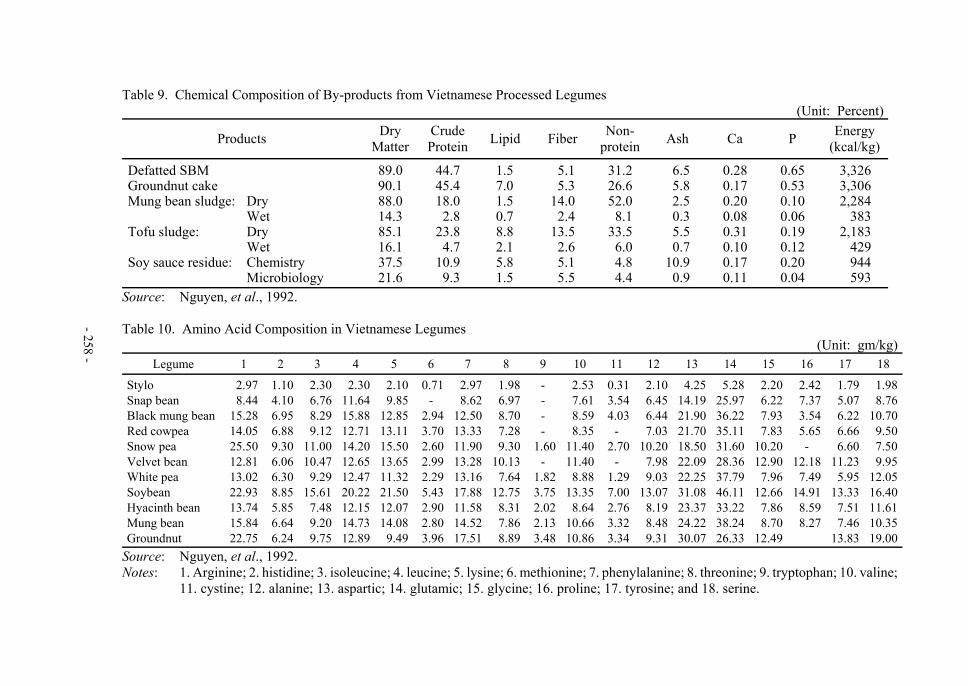
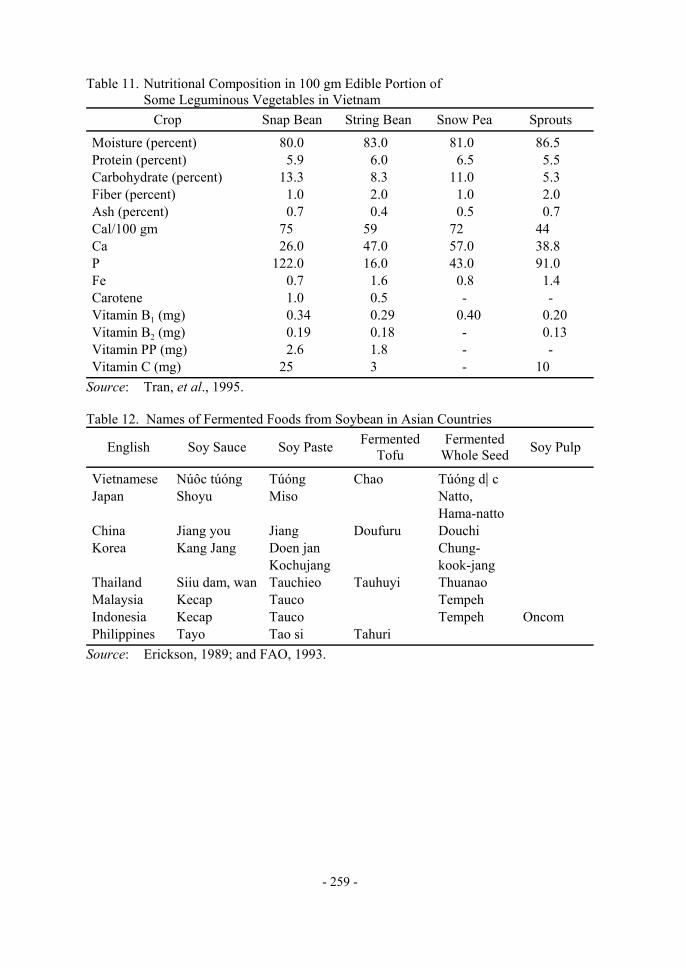
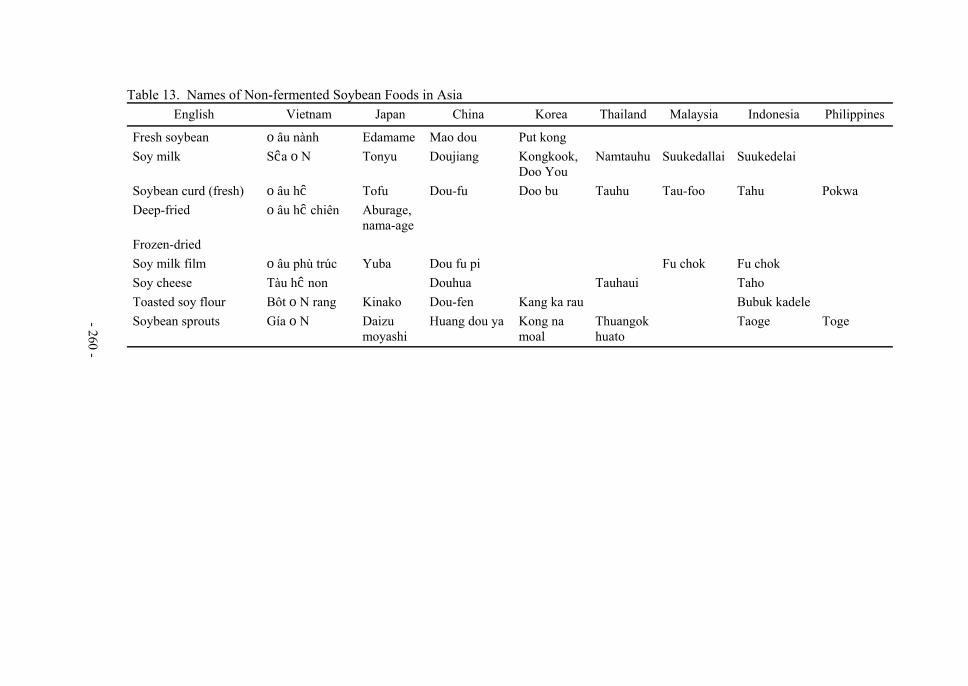


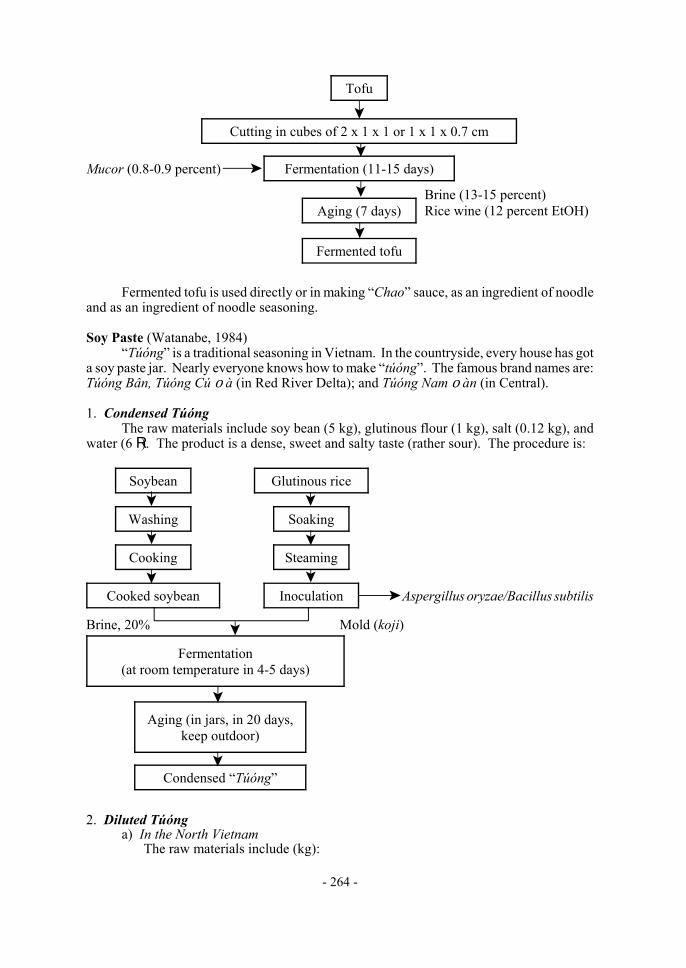
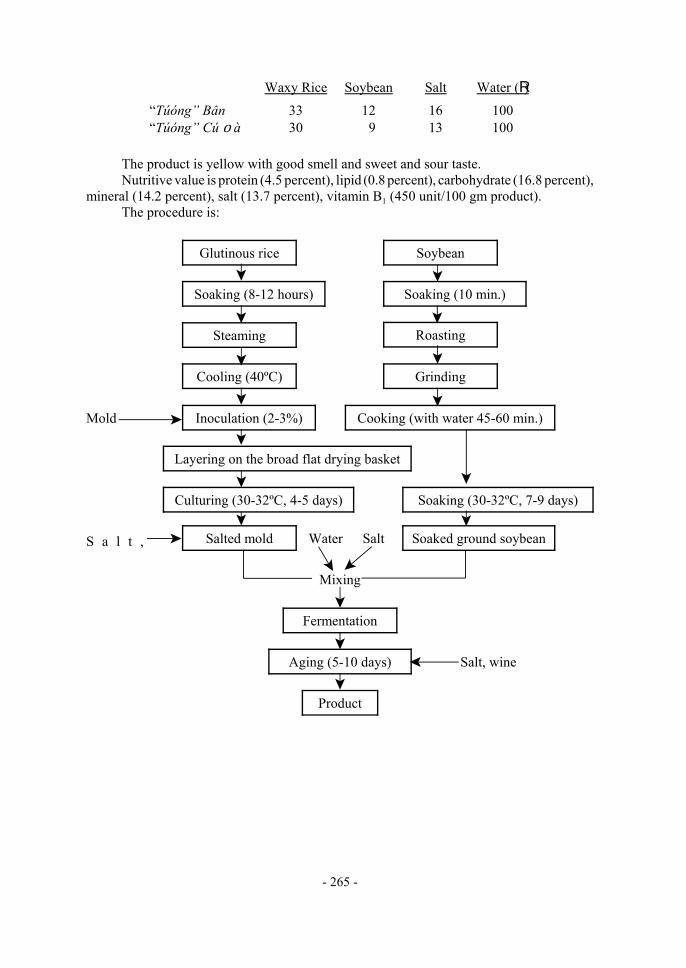

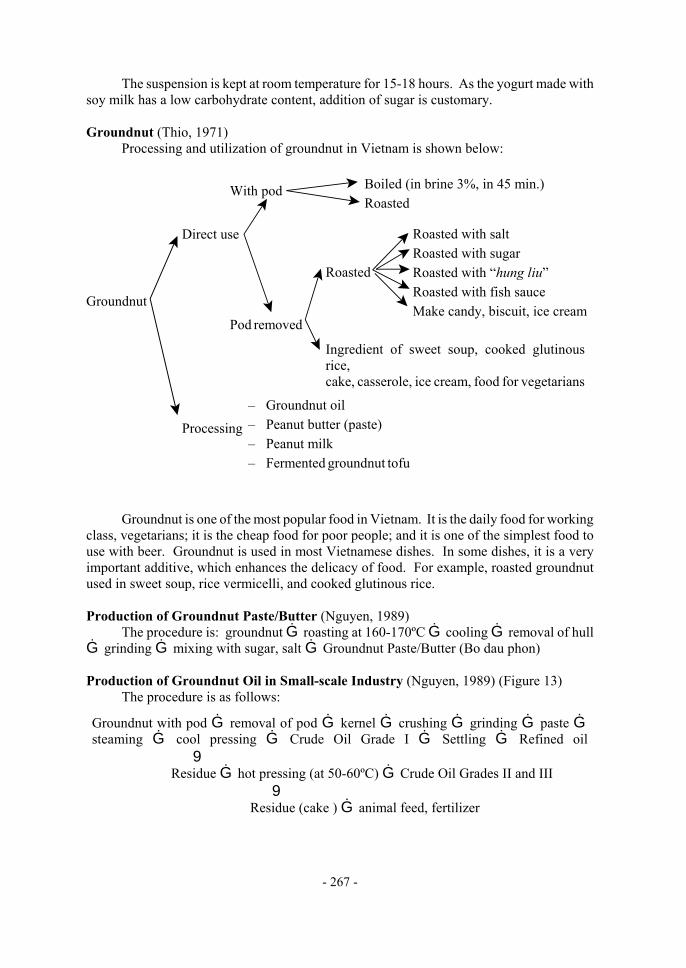
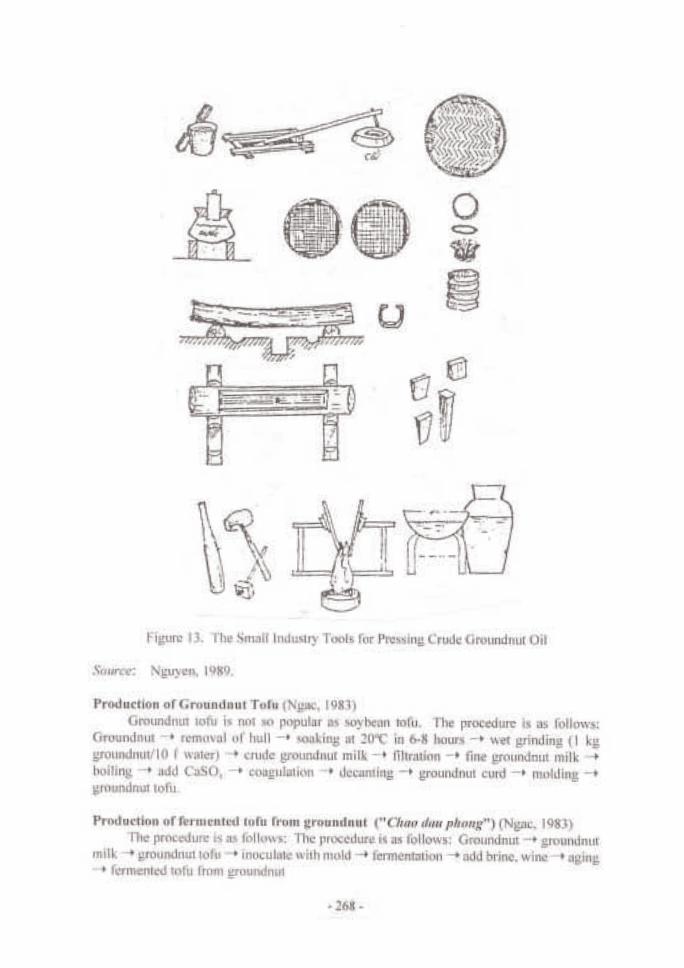
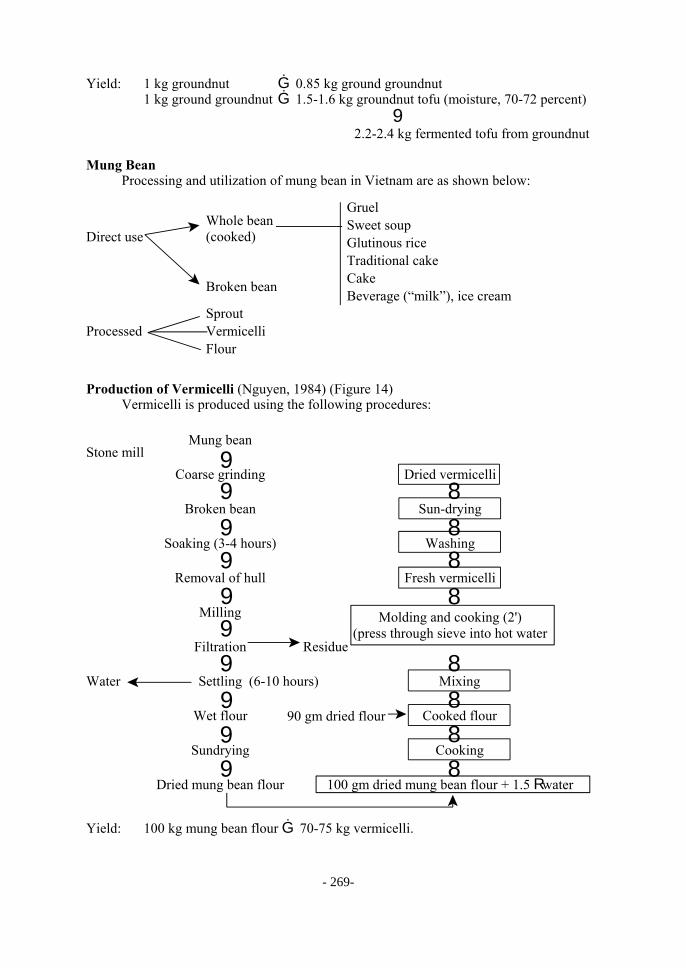
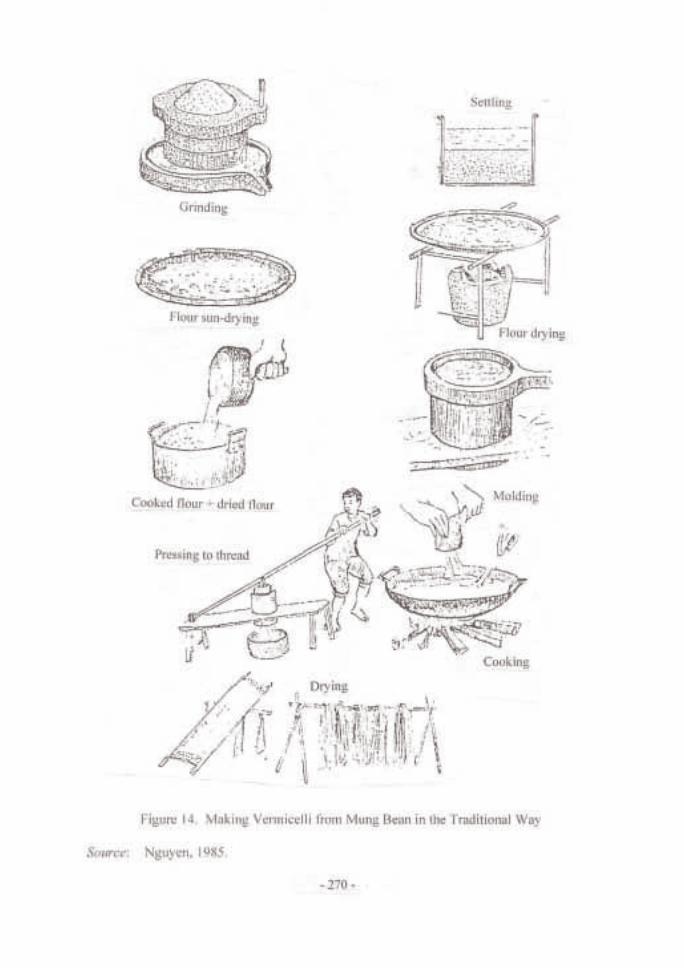
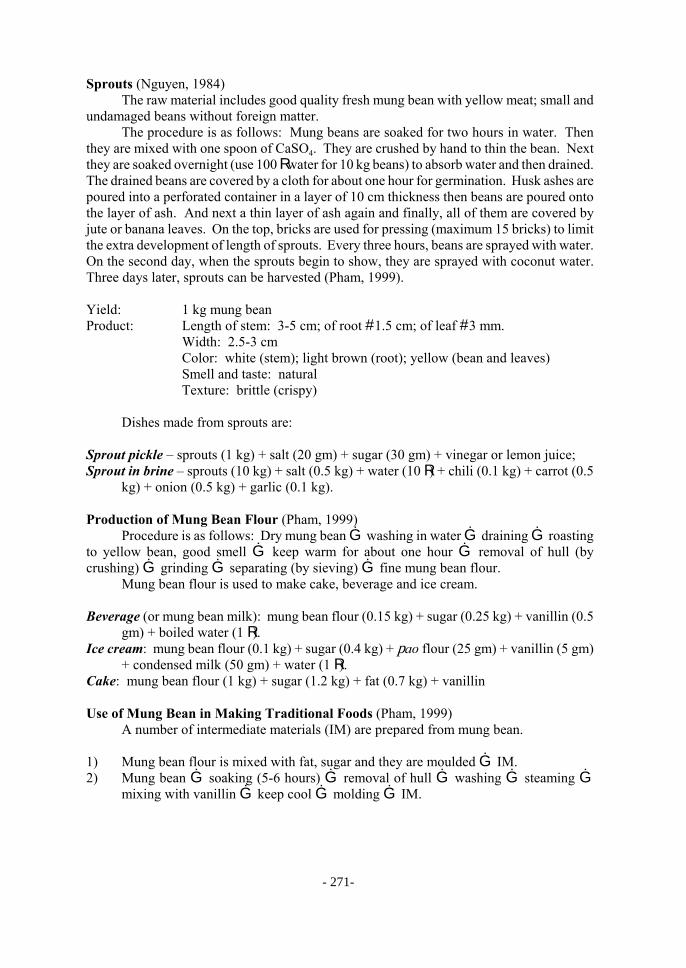
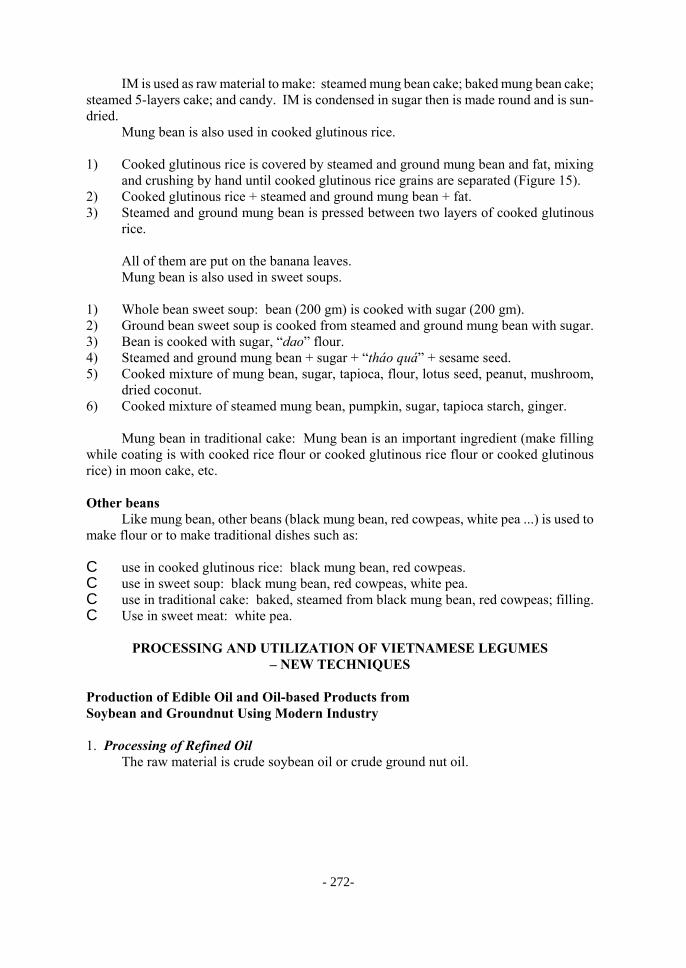

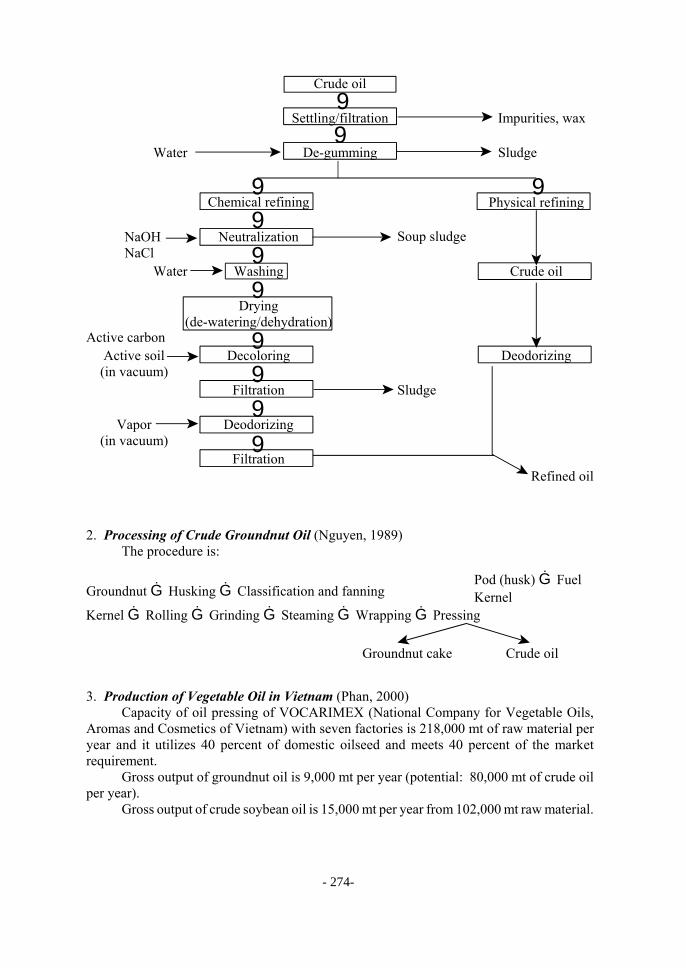

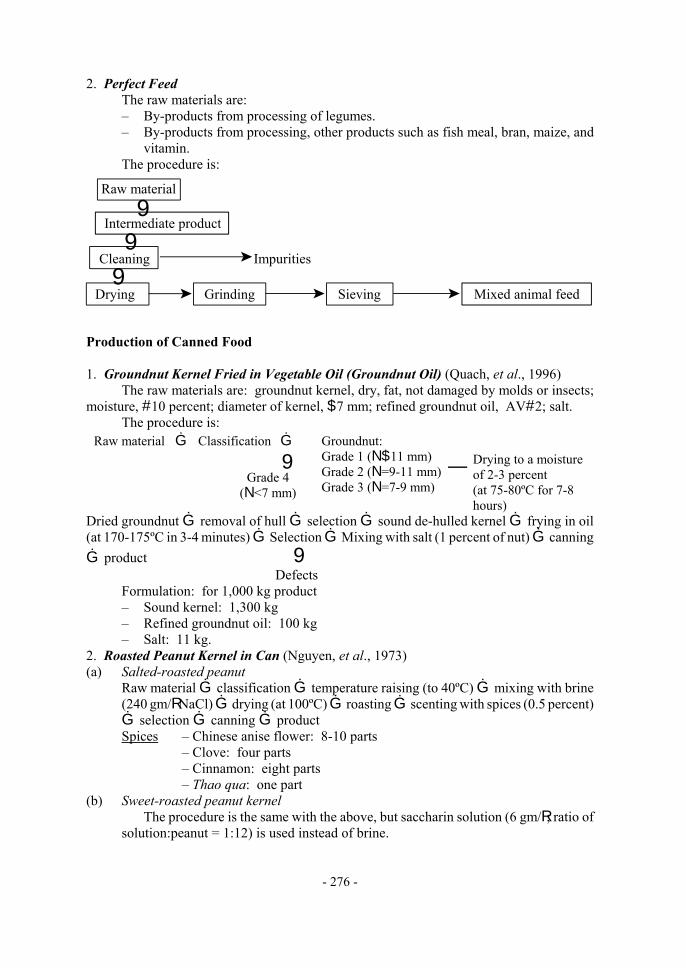
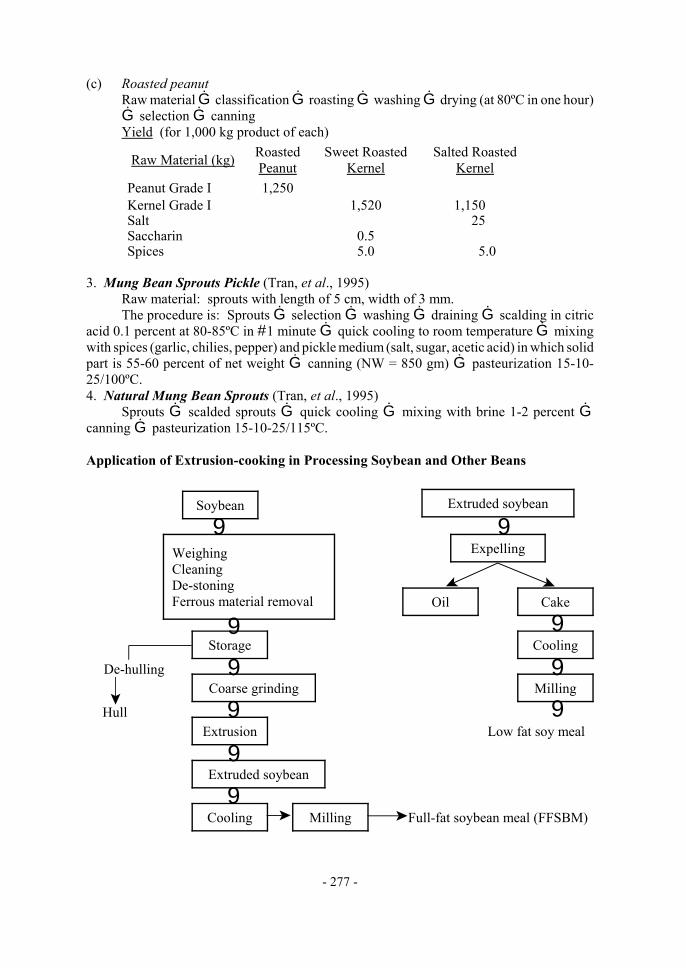
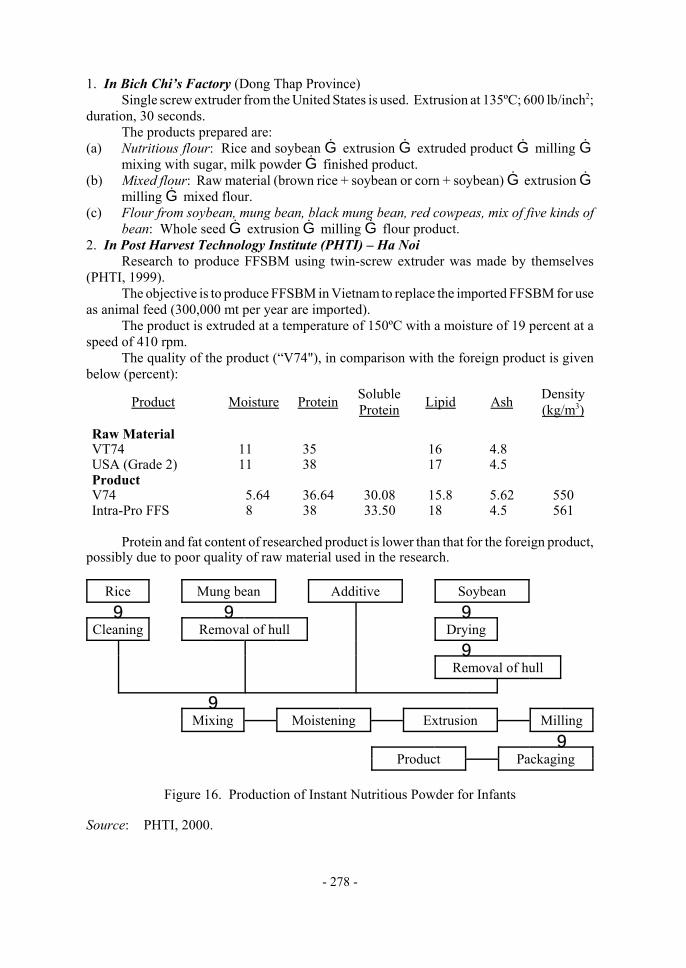
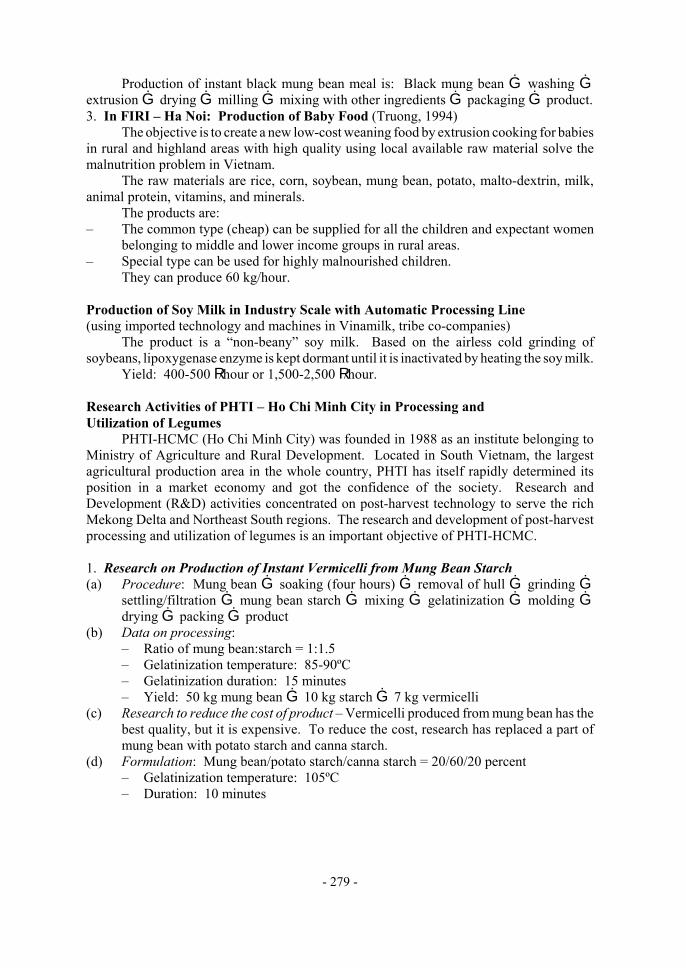
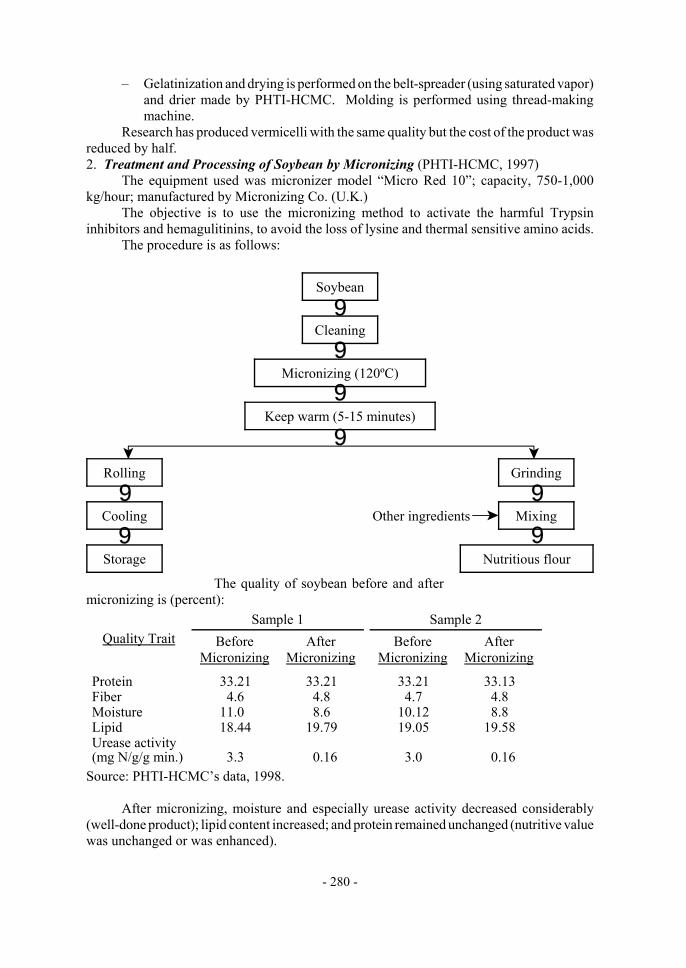
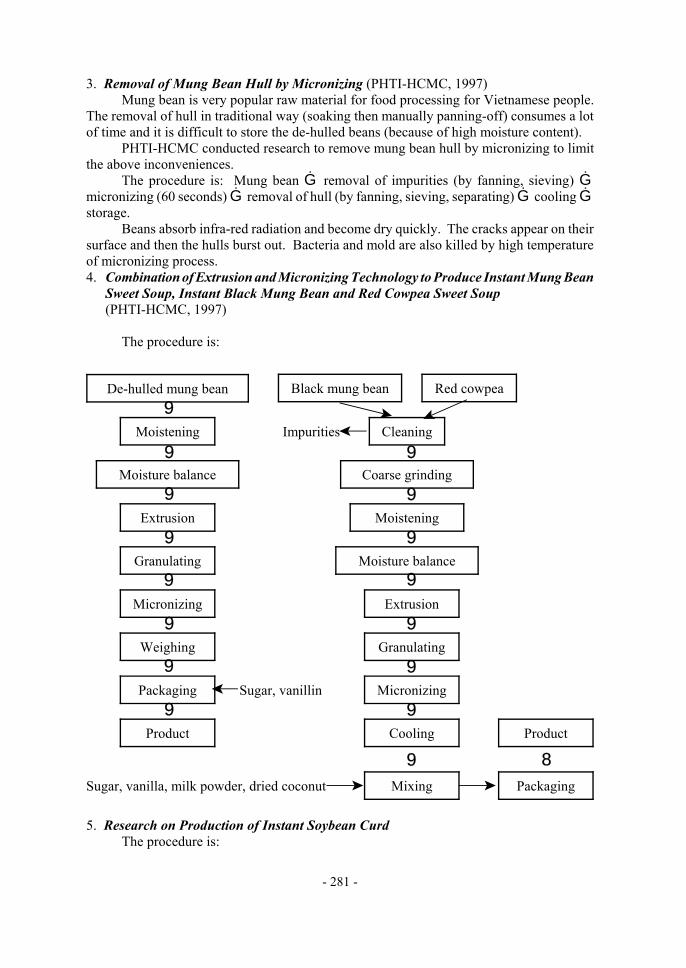
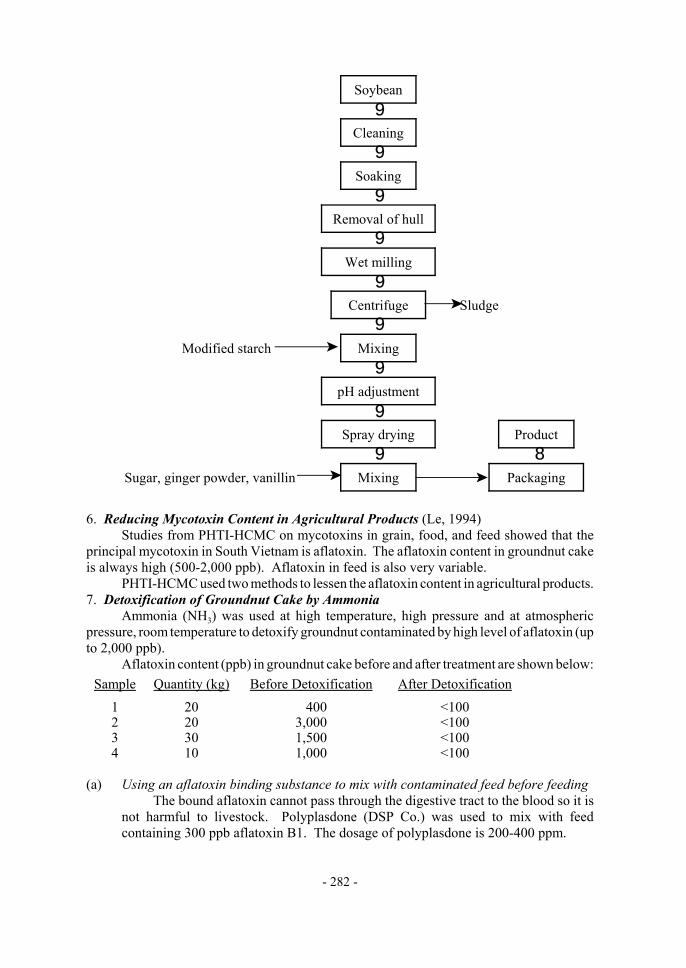
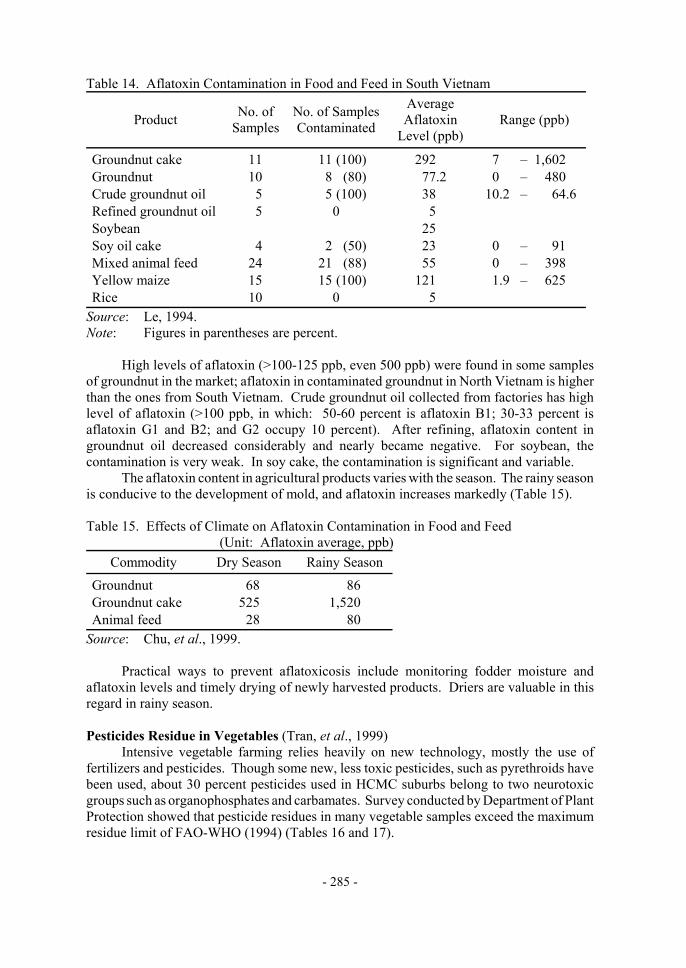


![Moringa Planting, Processing and Utilization Auto Saved]](https://static.documents.pub/doc/80x56/577d27d71a28ab4e1ea4faf3/moringa-planting-processing-and-utilization-auto-saved.jpg)

