Procrastination, Present-Biased Preferences, and Financial Behaviors Jeffrey Brown University of Illinois at Urbana-Champaign and Alessandro Previtero University of Western Ontario Prepared for the 16 th Annual Joint Meeting of the Retirement Research Consortium August 7-8, 2014 Washington, DC The research reported herein was pursuant to a grant from the U.S. Social Security Administration (SSA), funded as part of the Retirement Research Consortium (RRC). The findings and conclusions expressed are solely those of the authors and do not represent the views of SSA, any agency of the federal government, the University of Illinois at Urbana-Champaign, the University of Western Ontario, or the Center for Retirement Research at Boston College.
Transcript
Procrastination, Present-Biased Preferences, and Financial Behaviors
Jeffrey Brown University of Illinois at Urbana-Champaign
and Alessandro Previtero
University of Western Ontario
Prepared for the 16th Annual Joint Meeting of the Retirement Research Consortium August 7-8, 2014 Washington, DC
The research reported herein was pursuant to a grant from the U.S. Social Security Administration (SSA), funded as part of the Retirement Research Consortium (RRC). The findings and conclusions expressed are solely those of the authors and do not represent the views of SSA, any agency of the federal government, the University of Illinois at Urbana-Champaign, the University of Western Ontario, or the Center for Retirement Research at Boston College.
1
Abstract We provide new and robust empirical evidence that procrastinators behave
differently than non‐procrastinators for five important retirement‐related financial behaviors.
Empirically, we define a procrastinator as an individual who waits until the last day of their
health care open enrollment period to make their plan election. Using three separate
administrative data sets, we show that procrastinators are: (i) less likely to participate in a
supplemental savings plan, (ii) take longer to sign up for 401(k) plans, (iii) contribute less, (iv)
are more likely to stick with default portfolio allocations, and (v) are less likely to take the
annuity payout option from their DB plan, especially when the plan is framed so as to make the
investment features more salient. Further evidence shows that these findings are best
explained by procrastination being the outcome of present‐biased preferences, consistent with
the predictions of leading economic models of procrastination.
1
“You cannot escape the responsibility of tomorrow by evading it today.” - Abraham Lincoln
1. Overview
The popular press is full of articles pointing fingers at procrastination as an enemy of
good financial planning. The idea is certainly intuitive: planning for retirement involves near‐
term actions with distant consequences, and it is easy to put it off when faced with more
immediate temptations or demands on one’s time. Indeed, the trade‐off between near‐term
costs and distance consequences is the reason that economists treat procrastination as a
stemming from present‐biased preferences (e.g., Akerlof 1991; O’Donoghue and Rabin 1999).
Surprisingly, however, there is very little empirical research to confirm or refute the idea that
procrastination has a meaningful effect on financial security in retirement, and virtually no
empirical work showing that procrastination arises from present‐biased preferences. This
paper seeks to fills that void. First, we provide robust evidence that procrastinators behave
differently than non‐procrastinators when it comes to major actions related to financial
preparation for retirement. Second, we then discuss why the existence of present‐biased
preferences is the only theory that is consistent with the entirety of our empirical results.
We construct a novel empirical measure of procrastination based on actual decision‐
making delays, an approach that can be easily implemented using administrative data on
benefit choices. Specifically, we measure procrastination by whether an individual waits until
the last day of an open enrollment window to make their health care plan election. We label
those who wait until the last day as “procrastinators,” whereas those who make their health
care plan election in advance of the deadline are labeled as “non‐procrastinators.”
2
We then examine how procrastinators differ from non‐procrastinators when it comes to
five financial behaviors that are important for retirement planning and find significant
differences for all five. Relative to non‐procrastinators, we find that procrastinators: (i) less
likely to participate in supplemental savings plans, (ii) conditional on eventually signing up, take
longer to join, (iii) contribute less, (iv) have a higher fraction of their portfolio in default
portfolio options and are more likely to have 100% of their portfolio invested in the default
portfolio, and (v) are less likely to annuitize (i.e., more likely to take the lump sum option) from
DB plan, and that this relation is strongest when the lump‐sum is most salient. The results are
extremely robust to a wide range of variable definitions, specifications and other robustness
checks.
There are numerous advantages of using observed delays in making health care plan
elections as an empirical measure of procrastination rather than using self‐reported survey
measures or low‐stakes lab experiments that are common in the psychology literature. A key
advantage is that the consequences are real rather than hypothetical. In particular, both health
care plan elections and retirement plan choices are financially consequential, which increases
confidence in the external validity of the findings. Another nice feature is that the health care
plan election and retirement plan choices are similar enough for the health care plan election
behavior to be informative, but not so similar as to introduce any mechanical correlations with
our outcomes of interest. For example, if we instead used delay in signing up for the
retirement plan itself as our measure of procrastination, one could certainly not measure the
causal effect of procrastination on the propensity to sign up for the same plan. Another benefit
of using administrative data is that it should be easy to replicate in any administrative data for
3
which the researcher has access to decision timing. Indeed, we use three different data sources
in this study, which itself increases the degree of confidence that this approach is robust.
Finally, reliance on administrative data substantially reduces concerns about measurement
error that often arise when using survey data.
With these advantages comes a potential concern that is common to many studies using
administrative data: namely, that we have a very limited set of demographic controls. We take
some comfort in showing that the effect of procrastination exists after controlling for gender,
age, plan effects, and year effects. In one of our three data sets, we have a few additional
controls (noisy proxies for education and financial literacy), and find that their inclusion has no
effect on our estimate of the effect of procrastination on probability of participating in a
supplemental plan. Given the limitations of administrative data, however, we must rely on the
identification assumption that the set of correlations between observed procrastination in
making one’s health care plan election and the numerous financial behaviors that we study are
not driven by an unobserved factor.
Having established a robust correlation between procrastination and important financial
behaviors, we then turn to the task of showing that our measure of delay is indeed a measure
of procrastination that derives from present‐biased preferences. We do this by ruling out
alternative stories, including optimal delay, rational inattention, or the basic notion that
individuals may simply be busy or disorganized. For example, we use data on the frequency of
interactions with the plan election tool to separate optimal delayers from procrastinators, and
show that our results are being driven by the procrastinators. We also do a stylized calculation
to show that these are consequential decisions, which casts significant doubt that rational
4
inattention could explain our results. We also discuss that a subset of our results – namely
those related to contribution rates conditional on saving, and those related to annuitization –
are consistent with present‐biased preferences and not alternative stories. In the end, the only
hypothesis that can explain the entirety of our results is that individuals with present‐biased
preferences are more likely to procrastinate, and this combination of preferences and behavior
lead them to behave quite differently from non‐procrastinators when it comes to preparing for
retirement.
This paper proceeds as follows: In section 2, we provide a very brief overview of the
existing literature on procrastination, drawing upon both psychology and economics. In section
3, we explain the three administrative data sets that we use in our empirical work. We explain
our methodology in section 4 and present our key results in section 5. In section 6, we discuss
why our results are most consistent with present‐biased preferences, rather than other
hypotheses, as the underlying reason for procrastination. Section 7 provides a summary and
conclusions.
2. A Brief Review of the Literature on Procrastination
Procrastination is a feature of human behavior with a very long pedigree. As far back as 800
BC, the Greek poet Hesiod stated:
“Do not put your work off till tomorrow and the day after; for a sluggish worker does not
fill his barn, nor one who puts off his work …”1
1 This quote, along with much of the discussion of the psychology literature, is summarized from an excellent survey article by Steel (2007). A less technical summary of this same material can be found at: http://www.slate.com/articles/life/procrastination/2008/05/procrastination_2.html
5
It is not surprising, then, that procrastination has received significant attention in the
psychology literature. Harriott and Ferrari (1996) provide evidence that procrastination is
widespread, with chronic procrastination affecting as many as one in five adults. As an aside,
professors reading this paper may not be surprised that procrastination is more prevalent
among college students!
Because researchers have documented stability of procrastination tendencies across time
and situations, some psychologists consider procrastination to be a personality trait that is at
least part biological or genetic in nature (Arvey, et al 2003), although not all agree with labeling
it a personality trait. Steel (2007) concludes that procrastination is one aspect of
conscientiousness, which is itself considered to be one of the “Big Five” personality traits in the
psychology literature.
Among economists, Akerlof’s 1991 Richard T. Ely Lecture is often viewed as ground zero
for the formal treatment of procrastination. He models individuals as overweighting near‐term
costs and heavily discounting future costs. He speculates that procrastination could help
explain the difficulties that many individuals have in saving adequately for retirement, although
he does not test this proposition. Building on Akerlof’s insights, O’Donoghue and Rabin (1999)
coined the term “present biased preferences” to refer to the broad class of models – including
Laibson’s (1997) influential model of hyperbolic discounting model – in which individuals have
time‐inconsistent preferences that lead them to place a disproportionately greater weight on
near‐term well‐being than more distant well‐being. In their model, a person with present‐
biased preferences (and who is not sophisticated enough to recognize this proclivity and
6
engage in self‐control to overcome it) will tend to procrastinate in the face of near‐term costs
of action.
In household finance, researchers have suggested procrastination as one of several
possible explanations for why default options (such as auto‐enrollment into 401(k) plans) have
such a powerful effect on behavior (Beshears et al 2009). Although both intuitive and
consistent with many observed behaviors, we have little empirical evidence that provides a
direct causal link between procrastination and these financial behaviors. Our study intends to
fill this gap.
3. An Overview of Three Administrative Data Sets
This paper makes use of three different administrative data sources that all share a
common feature: the ability to link one or more retirement plan choices with a measure of
whether each individual delayed the timing of their health care plan election.
Our first data set is used to study whether an individual chooses to participate in a
supplemental savings plan. Specifically, we obtained data from the University of Illinois human
resources office for all individuals who joined the University system (including three major
campuses and central administration) during 2010. Our sample includes 2,674 individuals that
joined during the year and had 30 days to make their initial health care plan election. In this
data, we will define a “procrastinator” as someone who waits until the last day of their 30 day
window to make their health care plan election. We will then correlate this measure with
whether or not the individuals were participating in one or both of the voluntary, supplemental
savings plans (a 403(b) plan, a 457 plan, or both) as of the final pay period in 2010. Summary
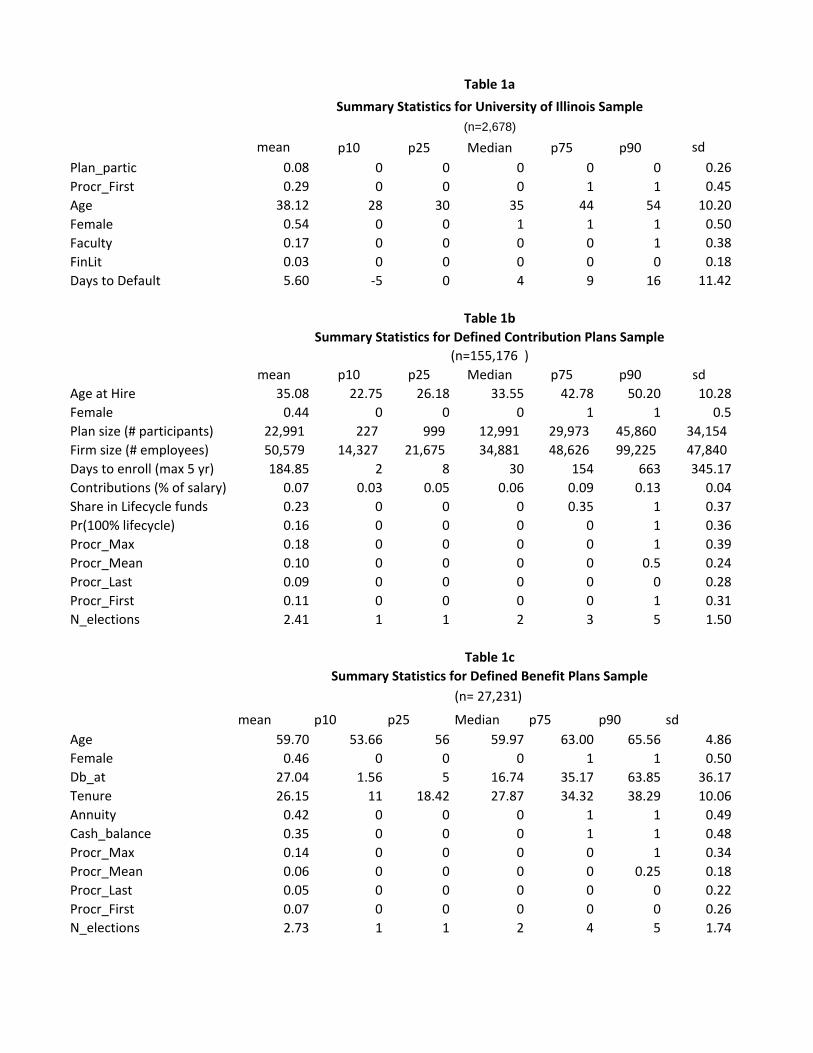
7
statistics for this data are presented in Table 1A. In this data, just over a quarter of new
employees (28.4%) waited until the last day to make their health care plan decision.
The second dataset is a sample of 155,176 employees participating in 27 defined
contribution (DC) plans from 23 distinct firms. In this data, provided by a large record‐keeper,
we observe the number of days it takes an individual to enroll in their DC plan, their DC plan
contribution rates, and their portfolio allocations. Our sample consists of everyone who joined
one of the firms between 2002 and 2008 and is still with the firm as of the end of 2008. Table
1b shows that the average age of those joining the firms is just around 35 years, with a slight
majority male. As can be seen, these are very large plans and large firms, with nearly 23,000
participants per plan on average and over 50,000 employees per firm. Depending on our
definition of procrastination, which we will discuss in more detail below, procrastinators
comprise between 9% and 18% of the sample.
A third data set, also from a large record‐keeper, allows us to observe the annuity
versus lump‐sum decisions of individuals retiring from 63 defined benefit (DB) plans, offered by
37 different firms. In this data, we observe individuals retiring from the plan from 2002 to 2008
and making a lump‐sum versus annuity choice. Table 1c shows summary statistics for this DB
sample. Keeping in mind that these are individuals making a lump‐sum versus annuity choice
upon separation from the firm, it is not surprising that the population is older with a mean and
median age of 60. Depending on our definition, procrastinators comprise between 5% and 14%
of the sample.
8
4. Empirical Strategy
4.1 Defining procrastination
In the University of Illinois data, we define procrastination as follows:
Procr_First = 1 if the individual waited until the last day of the 30‐day enrollment
window to make their initial health care plan election, and zero otherwise.
In our two multi‐plan data sets (the 55 DC plans and the 63 DB plans), we measure
procrastination four ways:
Procr_Max = 1 if at any time since 2002, the individual had at least one year in which
they waited until the last day to do their health care plan election, and = 0 otherwise.
Procr_Mean = the fraction of health care plan elections for which the individual waited
until the last day (varies from 0 to 1).
Procr_First = 1 if the individual waited until the last day to make their very first plan
election (i.e., when they were hired), and = 0 otherwise.
Procr_Last = 1 if they waited until the last day for the last year in which they made a
health care plan election, and =0 otherwise.
Note that we only have the Proc_First measure available in the University of Illinois data
because we only have a single open enrollment period in 2010, namely, the 30 days after the
individual starts employment.
4.2 Basic Specification
9
Our baseline specification is as follows:
,
where i signifies the individual and p the plan. Procr signifies one of the various procrastination
measures identified above. measures the effect of age in 5‐year increments (starting at age
18). We report results both excluding and including indicators for the year that each individual
joined the plan ( ) as well as plan indicators ( ). We will report OLS coefficients for most
specifications, although we also use a Cox Proportional Hazard model to examine the number
of days it takes to sign up for a DC plan. We have also confirmed that our results hold in non‐
linear models (Tobit and/or Probit) in addition to OLS. Standard errors are clustered on year
and plan.
Our specification is parsimonious out of necessity because our administrative data does
not include other demographic variables (the Illinois data is an exception that we will discuss in
the results section). We note, however, that even if we had other covariates, it is questionable
whether to include them because some standard demographic variables – such as education or
income – may themselves be partly determined by procrastination. For example, Tanaka,
Camerer and Nguyen (2010) show that procrastination negatively predicts income. Thus,
procrastination may have both direct and indirect (operating through other covariates) effects
on outcomes. Fortunately, as the results below will indicate, the inclusion of the covariates
that are available generally do not have any effect on the relation between procrastination and
the financial behaviors of interest.
10
4.3 Identifying Firms Using Automatic Enrollment
Some of the behaviors we intend to examine in DC plans are ones that are likely to be
affected by the presence of automatic enrollment. For example, Madrian and Shea (2001) and
Beshears et al (DATES) have shown compelling evidence that automatic enrollment increase
participation rates. Given these relations, we would ideally like to examine whether the effect
of procrastination differs in firms with default options versus those without. Unfortunately, our
administrative data does not include any indicators for whether a firm uses default options.
To address this, we make use of participant data to create a proxy measure to identify
which firms are most likely to have automatic enrollment in each year. Specifically, we note
that plans with defaults are more likely to exhibit three patterns of participant behavior. First,
a plan with automatic enrollment is likely to have an enrollment spike around the auto‐
enrollment date (measured in terms of days after employment). Second, there is likely to be a
spike in the fraction of individuals contributing at the automatic contribution rate, which we
will identify as the modal rate of saving (with a floor of 3% and a ceiling of 10%). Third, plans
with automatic enrollment were likely to use money market funds as the default investment
option prior to 2007 and to use life‐cycle, target date, or balanced funds after 2007 due to the
passage of the Pension Protection Act (PPA) of 2006. The PPA and related regulations issued by
the Department of Labor in 2007 defined life‐cycle, target date and balanced funds as
“Qualified Default Investment Alternatives” (QDIAs) which firms are now encouraged to use as
the default portfolio for individuals who are automatically enrolled.
We use a “30% rule” to proxy for which firms use automatic enrollment. Specifically, we
label a firm as having automatic enrollment if at least 30% of new hires enrolled on the same
11
day (not the same calendar day, but the same number of days following employment), if at
least 30% of new hires in a given plan year contribute (as of 1/1/2009) at the modal
contribution rate, and if at least 20% of new hires contribute 100% or their portfolio to a money
market fund before the PPA or to a QDIA after PPA. If a plan meets all three criteria, we label
them as having automatic enrollment in that and all subsequent years. Although our empirical
results are robust to using higher (30%) and lower (10%) cut‐offs, a nice feature of the 30% rule
is that we generate aggregate plan‐year patterns of default adoption that are reasonable in
comparison to external data – provided by PLANSPONSOR2 ‐ on the frequency of default
adoption by large plans. In 2003, for example, we estimate that 4 out of 26 firms (about 15%)
in our data have automatic enrollment, whereas the PLANSPONSOR data indicates that 20% of
plans with over $1 billion of assets had automatic enrollment. By 2008, 10 of our 24 plans
(about 42%) are labeled as auto‐enrolling firms, whereas the PLANSPONSOR data reports that
about 48% of large firms were auto‐enrolling in that same year.
A limitation of using participant behavior to identify a firm that uses defaults is that we
cannot use this measure to identify the direct effect of automatic enrollment on these same
behaviors. However, the goal of this paper is not to estimate the effect of auto‐enrollment on
behavior. Rather, we are examining the effect of procrastination on financial behaviors, and in
some cases it is instructive to know whether the effect of procrastination on behavior differs
across firms with and without automatic enrollment. Because our measure of procrastination is
based on health care plan elections, rather than retirement planning behaviors, our
procrastination measure is not subject to any mechanical correlations with our proxy for firms
with defaults. Thus, we will use our proxy for auto‐enrollment to examine whether
procrastination affects behavior differentially across firms with and without defaults. We will
also make use of other variation in default probability, where possible, such as by using the pre‐
versus post‐PPA change in the regulatory designation of default options to further identify how
procrastination affects the likelihood of investing in the default investment option.
5. Results
In the analysis that follows, we examine five key behaviors related to financial planning for
retirement. We will look at these five decisions roughly in the order that an individual
experiences these decisions over their lifecycle. First, we will look at the extensive margin of
whether or not to participate in a voluntary supplemental saving plan. Second, conditional on
eventually joining the plan, we will look at how long it takes an individual to sign up. Third, we
will examine how much a participant chooses to contribute as a percent of pay. Fourth, we will
examine how individuals allocate their portfolio: specifically, their propensity to stick with
default portfolio allocations. Finally, we will examine what is arguably the most important
decision at the time when an individual exits the labor force: whether to take a lump‐sum or
annuity.
4.1 Participation in Voluntary Supplemental Savings Plan
We begin our analysis by using the University of Illinois data to examine the binary decision
of whether or not to participate in a supplemental saving plan. A nice feature of this data is
that participation in the 403(b) and 457 plans is purely voluntary. Of newly hired employees in
13
2010, only 7.5 percent were participating in at least one of the plans as of the final pay period
of 2010.
In Table 2, we see that procrastinators are 2.4 percentage points less likely to participate,
which is nearly one‐third the size of the baseline participation rate of 7.5 percent. This estimate
is remarkably stable as one adds additional covariates, even when these covariates themselves
are significant.
For example, as we add in a dummy variable to control for gender in column 2, we see that
women are approximately 3 percentage points less likely to participate than men, which is also
a substantial difference relative to the 7.5 percent. Yet including the female indicator variable
has virtually no impact on the procrastination measure (the point estimate of the coefficient on
procrastination goes from ‐2.4% to ‐2.5%). As we add controls for age (in years) in column 3,
we see that being another year older increases the probability of participating by 0.4
percentage points, but again has no effect on the effect of procrastination.
As noted earlier, the DC and DB data that we will use to study other behaviors have very
few demographic variables. The Illinois data does have a slight advantage in this regard in that
we observe a few additional variables that allow us to construct noisy proxies for education and
financial literacy.
Although we do not observe education per se, we do know whether an individual is a
member of the faculty or staff, a variable that is correlated with level of education. Controlling
for this (column 4) has no effect on the coefficient on procrastination.
In column 5 we also add a measure of financial literacy, an area of very active research in
recent years (see Lusardi and Mitchell 2014 for a comprehensive review.) Our measure is based
14
on whether an individual’s department or occupation code was related to business, finance,
accounting or economics.3 The effect of financial literacy on participation is not significant, and
again has no effect on the magnitude of the coefficient on procrastination.4
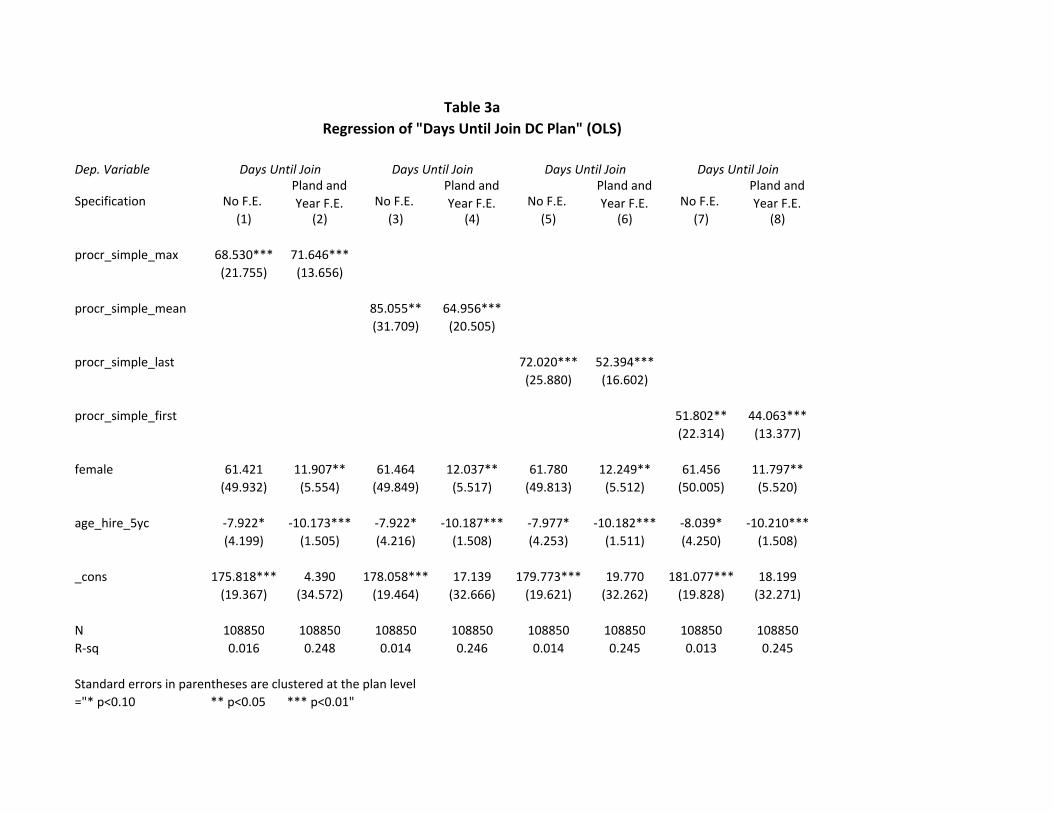
4.2 Days Until Join the 401(k)
Turning now to the data on 55 DC plan sponsors, Table 3a shows the results of a simple OLS
regression of the number of days it took the employee from their hire date to sign up for the
firm’s DC plan, conditional on eventually signing up within 5 years of one’s start date. There are
8 columns in total, corresponding to our four different measures of procrastination, both with
and without year and plan controls. Column 1 uses the Procr_max variable, whereas column 2
repeats this specification with the inclusion of year and plan fixed effects. The remaining
columns repeat this pattern for the other three measures of procrastination.
We find statistically significant results in this simple OLS specification: procrastinators wait
44 to 85 days longer to enroll in a 401(k) plan than do non‐procrastinators.
Table 3b repeats this analysis using a Cox proportional hazard model in which the
dependent variable is the conditional probability of signing up for the plan on a given day,
3 Our definition of financially literate was chosen ex ante based on a list of department and occupation codes. The University Human Resources office then provided us with a simple binary indicator variable. Although this prevents us from engaging in further exploration of occupation differences, it was necessary to meet human subjects protocols to ensure that the researchers could not individually identify employees in the sample. 4 At the start of this project we made an ex ante decision to not include income in our regression both because it is not available in the DC and DB data sets and because the prior literature has already established that income is itself predicted by procrastination (Tanaka, Camerer and Nguyen 2010). In unreported results, we have undertaken a statistical decomposition exercise in the spirit of Blinder (1973), Oaxaca (1973) and Fairlie (2005) to determine how much of the total difference in plan participation between procrastinators and non‐procrastinators is a direct effect of procrastination on participation, versus an indirect effect of procrastination working through income. This decomposition suggests that about half of the 2.6 percentage point difference in supplemental savings plan participation can be explained by the direct effect of procrastination, whereas the other half is due to procrastination operating indirectly through income.
15
conditional on having not yet signed up. In the Cox specification, a coefficient is multiplicative
of the baseline hazard rate: thus, a coefficient less than 1 means that the individual is less likely
to join the plan on that date. The coefficient ranges from 0.76 to 0.86, which corresponds to a
14‐24% reduction in the hazard rate.
This is perhaps more easily seen in Figure 1, which uses the coefficients on the Cox model to
plot the cumulative probability of joining the plan, where day 0 is defined as the date of hire.
We show the first five years, recognizing that because we only observe individuals who
eventually sign up for the plan by the time our data was run in 2009, these cumulative
probabilities will both reach 1 over the full sample period. This figure uses the
procr_simple_mean measure of procrastination, which corresponds to column 4 of table 3b. As
can be seen, the cumulative effect of the difference in hazard rates is quite meaningful over
time.
4.3 Contribution Rates
In Table 4a we analyze the effect of procrastination on DC plan contributions as a percent of
salary. The average contribution rate (conditional on contributing) in our sample is 7.2% of
pay. In all of the fixed effects specifications, we find a negative coefficient ranging from ‐0.088
to ‐0.146, although only two of the four are significant at the 10% level. The two significant
coefficients suggest that procrastinators contribute about 10‐15 basis points less, or about 1.3 –
2.0% of the baseline saving rate.
Prior research has shown that firms that use automatic enrollment often have the effect of
guiding many participants to contribute at the default rate. If procrastinators are more likely to
16
be auto‐enrolled at a default saving rate, as hypothesized by Beshears et al (2009), then this
would make it harder to find an effect of procrastination on saving rates. To address this, we
make use of our 30% rule (described in section 4.3 above) to proxy for which firms have auto‐
enrollment. In Table 4b, we run separate regressions (that include plan and year effects) on the
sample of firm‐years in which we estimate there is not a default option in place (odd numbered
columns) and on the sample of firm‐years in which we estimate that there is a default option
(even‐numbered columns). We find that the coefficient on contribution rate is slightly larger
(with three of the four now statistically significant) in the default sample than in the full sample.
The coefficient on contribution rate is not significant in any of the specifications in which there
is a default option at the firm. We caution, however, that the differences in the even and odd
number columns are themselves not significantly different, so this is, at best, suggestive
evidence.
Another way of tackling the question of how procrastination affects contribution rates that
takes into account the presence of auto‐enrollment is to examine the propensity of an
individual to invest at the default saving rate. As noted above, we do not actually observe the
plan rules, so we do not know the actual default saving rate in firms that we expect have auto‐
enrollment. We can, however, observe the modal rate of saving, which we believe, based on
prior research, is likely the default contribution rate. In Table 4c we examine the effect of
procrastination on the probability of contributing at the default saving rate. In the overall
sample, 38.2% of individuals contribute at their firm’s modal saving rate. Across all plan sin our
sample (odd numbered columns), we find that procrastinators are about 1.7 to 3.6 percentage
points more likely to contribute at this rate than non‐procrastinators. The results are
17
statistically significant using all four measures of procrastination. In the even‐numbered
columns, we limit the sample to individuals at firms we have identified as having default
options. Again, we find highly significant results, ranging from 2.7 to 5.2 percentage points
more likely to contribute at the modal rate.
Overall, these results suggest that procrastinators contribute less than non‐procrastinators,
and are more likely to contribute at the default rate when the firm has automatic enrollment.
4.4 Allocations to Default Portfolio
Although there is no theoretical relation between procrastination and risk aversion, it is not
obvious that procrastination should affect an individual’s preference for risky versus safe assets.
However, given the propensity of procrastinators to stick with default options, there is a clear
hypothesis regarding portfolio choice: procrastinators should be more likely to invest in a firm’s
default investment portfolio.
As noted above, the Pension Protection Act of 2006 and subsequent regulations designated
life‐cycle, target date and balanced funds as Qualified Default Investment Alternatives (QDIAs).
Prior to the PPA, firms that used automatic enrollment placed the assets of defaulters into a
money market fund so as to ensure that the plan sponsor could not be held responsible for
investment losses. Following the implementation of the QDIA regulations in December 2007,
firms using auto‐enrollment predominantly use one of the QDIA‐designated fund types as the
default portfolio option.
Empirically, this pre‐ versus post‐QDIA change gives us a useful strategy for identifying the
effect of procrastination on default behavior in the context of portfolio allocation. Specifically,
18
prior to the adoption of the QDIA regulations, there is no reason to expect that funds later
designated as QDIAs would be more or less likely to be held by procrastinators. Following the
PPA, however, procrastinators who worked for firms with defaults should be more likely to hold
their portfolio in the firm’s QDIA.
Starting with Table 5a, we look at all firms from 2002 – 2006 (pre‐PPA) in odd numbered
columns and find that there is no significant relation between procrastination and the share of
the portfolio held in lifecycle funds. In 2008, however, following the implementation of the
QDIA regulations, we see that procrastinators allocate from 3.1 to 4.6 percentage points more
of their portfolio to lifecycle funds than do non‐procrastinators.5
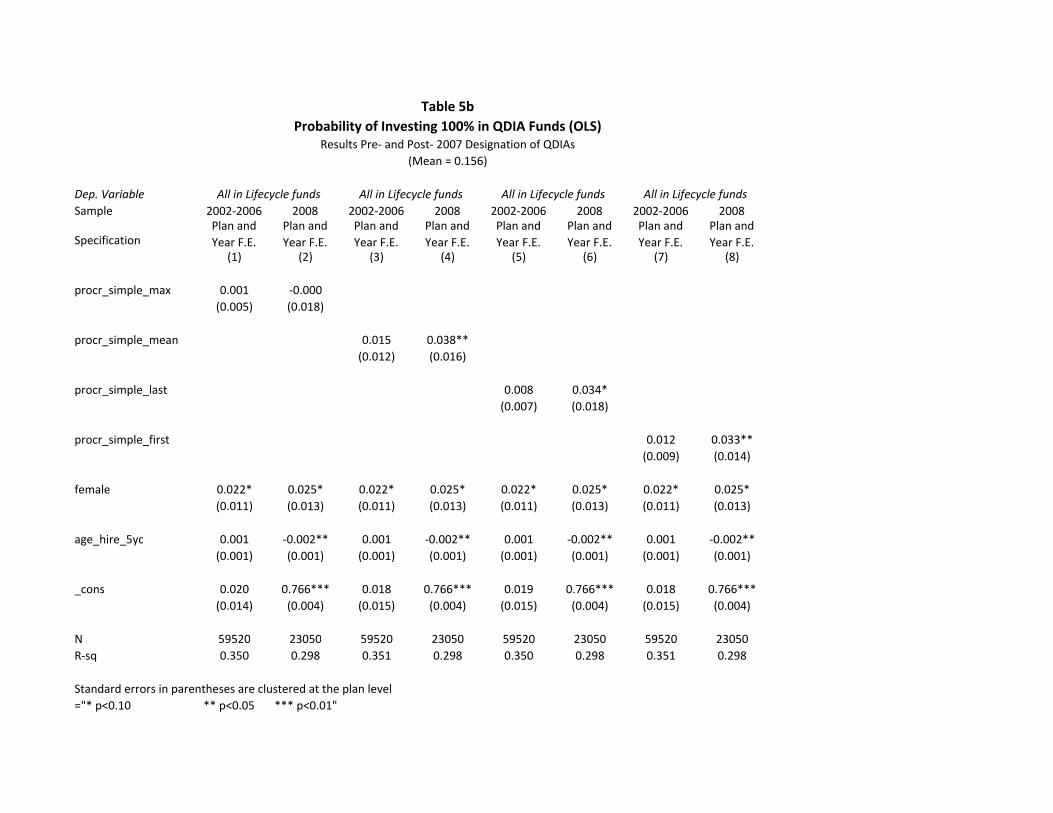
We next examine the binary outcome of whether the individual holds 100% of their
portfolio in the QDIA fund. This can be viewed as a rather strong or restrictive measure of
defaults because it requires that an individual made no reallocations at all between the time
they joined the plan and January 1, 2009, the date on which we observe portfolio allocations.
Of course, it is possible – although unlikely – that some individuals previously held a different
portfolio and reallocated 100% of it to the QDIA fund prior to our data collection date. Because
such active portfolio management is expected to be less likely among procrastinators, any such
individuals in our sample would only serve to make it more difficult for us to find an effect.
These results are reported in Table 5b, where we again split the results into the pre‐PPA
(2002‐2006) and post‐PPA (2008) period. Note that across the full sample, 15.6% of individuals
allocate 100% of their portfolio to a fund that could be designated as a QDIA after the PPA.
Consistent with our hypothesis, we find no statistically significant impact of procrastination on
5 Note that we exclude 2007 from this analysis because the regulations were issued during that year, making it difficult to assign observations in that year to a pre or post PPA period.
19
the probability of investing in a QDIA‐type fund in the period before the PPA. Following the
PPA, we find statistically significant effects in three of the four specifications, indicating that
procrastinators are between 3.3 and 3.8 percentage points more likely to invest their entire
portfolio in the QDIA fund.6
4.5 Annuitization of DB Balances at Retirement
At retirement, a key decision is whether to take retirement plan benefits in the form of a
lump‐sum or an annuity. There is a very large literature on the theoretical value of insuring
longevity risk by purchasing an annuity that pays out for life (e.g., Yaari 1965; Davidoff, Brown
and Diamond 2005), and also numerous papers exploring why so few individuals voluntarily
purchase annuities when given the opportunity to do so (e.g., Benartzi, Previtero and Thaler
2011 and cites therein).
We are not able to observe annuitization within our DC plan data, which is not surprising
given how few DC plans offer annuitization options. However, the third data set – on DB plan
participants – allows us to study this question directly. As discussed by Benartzi, Previtero and
Thaler (2011), annuitization is substantially more common in DB plans than in DC plans: in our
data, 49 percent of retirees take their benefit in the form of an annuity. We examine whether
this probability differs between procrastinators and non‐procrastinators.
In Table 6, we find that procrastinators are significantly less likely to annuitize. In the three
significant specifications (three of the four using plan and year controls), procrastinators are 4.2
6 In unreported results, we also tried to decompose the 2008 results into firms that we believe have auto‐enrollment versus those that do not. Although we find positive coefficients that would translate to a 2.7 to 5.3 percentage points increase among procrastinators, these estimates are not statistically significant due to much smaller sample sizes.
20
to 5.2 percentage points less likely to annuitize, an effect which is about 10 percent of the
baseline annuitization rate of 49%. For perspective, this is even larger than the 3.8 percentage
point difference between men and women. With gender‐blind pricing of annuities (as is the
case with DB plans), the difference between men and women in the expected present
discounted value of an annuity at age 65 is about 10 percentage points. Under the simplifying
assumption that gender difference is annuitization are attributable solely to differences in the
actuarial value, this suggests that procrastinators behave as if annuities were 10 percent more
expensive.
6. Present‐Biased Preferences as the Leading Explanation
To this point, we have established a strong empirical link between delaying until the last day
to make a health care plan election, and a full range of behaviors related to retirement
planning. In this section, we discuss how these results – and several additional extensions –
lead us to two conclusions. First, that our empirical measure is indeed capturing
procrastination rather than capturing the efforts of an optimizing agent to collect as much
information as possible before locking in a decision. Second, that our results are most
consistent with present‐biased preferences being the underlying cause of the observed
procrastination behavior. In total, we view our results as being strongly supportive of
procrastination being a manifestation of present‐biased preferences, and thus evidence that
present‐bias is a fundamental contributor to understanding why so many individuals under‐
prepare for retirement.
21
6.1 Ruling Out Alternative Hypotheses: Optimal Delay
According to economic theory, present‐biased preferences cause procrastination. The
literature does not, however, suggest that present‐biased preferences are the only cause of
procrastination. Up to this point, we have used an empirical measure of delay as a measure of
procrastination. But a natural alternative reason for delaying decisions is that it may be rational
to do so in order to maximize the information set that is available. For example, a truly
engaged optimizer may go online, learn about the options, and then take time to speak with
friends and financial advisors, do online research, or and/or undertake extensive analysis
before deciding. Such an individual may wait until the last day to submit their decision not out
of procrastination, but out of a desire to be exhaustive in their due diligence.
If our measures of procrastination are actually a mix of “present‐biased procrastinators”
and “optimal delayers,” then this would bias most of the procrastination coefficients toward
zero and make it more difficult for us to find a significant difference between those we have
labeled procrastinators versus non‐procrastinators. One exception is that optimal delayers may
also take longer to sign up for the DC plan, so in that case the bias could be in either direction.
Going beyond acknowledging attenuation bias, however, we can take a subset of our
analyses a step further, owing to the rich data from the large record keeper. Specifically, in
addition to knowing the date of the final health care plan choice, we also know whether the
individual made any prior submissions within the enrollment period, and then over‐rode those
earlier submissions with a final one on the last day of the period. Individuals who make
multiple submissions are much more likely to be “optimal delayers” who were engaged in the
22
decision‐process prior to the end of the enrollment window. In contrast, individuals who had
no online activity prior to the final submission on the final day are much more likely to be
“present‐biased procrastinators.”
In Table 7, we explore this distinction empirically. We re‐examine time‐to‐join, contribution
rates, fraction in QDIA funds, the probability of having all of one’s assets in the QDIA funds, and
the probability of annuitizing. However, we now add an interaction term between our
procr_mean variable and an indicator for having multiple submissions prior to the final date.
In column 1, we see that there is not a significant difference between procrastinators and
optimal delayers for time to join. This makes sense: optimal delayers who take extra time to
make their health care decision may also take extra time to research their 401(k) participation
decision.
In column 2, however, we see that procrastinators contribute 0.18 percentage points less
than non‐procrastinators, whereas optimal delayers actually contribute more. To be clear, the
coefficient on the interaction term is large enough that it suggests that optimal delayers not
only contribute more than procrastinators, they also contribute more than the excluded group,
i.e., those that are neither procrastinators nor optimal delayers.
Moving to columns 3 and 4, we also see that procrastinators place 5.1 percentage points
less of their portfolio in QDIA type funds and are 5.5 percentage points less likely to have their
entire portfolio in these funds. The optimal delayers, in contrast, show no such bias.
These results strengthen our findings. In effect, for outcomes where we expect differences
between procrastinators and optimal delayers, we find consistent evidence of those effects.
23
Most importantly, the effect of procrastination on our outcome of interest is at least as strong,
and occasionally stronger, than we find when optimal delayers are mixed in.
6.2 Ruling Out Alternative Hypotheses: Rational Inattention
When choices are relatively inconsequential, the theory of rational inattention suggests that
it may be optimal for individuals to allocate their limited attention to other decisions (see
Wiederholt 2010 for a survey of the literature on rational inattention). For example, there may
be some individuals for whom the choice among health care plans is relatively unimportant
(e.g., if the plans do not differ along margins that are important given the individual’s expected
utilization). If so, then this would introduce noise in our measure of procrastination that would
bias our findings toward zero.
It is harder, however, to suggest that the financial behaviors we observe are sufficiently
inconsequential to justify rational inattention. To illustrate this, we construct a simple back‐of‐
the‐envelope calculations using the estimates above: a one‐third reduction in the probability of
participating (from 8 to 5.5%), a six‐month delay in contributing (a stylized version of a 2 month
delay at each of three jobs), a savings rate of 7% instead of 7.2%, and a reduction in
annuitization from 50 to 45% (assuming that annuitization increases one’s consumption
possibilities by 30%, the lower end of the values found in Mitchell et al 1999). Assuming an
individual enters the workforce at age 22 and exits at 62, we find that, all else equal,
procrastination reduces the consumption financed by the retirement plan by 35% relative to
24
otherwise identical individuals that do not procrastinate.7 Even if one assumes that Social
Security and other resources provides 60% of total income, this translates into a 14% reduction
in total retirement consumption. We believe that decisions of this magnitude are difficult to
rationalize via a rational inattention story.
6.3 Ruling Out Alternative Hypotheses: Disorganized or Too Busy
Although economic theory posits present‐biased preferences as the reason for
procrastination, some might argue that procrastination can also occur for other reasons, such
as the fact that a person is just disorganized, or that perhaps the health care election and the
retirement plan choices came at a time when the respondents were just very busy with new
job.
Stories like these could explain why someone who delays signing up for their health plan
also never gets around to participating in their retirement plan, or delays signing up for it. They
could also be used to explain why the person just goes with the default investment option, if
they are too busy or disorganized to look into the alternative investment options that are
available.
However, these alternative explanations do not explain why procrastinators – once they
finally get around to signing up – contribute less to their plan, especially in firms without
7 Of all the assumptions, our back‐of‐the‐envelope calculation is most sensitive to how we treat the probability of contributing at all. If the 2.4 percentage point reduction by procrastinators relative to a total sample level of 7.5% is used, we get the 35% reduction in consumption financed by the retirement plan. The same result holds if we assume that this approximately 1/3 reduction (2.4/7.5) in the probability of joining, regardless of the baseline probability we assume. In contrast, if we assume a 2.4 percentage point reduction applies even if baseline participation levels are ultimately as high as 50%, then the total reduction in plan‐financed consumption falls to just over 10%. Under any plausible assumptions deriving from our results, however, the implications for consumption financed by the retirement plan are large enough to render the rational inattention story unlikely.
25
automatic enrollment (results from Table 4b). In contrast, if procrastination is a manifestation
of present‐biased preferences, we would expect exactly this outcome. That is, people with a
present bias are likely to value current consumption over future consumption to a greater
degree than individuals without present biases.
Furthermore, these alternative stories do not explain the annuitization results. If people
procrastinate because they are simply disorganized or very busy, there is no obvious reason
that this should be correlated with whether to take the money as a lump sum or annuity.
When a person retires, they have to choose one option or the other if they want to access their
retirement money: unlike the decision of whether to participate in a 401(k), there is no implicit
default option with regard to the decision on how to take distributions from the DB plan. In
most firms, the act of retiring is a somewhat involved process that requires actively interfacing
with a company’s H.R. department. As such, the H.R. department can essentially force an
individual to choose whether they want a lump‐sum or annuity, and therefore need not
construct a “default option.”
In contrast, present‐biased preferences have a clear prediction for annuity demand:
because present‐biased preferences underweight future consumption and overweight near
term consumption, and such individuals should find annuities less valuable. This is exactly what
we find in Table 6.
6.4 More Evidence for Present‐Biased Preferences
As one final test, we build upon the insights of Brown et al (2008) and Beshears et al (2014)
who find that annuity demand is sensitive to whether the decision is framed as an investment
26
or a consumption choice. The framing evidence suggests that the demand for annuities is
larger in a consumption frame, in which annuities look like a valuable form of insurance, and
smaller in an investment frame, which makes annuities look risky. Although we have no
information about how the annuity v. lump‐sum choice is communicated, we can take
advantage of the fact that two‐thirds of our plans are traditional DB plans that have historically
paid benefits as monthly income and tend to communicate about the plans in these terms. The
other one‐third are “cash balance” plans which, although legally DB plans, communicate to
employees in a decidedly investment‐oriented manner, such as reporting account balances
rather than monthly income.
We hypothesize that if procrastination is a manifestation of present‐biased preferences,
then procrastination should have an even larger effect on behavior when the lump‐sum option
is made more salient. Therefore, in our data, we hypothesize that procrastination’s negative
effect will be larger in cash balance plans (which are typically presented in an investment frame
where the lump‐sum is more salient) than in traditional DB plans (which are typically presented
in terms of retirement income).
Table 7 provides evidence that is consistent with our hypothesis. In the first four columns,
we show the results for traditional DB plans. In this sample, only one of the four coefficients is
significantly different from 0, coming in at ‐0.023. In contrast, in columns 5 through 8, we see
that all four coefficients are negative, large and significant. Specifically, we find that
procrastinators are much less likely to annuitize than non‐procrastinators when the decision is
framed in a manner that emphasizes the lump‐sum. This is consistent with present‐biased
preferences driving these results.
27
7. Conclusions
Using a new empirical measure of procrastination that can be implemented in other
administrative data sets on benefit elections, we present evidence that procrastinators behave
differently from non‐procrastinators in every major step of financial planning for retirement
that we are able to measure. Specifically, procrastinators are less likely to participate in savings
plans, take longer to sign up when they do participate, contribute less to their DC plans, tend to
stick with default investment options, and are less likely to annuitize, especially when the
decision is framed in an investment‐oriented setting. These results, which derive from three
different data sets covering a range of employers, are robust to including other controls and to
various definitions of procrastination.
Our results are consistent with the leading view in economics that models procrastination
as a manifestation of present‐biased preferences. Although there are other reasons that
individuals may delay decision‐making, we discuss why these alternative hypotheses are
unlikely explanations for the full set of findings. For example, none of the alternatives predict
why individuals who delay decision‐making are likely to contribute less (conditional on saving)
or are less likely to annuitize, whereas these finding flows directly from present‐biased
preferences. We also distinguish directly between optimal delayers and present‐biased
procrastinators by using data on whether individuals were engaged in the decision process prior
to the last day. These results clearly indicate that non‐optimizing procrastinators are making
decisions that are, on average, detrimental to their future retirement security.
28
These results have wide‐ranging implications. At an intellectual level, our results provide
what is, in our view, the most direct and robust evidence to date in support of recent economic
models of present‐biased preferences. From a research perspective, our results suggest that
measures of decision‐making delays can be a good empirical measure of present‐biased
preferences. Our results are also relevant to policy makers and those responsible for designing
retirement plans. For example, our evidence suggests that procrastination is an important
underlying reason why default options (such as automatic enrollment in 401(k) plans) are so
powerful. We also show that procrastinators are more heavily influenced by some aspects of
plan design, such as the use of default investment portfolios. Knowing that present‐based
preferences are a pathway through which plan architecture matters is informative for how to
design other behavioral interventions. For example, these results suggest that plan architects
may find it fruitful to use tools to address procrastination and present‐biases directly, such as
through forcing choices, changing the incentives around deadlines, or increasing the salience of
future payoffs. This should help guide future research on the relative efficacy of alternative
plan design interventions.
29
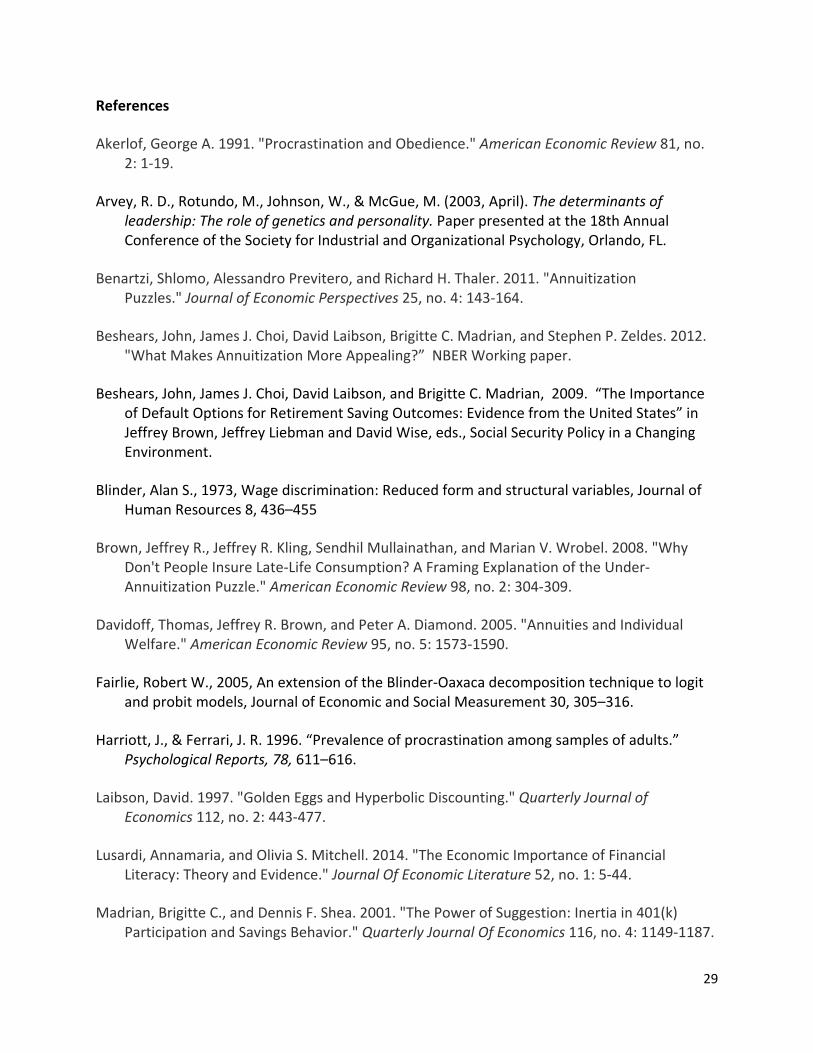
References
Akerlof, George A. 1991. "Procrastination and Obedience." American Economic Review 81, no. 2: 1‐19.
Arvey, R. D., Rotundo, M., Johnson, W., & McGue, M. (2003, April). The determinants of leadership: The role of genetics and personality. Paper presented at the 18th Annual Conference of the Society for Industrial and Organizational Psychology, Orlando, FL.
Benartzi, Shlomo, Alessandro Previtero, and Richard H. Thaler. 2011. "Annuitization Puzzles." Journal of Economic Perspectives 25, no. 4: 143‐164.
Beshears, John, James J. Choi, David Laibson, Brigitte C. Madrian, and Stephen P. Zeldes. 2012. "What Makes Annuitization More Appealing?” NBER Working paper.
Beshears, John, James J. Choi, David Laibson, and Brigitte C. Madrian, 2009. “The Importance of Default Options for Retirement Saving Outcomes: Evidence from the United States” in Jeffrey Brown, Jeffrey Liebman and David Wise, eds., Social Security Policy in a Changing Environment.
Blinder, Alan S., 1973, Wage discrimination: Reduced form and structural variables, Journal of Human Resources 8, 436–455
Brown, Jeffrey R., Jeffrey R. Kling, Sendhil Mullainathan, and Marian V. Wrobel. 2008. "Why Don't People Insure Late‐Life Consumption? A Framing Explanation of the Under‐Annuitization Puzzle." American Economic Review 98, no. 2: 304‐309.
Davidoff, Thomas, Jeffrey R. Brown, and Peter A. Diamond. 2005. "Annuities and Individual Welfare." American Economic Review 95, no. 5: 1573‐1590.
Fairlie, Robert W., 2005, An extension of the Blinder‐Oaxaca decomposition technique to logit and probit models, Journal of Economic and Social Measurement 30, 305–316.
Harriott, J., & Ferrari, J. R. 1996. “Prevalence of procrastination among samples of adults.” Psychological Reports, 78, 611–616.
Laibson, David. 1997. "Golden Eggs and Hyperbolic Discounting." Quarterly Journal of Economics 112, no. 2: 443‐477.
Lusardi, Annamaria, and Olivia S. Mitchell. 2014. "The Economic Importance of Financial Literacy: Theory and Evidence." Journal Of Economic Literature 52, no. 1: 5‐44.
Madrian, Brigitte C., and Dennis F. Shea. 2001. "The Power of Suggestion: Inertia in 401(k) Participation and Savings Behavior." Quarterly Journal Of Economics 116, no. 4: 1149‐1187.
30
Mitchell, Olivia S., James M. Poterba, and Mark J. Warshawsky. 2000. "New Evidence on the Money's Worth of Individual Annuities."
Oaxaca, Ronald. 1973. “Male‐female wage differentials in urban labor markets.” International Economic Review. 14: 693‐709.
O'Donoghue, Ted, and Matthew Rabin. 1999. "Doing It Now or Later." American Economic Review 89, no. 1: 103‐124.
Steel, Piers. 2007. “The Nature of Procrastination: A Meta‐Analytic and Theoretical Review of Quintessential Self‐Regulatory Failure.” Psychological Bulletin 2007, Vol 133, No 1, 65‐94.
Tanaka, Tomomi, Colin F. Camerer, and Quang Nguyen. 2010. "Risk and Time Preferences: Linking Experimental and Household Survey Data from Vietnam." American Economic Review v. 100, no. 1: 557‐571.
Wiederholt, Mirko. 2010. "Rational Inattention." The New Palgrave Dictionary of Economics. Online Edition. Eds. Steven N. Durlauf and Lawrence E. Blume. Palgrave Macmillan, 2010. The New Palgrave Dictionary of Economics Online. Palgrave Macmillan. 17 July 2014 <http://www.dictionaryofeconomics.com/article?id=pde2010_R000281> doi:10.1057/9780230226203.3841
Yaari, Menahem E. “Uncertain Lifetime, Life Insurance, and the Theory of the Consumer.” The Review of Economic Studies. Vol. 32. No. 2 (April, 1965), pp. 137‐50.
Table 1a
Summary Statistics for University of Illinois Sample
(n=2,678)
mean p10 p25 Median p75 p90 sd
Plan_partic 0.08 0 0 0 0 0 0.26
Procr_First 0.29 0 0 0 1 1 0.45
Age 38.12 28 30 35 44 54 10.20
Female 0.54 0 0 1 1 1 0.50
Faculty 0.17 0 0 0 0 1 0.38
FinLit 0.03 0 0 0 0 0 0.18
Days to Default 5.60 ‐5 0 4 9 16 11.42
Table 1b
Summary Statistics for Defined Contribution Plans Sample
(n=155,176 )
mean p10 p25 Median p75 p90 sd
Age at Hire 35.08 22.75 26.18 33.55 42.78 50.20 10.28