20
Produced Formation Water Sample Results from Shale Pla ys Nancy Pees Coleman, Ph.D. Oklahoma City Oklahoma Oklahoma City , Oklahoma

Produced Formation Water SampleResults from Shale Playsy
Nancy Pees Coleman, Ph.D. Oklahoma City OklahomaOklahoma City, Oklahoma

results of non
Produced Formation Water Review
Conducted a review of the analytical results of non-potable producedpotable produced formation water from four shale plays
Marcellus BarnettBarnett Fayetteville Haynesville
Utilized several available data sources Gas Technology Institute Study for the Marcellus USGS database Additional privately generated data sources
2

ote t a ob t ou d ate s ste s to c t a d t e
Purpose of the Data Review
Identify sentinel parameters to be included in baseline potable water sampling programpotable water sampling program
Criteria for selection of sentinel parameters was based on potential mobility in groundwater systems, toxicity, and thep y g y , y, ability to accurately quantitate the parameters in produced formation water
Identify parameters which could be released from host rock
Support decision making on disposal and treatment and reuse/recycling related to produced water
3

― –
Shale Play Data Evaluated
Source water for hydraulic fracturing fluids
Mixed hydraulic fracturing fluids
Produced formation water from operating wells
Produced formation water after hydraulic fracturing activities I i
l
iIterative samples over time
Varying sampling times utilized by different data sources ― GTI Study in Marcellus – samples up to 90 days after hydraulic fracturing ― Additional Data – samples up to 30 days after hydraulic fracturing Additional Data samples up to 30 days after hydraulic fracturing
Analytical results available for the following parameters: Volatile organics, including glycols
Semi-volatile organics
Metals, total and dissolved
General chemistry
4
Radiochemistry (gross alpha/beta, Radium 226/228, and some additional isotopic nuclides by gamma spectroscopy)

Shale Information
Shale Play Barnett Fayetteville Haynesville Marcellus
Average Depth From Surface (ft)
7,400 4,500 11,500 6,750 ( )
Bottom Hole Temperature (F)
190 130 320 140
Bottom Hole Pressure (psi)
2,900 2,000 10,000 4,000
� Natural gas producing shale zones are thousands of feet below the formations which produce potable water
5

t
Sampling and Analytical Challenges for Produced Formation Water
Analytical data has limitations due to sampling challenges Natural gas is contained under high pressure in specialized equipment Natural gas is contained under high pressure in specialized equipment not designed for producing a high quality environmental sample
Sample matrix causes collection problems
I iti l d d th d f iInitial produced water pressures are thousands of psi
Temperature of produced water 30-70 degrees Celsius
Safety issues for sampling personnel
Analytical data has limitations due to analytical challenges Organic chemistry analyses has fewer issues
Inorganic and Wet Chemistry tests were affected by very high solids content and other matrix complexities
Radiochemistry affected by solids and barium
6
Radiochemistry affected by solids and barium
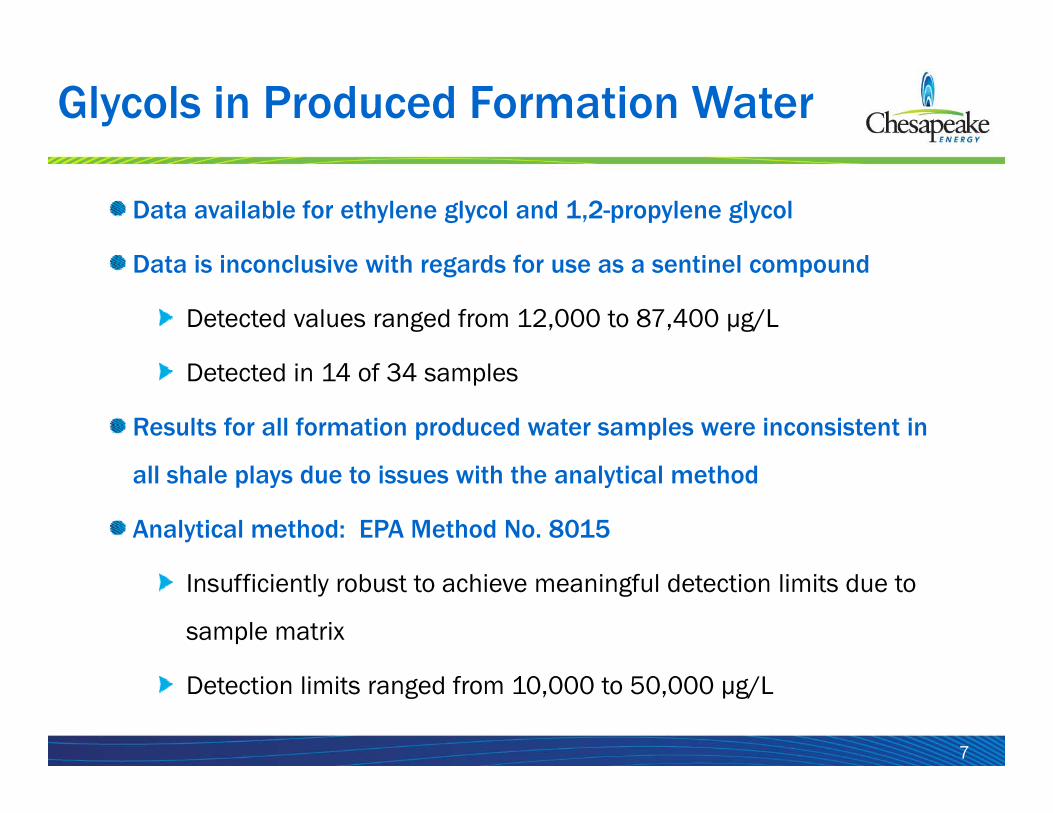
Glycols in Produced Formation Water
Data available for ethylene glycol and 1,2-propylene glycol
Data is inconclusive with regards for use as a sentinel compound
Detected values ranged from 12,000 to 87,400 µg/L
Detected in 14 of 34 samples
Results for all formation produced water samples were inconsistent in
all shale plays due to issues with the analytical method
Analytical method: EPA Method No. 8015
Insufficiently robust to achieve meaningful detection limits due to
sample matrix
7
Detection limits ranged from 10,000 to 50,000 µg/L

t t
Volatile and Semi-Volatile Organics in Produced Formation Water
Data was available for produced formation water from operating wells and iterative (time series) samples for operating wells and iterative (time series) samples for produced water following hydraulic fracturing activities
The majority of the VOC and SVOC results were below The majority of the VOC and SVOC results were below detection limits for both sets of samples
B E h l b T l d X lBenzene, Ethyl benzene, Toluene and Xylenes most consistently detected VOCs - produced in formation
Phenol and Pyridine most consistently detected SVOCs
No consistent trends in VOC or SVOC concentrations with
8
time in the iterative samples

Summary of Analytical ResultsSelected Volatile Organic CompoundsProduced Formation Water after Hydraulic Fracture (First 30 Days)
Concentrations in Produced Formation Water by Shale Play
Parameter
(µg/L)
Barnett Fayetteville Haynesville Marcellus Barnett Fayetteville Haynesville Marcellus
Benzene < 1 – 97 <1 – 140 <1 ‐3,460 <1 – 1,950
Ethyl benzene <1 ‐ 249 <1 – 11 <1 – 1,470 <1 ‐ 164
Toluene 1 – 578 <1 – 117 2.6 – 11,400 <1 – 3,190
Xylenes, total <3 – 2,480 <3 – 60.1 12 – 10,700 <2 – 1,970
No. of Wells Sampled
3 2 3 4
9

y y
Summary of Analytical ResultsSelected Volatile Organic CompoundsProduced Formation Water from Operating Wells
Concentrations in Produced Formation Water by Shale Play
Parameter
(µg/L)
Barnett Fayetteville Haynesville Marcellus Barnett Fayetteville Haynesville Marcellus
Benzene 4.37 – 1,600 <1 – 1.05 76 – 3,140 <1 ‐ 513
Ethyl benzene <1 – 102 ND 2.5 – 839 <1 – 51.6
Toluene 8.8 – 3,250 ND 84 – 11, 300 <1 ‐ 918
Xylenes, total <3 – 2,630 <3 – 4.86 31 – 14,500 <3 ‐ 439
No. of Wells Sampled
15 9 5 15
10

y y (µg/ )
Summary of Analytical ResultsSelected Semi-Volatile Organic CompoundsProduced Formation Water after Hydraulic Fracture (First 30 days)
Concentrations in Produced Water by Shale Play (µg/L)
Parameter Barnett Fayetteville Haynesville Marcellus
Phenol ND – 1,160 ND ND ‐ 971 ND ‐ 459
Pyridine ND – 264 ND – 534 ND ND
No. of Wells Sampled
3 2 3 4
11

Summary of Analytical ResultsSelected Semi-Volatile Organic CompoundsProduced Formation Water from Operating Wells p g
Concentrations in Produced Water by Shale Play (µg/L)
Parameter
y y (µg/ )
Barnett Fayetteville Haynesville Marcellus
Phenol 12 ‐ 31 ND ‐ 32 250 – 3,720 ND ‐ 34
Pyridine 12 ‐ 758 ND – 92 ND – 15.5 ND ‐ 56
No. of Wells Sampled
15 9 5 15
12
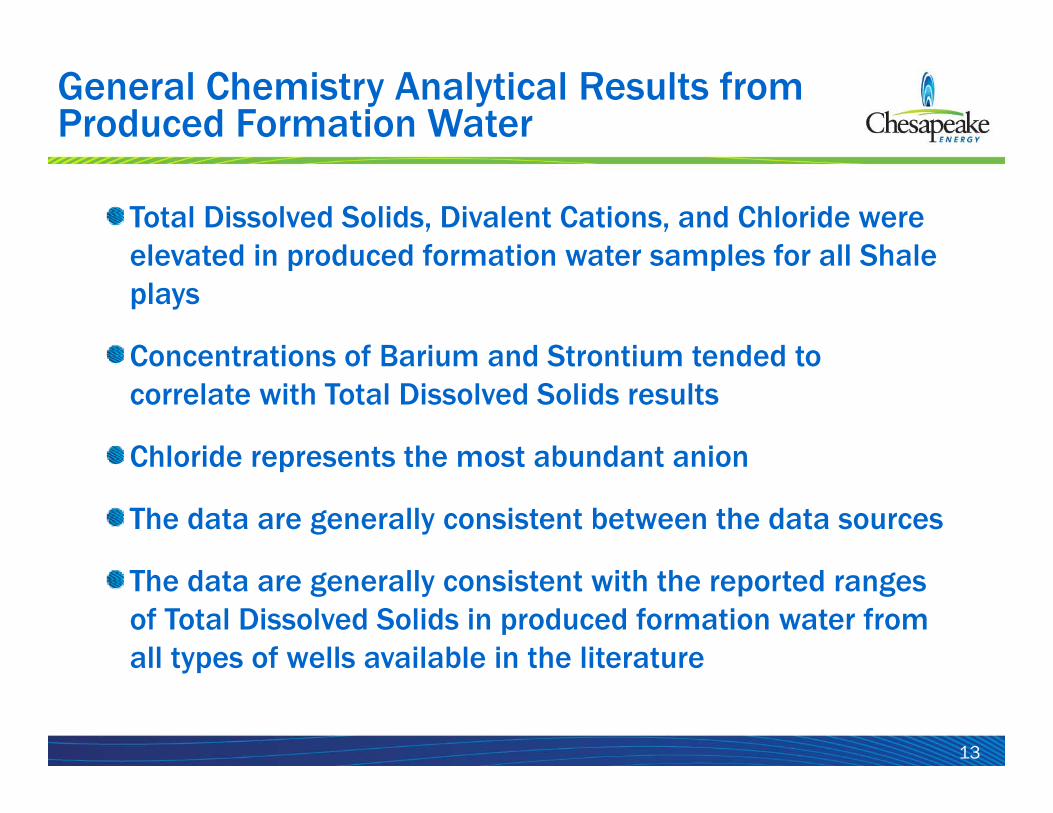
General Chemistry Analytical Results from Produced Formation Water
Total Dissolved Solids, Divalent Cations, and Chloride were elevated in produced formation water samples for all Shale elevated in produced formation water samples for all Shale plays
Concentrations of Barium and Strontium tended toConcentrations of Barium and Strontium tended to correlate with Total Dissolved Solids results
Chloride represents the most abundant anionChloride represents the most abundant anion
The data are generally consistent between the data sources
The data are generally consistent with the reported ranges of Total Dissolved Solids in produced formation water from all types of wells available in the literature
13
all types of wells available in the literature
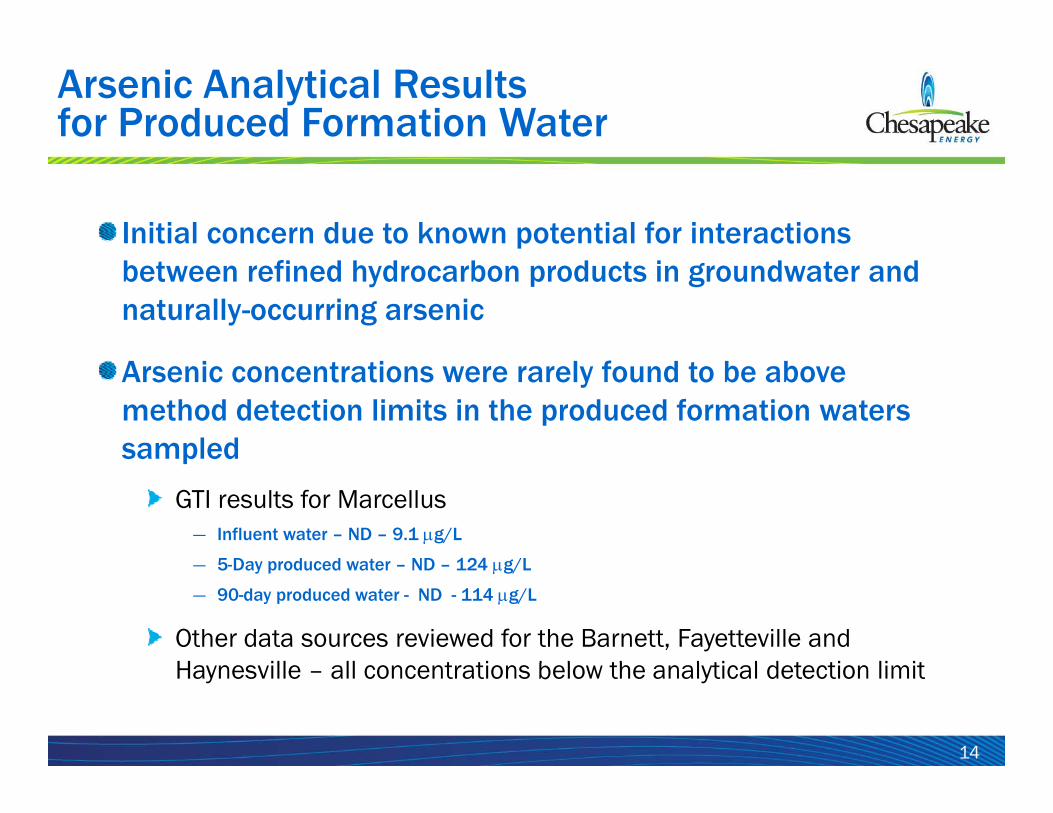
Arsenic Analytical Resultsfor Produced Formation Water
Initial concern due to known potential for interactions between refined hydrocarbon products in groundwater and naturally-occurring arsenic
Arsenic concentrations were rarely found to be above method detection limits in the produced formation waters sampledsampled
GTI results for Marcellus ― Influent water – ND – 9.1 μg/L
5 D d d t ND 124 g/L― 5-Day produced water – ND – 124 μg/L
― 90-day produced water - ND - 114 μg/L
Other data sources reviewed for the Barnett, Fayetteville and H ill ll t ti b l th l ti l d t ti li it
14
Haynesville – all concentrations below the analytical detection limit

-
Radionuclides in Produced Formation Water
Presence of radionuclides in produced formation water is well documented
Analytical method of choice: EPA Method 901 1 modified (Gamma Analytical method of choice: EPA Method 901.1 modified (Gamma Spectroscopy)
Less influenced by matrix interferences
Data must be reported with activity, accompanied by standard deviation and minimum detected concentration
Example: 970 ± 130 pCi/L (MDC 30 pCi/L) Radium-226Example: 970 ± 130 pCi/L (MDC 30 pCi/L) Radium 226 Necessary to put data result into context, particularly for non-detected values. Unless data is presented in this format, it is meaningless.
Focus should be on Radium-226, Radium-228, and Uranium-238
Radium 226 and radium 228 represent more than 80% of the potential radiation dose in ingested water
15
radiation dose in ingested water

Conclusions
Produced formation waters are highly variable within and between shale
formations
Analytical techniques must be robust to the matrix interferences from TDS
Most reliable sentinel compounds are TDS, chloride and divalent cations
Few VOCs and SVOCs are consistently found in produced formation water.
Benzene, ethyl benzene, toluene and xylenes are the most frequently detected
VOCs and are naturally occurring
The concentrations of VOCs and SVOCs in produced formation water are The concentrations of VOCs and SVOCs in produced formation water are
generally too low for use as sentinel compounds
16

Produced Formation Water Sample Results from Shale Plays Nancy Pees Coleman, Ph.D.
Environmental Consultants and Chesapeake Energy Corporation
The statements made during the workshop do not represent the views or opinions of EPA. Theclaims made by participants have not been verified or endorsed by EPA.
Chesapeake Energy Corporation (Chesapeake) and Environmental Consultants reviewed non‐potable produced formation water sample results available from the literature and other sources. The data review was specifically directed at the chemical characteristics of source water used for hydraulic fracturing fluids, hydraulic fracturing fluids, produced formation water from natural gas wells following hydraulic fracturing activities (i.e., less than 30 or 90 days following hydraulic fracturing), and produced formation water from operating natural gas wells.. The largest amount of data represents sampling conducted of produced formation water from the Marcellus Shale, including the GTI study (Hayes, 2009) and the USGS Produced Water database (USGS, 2010). Additional data was available from private sources. This data set included limited data for three other shale formations, the Barnett, Fayetteville and Haynesville. Some of the data evaluated is subject to attorney‐client privilege (herein after “privileged data”). The zones in the four shale plays from which natural gas is being produced vary in average depth below the surface from 4,500 feet in the Fayetteville to 11,500 feet in the Haynesville. The average depth from the surface to the natural gas producing zones in each of the four shale plays are thousands of feet below the geologic zones which produce potable groundwater. Furthermore, temperatures and pressures found at these depths vary from 130°F and 3,000 pounds per square inch (psi), respectively, in the Fayetteville to 320°F and 10,000 psi, respectively, in the Haynesville. These temperatures and pressures have marked effects on the sampling and field analysis of produced formation waters and create potential safety issues for sampling personnel. The primary purpose of the produced formation water data review was to support Chesapeake’s baseline water sampling program for potable water. Of major interest was the identification of potential sentinel chemicals and/or radiochemicals that could be included in the baseline potable water sampling program. Further, the review was intended to assist in decision making regarding disposal or treatment for reuse or recycling of produced formation waters. Data available from the GTI study included general chemistry parameters and metals as well as volatile organic compounds and semi‐volatile organic compounds from 70 wells in the Marcellus. The data evaluation included a review of chemicals currently being used in Chesapeake wells during hydraulic fracturing. Initially, Chesapeake had chosen the parameters

for analyses based on their potential mobility in groundwater water systems, toxicity, and the availability of analytical methods. Eventually, the complete list found at 40 CFR Part 264, Appendix IX, and commonly associated with groundwater monitoring, was selected. The complete list was specified because many of the chemicals in the treatment fluids are proprietary or not disclosed in information available to Chesapeake. All of the analyses were conducted using EPA analytical methods and analyses were performed by certified laboratories. The majority of analyses were conducted by one laboratory. Some additional data was available in the privileged data for special volatile organic compounds, primarily glycols, and radiochemistry data. The glycols had been included because of the frequency of use in hydraulic fracturing fluids and in order to evaluate their usefulness as sentinel species. Both the authors of the GTI study and the sources for the privileged data indicated that there are significant issues regarding sampling of produced formation water. Natural gas is contained under high pressure in specialized equipment that is not designed for producing high quality environmental samples. The sample matrix itself presents challenges such as foaming and changes in surface tension. Analytical techniques are also impacted by the presence of elevated concentrations of total dissolved solids and chloride. The inorganic and wet chemistry methods were most affected by the presence of high total dissolved solids. Radiochemistry methods are particularly affected by the elevated concentrations of barium and total dissolved solids. As anticipated total dissolved solids and the divalent cations, including barium and strontium, are elevated in produced formation water samples. The concentrations noted in the data evaluated are consistent with that gleaned from the literature (USGS, 2010). Concentrations of these parameters appear to increase with time following hydraulic fracture activities and remain at high concentrations in the produced formation water from operating wells in each shale formation. The concentrations of barium and strontium appear to correlate to the concentrations of total dissolved solids. Chloride represented the most abundant anion. These data are consistent with the generalized data available in the USGS database. The literature supports the interaction and release of arsenic from host rock in the presence of refined hydrocarbons products, therefore, a specific review of the arsenic data was conducted. In general, arsenic concentrations were not found in many of the samples above method detection limits. The GTI study found some detectable concentrations of arsenic with produced formation water sampled on day five following hydraulic fracturing having the highest concentration, 124 μg/L. Data available from analysis of produced formation water from the Marcellus prior to disposal confirmed the general absence of arsenic. There were four detected concentrations from 87 fluids samples. The highest detected concentration was 4.2 μg/L. Arsenic was not detectable in the limited data available for the Barnett, Fayetteville and Haynesville formations; detection limits ranged from 1 to 10 µg/L.

In consultation with health physicists from SAIC and IEM, Chesapeake has determined that radium 226 and 228 represent the most useful parameters to provide meaningful information regarding radionuclides. This decision is based on the fact that radium 226 and 228 are more soluble in water, are more potentially mobile, and represent 80 percent of the potential ingested dose of radiation in drinking water. Based on experience with radionuclide analyses in produced formation water, it appears that gamma spectroscopy (EPA Method 901.1) and isotopic analyses of the select decay series provide the most accurate and usable information. Itis important for the activity results to be presented accompanied by the standard deviation and
minimum detected concentrations in order to put the data in context, particularly for non‐detected activity levels. Certain volatile organic compounds, namely glycols, were also evaluated. Glycols were selected because of their frequency of use in treatment fluids used in natural gas production. EPA Method 8015 has been found to be insufficiently robust to overcome the matrix issues which are attendant to the analysis of produced formation water. The range of detection limits seen in the available data sets ranged from 10,000 to 50,000 μg/L, which does not provide meaningful results. EPA Method 8270 has some utility for larger glycols, such as glycol ethers; however for the smaller, more soluble, ethylene and diethylene glycols, the extraction methods are not useful. Sample results for produced formation water prior to disposal had similar issues with elevated detection limits even when total dissolved solids levels were lower. In these samples, ethylene glycol was found in 14 of 87 samples. Glycols may prove to be problematic for use as sentinel compounds because of their other uses in natural gas production, such as winterization of equipment similar to their use in automobiles, recreational vehicles, etc. Measured concentrations of volatile organic compounds were available for the Marcellus from the GTI study and more limited data had been provided for the Barnett, Fayetteville and Haynesville formations. The most consistently detected volatile organic compounds were benzene, toluene, ethyl benzene and xylenes (BTEX). This finding is consistent with data available in the literature and would be anticipated as these compounds are closely associated with hydrocarbon producing geologies from which the produced formation water comes. There were no trends evident for the BTEX data. The appearance of BTEX was somewhat inconsistent and when present was internally inconsistent. That is, the highest concentrations of benzene were not in the same samples as the highest concentrations of the other three. In the iterative sampling, there was no consistent timing for occurrence of the highest concentration. This may well be due to the differences in water solubility in the presence of elevated total dissolved solids for the individual BTEX components. The data is suggestive that there are differences in BTEX levels between and within shale formations. There were few other volatile organic compounds found in produced formation water; however, they were found on an inconsistent basis. The semi‐volatile organic compounds (SVOCs) were generally not present in detectable concentrations. The most frequently detected SVOC was pyridine in both the GTI Study and in the other data available. In the GTI study data set, six of 70 samples had detectable levels of pyridine in the hydraulic fracture fluids. The author speculated that presence of pyridine was

due to its use as a precursor in the manufacture of one of the hydraulic fracturing additives. Certain service companies have alkyl pyridines available as corrosion inhibitors (Weatherford, 2011). In the additional data evaluated, only two of eleven sampled hydraulic fracturing fluids had detectable concentrations of pyridine. In one of these samples, the concentration was related to the reuse of produced formation water as makeup water for the hydraulic fracturing fluid. Pyridine has been reported as naturally occurring in oil shales (ATSDR, 1992). The additional data sets may indicate support mobilization of the naturally‐occurring pyridine since it is soluble in water or may represent a degradation product. There appear to be differences between the shale plays; however, the data set is small and therefore, does not support the development of generalizations. The iterative (time series) sample results presented by GTI and in other available data does not reveal a consistent trend of increasing or decreasing concentration of volatile organic compounds or SVOCs with increasing times after hydraulic fracturing. The major conclusions from the review of produced formation water data are:
• Produced formation water appears to be highly variable within and between shale plays.• Analytical techniques used for chemical and radiochemical characterization of the
produced formation water must be robust to the matrix interferences presented by total dissolved solids.
• Few volatile organic compounds and SVOCs are consistently found in produced formation waters. Benzene, ethyl benzene, toluene and xylenes are expected to be present in varying concentrations in natural gas. The concentrations of volatile organic compounds and SVOCs are generally low and tend to preclude their use as sentinel chemicals.
• The most reliable sentinel compounds appear to be total dissolved solids, chloride and divalent cations.
References ATSDR, 1992. Toxicological Profile for Pyridine, Atlanta, GA, September. Hayes, T, 2009. Sampling and Analysis of Water Streams Associated with the Development of
the Marcellus Shale Gas, Final Report, prepared for Marcellus Shale Coalition, Gas Technology Institute, Des Plaines, IL, December 31.
USGS, 2010. USGS Produced Water Database, queried at energy.cr.usgs.gov/prov/prodwat/intro.html.
Weatherford International Ltd., 2011. Corrosion Inhibitors, available on‐line.


