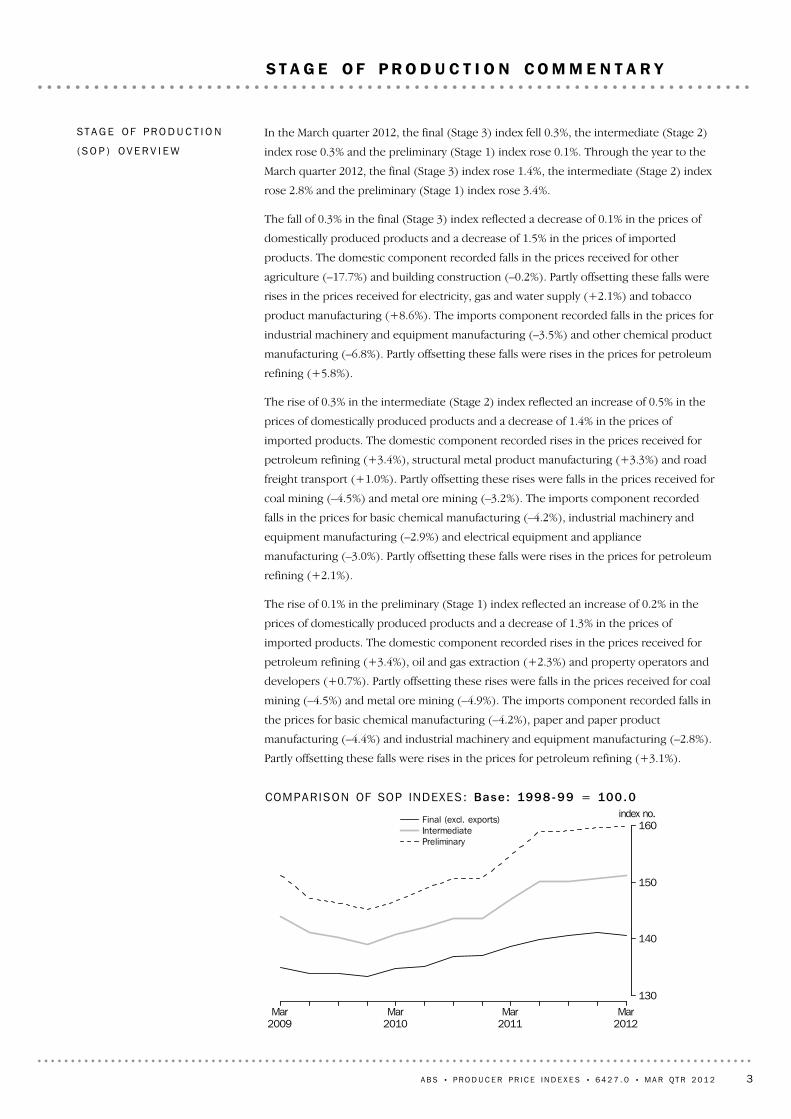
7.2 –1.3 Imports 2.8 0.2 Domestic 3.4 0.1 Preliminary (Stage 1) commodities 4.8 –1.4 Imports 2.6 0.5 Domestic 2.8 0.3 Intermediate (Stage 2) commodities –0.6 –1.5 Imports 1.7 –0.1 Domestic 1.4 –0.3 Final (Stage 3) commodities (excl. exports) % change % change Mar Qtr 11 to Mar Qtr 12 Dec Qtr 11 to Mar Qtr 12 STAGE OF PRODUCTION KEY FIGURES FINAL (STAGE 3) COMMODITIES ! fell 0.3% in the March quarter 2012. ! mainly due to falls in the prices received for other agriculture (–17.7%), building construction (–0.2%) and industrial machinery and equipment manufacturing (–2.4%). ! partly offset by rises in the prices received for electricity, gas and water supply (+2.1%) and tobacco product manufacturing (+7.8%). ! rose 1.4% through the year to the March quarter 2012. INTERMEDIATE (STAGE 2) COMMODITIES ! rose 0.3% in the March quarter 2012. ! mainly due to rises in the prices received for petroleum refining (+3.1%), structural metal product manufacturing (+3.4%) and road freight transport (+1.0%). ! partly offset by falls in the prices received for metal ore mining (–3.3%) and coal mining (–4.5%). ! rose 2.8% through the year to the March quarter 2012. PRELIMINARY (STAGE 1) COMMODITIES ! rose 0.1% in the March quarter 2012. ! mainly due to rises in the prices received for petroleum refining (+3.4%), oil and gas extraction (+0.9%) and property operators and developers (+0.7%). ! partly offset by falls in the prices received for coal mining (–4.5%) and metal ore mining (–4.7%). ! rose 3.4% through the year to the March quarter 2012. KEY POINTS E M B A R G O : 1 1 . 3 0 A M ( C A N B E R R A T I M E ) M O N 2 3 A P R 2 0 1 2 PRODUCER PRICE INDEXES AUSTRALIA 6427.0 M A R C H Q U A R T E R 2 0 1 2 For further information about these and related statistics, contact the National Information and Referral Service on 1300 135 070. Final Stage Base 1998–99 = 100.0 Mar 2008 Mar 2009 Mar 2010 Mar 2011 Mar 2012 index no. 125 130 135 140 145 Final Stage Quarterly % change Mar 2008 Mar 2009 Mar 2010 Mar 2011 Mar 2012 % –1 0 1 2 INQUIRIES www.abs.gov.au
–0.011.121.13. .. .. .–0.011.411.42Technical services782–0.013.233.24. .. .. .–0.024.074.09Real estate agents7720.011.891.88. .. .. .0.022.382.36Services to transport660.010.300.29. .. .. .0.010.370.36Water, air and space transport630–6400.010.480.47. .. .. .0.020.610.59Rail transport6200.021.671.65. .. .. .0.022.102.08Road freight transport6110.011.461.45. .. .. .0.011.841.83Accommodation5710.075.285.21. .. .. .0.096.666.57Non-building construction412
–0.1248.7048.82. .. .. .–0.1661.3961.55Building construction4110.2110.3210.11. .. .. .0.2513.0012.75Electricity, gas and water supply36–370.023.873.85–0.014.504.510.043.703.66Other mfg29
–0.104.094.19–0.4211.7412.16–0.012.072.08Industrial machinery and equipment mfg286–0.021.982.00–0.063.363.42–0.011.611.62Electrical equipment and appliance mfg285–0.031.101.13–0.163.994.150.000.340.34Electronic equipment mfg2840.000.790.79–0.023.193.210.000.160.16Photographic and scientific equipment mfg283
–0.021.321.34–0.093.873.960.010.650.64Other transport equipment mfg282–0.028.168.180.0016.8916.89–0.025.855.87Motor vehicle and part mfg281–0.010.380.39–0.030.940.970.000.230.23Fabricated metal product mfg2760.000.250.25. .. .. .–0.010.310.32Sheet metal product mfg2750.000.040.040.000.180.18. .. .. .Non-ferrous basic metal product mfg2730.000.030.030.000.140.14. .. .. .Iron and steel mfg2710.011.041.030.010.750.740.001.111.11Plastic product mfg2560.000.260.26–0.010.760.770.010.130.12Rubber product mfg255
–0.032.682.71–0.304.064.360.042.312.27Other chemical product mfg2540.000.120.12–0.010.570.58. .. .. .Basic chemical mfg2530.024.184.160.142.602.46–0.024.584.60Petroleum refining2510.000.280.280.020.750.730.000.160.16Recorded media mfg and publishing243
–0.011.341.35–0.040.710.750.001.511.51Publishing2420.010.320.310.000.070.070.000.380.38Printing and services to printing2410.000.640.64. .. .. .0.000.810.81Other wood, paper and paper product mfg232–2330.000.140.14–0.010.690.70. .. .. .Leather and leather product mfg226
–0.011.411.42–0.012.522.53. .. .. .Technical services782–0.024.074.09–0.047.257.29. .. .. .Real estate agents7720.022.382.36. .. .. .0.045.455.41Services to transport660.010.370.36. .. .. .0.020.850.83Water, air and space transport630–6400.020.610.59. .. .. .0.041.391.35Rail transport6200.022.102.08. .. .. .0.054.814.76Road freight transport6110.011.841.83. .. .. .0.034.224.19Accommodation5710.096.666.570.1611.8611.70. .. .. .Non-building construction412
–0.1661.3961.55–0.28109.37109.65. .. .. .Building construction4110.2513.0012.75. .. .. .0.5929.7329.14Electricity, gas and water supply36–370.043.703.660.044.634.590.022.512.49Other mfg29
–0.012.072.08–0.033.683.71. .. .. .Industrial machinery and equipment mfg286–0.011.611.620.001.101.10–0.032.272.30Electrical equipment and appliance mfg2850.000.340.340.000.490.490.000.150.15Electronic equipment mfg2840.000.160.160.000.280.28. .. .. .Photographic and scientific equipment mfg2830.010.650.640.020.810.79–0.010.450.46Other transport equipment mfg282
–0.025.855.87–0.025.925.94–0.025.795.81Motor vehicle and part mfg2810.000.230.230.000.420.42. .. .. .Fabricated metal product mfg276
–0.024.584.60. .. .. .–0.0310.4810.51Petroleum refining2510.000.160.16. .. .. .0.000.360.36Recorded media mfg and publishing2430.001.511.51. .. .. .0.003.453.45Publishing2420.000.380.38. .. .. .0.010.880.87Printing and services to printing2410.000.810.81. .. .. .0.011.851.84Other wood, paper and paper product mfg232–233
STAGE OF PRODUCT ION (a) (b ) : Domest i c f ina l commod i t i es index po in t s change6
12 A B S • P R O D U C E R P R I C E I N D E X E S • 6 4 2 7 . 0 • MA R QT R 2 0 1 2
(a) Reference base of each index: 1998–99 = 100.0.. . not applicable
–1.277.879.0–1.166.367.4–1.288.990.1Total
–0.014.504.510.021.901.88–0.047.067.10Other mfg29–0.4211.7412.16–0.8423.5824.42. .. .. .Industrial machinery and equipment mfg286–0.063.363.42–0.033.083.11–0.093.633.72Electrical equipment and appliance mfg285–0.163.994.15–0.246.356.59–0.061.651.71Electronic equipment mfg284–0.023.193.21–0.044.054.090.002.332.33Photographic and scientific equipment mfg283–0.093.873.96–0.125.555.67–0.072.202.27Other transport equipment mfg2820.0016.8916.890.1721.7721.60–0.1612.0112.17Motor vehicle and part mfg281
–0.030.940.97. .. .. .–0.061.871.93Fabricated metal product mfg2760.000.180.18. .. .. .0.000.360.36Non-ferrous basic metal product mfg2730.000.140.14. .. .. .0.000.280.28Iron and steel mfg2710.010.750.74. .. .. .0.031.501.47Plastic product mfg256
–0.010.760.77. .. .. .–0.041.501.54Rubber product mfg255–0.304.064.36. .. .. .–0.598.068.65Other chemical product mfg254–0.010.570.58. .. .. .–0.031.131.16Basic chemical mfg2530.142.602.46. .. .. .0.295.174.88Petroleum refining2510.020.750.73. .. .. .0.031.481.45Recorded media mfg and publishing243
–0.040.710.75. .. .. .–0.061.421.48Publishing2420.000.070.07. .. .. .–0.010.130.14Printing and services to printing241
STAGE OF PRODUCT ION (a) : Impor ted f ina l commod i t i es index poin ts change7
A B S • P R O D U C E R P R I C E I N D E X E S • 6 4 2 7 . 0 • MA R QT R 2 0 1 2 13
(a) Reference base of each index: 1998-99 = 100.0.. . not applicable
0.4151.1150.7–1.7122.2123.90.8156.1155.3Total
0.047.597.55. .. .. .0.048.888.84Other business services7860.006.176.17. .. .. .0.017.237.22Marketing and business management services7850.026.186.16. .. .. .0.037.247.21Legal and accounting services7840.053.343.29. .. .. .0.053.903.85Computer services783
–0.012.682.69. .. .. .0.003.143.14Technical services7820.001.451.45. .. .. .0.001.701.70Machinery and equipment hiring and leasing7740.001.831.83. .. .. .–0.012.142.15Real estate agents7720.0811.6111.53. .. .. .0.0813.5813.50Property operators and developers7710.011.171.16. .. .. .0.021.371.35Storage6700.021.941.92. .. .. .0.022.272.25Services to transport660.010.290.28. .. .. .0.010.340.33Other transport6500.031.321.29. .. .. .0.041.551.51Air and space transport6400.010.580.57. .. .. .0.020.680.66Water transport6300.030.800.77. .. .. .0.030.930.90Rail transport6200.087.757.67. .. .. .0.099.078.98Road freight transport6110.020.610.59. .. .. .0.010.710.70Accommodation5710.016.966.95. .. .. .0.028.158.13Electricity, gas and water supply36–37
–0.010.280.29–0.021.961.98. .. .. .Other mfg29–0.052.852.90–0.279.329.59–0.011.751.76Industrial machinery and equipment mfg286–0.032.722.75–0.206.296.49–0.012.112.12Electrical equipment and appliance mfg285–0.011.151.16–0.102.943.040.000.850.85Electronic equipment mfg284–0.010.680.69–0.053.543.59–0.010.190.20Photographic and scientific equipment mfg2830.010.910.90–0.011.501.510.020.810.79Other transport equipment mfg282
–0.013.233.24–0.149.089.220.012.232.22Motor vehicle and part mfg2810.011.941.93–0.014.054.060.011.581.57Fabricated metal product mfg2760.001.231.23–0.010.140.150.001.421.42Sheet metal product mfg2750.103.153.050.000.060.060.123.683.56Structural metal product mfg2740.020.580.560.071.671.600.000.390.39Non-ferrous basic metal product mfg2730.032.272.240.051.211.160.032.452.42Basic non-ferrous metal mfg272
–0.044.094.13–0.164.534.69–0.024.024.04Iron and steel mfg2710.015.095.08–0.062.642.700.025.515.49Non-metallic mineral product mfg260.002.462.46–0.013.053.060.012.372.36Plastic product mfg2560.030.960.93–0.042.963.000.040.620.58Rubber product mfg2550.002.532.53–0.114.064.170.022.272.25Other chemical product mfg254
–0.062.732.79–0.398.969.35–0.011.671.68Basic chemical mfg2530.186.025.840.188.908.720.185.535.35Petroleum refining251
–0.022.882.90. .. .. .–0.023.373.39Publishing2420.022.001.98. .. .. .0.032.352.32Printing and services to printing241
–0.011.661.67–0.122.782.900.011.471.46Paper and paper product mfg2330.062.352.290.020.850.830.062.602.54Other wood product mfg2320.001.141.14–0.021.871.890.011.021.01Log sawmilling and timber dressing2310.002.582.580.047.737.69–0.011.711.72Textile, clothing, footwear and leather mfg220.020.960.94–0.010.640.650.021.010.99Beverage and malt mfg218
–0.010.160.17. .. .. .–0.020.180.20Services to agriculture; hunting and trapping02–0.023.633.65. .. .. .–0.024.254.27Other agriculture011, 014–0160.067.327.26. .. .. .0.068.568.50Grain, sheep, beef and dairy cattle farming012–013
Change
Mar Qtr
2012
Dec Qtr
2011Change
Mar Qtr
2012
Dec Qtr
2011Change
Mar Qtr
2012
Dec Qtr
2011
TOTALIMPORTSDOMESTIC
ANZS IC 1993
STAGE OF PRODUCT ION PRICE INDEXES (a) : Inte rmed ia te commod i t i es index po in ts
change8
14 A B S • P R O D U C E R P R I C E I N D E X E S • 6 4 2 7 . 0 • MA R QT R 2 0 1 2
(a) Reference base of each index: 1998-99 = 100.0.. . not applicable
0.2159.8159.6–1.9149.4151.30.4161.6161.2Total
0.047.377.33. .. .. .0.048.568.52Other business services7860.015.805.79. .. .. .0.016.746.73Marketing and business management services7850.025.775.75. .. .. .0.026.706.68Legal and accounting services7840.053.583.53. .. .. .0.064.164.10Computer services783
–0.012.872.88. .. .. .–0.013.343.35Technical services782–0.012.042.05. .. .. .–0.012.372.38Machinery and equipment hiring and leasing774–0.012.582.59. .. .. .–0.022.993.01Real estate agents7720.1116.3816.27. .. .. .0.1319.0218.89Property operators and developers7710.011.431.42. .. .. .0.011.661.65Storage6700.022.322.30. .. .. .0.022.702.68Services to transport660.010.390.38. .. .. .0.010.460.45Other transport6500.031.481.45. .. .. .0.041.721.68Air and space transport6400.010.650.64. .. .. .0.010.750.74Water transport6300.041.101.06. .. .. .0.041.281.24Rail transport6200.109.559.45. .. .. .0.1111.0910.98Road freight transport6110.020.720.70. .. .. .0.010.830.82Accommodation5710.028.828.80. .. .. .0.0210.2510.23Electricity, gas and water supply36–37
–0.052.572.62–0.269.089.34–0.021.531.55Industrial machinery and equipment mfg286–0.021.721.74–0.144.404.540.001.291.29Electrical equipment and appliance mfg285–0.010.930.94–0.092.522.610.000.680.68Electronic equipment mfg2840.000.350.35–0.032.022.050.000.080.08Photographic and scientific equipment mfg2830.000.790.79–0.021.471.490.010.680.67Other transport equipment mfg2820.002.172.17–0.106.146.240.011.531.52Motor vehicle and part mfg2810.011.461.450.003.133.130.011.191.18Fabricated metal product mfg2760.000.620.620.000.070.070.000.710.71Sheet metal product mfg2750.072.182.11. .. .. .0.082.532.45Structural metal product mfg2740.010.700.690.092.081.990.000.480.48Non-ferrous basic metal product mfg2730.042.812.770.061.551.490.033.012.98Basic non-ferrous metal mfg272
–0.056.396.44–0.227.177.39–0.026.276.29Iron and steel mfg2710.012.162.15. .. .. .0.012.512.50Non-metallic mineral product mfg260.002.202.20–0.012.892.900.002.092.09Plastic product mfg2560.020.790.77–0.042.592.630.040.510.47Rubber product mfg2550.012.812.80–0.045.165.200.022.442.42Other chemical product mfg254
–0.145.605.74–0.8418.7719.61–0.033.503.53Basic chemical mfg2530.216.576.360.309.829.520.206.065.86Petroleum refining251
–0.022.442.46. .. .. .–0.022.832.85Publishing2420.021.631.61. .. .. .0.021.891.87Printing and services to printing241
–0.042.742.78–0.327.127.440.002.042.04Paper and paper product mfg2330.020.920.900.000.240.240.031.031.00Other wood product mfg2320.001.141.14–0.021.631.650.001.061.06Log sawmilling and timber dressing2310.001.581.580.035.285.25–0.010.991.00Textile, clothing, footwear and leather mfg220.010.510.500.000.410.410.010.530.52Beverage and malt mfg218
–0.010.440.45. .. .. .–0.010.510.52Flour mill and cereal food mfg2150.000.150.15–0.040.370.410.010.120.11Fruit and vegetable processing; oil and fat mfg213–214
–0.010.530.54–0.010.460.47–0.010.540.55Dairy product mfg2120.000.700.70. .. .. .0.000.810.81Meat and meat product mfg211
–0.011.921.93–0.060.971.030.012.082.07Other mining14–0.153.073.22–0.112.722.83–0.163.133.29Metal ore mining1310.1112.2112.10–0.0750.8550.920.136.035.90Oil and gas extraction120
–0.204.264.46. .. .. .–0.244.945.18Coal mining110–0.010.390.40. .. .. .–0.010.450.46Forestry and logging030–0.020.280.30. .. .. .–0.030.320.35Services to agriculture; hunting and trapping02–0.012.522.53. .. .. .–0.022.922.94Other agriculture011, 014–016–0.045.465.50. .. .. .–0.046.346.38Grain, sheep, beef and dairy cattle farming012–013
Change
Mar Qtr
2012
Dec Qtr
2011Change
Mar Qtr
2012
Dec Qtr
2011Change
Mar Qtr
2012
Dec Qtr
2011
TOTALIMPORTSDOMESTIC
ANZS IC 1993
STAGE OF PRODUCT ION PRICE INDEXES (a) : Pre l im ina r y commod i t i es index poin t s
change9
A B S • P R O D U C E R P R I C E I N D E X E S • 6 4 2 7 . 0 • MA R QT R 2 0 1 2 15
5 The valuation basis for the transactions covered by an output index is basic prices,
defined as the amount received by the producer exclusive of any taxes on products and
transport and trade margins (i.e. the pricing point is ex–factory, ex–farm, ex–service
provider, etc.).
6 On the other hand, an input index has a valuation basis of purchasers' prices, defined
as the amount paid by the purchaser inclusive of any non–deductible taxes on products
and transport and trade margins (i.e. the prices recorded in the index should be those
relating to products delivered into store, delivered on site, etc.).
7 In reality, industry practice may mean that it is sometimes necessary to diverge from
the conceptual ideal in order to obtain actual transaction prices. For example, although
the pricing point for the output index Price Indexes of Articles Produced by
Manufacturing Industries is ex–factory, in cases where costs such as handling and
distribution are built into the manufacturer's selling price, they will be included in the
index.
8 Similarly, for input indexes such as the Price Index of Materials Used In House
Building, which has a pricing point of delivered on site, it has sometimes been necessary
to use the nearest actual transaction price available, e.g. prices of materials supplied and
fixed.
9 The GST is excluded from all the prices recorded in the current producer price
indexes because, in the main, it is deductible on business–to–business transactions. In
the case of service industry output indexes relating to business–to–household
transactions, the GST is also excluded because the pricing basis is basic prices (i.e.
exclusive of product taxes).
Valuat ion basis
4 Producer price indexes can be constructed as either output or input measures. The
output producer price indexes relate to selected products that are primary to a particular
industry, irrespective of the industrial classification of establishments undertaking the
activity. The input producer price indexes relate to selected products used by
establishments classified to particular industries.
Output and input indexes
3 Producer price indexes relate to products that are primary to a particular industry,
irrespective of the industrial classification of establishments undertaking the activity. The
indexes do not represent the activity of establishments classified to a particular industry.
For ease of use, some of the tables relating to producer price indexes carry the title
'Selected output of an ANZSIC Division or Subdivision'. This indicates selected output of
products primary to that ANZSIC Division or Subdivision. The labels for the tables
available on the ABS website <http://www.abs.gov.au> associated with these additional
publications have been shortened. The coverage of these tables is as described in these
explanatory notes.
GE N E R A L
Industry versus product
1 This publication and associated data cubes and time series spreadsheets available on
the ABS website <http://www.abs.gov.au>, contain a range of producer price indexes.
Economy–wide indexes are presented within a stage of production framework in this
publication. A set of other indexes relating to products or services that are primary to
specific industries (selected manufacturing, construction, mining and service industries)
are available on the ABS website <http://www.abs.gov.au>.
2 Index numbers for the stage of production producer price indexes, services and
construction indexes, are primarily calculated on the reference base 1998–99=100.0. The
index numbers for other producer price indexes are primarily calculated on the
reference base 1989–90=100.0. New manufacturing and services indexes, introduced as
part of the ANZSIC 2006 implementation in the September quarter 2009, are calculated
on the reference base 2001–02 = 100.0. (Further information relating to the reference
bases is presented in the Appendix to the March quarter 2009 issue of this publication).
I N T R O D U C T I O N
16 A B S • P R O D U C E R P R I C E I N D E X E S • 6 4 2 7 . 0 • MA R QT R 2 0 1 2
E X P L A N A T O R Y N O T E S
18 As far as possible, the industry indexes have been constructed in accordance with
the Australian and New Zealand Standard Industrial Classification ANZSIC 2006 (cat.
no. 1292.0). Prior to the September quarter 2009, all of the series were based on the
ANZSIC 1993 classification. The stage of production series (tables 5–9 and 24–25) remain
on an ANZSIC 1993 basis. However, from the September quarter 2009 onwards, the
Classi f icat ions
12 The main sources of ongoing price data are samples of businesses. The samples can
relate to either buyers or sellers, or a combination of both. The choice is influenced by
the pricing point of the index (output or input) and practical considerations such as the
relative degree of concentration of buyers, and of sellers, and the implications for sample
sizes and costs.
13 The main pricing methodology used is specification pricing, under which a
manageable sample of precisely specified products is selected, in consultation with each
reporting business, for repeat pricing. In specifying the products, care is taken to ensure
that they are fully defined in terms of all the characteristics which influence their
transaction prices. As such, all the relevant technical characteristics need to be described
(e.g. make, model, features) along with the unit of sale, type of packaging, conditions of
sale (e.g. delivered, payment within 30 days), etc.
14 When the quality or the specifications of an item being priced change over time,
adjustments are made to the reported prices so that the index captures only pure price
change. That is, any element of price change attributable to a change in quality is
removed. If there is an increase (decrease) in the quality of an item, the price is adjusted
downwards (upwards) to reflect the value of the quality change to the provider of the
goods or services. This technique is known as pricing to constant quality.
15 Another very important consideration in establishing and maintaining price
collections is to ensure that the prices reported are actual market transaction prices.
That is, they must reflect the net prices received (or paid) after taking into account all
discounts applied to the transactions whether they be volume discounts, settlement
discounts or competitive price cutting discounts which are likely to fluctuate with market
conditions.
16 Any rebates also need to be considered. The collection of nominal list prices, or
book prices, is unlikely to yield reliable price indexes and could result in quite
misleading results if fluctuations in transaction prices are not captured. The ABS
therefore asks respondent businesses to report details of the discounts they offer so that
actual transaction prices can be calculated. In addition, as many different types of
discounts apply to business–to–business transactions (see paragraph 15), considerable
effort is put into monitoring discount practices in order to identify changes to existing
discounts and the introduction of new ones.
17 Specification pricing is not feasible in cases where the products are unique and not
reproduced over time, e.g. construction industry output and many of the customised
business services. As a result, alternative pricing techniques need to be used, often
involving compromise. Some of the approaches adopted include the use of model
pricing, collecting unit values for reasonably homogeneous components of a good or
service, input pricing and collecting charge–out rates (e.g. for a legal service).
Price measurement
10 The indexes are fixed weighted indexes of the Laspeyres form. The list of items and
the weights are updated periodically to ensure they remain representative. New index
series compiled using updated weights are linked to the previous series to maintain a
continuous series. Broad level weights are derived from an analysis of the latest available
input–output tables as well as other ABS and industry sources.
11 Where prices of items are expected to move in a similar way, many of the directly
priced items carry not only their own weight but also the weight of similar commodities.
Items and weights
A B S • P R O D U C E R P R I C E I N D E X E S • 6 4 2 7 . 0 • MA R QT R 2 0 1 2 17
E X P L A N A T O R Y N O T E S continued
23 The indexes are compiled using the SOP concept. Under this concept flows of
commodities are categorised according to their economic destination on a sequential
basis along the production chain. The basis for the categorisation is the Australian
input–output tables (1996–97). The primary categorisation is between final commodities
(i.e. commodities destined for final consumption, capital formation or export) and
non–final commodities (i.e. commodities that flow into intermediate consumption for
further processing).
24 This initial breakdown of the commodity flows into final and non–final represents a
useful economic dissection of producers' transactions. However, the non–final
commodities can flow into the production of both final and other non–final
commodities. Therefore, to aid analysis, the non–final commodity flows have been
divided on a sequential basis between Stage 1 (or preliminary) commodities and Stage 2
(or intermediate) commodities as illustrated below. This approach results in three
separate stages of production.
The SOP concept
22 In concept the valuation basis of the SOP indexes is basic prices (see paragraphs
5–9). However, the use of component series from existing ABS price collections in some
cases results in the pricing basis diverging from this ideal. For example, imports are
priced on a 'free–on–board' (f.o.b) basis, not 'cost, insurance, freight' (c.i.f), which
approximates basic prices.
Pric ing basis
19 Tables 1–9 and 24–25 present producer price indexes for the supply of
commodities to the Australian economy in a stage of production (SOP) framework. As
such, the indexes cover both domestically produced and imported commodities,
individually and in aggregate. The SOP indexes are compiled from data used in the
industry sector indexes, the international trade indexes and some additional data
collections. The indexes are calculated on the reference base 1998–99=100.0.
20 These indexes are compiled within the statistical framework outlined in
Information Paper: An Analytical Framework for Price Indexes in Australia, 1997 (cat.
no. 6421.0) and are designed to support the study of inflation.
21 A more detailed explanation of the SOP concept is contained in Information Paper:
Producer Price Index Developments, 1999 (cat. no. 6422.0). The index numbers in this
current publication cannot be directly compared with the experimental index numbers
in the information paper because:
! the coverage of the series has been expanded to include selected service and
construction industries; and
! the weighting patterns of the indexes have been updated to 1996–97 and the
reference base of the indexes has been updated to 1998–99=100.0.
ST A G E OF PR O D U C T I O N
(S O P ) PR O D U C E R PR I C E
IN D E X E S
Introduct ion
other producer price indexes relating to products primary to specific industries are
based on ANZSIC 2006. A mapping has been prepared to enable the ANZSIC 2006
producer price indexes to be represented under the ANZSIC 1993 stage of production
framework. Further information on the new industrial classification can be found in the
Appendix to the March quarter 2009 issue of this publication, as well as in Information
Paper: Update on ANZSIC 2006 Implementation for Producer and International Trade
(a)Grain mill and cereal productmanufacturing116Flour mill and cereal food manufacturing215
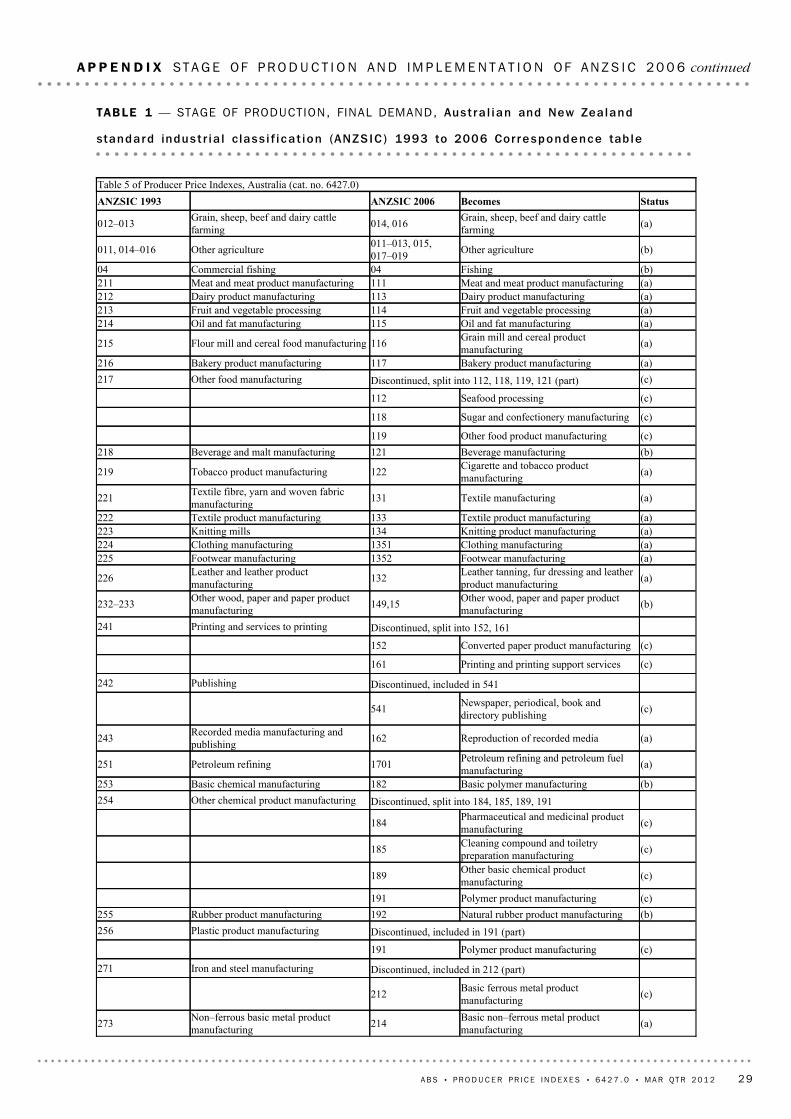
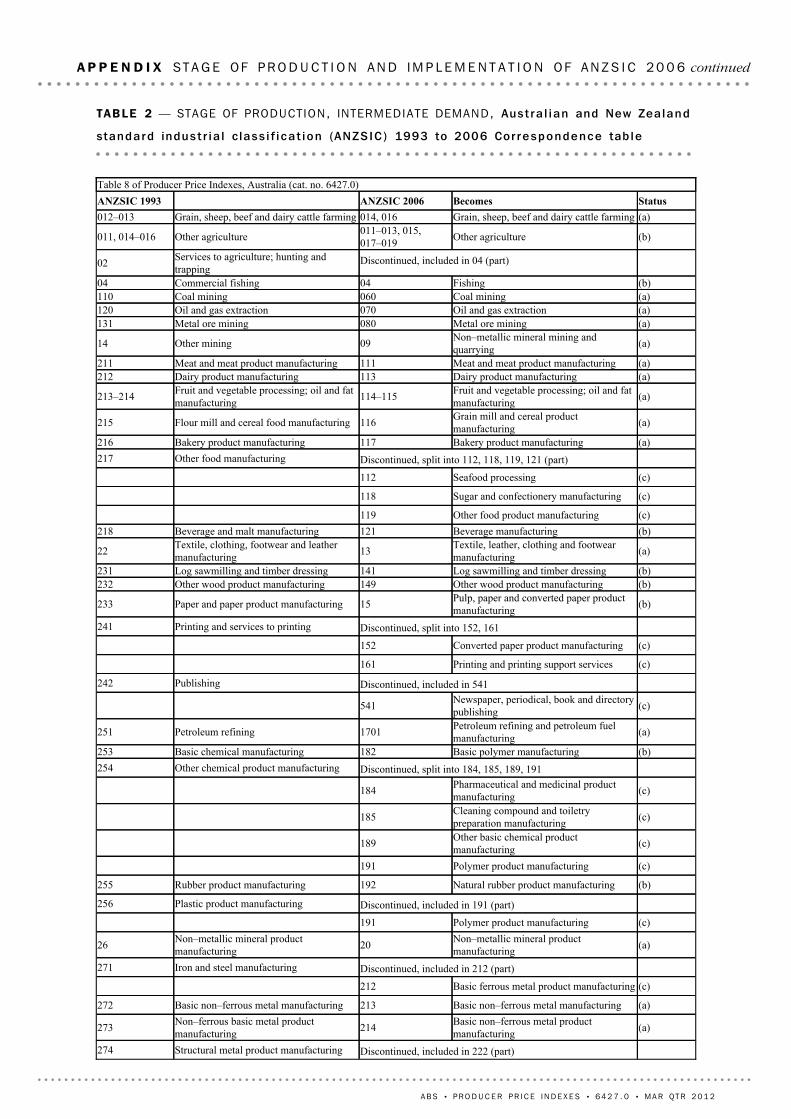
(a)Oil and fat manufacturing115Oil and fat manufacturing214(a)Fruit and vegetable processing114Fruit and vegetable processing213(a)Dairy product manufacturing113Dairy product manufacturing212(a)Meat and meat product manufacturing111Meat and meat product manufacturing211(b)Fishing04Commercial fishing04
(a)Grain, sheep, beef and dairy cattlefarming014, 016Grain, sheep, beef and dairy cattle
farming012�013
StatusBecomesANZSIC 2006ANZSIC 1993Table 5 of Producer Price Indexes, Australia (cat. no. 6427.0)
A P P E N D I X S T A G E O F P R O D U C T I O N AN D IM P L E M E N T A T I O N O F AN Z S I C 2 0 0 6 continued
A B S • P R O D U C E R P R I C E I N D E X E S • 6 4 2 7 . 0 • MA R QT R 2 0 1 2 29
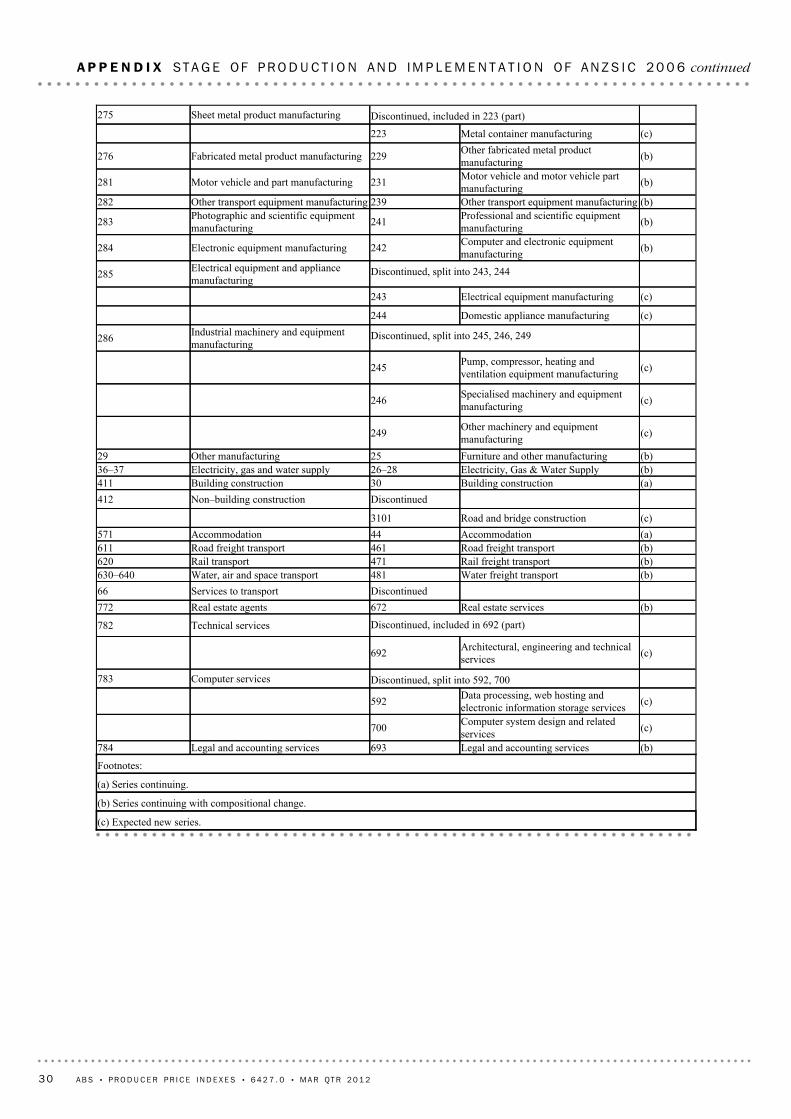
(c) Expected new series.
(b) Series continuing with compositional change.
(a) Series continuing.
Footnotes:
(b)Legal and accounting services693Legal and accounting services784
(c)Computer system design and relatedservices700
(c)Data processing, web hosting andelectronic information storage services 592
Discontinued, split into 592, 700Computer services783
(c)Architectural, engineering and technicalservices 692
Discontinued, included in 692 (part)Technical services782
(b)Real estate services672Real estate agents772DiscontinuedServices to transport66
(b)Water freight transport481Water, air and space transport630�640(b)Rail freight transport471Rail transport620(b)Road freight transport461Road freight transport611(a)Accommodation44Accommodation571(c)Road and bridge construction3101
DiscontinuedNon�building construction412(a)Building construction30Building construction411(b)Electricity, Gas & Water Supply26�28Electricity, gas and water supply36�37(b)Furniture and other manufacturing25Other manufacturing29
(c)Other machinery and equipmentmanufacturing249
(c)Specialised machinery and equipmentmanufacturing246
(a)Grain mill and cereal productmanufacturing116Flour mill and cereal food manufacturing215
(a)Fruit and vegetable processing; oil and fatmanufacturing114�115Fruit and vegetable processing; oil and fat
manufacturing213�214
(a)Dairy product manufacturing113Dairy product manufacturing212(a)Meat and meat product manufacturing111Meat and meat product manufacturing211
(a)Non�metallic mineral mining andquarrying09Other mining14
(a)Metal ore mining080Metal ore mining131(a)Oil and gas extraction070Oil and gas extraction120(a)Coal mining060Coal mining110(b)Fishing04Commercial fishing04
Discontinued, included in 04 (part)Services to agriculture; hunting andtrapping02
(a)Grain, sheep, beef and dairy cattle farming014, 016Grain, sheep, beef and dairy cattle farming012�013StatusBecomesANZSIC 2006ANZSIC 1993
Table 8 of Producer Price Indexes, Australia (cat. no. 6427.0)
A P P E N D I X S T A G E O F P R O D U C T I O N AN D IM P L E M E N T A T I O N O F AN Z S I C 2 0 0 6 continued
A B S • P R O D U C E R P R I C E I N D E X E S • 6 4 2 7 . 0 • MA R QT R 2 0 1 2
(c) Expected new series.
(b) Series continuing with compositional change.
(a) Series continuing.
Footnotes:
(c)Other administrative services729
(c)Employment services721
DiscontinuedOther business services786
(c)Market research and statistical services695
(c)Architectural, engineering and technicalservices 692
Discontinued, split into 692 (part), 695 (part), 696 (part)Marketing and business managementservices785
(b)Legal and accounting services693Legal and accounting services784
(c)Computer system design and relatedservices700
(c)Data processing, web hosting andelectronic information storage services592
Discontinued, split into 592, 700Computer services783
(c)Architectural, engineering and technicalservices 692
Discontinued, included in 692 (part)Technical services782
(b)Rental and hiring services (except realestate) 66Machinery and equipment hiring and
leasing774
(b)Real estate services672Real estate agents772
DiscontinuedProperty operators and developers771
(a)Warehousing and storage services530Storage670
DiscontinuedServices to transport66
DiscontinuedOther transport650
DiscontinuedAir and space transport640(b)Water freight transport481Water transport630(b)Rail freight transport471Rail transport620(b)Road freight transport461Road freight transport611(a)Accommodation44Accommodation571(b)Electricity, Gas & Water Supply26�28Electricity, gas and water supply36�37(b)Furniture and other manufacturing25Other manufacturing29
(c)Other machinery and equipmentmanufacturing249
(c)Specialised machinery and equipmentmanufacturing246
(c)Pump, compressor, heating and ventilationequipment manufacturing245
Discontinued, split into 245, 246, 249Industrial machinery and equipmentmanufacturing286
(c)Domestic appliance manufacturing244
(c)Electrical equipment manufacturing 243
Discontinued, split into 243, 244Electrical equipment and appliancemanufacturing285
(b)Computer and electronic equipmentmanufacturing242Electronic equipment manufacturing284
(b)Professional and scientific equipmentmanufacturing241Photographic and scientific equipment
manufacturing283
(b)Other transport equipment manufacturing239Other transport equipment manufacturing282
(b)Motor vehicle and motor vehicle partmanufacturing231Motor vehicle and part manufacturing281
(b)Other fabricated metal productmanufacturing229Fabricated metal product manufacturing276
(c)Metal container manufacturing223
Discontinued, included in 223 (part)Sheet metal product manufacturing275
(c)Structural metal product manufacturing222
A P P E N D I X S T A G E O F P R O D U C T I O N AN D IM P L E M E N T A T I O N O F AN Z S I C 2 0 0 6 continued
A B S • P R O D U C E R P R I C E I N D E X E S • 6 4 2 7 . 0 • MA R QT R 2 0 1 2
TABLE 3 — STAGE OF PRODUCT ION, PREL IMINARY DEMAND, Aust ra l i an and New Zea land
standa rd indus t r i a l c lass i f i ca t i on (ANZS IC ) 1993 to 2006 Cor respondence tab le
(a)Basic non�ferrous metal productmanufacturing214Non�ferrous basic metal product
manufacturing273
(a)Basic non�ferrous metal manufacturing213Basic non�ferrous metal manufacturing272(c)Basic ferrous metal product manufacturing212
Discontinued, included in 212 (part)Iron and steel manufacturing271
(a)Non�metallic mineral productmanufacturing20Non�metallic mineral product
manufacturing26
(c)Polymer product manufacturing191
Discontinued, included in 191 (part)Plastic product manufacturing256
(a)Grain mill and cereal productmanufacturing116Flour mill and cereal food manufacturing215
(a)Fruit and vegetable processing; oil and fatmanufacturing114�115Fruit and vegetable processing; oil and fat
manufacturing213�214
(a)Dairy product manufacturing113Dairy product manufacturing212(a)Meat and meat product manufacturing111Meat and meat product manufacturing211
(a)Other non�metallic mineral mining andquarrying099Other mining14
(a)Metal ore mining080Metal ore mining131(a)Oil and gas extraction070Oil and gas extraction120(a)Coal mining060Coal mining110(a)Forestry and logging030Forestry and logging030
DiscontinuedServices to agriculture; hunting andtrapping02
(a)Grain, sheep, beef and dairy cattle farming014, 016Grain, sheep, beef and dairy cattle farming012�013StatusBecomesANZSIC 2006ANZSIC 1993
Table 9 of Producer Price Indexes, Australia (cat. no. 6427.0)
A P P E N D I X S T A G E O F P R O D U C T I O N AN D IM P L E M E N T A T I O N O F AN Z S I C 2 0 0 6 continued
A B S • P R O D U C E R P R I C E I N D E X E S • 6 4 2 7 . 0 • MA R QT R 2 0 1 2
(c) Expected new series.
(b) Series continuing with compositional change.
(a) Series continuing.
Footnotes:
(c)Other administrative services729
(c)Employment services721
DiscontinuedOther business services786
(c)Market research and statistical services695
(c)Architectural, engineering and technicalservices 692
Discontinued, split into 692 (part), 695 (part), 696 (part)Marketing and business managementservices785
(b)Legal and accounting services693Legal and accounting services784
(c)Computer system design and relatedservices700
(c)Data processing, web hosting andelectronic information storage services 592
Discontinued, split into 592, 700Computer services783
(c)Architectural, engineering and technicalservices 692
Discontinued, included in 692 (part)Technical services782
(b)Rental and hiring services (except realestate) 66Machinery and equipment hiring and
leasing774
(b)Real estate services672Real estate agents772DiscontinuedProperty operators and developers771
(a)Warehousing and storage services530Storage670
DiscontinuedServices to transport66
DiscontinuedOther transport650
DiscontinuedAir and space transport640(b)Water freight transport481Water transport630(b)Rail freight transport471Rail transport620(b)Road freight transport461Road freight transport611(a)Accommodation44Accommodation571(b)Electricity, Gas & Water Supply26�28Electricity, gas and water supply36�37
(c)Other machinery and equipmentmanufacturing249
(c)Specialised machinery and equipmentmanufacturing246
(c)Pump, compressor, heating and ventilationequipment manufacturing245
Discontinued, split into 245, 246, 249Industrial machinery and equipmentmanufacturing286
(c)Domestic appliance manufacturing244
(c)Electrical equipment manufacturing 243
Discontinued, split into 243, 244Electrical equipment and appliancemanufacturing285
(b)Computer and electronic equipmentmanufacturing242Electronic equipment manufacturing284
(b)Professional and scientific equipmentmanufacturing241Photographic and scientific equipment
manufacturing283
(b)Other transport equipment manufacturing239Other transport equipment manufacturing282
(b)Motor vehicle and motor vehicle partmanufacturing231Motor vehicle and part manufacturing281
(b)Other fabricated metal productmanufacturing229Fabricated metal product manufacturing276
(c)Metal container manufacturing223
Discontinued, included in 223 (part)Sheet metal product manufacturing275
(c)Structural metal product manufacturing222
Discontinued, included in 222 (part)Structural metal product manufacturing274
A P P E N D I X S T A G E O F P R O D U C T I O N AN D IM P L E M E N T A T I O N O F AN Z S I C 2 0 0 6 continued
A B S • P R O D U C E R P R I C E I N D E X E S • 6 4 2 7 . 0 • MA R QT R 2 0 1 2
www.abs.gov.auWEB ADDRESS
All statistics on the ABS website can be downloaded freeof charge.
F R E E A C C E S S T O S T A T I S T I C S
Client Services, ABS, GPO Box 796, Sydney NSW 2001POST
Our consultants can help you access the full range ofinformation published by the ABS that is available free ofcharge from our website. Information tailored to yourneeds can also be requested as a 'user pays' service.Specialists are on hand to help you with analytical ormethodological advice.
I N F O R M A T I O N A N D R E F E R R A L S E R V I C E
www.abs.gov.au the ABS website is the best place fordata from our publications and information about the ABS.