Page 1
Producing Synthetic Estimates of Children’s Health and Well-Being for Local Areas
POPULATION REFERENCE BUREAU | www.prb.org
PRESENTATION BY MARK MATHER AND BETH JAROSZ OF THE POPULATION REFERENCE BUREAU
SEPT. 2014
Page 2
© 2014 Population Reference Bureau. All rights reserved. www.prb.org
Overview
Purpose Methodology
Data, process, and examples
Techniques to reduce error
Methods for evaluating the estimates
Results Conclusions
Page 3
© 2014 Population Reference Bureau. All rights reserved. www.prb.org
What is a Synthetic Local Estimate?
When data are available only for larger areas, how do we estimate local conditions? Extend the patterns that exist in a larger
region down to the local level Called “estimates” because they are
extrapolated (not observed) Called “synthetic” because they are created
by combining data for the “parent” geography with local population data
Page 4
© 2014 Population Reference Bureau. All rights reserved. www.prb.org
Purpose
National Survey of Children’s Health provides state-level estimates of child health and well-being
Extensive public health planning and policy occurs at the county- or city-level
These estimates attempt to bridge that gap
Page 5
© 2014 Population Reference Bureau. All rights reserved. www.prb.org
The Broader Context
Federal, state budgets squeezed Demands for better data at lower costs Declining response rates / Privacy
concerns Future=Greater reliance on administrative
records and model-based estimates
Page 6
© 2014 Population Reference Bureau. All rights reserved. www.prb.org
26 Health Measures
Obesity and overweight status
CSHCN status Status of child’s teeth Prematurity EBD - Emotional,
developmental, and/or behavioral problems
Adequacy of insurance
Consistency of insurance
Childcare issues affecting parental employment
Preventive medical Preventive dental Medical home Received needed
mental health care
Page 7
© 2014 Population Reference Bureau. All rights reserved. www.prb.org
26 Health Measures
Vision screening Developmental
screening Problems accessing
specialist care School engagement Grade repetition Missed school Adverse Childhood
Experience (ACEs)
Parental stress Supportive
neighborhoods Safe communities Neighborhood
amenities Resilience age 0-5 Resilience age 6-17 Physical activity
Page 8
© 2014 Population Reference Bureau. All rights reserved. www.prb.org
Methodology: Data Sources
2011-2012 National Survey of Children’s Health (NSCH) State-level prevalence rates
• 4 racial/ethnic categories• 4 family income categories
2010-2012 American Community Survey (ACS) Local-level population data
• 4 racial/ethnic categories• 4 family income categories
Page 9
© 2014 Population Reference Bureau. All rights reserved. www.prb.org
Methodology: Geography
NSCH prevalence rates for 50 states, District of Columbia, 4 Census Regions
Image source: U.S. Centers for Disease Control and Prevention
Page 10
© 2014 Population Reference Bureau. All rights reserved. www.prb.org
Methodology: Geography
ACS population estimates for cities and counties of population ≥100,000 583 counties 297 cities (excl. 3 college towns)
• South Bend, IN (Notre Dame University)• Edison township, NJ (Rutgers University)• Murfreesboro, TN (Middle Tennessee State Univ.)
Wyoming special case: • No counties or cities met 100,000 population
threshold in 2012• Combined counties of Albany and Laramie
Page 11
© 2014 Population Reference Bureau. All rights reserved. www.prb.org
Methodology: Estimation Process
Rate = Sum Incidence / Sum
Population
To Get Estimated Incidence by Race
and Income
Multiply by NSCH Rate by Race and
Income
ACS Population by Race and Income
Population Area AR,I
Incidence Area AR,I
Estimated Rate A
Population Area BR,I
Incidence Area BR,I
Estimated Rate B
Population Area CR,I
Incidence Area CR,I
Estimated Rate C
Prevalence RateR,I
Page 12
© 2014 Population Reference Bureau. All rights reserved. www.prb.org
Methodology: Estimation Formula
Where:
= local population of a given race and income group within the age group of interest
= number of cases in parent geography
= population of parent geography
L
OR
L
Page 13
© 2014 Population Reference Bureau. All rights reserved. www.prb.org
Example: Overweight/Obesity in Baltimore, MDNSCH Prevalence Rate MARYLAND
0-99% FPL
100-199% FPL
200-399% FPL
400% FPL or Higher
Hispanic 50.0%* 45.7%* 36.2%* 23.8%*
White, non-Hispanic 40.9%* 33.6%* 24.1% 18.0%
Black, non-Hispanic 52.7%* 80.2% 36.3% 34.7%
Other, non-Hispanic 37.9%* 35.1%* 35.9%* 20.9%*
ACS Population Est. BALTIMORE
TOTAL 0-99% FPL
100-199% FPL
200-399% FPL
400% FPL or Higher
TOTAL 54,028 19,094 14,000 13,959 6,975
Hispanic 2,003 777 463 548 215
White, non-Hispanic 7,838 1,300 1,307 2,348 2,883
Black, non-Hispanic 41,534 16,310 11,532 10,335 3,357
Other, non-Hispanic 2,653 707 698 728 520
Page 14
© 2014 Population Reference Bureau. All rights reserved. www.prb.org
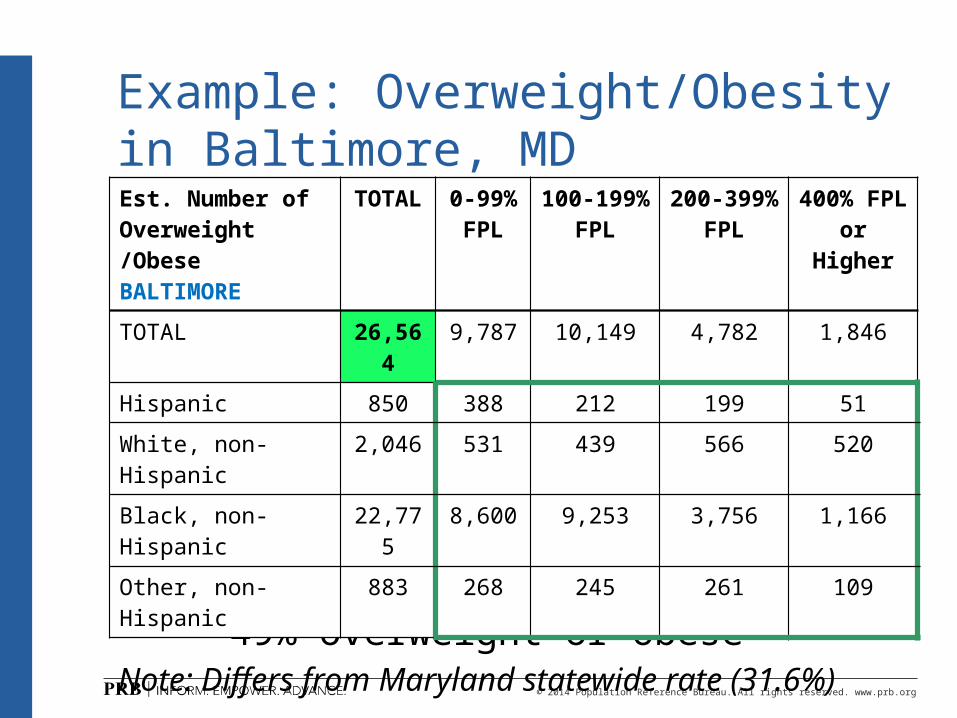
Example: Overweight/Obesity in Baltimore, MD
Baltimore overweight/obesity prevalence rate
= 26,564 / 54,028
= 49% overweight or obeseNote: Differs from Maryland statewide rate (31.6%)
Est. Number of Overweight /Obese BALTIMORE
TOTAL 0-99% FPL
100-199% FPL
200-399% FPL
400% FPL or Higher
TOTAL 26,564 9,787 10,149 4,782 1,846
Hispanic 850 388 212 199 51
White, non-Hispanic 2,046 531 439 566 520
Black, non-Hispanic 22,775 8,600 9,253 3,756 1,166
Other, non-Hispanic 883 268 245 261 109
Page 15
© 2014 Population Reference Bureau. All rights reserved. www.prb.org
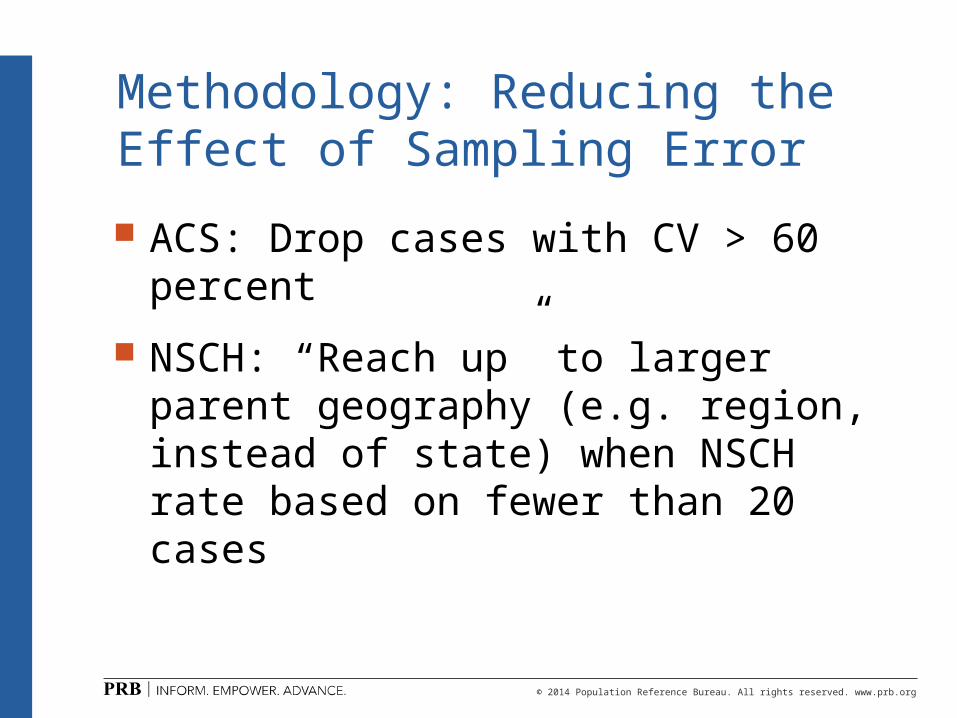
Methodology: Reducing the Effect of Sampling Error
ACS: Drop cases with CV > 60 percent
NSCH: “Reach up” to larger parent geography (e.g. region, instead of state) when NSCH rate based on fewer than 20 cases
Page 16
© 2014 Population Reference Bureau. All rights reserved. www.prb.org
Methodology: Evaluating the Estimates
Proof of Concept #1: test synthetic estimation at the state level Use region-level rates to develop synthetic
state estimates Compare with published state-level NSCH
• Mean Absolute Percent Error (MAPE)• Mean Algebraic Percent Error (MALPE)
Page 17
© 2014 Population Reference Bureau. All rights reserved. www.prb.org
Evaluation: MAPE and MALPE for Region to State Synthetic Estimates 50 states and
District of Columbia 4 Census Regions Synthetic method
applied Used Region
prevalence rate and state population estimates
Overweight & Obesity
U.S. Rate 31.3
Range 17.3
High (MS) 39.7
Low (UT) 22.4
MAPE 7.5
MALPE 1.5
Max Underestimate -6.7
Max Overestimate 7.4
Nmbr States w/i 1pt 13
Percent within 1pt 25.5%
Page 18
© 2014 Population Reference Bureau. All rights reserved. www.prb.org
Survey: Overweight/Obesity Rate for Children Ages 10-17
NSCH Rate ofOverweight/Obesity
< 25%
25 to 29%
30 to 34%
35% or higher
Hawaii
Alaska
West
South
Midwest
Northeast
Texas
Utah
Montana
California
Arizona
Idaho
Nevada
Oregon
Iowa
ColoradoKansas
Wyoming
New Mexico
IllinoisOhio
Missouri
Nebraska
Georgia
Oklahoma
Washington
Arkansas
South Dakota
North Dakota
Virginia
Tennessee
Florida
Minnesota
Alabama
Wisconsin
Maine
New York
Louisiana
Indiana
Michigan
Mississippi
Kentucky
North Carolina
South Carolina
Vermont
MarylandNew Jersey
New Hampshire
Massachusetts
Connecticut
DelawareRhode Island
District of Columbia
Page 19
© 2014 Population Reference Bureau. All rights reserved. www.prb.org
Estimate: Overweight/Obesity Rate for Children Ages 10-17
Hawaii
Alaska
West
South
Midwest
Northeast
Texas
Utah
Montana
California
Arizona
Idaho
Nevada
Oregon
Iowa
ColoradoKansas
Wyoming
New Mexico
IllinoisOhio
Missouri
Nebraska
Georgia
Oklahoma
Washington
Arkansas
South Dakota
North Dakota
Virginia
Tennessee
Florida
Minnesota
Alabama
Wisconsin
Maine
New York
Louisiana
Indiana
Michigan
Mississippi
Kentucky
North Carolina
South Carolina
Vermont
MarylandNew Jersey
New Hampshire
Massachusetts
Connecticut
DelawareRhode Island
District of Columbia
Estimated Rate ofOverweight/Obesity
< 25%
25 to 29%
30 to 34%
35% or higher
Page 20
© 2014 Population Reference Bureau. All rights reserved. www.prb.org
Difference Between Survey and Estimate for Overweight/Obesity
Hawaii
Alaska
West
South
Midwest
Northeast
Texas
Utah
Montana
California
Arizona
Idaho
Nevada
Oregon
Iowa
ColoradoKansas
Wyoming
New Mexico
IllinoisOhio
Missouri
Nebraska
Georgia
Oklahoma
Washington
Arkansas
South Dakota
North Dakota
Virginia
Tennessee
Florida
Minnesota
Alabama
Wisconsin
Maine
New York
Louisiana
Indiana
Michigan
Mississippi
Kentucky
North Carolina
South Carolina
Vermont
MarylandNew Jersey
New Hampshire
Massachusetts
Connecticut
DelawareRhode Island
District of Columbia
Percentage PointDifference in Rates
-6.7 to -3.0
-2.9 to -1.0
-0.9 to 0.9
1.0 to 2.9
3.0 to 7.4
Page 21
© 2014 Population Reference Bureau. All rights reserved. www.prb.org
Methodology: Evaluating the Estimates Proof of Concept #2: Compare NSCH and
Synthetic Estimates for Washington, D.C. District of Columbia is a unique case
• D.C. surveyed and reported as a state in NSCH• D.C. also a city and a county in synthetic estimates
Results suggest method yields reliable estimates• D.C. synthetic estimate incorporates ACS
reweighting and state- and region-level NSCH
Page 22
© 2014 Population Reference Bureau. All rights reserved. www.prb.org
Evaluation: Compare Estimates for District of Columbia
Health Measure Synth. Publ. Diff.Obesity/overweight 38.3 35.0 3.30
CSHCN status 22.9 20.9 2.00Status of children’s teeth 74 72.6 1.40Prematurity 91.2 89.6 1.60
EBD problems 8.2 N/A N/AAdequacy of insurance 21.2 19.7 1.50Consistency of insurance 93.6 94.2 -0.60Childcare affecting employment 84.6 85.0 -0.40Preventive medical 90.2 89.8 0.40Preventive dental 17.5 17.7 -0.20Medical home 48.8 49.7 -0.90Received needed mental health care 4.2 5.6 -1.40
Health Measure Synth. Publ. Diff.Vision screening 63.5 63.8 -0.30Developmental screening 27.5 N/A N/AProblems accessing specialist care 9.1 7.7 1.40School engagement 74.5 73.6 0.90Grade repetition 85.2 84.4 0.80Missed school 94.4 94.6 -0.20ACEs 27.4 24.7 2.70Parental stress 14.1 14.2 -0.10Supportive neighborhoods 70.1 71.2 -1.10Safe communities 72.5 72.6 -0.10Neighborhood amenities 93.3 92.3 1.00Resilience 0-5 66.5 N/A N/A
Resilience 6-17 53.7 N/A N/APhysical activity 62.2 59.5 2.70
Page 23
© 2014 Population Reference Bureau. All rights reserved. www.prb.org
Results: Obesity by County, U.S.
Page 24
© 2014 Population Reference Bureau. All rights reserved. www.prb.org
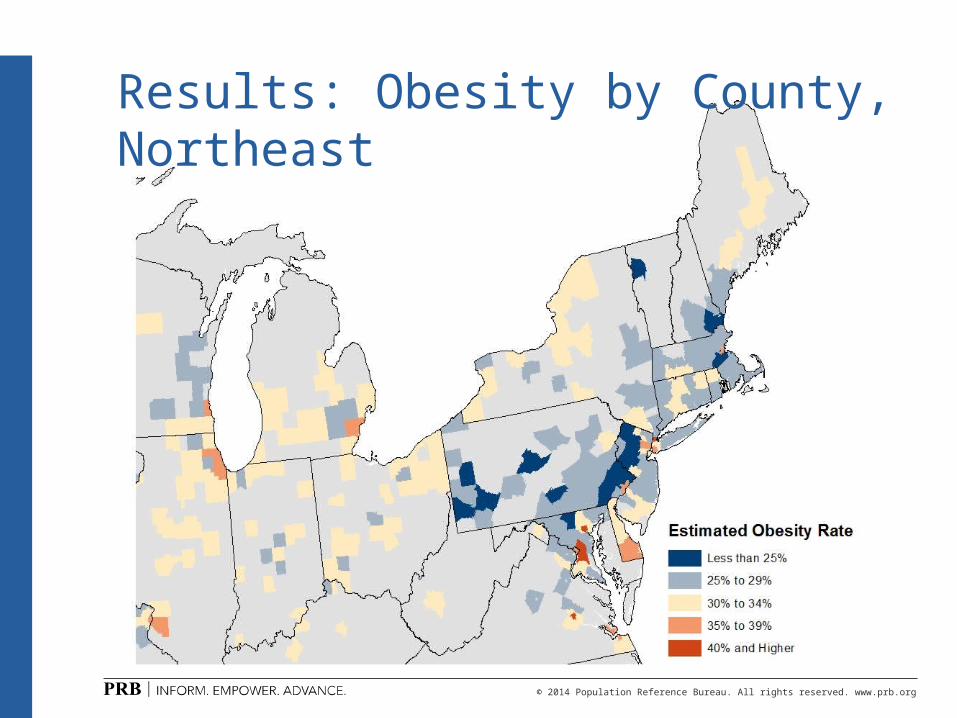
Results: Obesity by County, Northeast
Page 25
© 2014 Population Reference Bureau. All rights reserved. www.prb.org
Results: Obesity by County, West
Page 26
© 2014 Population Reference Bureau. All rights reserved. www.prb.org
Results: Obesity by County, Atlanta
Page 27
© 2014 Population Reference Bureau. All rights reserved. www.prb.org
Discussion: Model Strengths
Model based on sound estimation techniques
Process is clear and replicable Method attempts to mitigate effect of
sampling error “Reaches up” to larger parent geography
when state rate is unstable Focuses on areas with relatively large
populations Excludes population groups with large CV
Page 28
© 2014 Population Reference Bureau. All rights reserved. www.prb.org
Discussion: Potential Source of Error
Sampling error in the NSCH Sampling error in the ACS data affecting
the population reweighting scheme Rounding error in the ACS data affecting
the population reweighting scheme Variation in the health and well-being of
children across different racial/ethnic and income groups at the state and local levels
Page 29
© 2014 Population Reference Bureau. All rights reserved. www.prb.org
Discussion: Model Limitations
Model may under- or over-estimate location-specific variations in health Assumes local prevalence rates by
race/ethnicity and income match state rates Combined estimates may compound sampling
error Unable to “ground truth” model against
county- and city-level data from NSCH or other sources
Page 30
© 2014 Population Reference Bureau. All rights reserved. www.prb.org
Conclusions and Next Steps
Conclusions: Method useful, but has limitations
Wide range of possible applications
Next Steps: Compare synthetic estimates with special
tabulation of NSCH data for selected counties
Produce data for rural areas
Page 31
© 2014 Population Reference Bureau. All rights reserved. www.prb.org
MARK MATHER
Associate Vice President
U.S. Programs
Population Reference Bureau
[email protected]
BETH JAROSZ
Research Associate
U.S. Programs
Population Reference Bureau
[email protected]