Page 1
PRODUCT INFORMATION EXTRACTION
By
Santosh Raju Vysyaraju
200707023
A THESIS SUBMITTED IN PARTIAL FULFILLMENT OF THEREQUIREMENTS FOR THE DEGREE OF
Master of Science (by Research)in
Computer Science & Engineering
Search and Information Extraction Lab, Language TechnologiesResearch Center
International Institute of Information Technology
Hyderabad, India
June 2010
Page 2
Copyright c© 2010 Santosh Raju Vysyaraju
All Rights Reserved
Page 3
Dedicated to all those people, living and dead, who are directly or indirectlyresponsible to the wonderful life that I am living now.
Page 4
INTERNATIONAL INSTITUTE OF INFORMATION TECHNOLOGY
Hyderabad, India
CERTIFICATE
It is certified that the work contained in this thesis, titled “ Product Information
Extraction ” by Santosh Raju Vysyaraju (200707023) submitted in partial fulfill-
ment for the award of the degree of Master of Science (by Research) in Computer
Science & Engineering, has been carried out under my supervision and it is not
submitted elsewhere for a degree.
Date Advisor :
Dr. Vasudeva VarmaAssociate Professor
IIIT, Hyderabad
Page 5
Acknowledgements
I would like to first thank my advisor Dr.Vasudeva Varma for believing in me
and giving me the freedom to work on problems of my interest. I thank Dr. Prasad
Pingali for his valuable guidance, help at various junctures throughout the duration
of my thesis. I thank Dr. Kamal Karlapalem for his motivation and generating re-
search interest during my bachelors. I thank Babji for all the help with the systems.
I thank Praneeth for all the innumerable dicussions (technical and non-technical),
helps, motivational talks, suggestions and everything else that has happend ever
since that fateful first meeting near NBH. Without him, life would have been tough
and it would have been impossible to finish my thesis with ease. I thank Rahul for
all the help in writing the papers, enlightening discussions and all the fun. I thank
Sowmya for all those innumerable walks, talks and for pushing me to work at deci-
sive moments. I thank Swathi for all the fun and help. I thank Saras and Shivudu
for the lite moments in lunch times and dinner outings. Last but not the least, I spe-
cially thank all my btech batchmates and Krishna Kiran for all those dinner outings
and fun thoughout my master’s which were very important in relieving the stress.
Page 6
Abstract
Online shopping has become a very popular web application in the recent times and
received lot of attention from both consumers and retail merchants. With this grow-
ing popularity, lots of information is generated on many products to assist users
across the globe. This has resulted in information explosion with lots of informa-
tion for the consumers to digest. This has created need for techniques to identify
useful and relevant content for the consumers from the huge amounts available. In
this thesis, we have explored application of information extraction techniques for
extracting relevant product information. We have focused on the following sub-
problems in the context of products: Attribute Extraction, Attribute Ranking.
We have explored algorithms to automatically extract product attributes from
text descriptions. We have come up with unsupervised methods which do not re-
quire any domain specific information for extraction. Our algorithms are based on
the hypothesis that attributes should repeat across descriptions. We have explored
two clustering methods in this work for extraction : Noun Phrase(NP) Clustering
and Word Clustering. In the first method, clusters of noun phrases are computed so
that all the phrases describing an attribute are grouped together and a representative
attribute is extracted from each cluster. In the second method, we cluster words ap-
pearing in the descriptions such that all the words related to an attribute are grouped
together in one cluster. We construct a graph from the word occurrences in descrip-
tions and compute word clusters using a graph clustering algorithm. Attributes are
extracted from word clusters using word associations inside a cluster. We have
Page 7
throughly evaluated our methods by conducting various experiments. Our exper-
iments show that the methods are robust and extract product attributes accurately.
We have also compared the two algorithms and presented an analysis on the trade
offs in the two approaches.
We have defined attribute ranking in the context of product comparison and
came up new features for ranking the attributes. We have also designed a new kind
of summaries called Comparative Summaries that delivers majority of the compara-
ble content found in an input set of documents. We have presented how comparative
summaries could be generated for products using our attribute extraction and rank-
ing algorithms. We have carried out experiments to evaluate the performance of our
ranking algorithm and showed that it is effective in identifying useful attributes.
Page 8
Contents
Table of Contents viii
List of Tables x
List of Figures xi
1 Introduction 11.1 Information Extraction . . . . . . . . . . . . . . . . . . . . . . . . . . . . 2
1.1.1 Applications . . . . . . . . . . . . . . . . . . . . . . . . . . . . . 21.1.2 Types of Sources . . . . . . . . . . . . . . . . . . . . . . . . . . . 31.1.3 Granularity . . . . . . . . . . . . . . . . . . . . . . . . . . . . . . 41.1.4 Extraction Methods . . . . . . . . . . . . . . . . . . . . . . . . . . 4
1.2 Product Information Extraction . . . . . . . . . . . . . . . . . . . . . . . . 51.2.1 Product Data . . . . . . . . . . . . . . . . . . . . . . . . . . . . . 61.2.2 Research in Product Information Extraction . . . . . . . . . . . . . 7
1.3 Product Attribute Extraction . . . . . . . . . . . . . . . . . . . . . . . . . 81.4 Problem Statement . . . . . . . . . . . . . . . . . . . . . . . . . . . . . . 101.5 Contributions . . . . . . . . . . . . . . . . . . . . . . . . . . . . . . . . . 101.6 Organization of Thesis . . . . . . . . . . . . . . . . . . . . . . . . . . . . 11
2 Related Work 132.1 Key Phrase Extraction . . . . . . . . . . . . . . . . . . . . . . . . . . . . 142.2 Customer Review Mining . . . . . . . . . . . . . . . . . . . . . . . . . . . 152.3 Attribute Information Extraction . . . . . . . . . . . . . . . . . . . . . . . 16
2.3.1 Attribute Extraction from Web Pages . . . . . . . . . . . . . . . . 172.3.2 Attribute Normalization . . . . . . . . . . . . . . . . . . . . . . . 17
2.4 Comparative Information Extraction . . . . . . . . . . . . . . . . . . . . . 182.4.1 Extraction of sentence level comparative information . . . . . . . . 182.4.2 Extraction of topic level comparisons . . . . . . . . . . . . . . . . 19
3 Attribute Extraction 213.1 Challenges . . . . . . . . . . . . . . . . . . . . . . . . . . . . . . . . . . . 213.2 General Approach . . . . . . . . . . . . . . . . . . . . . . . . . . . . . . . 23
viii
Page 9
CONTENTS
3.3 Noun Phrase Clustering Approach . . . . . . . . . . . . . . . . . . . . . . 253.3.1 Pre-processing . . . . . . . . . . . . . . . . . . . . . . . . . . . . 253.3.2 Clustering . . . . . . . . . . . . . . . . . . . . . . . . . . . . . . . 263.3.3 Attribute Identification . . . . . . . . . . . . . . . . . . . . . . . . 28
3.4 Summary . . . . . . . . . . . . . . . . . . . . . . . . . . . . . . . . . . . 30
4 Attribute Extraction using Word Clusters 314.1 Small World Property . . . . . . . . . . . . . . . . . . . . . . . . . . . . . 324.2 Graph Construction . . . . . . . . . . . . . . . . . . . . . . . . . . . . . . 324.3 Chinese Whispers Algorithm . . . . . . . . . . . . . . . . . . . . . . . . . 334.4 Attribute Extraction . . . . . . . . . . . . . . . . . . . . . . . . . . . . . . 354.5 Summary . . . . . . . . . . . . . . . . . . . . . . . . . . . . . . . . . . . 37
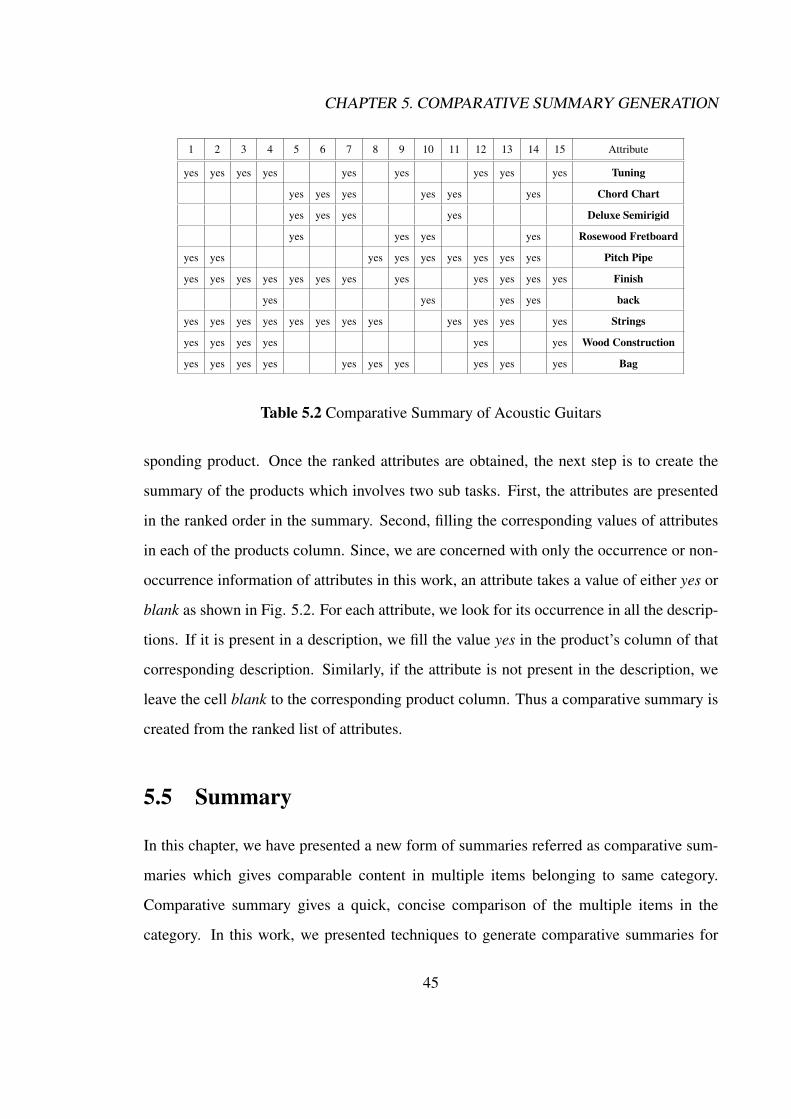
5 Comparative Summary Generation 385.1 Introduction . . . . . . . . . . . . . . . . . . . . . . . . . . . . . . . . . . 385.2 Comparative Summary Generation Framework . . . . . . . . . . . . . . . 405.3 Attribute Ranking . . . . . . . . . . . . . . . . . . . . . . . . . . . . . . . 42
5.3.1 Features . . . . . . . . . . . . . . . . . . . . . . . . . . . . . . . . 425.3.2 Ranking Function . . . . . . . . . . . . . . . . . . . . . . . . . . . 44
5.4 Creating the Summary . . . . . . . . . . . . . . . . . . . . . . . . . . . . 445.5 Summary . . . . . . . . . . . . . . . . . . . . . . . . . . . . . . . . . . . 45
6 Experiments and Results 476.1 Data . . . . . . . . . . . . . . . . . . . . . . . . . . . . . . . . . . . . . . 476.2 Evaluation Measures . . . . . . . . . . . . . . . . . . . . . . . . . . . . . 48
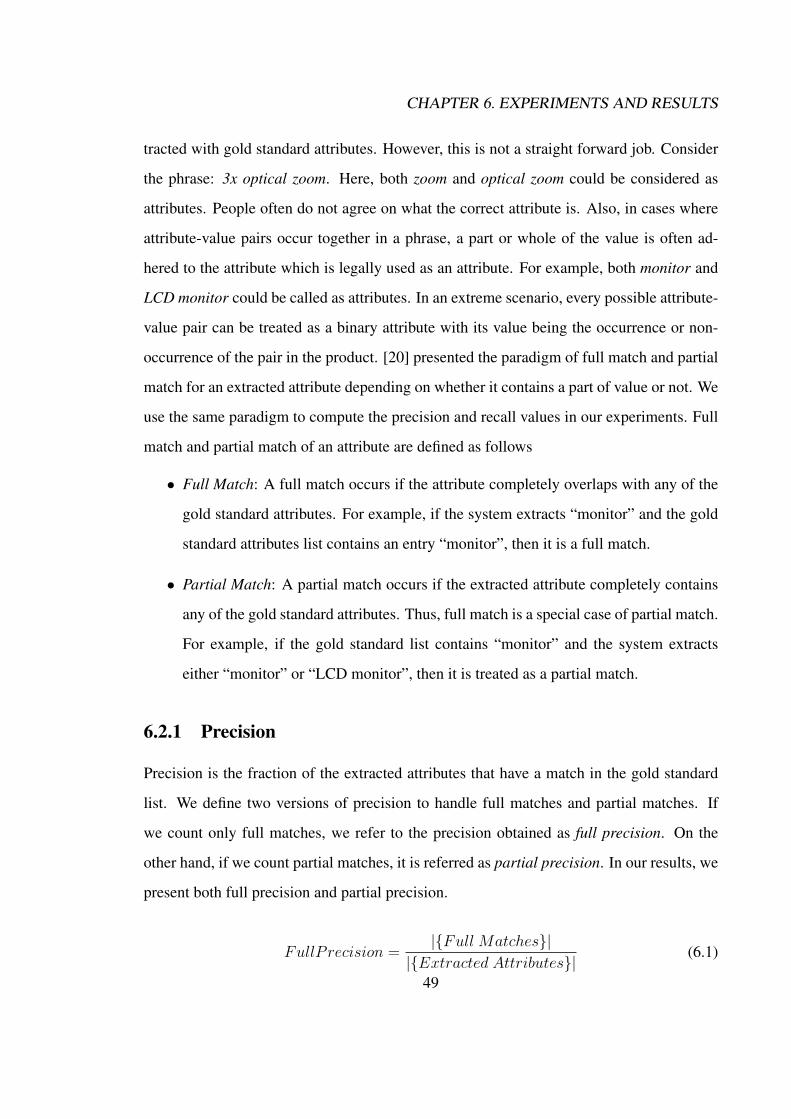
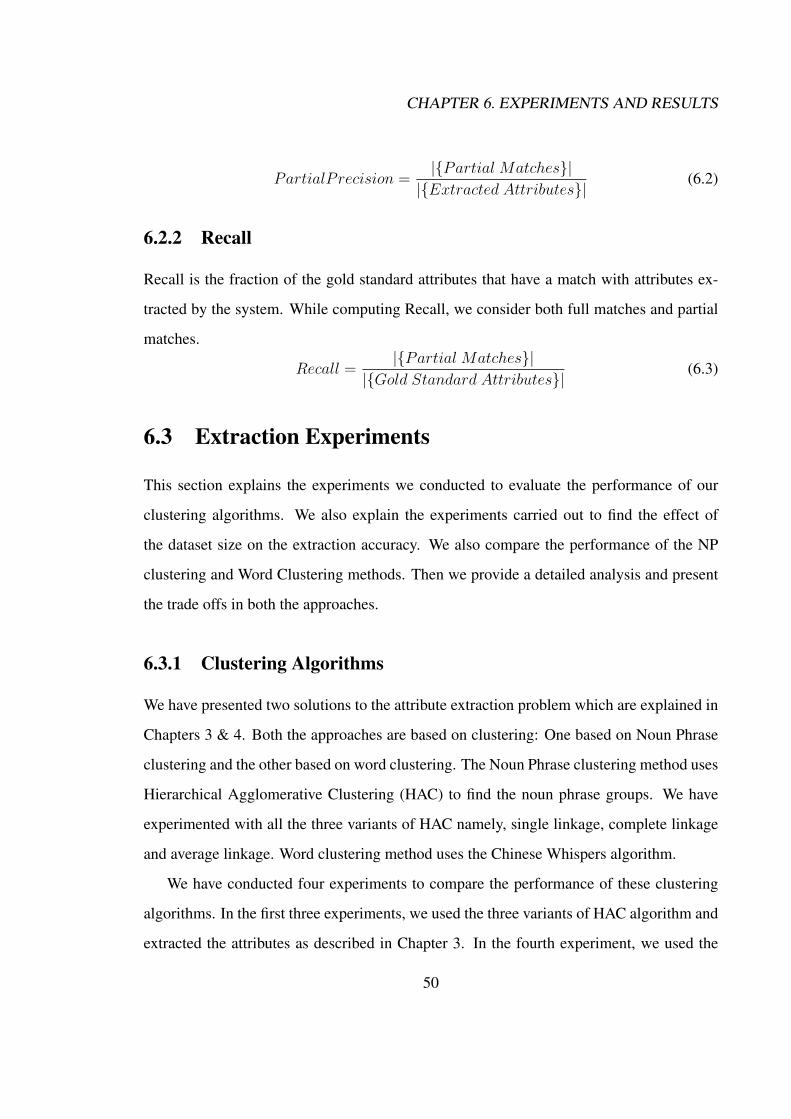
6.2.1 Precision . . . . . . . . . . . . . . . . . . . . . . . . . . . . . . . 496.2.2 Recall . . . . . . . . . . . . . . . . . . . . . . . . . . . . . . . . . 50
6.3 Extraction Experiments . . . . . . . . . . . . . . . . . . . . . . . . . . . . 506.3.1 Clustering Algorithms . . . . . . . . . . . . . . . . . . . . . . . . 506.3.2 Dataset Size . . . . . . . . . . . . . . . . . . . . . . . . . . . . . . 526.3.3 Baseline . . . . . . . . . . . . . . . . . . . . . . . . . . . . . . . . 536.3.4 Noun Phrase Clustering vs Word Clustering . . . . . . . . . . . . . 53
6.4 Ranking Experiments . . . . . . . . . . . . . . . . . . . . . . . . . . . . . 586.4.1 User Study . . . . . . . . . . . . . . . . . . . . . . . . . . . . . . 586.4.2 Ranking . . . . . . . . . . . . . . . . . . . . . . . . . . . . . . . . 616.4.3 Comparison of Ranking Features . . . . . . . . . . . . . . . . . . . 62
6.5 Summary . . . . . . . . . . . . . . . . . . . . . . . . . . . . . . . . . . . 63
7 Conclusions 647.1 Contributions . . . . . . . . . . . . . . . . . . . . . . . . . . . . . . . . . 647.2 Future Work . . . . . . . . . . . . . . . . . . . . . . . . . . . . . . . . . . 66
Bibliography 69
ix
Page 10
List of Tables
3.1 Sample Noun Phrase Clusters for Product Class: Acoustic Guitar . . . . . . 28
4.1 Sample Word Clusters for Product Class: Acoustic Guitar . . . . . . . . . . 35
5.1 Comparative Summary of iPods . . . . . . . . . . . . . . . . . . . . . . . 395.2 Comparative Summary of Acoustic Guitars . . . . . . . . . . . . . . . . . 45
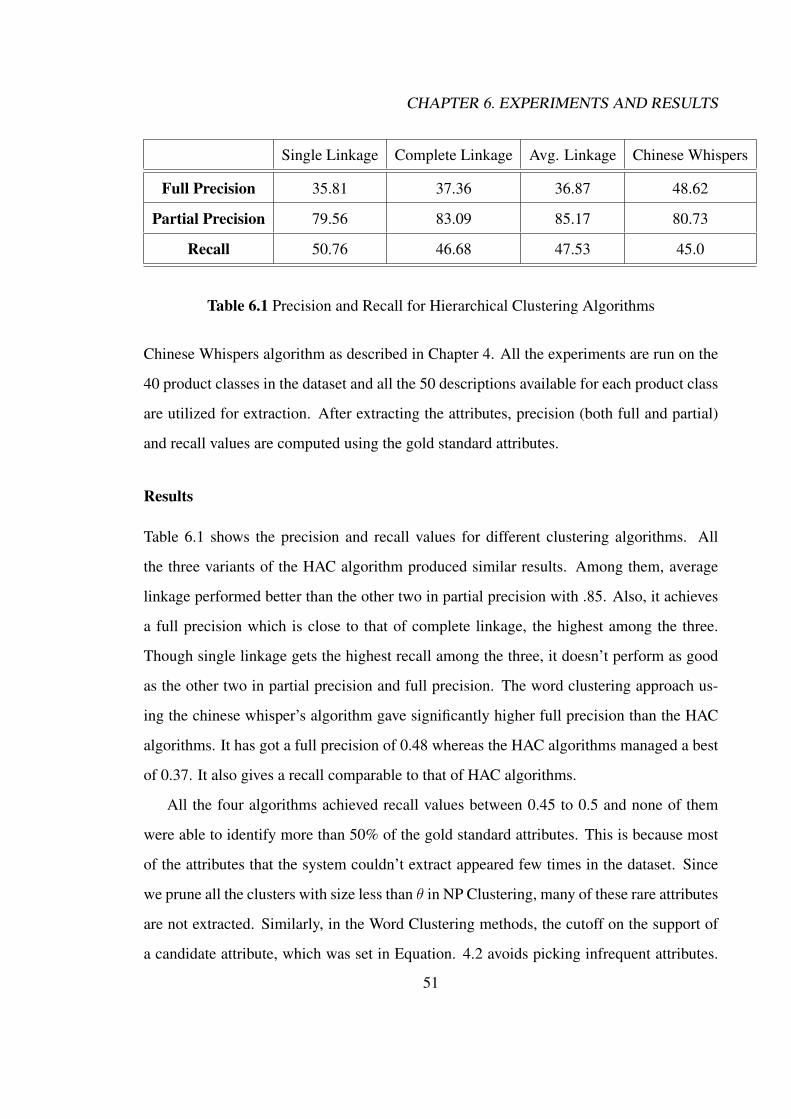
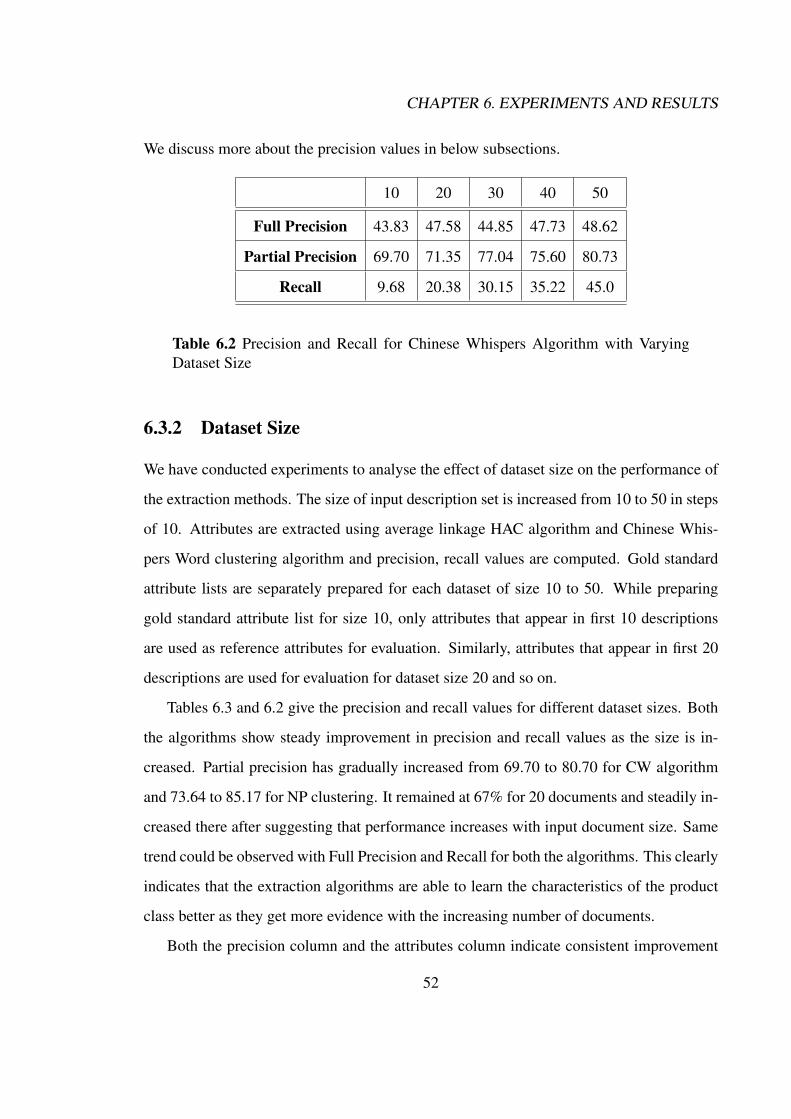
6.1 Precision and Recall for Hierarchical Clustering Algorithms . . . . . . . . 516.2 Precision and Recall for Chinese Whispers Algorithm with Varying Dataset
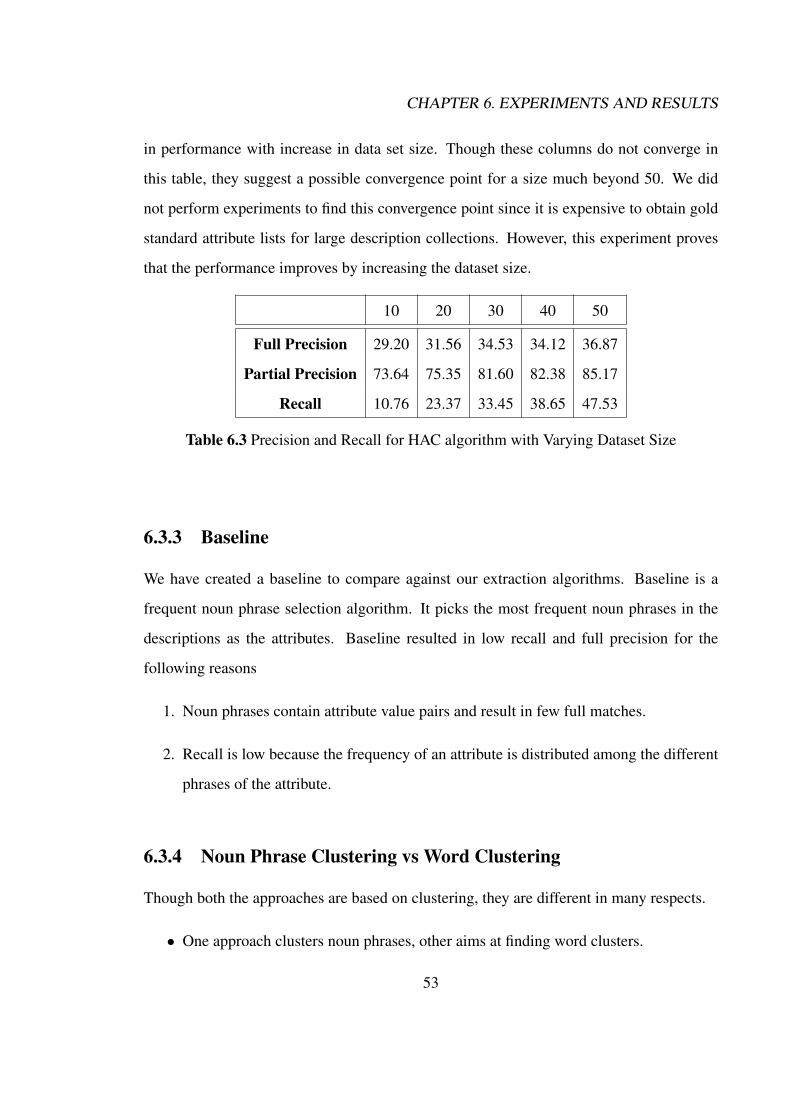
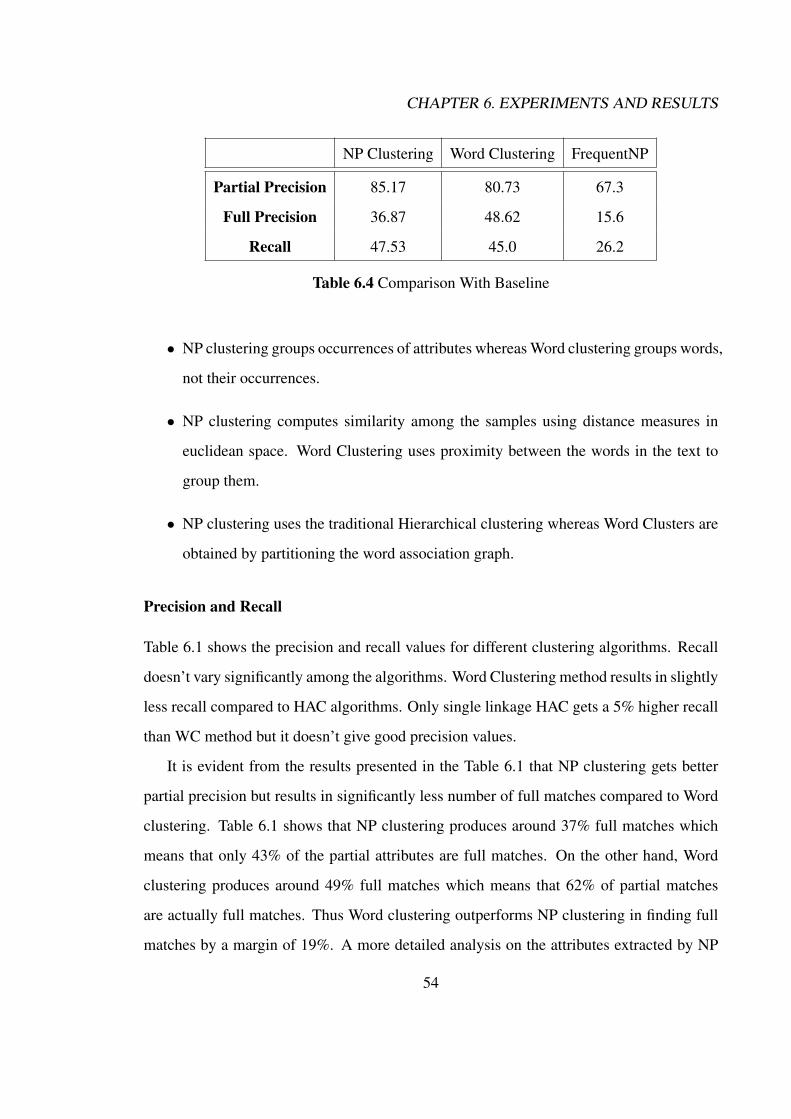
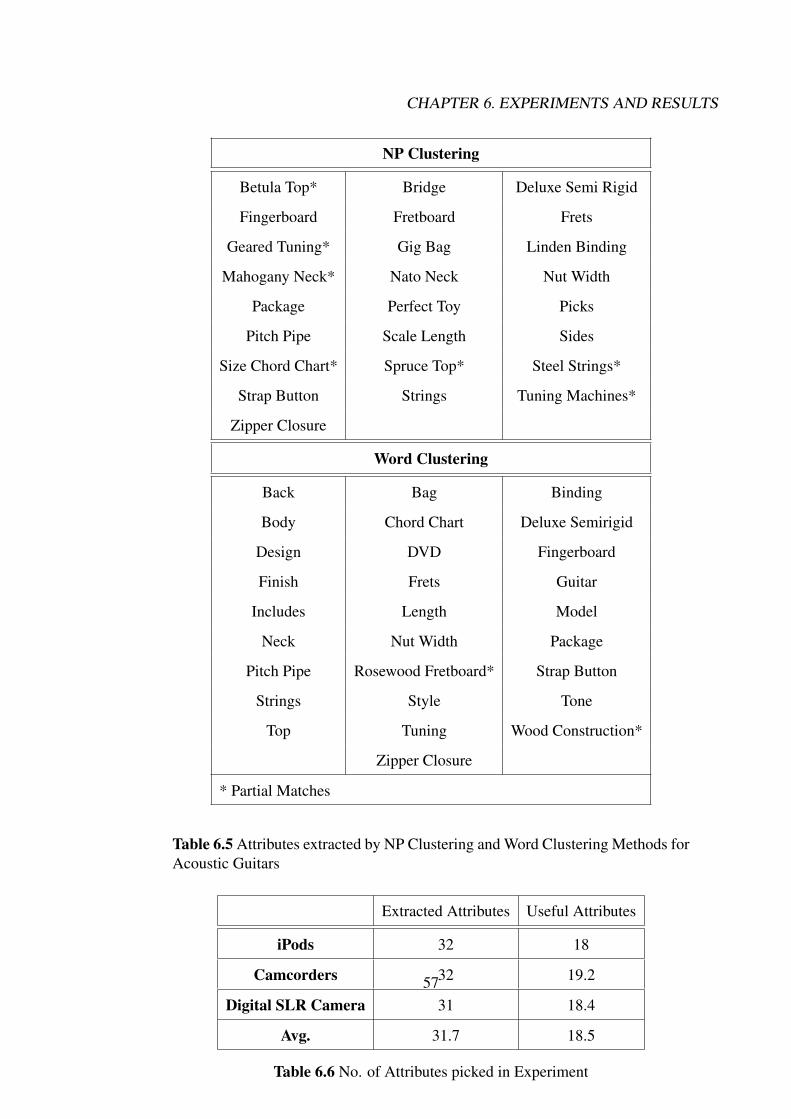
Size . . . . . . . . . . . . . . . . . . . . . . . . . . . . . . . . . . . . . . 526.3 Precision and Recall for HAC algorithm with Varying Dataset Size . . . . . 536.4 Comparison With Baseline . . . . . . . . . . . . . . . . . . . . . . . . . . 546.5 Attributes extracted by NP Clustering and Word Clustering Methods for
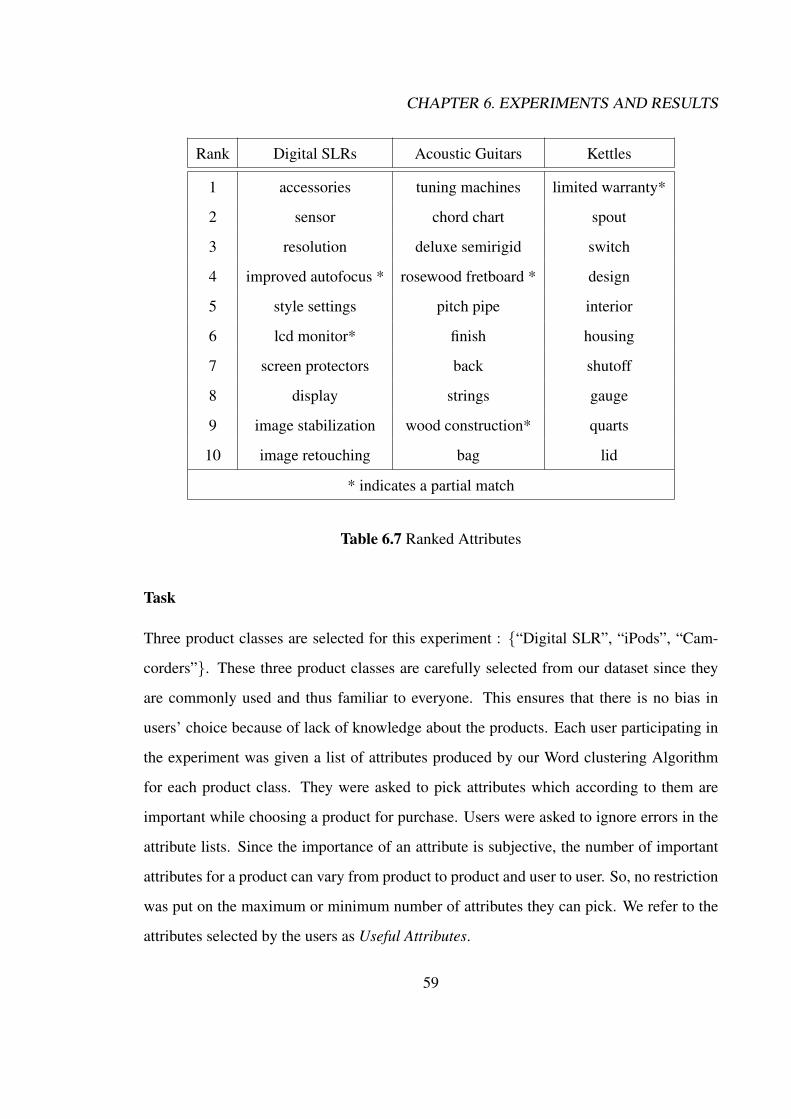
Acoustic Guitars . . . . . . . . . . . . . . . . . . . . . . . . . . . . . . . 576.6 No. of Attributes picked in Experiment . . . . . . . . . . . . . . . . . . . . 576.7 Ranked Attributes . . . . . . . . . . . . . . . . . . . . . . . . . . . . . . . 59
x
Page 11
List of Figures
3.1 Sample iPod description1 . . . . . . . . . . . . . . . . . . . . . . . . . . . 233.2 Sample iPod description2 . . . . . . . . . . . . . . . . . . . . . . . . . . . 233.3 Sample iPod description3 . . . . . . . . . . . . . . . . . . . . . . . . . . . 23
4.1 Number of Clusters with Varying Iterations . . . . . . . . . . . . . . . . . 344.2 Sample Sub-graphs . . . . . . . . . . . . . . . . . . . . . . . . . . . . . . 36
6.1 Complementary Cumulative Distribution of Useful Attributes in Relationto Number of User Selections . . . . . . . . . . . . . . . . . . . . . . . . . 60
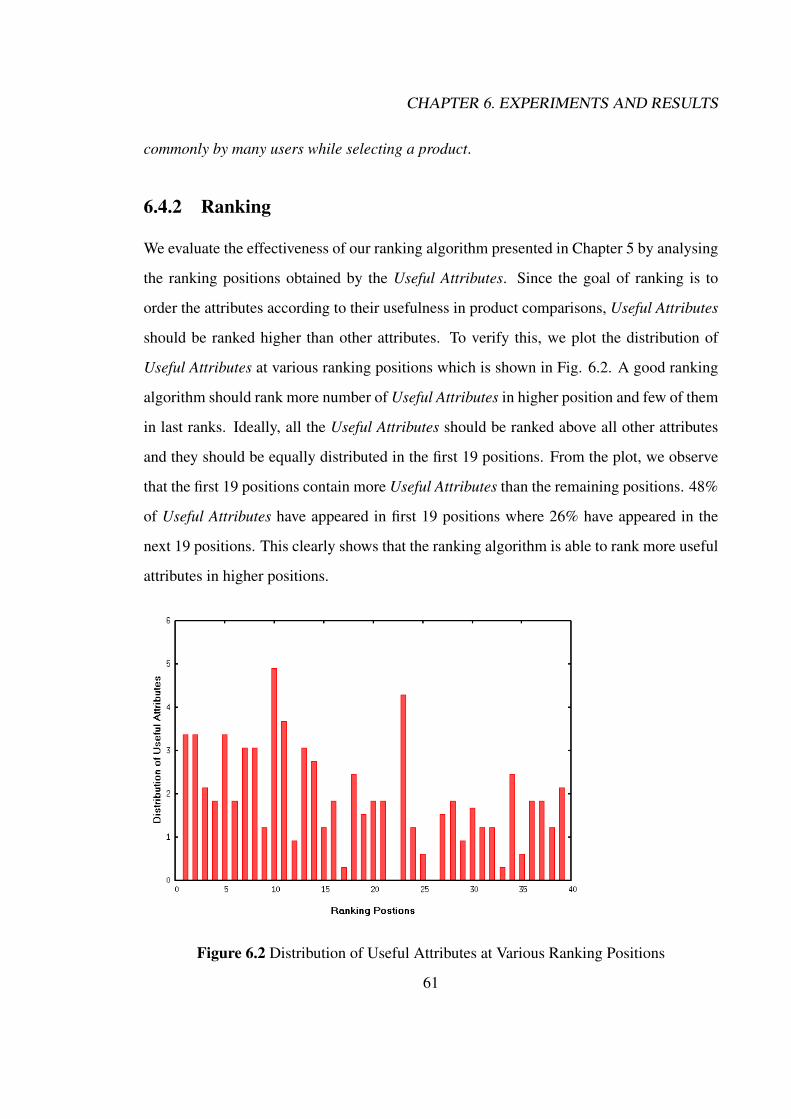
6.2 Distribution of Useful Attributes at Various Ranking Positions . . . . . . . 616.3 Distribution of Useful Attributes at various Ranking positions for Different
Ranking Features . . . . . . . . . . . . . . . . . . . . . . . . . . . . . . . 62
xi
Page 12
Chapter 1
Introduction
World Wide Web has emerged as a great source of knowledge accumulating lot of new
information each day. With the development in information and communication infrastruc-
ture, more and more users across the globe are able to access the web. Internet, with 1.5
billion users now, has seen a 3 fold increase in its user base during 2000-20081. This rapid
increase in Internet usage has given raise to a wide variety of web applications for both en-
terprises and common man. Millions of users access Internet applications such as e-mail,
instant messaging, e-commerce portals, online banking, online ticket booking systems etc
for their day to day activities.
With this advent of world wide web, e-commerce portals have become the favorite
means of purchase for consumers and numerous shopping sites were launched. Websites
like Amazon2, eBay3 witness millions of transactions everyday on a wide range of prod-
ucts. New brands and products that are coming up burden the consumers with too much
information. In order to get relevant information on a product of his/her interest, a con-
sumer has to go through all the text available on that product which is a tedious and time
consuming task. In this thesis, we study the problem of extracting relevant information for
1Statistics obtained from www.internetworldstats.com2www.amazon.com3www.ebay.com
1
Page 13
CHAPTER 1. INTRODUCTION
consumers from the textual data available in e-commerce portals. We propose and evaluate
information extraction techniques to solve the problem.
In the following sections of this chapter, we introduce the information extraction prob-
lem and information extraction in the context of e-commerce. Section 1.1 discusses the
information extraction problem in detail. Section 1.2 explains the information extraction
problem in the context of e-commerce. Section 1.3 explains the product attribute extraction
problem. Section 1.4 defines the problem statement of this thesis. The contributions of this
thesis are briefly explained in Section 1.5. We conclude the chapter with the organization
of this thesis in Section 1.6
1.1 Information Extraction
Information Extraction(IE) refers to the process of locating relevant information from nat-
ural language text to serve a pre-defined information need. [49] define IE as the task of
filling template information from previously unseen text which belongs to a pre-defined
domain. Its goal is to automatically extract structured information such as entities, rela-
tionships between entities, and attributes describing entities from natural language text.
This information is usually stored automatically into a database, which enables rich form
of queries on the text than possible with keyword search alone.
1.1.1 Applications
Information extraction is useful in a diverse set of applications ranging from enterprise
applications , personal applications to web applications. Some of the early information ex-
traction tasks include extraction of named entities and event information from news articles.
Competitions like Message Understanding Conference (MUC) [65, 23, 12] and Automatic
Content Extraction (ACE) [44] are based on the extraction of structured entities like people
and company names, and relations such as “has-acquired” between them. Other popular
tasks are: tracking disease outbreaks [22], and terrorist events from news sources. This has2
Page 14
CHAPTER 1. INTRODUCTION
resulted in various other research works [21, 69] like extraction of named entities and their
relationship from news articles.
Later, the advent of Internet and other information rich sources like Wikipedia has
resulted in diverse set of IE applications. Effective Techniques are developed for extraction
that could scale to the diversity and the size of web which include Open domain Question
answering [36, 45, 25, 33] and open domain fact extraction [9, 50, 18, 73]. With more
than a million articles, wikipedia has become a rich source of knowledge. The structure of
wikipedia provides an easy way to extract information which gave rise to many works on
information extraction from wikipedia [64, 77].
1.1.2 Types of Sources
IE systems can be grouped based on the type of text they process: Structured, Semi-
Structured and Unstructured.
Structured: Structured data is primarily relational data stored in databases. Relational
database stores information about the entities, their attributes and the relationships among
them in a formal structure. It gives meaning to the stored data by using the structure. This
makes extraction of relevant information from databases an easy task.
Semi-structured: It is a form of structured data that does not conform with the formal
structure of tables and data models associated with databases but contains tags or other
markers to separate semantic elements and hierarchies of records and fields within the
text. Examples are XML coded pages or highly structured HTML pages, advertisements in
newspapers and job postings.
Unstructured: Unstructured text is a free flow of natural languages text containing a
set of sentences. It doesn’t provide any semantic information about the text. Examples are
newspaper articles.
One of the important factors that influence the accuracy of an information extraction
system is the format and style of source text. Information Extraction from unstructured
3
Page 15
CHAPTER 1. INTRODUCTION
text is a difficult task and poses lots of challenges. Structured and Semi-structured text
provide semantic information about the text they represent and thus are relatively easy to
process compared to unstructured text.
1.1.3 Granularity
The granularity of a text may vary depending on the type of source. The text could be small
snippets containing unstructured records like addresses, classified ads [2, 6] or sentences
extracted from a natural language paragraph [67, 23, 7]. In the case of unstructured records,
the data can be treated as a set of structured fields concatenated together, possibly with a
limited reordering of the fields. Thus, each word is a part of such structured field and during
extraction we just need to segment the text at the entity boundaries. In sentences there are
many words that do not form part of any entity of interest.
Some extraction tasks require multiple sentences or an entire document for extractions.
Popular examples include event extraction from news articles [23], extraction of part num-
ber and problem description from emails in help centers, structured information extraction
from text resumes, extraction of title, location and timing of a talk from talk announcements
[60] and the extraction of paper headers and citations from a scientific publication [48].
1.1.4 Extraction Methods
The extraction of structured information from noisy, unstructured text poses lots of chal-
lenges, which attracted attention of different research communities including Natural Lan-
guage Processing, Machine Learning, Information Retrieval etc. Numerous information
extraction techniques have been designed over the last two decades to cater to the require-
ments of various applications. These techniques can be primarily categorized into two
groups: (1) Rule-based Approach and (2) Machine Learning.
Rule-Based Approach relies on a system expert, who is familiar with both the applica-
tion domain and the required function of the IE system. Early information extraction sys-
4
Page 16
CHAPTER 1. INTRODUCTION
tems were all rule-based [26, 16, 41, 57] and they continue to be researched and improved
[14, 30, 43] to meet the challenges of real world extraction systems. Rules are particu-
larly useful when the task is controlled and clear like the extraction of phone numbers and
zip codes from emails, or when creating wrappers for machine generated web-pages. Also,
rule-based systems are faster and more easily amenable to optimizations [56, 61]. Rules are
typically hand-coded by a domain expert. However they can be automatically learned from
training examples created from unstructured text. Several algorithms have been studied for
inducing rules from labeled examples of which bottom-up [10, 11] and top-down [62, 53]
rule formulation are well known. In bottom-up approach, a specific rule is generalized, and
in top-down approach, a general rule is specialized.
Machine learning methods formulate the information extraction problem as a labeling
task where the unstructured text is segmented and the individual parts are labeled. These
techniques can be broadly classified into two classes: generative models based on Hidden
Markov Models [2, 60] and conditional models based on maximum entropy [42, 55, 37].
Both were superseded by global conditional models, popularly called Conditional Random
Fields [34]. Both Rule-based methods and statistical methods are being used in parallel
depending on the nature of the extraction application. Few other hybrid models [13, 19] are
also proposed that attempt to benefit from both machine learning and rule-based methods.
1.2 Product Information Extraction
The rapid expansion of e-commerce resulted in sharp rise in the number of products sold
on the web along with the number of people buying on the web. Lot of textual data is being
generated in this process to assist customers with necessary information to help them in
selecting the correct product among the many available. Product Information Extraction
(PIE) refers to application of information extraction and text mining techniques to extract
relevant information about products. The text useful for PIE comes from variety of sources
and available in different types: product manufacturers provide descriptions, consumers
5
Page 17
CHAPTER 1. INTRODUCTION
write reviews, online merchants prepare feature tables etc.
1.2.1 Product Data
Most of the data on products is unstructured text, which we have classified into the follow-
ing categories based on the nature of the text,
Customer Reviews: In order to enhance customer satisfaction and their shopping expe-
riences, it has become a common practice for online merchants to enable their cus-
tomers to review or to express opinions on the products that they buy. With more and
more common users becoming comfortable with the Internet, an increasing num-
ber of people are writing reviews. As a consequence, the number of reviews that a
product receives grows rapidly. Some products get hundreds of reviews at popular
merchant sites.
Product Descriptions: Product manufacturers usually provide raw text descriptions or
technical specifications along with the product to help the customers understand the
functionality and usability of products. These documents, referred to as Product De-
scriptions, contain unstructured text which explains the product features in greater
detail.
Structured Tables: Another source of information on products are structured tables. Re-
view websites and price comparison websites like epinions4, google product search
provide tables along with product ratings and reviews. These tables list the features of
a product with their corresponding values to help the customers get a quick overview
on the product.
4www.epinions.com
6
Page 18
CHAPTER 1. INTRODUCTION
1.2.2 Research in Product Information Extraction
Customer Reviews are a valuable source of information as they are written by users who
had hands on experience on the product. Reviews provide critical opinions and comments
on products and their respective features. It is a common practice for a new customer
willing to buy a product to read the available reviews on that product. However, there
could be large number of reviews for a single product and it is very painful for a customer
to go through all of them. Also, a customer may be interested in a particular feature and
looking for opinions on that feature. The remaining text in the reviews becomes irrelevant
for him/her.
All the above issues encouraged research on customer reviews and many interesting text
mining applications were developed under the name “Sentiment Analysis”. Some of the
interesting applications include Polarity Detection, Subjectivity/Objectivity Identification,
Feature-based Opinion Mining etc. Polarity detection [47, 71] is the classification of given
opinion text as positive or negative or neutral. Subjectivity/Objectivity Identification [46]
refers to classification of given text, usually a sentence, as objective or subjective. Feature-
based sentiment analysis [27] refers to the study of determining the opinions or sentiments
expressed on different features of entities, e.g., a cell phone or a digital camera. In simple
terms, a feature or attribute is a property or a component of a product, e.g., the screen of a
cell phone, or the picture quality of a camera. More details on the techniques used in the
above mentioned applications are discussed in Chapter 2
Product Descriptions are the most primitive form of information available on a product
as they are provided by manufacturer. Thus product descriptions are likely to be available
for most products where as reviews and tables are written for selected popular products.
One problem that has been recently studied[20] is the automatic extraction of attributes
and values from product descriptions. The goal of the task is to automatically generate
structured tables from text descriptions.
Tables offer a simple, structured layout for presenting attributes and values of a product.
7
Page 19
CHAPTER 1. INTRODUCTION
Many online stores and review websites provide product attribute information in tables. If
the product attribute information is extracted from multiple web sites, another desirable
task is that the product attributes can be automatically normalized[75] and preferably the
semantic meaning of normalized attributes can be obtained. This can improve the indexing
of product Web pages, and support intelligent tasks such as attribute search or product
matching.
In this thesis, we study unsupervised techniques to extract attributes from product de-
scriptions. Also, we define a novel form of summaries referred as Comparative Summaries
for products which provide attributes and values of different products together in a compact
form.
1.3 Product Attribute Extraction
Every product has a set of attributes which best describe its characteristics or functionality.
An attribute could be a tangible or intangible property of that product. Also each attribute
is associated with a value. Values could be binary or discrete from a given set or numeric
from a range. For instance, FM-Radio is a binary valued attribute with just yes or no value
whereas color has a discrete value from the set of colors and weight is discrete valued with
a numeric value. To avoid confusion, we use the phrase product class to refer to a product
type like Cell Phone and product to refer to individual models such as Nokia N72 through
out this thesis.
We define Product Attribute Extraction (PAE) as the task of automatically extracting
attribute information of a product from its text descriptions. By attribute information we
mean attributes and corresponding values of products.
An online shopper willing to buy a product has to go through its description in the
website to know its features. Often there are many varieties and it is painful for a consumer
to manually read all the descriptions to select a product. Manually preparing Attribute lists
is a difficult and time consuming task for e-commerce websites and search engines. Also
8
Page 20
CHAPTER 1. INTRODUCTION
it is difficult to update the manual lists with the new products and new attributes that come
up everyday. We therefore propose that an automatic PAE system is an ideal information
access tool for users to get quick overview. For example, a future 4G iPhone may have a
new feature that is not available in the current 3G iPhones. An automatic PAE system can
easily capture such features making the comparative summaries dynamically generated
at the time of users request. The traditional way of doing this is by manually keying in
attribute values into structured databases, which are very difficult to manage and keep up
with changing attributes.
In this thesis, we deal with two specific problems of PAE: Attribute Extraction and
Comparative Summary Generation.
Attribute Extraction: Given a set of text descriptions of multiple products which belong
to same product class, the task is to identify the list of attributes specific to the product
class. e.g. for a set of Digital Camera descriptions, the output consists of attributes
like “zoom”, “auto focus”, “resolution” etc.
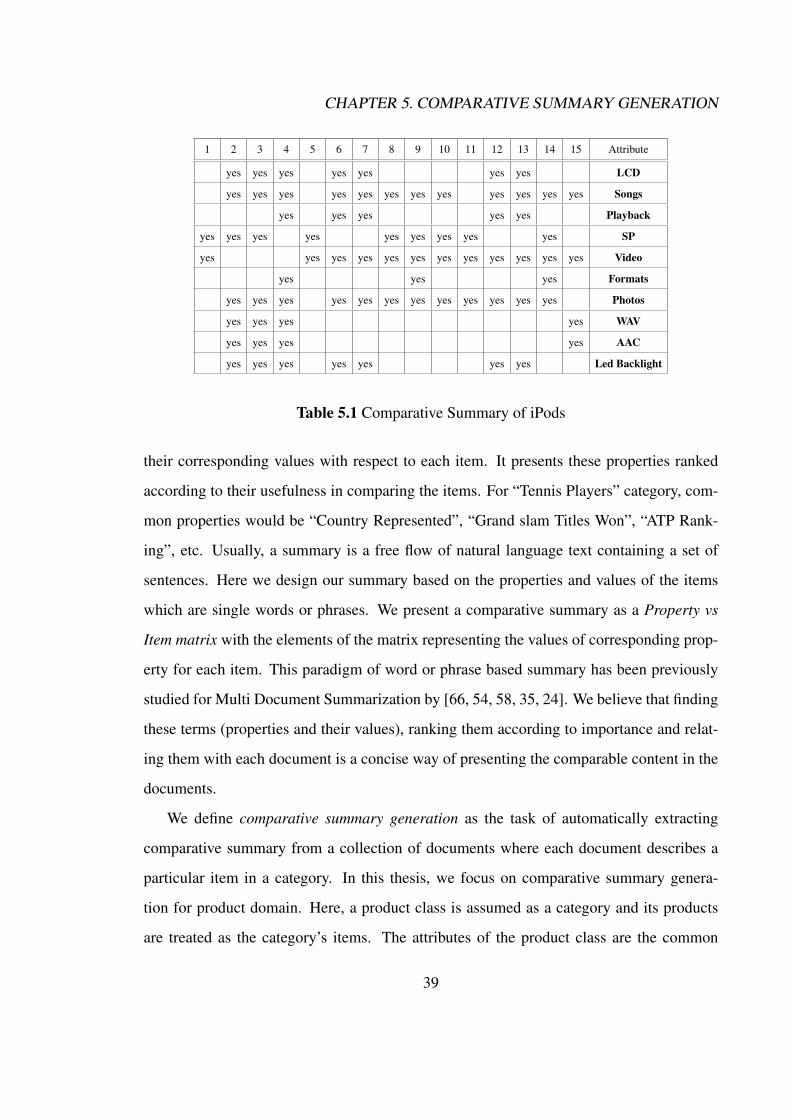
Comparative Summary Generation: We define a novel form of summaries referred to
as comparative summaries which provides a comparative study of multiple items be-
longing to same category. The purpose of a comparative summary is to provide a
quick, concise comparison of multiple items of a category. An assumption in such
a task is that, the documents in the collection should talk about comparable items
such as entities or events. In our case, these entities are products belonging to same
product class and the input documents are text descriptions of these products. A
comparative summary provides the attributes common to these products and their
corresponding values with respect to each product. It presents the attributes in de-
creasing order of importance in product comparison. These attributes and values of
the products are presented in Attribute vs Product matrix with the elements of the
matrix representing the values of corresponding attribute for each product. Compar-
ative summary generation task deals with extraction of comparative summaries for
9
Page 21
CHAPTER 1. INTRODUCTION
a product class from its descriptions. This task involves two important steps: (1)
Attribute/Value Extraction from descriptions (described in the above task) and (2)
Attribute Ranking based on the importance of these attributes in product comparison.
We describe this task in more detail in Chapter 5.
1.4 Problem Statement
Information extraction from product descriptions is not a well-studied problem. Though
there have been many research works on information extraction and sentiment analysis
from customer reviews, few attempts were made on information extraction from product
descriptions. Few semi-supervised approaches were proposed recently.
Our goal in this thesis is to study the problem of Product Attribute Extraction and
develop efficient and scalable extraction methods. These methods can be applied to any
kind of products and thus are domain independent. In essence, this work provides solutions
for easily obtaining attribute information about products without manual labour. Our thesis
problem can be divided into the following steps.
• Studying the problem of Product Information Extraction.
• Developing methods for attribute extraction and attribute ranking.
• Defining comparative summaries and coming up with solutions for generating com-
parative summaries for products.
• Evaluating our methods using existing evaluation measures.
1.5 Contributions
The contributions of thesis towards the area of product information extraction and compar-
ative text mining are given below:
10
Page 22
CHAPTER 1. INTRODUCTION
• Development of novel unsupervised algorithms to the product attribute extraction
problem. Our algorithms extract attributes specific to a product class from the text
descriptions of different varieties.
• Methods were proposed for ranking the attributes of a product class according to their
importance in providing comparisons among different products. We have defined the
notion of Ranking for Comparison and computed a ranking function.
• Design of a novel form of summaries referred to as Comparative Summaries which
provides comparative study of multiple items belonging to same category. We have
defined a phrase based form of summary using the attribute-value paradigm.
• Present techniques to compute Comparative Summaries for products from text de-
scriptions using the attribute extraction and ranking methods.
1.6 Organization of Thesis
The main focus of this thesis is the development of unsupervised techniques for product
attribute extraction and attribute ranking. This chapter introduces the area of information
extraction and its relevant problems in the context of products. We have described the
specific sub-problems of product information extraction which are dealt in this thesis. We
have also provided an overview of the various solutions proposed which are explained in
detail in the subsequent chapters.
Chapter 2 presents some of the related literature in the area. We have identified four
problems which are relevant to the problems studied in this thesis. The chapter explains the
related work done in these problems in four sections. Each section explains a problem and
surveys the various solutions proposed. We have also compared the different works and
tried to understand the advantages and disadvantages of the solutions.
Chapters 3 explains a noun phrase clustering approach and word clustering approach.
11
Page 23
CHAPTER 1. INTRODUCTION
The chapter begins with explaining the various challenges involved in the attribute extrac-
tion task and then proceeds with the details of the extraction methods.
Chapter 4 explains world clustering method for the attribute extraction which over-
comes the shortcomings of the noun phrase clustering method.
Chapter 5 introduces comparative summaries and presents a solution for generation
of comparative summaries for products. The chapter begins with the introduction of com-
parative summaries and then describes the steps involved in the generation of comparative
summaries for products.
Chapter 6 explains the experiments conducted in detail. The chapter begins with the
details on the datasets used in the experiments and then describes the evaluation measures.
The chapter explains each experiment in detail and presents an analysis on the results ob-
tained. Experiments are conducted to evaluate the techniques presented in Chapters 3 and
5.
Chapter 7 concludes this thesis by explaining the work done and explaining the con-
tributions of this thesis. This chapter also provides an outline for the future work.
12
Page 24
Chapter 2
Related Work
In this chapter, we survey the literature related to the problems addressed in this thesis:
Product Attribute Extraction and Comparative Summarization. There are very few studies
on attribute extraction from product descriptions and no prior work on comparative sum-
marization. So we present previous studies which are broadly related to attribute extraction
and comparative summarization. We have identified four such problems,
1. Key Phrase Extraction
2. Customer Review Mining
3. Product Attribute Extraction
4. Comparative Information Extraction
The following sections in this chapter explain the previous studies on the above four
problems. We give a brief introduction to each problem and survey the different approaches
that were previously used to solve the problem.
13
Page 25
CHAPTER 2. RELATED WORK
2.1 Key Phrase Extraction
Key Phrase Extraction aims to identify the most relevant words or phrases in a set of docu-
ments. It is the process of identifying a phrase from the input documents and extracting the
phrase as a keyphrase. Keyphrases provide a high-level overview of a document’s content
and helps the readers to decide whether the document is relevant to them or not. There is
an increase in the amount of information that is available to both lay users and professional
users such as journalists, analysts. Users are required to deal with large collections of doc-
uments from unfamiliar domains. Keyphrases provide a powerful means for sifting through
large numbers of documents and get an understanding of the topics and events which are
particular to a domain. This has called for methods to condense information and make the
most important content stand out. Keyword extraction is one of the first and prominent
methods that which were later followed by automatic text summarization etc.
Keyphrases are usually selected manually. Authors of technical articles provide key-
words to documents so that the reader gets a quick, concise overview on the topic being
discussed. Professional indexers often choose phrases from a predefined controlled vocab-
ulary relevant to the domain at hand. However, only a small fraction of documents come
with keyphrases, and attaching them manually is a very laborious task that requires knowl-
edge of the subject matter. Thus automatic keyword extraction techniques provide great
benefits and have become popular.
The problem of Product attribute extraction is closely related to Key phrase extraction.
Both the tasks involve extraction of phrases from a single or set of documents. However,
product attribute extraction is a more specific problem where the input documents describe
products. It has an additional constraint that the phrases extracted should define a feature
or property of the product being described in the input documents. This makes product
attribute extraction a special and difficult problem.
There has been lot of work on automatic keyphrase extraction and several methods were
proposed. Some of the works treated keyphrase extraction as a classification problem and
14
Page 26
CHAPTER 2. RELATED WORK
presented supervised learning approaches. In these approaches, documents are treated as
set of phrases and every phrase encountered in the text is classified as positive or negative
- distinguishing keyphrases from the other phrases. [70] presents the GenEx keyphrase ex-
traction system which is based on a set of parametrized heuristic rules that are fine-tuned
using a genetic algorithm. Kea[74] uses naive bayes learning for training the keyphrases
which is shown to produce significant results when both the training and testing data are
limited to same domain. [63] presented KPSpotter, a web based keyphrase extraction sys-
tem capable of processing various types of data like XML, HTML or unstructured text.
The system uses information gain measure and natural language processing techniques to
extract the relevant phrases. All the above mentioned methods use statistical features like
frequency to learn the characteristics of keyphrases. [28] showed that the performance
could be improved by using linguistic features like POS tags, NP Chunks along with sta-
tistical features.
Most of the unsupervised approaches to keyphrase extraction exploit the statistical in-
formation associated with the words in the documents to identify the keyphrases. [40]
proposed a keyword extraction algorithm for single document that doesn’t utilize any ref-
erence corpus. They compute the co-occurrence distribution of the terms with the most
frequent terms in the document and use the degree of bias in the distribution to estimate the
importance of the terms. [68] present a language modeling approach to extract keyphrases.
They construct multiple language models from the input documents and a reference corpus.
Pointwise KL-divergence between these language models is used to score the candidate
phrases from the input documents.
2.2 Customer Review Mining
Web contains a wealth of opinions about lot of products written by consumers in e-commerce
portals. Reviews are very important source of information for consumers who want to buy
a product. However, it is difficult for consumers to go through all the reviews available
15
Page 27
CHAPTER 2. RELATED WORK
for a product. This has resulted in the development of a new area of text mining called
“Customer Review Mining”(CRM). CRM focuses on automatically identifying opinions
on a product and its features from customer reviews.
Polarity detection deals with classification of opinion text as positive or negative. [47,
71] present various solutions for polarity detection from customer reviews which is a huge
resource for opinion content. [27, 51, 59] present techniques to extract product features
from customer reviews. Product feature extraction from descriptions pose different chal-
lenges. Numerous reviews are available for each product whereas product descriptions
are few in number and the text is sparse. [27] mine the frequently co-occurring words in
phrases to find the product features using association rule mining. [51] present techniques
that are based on frequently occurring patterns in reviews to extract product features from
customer reviews. Patterns of this kind are rare in product descriptions which make the
task challenging.
However feature extraction from consumer reviews is not exhaustive for the following
reasons: 1. Review mining methods primarily focuses on mining pinions and determining
polarity rates. Customers usually discuss only the important features and rarely mention
other less important features of the product. Thus feature extraction from customer reviews
is limited to only the important features. 2. Also, only a selected popular products get
enough consumer reviews for mining and lot of products do not have reviews. Thus product
attribute extraction from consumer reviews is possible only for those products which have
enough number of reviews.
2.3 Attribute Information Extraction
Attribute Information extraction from product descriptions is not a well studied problem
with only a few works that have come up recently. [20] proposed a method to extract
attributes and values of products from text descriptions. They extract attribute-value pairs
from large set of product descriptions that belong to a particular domain. They employ
16
Page 28
CHAPTER 2. RELATED WORK
a semi-supervised algorithm which identifies attributes and values in the sentences from
text descriptions of multiple products of a domain. In this thesis, we focus on unsupervised
methods for extracting attributes specific to a product. Moreover, our techniques can extract
attributes from small datasets containing less than 50 descriptions whereas their approach
requires relatively large dataset belonging to a domain.
2.3.1 Attribute Extraction from Web Pages
Retail websites and Online merchants often display attribute value information in prod-
uct tables as described in Section. 1.2.1. These websites come up with their own layouts
and templates for displaying product tables. This makes the identification of attributes and
values from product tables a difficult task. Wrapper learning methods[79] have been devel-
oped to extract information from web pages but these methods are supervised and require
manual work in obtaining the training data. Also, the learned wrapper could be used for
extraction only from the websites which were used for preparing the training samples. [80]
uses the layout of the Web page and employs an integrated approach of Hierarchical Con-
ditional Random Fields (HCRF) which can segment and label elements of web pages from
different websites. But it is supervised learning method and requires training examples for
each attribute in advance and thus not capable of discovering previously unseen attributes.
[76] and [75] propose semi-supervised and unsupervised learning methods respectively to
extract attributes accurately which are template-independent and can discover unseen at-
tributes.
2.3.2 Attribute Normalization
Another problem that is closely related to attribute information extraction is Attribute Nor-
malization. Attributes extracted from different sources are not normalized, and require
human effort to judge whether two fields refer to the same attribute. For example, one may
not know that the extracted text fragments “fireworks” and “portrait” refer to two different
17
Page 29
CHAPTER 2. RELATED WORK
attribute values of the same attribute “shooting mode” of digital camera. Attribute nor-
malization is defined as grouping attribute values with similar semantic meaning. It has
many useful applications such as storing attribute values of products into product database,
retrieving and matching of products, etc. [75] propose a framework for normalization of
attributes found in multiple websites. They designed a probabilistic graphical model that
can model page-independent content information and page-dependent layout information
of text fragments in web pages for simultaneously identifying attribute value pairs and
normalizing them.
2.4 Comparative Information Extraction
There were many works in the past which dealt with the problem of extracting compar-
ative information from text. By comparative information extraction, we mean extraction
of elements from text which compares two or more entities or concepts. As part of this
thesis, we have presented techniques for extraction of comparative information on products
which we refer to as “Comparative Summaries” as defined in Chapter 1. Previous works
on comparative information extraction can be classified into two categories: Extraction of
sentence level comparative information and Extraction of topic level comparisons.
2.4.1 Extraction of sentence level comparative information
There is a class of works focused on extraction of text which explicitly compares two or
more entities/concepts. [31] proposed a method for extraction of comparative sentences
from customer reviews which make subjective or objective comparisons between products.
They proposed a supervised learning approach based on pattern discovery to identify com-
parative sentences. There are few works that summarize the comparable content in a set
of related documents which again is a sentence extraction task. [38] describes a summa-
rization problem to identify similarities and dissimilarities in information content among a
set of related documents. Initially, they extract text units like phrases/words and identify18
Page 30
CHAPTER 2. RELATED WORK
relationships between them which are finally used to generate the summary. They align
related sentences across the documents and highlight important phrases and present them
as a summary. More recently, the idea of contrastive summarization [32] is proposed for
products. A pair of products are compared using their customer review collection and two
summaries are generated highlighting the differences between two products.
Our work is different from the above works in the following respects. All the above
discussed methods concentrated on extraction of sentences with comparable content. We
do not extract comparative sentences, but work at a more granular level. We identify and
extract attributes specific to a product class and relate them with various products of that
class in a comparative summary. Also, majority of the above works provide comparisons
on a pair of products whereas comparative summaries provide attribute level comparisons
on multiple products simultaneously. Another important difference is that the sentences
extracted by them can contain comparisons that can be subjective or objective in nature.
Comparisons drawn from comparative summaries are objective in nature as they focus on
differences in product attributes.
2.4.2 Extraction of topic level comparisons
Another class of works focus on extraction of more granular topics from a set of related doc-
uments. [17, 39] present a method for identifying corresponding topics or themes across
several corpora that are focused on related, but distinct, domains. [17] achieve this by
cross dataset clustering. Their method simultaneously clusters multiple datasets such that
each cluster includes elements from several datasets, capturing a common theme, which is
shared across the sets. [39] proposed an unsupervised algorithmic framework based on dis-
tributional data clustering for the task. [78] define Comparative Text Mining from a set of
comparable text collections as the task of discovering any latent common themes across all
collections as well as summarize the similarities and differences of these collections along
each common theme. Though these approaches extract common themes that are compa-
19
Page 31
CHAPTER 2. RELATED WORK
rable across sub corpora, the granularity of theme is vaguely defined and is application
specific. Also, they do not have the notion of explicit attributes or properties whereas the
granularity of the attributes in comparative summary is more precisely defined.
20
Page 32
Chapter 3
Attribute Extraction
This chapter presents solution to the attribute extraction problem. The goal is to extract the
attributes of a product class given a set of sample product descriptions where each input
description describes a product belonging to that class. In this chapter, we present an un-
supervised solution for the problem which doesn’t require any domain specific knowledge.
The chapter begins with a discussion on the challenges involved in the attribute extraction
task in Section 3.1. Section 3.2 explains the motivation behind our methods and Section
3.3 presents the actual method which we refer to as “Noun Phrase Clustering Method” in
detail.
3.1 Challenges
The attribute extraction task is not a trivial problem and has many challenges. Often, only
a small number of descriptions are available for a product class. Also, product descriptions
contain unstructured text. This poses interesting challenges and makes the task difficult. In
order to understand the complexity of the problem better, we first describe a sample product
description.
Each input description is a text document describing a product belonging to a product
class. Fig. 3.1, 3.2 and 3.3 show sample descriptions of three iPod models. A description
21
Page 33
CHAPTER 3. ATTRIBUTE EXTRACTION
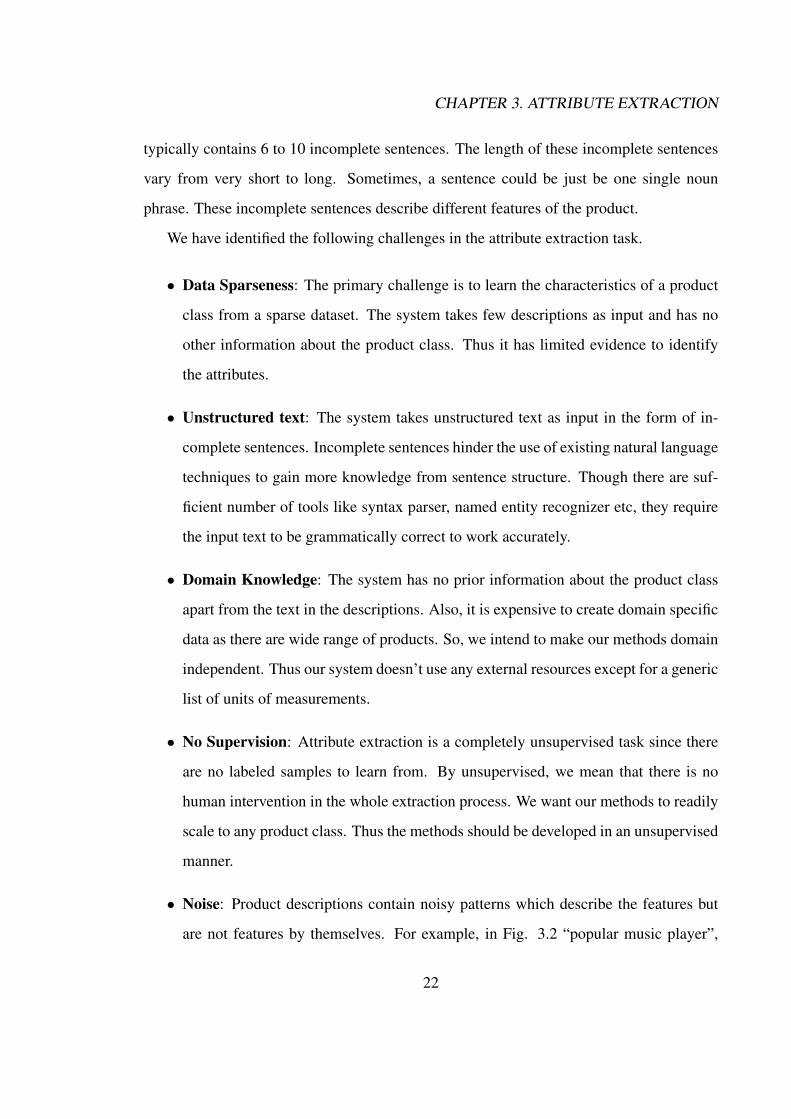
typically contains 6 to 10 incomplete sentences. The length of these incomplete sentences
vary from very short to long. Sometimes, a sentence could be just be one single noun
phrase. These incomplete sentences describe different features of the product.
We have identified the following challenges in the attribute extraction task.
• Data Sparseness: The primary challenge is to learn the characteristics of a product
class from a sparse dataset. The system takes few descriptions as input and has no
other information about the product class. Thus it has limited evidence to identify
the attributes.
• Unstructured text: The system takes unstructured text as input in the form of in-
complete sentences. Incomplete sentences hinder the use of existing natural language
techniques to gain more knowledge from sentence structure. Though there are suf-
ficient number of tools like syntax parser, named entity recognizer etc, they require
the input text to be grammatically correct to work accurately.
• Domain Knowledge: The system has no prior information about the product class
apart from the text in the descriptions. Also, it is expensive to create domain specific
data as there are wide range of products. So, we intend to make our methods domain
independent. Thus our system doesn’t use any external resources except for a generic
list of units of measurements.
• No Supervision: Attribute extraction is a completely unsupervised task since there
are no labeled samples to learn from. By unsupervised, we mean that there is no
human intervention in the whole extraction process. We want our methods to readily
scale to any product class. Thus the methods should be developed in an unsupervised
manner.
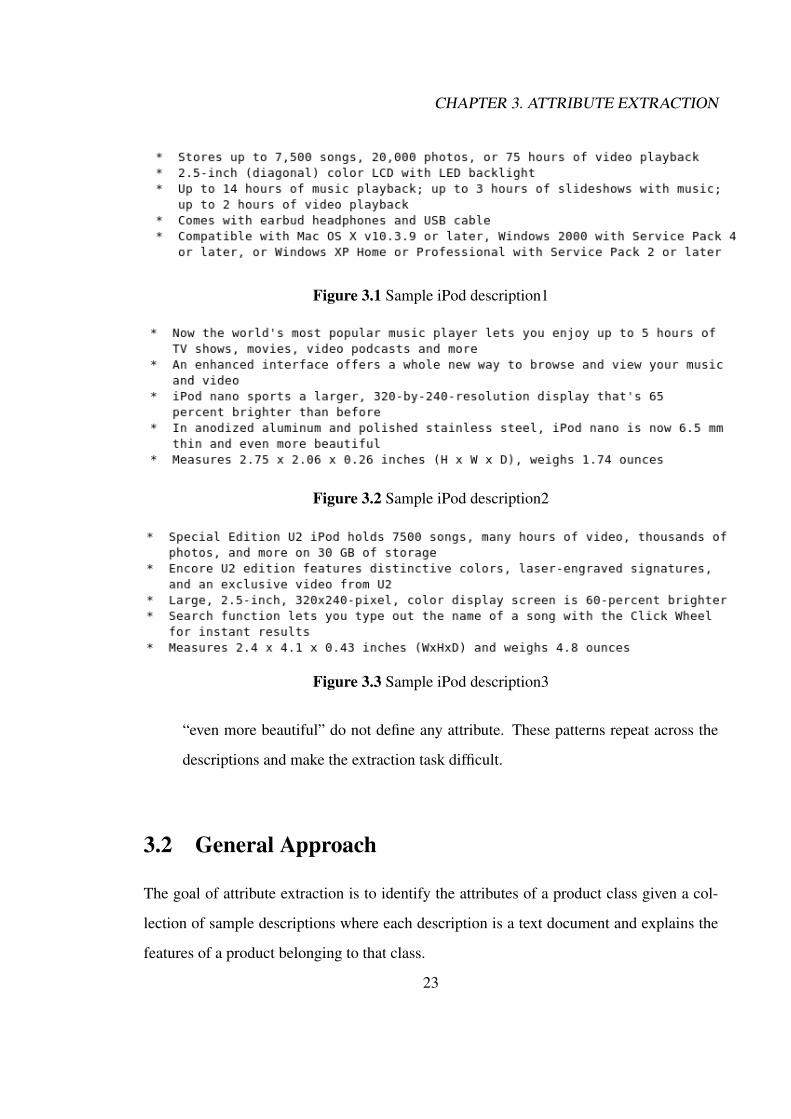
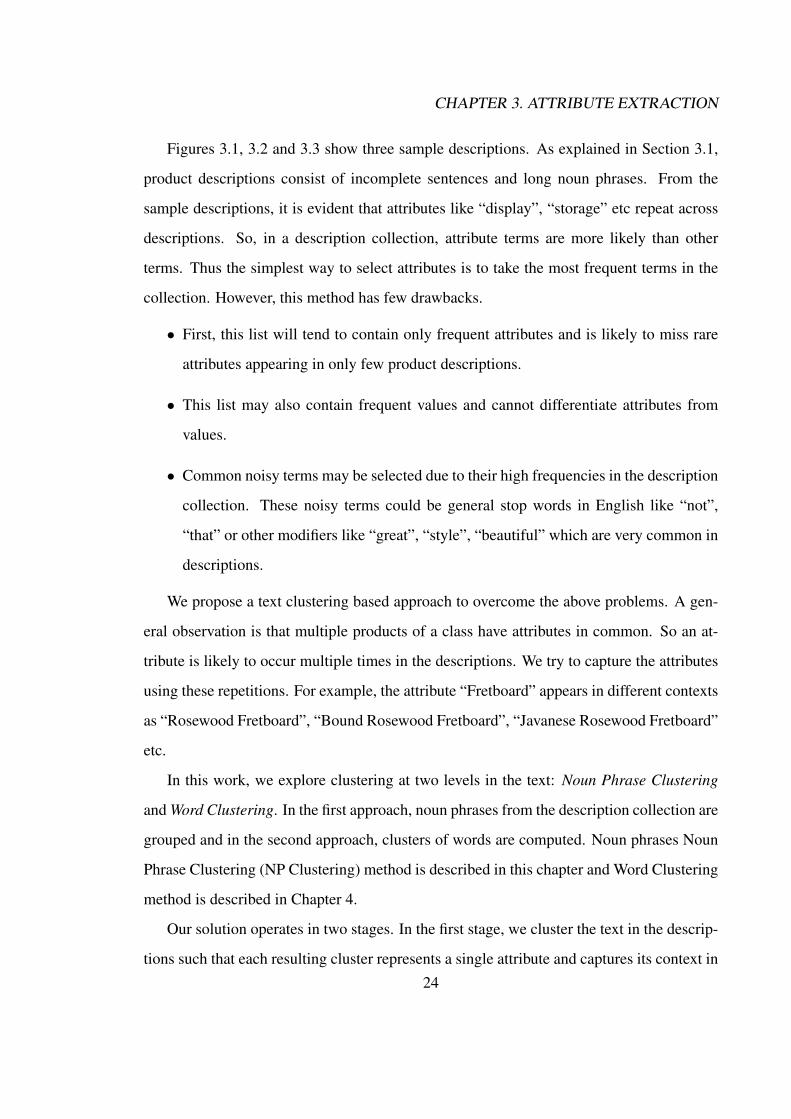
• Noise: Product descriptions contain noisy patterns which describe the features but
are not features by themselves. For example, in Fig. 3.2 “popular music player”,
22
Page 34
CHAPTER 3. ATTRIBUTE EXTRACTION
Figure 3.1 Sample iPod description1
Figure 3.2 Sample iPod description2
Figure 3.3 Sample iPod description3
“even more beautiful” do not define any attribute. These patterns repeat across the
descriptions and make the extraction task difficult.
3.2 General Approach
The goal of attribute extraction is to identify the attributes of a product class given a col-
lection of sample descriptions where each description is a text document and explains the
features of a product belonging to that class.
23
Page 35
CHAPTER 3. ATTRIBUTE EXTRACTION
Figures 3.1, 3.2 and 3.3 show three sample descriptions. As explained in Section 3.1,
product descriptions consist of incomplete sentences and long noun phrases. From the
sample descriptions, it is evident that attributes like “display”, “storage” etc repeat across
descriptions. So, in a description collection, attribute terms are more likely than other
terms. Thus the simplest way to select attributes is to take the most frequent terms in the
collection. However, this method has few drawbacks.
• First, this list will tend to contain only frequent attributes and is likely to miss rare
attributes appearing in only few product descriptions.
• This list may also contain frequent values and cannot differentiate attributes from
values.
• Common noisy terms may be selected due to their high frequencies in the description
collection. These noisy terms could be general stop words in English like “not”,
“that” or other modifiers like “great”, “style”, “beautiful” which are very common in
descriptions.
We propose a text clustering based approach to overcome the above problems. A gen-
eral observation is that multiple products of a class have attributes in common. So an at-
tribute is likely to occur multiple times in the descriptions. We try to capture the attributes
using these repetitions. For example, the attribute “Fretboard” appears in different contexts
as “Rosewood Fretboard”, “Bound Rosewood Fretboard”, “Javanese Rosewood Fretboard”
etc.
In this work, we explore clustering at two levels in the text: Noun Phrase Clustering
and Word Clustering. In the first approach, noun phrases from the description collection are
grouped and in the second approach, clusters of words are computed. Noun phrases Noun
Phrase Clustering (NP Clustering) method is described in this chapter and Word Clustering
method is described in Chapter 4.
Our solution operates in two stages. In the first stage, we cluster the text in the descrip-
tions such that each resulting cluster represents a single attribute and captures its context in24
Page 36
CHAPTER 3. ATTRIBUTE EXTRACTION
different occurrences. This results in clusters of varying size with bigger clusters contain-
ing frequent attributes and smaller clusters representing rare attributes. In the second stage,
we extract an attribute from each cluster.
3.3 Noun Phrase Clustering Approach
As stated earlier, this method consists of two stages: Clustering and Attribute Identifica-
tion. In the first stage, explained in Section 3.3.2, we cluster the noun phrases from all
the descriptions and in the second stage explained in 3.3.3, we extract attributes from the
clusters.
As it can be seen from the product descriptions, attributes occur in noun phrases. For
example, in Fig 3.1, “backlight”, “LCD” occur in phrases “LED backlight”, “2.5 inch color
LCD” respectively. The context of an attribute varies from one occurrence to another. An
attribute is accompanied by a general modifier or a value. Also, a noun phrase usually
contains no attribute or a single attribute and rarely contains more than one attribute. This
motivated us to use noun phrase clustering so that noun phrases related to an attribute are
grouped together in a single cluster.
Before the clustering and attribute identification stages, the text in the descriptions un-
dergoes a preprocessing step to get the noun phrases from the text.
3.3.1 Pre-processing
The input descriptions contain raw text as shown in Figs. 3.1, 3.2 and 3.3. The goal of
this step is to identify the noun phrases from the product descriptions. These noun phrases
are given as input for clustering. Pre-processing is a simple three stage process: Sentence
Splitting, POS tagging and Stemming. First, the text in the descriptions is split into (in-
complete) sentences using a rule based sentence splitter. A set of patterns are devised to
split the text into sentences. We split the text when any of the following patterns occur,
25
Page 37
CHAPTER 3. ATTRIBUTE EXTRACTION
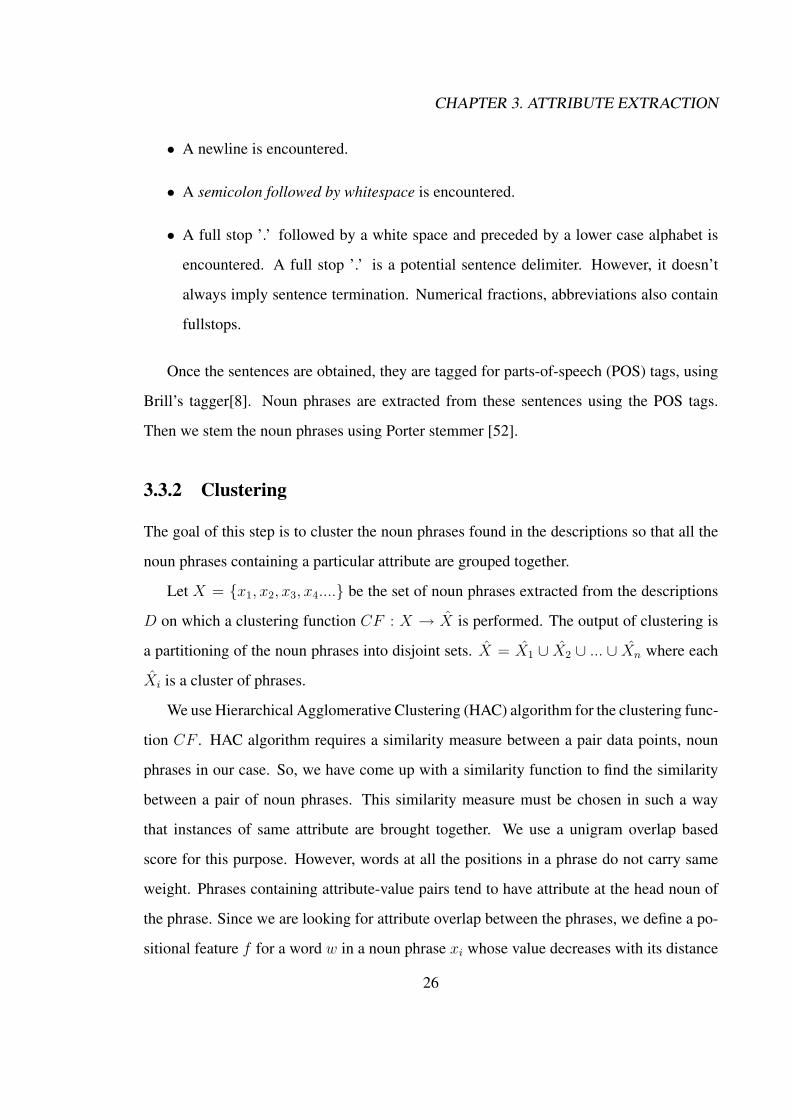
• A newline is encountered.
• A semicolon followed by whitespace is encountered.
• A full stop ’.’ followed by a white space and preceded by a lower case alphabet is
encountered. A full stop ’.’ is a potential sentence delimiter. However, it doesn’t
always imply sentence termination. Numerical fractions, abbreviations also contain
fullstops.
Once the sentences are obtained, they are tagged for parts-of-speech (POS) tags, using
Brill’s tagger[8]. Noun phrases are extracted from these sentences using the POS tags.
Then we stem the noun phrases using Porter stemmer [52].
3.3.2 Clustering
The goal of this step is to cluster the noun phrases found in the descriptions so that all the
noun phrases containing a particular attribute are grouped together.
Let X = {x1, x2, x3, x4....} be the set of noun phrases extracted from the descriptions
D on which a clustering function CF : X → X is performed. The output of clustering is
a partitioning of the noun phrases into disjoint sets. X = X1 ∪ X2 ∪ ... ∪ Xn where each
Xi is a cluster of phrases.
We use Hierarchical Agglomerative Clustering (HAC) algorithm for the clustering func-
tion CF . HAC algorithm requires a similarity measure between a pair data points, noun
phrases in our case. So, we have come up with a similarity function to find the similarity
between a pair of noun phrases. This similarity measure must be chosen in such a way
that instances of same attribute are brought together. We use a unigram overlap based
score for this purpose. However, words at all the positions in a phrase do not carry same
weight. Phrases containing attribute-value pairs tend to have attribute at the head noun of
the phrase. Since we are looking for attribute overlap between the phrases, we define a po-
sitional feature f for a word w in a noun phrase xi whose value decreases with its distance
26
Page 38
CHAPTER 3. ATTRIBUTE EXTRACTION
from head noun.
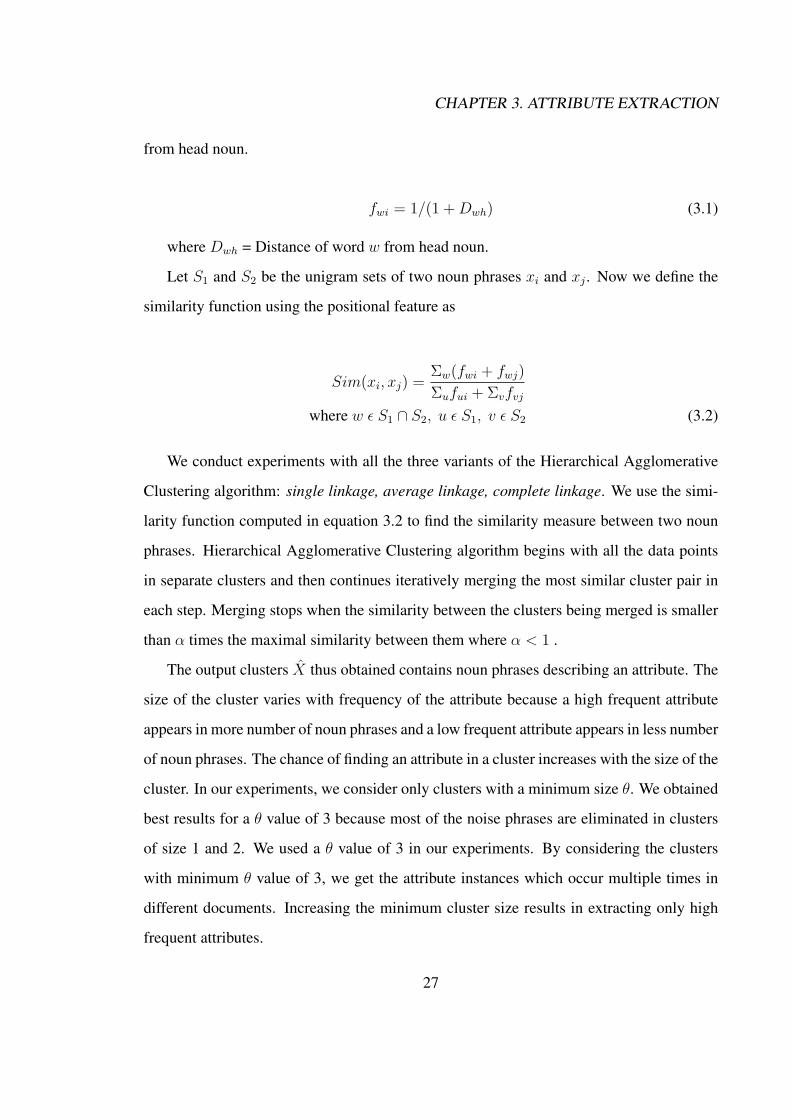
fwi = 1/(1 +Dwh) (3.1)
where Dwh = Distance of word w from head noun.
Let S1 and S2 be the unigram sets of two noun phrases xi and xj . Now we define the
similarity function using the positional feature as
Sim(xi, xj) =Σw(fwi + fwj)
Σufui + Σvfvj
where w ε S1 ∩ S2, u ε S1, v ε S2 (3.2)
We conduct experiments with all the three variants of the Hierarchical Agglomerative
Clustering algorithm: single linkage, average linkage, complete linkage. We use the simi-
larity function computed in equation 3.2 to find the similarity measure between two noun
phrases. Hierarchical Agglomerative Clustering algorithm begins with all the data points
in separate clusters and then continues iteratively merging the most similar cluster pair in
each step. Merging stops when the similarity between the clusters being merged is smaller
than α times the maximal similarity between them where α < 1 .
The output clusters X thus obtained contains noun phrases describing an attribute. The
size of the cluster varies with frequency of the attribute because a high frequent attribute
appears in more number of noun phrases and a low frequent attribute appears in less number
of noun phrases. The chance of finding an attribute in a cluster increases with the size of the
cluster. In our experiments, we consider only clusters with a minimum size θ. We obtained
best results for a θ value of 3 because most of the noise phrases are eliminated in clusters
of size 1 and 2. We used a θ value of 3 in our experiments. By considering the clusters
with minimum θ value of 3, we get the attribute instances which occur multiple times in
different documents. Increasing the minimum cluster size results in extracting only high
frequent attributes.
27
Page 39
CHAPTER 3. ATTRIBUTE EXTRACTION
Strings Gig Bag Spruce Top Fingerboard
Strings (5) Gig Bag (13) Solid Spruce Top (4) Rosewood Fingerboard (2)
Steel Strings (11) A Gig Bag (2) Spruce Top (5) Ebonite Fingerboard (1)
Extra Strings (2) Nylon Gig Bag (1) Select Spruce Top (1) Fingerboard Rosewood (1)
Strings (1) Natural Spruce Top (1)
Fretboard Tuning Machines Scale Length
Rosewood Fretboard (2) die cast tuning machines(2) Scale Length (5)
Bound Rosewood Fretboard (2) chrome die cast tuning machines(1)
Javanese Rosewood Fretboard (2) chrome plated tuning machines (10
Fretboard (1)
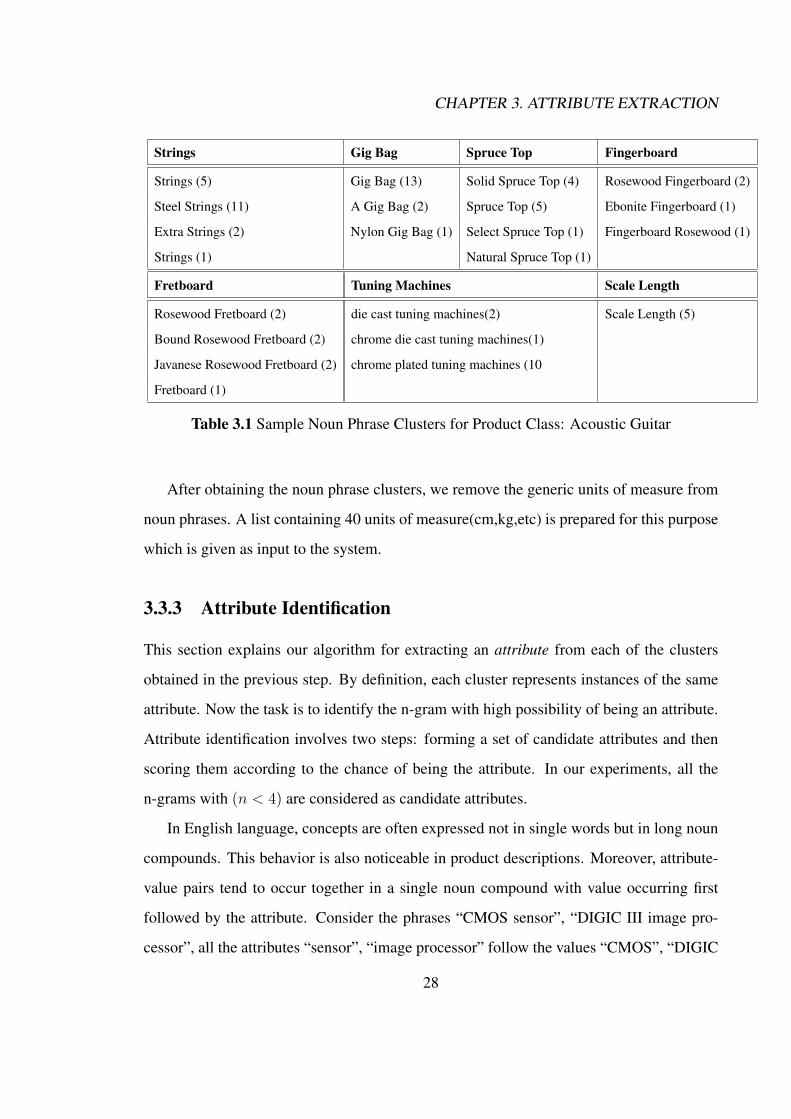
Table 3.1 Sample Noun Phrase Clusters for Product Class: Acoustic Guitar
After obtaining the noun phrase clusters, we remove the generic units of measure from
noun phrases. A list containing 40 units of measure(cm,kg,etc) is prepared for this purpose
which is given as input to the system.
3.3.3 Attribute Identification
This section explains our algorithm for extracting an attribute from each of the clusters
obtained in the previous step. By definition, each cluster represents instances of the same
attribute. Now the task is to identify the n-gram with high possibility of being an attribute.
Attribute identification involves two steps: forming a set of candidate attributes and then
scoring them according to the chance of being the attribute. In our experiments, all the
n-grams with (n < 4) are considered as candidate attributes.
In English language, concepts are often expressed not in single words but in long noun
compounds. This behavior is also noticeable in product descriptions. Moreover, attribute-
value pairs tend to occur together in a single noun compound with value occurring first
followed by the attribute. Consider the phrases “CMOS sensor”, “DIGIC III image pro-
cessor”, all the attributes “sensor”, “image processor” follow the values “CMOS”, “DIGIC
28
Page 40
CHAPTER 3. ATTRIBUTE EXTRACTION
III”. So phrases containing attribute-value pairs tend to have attribute at the head noun of
the phrase.
Now, a scoring function AttrScore is defined for a candidate attribute a for cluster xi
using the following principles:
1. An attribute is more likely to occur in the cluster xi and less likely to occur in other
clusters.
2. The chance of finding an attribute decreases with its distance from the head noun.
Following principle 1 above, we find a candidate attribute’s belongingness to its cluster
than other cluster using the pointwise KL divergence metric which was previously used in
[68]. So
AttrScore ∝ P (a)logP (a)
Q(a)(3.3)
where P and Q are distributions of all n-grams in current cluster and rest of the clusters
together respectively.
Following the principle 2, We define ADh as the average distance of n-gram a from
head noun Dh in its instances. For example, in the noun phrase “CMOS sensor”, Dh of the
n-grams “CMOS”, “Sensor”, “CMOS Sensor” are 1, 0 and 0 respectively. In order to be an
attribute, the Average Head Noun Distance of an n-Gram w should be small. SoAttrScore
is defined as
AttrScore =P (a)log P (a)
Q(a)
ADh(w)(3.4)
The n-gram a with highest AttrScore is selected as the attribute represented by that
cluster. Since noun phrases are stemmed before clustering, the extracted attributes contain
normalized tokens. Each of these tokens is substituted with its most frequent morphological
variant in the cluster. Table 3.1 shows sample noun phrase clusters for the product class
Acoustic Guitars computed by our noun phrase clustering method. It shows noun phrase29
Page 41
CHAPTER 3. ATTRIBUTE EXTRACTION
clusters along with the attribute (in bold) it represents. The number next to each noun
phrase gives the number of times the noun phrase has appeared in the description collection.
3.4 Summary
In this chapter, we have explained the challenges in the attribute extraction problem and
presented an unsupervised method to overcome the challenges. The key idea in our method
is to cluster noun phrases from all the descriptions and extract attributes from the noun
phrase clusters. We have defined a custom lexical similarity measure which uses the posi-
tional information of the individual terms in the phrases. We have used HAC algorithms to
cluster the noun phrases. A representative attribute is extracted from each cluster from its
noun phrases. We have defined a AttrScore to measure each candidate n-gram for being
an attribute. This metric scores a candidate high if it is frequent in its cluster and infrequent
in other clusters. The candidate with the highest score is selected as the attribute for that
cluster. This is the first unsupervised method for the attribute extraction problem in the
literature. Also this method is effective in extracting attributes accurately from small set of
descriptions.
30
Page 42
Chapter 4
Attribute Extraction using Word
Clusters
This section presents an alternate method to the attribute extraction problem. In the previ-
ous chapter, we have explored noun phrase clustering in order to find the attributes. Here
we perform clustering on words in the descriptions and find groups of related words.
Usually language objects, words or noun phrases in our case, are represented as a fea-
ture vector in a multidimensional space. A distance metric is computed to find the sim-
ilarity between the objects. Clustering algorithms use these similarity values to generate
the clusters from the objects. We used a similar representation in the method presented in
the previous chapter. Instead, we used a graph representation for clustering which doesn’t
use dimensions in space. In this representation, a graph is constructed from the input text
where language objects are mapped to nodes in the graph which are connected by edges.
Then graph clustering algorithms are used to find groups of similar nodes.
A co-occurrence graph is constructed from the descriptions with each distinct word
representing a node and edges representing word co-occurrences. This co-occurrence graph
exhibits the small world property. We give more details about the small world property
in Section 4.1. A graph clustering algorithm can now be used to cluster all the words
such that each resulting cluster consists of words related to an attribute. We compute the
31
Page 43
CHAPTER 4. ATTRIBUTE EXTRACTION USING WORD CLUSTERS
word clusters using the chinese whispers algorithm which has been used to cluster graphs
exhibiting the small world property. We explain chinese whispers algorithm in Section 4.3.
Then we extract an attribute from each of these clusters. We explain the graph clustering
and attribute extraction in 4.3 and 4.4.
4.1 Small World Property
A graph which is characterized by the presence of densely connected sub-graphs and where
there exists a path between most pairs of nodes is said to possess the small world property.
Most of the nodes need not be neighbors of one another, but can be reached from every
other node by a small number of hops. The nodes that are densely connected share a
common property and when mapped this to a social network represents the communities
formed by the people. In social networks, two people may not know each other directly,
but it is possible that both people are connected by common people[72].
There exist many other graphs which are found to exhibit small-world property. Examples
include road maps, food chains, electric power grids, neural networks, voter networks,
telephone call graphs, and social influence networks. We refer the reader to [72] for more
details on the dynamics and structural properties of the small world graphs. According
to Ferrer and Sole[29], co-occurrence graphs also possess the small world property. The
graph built from the product descriptions possesses the co-occurrence property and hence
also possesses the small world property. We now describe how the text is modeled as a
graph in section 4.2.
4.2 Graph Construction
Let D be a set of descriptions describing different varieties of a product. We follow the
same preprocessing step explained in 3.3.1 for getting the noun phrases. We represent
these phrases in a weighted, undirected graph G=(V,E) where each vertex vi ∈ V represents
32
Page 44
CHAPTER 4. ATTRIBUTE EXTRACTION USING WORD CLUSTERS
a distinct word in the document collection D and each edge (vi,vj ,wi,j) ∈ E represents
co-occurrences between a pair of words. Since a noun phrase typically describes a single
attribute, we limit the context to the boundaries of the noun phrase. This way of using a
complete noun phrases helps us capture the context better than a fixed window approach.
So we say that two words co-occur if they occur within a noun phrase boundary. The weight
of an edge wi,j is the number of co-occurrences between the pair of words represented by
vertices vi and vj . The neighborhood N(vi) of a vertex vi is defined as the set of all nodes
vj ∈ V , connected to vi i.e. (vi,vj ,wij) or (vj ,vi,wij) ∈ E. We build an adjacency matrix
A from the graph G and identify the densely connected nodes in the graph using Chinese
Whispers algorithm.
4.3 Chinese Whispers Algorithm
Chinese Whispers (CW) [4] is an algorithm for partitioning the nodes of a weighted, undi-
rected graph. This algorithm is motivated by a children’s game where children whisper
words to each other. Though the goal of the game is to derive a funny message of the orig-
inal text, CW finds the groups of nodes that share a common property. In children’s game
all the nodes that broadcast the same message fall into a single cluster.
Chinese Whispers is an iterative algorithm which works in a bottom-up fashion. It starts
by assigning a separate class to each node. In each iteration, every node is assigned the
strongest class in its neighborhood, which is the class having the highest sum of weights
to the current node. This process continues until no other assignments are possible for any
node in the graph.
Generally, the CW algorithm can result either in a soft partition or hard partition. We
set the parameters of CW so that it always results in a hard partitioning of the graph i.e each
node is assigned exactly one class. After obtaining the clusters, we proceed to the next step
where we extract attributes represented by the clusters.
We conducted an experiment to see if the number of iterations affected the clusters
33
Page 45
CHAPTER 4. ATTRIBUTE EXTRACTION USING WORD CLUSTERS
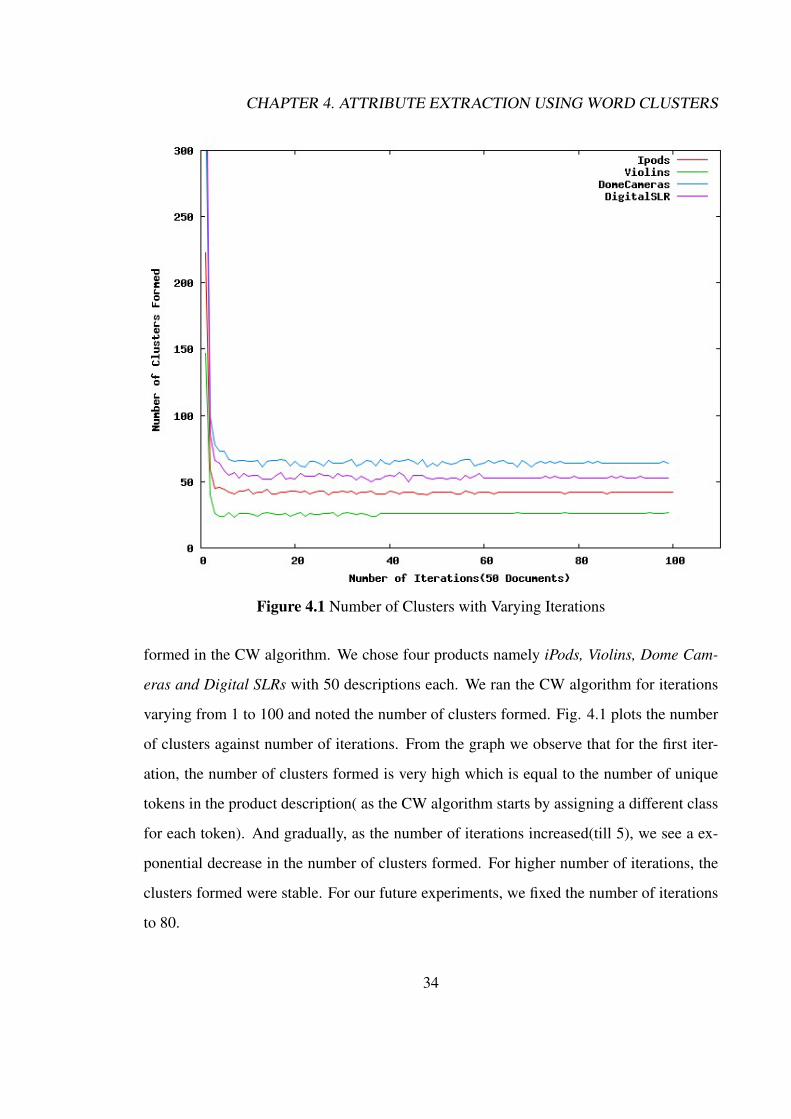
Figure 4.1 Number of Clusters with Varying Iterations
formed in the CW algorithm. We chose four products namely iPods, Violins, Dome Cam-
eras and Digital SLRs with 50 descriptions each. We ran the CW algorithm for iterations
varying from 1 to 100 and noted the number of clusters formed. Fig. 4.1 plots the number
of clusters against number of iterations. From the graph we observe that for the first iter-
ation, the number of clusters formed is very high which is equal to the number of unique
tokens in the product description( as the CW algorithm starts by assigning a different class
for each token). And gradually, as the number of iterations increased(till 5), we see a ex-
ponential decrease in the number of clusters formed. For higher number of iterations, the
clusters formed were stable. For our future experiments, we fixed the number of iterations
to 80.
34
Page 46
CHAPTER 4. ATTRIBUTE EXTRACTION USING WORD CLUSTERS
Neck Finish Warranty Bag Strap Button Frets
Reinforced Satin Limited Black Strap Frets
Hardwood Carry Pocket Nylon Handle 15
Nato Gloss One Gig Button 18
Neck High Year Carrying Shoulder
Rosette Protective Warranty Bag
Finish
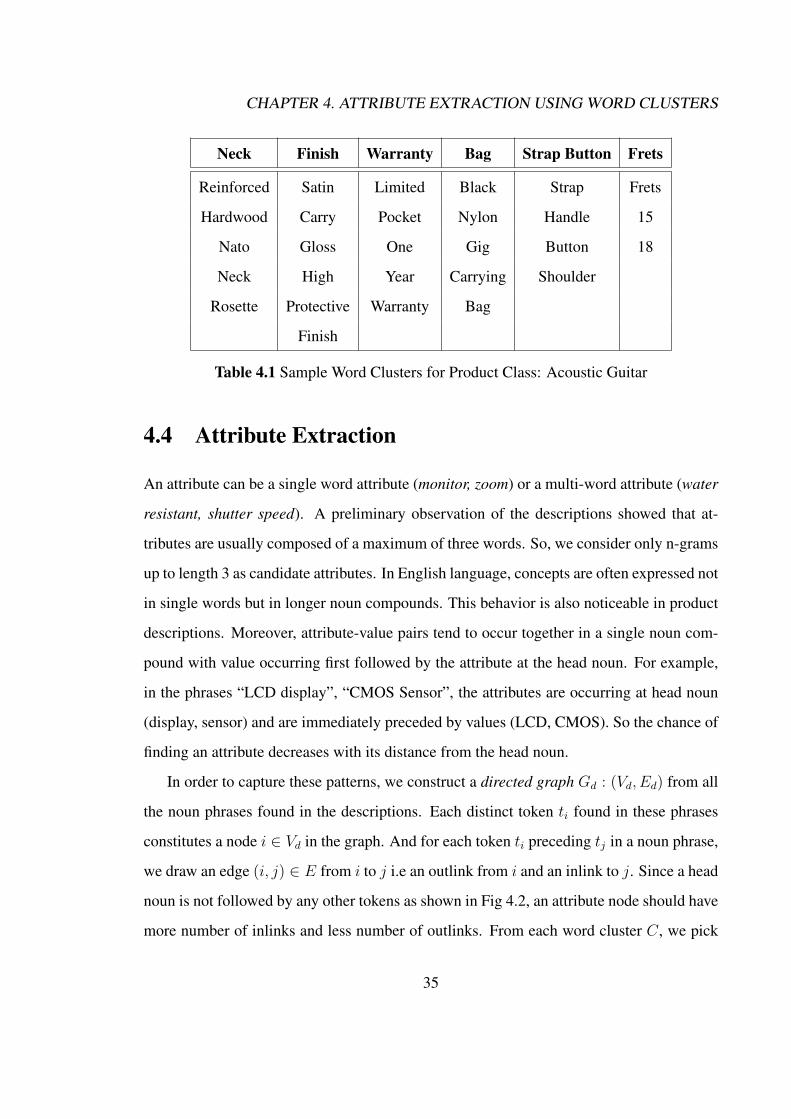
Table 4.1 Sample Word Clusters for Product Class: Acoustic Guitar
4.4 Attribute Extraction
An attribute can be a single word attribute (monitor, zoom) or a multi-word attribute (water
resistant, shutter speed). A preliminary observation of the descriptions showed that at-
tributes are usually composed of a maximum of three words. So, we consider only n-grams
up to length 3 as candidate attributes. In English language, concepts are often expressed not
in single words but in longer noun compounds. This behavior is also noticeable in product
descriptions. Moreover, attribute-value pairs tend to occur together in a single noun com-
pound with value occurring first followed by the attribute at the head noun. For example,
in the phrases “LCD display”, “CMOS Sensor”, the attributes are occurring at head noun
(display, sensor) and are immediately preceded by values (LCD, CMOS). So the chance of
finding an attribute decreases with its distance from the head noun.
In order to capture these patterns, we construct a directed graph Gd : (Vd, Ed) from all
the noun phrases found in the descriptions. Each distinct token ti found in these phrases
constitutes a node i ∈ Vd in the graph. And for each token ti preceding tj in a noun phrase,
we draw an edge (i, j) ∈ E from i to j i.e an outlink from i and an inlink to j. Since a head
noun is not followed by any other tokens as shown in Fig 4.2, an attribute node should have
more number of inlinks and less number of outlinks. From each word cluster C, we pick
35
Page 47
CHAPTER 4. ATTRIBUTE EXTRACTION USING WORD CLUSTERS
Figure 4.2 Sample Sub-graphs
the node a with the maximum difference between inlink and outlinks (Equation 4.1). The
token ta represented by this node a is selected as the attribute if has a minimum support Sa
of 0.5. Support is defined in Equation 4.2. We do not pick any attribute from cluster C if
36
Page 48
CHAPTER 4. ATTRIBUTE EXTRACTION USING WORD CLUSTERS
Sa < 0.5.
a = argmaxi
(inlinks(i)− outlink(i)) where i ∈ C (4.1)
Sa =inlinks(a)− outlinks(a)
inlinks(a)(4.2)
If all the inlinks to the node a are from a single node b, then we take the bigram tatb
as the attribute instead of ta and similarly we take a trigram as attribute if tatb has all the
inlinks from a single node. This helps us in extracting multi-word attributes like wood
construction, pitch pipe etc. Table 4.1 shows sample word clusters for the product class
Acoustic Guitars computed using the word clustering method. It shows word clusters along
with the attribute (in bold) it represents.
4.5 Summary
This chapter presented a new method for attribute extraction problem. In this method, we
cluster words appearing in the descriptions instead of noun phrases. We follow a graph
clustering approach to identify the attributes and construct a word co-occurrence graph
from the descriptions. The idea is that words related to an attribute co-occur more often
than words of different attributes and form densely connected clusters in the co-occurrence
graph. So we used a two stage method to identify the attributes. In the first stage, we par-
tition the graph using chinese whispers clustering algorithm. This results in word clusters
each representing words related to a particular attribute. In the second stage, we extract
representative attribute from each cluster. As we explain in Chapter 6, this overcomes the
problems associated with the noun phrase clustering method presented and performs signif-
icantly better than NP clustering method in forming the attributes and improves the quality
of the attributes.
37
Page 49
Chapter 5
Comparative Summary Generation
In the last two chapters, we have presented algorithms to automatically extract attributes of
a product class. In this chapter, we explain how these attributes can be effectively used to
compare multiple products of a class simultaneously. We have come up with a new design
for the same which we refer to as “Comparative Summaries”. We also describe a method
to automatically rank attributes and generate comparative summaries for a product class.
5.1 Introduction
A summary is a condensed form of text serving a purpose. In a multi document summa-
rization task, a summary aims to deliver majority of the content from a set of documents
that share a common topic. In this work, we define a novel form of summaries referred to
as comparative summaries which provide comparative study of multiple items belonging
to a category. For example, a category of “Tennis Players” will have the players “Roger
Federer”, “Rafael Nadal” etc as its items. rer”, “Rafael Nadal” etc as its items. Here, the
purpose of a summary is to provide a quick, concise comparison among the items of the
category. An assumption in such a task is that, the documents in the collection should
describe the comparable items which are primarily entities or concepts or events.
A comparative summary provides the properties or facts common to these items and
38
Page 50
CHAPTER 5. COMPARATIVE SUMMARY GENERATION
1 2 3 4 5 6 7 8 9 10 11 12 13 14 15 Attribute
yes yes yes yes yes yes yes LCD
yes yes yes yes yes yes yes yes yes yes yes yes Songs
yes yes yes yes yes Playback
yes yes yes yes yes yes yes yes yes SP
yes yes yes yes yes yes yes yes yes yes yes yes Video
yes yes yes Formats
yes yes yes yes yes yes yes yes yes yes yes yes Photos
yes yes yes yes WAV
yes yes yes yes AAC
yes yes yes yes yes yes yes Led Backlight
Table 5.1 Comparative Summary of iPods
their corresponding values with respect to each item. It presents these properties ranked
according to their usefulness in comparing the items. For “Tennis Players” category, com-
mon properties would be “Country Represented”, “Grand slam Titles Won”, “ATP Rank-
ing”, etc. Usually, a summary is a free flow of natural language text containing a set of
sentences. Here we design our summary based on the properties and values of the items
which are single words or phrases. We present a comparative summary as a Property vs
Item matrix with the elements of the matrix representing the values of corresponding prop-
erty for each item. This paradigm of word or phrase based summary has been previously
studied for Multi Document Summarization by [66, 54, 58, 35, 24]. We believe that finding
these terms (properties and their values), ranking them according to importance and relat-
ing them with each document is a concise way of presenting the comparable content in the
documents.
We define comparative summary generation as the task of automatically extracting
comparative summary from a collection of documents where each document describes a
particular item in a category. In this thesis, we focus on comparative summary genera-
tion for product domain. Here, a product class is assumed as a category and its products
are treated as the category’s items. The attributes of the product class are the common
39
Page 51
CHAPTER 5. COMPARATIVE SUMMARY GENERATION
properties that should be presented in the comparative summary.
One of the main tasks users perform before buying products is to choose one from the
many available varieties. For this purpose, users compare products. Comparisons can be
either subjective or objective. For example, “The sound quality in MP3 player A is better
than the sound quality in MP3 player” is a subjective comparison. An objective compari-
son is “Camera X has double the resolution than Camera”. A comparative summary aids
in making objective comparisons like feature comparison or attribute/value comparison
among the products. In this thesis, we are exploring occurrence or non-occurrence of an
attribute (binary), since this is a good simplification of the problem to begin with.
We present a simple form of comparative summary for binary valued attributes. A more
complex form of comparative summary has the attributes taking discrete values. Table
5.1 shows a comparative summary for iPods descriptions. In simple terms, a comparative
summary is an Attributes vs Products table with attributes ranked according to importance
in rows. The rightmost column in the table contains attributes backlight, etc. The top row
contains the document ids of descriptions. The values in the table are binary with yes or no
possibilities. An yes entry implies that the attribute in that row is present in the description
of the corresponding column. Similarly if the entry is no, it means that the document doesnt
have the attribute. Table 5.1 shows the initial screen of the summarizer which displays the
top 10 attributes of a product class. A user can access more attributes of the iPod on clicking
the More Results link available at the bottom of the page.
5.2 Comparative Summary Generation Framework
The goal of Comparative Summary Generation task is to generate a summary for a set of
products belonging to same class P . The input to the system is a collection of product de-
scriptions collection D = {d1, d2, d3 · · · dn} with each description di describing a product
Pi . The product class P has a set of attributes A = {a1, a2, · · · am}. But a product may
not contain all the attributes in A. Let Ai ⊂ A be the set of attributes found in product Pi.
40
Page 52
CHAPTER 5. COMPARATIVE SUMMARY GENERATION
The output of the system is a comparative summary for P which gives the occurrence in-
formation of attributes in each of the products belonging to P . These attributes are ranked
in the summary according to their importance in comparing products.
We define a Comparative Summary S for the product P as an m x n matrix with each
column corresponding to a product and each row corresponding to an attribute.
Si,j = 1 if ai ∈ Aj (5.1)
= 0 if ai ∈ Aj
A comparative summary generation system for products typically has three stages.
1. Attribute Extraction: The first stage deals with the attribute extraction task. Give a
set of product descriptions of a class, the attributes of the product class are extracted
using the input product descriptions.
2. Attribute Ranking: A summary presents attributes of various products of a class.
A user who is willing to choose a product would look for the attributes present in
the summary. However, all the attributes need not be equally important. So the
comparative summary lists the attributes in the order of importance. Thus a ranking
algorithm is used to find the importance of attributes.
3. Summary Generation: In the final stage, summary is constructed from the ranked
attributes. The occurrence information of attributes in each product is determined
and presented in the summary.
We presented two unsupervised algorithms for the attribute extraction task in chapters
3 and 4. Section 5.3 presents an algorithm for ranking the attributes. Summary generation
is explained in Section 5.4.
41
Page 53
CHAPTER 5. COMPARATIVE SUMMARY GENERATION
5.3 Attribute Ranking
To facilitate a user in comparing different products using the summary, we present the
attributes along with their corresponding values (occurrence or non-occurrence) for all the
products. However, all the attributes need not be equally important. A user would be more
interested in learning about attributes that assist him/her in comparing products and such
attributes should be displayed at the top in the summary. So we propose the notion of
Ranking For Comparison which states that the attributes should be ranked based on their
usefulness in comparing products.
The most intuitive way of ranking the attributes is to sort them on their frequency of
occurrence in various products. However, this method has drawbacks. A frequent attribute
that has the same value in all the products can be less informative, despite being a vital
feature of that product class, because it cannot help in making comparisons. For example,
as shown in the iPod description (Fig. 3.1), many iPod descriptions mention that “Comes
with earbud headphones and USB cable”. Though Earbud Headphones is very frequent
attribute of an iPod, it is a trivial fact that every iPod comes with Earbud Headphones
and doesn’t contribute much in discriminating different models. So frequency alone is
not sufficient in determining the usefulness of attributes. We solve the above problems by
identifying features which can enhance the performance.
5.3.1 Features
We devise the following characteristics to be present in the attribute: (1) The attribute
should be frequent and occurring in many products. So we take the product frequency of
an attribute as a feature (2) However, attributes that have same value for many products are
inefficient. Attributes having more variety in their values draw more comparisons and thus
help in selecting a particular product. It is known that attributes are likely to occur along
with their values in the noun phrases. So, attributes having informative noun phrases are
more useful for comparison. Since entropy is a measure of informative content, we take
42
Page 54
CHAPTER 5. COMPARATIVE SUMMARY GENERATION
the entropy in attribute’s context as a feature (3) Domain specific attributes are of more
interest than generic attributes. For example, a user willing to buy an iPod would be more
interested in its memory than weight. We compute the domain specific nature of an attribute
by calculating the KL divergence of an attribute with respect to a background corpus.
We define our feature functions using the above cues.
Product Frequency: We define Product Frequency (pf ) of an attribute as the number
of products in which it appears. Since each document d in the description collection D
represents a single product, product frequency is nothing but the document frequency of
the attribute ai.
pf =|{d : ai ε d}||D|
(5.2)
Context Entropy: Context Entropy (ce) of an attribute is the unigram entropy of the
text surrounding the attribute in its instances. Since a noun phrase typically describes a
single attribute, we limit the context to the boundaries of the noun phrase. For an attribute
ai, all the noun phrases in which it appears are considered as its context. We construct a
unigram language model Mi for the cluster xi. So the context entropy becomes
ce = −Σwp(w|Mi) log p(w|Mi) (5.3)
Specialty: Specialty (sp) is computed as the KL divergence [15] of an attribute a with
respect to a generic background corpus. The assumption here is that common attributes
such as “length”, “weight” etc are more likely to appear in a generic corpus compared to
domain specific attributes such as “ pitch pipe” of an acoustic guitar. Specialty value should
be higher for “pitch pipe” compared to “length”. We use a random sample from TREC
collection [1] for this purpose. Text Retrieval Conference (TREC) is an annual competition
focused on different Information Retrieval research problems. They create large document
collections for evaluating the participants in the competition. We have used the document
collection of ad-hoc retrieval task as our background corpus since the collection is open
43
Page 55
CHAPTER 5. COMPARATIVE SUMMARY GENERATION
domain and thus serves as a generic english corpus. We construct unigram language models
Ma for attribute a and Mg for the background corpus.
sp = Σwp(w|Ma) log p(w|Ma)/p(w|Mg) (5.4)
5.3.2 Ranking Function
Once we computed the features, we could use a simple formula to combine them and
calculate a salience score for each attribute. But this might be too heuristic and may not
be the best way to combine them. Instead, we learn a regression model using training data.
Regression is a classic statistical problem which tries to determine the relationship between
two random variables X = (x1, x2, ..., xp) and Y . In our case, independent variable X is
a vector of the three features described above: X = (pf, ce, sp), and dependent Y is the
ranking functionR(a) which takes any real-valued score. We useR(a) to sort the attributes
in a descending order.
R(a) = w1 ∗ pf(a) + w2 ∗ ce(a) + w3 ∗ sp(a) + w0 (5.5)
where w1, w2 and w3 are the weights of the features pf , ce, sp respectively.
A linear regression classifier is used to learn the weights. We train a binary regression
model to learn our ranking function. We used manually created attribute lists (explained in
Chapter 6) for positive samples and randomly picked non attribute words from the descrip-
tions for negative samples. The weights are optimized and these weights are used in our
experiments which are explained in detail later in Section. 6.4
5.4 Creating the Summary
As we have described in Section 5.1, a comparative summary is an Attributes vs Products
matrix. The elements of this matrix are filled with values of the attributes in the corre-
44
Page 56
CHAPTER 5. COMPARATIVE SUMMARY GENERATION
1 2 3 4 5 6 7 8 9 10 11 12 13 14 15 Attribute
yes yes yes yes yes yes yes yes yes Tuning
yes yes yes yes yes yes Chord Chart
yes yes yes yes Deluxe Semirigid
yes yes yes yes Rosewood Fretboard
yes yes yes yes yes yes yes yes yes Pitch Pipe
yes yes yes yes yes yes yes yes yes yes yes yes Finish
yes yes yes yes back
yes yes yes yes yes yes yes yes yes yes yes yes Strings
yes yes yes yes yes yes Wood Construction
yes yes yes yes yes yes yes yes yes yes Bag
Table 5.2 Comparative Summary of Acoustic Guitars
sponding product. Once the ranked attributes are obtained, the next step is to create the
summary of the products which involves two sub tasks. First, the attributes are presented
in the ranked order in the summary. Second, filling the corresponding values of attributes
in each of the products column. Since, we are concerned with only the occurrence or non-
occurrence information of attributes in this work, an attribute takes a value of either yes or
blank as shown in Fig. 5.2. For each attribute, we look for its occurrence in all the descrip-
tions. If it is present in a description, we fill the value yes in the product’s column of that
corresponding description. Similarly, if the attribute is not present in the description, we
leave the cell blank to the corresponding product column. Thus a comparative summary is
created from the ranked list of attributes.
5.5 Summary
In this chapter, we have presented a new form of summaries referred as comparative sum-
maries which gives comparable content in multiple items belonging to same category.
Comparative summary gives a quick, concise comparison of the multiple items in the
category. In this work, we presented techniques to generate comparative summaries for
45
Page 57
CHAPTER 5. COMPARATIVE SUMMARY GENERATION
products. We designed the comparative summary based on the attributes of the products. A
comparative summary is an Attributes Vs Products matrix with each element correspond-
ing to attribute of a product and attributes ranked according to their importance in product
comparison. We have come up with features for identifying attributes useful in compari-
son and have presented a method for ranking the attributes using these features. We have
evaluated the ranking method by conducting a user study which is explained in Chapter 6.
The study has shown that our ranking algorithm is effective in identifying attributes useful
in product comparison.
46
Page 58
Chapter 6
Experiments and Results
This chapter discusses the empirical evaluation of the various methods proposed in this
thesis. We start by describing the datasets used in our experiments: Product description
dataset and gold standard attributes. We then explain the evaluation measures used in our
experiments in section 6.2. Precision and Recall are defined in the context of attributes.
We have conducted several experiments to evaluate the effectiveness of our algorithms and
to find the optimal parameters. These experiments evaluate the attribute extraction and
ranking algorithms presented in Chapters 3, 4 & 5. Sections 6.3 and 6.4 describe these
experiments in detail along with analysis on the results obtained.
6.1 Data
To carry out our experiments, we primarily require two resources, product descriptions for
different product classes and a corresponding gold standard attributes list for each of these
product classes.
• Product Descriptions: We crawled product descriptions from the online shopping
portal Amazon 1. Amazon organizes products in a category tree. Each product be-
longs to at least one bottom category (leaf node) in the tree. The top categories in1www.amazon.com
47
Page 59
CHAPTER 6. EXPERIMENTS AND RESULTS
the tree are broad and consist of diverse products whereas bottom categories contain
a narrow set of products. Some of the top categories include “Electronics”, “Home
appliances”, “Musical Instruments”. They stand on top of more specific categories
at the bottom of the tree like “Digital Cameras”, “Microwave Oven”, “Electric Gui-
tars”. We have selected 40 categories from bottom level categories and penultimate
level categories for evaluation. These categories are selected from different top cate-
gories to maintain diversity. Each selected category represents a Product Class. A set
of 50 descriptions are downloaded for each product class. As explained earlier, each
description corresponds to one product and contains incomplete sentences describing
the product.
• Gold Standard attributes: In order to evaluate the performance of our system, a
list of reference attributes is prepared for each of the 40 product classes. These are
manually created by two annotators for each product class in the dataset after reading
the descriptions of that class. Any attribute which appears at least in one description
of that product class is added to the reference list. We call these reference attributes
as Gold Standard Attributes. In our experiments, we compute the accuracy of our
methods by comparing the attributes extracted by our methods with the gold standard
attributes.
6.2 Evaluation Measures
This section explains the metrics we have used for evaluating the correctness of the at-
tributes extracted by our methods. Traditional IE systems like Named Entity Recognizers,
Relation Extractors etc are evaluated using precision and recall measures. We used a vari-
ant of precision and recall which was previously used by [20] for evaluating attribute-value
extraction.
Precision and recall values of our methods are computed by comparing attributes ex-
48
Page 60
CHAPTER 6. EXPERIMENTS AND RESULTS
tracted with gold standard attributes. However, this is not a straight forward job. Consider
the phrase: 3x optical zoom. Here, both zoom and optical zoom could be considered as
attributes. People often do not agree on what the correct attribute is. Also, in cases where
attribute-value pairs occur together in a phrase, a part or whole of the value is often ad-
hered to the attribute which is legally used as an attribute. For example, both monitor and
LCD monitor could be called as attributes. In an extreme scenario, every possible attribute-
value pair can be treated as a binary attribute with its value being the occurrence or non-
occurrence of the pair in the product. [20] presented the paradigm of full match and partial
match for an extracted attribute depending on whether it contains a part of value or not. We
use the same paradigm to compute the precision and recall values in our experiments. Full
match and partial match of an attribute are defined as follows
• Full Match: A full match occurs if the attribute completely overlaps with any of the
gold standard attributes. For example, if the system extracts “monitor” and the gold
standard attributes list contains an entry “monitor”, then it is a full match.
• Partial Match: A partial match occurs if the extracted attribute completely contains
any of the gold standard attributes. Thus, full match is a special case of partial match.
For example, if the gold standard list contains “monitor” and the system extracts
either “monitor” or “LCD monitor”, then it is treated as a partial match.
6.2.1 Precision
Precision is the fraction of the extracted attributes that have a match in the gold standard
list. We define two versions of precision to handle full matches and partial matches. If
we count only full matches, we refer to the precision obtained as full precision. On the
other hand, if we count partial matches, it is referred as partial precision. In our results, we
present both full precision and partial precision.
FullPrecision =|{Full Matches}|
|{Extracted Attributes}|(6.1)
49
Page 61
CHAPTER 6. EXPERIMENTS AND RESULTS
PartialPrecision =|{Partial Matches}||{Extracted Attributes}|
(6.2)
6.2.2 Recall
Recall is the fraction of the gold standard attributes that have a match with attributes ex-
tracted by the system. While computing Recall, we consider both full matches and partial
matches.
Recall =|{Partial Matches}|
|{Gold Standard Attributes}|(6.3)
6.3 Extraction Experiments
This section explains the experiments we conducted to evaluate the performance of our
clustering algorithms. We also explain the experiments carried out to find the effect of
the dataset size on the extraction accuracy. We also compare the performance of the NP
clustering and Word Clustering methods. Then we provide a detailed analysis and present
the trade offs in both the approaches.
6.3.1 Clustering Algorithms
We have presented two solutions to the attribute extraction problem which are explained in
Chapters 3 & 4. Both the approaches are based on clustering: One based on Noun Phrase
clustering and the other based on word clustering. The Noun Phrase clustering method uses
Hierarchical Agglomerative Clustering (HAC) to find the noun phrase groups. We have
experimented with all the three variants of HAC namely, single linkage, complete linkage
and average linkage. Word clustering method uses the Chinese Whispers algorithm.
We have conducted four experiments to compare the performance of these clustering
algorithms. In the first three experiments, we used the three variants of HAC algorithm and
extracted the attributes as described in Chapter 3. In the fourth experiment, we used the
50
Page 62
CHAPTER 6. EXPERIMENTS AND RESULTS
Single Linkage Complete Linkage Avg. Linkage Chinese Whispers
Full Precision 35.81 37.36 36.87 48.62
Partial Precision 79.56 83.09 85.17 80.73
Recall 50.76 46.68 47.53 45.0
Table 6.1 Precision and Recall for Hierarchical Clustering Algorithms
Chinese Whispers algorithm as described in Chapter 4. All the experiments are run on the
40 product classes in the dataset and all the 50 descriptions available for each product class
are utilized for extraction. After extracting the attributes, precision (both full and partial)
and recall values are computed using the gold standard attributes.
Results
Table 6.1 shows the precision and recall values for different clustering algorithms. All
the three variants of the HAC algorithm produced similar results. Among them, average
linkage performed better than the other two in partial precision with .85. Also, it achieves
a full precision which is close to that of complete linkage, the highest among the three.
Though single linkage gets the highest recall among the three, it doesn’t perform as good
as the other two in partial precision and full precision. The word clustering approach us-
ing the chinese whisper’s algorithm gave significantly higher full precision than the HAC
algorithms. It has got a full precision of 0.48 whereas the HAC algorithms managed a best
of 0.37. It also gives a recall comparable to that of HAC algorithms.
All the four algorithms achieved recall values between 0.45 to 0.5 and none of them
were able to identify more than 50% of the gold standard attributes. This is because most
of the attributes that the system couldn’t extract appeared few times in the dataset. Since
we prune all the clusters with size less than θ in NP Clustering, many of these rare attributes
are not extracted. Similarly, in the Word Clustering methods, the cutoff on the support of
a candidate attribute, which was set in Equation. 4.2 avoids picking infrequent attributes.
51
Page 63
CHAPTER 6. EXPERIMENTS AND RESULTS
We discuss more about the precision values in below subsections.
10 20 30 40 50
Full Precision 43.83 47.58 44.85 47.73 48.62
Partial Precision 69.70 71.35 77.04 75.60 80.73
Recall 9.68 20.38 30.15 35.22 45.0
Table 6.2 Precision and Recall for Chinese Whispers Algorithm with VaryingDataset Size
6.3.2 Dataset Size
We have conducted experiments to analyse the effect of dataset size on the performance of
the extraction methods. The size of input description set is increased from 10 to 50 in steps
of 10. Attributes are extracted using average linkage HAC algorithm and Chinese Whis-
pers Word clustering algorithm and precision, recall values are computed. Gold standard
attribute lists are separately prepared for each dataset of size 10 to 50. While preparing
gold standard attribute list for size 10, only attributes that appear in first 10 descriptions
are used as reference attributes for evaluation. Similarly, attributes that appear in first 20
descriptions are used for evaluation for dataset size 20 and so on.
Tables 6.3 and 6.2 give the precision and recall values for different dataset sizes. Both
the algorithms show steady improvement in precision and recall values as the size is in-
creased. Partial precision has gradually increased from 69.70 to 80.70 for CW algorithm
and 73.64 to 85.17 for NP clustering. It remained at 67% for 20 documents and steadily in-
creased there after suggesting that performance increases with input document size. Same
trend could be observed with Full Precision and Recall for both the algorithms. This clearly
indicates that the extraction algorithms are able to learn the characteristics of the product
class better as they get more evidence with the increasing number of documents.
Both the precision column and the attributes column indicate consistent improvement
52
Page 64
CHAPTER 6. EXPERIMENTS AND RESULTS
in performance with increase in data set size. Though these columns do not converge in
this table, they suggest a possible convergence point for a size much beyond 50. We did
not perform experiments to find this convergence point since it is expensive to obtain gold
standard attribute lists for large description collections. However, this experiment proves
that the performance improves by increasing the dataset size.
10 20 30 40 50
Full Precision 29.20 31.56 34.53 34.12 36.87
Partial Precision 73.64 75.35 81.60 82.38 85.17
Recall 10.76 23.37 33.45 38.65 47.53
Table 6.3 Precision and Recall for HAC algorithm with Varying Dataset Size
6.3.3 Baseline
We have created a baseline to compare against our extraction algorithms. Baseline is a
frequent noun phrase selection algorithm. It picks the most frequent noun phrases in the
descriptions as the attributes. Baseline resulted in low recall and full precision for the
following reasons
1. Noun phrases contain attribute value pairs and result in few full matches.
2. Recall is low because the frequency of an attribute is distributed among the different
phrases of the attribute.
6.3.4 Noun Phrase Clustering vs Word Clustering
Though both the approaches are based on clustering, they are different in many respects.
• One approach clusters noun phrases, other aims at finding word clusters.
53
Page 65
CHAPTER 6. EXPERIMENTS AND RESULTS
NP Clustering Word Clustering FrequentNP
Partial Precision 85.17 80.73 67.3
Full Precision 36.87 48.62 15.6
Recall 47.53 45.0 26.2
Table 6.4 Comparison With Baseline
• NP clustering groups occurrences of attributes whereas Word clustering groups words,
not their occurrences.
• NP clustering computes similarity among the samples using distance measures in
euclidean space. Word Clustering uses proximity between the words in the text to
group them.
• NP clustering uses the traditional Hierarchical clustering whereas Word Clusters are
obtained by partitioning the word association graph.
Precision and Recall
Table 6.1 shows the precision and recall values for different clustering algorithms. Recall
doesn’t vary significantly among the algorithms. Word Clustering method results in slightly
less recall compared to HAC algorithms. Only single linkage HAC gets a 5% higher recall
than WC method but it doesn’t give good precision values.
It is evident from the results presented in the Table 6.1 that NP clustering gets better
partial precision but results in significantly less number of full matches compared to Word
clustering. Table 6.1 shows that NP clustering produces around 37% full matches which
means that only 43% of the partial attributes are full matches. On the other hand, Word
clustering produces around 49% full matches which means that 62% of partial matches
are actually full matches. Thus Word clustering outperforms NP clustering in finding full
matches by a margin of 19%. A more detailed analysis on the attributes extracted by NP
54
Page 66
CHAPTER 6. EXPERIMENTS AND RESULTS
clustering method gave more insight into the reasons for this.
• One of the reasons for reduction in full matches with NP clustering is repetition
of phrases across descriptions. For some attributes, the value remains the same for
most of the products in the class which result in same phrase occurring in multiple
descriptions. For example, most of the “Electric Guitar” varieties in the dataset have
Maple Neck. Here Neck is an attribute of Electric Guitar and its value is Maple. This
results in our extraction algorithm extracting Maple Neck instead of Neck.
• Ideally NP clustering should group all the occurrences of an attribute in a single
cluster. But in some cases, it results in multiple small clusters instead of one big
cluster. Each such small cluster contains occurrences of the attribute for a subset of
values and the extractor finds an output attribute from its phrases. This might result in
augmentation of part of value to the attribute. For example, Table 6.5 shows attributes
extracted by NP clustering method and Word clustering method for Acoustic Guitars.
NP clustering has produced two different clusters for Top and resulted in two partial
matches: Spruce Top and Betula Top. Similarly, it has generated two clusters for
Neck and extracted Mahogany Neck and Nato Neck. Multiple partial attributes for
a single gold standard attribute of this kind not only decrease the full precision, but
also degrade the quality of the attributes.
• NP clustering doesn’t result in good clusters if an attribute appears in long phrases
and the attribute is small (unigram or bigram). This is a special case of multiple clus-
ters mentioned above which would lead to partial matches instead of full matches.
Excessive partial matches also degrade the quality of the output attributes. All the above
reasons result in few full matches with the NP clustering methods. However, Word clus-
tering method does not suffer from the above problems and extracts more fully matching
attributes. This can be easily understood from the way it works. Unlike the NP cluster-
ing method, it groups words instead of their occurrences. So, a word can appear in only
55
Page 67
CHAPTER 6. EXPERIMENTS AND RESULTS
one cluster and only one attribute. Thus, a gold standard attribute can appear in only one
output attribute either as a full match or a partial match but it cannot appear in multiple
attributes as partial matches. Table 6.5 shows attributes produced by NP clustering and
word clustering methods for product class Acoustic Guitar.
Synonyms
It is common for attributes to have synonyms and thus different words could be used in
different product descriptions to refer to the same attribute. For example, “screen” and
“display” are used while describing Digital Cameras. The methods proposed in this work
are focused on only extraction of attributes and are not adapted to handle synonyms in at-
tributes. However, we have performed a subjective analysis to understand how our extrac-
tion methods handle the synonyms since synonyms form an interesting subset of attributes.
We have analysed the attributes generated by both the extraction methods separately.
The NP clustering approach has produced separate clusters for synonyms in most cases and
thus treated them as independent attributes. But the word clustering approach has identified
only one of the synonyms. This could be easily understood from the way the method works.
Since, the method groups the words in the graph, all the synonymous words of an attribute
are strongly connected and fall into same group. But the attribute identification method
explained in Section 4.4 extracts only the top scoring n-gram from a word cluster. So only
one variant among the synonyms of the attribute is extracted from the cluster and other
synonyms in the group are ignored.
56
Page 68
CHAPTER 6. EXPERIMENTS AND RESULTS
NP Clustering
Betula Top* Bridge Deluxe Semi Rigid
Fingerboard Fretboard Frets
Geared Tuning* Gig Bag Linden Binding
Mahogany Neck* Nato Neck Nut Width
Package Perfect Toy Picks
Pitch Pipe Scale Length Sides
Size Chord Chart* Spruce Top* Steel Strings*
Strap Button Strings Tuning Machines*
Zipper Closure
Word Clustering
Back Bag Binding
Body Chord Chart Deluxe Semirigid
Design DVD Fingerboard
Finish Frets Guitar
Includes Length Model
Neck Nut Width Package
Pitch Pipe Rosewood Fretboard* Strap Button
Strings Style Tone
Top Tuning Wood Construction*
Zipper Closure
* Partial Matches
Table 6.5 Attributes extracted by NP Clustering and Word Clustering Methods forAcoustic Guitars
Extracted Attributes Useful Attributes
iPods 32 18
Camcorders 32 19.2
Digital SLR Camera 31 18.4
Avg. 31.7 18.5
Table 6.6 No. of Attributes picked in Experiment
57
Page 69
CHAPTER 6. EXPERIMENTS AND RESULTS
6.4 Ranking Experiments
In this section, we explain the experiments conducted to evaluate our ranking algorithm.
We have conducted a user study to get user preferences on attributes important for product
comparison. We have used these user preferences to evaluate our ranking algorithm. We
have also conducted experiments to compare the performance of the individual ranking
features.
6.4.1 User Study
The rational behind the design of the comparative summary is that it should assist con-
sumers in selecting a product while purchasing. A consumer looking for a product can
use the comparative summary to make quick comparisons between the different models
available and choose the one that best fits his requirements. Thus the goal of our attribute
ranking algorithm is to find attributes of interest to a user while comparing products. To
verify if the our algorithm actually finds attributes of interest to users, we have conducted
a small scale experiment. User preferences on attributes are taken and they are compared
to the results of our algorithm.
Users
10 users have participated in this experiment. All the users are either under graduate or
post graduate students of computer science.
58
Page 70
CHAPTER 6. EXPERIMENTS AND RESULTS
Rank Digital SLRs Acoustic Guitars Kettles
1 accessories tuning machines limited warranty*
2 sensor chord chart spout
3 resolution deluxe semirigid switch
4 improved autofocus * rosewood fretboard * design
5 style settings pitch pipe interior
6 lcd monitor* finish housing
7 screen protectors back shutoff
8 display strings gauge
9 image stabilization wood construction* quarts
10 image retouching bag lid
* indicates a partial match
Table 6.7 Ranked Attributes
Task
Three product classes are selected for this experiment : {“Digital SLR”, “iPods”, “Cam-
corders”}. These three product classes are carefully selected from our dataset since they
are commonly used and thus familiar to everyone. This ensures that there is no bias in
users’ choice because of lack of knowledge about the products. Each user participating in
the experiment was given a list of attributes produced by our Word clustering Algorithm
for each product class. They were asked to pick attributes which according to them are
important while choosing a product for purchase. Users were asked to ignore errors in the
attribute lists. Since the importance of an attribute is subjective, the number of important
attributes for a product can vary from product to product and user to user. So, no restriction
was put on the maximum or minimum number of attributes they can pick. We refer to the
attributes selected by the users as Useful Attributes.
59
Page 71
CHAPTER 6. EXPERIMENTS AND RESULTS
Figure 6.1 Complementary Cumulative Distribution of Useful Attributes in Rela-tion to Number of User Selections
Results
Our extraction system has extracted 120 attributes for the three products of which 95 are
partial matches and rest are errors. Each user picked 18.5 attributes per product on an
average which accounts to 46.4% of extracted attributes. Table 6.6 gives the number of
attributes extracted by our method and the number of attributes the users have picked from
them for each product.
The plot in Fig. 6.1 shows the complementary cumulative distribution for the random
variable X representing number of user selections which varies between 0 to 10. It gives
the percentage of useful attributes selected by at least x users. It depicts the agreement
among users in more detail. The plot shows the trends for all the products and also shows
the average for all products. 6.7% of attributes are selected by all users as useful. 35%
of attributes are selected by at least 70% users. This conforms with our hypothesis in
comparative summary design that a set of attributes exists which are considered important
60
Page 72
CHAPTER 6. EXPERIMENTS AND RESULTS
commonly by many users while selecting a product.
6.4.2 Ranking
We evaluate the effectiveness of our ranking algorithm presented in Chapter 5 by analysing
the ranking positions obtained by the Useful Attributes. Since the goal of ranking is to
order the attributes according to their usefulness in product comparisons, Useful Attributes
should be ranked higher than other attributes. To verify this, we plot the distribution of
Useful Attributes at various ranking positions which is shown in Fig. 6.2. A good ranking
algorithm should rank more number of Useful Attributes in higher position and few of them
in last ranks. Ideally, all the Useful Attributes should be ranked above all other attributes
and they should be equally distributed in the first 19 positions. From the plot, we observe
that the first 19 positions contain more Useful Attributes than the remaining positions. 48%
of Useful Attributes have appeared in first 19 positions where 26% have appeared in the
next 19 positions. This clearly shows that the ranking algorithm is able to rank more useful
attributes in higher positions.
Figure 6.2 Distribution of Useful Attributes at Various Ranking Positions
61
Page 73
CHAPTER 6. EXPERIMENTS AND RESULTS
6.4.3 Comparison of Ranking Features
The attribute ranking function we have explained in Chapter 5 uses three features pf , ce,
sp. To understand the effect of each individual feature on the ranking function, we ranked
the attributes using only one feature at a time as the ranking function. Let R be the ranking
function with optimized weights computed from least squares in Section 5.3.2. Let R1, R2
and R3 be ranking functions with only one individual features pf , ce, sp respectively.
R1 = pf(x) (6.4)
R2 = ce(x)
R3 = sp(x)
Figure 6.3 Distribution of Useful Attributes at various Ranking positions for Dif-ferent Ranking Features
The plot in Fig. 6.3 gives the percentage distribution of user selected attributes at the top
10 positions for the four ranking functions R, R1, R2 and R3. It can be observed from the62
Page 74
CHAPTER 6. EXPERIMENTS AND RESULTS
graph that R ranked more number of user-picked-attributes in the first 5 positions than R1,
R2 and R3. The ranking functions R, R1, R2 and R3 extract 14%, 7%, 8% and 7% of user
selected attributes respectively in the first 5 positions . The combined ranking function R
clearly outperforms the individual features by a margin of 100%. The difference decreases
from 6th to 10th positions. This proves that the combined feature ranking function R
performs better than individual feature ranking functions in identifying the most useful
attributes.
6.5 Summary
This chapter explained the various experiments conducted to evaluate the algorithms pre-
sented in this thesis. We have crawled descriptions of 40 products from the amazon e-
commerce portal. We have also manually prepared a set of reference attributes for each
of these products which are used for evaluation. Experiments can be divided into two
categories: 1. Extraction experiments and 2. Ranking Experiments. We have extracted at-
tributes using both the Noun phrase clustering and word clustering methods and compared
the effectiveness in extracting the attributes. We found that both the algorithms are effective
in extracting attributes. However, the word clustering method yields significant improve-
ments in precision compared to noun phrase clustering methods. We have explained why
word clustering performs better than NP clustering method in identifying the attributes.
We have conducted a user study to evaluate the usefulness of the attributes in product
comparison. Attributes extracted by our algorithms are given to users and select attributes
useful while purchasing that product. We then compared the top ranking attributes from
our algorithm with the useful attributes selected by users. Experiments showed that our
algorithm is efficient in identifying useful attributes.
63
Page 75
Chapter 7
Conclusions
In this thesis, we have studied problems in product information extraction. We have pre-
sented different solutions for the problems and evaluated them through experiments. We
conclude the thesis in this chapter with details about the contributions of the thesis and
directions for future work.
7.1 Contributions
In this thesis, we have proposed techniques for product information extraction and per-
formed thorough evaluation of our methods by conducting various experiments. We can
broadly classify our work into the following tasks
• Attribute Extraction
• Attribute Ranking
• Comparative Summary Generation
We have presented effective methods for each of the above tasks. We have also created
datasets for carrying out experiments and evaluate the methods. Our evaluation measures
64
Page 76
CHAPTER 7. CONCLUSIONS
are based on standard IE evaluation measures which are widely used in evaluating many
related applications [5, 3].
Most of the existing methods for attribute extraction are either domain specific or su-
pervised and require training data to build classifiers. We have presented two novel unsu-
pervised methods which do not require any training data or domain specific information.
Moreover, our methods do not require many input descriptions and are effective in extract-
ing attributes even from small collections of 50 descriptions. Both the approaches are based
on clustering and achieve 80% precision in partial matches as shown in Chapter 6.3.1. We
have also compared the two methods and presented detailed analysis on the advantages and
disadvantages of one method over the other. We have concluded that the word clustering
method achives significantly higher full precision than the NP clustering method.
In this work, we have defined attribute ranking in the context of product comparisons.
The goal of our ranking algorithm is to identify attributes useful in product comparison.
With this rational in mind we have come up with novel features for ranking the attributes.
We have conducted user study to find useful attributes for comparison. The results of this
study showed that users actually consider a subset of attributes to be important in product
selection. This conforms with the rationale behind our ranking features which assume that
there exists some attributes which help in comparison. We have evaluated the performance
of our ranking algorithm in identifying Useful Attributes and showed that our algorithm
ranks useful attributes in higher positions as explained in Section 6.4.
Most of the existing summarization techniques focus on providing informative content
by compressing the text from a set of documents. There are no efforts in summarization
literature which give comparisons on entities or events. We have defined a novel form
of summaries referred to as comparative summaries which provide comparative study of
multiple items belonging to same category. The purpose of a comparative summary is to
provide a quick, concise comparison on multiple items of a category. We have presented
a method for generating binary comparative summaries for products using the attribute
extraction and ranking methods discussed above. This is explained in greater detail in
65
Page 77
CHAPTER 7. CONCLUSIONS
Chapter 5.
7.2 Future Work
In this thesis, we have focused on extracting product attributes from text descriptions. A
very important and obvious extension of this work is value extraction. The methods pre-
sented here aim at extracting attributes for a product class. The unsupervised techniques
we have proposed for this task could be extended to extract values along with the attributes.
This would give attribute-value pairs for different products. Appending values to attributes
would also help in generation of valued comparative summaries which will be more infor-
mative than the binary comparative summaries.
An interesting direction of work is identification of relationships between attributes.
Attributes of some products can be further categorized and represented in a hierarchy.
For instance, “Cell Phone” has many attributes which can be grouped into: Dimensions
(Length, Width, Height), Display (Resolution, Colors, Type), Connectivity(Blue tooth, In-
frared, USB), Battery(Capacity, Talk time, Standby Time) etc. The graph clustering ap-
proach presented in this thesis is a good starting point for work in this direction. The
word graph provides a natural way of identifying relationships among the clusters and their
corresponding representative attributes.
This work has focused on attribute extraction from product descriptions which are short
with just few lines of text and incomplete sentences. However, there are other genres of text
in which descriptions could be available. Descriptions also exist in longer formats which
contain grammatically correct sentences and describe greater details about products. These
descriptions pose different challenges in extraction. The documents are more noisy but
they have the advantage of being grammatically correct which allows the use of existing
Natural Language Processing techniques. Extraction of attributes in this scenario requires
development of specialized techniques.
In this work, we have defined comparative summary and proposed techniques for au-
66
Page 78
CHAPTER 7. CONCLUSIONS
tomatically extracting them. Comparative summaries could be a very useful information
access tool in any domain which has comparable entities or events with structured proper-
ties and values. The solutions presented in this thesis are focused on generation for product
domain. This should encourage development of efficient methods for generating com-
parative summaries for other domains. There are many other domains where comparative
summaries can be useful like “Sports”, “People Search” etc. The techniques presented here
may not work directly in other domains but some of these ideas could be used in similar
applications.
67
Page 79
CHAPTER 7. CONCLUSIONS
Publications• “An Unsupervised Approach to Product Attribute Extraction.” Santosh Raju, Prasad
Pingali and Vasudeva Varma. Appeared at the 31st European Conference on Infor-
mation Retrieval (ECIR) - 2009.
• “A Graph Clustering Approach to Product Attribute Extraction.” Santosh Raju, Pra-
neeth Shistla, Vasudeva Varma. Appeared at the 4th Indian International Conference
on Artificial Intelligence (IICAI) - 2009.
68
Page 80
Bibliography
[1] http://trec.nist.gov/data/docs eng.html.
[2] Eugene Agichtein and Venkatesh Ganti. Mining reference tables for automatic textsegmentation. In KDD ’04: Proceedings of the tenth ACM SIGKDD internationalconference on Knowledge discovery and data mining, pages 20–29, New York, NY,USA, 2004. ACM.
[3] Eugene Agichtein and Luis Gravano. Snowball: extracting relations from large plain-text collections. In DL ’00: Proceedings of the fifth ACM conference on Digitallibraries, pages 85–94, New York, NY, USA, 2000. ACM.
[4] Chris Biemann. Chinese whispers - an efficient graph clustering algorithm and itsapplication to natural language processing problems. In Proceedings of TextGraphs:the Second Workshop on Graph Based Methods for Natural Language Processing,pages 73–80, New York City, 2006. Association for Computational Linguistics.
[5] Daniel M. Bikel, Scott Miller, Richard Schwartz, and Ralph Weischedel. Nymble:a high-performance learning name-finder. In Proceedings of the fifth conference onApplied natural language processing, pages 194–201, Morristown, NJ, USA, 1997.Association for Computational Linguistics.
[6] Vinayak Borkar, Kaustubh Deshmukh, and Sunita Sarawagi. Automatic segmentationof text into structured records. SIGMOD Rec., 30(2):175–186, 2001.
[7] Andrew Borthwick, John Sterling, Eugene Agichtein, and Ralph Grishman. Exploit-ing diverse knowledge sources via maximum entropy in named entity recognition. InIN PROCEEDINGS OF THE SIXTH WORKSHOP ON VERY LARGE CORPORA,pages 152–160, 1998.
[8] Eric Brill. Transformation-based error-driven learning and natural language process-ing: a case study in part-of-speech tagging. Comput. Linguist., 21(4):543–565, 1995.
[9] Michael J. Cafarella, Doug Downey, Stephen Soderland, and Oren Etzioni. Knowit-now: fast, scalable information extraction from the web. In HLT ’05: Proceedings ofthe conference on Human Language Technology and Empirical Methods in NaturalLanguage Processing, pages 563–570, Morristown, NJ, USA, 2005. Association forComputational Linguistics.
69
Page 81
BIBLIOGRAPHY
[10] Mary Elaine Califf and Raymond J. Mooney. Relational learning of pattern-matchrules for information extraction. In AAAI ’99/IAAI ’99: Proceedings of the sixteenthnational conference on Artificial intelligence and the eleventh Innovative applicationsof artificial intelligence conference innovative applications of artificial intelligence,pages 328–334, Menlo Park, CA, USA, 1999. American Association for ArtificialIntelligence.
[11] Mary Elaine Califf and Raymond J. Mooney. Bottom-up relational learning of patternmatching rules for information extraction, 2002.
[12] N. A. Chinchor. Overview of muc-7/met-2.
[13] Yejin Choi, Claire Cardie, Ellen Riloff, and Siddharth Patwardhan. Identifyingsources of opinions with conditional random fields and extraction patterns. In HLT’05: Proceedings of the conference on Human Language Technology and EmpiricalMethods in Natural Language Processing, pages 355–362, Morristown, NJ, USA,2005. Association for Computational Linguistics.
[14] Fabio Ciravegna. Adaptive information extraction from text by rule induction andgeneralisation.
[15] Thomas M. Cover and Joy A. Thomas. Elements of Information Theory (Wiley Seriesin Telecommunications and Signal Processing). Wiley-Interscience, 2006.
[16] H. Cunningham, D. Maynard, K. Bontcheva, and V. Tablan. Gate: A frameworkand graphical development environment for robust nlp tools and applications. InProceedings of the 40th Annual Meeting of the ACL, 2002.
[17] Ido Dagan, Zvika Marx, and Eli Shamir. Cross-dataset clustering: revealing corre-sponding themes across multiple corpora. In COLING-02: proceedings of the 6thconference on Natural language learning, pages 1–7, Morristown, NJ, USA, 2002.Association for Computational Linguistics.
[18] Oren Etzioni, Michele Banko, Stephen Soderland, and Daniel S. Weld. Open infor-mation extraction from the web. Commun. ACM, 51(12):68–74, 2008.
[19] Ronen Feldman, Benjamin Rosenfeld, and Moshe Fresko. Teg—a hybrid ap-proach to information extraction. Knowl. Inf. Syst., 9(1):1–18, 2006.
[20] Rayid Ghani, Katharina Probst, Yan Liu, Marko Krema, and Andrew Fano. Textmining for product attribute extraction. SIGKDD Explor. Newsl., 8(1):41–48, 2006.
[21] Ralph Grishman. Information extraction: Techniques and challenges. In SCIE ’97:International Summer School on Information Extraction, pages 10–27, London, UK,1997. Springer-Verlag.
70
Page 82
BIBLIOGRAPHY
[22] Ralph Grishman, Silja Huttunen, and Roman Yangarber. Information extraction forenhanced access to disease outbreak reports. J. of Biomedical Informatics, 35(4):236–246, 2002.
[23] Ralph Grishman and Beth Sundheim. Message understanding conference-6: a briefhistory. In Proceedings of the 16th conference on Computational linguistics, pages466–471, Morristown, NJ, USA, 1996. Association for Computational Linguistics.
[24] Sanda Harabagiu and Finley Lacatusu. Topic themes for multi-document summa-rization. In SIGIR ’05: Proceedings of the 28th annual international ACM SIGIRconference on Research and development in information retrieval, pages 202–209,New York, NY, USA, 2005. ACM.
[25] Sanda M. Harabagiu, Marius A. Pasca, and Steven J. Maiorano. Experiments withopen-domain textual question answering. In Proceedings of the 18th conference onComputational linguistics, pages 292–298, Morristown, NJ, USA, 2000. Associationfor Computational Linguistics.
[26] Jerry R. Hobbs, John Bear, David Israel, and Mabry Tyson. Fastus: A finite-stateprocessor for information extraction from real-world text. pages 1172–1178, 1993.
[27] Minqing Hu and Bing Liu. Mining and summarizing customer reviews. In KDD’04: Proceedings of the tenth ACM SIGKDD international conference on Knowledgediscovery and data mining, pages 168–177, New York, NY, USA, 2004. ACM.
[28] Anette Hulth. Improved automatic keyword extraction given more linguistic knowl-edge. In Proceedings of the 2003 conference on Empirical methods in natural lan-guage processing, pages 216–223, Morristown, NJ, USA, 2003. Association for Com-putational Linguistics.
[29] Ramon Ferrer i Cancho and Ricard V. Sol. The small world of human language. Pro-ceedings of The Royal Society of London. Series B, Biological Sciences, 268:2261–2266, 2001.
[30] T. S. Jayram, Rajasekar Krishnamurthy, Sriram Raghavan, ShivakumarVaithyanathan, and Huaiyu Zhu. Avatar information extraction system. IEEEData Eng. Bull., 29(1):40–48, 2006.
[31] Nitin Jindal and Bing Liu. Identifying comparative sentences in text documents. InSIGIR ’06: Proceedings of the 29th annual international ACM SIGIR conference onResearch and development in information retrieval, pages 244–251, New York, NY,USA, 2006. ACM.
[32] Ryan McDonald Kevin Lerman. Contrastive summarization: An experiment withconsumer reviews. In North American Chapter of the Association for ComputationalLinguistics - Human Language Technologies (NAACL HLT) 2009 ; Proceedings of theMain Conference, Boulder, USA, 2009. Association for Computational Linguistics.
71
Page 83
BIBLIOGRAPHY
[33] Cody Kwok, Oren Etzioni, and Daniel S. Weld. Scaling question answering to theweb. ACM Trans. Inf. Syst., 19(3):242–262, 2001.
[34] John D. Lafferty, Andrew McCallum, and Fernando C. N. Pereira. Conditional ran-dom fields: Probabilistic models for segmenting and labeling sequence data. In ICML’01: Proceedings of the Eighteenth International Conference on Machine Learning,pages 282–289, San Francisco, CA, USA, 2001. Morgan Kaufmann Publishers Inc.
[35] Dawn Lawrie, W. Bruce Croft, and Arnold Rosenberg. Finding topic words for hier-archical summarization. In SIGIR ’01: Proceedings of the 24th annual internationalACM SIGIR conference on Research and development in information retrieval, pages349–357, New York, NY, USA, 2001. ACM.
[36] Jimmy Lin. An exploration of the principles underlying redundancy-based factoidquestion answering. ACM Trans. Inf. Syst., 25(2):6, 2007.
[37] Robert Malouf. Markov models for language-independent named entity recognition.In COLING-02: proceedings of the 6th conference on Natural language learning,pages 1–4, Morristown, NJ, USA, 2002. Association for Computational Linguistics.
[38] Inderjeet Mani and Eric Bloedorn. Summarizing similarities and differences amongrelated documents. Inf. Retr., 1(1-2):35–67, 1999.
[39] Zvika Marx, Ido Dagan, and Eli Shamir. A generalized framework for revealinganalogous themes across related topics. In HLT ’05: Proceedings of the conferenceon Human Language Technology and Empirical Methods in Natural Language Pro-cessing, pages 979–986, Morristown, NJ, USA, 2005. Association for ComputationalLinguistics.
[40] Y. Matsuo and M. Ishizuka. Keyword extraction from a single document using wordco-occurrence statistical information. INTERNATIONAL JOURNAL ON ARTIFICIALINTELLIGENCE TOOLS, 13:157–170, 2004.
[41] Diana Maynard, Valentin Tablan, Cristian Ursu, Hamish Cunningham, and YorickWilks. Named entity recognition from diverse text types. In In Recent Advances inNatural Language Processing 2001 Conference, Tzigov Chark, 2001.
[42] Andrew McCallum, Dayne Freitag, and Fernando C. N. Pereira. Maximum entropymarkov models for information extraction and segmentation. In ICML ’00: Pro-ceedings of the Seventeenth International Conference on Machine Learning, pages591–598, San Francisco, CA, USA, 2000. Morgan Kaufmann Publishers Inc.
[43] Ion Muslea. Extraction patterns for information extraction tasks: A survey. In InAAAI-99 Workshop on Machine Learning for Information Extraction, pages 1–6,1999.
[44] NIST. Automatic content extraction (ace) program. 1998present.72
Page 84
BIBLIOGRAPHY
[45] Marius Pasca. Lightweight web-based fact repositories for textual question answer-ing. In CIKM ’07: Proceedings of the sixteenth ACM conference on Conference oninformation and knowledge management, pages 87–96, New York, NY, USA, 2007.ACM.
[46] Bo Pang and Lillian Lee. Opinion mining and sentiment analysis. Found. Trends Inf.Retr., 2(1-2):1–135, 2008.
[47] Bo Pang, Lillian Lee, and Shivakumar Vaithyanathan. Thumbs up?: sentiment clas-sification using machine learning techniques. In EMNLP ’02: Proceedings of theACL-02 conference on Empirical methods in natural language processing, pages 79–86, Morristown, NJ, USA, 2002. Association for Computational Linguistics.
[48] Fuchun Peng and Andrew McCallum. Accurate information extraction from researchpapers using conditional random fields. In HLT-NAACL04, pages 329–336, 2004.
[49] Leonid Peshkin and Avi Pfeffer. Bayesian information extraction network. In IJ-CAI’03: Proceedings of the 18th international joint conference on Artificial intelli-gence, pages 421–426, San Francisco, CA, USA, 2003. Morgan Kaufmann PublishersInc.
[50] Ana-Maria Popescu. Information extraction from unstructured web text. 2007.Adviser-Etzioni, Oren.
[51] Ana-Maria Popescu and Oren Etzioni. Extracting product features and opinions fromreviews. In HLT ’05: Proceedings of the conference on HLT and EMNLP. ACL,2005.
[52] M. F. Porter. An algorithm for suffix stripping. pages 313–316, 1997.
[53] J. R. Quinlan. Learning logical definitions from relations. Mach. Learn., 5(3):239–266, 1990.
[54] Dragomir R. Radev and Kathleen R. McKeown. Generating natural language sum-maries from multiple on-line sources. Comput. Linguist., 24(3):470–500, 1998.
[55] Adwait Ratnaparkhi. Learning to parse natural language with maximum entropy mod-els. Mach. Learn., 34(1-3):151–175, 1999.
[56] Frederick Reiss, Sriram Raghavan, Rajasekar Krishnamurthy, Huaiyu Zhu, and Shiv-akumar Vaithyanathan. An algebraic approach to rule-based information extraction.In ICDE ’08: Proceedings of the 2008 IEEE 24th International Conference on DataEngineering, pages 933–942, Washington, DC, USA, 2008. IEEE Computer Society.
[57] Ellen Riloff. Automatically constructing a dictionary for information extraction tasks.In In Proceedings of the Eleventh National Conference on Artificial Intelligence,pages 811–816. MIT Press, 1993.
73
Page 85
BIBLIOGRAPHY
[58] Mark Sanderson and Bruce Croft. Deriving concept hierarchies from text. In SI-GIR ’99: Proceedings of the 22nd annual international ACM SIGIR conference onResearch and development in information retrieval, pages 206–213, New York, NY,USA, 1999. ACM.
[59] Christopher Scaffidi, Kevin Bierhoff, Eric Chang, Mikhael Felker, Herman Ng, andChun Jin. Red opal: product-feature scoring from reviews. In EC ’07: Proceedingsof the 8th ACM conference on Electronic commerce, pages 182–191, New York, NY,USA, 2007. ACM.
[60] Kristie Seymore, Andrew Mccallum, and Ronald Rosenfeld. Learning hidden markovmodel structure for information extraction. In In AAAI 99 Workshop on MachineLearning for Information Extraction, pages 37–42, 1999.
[61] Warren Shen, AnHai Doan, Jeffrey F. Naughton, and Raghu Ramakrishnan. Declar-ative information extraction using datalog with embedded extraction predicates. InVLDB ’07: Proceedings of the 33rd international conference on Very large databases, pages 1033–1044. VLDB Endowment, 2007.
[62] Stephen Soderland. Learning information extraction rules for semi-structured andfree text. Mach. Learn., 34(1-3):233–272, 1999.
[63] Min Song, Il-Yeol Song, and Xiaohua Hu. Kpspotter: a flexible information gain-based keyphrase extraction system. In WIDM ’03: Proceedings of the 5th ACM in-ternational workshop on Web information and data management, pages 50–53, NewYork, NY, USA, 2003. ACM.
[64] Fabian M. Suchanek, Gjergji Kasneci, and Gerhard Weikum. Yago: A large ontologyfrom wikipedia and wordnet. Web Semant., 6(3):203–217, 2008.
[65] B. M. Sundheim. Overview of the third message understanding evaluation and con-ference. In Proc. of the Third Message Understanding Conference (MUC-3), pages3–16, San Diego, CA, 1991.
[66] J Tait. Automatic summarization of english texts. Ph.D. Dissertation, 1983.
[67] Erik F. Tjong Kim Sang and Fien De Meulder. Introduction to the conll-2003 sharedtask: language-independent named entity recognition. In Proceedings of the seventhconference on Natural language learning at HLT-NAACL 2003, pages 142–147, Mor-ristown, NJ, USA, 2003. Association for Computational Linguistics.
[68] Takashi Tomokiyo and Matthew Hurst. A language model approach to keyphrase ex-traction. In Proceedings of the ACL 2003 workshop on Multiword expressions, pages33–40, Morristown, NJ, USA, 2003. Association for Computational Linguistics.
[69] Jordi Turmo, Alicia Ageno, and Neus Catala. Adaptive information extraction. ACMComput. Surv., 38(2):4, 2006.
74
Page 86
BIBLIOGRAPHY
[70] Peter D. Turney. Learning algorithms for keyphrase extraction. Inf. Retr., 2(4):303–336, 2000.
[71] Peter D. Turney. Thumbs up or thumbs down?: semantic orientation applied to un-supervised classification of reviews. In ACL ’02: Proceedings of the 40th AnnualMeeting on Association for Computational Linguistics, pages 417–424, Morristown,NJ, USA, 2002. Association for Computational Linguistics.
[72] D. J. Watts. Small worlds : the dynamics of networks between order and randomness.1999.
[73] Daniel S. Weld, Raphael Hoffmann, and Fei Wu. Using wikipedia to bootstrap openinformation extraction. SIGMOD Rec., 37(4):62–68, 2008.
[74] Ian H. Witten, Gordon W. Paynter, Eibe Frank, Carl Gutwin, and Craig G. Nevill-Manning. Kea: practical automatic keyphrase extraction. In DL ’99: Proceedingsof the fourth ACM conference on Digital libraries, pages 254–255, New York, NY,USA, 1999. ACM.
[75] Tak-Lam Wong, Wai Lam, and Tik-Shun Wong. An unsupervised framework forextracting and normalizing product attributes from multiple web sites. In SIGIR ’08:Proceedings of the 31st annual international ACM SIGIR conference on Researchand development in information retrieval, pages 35–42, New York, NY, USA, 2008.ACM.
[76] Bo Wu, Xueqi Cheng, Yu Wang, Yan Guo, and Linhai Song. Simultaneous productattribute name and value extraction from web pages. In WI-IAT ’09: Proceedingsof the 2009 IEEE/WIC/ACM International Joint Conference on Web Intelligence andIntelligent Agent Technology, pages 295–298, Washington, DC, USA, 2009. IEEEComputer Society.
[77] Fei Wu and Daniel S. Weld. Automatically refining the wikipedia infobox ontology.In WWW ’08: Proceeding of the 17th international conference on World Wide Web,pages 635–644, New York, NY, USA, 2008. ACM.
[78] ChengXiang Zhai, Atulya Velivelli, and Bei Yu. A cross-collection mixture modelfor comparative text mining. In KDD ’04: Proceedings of the tenth ACM SIGKDDinternational conference on Knowledge discovery and data mining, pages 743–748,New York, NY, USA, 2004. ACM.
[79] Hongkun Zhao, Weiyi Meng, and Clement Yu. Mining templates from search resultrecords of search engines. In KDD ’07: Proceedings of the 13th ACM SIGKDDinternational conference on Knowledge discovery and data mining, pages 884–893,New York, NY, USA, 2007. ACM.
75
Page 87
BIBLIOGRAPHY
[80] Jun Zhu, Bo Zhang, Zaiqing Nie, Ji-Rong Wen, and Hsiao-Wuen Hon. Webpageunderstanding: an integrated approach. In KDD ’07: Proceedings of the 13th ACMSIGKDD international conference on Knowledge discovery and data mining, pages903–912, New York, NY, USA, 2007. ACM.
76