47
Product Innovation and Survival in a High-Tech Industry N° 2007-30 Octobre 2007 Roberto Fontana (University of Pavia) Lionel Nesta (OFCE)

Product Innovation and Survival in a High-Tech Industry
N° 2007-30 Octobre 2007
Roberto Fontana (University of Pavia)
Lionel Nesta (OFCE)

Product Innovation and Survival
in a High-Tech Industry
Roberto Fontana ∗
Lionel Nesta †
October 1, 2007
Abstract
We investigate the relationship between product innovation and firm sur-
vival for a sample of 121 firms in a high-tech industry. We find that location
near the technological frontier is an important determinant of firm survival.
Firms located near the frontier are also more likely to be acquired than to exit
by failure if they cannot survive. This suggests that product location in the
technology space acts as a signal of firm quality. Possessing a substantial stock
of intangible capital, on the other hand, determines neither exit via failure nor
exit via acquisition, although it increases the probability of surviving.
1 Introduction
Why do successful innovators exit the market? And how do they exit, by failing or
by being acquired? These are the two questions raised in this paper. Our answer is
based on the role of product innovation in shaping the survival rate of firms. Our
argument is that successful product innovation has a dual influence on firms’ life∗Department of Economics, University of Pavia, Via San Felice 5, 27100, Pavia, Italy and CE-
SPRI - Bocconi University, Via Sarfatti 25, 20139, Milan, Italy. Tel: +39 02 58 36 30 37; Fax: +3902 58 36 33 99. Email: [email protected]
†Observatoire Francais des Conjonctures Economiques, Departement de Recherche surl’Innovation et la Concurrence, 250, rue Albert Einstein, 06560 Valbonne - France. Tel: +33(0)4 93 95 42 39; Fax: +33 (0)4 93 65 37 98. Email: [email protected]
1

expectancy. On the one hand, product innovation is the result of strategic market
positioning whereby firms seek to gain a temporary monopoly by locating in an
unexploited segment of the market. Thus, the dominant effect of successful product
innovation should be to increase a firm’s survival rate. On the other hand, successful
product innovation provides an incentive for competitors to acquire the innovator,
either because the latter is a threat to the incumbents, or because it represents an
opportunity to assimilate rapidly a bundle of technical competencies which otherwise
would be time consuming to develop. Therefore, the second order effect of successful
product innovation should be ultimately to shorten a firm’s life duration.
We test this simple idea on a sample of 121 firms in a rapidly changing high
technology industry: the Local Area Networking (LAN) switch equipment industry.
We define successful product innovation as improvement that is located at or near the
quality frontier of the market. Having information on firms’ mode of exit, by failure
or by acquisition, we run a discrete time competing risk model to investigate the
relationship between the quality of the innovation - measured as the distance from
the technological frontier - and the firm outcome - exit by failure, by acquisition,
or remaining in business. We control for a series of other important factors such as
age, size, R&D intensity and mode of entry. We find that successful innovation has
a positive impact on the firm’s life expectancy. However provided that a successful
innovator exits the market, it does so by being acquired rather than by failing.
This general result suggests that mergers and acquisitions are key to moulding the
boundaries of firms, determining market competition and shaping the dynamics of
industries.
The paper is organized as follows. Section 2 provides a review of the literature
and some background information on the LAN switch industry. In Sections 3 and 4
we develop the econometric model and describe the data sources and the variables
that will be used in the empirical analysis. Subsection 4.1 presents the method
of hedonic prices used to measure distance to the quality frontier as a proxy for
successful innovators. Section 5 presents the results, which are discussed in Section
2

6. Section 7 concludes.
2 Literature Review and Industry Background
Schumpeterian competition as a process of innovation and selection is increasingly
viewed as the key to achieving sustained aggregate economic growth, by screening
out the least innovative firms and promoting the most agile ones (Caves, 1998).
When innovation is understood in terms of productivity growth, it has been shown
that exiting firms are mostly concentrated in the lowest part of the productivity
distribution, suggesting that markets contribute to aggregate productivity growth
by rightly selecting against inefficient firms (Baily, Hulten, and Campbell, 1992)1.
When innovation is understood more directly, for example, in terms of R&D in-
vestments or new product innovation, a more complex pattern emerges. In fast
changing industries, soon after entry firms have a lower probability of survival, but
once the initial period has been mastered, their life expectancy increases signifi-
cantly (Audretsch, 1995; Audretsch and Mahmood, 1999). Cefis and Marsili (2006)
find that after controlling for age and size, innovative firms are more likely to survive
than non- innovative firms. Finally, the timing of innovation (Christensen, Suarez,
and Utterback, 1998), commercial strategy and relatedness among business lines
(Mitchell, 1991; Willard and Cooper, 1985), and the nature of the technological
regime (Audretsch, 1991) have a strong influence on the life duration of new firms.
On the whole, the idea common to all these contributions is that innovative firms
should grow faster, be more profitable and ultimately survive for longer (Geroski,
1995).
Alongside this neat stylized fact, however, there are many examples of innovative
firms failing to survive. Indeed exit is far from being a homogeneous event. Although
most firms exit by failure, some exit as a result of acquisitions. Exit by acquisition
may be the result of innovators being too successful, at least from a technological
viewpoint. For competitors, they represent a threat and also an opportunity for
them to acquire valuable intangible capital and distinctive skills. However, few
3

analyses have investigated the case of firms that are innovative but fail, and even
fewer have looked at the links between innovation and mode of exit (Siegfried and
Evans, 1994). In her seminal work, Schary (1991) found that profitability is a
weak determinant of exit mode, and that firms’ characteristics, mainly related to
capital structure, should instead be examined. Interestingly, the predictive power of
firms’ characteristics varies depending on the mode of exit. Perez, Llopis, and Llopis
(2005), for instance, perform a competing risk analysis on a sample of manufacturing
firms in Spain. They find differences in the determinants of exit depending on the
modes (i.e. exit due to business failure as opposed to acquisition). In particular,
while the risk of failure declines with age and size, the risk of being acquired seems
to increase. Although they provide interesting insights into the nature and causes
of different modes of exit, none of these contributions stresses the role played by
innovation.
To our knowledge, the contribution by Cockbrun and Wagner (2007) is the only
one to address this issue explicitly. It looks at the survival of a sample of 356
Internet related firms in the aftermath of the dot-com bubble. Employing patent
applications as an indicator of innovativeness, they find that possessing a large patent
portfolio both increases the probability of survival and decreases the probability of
exiting via merger or acquisition. Only those firms with a large share of highly
cited patents are more likely to exit by acquisition. Given that citations are a good
indication of patent quality (Hall, Jaffe, and Trajtenberg, 2005), this switch in the
sign reveals that acquired companies provide intangible capital of economic value.
Yet this important result is only weakly significant from a statistical viewpoint, and
hard to interpret from an economic one. As the authors acknowledge, the correlation
between patenting and firm duration may reflect unobserved firm characteristics such
as the quality of the firm’s products and intangible assets other than the technology
itself.
In this paper, we focus on product innovation. Product innovation is interesting
for several reasons. On the one hand, product innovation, understood as strategic
4

market positioning, may confer on firms a competitive advantage, which boosts the
life duration of successful innovators. Despite the existence of a substantial the-
oretical literature (Bonanno, 1987; Brander and Eaton, 1984; Schmalensee, 1978),
comparatively less evidence has been provided on the relationship between market
positioning and firm survival. Stavins (1995), for instance, analyzes the determi-
nants of entry and exit in a sample of personal computer (PC) models and firms
between 1976 and 1988. In modelling survival in terms of probability of exiting the
market for both models and firms, she found that models produced by old firms
are more likely to survive in the market and that more innovative firms or firms
that introduce pioneering models, also experience higher survival rates. Greenstein
and Wade (1998) carried out a similar study on a sample of computer mainframes
between 1968 and 1982. Employing duration analysis, they found that older models
had a lower chance of surviving in the market. Interestingly they also found that the
hazard rate of the single model increases in the number of models in the adjacent
market segment suggesting, therefore, that location in crowded markets negatively
affects the likelihood of product survival.
On the other hand, product innovation is also a signal of firm quality (Bontems
and Meunier, 2006). Think, for example, of a market in which products are distin-
guished on the basis of their technological quality. High quality products are those
located near the technology frontier, thus, their market positioning reveals the qual-
ity of firms. In this context, high quality firms are very likely to become acquisition
targets for a variety of reasons. First, acquiring high quality firms represents an
opportunity for competitors to improve and expand their own productive resources
quickly. Analyzing acquisitions in the US medical sector, Karim and Mitchell (2000)
provide evidence that acquisitions enable buyers both to increase efficiency and to
stretch the boundaries of their pre-acquisition markets. In fact, the benefits from
acquisition are more likely to occur when there is good synergy between the assets of
the targeted and the acquiring firm. For example, Hall (1987) provides evidence of
a positive relationship between the R&D intensity of the acquiring and the targeted
5
firms.
Second, acquisition may be used to exclude potential rivals from preferential
positions in the market. In this case, the goal of the merger is not to increase
productivity or research efficiency, but to increase market power (Salant, Switzer,
and Reynolds, 1983), or even to preempt mergers by rival companies (Brito, 2003).
Barros, Brito, and de Lucena (2006) show that in the food retailing sector, mergers
have had a negative impact on the consumer surplus by raising post-merger con-
sumer prices. In highly dynamic sectors, young firms are more likely to be acquired
by incumbents because of the threat they pose to incumbents. In a case study of sci-
ence based firms in Sweden, Grandstrand and Sjolander (1990) provide preliminary
evidence that young firms are more likely to be acquired by incumbents. They also
provide evidence on the presence of competition among buyers, which increasingly
tends to drive down the age of acquired firms.
This paper provides an empirical investigation of the firm-level attributes deter-
mining firm exit from the market. By measuring product innovation on a vertical
quality scale, we characterize each firm by its distance from the quality frontier.
We investigate product innovation and firm survival in the Local Area Networking
(LAN) switch equipment industry. The LAN switch industry began in 1990 with
the invention of the first switch for data communication. Entry in the industry was
initially slow but it dramatically increased after 1993. Three different types of firms
fueled the entry process. First, incumbents from established markets (i.e. routers
and hubs) entered the switch industry. Second, there was participation from in-
cumbents outside the industry, but with experience either in telecommunications, in
semiconductor, or in the computer industry. Third, there were new firms searching
for new opportunities. These firms were generally highly innovative and founded
by entrepreneurs, who were either former academics or former employees in the
industry.
Entry was accompanied by an evolution in the technology, which culminated in
the opening up of two market segments (Fontana and Nesta, 2006). The high-end
6

segment included products characterized by high performance, targeted to customers
with large networks. The low-end segment encompassed lower performance switches
targeted to customers with small networks. The nature of the competition in the
two types of market segments was different. In the low-end segment, manufacturers
competed mainly on price. In the high-end segment, competition was mainly based
on the constant search for technical excellence and increased performance. Polar-
ization led to consolidation and to an increase in the rate of exit. Among the firms
that exited the industry, the vast majority were new firms, which were ultimately
acquired by incumbents. Indeed, for many of the new firms the opening up of the
switch market had initially represented an opportunity to enter a new niche. How-
ever, it was always clear that the chances of turning a new venture into a large firm
were very few. Indeed, in many cases, from the start firms had been ’designed to be
acquired’, generating an entirely new business model which became known as the
’acquisition-as-exit-strategy’ business model (Kenney and von Burg, 2000, 234)2.
In this paper we take the quality of a firm as the distance of its product(s) from
the technical frontier. We also include other firm level indicators such as age at entry
to the industry, size, R&D intensity, and pre-entry experience. We would expect
first that firm quality as measured by distance from the technological frontier to be
negatively associated with the probability of surviving. Second, we would expect
that for those firms that fail to survive, distance from the technological frontier
should decrease the probability of their being acquired. Third, we would expect a
positive relationship between possession of innovative capital and the probability of
surviving.
3 Econometric Models
We develop two sets of econometric models to evaluate the factors that affect the fate
of innovative firms. First, we estimate a standard discrete time duration model to
explain the probability of exit. Second, we apply a competing risk model to account
for heterogeneity in firm exit.
7

In the first set of models, we estimate a duration model for grouped data following
the approach first introduced by Prentice and Gloeckler (1978). Suppose there are
firms i = 1, . . . , N , that enter the industry at time t = 0. The hazard rate function
for firm i at time t and t = 1, , T is assumed to take the proportional hazard form:
θit = θ0(t) · X ′itβ, where θ0 (t) is the baseline hazard function and Xit is a series
of time-varying covariates summarizing observed differences between firms. The
discrete time formulation of the hazard of exit for firm i in time interval t is given
by a complementary log logistic function such as:
ht (Xit) = 1− exp{− exp
(X′itβ + θ(t)
)}(1)
where θ(t) is the baseline hazard function relating the hazard rate ht (Xit) at the tth
interval with the spell duration (Jenkins, 1995).
This model can be extended to account for unobserved, but systematic differences
between firms. Suppose that unobserved heterogeneity is described by a random
variable εi independent of Xit. The proportional hazard form with unobserved
heterogeneity can now be written as :
ht (Xit) = 1− exp{− exp
(X′itβ + θ(t)
)+ εi
}(2)
where εi is an unobserved individual-specific error term with zero mean, uncorrelated
with the X’s. Model (2) can be estimated using standard random effects panel
data methods for a binary dependent variable, under the assumption that some
distribution is provided for the unobserved term. In our case, we will assume that
the εi are distributed Normal and Gamma. Assuming that εi is Gamma distributed
with mean one and variance v, the log-likelihood function can be written as:
log L =N∑
i=1
log (1− ci) ·Ai + ci ·Bi (3)
where
8

Ai =
[1 + v
Ti∑
ti=1
exp(X′itβ + θ(t)
)]−(1/v)
and
Bi =
[1 + v
Ti−1∑
ti=1
exp(X′itβ + θ(t)
)]−(1/v)
, if ti > 1 or
Bi = 1−Ai , if ti = 1.
where ci is an indicator variable taking unity for firms exiting the market, 0 other-
wise, and ti is the discrete time hazard rate for person i in each duration interval
ti = 1, . . . , Ti. The parameters v and β are to be estimated. Note that the pro-
portional hazards form without heterogeneity is the limiting case as v → 0. The
relevance of the estimated unobserved heterogeneity is tested directly by the sig-
nificance of parameter v. In addition, we perform a likelihood ratio test between
the unrestricted model (with unobserved heterogeneity) and the restricted model
(without unobserved heterogeneity). The reported estimates are chosen from the
LR test.
In the second set of models, we relax the assumption of homogeneous exit by
accounting for the mode of exit, namely firm failure, or firm buy-out. The exten-
sion of the standard pooled duration model to two exit forms is referred to as the
Competing Risks Model (CRM) (Jenkins, 2004). The two destinations are treated
as independent, so the probability of exit by failure is assumed not to depend on
the probability of exit by acquisition. We consider that these two alternatives can
in fact be viewed as contrasting, one points to a ’positive’ event (firm buy-out), the
other to lack of economic viability (firm failure). In practical terms, the indepen-
dent competing risk framework treats both exits as right censored Lancaster (1990);
Jenkins (2004). That is, we estimate the following complementary log logistic model
similar to 1, but allowing the full set of parameters to vary according to the different
destinations:
9

ht (Xijt) = 1− exp{− exp
(X′itβj + θj(t)
)}(4)
where, in our case j = 1 or 2 respectively, depending on the mode of exit. Finally, a
caveat to the interpretation of the coefficient estimates. In CMR, interpretation of
the coefficients is not always as straightforward as in the case of the pooled model
because the results depend on all the parameters in the model. If the CRM has a
proportional hazard form, as is the case in Eq.4, then an increase in X will increase
the conditional probability of exit, for instance, by firm failure if the estimated coef-
ficient for the hazard rate of firm failure is bigger than the corresponding coefficient
for the hazard rate of firm buy-out (Thomas, 1996). If we assume that we have
intrinsically discrete time data, Eq.4 can be estimated using a ’multinomial logit’
CRM.
We also test whether the two forms of exit, firm failure and firm buy-out, are
behaviorally distinct rather than simply incidental. This is equivalent to the null
hypothesis of equality for all parameters (except intercepts in the models for the
destination-specific hazard). Narendranathan and Stewart (1991) show that for con-
tinuous time PH models, a test of whether exits to different states are behaviorally
distinct (rather than simply incidental) corresponds to a particular set of restric-
tions: equality of all parameters except intercepts in the models for the destination-
specific hazards. The test statistic is 2[ln (LCR)− ln (LSR)−∑j nj ln (pj)], where
ln(LCR) is the maximized log-likelihood from the competing risk model (the sum of
those from the component models), ln(LSR) is the maximized log-likelihood from
the single-risk model, nj is the number of exits to state j and pj = nj/∑
j nj ,
where there are j = 1, . . . , j destination states. This test statistic is Chi-squared
distributed with degrees of freedom equal to the number of restrictions.
10

4 Data
We investigate a sample of 121 firms in the LAN switch industry. All firms in our
sample are ’innovative’ in the sense that they have introduced at least one piece of
switch equipment since 1990, the year that the first switch was marketed. For each
firm in our dataset we have information on date of entry and exit from the switch
industry and number of switches introduced. For each new switch introduced we
have information on price and technical characteristics. Information on firm entry
and exit dates was gathered from a variety of sources such as the D&B Million
Dollar Database and Lexis-Nexis. Additional information on the firms’ backgrounds
and founders was gathered by searching publicly available databases that aggregate
news and press releases, such as ABI-Inform, and annual reports gathered from the
Thomson Research (Global Access) database.
Information on the type of exit (i.e. whether a firm survived or exited either
by acquisition or failure at the end of the period) was obtained from a review
of announcements in the specialized trade press and information contained in the
CORPTECH database. Data on product characteristics and prices for switches, and
also for hubs and routers were obtained from an original dataset of 1,825 LAN prod-
ucts (536 switches, 535 hubs, and 754 routers) marketed between 1990 and 1999).
The dataset was constructed using information from specialized trade journals (Net-
work World and Data Communications), which periodically publish Buyers’ Guides
and details on new product introductions. This information was double checked,
with press communications and product announcements released by manufacturers.
After consolidation we have a sample of 121 firms that together marketed a total of
503 switch products.
4.1 Measuring Firm Quality Through Product Differentiation
In this paper, we argue that product differentiation should be considered an im-
portant explanatory variable of the fate of firms when exit is not considered to be
a homogeneous event. We measure product differentiation in terms of firm loca-
11
tion with respect to the technological frontier at time of entry, using the generic
technological characteristics of the products in the switch market. Indeed for each
product our dataset reports information on its technical characteristics, date of mar-
ket introduction and list price. To measure distances from the quality frontier we
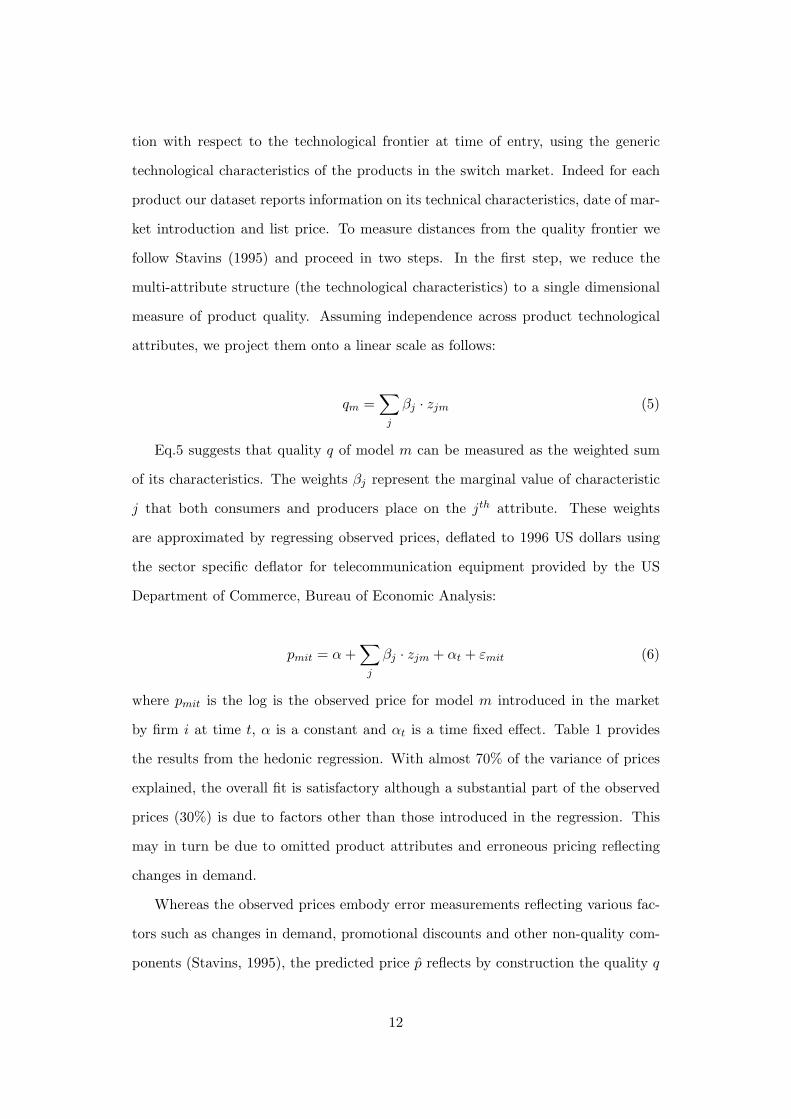
follow Stavins (1995) and proceed in two steps. In the first step, we reduce the
multi-attribute structure (the technological characteristics) to a single dimensional
measure of product quality. Assuming independence across product technological
attributes, we project them onto a linear scale as follows:
qm =∑
j
βj · zjm (5)
Eq.5 suggests that quality q of model m can be measured as the weighted sum
of its characteristics. The weights βj represent the marginal value of characteristic
j that both consumers and producers place on the jth attribute. These weights
are approximated by regressing observed prices, deflated to 1996 US dollars using
the sector specific deflator for telecommunication equipment provided by the US
Department of Commerce, Bureau of Economic Analysis:
pmit = α +∑
j
βj · zjm + αt + εmit (6)
where pmit is the log is the observed price for model m introduced in the market
by firm i at time t, α is a constant and αt is a time fixed effect. Table 1 provides
the results from the hedonic regression. With almost 70% of the variance of prices
explained, the overall fit is satisfactory although a substantial part of the observed
prices (30%) is due to factors other than those introduced in the regression. This
may in turn be due to omitted product attributes and erroneous pricing reflecting
changes in demand.
Whereas the observed prices embody error measurements reflecting various fac-
tors such as changes in demand, promotional discounts and other non-quality com-
ponents (Stavins, 1995), the predicted price p reflects by construction the quality q
12

of the product. Thus we posit:
qmit = pmit (7)
Eq.7 states that ranking predicted prices is tantamount to ranking products ac-
cording to their quality. However, in order to more properly account for product
quality, we amend Eq.6 in two ways. First in Eq.6 the estimated weights are con-
strained to be constant overtime, whereas the technology in the switch market is
likely to have evolved over time. This suggests that depending on significant changes
in product quality in the 1990s, the pooled regression may produce inexact weights.
Therefore, we interact all explanatory variables with year dummy variables, in order
to allow the weights βj to vary with time. Second we include a firm fixed effect µi
to control for heterogeneity in the firms’ pricing practices.
[Table 1 about here.]
For example, positive values of µi can be interpreted as persistent over-pricing,
i.e. a firm mark-up beyond and above marginal utility (from the consumer’s view-
point) or marginal product (from the producer’s viewpoint). The important point
here is that values of µi provide information on the firms’ pricing practices, not on
product quality. Therefore, we subtract µi from the predicted price p. Based on the
previous paragraph, we amend Eqs.6 and 7 as follows:
p′mit = α +
∑t
∑
j
βtj · (ztjm × αt) + αt + µi + εmit (8)
q′mit = p
′mit − µi (9)
Including the full vector of explanatory variables as specified in Eq.8 yields an
increased r2 of 0.85, implying that accounting for changes in the marginal values of
product characteristics and firm mark-ups explains a significant share of the variance
of observed prices in the LAN Switch market.
13
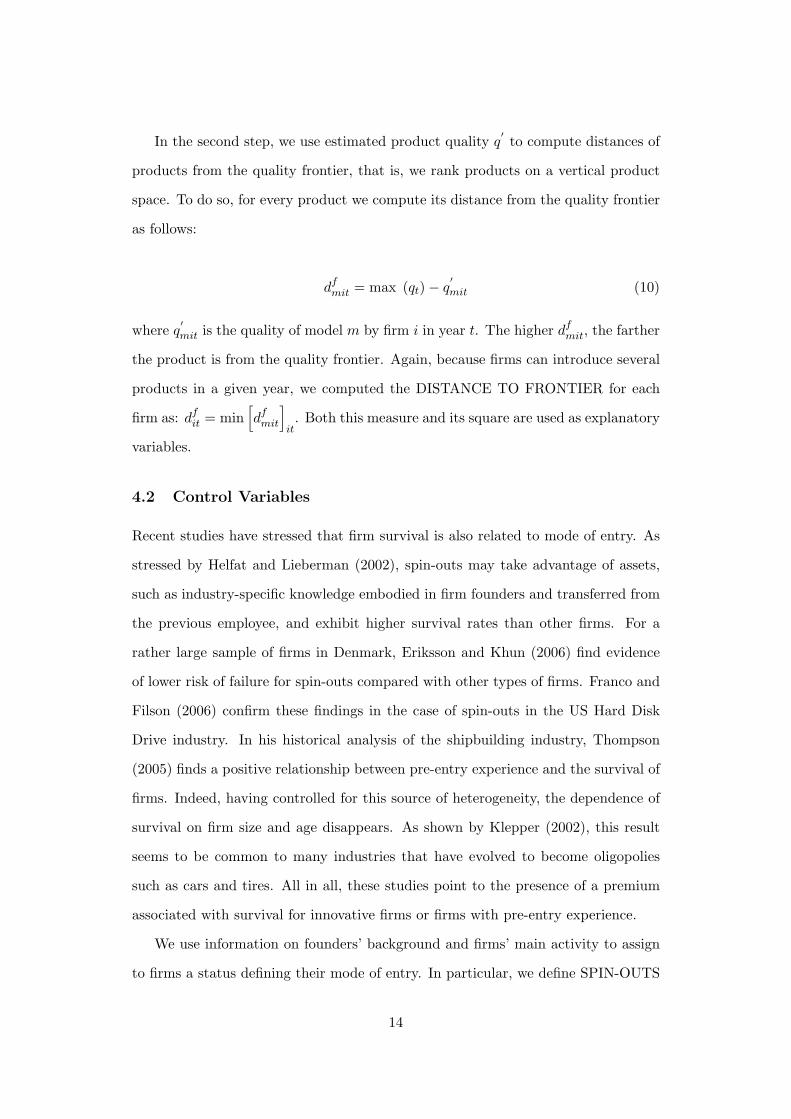
In the second step, we use estimated product quality q′to compute distances of
products from the quality frontier, that is, we rank products on a vertical product
space. To do so, for every product we compute its distance from the quality frontier
as follows:
dfmit = max (qt)− q
′mit (10)
where q′mit is the quality of model m by firm i in year t. The higher df
mit, the farther
the product is from the quality frontier. Again, because firms can introduce several
products in a given year, we computed the DISTANCE TO FRONTIER for each
firm as: dfit = min
[df
mit
]it. Both this measure and its square are used as explanatory
variables.
4.2 Control Variables
Recent studies have stressed that firm survival is also related to mode of entry. As
stressed by Helfat and Lieberman (2002), spin-outs may take advantage of assets,
such as industry-specific knowledge embodied in firm founders and transferred from
the previous employee, and exhibit higher survival rates than other firms. For a
rather large sample of firms in Denmark, Eriksson and Khun (2006) find evidence
of lower risk of failure for spin-outs compared with other types of firms. Franco and
Filson (2006) confirm these findings in the case of spin-outs in the US Hard Disk
Drive industry. In his historical analysis of the shipbuilding industry, Thompson
(2005) finds a positive relationship between pre-entry experience and the survival of
firms. Indeed, having controlled for this source of heterogeneity, the dependence of
survival on firm size and age disappears. As shown by Klepper (2002), this result
seems to be common to many industries that have evolved to become oligopolies
such as cars and tires. All in all, these studies point to the presence of a premium
associated with survival for innovative firms or firms with pre-entry experience.
We use information on founders’ background and firms’ main activity to assign
to firms a status defining their mode of entry. In particular, we define SPIN-OUTS
14

as those firms whose main line of business is the LAN industry. This includes cases
where the founder(s) were already employed in the LAN industry in the year prior
to the founding of the new company, and university spin-offs. We define DIVER-
SIFIERS as firms whose founder(s) had no prior experience in the LAN industry
and whose main line of business was outside the LAN industry (i.e. computer,
semiconductor etc.) at the time of entry into the switch market.
These definitions are used to provide some preliminary evidence on the relation-
ship between mode of entry and survival. Figure 1 depicts proportions of surviving
firms in relation to years in the market , distinguishing by mode of entry. We can
see that Diversifiers have the highest survival rate with more than 40% of firms
surviving until the end of the period.
[Figure 1 about here.]
This evidence seems inconsistent with previous results which stress the advan-
tages of pre-entry experience in terms of survival (Thompson, 2005). Spin-outs
benefit from greater pre-entry experience and should display higher survival rates
after entry into the switch market. Klepper (2002) argues that at a given age, early
entrants and firms with pre-entry experience should display a higher survival rates
than late entrants and firms with no experience. However, for innovative firms, be-
ing experienced might be a ’double edged sword’ in the sense of making them liable
to being bought-out by competitors. This is particularly true in contexts, such as
the LAN switch industry, characterized by rapid technical change, which means that
competitors do not have time to develop the capabilities to catch up with innovators.
We identify three possible modes of exit: Failure (i.e. bankruptcy), Buy-out (i.e.
acquisition), and Survival. Table 2 reports the relationship between modes of entry
and modes of exit for the firms in our sample. We note two things.
[Table 2 about here.]
First, more than two thirds (69%) of the firms in our sample exited the LAN
switch industry after entry. The majority of these were Spin-outs. Second, Spin-
15

outs exit mostly as a result of acquisition. Among the survivors, Spin-outs are
the largest share of the total although almost half of Diversifiers survive. This
preliminary evidence suggests that although firms with greater pre-entry experience
constitute most of the survivors, those that exit generally tend to be bought-out,
thus indicating that their fate may be linked to their status and that exit should
not be rated as a homogeneous event. The Chi-square statistics are not significant
leading us to retain the null hypothesis of independence between modes of entry
and modes of exit. However, this result should be interpreted with care due to low
expected frequencies.
In addition to pre-entry experience, the extensive empirical literature on firm
survival points to firm size and age as the prime determinants of firm selection
(Dunne, Roberts, and Samuelson, 1988; Audretsch, 1997). Mata and Portugal (1994)
and Mata, Portugal, and Guimaraes (1995) provide evidence on the complex nature
of the relationship between firm age and survival. While the probability of survival
seems to increase for older firms, the relationship is not so clear for young firms.
Honjo (2000), investigating the post-entry performance of a sample of Japanese
firms, found a negative effect of firm size on exit due to business failure, and a positive
one for firm age. We therefore introduce additional explanatory variables in order
to capture the role of firm level variables, such as size and age, in firm survival. The
size variable (SIZE) is constructed as the logarithm of the total number of employees
at time of entry. We define AGE AT ENTRY as the number of years at the time
of entry in the switch market, since the firm was institutionally born3. We also add
R&D Intensity (R&D INTENSITY) as a measure of innovative capital. This variable
is constructed as the share of R&D expenditures in total revenues, at time of entry,
and can be interpreted as knowledge capital at time of entry, similar to ? patent
stock measure (see Griliches and Mairesse (1998)). It is important to note that after
accounting for revealed firm quality through product differentiation, mode of entry,
intangible capital and firm size, the variable AGE AT ENTRY captures two effects:
(i) the combined influence of availability of financial resources and diversification in
16

the firm’s product portfolio; (ii) a residual unobserved heterogeneity effect, related
essentially to the firm’s past experience in doing business, implying that older firms
are more able to survive in their economic environment. Finally, to capture the
effect of industry life cycle on firm survival (Klepper and Simmons, 2005), we add
two industry level variables. ENTRY RATE and EXIT RATE are the number of
new firms and the number of firms exiting the switch industry respectively. Both
variables are based on the year preceding entry.
[Table 3 about here.]
Summary descriptive statistics for these explanatory variables are reported in
Table 3. In all these regressions, we consider 121 firms, of which 83 eventually exit
the industry. All firm level variables take values at the time when the firm enters the
industry. All duration models include a full vector of entry-year dummy variables.
Expanding the dataset by time intervals yields a total of 600 observations.
5 The Determinants of Market Selection in The LAN
Industry
We use a discrete time duration model with a Weibull hazard function to understand
the impact of product differentiation on firm survival. Several models have been
estimated. In these models the explanatory variables are introduced in sequence
and exit is treated as a homogeneous event. We check the robustness of our analysis
by employing different types of hazard functions and controlling for unobserved
heterogeneity. Finally, we extend the analysis to account for heterogeneity of exit
by estimating a ’multinomial logit’ CRM.
5.1 Preliminary Results
Six models were estimated using a discrete time duration model with a Weibull
hazard function (see Table 4). In the first model we look at the impact of time
duration on the hazard rate of exit. We then sequentially add AGE AT ENTRY
17

and SIZE, firm location in the vertical product space (DISTANCE TO FRONTIER),
innovative capital (R&D INTENSITY), mode of entry (SPIN-OUT), ENTRY and
EXIT RATE.
[Table 4 about here.]
Columns (1) and (2) report the results for the baseline hazard function together
with our controls for age and size. In column (1), we observe negative time duration,
in line with existing work on firm survival (Audretsch, 1995). This result is robust
to the subsequent addition of control variables. In the full specification in Column
(6), one standard deviation around the mean of the log of time implies a reduction in
the probability of exit of more than 50%. In Column (2) the negative and significant
coefficient of AGE AT ENTRY indicates that older firms have a lower probability of
leaving the industry. At first, the marginal effect may look small given that, in the
full model, a one-year increment around the mean age at entry is associated with
a reduction of only 5% in the probability of exit. However, when we compare two
firms - one at the 10th and one at the 90th percentile (aged 1 and 28 respectively),
we observe that the former is five times as likely to exit the market at the end of
the period than the latter. Thus, as expected, entry age is extremely critical to firm
survival. As in most of the literature on firm survival, the coefficient of SIZE is
negative, although not significant in models (2) and (3). However in the full model,
the negative sign is bigger and highly significant: one standard deviation around the
sample mean size entails a 43% reduction in the probability of exit.
The impact of product differentiation as measured by position of the firm with
respect to the technological frontier is estimated in Column (3). Based on previous
results (Fontana and Nesta, 2006), we assume a non-linear relationship between
product quality and survival and we enter both DISTANCE TO FRONTIER and
its squared value. DISTANCE TO FRONTIER is positive, indicating that firms
capable of being close to the frontier have a relatively higher probability of surviving.
However, the negative and significant coefficient of the squared value suggests that
the relation is non-linear and that exits mainly occur among firms located in the
18

middle of the market. This is a good reflection of the situation in the switch market
during the 1990s, which was polarized between high-end and low-end. At the high
end of the market firms compete to be at the frontier and those that lag behind do
not survive. At the low end competition occurs at the boundaries with the high-
end of the market, where firms struggle to survive, while firms serving niches at the
bottom of the low end have a higher probability of surviving. Again, the sign of both
coefficients is robust to the introduction of additional control variables (specification
6).
It is worth noting the net marginal effects associated with distance to frontier
measures. For example, for the firm with mean product quality, the probability of
exit is twice as large as for the firm with a frontier product, i.e. its hazard rate of
exit is multiplied by a factor of 2.1 (+115%). Interestingly, the non-linear estimates
implies that for 23% of the firms in the sample - those located far from the frontier -
the net effect is to actually reinforce firm survival compared to firms at the frontier.
This result suggests that firms at the low end of the market specialize in niche
products in order to escape the huge of competition from product innovation in the
high-end segment. Thus, three important conclusions can be drawn: (i) the effect of
product quality on firm survival is very large, much larger, in fact, than that of the
usual firm characteristics such as size and age; (ii) the effect of product quality on
firm survival is highly non-linear, in line with the idea of a two-tier market structure
where firms located in the middle of the market are the least likely to survive and
make it to the next round; (iii) locating in the low-end of the market appears to pay
for a quarter of the firms in the sample.
We next control for the role of intangible capital stock and mode of entry sep-
arately. In Column (4), R&D INTENSITY enters with a significant negative sign,
suggesting that possessing a higher stock of innovative capital reduces the proba-
bility of leaving the industry (by 30% at the margin). It is interesting to note that
accounting for intangible capital makes both SIZE and DISTANCE TO FRONTIER
significant (at the 10% and 5% levels, respectively). This reveals a complex mix of
19

the effect of size, stock of innovative capital and product differentiation within firms,
such that life duration analysis should adequately account for them all. We control
for mode of entry in Column (5). The variable SPIN-OUT enters negatively and
significantly indicating that firms’ with higher pre-entry experience have a relatively
lower probability of exiting the switch industry. The marginal effect is actually quite
large, since spin-outs enjoy a hazard rate of exit 70% lower than diversifiers. Lastly,
in model (6) we add the industry level controls. Though the coefficients show the
expected sign, they are weakly significant or not at all significant in the case of EXIT
RATE.
Altogether the sample is behaving as expected. First, product differentiation,
as measured by firm location with respect to the technological frontier, matters for
survival. In particular, firms located close to the technological frontier have a better
post entry performance in terms of probability of surviving. The relationship is
not linear, implying that locating far from the frontier may be a beneficial survival
strategy. Second, possessing innovative capital increases the probability of surviv-
ing. Third, pre-entry experience mainly reduces the probability of exit when exit
is considered a homogeneous event. Lastly, age and size also impact positively on
firms’ survival, as was expected from previous works.
5.2 Robustness Checks
We check the robustness of these results in Table 5, which provides alternative spec-
ifications for Column (6) . We carry out two types of robustness check. First,
we explore different specifications of the baseline hazard function. The polynomial
specification in Column (7) substantially confirms our previous results that both the
sign and magnitude of the parameter estimates are stable. The fully non-parametric
specification is reported in Column (8). This type of specification makes no as-
sumptions about the shape of the baseline hazard function and introduces a full
vector of year dummy variables rather than constraining the effect of duration to be
monotonic (Column 6) or polynomial (Column 7). Again, the signs and significance
20

levels of the coefficients are very stable, confirming the robustness of our results with
respect to different assumptions on the duration effect. Only ENTRY RATE loses
significance.
[Table 5 about here.]
Second, we control for unobserved heterogeneity by estimating a standard ran-
dom effect model for binary dependent variable with error terms. Estimates reported
in Columns (9) and (10) assume that error terms are normally distributed. Com-
pared to the previous models, this specification yields similar results for the sign
of the coefficients. In Column (11) we assume that the firm-specific terms are dis-
tributed gamma. In this specification all explanatory variables lose some significance
although the direction of the parameter estimates remains consistent. The test for
significant frailty (LR frailty test) suggests that unobserved heterogeneity is not im-
portant in our sample. Therefore, in what follows, we concentrate on modes of exit
and ignore the question of unobserved heterogeneity.
5.3 Product Differentiation and Modes of Exit
In industries characterized by rapid technical change where competitors may not
have the time to develop their capabilities, mergers and acquisitions are very fre-
quent and they cannot be treated the same as exit by failure. In these contexts
it is likely that product differentiation, pre entry experience, and intangible capital
influence both survival and, for those firms that do not survive, mode of exit. Our
short review of the existing empirical literature shows that this crucial aspect is
missing from many analyses of innovation and firms’ survival. To explore the rela-
tionships between product differentiation, pre entry experience, intangible capital,
and firm survival we now consider exit as being a heterogeneous event by running a
multinomial logit CRM (Table 6).
[Table 6 about here.]
21

Column (12) reports the results of the comparisons between the alternatives
of exiting by failure and surviving. DISTANCE TO FRONTIER has a positive
and significant coefficient suggesting that firms located relatively farther away from
the technological frontier do in fact have a higher probability of exiting by failure
than of surviving. Again, the relationship is non-linear as indicated by the negative
and significant coefficient of (DISTANCE TO FRONTIER)2. Choosing to locate
in the middle of the quality scale is the most dangerous strategy for firms, while
a positioning at either end - near the frontier or far from the frontier - may be
the right response to escape competition. Coefficients for AGE AT ENTRY, R&D
INTENSITY and SIZE are all negative and significant, indicating that bigger firms
with a large stock of innovative capital and better availability of financial capital
have a relatively higher probability of surviving. The coefficient of SPIN-OUT is also
negative and significant indicating that possessing pre-entry experience decreases
the probability of exiting by failure rather than surviving. Interestingly, none of
the industrial controls significantly affect the probability of failure when contrasted
with survival. Results of the comparison between exit by Buy-out, and Survival
are reported in Column (13). Again, we find that location in the product space
matters, in the sense that firms locating far from the technical frontier have a higher
probability of exiting (in this case by being bought-out) than surviving, as suggested
by the positive and significant coefficient of DISTANCE TO FRONTIER. In general,
there are no major differences with respect to the previous estimates though marginal
effects seems to vary.
Finally, column (14) compares the two alternatives of exiting by buy-out and
exiting by failure. In this column, the coefficients are estimated as the difference
between those in Column (13) and those in Column (12). Thus, an increase in the
explanatory variables coefficients will increase the conditional probability of exit, for
instance, by firm buy-out if the estimated coefficient for the hazard of firm buy-out
is larger than the corresponding coefficient for the hazards of firm failure. Major
differences with respect to the previous estimates are found in the coefficients of our
22

measures of firm location, which change sign and are the only variables that remain
significant. DISTANT TO FRONTIER is negative, suggesting that only firms lo-
cated close to the frontier have a higher probability of being acquired than exiting by
failure. This is confirmed by the coefficient (DISTANCE TO FRONTIER)2, which
here is positive and indicates that the probability of being acquired, is high for firms
located very close to the frontier, decreases as distance increases and then increases
again for those firms located farthest away. Overall, both these results confirm that
acquisitions are mainly triggered by the need to appropriate the technology of rival
firms, enrich firm portfolios and improve research activities.
Finally, the direction of the effect of R&D intensity is as expected (i.e. positive
on survival and negative on both acquisition and failure) and supports the general
idea that a large stock of intangible capital is important for firm survival. Moreover,
although possessing a large innovative stock may also increase the attraction of
firms in the market, it also makes potential targets more expensive to purchase
(Hall, Jaffe, and Trajtenberg, 2005). In a context where knowledge obsolescence is
extremely rapid, this may in turn inhibit acquisitions.
Altogether, these estimates provide new results that enrich our analysis and
shed some light on our initial hypotheses. When exit is treated as a homogeneous
event product differentiation is an important determinant of firm survival, in the
sense that being located close to the frontier increases the probability of surviving.
However, among exiting firms, only those located close to the frontier are more likely
to be acquired; thus, position relative to the technological frontier seems to act as
a signal of firm quality. In other words, firms located near the frontier are more
likely to survive, but, if they do not, they are more likely to be acquired than to
discontinue productive activities. We also find support for the hypothesis that there
is a positive relationship between the stock of intangible capital and the probability
of surviving. However, in the case of an exit from the market, intangible capital
determines neither exit via plant closure nor exit via acquisition.
23

6 Discussion
The rapid growth of the LAN switch industry in the 1990s gave rise to a large number
of both entries and exits. Of the 121 companies that entered the industry, only 38
still existed in 2005; 15 had exited through closure and 68 had been acquired by a
third party. In this section, we explore the determinants of firms’ fates by looking at
the marginal effects of firm level variables, the role of distance to frontier in shaping
the outcomes and the relationship between market positioning, time and entry and
exit mode.
Table 7 displays the predicted probability of each mode of exit. We first com-
puted the predicted probability using the median values of the continuous variables
(time, age, size, distance to frontier, R&D intensity) and the mean values of the
dichotomous variables (entry-year dummy variables and entry type). All marginal
effects were computed as discrete change, holding all other independent variables
constant at their mean or median values. We observe that for the median firm with
average entry year and entry type, the overall failure rate is 5.5%, the risk of ac-
quisition is 18.1% and the survival probability is 75.5% 4. At first sight, the overall
risk of exit, either by failure or by acquisition, seems low: the median firm has three
chances out of four to actually make it to the median-plus-one period. Comparison
of this result with the observed overall exit rate for the whole period 1990-2005
suggests the presence of large effects at the margin of each independent variable.
We therefore compute the marginal effects of each firm-level Variable only (not
the insignificant variables for industry turbulence). Again, we compute the discrete
change in the predicted probability by imputing a variation of two quintiles around
the median value of each continuous variables - i.e. from the 30th to the 70th
percentile - holding all other variables constant. Because of the non-linearity of
the effect of distance from the frontier on survival, we compute the change in the
predicted probability of being at the frontier to being at the 40th percentile. For
the dichotomous variable SPIN-OUT, we computed the discrete change from being
a diversifier to being a spin-out. All changes are reported as absolute and relative
24

change in probability. We obtained the following main observations.
[Table 7 about here.]
First, we observe that time impacts differently on the mode of exit from the
industry. Although the marginal effect of time on survival confirms the role of post-
entry experience, the mode of exit plays a larger (marginal) role in terms of exit by
acquisition compared to exit by failure. In other words, firms that exit as a result of
failure survive longer in the market than firms that are acquired. This result has at
least two explanations. The first is based on the notion of a Jovanovic (1982) learning
effect. Although they may perform poorly, entrants gather information on their
relative performance only slowly so that the decision to exit takes time. Looking at
the marginal effect of age at entry on exit by failure actually confirms this intuition:
experience in doing business accounts for several unobserved characteristics of firms.
One is their ability to learn their relative economic performance, so that the decision
to exit by failure takes less time. The second interpretation is related to the presence
of sunk costs and assumes that, on average, exit by acquisition has lower sunk exit
costs than exit by plant closure. Based on this scheme, firms struggling in the market
should always prefer to exit by acquisition than by failure. These firms would enter
the mergers and acquisitions market, and offer their quality at a given price to
potential buyers. In other words, they enter a market in which firms compete to be
acquired, the choice of exit by failure being a last resort.
These two explanations could be considered to be complementary. However,
they differ in one fundamental respect. Whereas exit by failure is the decision solely
of the firm, exit by acquisition is the outcome of two decisions, one by the acquired
company and the other by the acquiring company. Unfortunately, we do not have
information on the underlying rationale for the two firms combining their activities
through a merger or acquisition. However, we can trace their relative distance - i.e.
the mutual distance between their best quality products - in order to get a better
understanding of the logic underlying mergers and acquisitions5. On average, the
acquiring company is located closer to the frontier than the target firm, although
25

the gap is neither large nor significant. The width of the quality gap is an indi-
cation, albeit a preliminary one, of the motivation underlying the acquisition. A
relatively large gap suggests that buyer and target firms were ’complements’ rather
than ’substitutes’ and that the main objective of the acquisition was the growth of
their productive resources or the enlargement of the product portfolio. Importantly,
this gap tends to decrease over time, implying a change in merger and acquisition
motivations over the industry life cycle. In particular, a closing gap between buyers
and targets indicates that as the market evolved toward consolidation, acquisitions
mainly involved firms that were imperfect substitutes in the market 6. As com-
petition grew, firms increasingly used acquisitions to exclude potential rivals from
preferential positions in the market.
Second, the presence of a non-linear relationship between firm location and sur-
vival hints at the possibility that there are some regions in the quality space where
firms are more at risk. In particular, firms located at the 30th percentile have to cope
with the highest probability of exiting by any mode, and of exiting through failure
in particular. Firms located close to the frontier face an increasing probability of
being acquired, since the risk of being acquired peaks at the 30th percentile. Thus,
competition in the LAN industry is a race in which most players commit resources
to innovate along the quality ladder. However, only one firm will make it to the
frontier, whereas others will innovate with products of substantial but lower quality.
Our analysis reveals that these good, but not-good-enough innovators will be exposed
to acquisition. This stylized fact is further illustrated in Table 8. The top panel
of the table reports the relationship between location with respect to the frontier
and mode of exit, decomposed by mode of entry7. For both entry modes, firms in
the 20th, 30th, and 40th percentile are those more at risk of exiting the industry
tout-court. However, the probability of exiting is just 9.6% for diversifiers against
31.7% for spin-outs as a consequence of the much higher probability of the latter
being acquired. Thus, diversifiers generally display a significantly higher probabil-
ity of surviving than spin-outs for each distribution percentile. The gaps becomes
26

dramatic for firms within the second, third, and fourth decile. Thus, while the prob-
ability of surviving is always higher for diversifiers in every position with respect to
the frontier, pre-entry experience has important effects in determining the mode of
exit for firms located close to each other.
[Table 8 about here.]
Finally, the role of pre-entry experience shown in Table 8 suggests that spin-
outs are generally more at risk of exit than diversifiers. This seems incompatible
with the marginal effects in Table 7, revealing that, ceteris paribus, the net effect of
being a spin-out is to raise the probability or surviving or exiting by acquisition8.
To investigate this result further, we analysed the exit mode probability, by mode
of entry (diversifier or spin-out). These results are reported in the bottom panel
of Table 8. For both types of firm, the risk of being acquired is particularly high
immediately after entry and then decreases monotonically. It can be seen that
using the median values by group, changes the results significantly in the sense
of substantially increasing the hazard for spin-outs. In particular, spin-outs have
a higher probability of being acquired than of surviving. Altogether, these results
confirm the important role of pre-entry experience on survival, above and beyond the
distance from the frontier. They also confirm that possessing pre-entry experience
makes spin-outs more likely than diversifiers to be acquired. In short, previous
experience in the LAN industry, such as individual skills and social networking,
matter for survival, and thus the fate of firms is also rooted in the mode of entry
into the industry.
Our analysis has the following important implications. From the viewpoint of
the literature on industrial dynamics, our results offer additional insights into the
relationship between mode of entry to an industry and mode of exit from an industry.
Recent studies have highlighted the importance of pre-entry experience for firm
survival (Klepper, 2002; Thompson, 2005). Our results are consistent with these
findings, but also stress that firms with higher pre-entry experience are relatively
more likely to be acquired, especially immediately after innovation has occurred,
27

which demonstrates the importance of looking at firm exit as a heterogeneous event
instead of treating mergers and acquisitions as censored exits. We also extend the
empirical literature on the determinants of exit in turbulent industries. Indeed, most
of the existing contributions on this topic focus on exit from declining industries,
mainly by looking at the financial determinants of exit. Our study, however, provides
insights that are relevant to highly innovative sectors.
Our analysis also has implications for the empirical literature on aggregate eco-
nomic growth at industry level (See Baily, Hulten, and Campbell, 1992; Haltiwanger,
1997; Baily, Bartelsman, and Haltiwanger, 2001, among others). These empirical
analyses seek to decompose sectoral - or aggregate - economic growth into an in-
ternal firm effect (firms increase their own levels of productivity), an external effect
(changes in market shares across incumbents) and a market selection effect (the
impact of firm entry and exit on economic growth). In particular when entrants
perform better than exiting companies, market selection contributes positively to
aggregate economic growth9. Because information on modes of exit is not readily
available in large datasets, exit is treated as an homogeneous event, such that exit
by acquisition equates with exit by failure. Our analysis challenges these results
and points to a possible measurement error in the turnover component. Since ac-
quired companies are located closer to the frontier than firms that exit by failure,
the benefits of markets selection may have been underestimated. Depending on
data availability, future research on the role of market selection on economic growth
should take into consideration both types of exit.
Finally, our analysis of innovativeness and mode of exit has also important policy
implications. In dynamic industries, acquisitions are mainly finalized at strengthen-
ing market positions at the expenses of the closest competitors. Our results highlight
that targeted firms are generally young, endowed with experience inherited from
skilled founders, and located far away from the acquirers. This suggests that ac-
quisitions are a means of acquiring knowledge and innovative assets that the buyers
do not possess. Evaluating these implications in terms of welfare gains/losses from
28

these mergers is not straightforward and beyond the scope of this paper. However,
acquired assets are generally costly to replicate and require time to be developed.
The occurrence of these mergers allows the existing resources to be kept within the
economic system while at the same time avoiding duplication of costs. This is an
important aspect that should be taken into consideration by antitrust authorities,
which usually are more concerned with the anticompetitive effects of mergers and
acquisitions.
7 Conclusion
This paper has investigated the relationship between product innovation and firm
survival in a high-tech industry. First, we looked at the hazard rate of firms by
considering exit as a homogeneous event. We found that firm quality, as captured
by firm location with respect to the technological frontier, innovative capital, pre-
entry experience, age and size are important determinants of firm survival. Second
we have extended the analysis to the case of heterogeneous exit. We found that,
when controlling for firm level attributes, among firms that exited, only those located
close to the frontier were more likely to be acquired, suggesting that position with
respect to the technological frontier acts as a signal of firm quality. We also found
support for the presence of a positive relationship between the stock of intangible
capital and the probability of surviving. However, provided that the firm exits,
intangible capital determines neither exit via plant closure nor exit via acquisition.
29

References
Audretsch, D. (1991): “New-Firm Survival and The Technological Regime,” Re-
view of Economics and Statistics, 73(3), 441–450.
(1995): “Innovation, Growth and Survival,” International Journal of In-
dustrial Organization, 13, 441–457.
(1997): “Technological Regimes, Industrial Demography and the Evolution
of Industrial Structures,” Industrial and Corporate Change, 6, 49–82.
Audretsch, D., and T. Mahmood (1999): “New Firm Survival: New Results
Using a Hazard Function.,” Economics Letters, 62, 245–251.
Aw, B. Y., X. Chen, and M. J. Roberts (2001): “Firm-Level Evidence on
Productivity Differentials and Turnover in Taiwanese Manufacturing,” Journal of
Development Economics, 66(1), 51–86.
Baily, M. N., E. J. Bartelsman, and J. Haltiwanger (2001): “Labor Pro-
ductivity: Structural Change and Cyclical Dynamics,” Review of Economics and
Statistics, 83(3), 420–433.
Baily, M. N., C. Hulten, and D. Campbell (1992): “Productivity Dynamics in
Manufacturing Plants,” Brookings Papers on Economic Activity, 0(0), 187–249,
TY - JOUR.
Barros, P. P., D. Brito, and D. de Lucena (2006): “Mergers in the food
retailing sector: an empirical investigation,” European Economic Review, 50, 447–
468.
Blonigen, B., and M. Taylor (2000): “R&D Intensity and Acquisitions in High
Technology Industries: Evidence from the US Electronic and Electrical Equipment
Industries,” The Journal of Industrial Economics, XLVII(1), 47–70.
Bonanno, G. (1987): “Location Choice, Product Proliferation and Entry Deter-
rence,” Review of Economic Studies, 54, 207–216.
30

Bontems, P., and V. Meunier (2006): “Advertising and price signaling of quality
in a duopoly with endogenous locations,” forthcoming in Journal of Economics
and Management Strategy.
Brander, J., and J. Eaton (1984): “Product Line Rivarly,” American Economic
Review, 74, 323–334.
Brito, D. (2003): “Preemptive mergers under spatial competition,” International
Journal of Industrial Organization, 21(10), 1601–1622.
Caves, R. E. (1998): “Industrial Organization and New Findings on the Turnover
and Mobility of Firms,” Journal of Economic Literature, 36(4), 1947–1982.
Cefis, E., and O. Marsili (2006): “Survivor: the Role of Innovation in Firms’
Survival,” Research Policy, 35(5), 626–641.
Christensen, C., F. Suarez, and J. Utterback (1998): “Strategies for Survival
in Fast-changing Industries,” Management Science, 44, S207–S220.
Cockbrun, I., and S. Wagner (2007): “Patents and the Survival of Internet-
Related IPOs,” NBER Working Papers 13146, NBER.
Dunne, T., M. J. Roberts, and L. Samuelson (1988): “Patterns of Firm Entry
and Exit in US Manufacturing Industries,” RAND Journal of Economics, 19,
495–515.
Eriksson, T., and J. M. Khun (2006): “Firm Spin-offs in Denmark 1981-2000.
Pattern of Entry and Exit,” International Journal of Industrial Organization, 24,
1021–1040.
Fontana, R., and L. Nesta (2006): “Product entry in a fast growing industry:
the LAN switch market,” Journal of Evolutionary Economics, 16(1), 45–64.
Foster, L., J. Haltiwanger, C. J. Krizan, C. R. Hulten, E. R. Dean, and
M. J. e. Harper (2001): “Aggregate Productivity Growth: Lessons from Microe-
conomic Evidence,” in New developments in productivity analysis, pp. 303–363.
31

NBER Studies in Income and Wealth, vol. 63. Chicago and London: University
of Chicago Press.
Franco, A., and D. Filson (2006): “Spin-outs: Knowledge Diffusion Through
Employee Mobility,” RAND Journal of Economics, Forthcoming.
Geroski, P. (1995): “What do we know about entry?,” International Journal of
Industrial Organization, 13, 421–440.
Grandstrand, O., and S. Sjolander (1990): “The Acqusition of Technology and
Small Firms by Large Firms,” Journal of Economic Behavior and Organization,
13, 357–386.
Greenstein, S., and J. Wade (1998): “The Product Life Cycle in the Commercial
Mainframe Computer Market, 1968-1982,” RAND Journal of Economics, 29(4),
772–789.
Griliches, Z., and J. Mairesse (1998): “R&D and Productivity Growth: Com-
paring Japanese and U.S. Manufacturing Firms,” in R&D and productivity: The
econometric evidence, pp. 187–210. NBER Monograph series. Chicago and Lon-
don: University of Chicago Press.
Griliches, Z., and H. Regev (1995): “Firm productivity in Israeli industry 1979-
1988,” Journal of Econometrics, 65(1), 175–203.
Hall, B. (1987): “The Effect of Rakeover Activity on Corporate Research and
Development,” in Corporate Takeovers: Causes and Consequences. NBER Mono-
graph series. Chicago and London: University of Chicago Press.
Hall, B., A. Jaffe, and M. Trajtenberg (2005): “Market Value and Patent
Citations,” Rand Journal of Economics, 36, 16–38.
Haltiwanger, J. C. (1997): “Measuring and Analyzing Aggregate Fluctuations:
The Importance of Building from Microeconomic Evidence,” Federal Reserve Bank
of St. Louis Review, 79(3), 55–77.
32

Helfat, C., and M. Lieberman (2002): “The Birth of Capabilities and the Im-
portance of Pre-history,” Industrial and Corporate Change, 11, 725–760.
Honjo, Y. (2000): “Business Failure of New Firms: an Empirical Analysis using
a Multiplicative Hazard Function,” International Journal of Industrial Organiza-
tion, 18, 557–574.
Jenkins, S. (1995): “Easy ways to estimate discrete time duration models,” Oxford
Bulletin of Economics and Statistics, 57, 129–138.
Jenkins, S. (2004): “Survival Analysis,” Mimeo Essex University.
Jovanovic, B. (1982): “Selection and the Evolution of Industry,” Econometrica,
50, 649–670.
Karim, S., and W. Mitchell (2000): “econfiguring business resources following
acquisitions in the US medical sector, 1978-1995,” Strategic Management Journal,
21(Special issue on the evolution of business capabilities), 1061–1081.
Kenney, M., and U. von Burg (2000): Understanding Silicon Valley, The
Anatomy of an Entrepreneurial Regionchap. Institutions and Economies: Cre-
ating Silicon Valley. Stanford University Press: Stanford, CA.
Klepper, S. (2002): “Firm Survival and the Evolution of Oligopoly,” RAND Jour-
nal of Economics, 33, 37–61.
Klepper, S., and K. Simmons (2005): “Industry Shakeouts and technological
Change,” International Journal of Industrial Organization, 23, 23–43.
Lancaster, T. (1990): “Econometrics Models for the Duration of Unemployment,”
Econometrica, 47, 939–956.
Mata, J., and P. Portugal (1994): “Life Duration of New Firms,” The Journal
of Industrial Economics, 42, 227–245.
33

Mata, J., P. Portugal, and P. Guimaraes (1995): “The Survival of New Plants:
Start-up Conditions and Post-Entry Evolution,” International Journal of Indus-
trial Organization, 13, 469–481.
Mitchell, W. (1991): “Dual Clocks: Entry Order influences on Incumbent and
Newcomer Market Share and Survival when Specialized Assets Retain Their
Value,” Strategic Management Journal, 12, 85–100.
Narendranathan, W., and M. Stewart (1991): “Simple Methods for Testing
for the Proportionality of Cause-Specific Hazards in Competing Risks Models,”
Oxford Bulletin of Economics and Statistics, 53(3).
Nishimura, K. G., T. Nakajima, and K. Kiyota (2005): “Does the Natural Se-
lection Mechanism Still Work in Severe Recessions? Examination of the Japanese
Economy in the 1990s,” Journal of Economic Behavior and Organization, 58(1),
53–78.
Perez, S., A. Llopis, and J. S. Llopis (2005): “A Competing Risk Analysis of
Exit for Spanish Manufacturing Firms,” LINEEX Working Papers 03/05, Uni-
versidad de Valencia.
Prentice, R., and L. Gloeckler (1978): “Regression Analysis of Grouped Sur-
vival Data with Application to Breast Cancer Data,” Biometrics, 34, 57–67.
Salant, S. W., S. Switzer, and R. J. Reynolds (1983): “Losses from Hor-
izontal Merger: The Effects of an Exogenous Change in Industry Structure on
Cournot-Nash Equilibrium,” The Quarterly Journal of Economics, 98(2), 185–
199.
Schary, M. (1991): “The Probability of Exit,” RAND Journal of Economics, 22,
339–353.
Schmalensee, R. (1978): “Entry Deterrence in the Ready-to-Eat Breakfast Cereal
Industry,” Bell Journal of Economics, 9, 305–327.
34

Siegfried, J., and L. Evans (1994): “Empirical Studies of Entry and Exit: A
Survey of the Evidence,” Review of Industrial Organization, 9, 121–155.
Stavins, J. (1995): “Model entry and exit in a differentiated-product industry: the
Personal Computer market,” Review of Economics and Statistics, 77(4), 571–584.
Thomas, J. (1996): “On the interpretation of covariate estimates in independent
competing risk models,” Oxford Bulletin of Economics and Statistics, 48, 27–39.
Thompson, P. (2005): “Selection and Firms Survival: Evidence from the Shipbuild-
ing Industry, 1825-1914,” The Review of Economics and Statistics, 87, 26–36.
Willard, G., and A. Cooper (1985): “Survivors of Industry Shake-outs: the
Case of the US Color Television Set Industry,” Strategic Management Journal, 6,
299–318.
35

Notes
1A non-exhaustive list of contributions includes, among others, Haltiwanger
(1997), Foster, Haltiwanger, Krizan, Hulten, Dean, and Harper (2001) for the
United States, Griliches and Regev (1995) for Israel, Aw, Chen, and Roberts
(2001) for South Korea and Taiwan.
2According to this business model, new companies usually revolved around
a single innovative product or technology. Acquisition usually entailed the
purchase of the new firms in stock swap, followed by integration of the product
as well as the technology. Cisco Systems, the leader in the LAN switch market
was one of the proponents of this acquisition strategy (Kenney and von Burg,
2000).
3This is different from studies that use census data, in which the age of the
firm is generally taken as the number of years of presence in the census (i.e.
the dataset).
4Note that the sum of the predicted probabilities equals unity.
5To explore this issue, we focus on firms that were acquired by incumbents
from within the switch industry. This sub-sample of 40 target firms represents
59% of all mergers and acquisitions.
6This result echoes the results of Blonigen and Taylor (2000) who considered
a sample of acquisitions in the US electronic and electrical equipment industry
between 1983 and 1993 and found evidence of an inverse relationship between
R&D intensity and acquisition activity for acquiring firms, indicating that the
buyer treats the assets of the targeted firm as an imperfect substitute of its
own.
7Note that the predicted probabilities are computed using the median values
36

of the continuous variables (time, age at entry, size, R&D intensity) and the
mean values of the dichotomous variables (entry-year dummy variables), where
the mean and median were computed for each type of firm. The table highlights
important differences, but also some similarities.
8In Table 7, we compute the net effect of being a spin-out given the char-
acteristics of the representative firm over the whole sample of firms.
9With a few exception (Nishimura, Nakajima, and Kiyota, 2005), the con-
tribution of this market selection is generally positive. According to textbook
economics, this is to be expected since it implies that only the most profitable
companies stay in the industry.
37

Table 1: OLS Regression on Observed Prices
Backplane Capacity 0.236[0.036]***
Number of Ethernet Ports 0.09[0.028]***
Number of Fast Ethernet Ports 0.04[0.037]
Number of FDDI Ports 0.024[0.060]
Number of Token Ring Ports 0.132[0.046]***
Number of 100VG-AnyLAN Ports 0.248[0.122]**
Number of ATM Ports 0.112[0.042]***
Number of Gigabit Ethernet Ports 0.361[0.055]***
VLANs Capability 0.394[0.099]***
Chassis 0.899[0.130]***
Fixed Configuration -0.222[0.088]**
Constant 8.37[0.389]***
Observations 503R-squared 0.699
Dependent Variable: Deflated Product Price. Robuststandard errors in brackets. * significant at 10%; **significant at 5%; *** significant at 1%. Year dummyvariables omitted for clarity.
38

Table 2: The relationship between modes of entry and exit in the LAN industry
Failure Buying-Out Survival Total
Spin-Out 12 60 29 10112.5 56.8 31.7
Diversifier 3 8 9 202.5 11.2 6.3
Total 15 68 38 121
Expected frequencies in italics. To be interpreted with caredue to low expected frequencies. Chi-square statistics = 2.66(P = 0.265)
39

Table 3: Summary Statistics
Variable Obs Mean Std. Dev. Min Max
Failure 121 0.12 0.33 0.00 1.00Bought-Out 121 0.56 0.50 0.00 1.00Survivor 121 0.31 0.47 0.00 1.00Spin-Out 121 0.83 0.37 0.00 1.00Diversifier 121 0.17 0.37 0.00 1.00Age at Entry 121 9.61 12.54 1.00 84.00Size (log) 121 6.16 2.16 2.71 13.30Dist. Frontier 121 2.42 1.09 0.00 4.69R&D Intensity 121 0.11 0.20 0.00 0.70Entry Rate (t− 1) 600 1.23 2.00 0.00 6.80Exit Rate (t− 1) 600 0.44 0.58 0.00 2.00
40

Table 4: Firm Entry and the Hazard Rate of Exit in the LAN Switch Industry
(1) (2) (3) (4) (5) (6)
Time (Log) -0.830 -0.747 -0.699 -0.670 -0.616 -1.072[0.147]*** [0.150]*** [0.150]*** [0.152]*** [0.155]*** [0.270]***
Age at Entry -0.040 -0.035 -0.041 -0.063 -0.060[0.017]** [0.016]** [0.017]** [0.019]*** [0.019]***
Size (Log) -0.071 -0.091 -0.138 -0.206 -0.250[0.073] [0.072] [0.076]* [0.081]** [0.082]***
Dist. Frontier 0.788 1.161 1.186 1.213[0.495] [0.527]** [0.506]** [0.517]**
(Dist. Frontier)2 -0.256 -0.359 -0.363 -0.364[0.120]** [0.130]*** [0.124]*** [0.126]***
R&D Intensity -2.021 -1.938 -1.860[0.874]** [0.864]** [0.858]**
Spin-Out -1.232 -1.410[0.468]*** [0.479]***
Entry Rate (t− 1) -0.243[0.132]*
Exit Rate (t− 1) 0.103[0.351]
Constant -1.767 -0.656 -0.736 -0.119 1.671 3.138[0.516]*** [0.754] [0.776] [0.812] [1.042] [1.263]**
Number of firms 121 121 121 121 121 121Number of firm exit 83 83 83 83 83 83P (Y |X) = 1 .109 .095 .093 .089 .087 .083Log Likelihood -216.7 -209.6 -205.3 -202.3 -199.1 -196.8Chi-square 49.0 63.2 71.7 77.7 84.1 88.8LR Chi-Square 49.0*** 13.2*** 8.6** 5.9* 6.4** 4.7*
Number of observations: 600. Discrete Time Duration Model with Weibull Hazard Function. Standard errorsin brackets. * significant at 10%; ** significant at 5%; *** significant at 1%. All duration models include a fullvector of entry-year dummy variables, not reported here for clarity.
41

Table 5: Robustness Checks for Discrete Time Duration Model
Hazard Rate Function Unobserved Heterogeneity(6) (7) (8) (9) (10) (11)
Age at Entry -0.060 -0.060 -0.059 -0.077 -0.064 -0.067[0.019]*** [0.019]*** [0.019]*** [0.024]*** [0.020]*** [0.029]**
Size (Log) -0.250 -0.220 -0.230 -0.217 -0.266 -0.279[0.082]*** [0.082]*** [0.083]*** [0.121]* [0.087]*** [0.123]**
Dist. Frontier 1.213 1.216 1.234 1.837 1.266 1.307[0.517]** [0.513]** [0.517]** [0.677]*** [0.547]** [0.660]**
(Dist. Frontier)2 -0.364 -0.369 -0.370 -0.540 -0.383 -0.399[0.126]*** [0.125]*** [0.126]*** [0.168]*** [0.133]*** [0.182]**
R&D Intensity -1.860 -1.812 -1.796 -3.066 -1.999 -2.119[0.858]** [0.862]** [0.862]** [1.147]*** [0.910]** [1.249]*
Spin-Out -1.410 -1.314 -1.326 -2.083 -1.500 -1.568[0.479]*** [0.478]*** [0.480]*** [0.678]*** [0.513]*** [0.690]**
Entry Rate (t− 1) -0.243 -0.109 -0.154 -0.301 -0.259 -0.272[0.132]* [0.137] [0.142] [0.164]* [0.136]* [0.163]*
Exit Rate (t− 1) 0.103 -0.079 0.016 0.080 0.124 0.141[0.351] [0.348] [0.362] [0.433] [0.355] [0.375]
Constant 3.138 2.448 -0.900 4.738 3.365 3.676[1.263]** [1.416]* [1.555] [1.682]*** [1.343]** [2.051]
Link Function C log-log C log-log C log-log Logistic C log-log C log-logHazard Function Weibull Polynomial Non Par. Weibull Weibull WeibullNumber of Firms 121 121 121 121 121 121Number of Firm Exit 83 83 83 83 83 83Log Likelihood -196.8 -195.6 -194.0 -192.9 -196.8 -196.7LR test for frailty - - - 0.480 0.150 0.117
Number of observations: 600. Standard errors in brackets. * significant at 10%; ** significant at 5%; *** significantat 1%. All duration models include a full vector of entry-year dummy variables, not reported here for clarity. BaselineHazard Function: (6), (9), (10) and (11) Log of time (Weibull); (7) Polynomial of order 2;(8) Fully non parametric.Distribution of Unobserved Heterogeneity: (9) and (10) Normal; (11) Gamma
42

Table 6: The Determinant of the Forms of Firm Exit in the LAN Switch Industry
(12) (13) (14)
Time (Log) -0.793 -1.351 -0.559[0.464]* [0.352]*** [0.549]
Age at Entry -0.071 -0.073 -0.002[0.025]*** [0.023]*** [0.031]
Size (Log) -0.463 -0.413 0.051[0.152]*** [0.110]*** [0.171]
Dist. Frontier 5.008 1.579 -3.429[1.342]*** [0.631]** [1.418]**
(Dist. Frontier)2 -1.261 -0.457 0.804[0.328]*** [0.154]*** [0.346]**
R&D Intensity -6.152 -2.318 3.834[2.564]** [1.034]** [2.680]
Spin-Out -2.424 -2.001 0.423[0.814]*** [0.649]*** [0.887]
Entry Rate (t− 1) -0.304 -0.229 0.075[0.225] [0.169] [0.260]
Exit Rate (t− 1) 0.249 0.024 -0.224[0.590] [0.434] [0.673]
Constant 4.76 5.216 0.456[2.277] [1.651] [2.513]
Log Likelihood -259.1Hausman Test (IAA) -35.5 0.000Wald Test (Combined) 38.9*** 64.2*** 19.8
Number of observations: 600. Competing Risk Duration Model. Stan-dard errors in brackets. * significant at 10%; ** significant at 5%; ***significant at 1%. All duration models include a full vector of entry-year dummy variables, not reported here for clarity.(12) Failure vs. Survival(13) Buying-out vs. Survival(14) Buying-out vs. Failure
43

Table 7: Marginal Effects of Firm-Level Variables on the Mode of Exit
Failure Acquisition Surviving
Predicted Probability 0.055 0.191 0.755
TimePredicted at the 30th percentile 0.062 0.254 0.684Predicted at the 70th percentile 0.049 0.150 0.802Absolute Change -0.013 -0.105 +0.118Relative Change -21.6% -41.2% +17.3%
Age at EntryPredicted at the 30th percentile 0.067 0.236 0.698Predicted at the 70th percentile 0.039 0.135 0.827Absolute Change -0.028 -0.101 +0.129Relative Change -41.9% -42.8% +18.5%
SizePredicted at the 30th percentile 0.070 0.236 0.694Predicted at the 70th percentile 0.026 0.100 0.874Absolute Change -0.044 -0.136 +0.181Relative Change -63.1% -57.7% +26.0%
Distance to FrontierPredicted at the 1st percentile 0.001 0.085 0.914Predicted at the 40th percentile 0.074 0.220 0.706Absolute Change +0.074 + 0.135 -0.208Relative Change +∞ +158.5% -22.8%
R&D IntensityPredicted at the 30th percentile 0.068 0.202 0.730Predicted at the 70th percentile 0.041 0.176 0.783Absolute Change -0.026 -0.027 +0.053Relative Change -38.8% -13.2% +7.2%
Spin-OutPredicted for SPIN-OUT=0 0.184 0.456 0.360Predicted for SPIN-OUT=1 0.037 0.141 0.822Absolute Change -0.146 -0.316 +0.462Relative Change -79.8% -69.1% +128.3%
The predicted probability has been computed using the median values of con-tinuous variables (time, age, size, distance to frontier, R&D intensity) and themean values of the dichotomous variables (entry-year dummy variables and en-try type). All marginal effects have been computed as discrete change, whileholding all other independent variables constant at their mean or median values.
44

Tab
le8:
Dis
tanc
eto
Fron
tier
,T
ime
and
the
Mod
eof
Exi
t,by
Mod
eof
Ent
ry
Dis
tanc
eto
fron
tier
(per
cent
iles)
a
110
2030
4050
6070
8090
100
Div
ersi
fier
Failu
re0.
000
0.00
40.
015
0.02
40.
021
0.01
50.
009
0.00
50.
002
0.00
10.
000
Acq
uisi
tion
0.02
10.
052
0.07
20.
072
0.06
60.
054
0.04
20.
033
0.02
30.
017
0.00
2Su
rviv
ing
0.97
90.
945
0.91
30.
905
0.91
30.
931
0.94
90.
962
0.97
50.
983
0.99
9
Spin
-Out
Failu
re0.
001
0.01
60.
059
0.09
20.
084
0.06
20.
038
0.02
30.
010
0.00
50.
000
Acq
uisi
tion
0.08
20.
182
0.23
20.
225
0.21
00.
183
0.14
90.
123
0.08
90.
065
0.00
6Su
rviv
ing
0.91
80.
802
0.70
80.
684
0.70
60.
756
0.81
30.
854
0.90
10.
930
0.99
4
Tim
e(i
nye
ars)
b
12
34
56
78
910
1112
13D
iver
sifie
rFa
ilure
0.04
40.
032
0.02
50.
021
0.01
80.
016
0.01
40.
013
0.01
20.
011
0.01
00.
009
0.00
9A
cqui
siti
on0.
325
0.16
20.
102
0.07
20.
054
0.04
30.
035
0.03
00.
025
0.02
20.
020
0.01
70.
016
Surv
ivin
g0.
632
0.80
60.
873
0.90
70.
928
0.94
10.
951
0.95
80.
963
0.96
70.
970
0.97
30.
976
Spin
-Out
Failu
re0.
080
0.07
30.
063
0.05
50.
049
0.04
40.
040
0.03
70.
034
0.03
20.
030
0.02
80.
026
Acq
uisi
tion
0.54
80.
340
0.23
50.
175
0.13
70.
111
0.09
20.
079
0.06
80.
060
0.05
30.
048
0.04
3Su
rviv
ing
0.37
20.
587
0.70
20.
770
0.81
40.
845
0.86
80.
885
0.89
80.
909
0.91
70.
925
0.93
1
aT
he
pre
dic
ted
pro
bability
isco
mpute
dusi
ng
the
med
ian
valu
esof
conti
nuous
vari
able
s(t
ime,
age
at
entr
y,si
ze,R
&D
inte
nsi
ty)
and
the
mea
nvalu
esofth
edic
hoto
mous
vari
able
s(e
ntr
y-y
ear
dum
my
vari
able
s),w
her
eth
em
ean
and
med
ian
are
com
pute
dfo
rea
chty
pe
offirm
.b
The
pre
dic
ted
pro
bability
isco
mpute
dusi
ng
the
med
ian
valu
esof
conti
nuous
vari
able
s(a
ge
at
entr
y,si
ze,dis
tance
tofr
onti
er,R
&D
inte
nsi
ty)
and
the
mea
nvalu
esofth
edic
hoto
mous
vari
able
s(e
ntr
y-y
ear
dum
my
vari
able
s),w
her
eth
em
ean
and
med
ian
are
com
pute
dfo
rea
chty
pe
offirm
.
45

Figure 1: Kaplan Meier Survival Estimates
46


