28


Product Space Analysis of the Exports of Brazil
Justino De La Cruz and David Riker
U.S. International Trade Commission1
June 25, 2012
ABSTRACT
This paper applies several of the product space tools of Hausmann, Klinger, and Hidalgo to explain and predict the pattern of Brazil’s exports. First, we calculate an annual measure of distance between moderately disaggregated products. Then we fit an econometric model that predicts the next products in which each country will gain comparative advantage, based on this distance measure, domestic resource constraints, and the extent of international competition. We evaluate the model’s success in explaining the changes in the pattern of Brazil’s exports between 1998 and 2008. Then we use the model to predict the products in which Brazil will gain a comparative advantage over the next decade. These products are concentrated in primary commodities like agricultural and mineral products rather than manufactures like machinery and equipment. Finally, we find that the model’s predictions change significantly when we refocus the analysis on Brazil’s exports to the United States rather than its exports to the entire world.
Key words: Revealed Comparative Advantage, Product Space, Brazil, and Model Validation.
JEL Codes: F10, F17, O20, O54
1 The views in this paper represent solely the views of the authors and it is not meant to reflect the views of the U.S. International Trade Commission or any of its Commissioners. The authors appreciate the comments and suggestions from Michael Ferrantino, William Powers, and many other Office of Economics seminar participants.
1

1 Introduction
Brazil is a natural resource rich country that has rapidly expanded its exports to the United States
and to the rest of the world. In 1998, Brazil recorded $51 billion in exports, approximately one percent of
world exports. That placed Brazil in 24th place among exporting countries. Ten years later, Brazil
advanced to 21st place with total exports of $198 billion, approximately 1.3 percent of world exports. In
2011, Brazil advanced to 15th place with approximately 1.8 percent of world exports. In 1998, Brazil’s
largest market, the United States, accounted for almost 20 percent of its exports. In 2008, the United
States continued to be Brazil’s top market, but its share declined to 14 percent. In 2009, China overtook
the United States as Brazil’s top export destination.
The product mix of Brazil’s exports has shifted over time, but not significantly. In 1998, Brazil’s
top exports were coffee, soy beans and soy bean oil, iron ore and concentrates, iron ore agglomerates,
blooms, billets, slabs and sheet bars of iron or steel, pig iron, oil-cake and other residues, and motor
vehicles and parts and accessories. A decade later in 2008, Brazil’s top exports were petroleum, iron ore
and concentrates, soy beans, poultry, iron ore agglomerates, motor vehicles and parts, aircraft, oil-cake
and other residues, coffee, meat of bovine animals, blooms, billets, slabs and sheet bars or iron or steel,
chemicals wood pulp, and sugar.
Table 1 reports the value of Brazil’s exports to the world by sector in 2008. The table also reports
whether Brazil had a revealed comparative advantage in the sector’s products in 2008. We measure
revealed comparative advantage (RCA) as the ratio of a product’s share of a country’s total exports to the
product’s share in the combined exports of all countries. Table 2 identifies the ten largest export products
of Brazil in 2008. For several of these products, including petroleum oils, Brazil recorded a relatively
large value of exports but did not have a revealed comparative advantage. The last column of Table 2
indicates that more than half of Brazil’s ten exports products in 2008 were also among its top ten export
products in 1998.
2

To analyze the changes in Brazil’s comparative advantage over time, and to predict the next
products in which it may gain a comparative advantage, we apply and extend the product space analysis
of Hausmann, Hidalgo, and Klinger. In a series of recent papers, these authors have developed a
framework for analyzing data on international trade flows. Different products are related to each other by
a network of proximities. When countries add new products to the set of products in which they have
comparative advantage, they tend to be products that are closer in the product space to those that they
already export. Hausmann, Hidalgo, and Klinger interpret the product space as reflecting similarities in
the products’ specific input requirements.
There are two economic issues that are fundamental to modeling international trade but are not
been addressed in the product space literature (to our knowledge). The first is the importance of resource
constraints within each country. The second is international competition. We attempt to extend the
product space analysis to incorporate these factors in a simple way and also to incorporate product
complexity concepts from related work by Hausmann, Hidalgo, and Klinger.
We use the extended model to explain the past, current, and future exports of Brazil. First, we
measure the product space for 1998 based on a data set of the exports of 121 countries, and then we
estimate an econometric model of the changes in the countries’ RCA between 1998 and 2008, at a
moderately disaggregated product level. Next, we evaluate how well the model predicted the changes in
RCA for the 121 countries as a whole, and we also assess the model’s predictions for one specific
country, Brazil. Then we construct a different product space for 2008 and use the estimated parameters of
the econometric model, along with export values in 2008, to estimate the probability that Brazil will gain
RCA after 2008 in each of the products in which it did not have an RCA in 2008.
In the final step in our analysis, we also reshape the product space by focusing on each country’s
exports to a specific national market, the United States, rather than defining the product space based on
each country’s exports to the entire world. This focus changes the estimated product space in a
3

2
significant way, and so it changes the model’s predictions about the products in which the countries will
gain RCA in the future. By redefining the product space, we generate predictions for the changes in
international trade that will most directly affect consumers and domestic producers within the United
States.
The rest of the paper is organized as follows. In the second section, we introduce the product
space framework by briefly reviewing related studies, explaining the measures of product space distance
and RCA, and identifying the data requirements of the analysis. In the third section, we report the
parameter estimates for our econometric model of the changes in RCA between 1998 and 2008. In the
fourth section, we report the model’s predictions for the products in which Brazil will gain RCA after
2008. In the fifth section, we refocus the analysis on exports to the United States and repeat the many
steps of the data analysis. In the concluding section, we summarize the strengths and limitations of the
product space analysis and discuss its potential policy implications.
Overview of the Product Space Framework
Related Literature
Recent research suggests that what a country exports matters. Hausmann, Hwang, and Rodrik
(2007) find that the level of sophistication of a country’s exports has important implications for economic
growth. More sophisticated exports tend to accelerate economic growth. The determinants of the
evolution of a country’s export sophistication have been studied by Hausmann and Klinger (2006, 2007)
and Hidalgo, et al. (2007). They found that the process of structural transformation reflects the similarity
in the specific input requirements of products. They call the network of relatedness among products the
product space. According to Hausmann (2009), the similarity in input requirements includes everything
from particular skills, institutional and infrastructural requirements, and technology.
4

Hausmann and Klinger (2006, 2007) suggest that changes in the revealed comparative advantage
of countries can be predicted by where the countries’ output lies within the product space. When
countries change the product mix of their exports, they tend to add products that are closely related to the
products in which they currently have an RCA. To illustrate the point, Klinger (2007) notes that the
infrastructure, institutions, human capital, and inputs that are required by the garment industry can be
more easily reemployed in the harness industry than in the call center industry.
Hausmann and Klinger (2006, 2007) develop a measure of relatedness between pairs of products
using annual export data for a cross-section of countries. They find that the product space is highly
heterogeneous: there are very dense parts of the product space with highly inter-connected products and
very sparse parts.2 They conclude that a “product’s proximity to existing areas of comparative advantage
is one of the most significant determinant of whether a country will develop an advantage in that product
over time.” In addition, Hidalgo and Hausmann (2009) provide evidence that countries with more
capabilities will be more diversified and will export a wider range of products. They also demonstrate
that products that require more capabilities will be produced by fewer countries. The products will be less
ubiquitous as fewer countries will have all of the capabilities needed to make the products. They conclude
that a country’s diversification (the number of products in which it has an RCA) is a reliable indicator of
the number of capabilities that the country has.
The structural transformation and product space methodology have been applied to analyze the
pattern of trade of a number of specific countries and regions. Hausmann and Klinger (2006b, 2007a,
2008, and 2009) studied structural transformation in South Africa, Chile, Colombia, and several
Caribbean nations. The Inter-American Development Bank (2008) used the methodology to study
diversification from energy in Trinidad and Tobago. The United Nations Economic and Social
2 Hausmann and Klinger (2006, 2007) construct a map of possibilities for export diversification at the SITC 4-digit level, with approximately 800 traded products. As an analogy, they describe the product space as a forest (the country) with trees (the products) occupied by monkeys (the firms). In this analogy, income-enhancing diversification will occur when monkeys jump to additional trees with additional fruit, and they are more likely to jump to nearby trees.
5

Commission for Asia and the Pacific analyzed 13 of the least developed countries in the Asia and the
Pacific. Jankowska, Nagengast and Perea (2012) compared Asian and Latin American export
experiences. Hausmann, Klinger, and López-Cálix (2008 ) studied export diversification in Algeria.
Hidalgo (2011) studied the industrial opportunities of five countries in eastern and southern Africa.
Abdon and Felipe (2011) studied the opportunities for growth and structural transformation in Sub-
Saharan Africa. Felipe, Kumar, and Abdon (2010) applied the methodology to exports and industrial
policy in India, and Felipe, Kumar, Usui, and Abdon (2010) applied the methodology to China.
The Product Space and Measures of Revealed Comparative Advantage
We calculate the product space proximity for fairly disaggregated (SITC4) products, based on
how many countries export each pair of products in a given year. We can summarize our measures of
RCA and distance in the product space using the following five equations from Hausmann, Hidalgo, et al.
.and product Equation (1) is their definition of RCA, for country (2011) .
ൌ ൬ ܣܥ∑ೕ ೕ
. exports from country is the total value of product The variable
൰ ൬ ∑൘ ൰ (1) ∑ ∑ ೕೕ
The variable is an index of
countries, and the variable is an index of products. Equation (2) is the cut-off rule that Hausmann,
has a revealed comparative advantage in product Hidalgo, et al. (2011) use to define whether country .
ൌ 0ܯ ; otherwise 1ܣܥ ifൌ 1ܯ (2)
as the number of countries that have a revealed Equation (3) defines the ubiquity of product
comparative advantage in product .
ܯ∑ൌ,
Equation (4) represents the proximity and of distinct products
(3)
ᇱ within the product space.
6

∑ ெ ெᇲ߶ᇲ ൌ ௫ቀబ, ,బ, ᇲቁ
(4)
currently has a Finally, equation (5) is the measure of distance from the products in which country
in which it does not. comparative advantage to product
∑ൌܦ
ᇲ ቀଵெᇲቁథᇲ
∑ᇲ థᇲ (5)
This distance measure from Hausmann, Hidalgo, et al. (2011) is inversely related to the density measure
in Hausmann and Klinger (2007b).
We use the product space distance in (5) to predict the next products in which a country will gain
comparative advantage. To clarify timing, we add a time subscript to the variables introduced in
gains equations (1) through (5). Equation (6) defines an indicator variable that is equal to one if country
and is equal ݐ െ 1 that it did not have in period ݐ in period a revealed comparative advantage in product
to zero otherwise.
ൌ 0,௧ଵܯ andൌ 1௧ܯ ifൌ 1௧ܣ (6)
based on an econometric model with the We calculate the probability of gaining an RCA in product
logit functional form in equation (7).
൯,షభ௫൫ ൌ௧ܣ௧ଵܧଵା௫൫,షభ൯
l
(7)
≡ ߙ ߚ ,௧ଵ ൯,௧ଵܦn൫ (8)
We expect that ߚ ൏ ݐ..0 െ 1 represents expectations in period ௧ଵܧ
One limitation of the models (in Hausmann and Klinger (2007), Hausmann, Hidalgo et al. (2011),
and our equations (7) and (8)) is that they do not account for resource constraints within the countries of
origin. The probability that a country will gain an RCA in a particular product should depend not only on
7

the distance to that product but also on the distance to the country’s other potential new RCA products, to
the extent that they compete for some of the same scarce resources.
A second limitation of the models is that they do not take into account the extent of international
competition. A simple way to do this is to include the number of countries that already have an RCA in
in equation,,௧ଵ This is measured by as an additional explanatory variable. ݐ െ 1 in period product
(3). If this is a reasonable proxy for the number of international competitors, then it should have a
.௧ܣ௧ଵܧ negative effect on On the other hand, if this variable indicates a lack of product complexity, as
.௧ܣ௧ଵܧ in Hausmann, Hidalgo et al. (2011), then it could have a positive effect on In this case, the
country would be more likely to gain an RCA in products that require simple and ubiquitous production
capabilities, for a given product space distance.
Equation (9) extends the model to address these concerns. It replaces equation (8).
തതതതതതത∙,௧ଵܦത൫
ݐ, െ 1 that are potential entrants after period is the number of products in country ,௧ଵ The variable
≡ ߙ ߚ ,௧ଵ l ൯ ߛ ,௧ଵܦn൫ ൯ ߜ ൯,,௧ଵ൫൯ ,௧ଵ൫ߠ (9)
തതതതതതത
advantage in period ݐ െ 1.
∙,௧ଵܦതand the variable
The econometric model in Hausmann and Klinger (2007b) does not include the additional terms
in equation (9), but it does include a set of country fixed effects and a set of product fixed effects. While
these fixed effects would absorb the additional terms in equation (9), they would only be appropriate in
our forecast model if the factors that they represent were fixed over time. That is not the case. The
country effects in equation (9) include the number of potential new RCA products, which we define as the
number of products in which the country does not currently have an RCA, as well as the average distance
associated with these products. We know that these factors are not fixed over time; in fact, they change in
does not have comparative is the average distance of products in which country
There is a different set of changes over time. ,,௧ଵ Likewise, the product effect an observable way.
8

3
potential new RCA products in 1998 than in 2008. For this reason, it would not be correct to use a set of
product fixed effects estimated for the potential new RCA products in 2008 to forecast the set of new
RCA products after 2008.
Data Requirements
One of the greatest appeals of the product space analysis is its limited data requirements. We
analyze annual exports from each country at the four-digit level of the SITC revision 2 product
classifications. These are the product classifications used in Hausmann, Hidalgo, et al. (2011). We
analyze data for 121 countries for 1998 and 2008. The trade data are from COMTRADE, available
through the World Banks’ WITS data base. The various terms in equation (9), representing the country-
average distance, product-average distance, and product ubiquity, are all constructed from these trade
data.
Econometric Model of Change in Brazil’s Revealed Comparative Advantage
Before estimating the econometric models, we look for basic evidence that there is a negative
relationship between the measure of distance in product space and the set of products in which Brazil
gained an RCA between 1998 and 2008. We separate the potential new RCA products into two groups
based on the ex-post outcomes: the products in which the country gained an RCA between 1998 and 2008
and the products in which it did not.
Figure 1 represents the distance of the potential new RCA products along the horizontal axis, and
the share of potential new RCA products in each group along the vertical axis. The distribution for the
products that did gain an RCA over the time period is shifted to the left of the distribution of the products
that did not gain an RCA. These data for Brazil indicate that product space distance helps to predict
whether Brazil gained an RCA in a particular product.
9

Table 3 reports four alternative econometric models based on equations (7) and (9). The
All of theThis variable is define in equation (6). .,ଶܣ dependent variable in all of the models is
explanatory variables in the models are observable ex ante, in 1998. We estimated the parameters of the
models using the two-dimensional panel of ten-year differences, which varies across the countries and
four-digit products. Model 1 is the least restrictive of the four models, while Model 4 is the most
restrictive. According to Table 3, the Akaike Information Criterion (AIC) and the sum of absolute
deviations are both lower for Model 1, though these diagnostic statistics are very close across the models.
The purpose of these statistics is to measure the gain in model fit from adding explanatory variables. In
the case of the AIC, there is also a penalty for reducing the degrees of freedom. Model 1 is the preferred
model by these criteria. We find that the coefficients on the proxies for domestic resource constraints,
തതതതതതത∙,௧ଵܦതand,௧ଵ ,,,௧ଵ The ubiquity measure, , have the expected sign and are statistically significant.
has a positive effect that is statistically significant. This suggests that the positive effect from less product
complexity dominates the negative effect of more international competitors.
Table 4 provides an evaluation of the econometric models for two groups of products, potential
new RCA products that were added between 1998 and 2008 and potential new RCA products that were
not added during that time period. The top panel of Table 4 reports the group average over all 121
countries of origin. Based on the export data for 1998, Model 1 predicts that each country will gain an
RCA in approximately 9% of all of the potential new RCA products. The average estimated probability
was 16.4% higher among the products in which the countries did in fact gain an RCA by 2008. The
difference in group means is statistically significant at the 1% level for all four models, but the largest
difference is in the predictions of Model 1. This comparison provides in-sample validation of the
predictions of the model. The bottom panel of Table 4 looks more narrowly at the performance of the
models in predicting changes in exports from Brazil. The models are constructed to fit the data on
average for the full set of 121 countries. They are not necessarily a good fit for each individual country in
the sample. Nevertheless, the outcomes for Brazil help to validate the models. For Model 1, the average
10

4
estimated probability was 30.3% higher among products in which Brazil actually gained an RCA by
2008.
Predictions of Brazil’s New RCA Products after 2008
In this section, we use the econometric model that we fit to the historical changes in comparative
advantage to identify products in which Brazil is likely to gain an RCA in the future. In our opinion, the
model is more reliable as an estimate of the relative probabilities across the potential new RCA products,
rather than as an estimate of the average magnitude of the probabilities. The reason is that the average
magnitude depends on the assumption that the constant of the econometric model, which we estimate
from the historical sample, will continue to apply going forward. While this assumption underlies our
estimates of the average magnitude of the probabilities, it is irrelevant to the estimates of the relative
probabilities. Therefore, we focus our discuss on the relative probabilities.
Table 5 reports the sector average of the probability that Brazil will gain an RCA in each product
after 2008. The top panel of the table reports the mean and standard deviation of the estimated
probability of gaining an RCA in each product, by SITC one-digit sector. The average estimated
probability for food products (SITC 0) is almost twice as high as the average estimated probability for
machinery and equipment (SITC 7). The bottom panel of the table differentiates the products by whether
the United States has an RCA in the product in 2008. The average probability of Brazil gaining an RCA
in a product in which the United States already has an RCA is 0.073, compared to 0.070 for products in
which the United States did not have an RCA in 2008.
Figure 2 graphs the estimated probability that Brazil will gain an RCA after 2008 in each four-
digit product after 2008. The horizontal axis of the graph represents the four-digit SITC codes of the
potential new RCA products. The height of the vertical bars represents the estimated probability of
gaining RCA after 2008. The graph uses color to group the products into three categories: primary
11

5
commodities other than fuels, mineral fuels, chemicals, machinery, transportation equipment, and all
other manufactures. There is substantial variation in the estimate probabilities across the categories.
They range from 2% to 15%. There is also substantial variation within the six categories. Nevertheless,
the estimated probabilities are generally higher for primary commodities and lower for machinery and
equipment. This reflects the shorter average distance of the primary commodities from Brazil’s RCA
products in 2008 and the fact that these products are typically more ubiquitous.
Finally, Table 6 lists the ten SITC four-digit products in which Brazil is most likely to gain an
RCA after 2008. The table demonstrates that the model can generate fairly detailed product predictions,
even though our discussion has focused for the most part on sector-level summary statistics. Most of
these four-digit products are agricultural or mineral commodities. None is in the machinery or equipment
sectors.
Estimation of the Models for Brazil’s Exports to the United States
In this section, we reformulate the model using a different set of trade data to define each
country’s revealed comparative advantage. We reshape the product space by focusing on each country’s
exports to a specific national market of interest, in our case the United States, rather than defining the
product space based on the countries’ total exports. This change in the estimated product space alters the
model’s predictions for the pattern of Brazil’s future exports. The new model predictions address more
directly how changes in the country’s pattern of exports will affect consumers and domestic producers in
the United States. With these new data, we repeat the prior analysis, using the same steps to calculate
RCA, estimate distances in the relevant product space, estimate an econometric model of new RCA
products, and use the model to predict Brazil’s new RCA products after 2008.
Table 7 reports the new set of parameter estimates for Model 1, using the data on each country’s
exports to the United States. The table also repeats the parameter estimates from Table 3 for the sake of
12

6
comparison. It is difficult to compare the two models, because they describe fundamentally different data
sets. There are different numbers of observations, because the definition of the potential new RCA
products of each country of origin varies with the geographic scope of the export market. Nevertheless,
the models have the same signs for the effects of each of the explanatory variables. The greatest
difference is that the measure of ubiquity is not significantly different from zero for the model based on
exports to the United States. Also, the coefficient that measures the sensitivity of the probabilities to
product space distance is smaller in absolute value in the model based on exports to the United States.
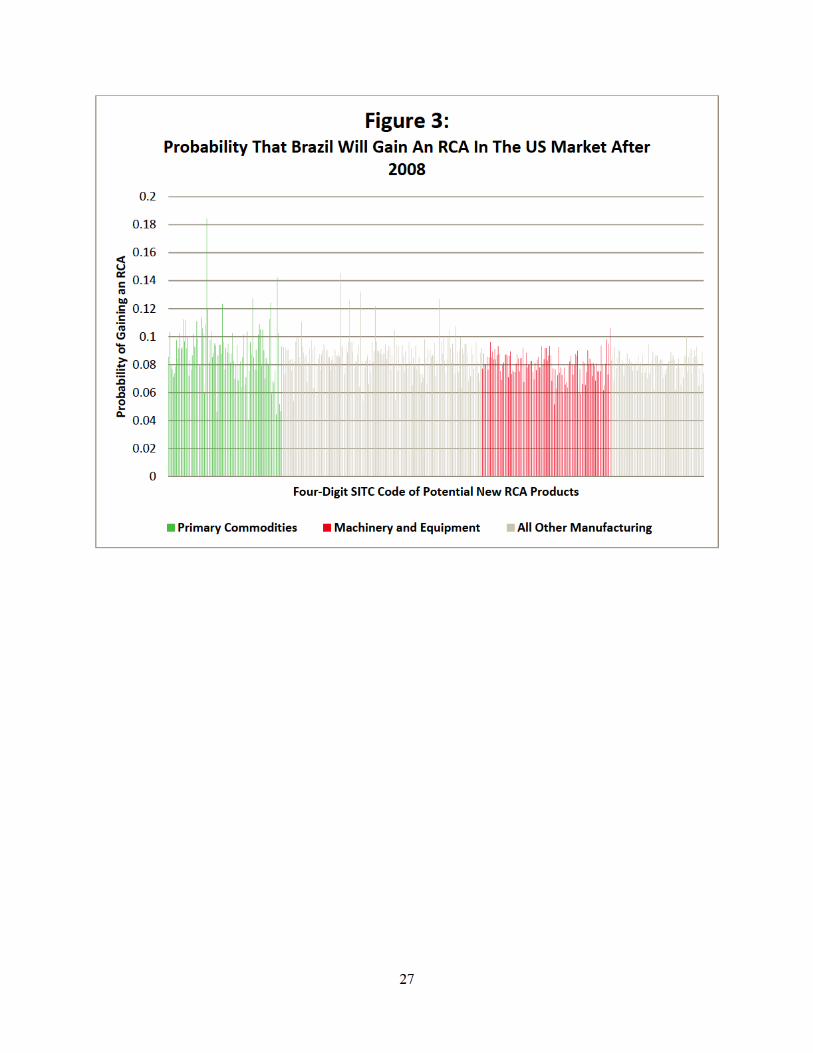
Figure 3 graphs the estimated probability that Brazil will gain an RCA in each of the four-digit
products in which it does not have an RCA in 2008. Like Figure 2, there is substantial variation in the
estimated probabilities across all of the products and even within the three categories of products. Unlike
Figure 2, the primary commodity category is not significantly higher than the other product categories,
and the machinery and equipment sectors are not significantly lower. This reversal of the model’s
predictions is also clear in Table 8, which compares the two sets of sector averages of the estimated
probabilities. The greatest difference is in the probabilities for the manufacturing sectors (SITC 5, 6, 7,
and 8). The sector averages in Table 8 are 18% to 36% higher than the comparable sector averages in
Table 5. When we focus on the countries’ exports to the United States, the potential new RCA products
in the manufacturing sectors are much closer to Brazil’s pattern of RCA in 2008, and therefore they are
more likely to gain an RCA in these products after 2008.
Concluding Remarks
We draw several conclusions from our product space analysis of the exports of Brazil. First, the
measures of distance in the product space are significant determinants (and predictors) of changes in each
country’s pattern of comparative advantage. Second, it is important to allow for resource constraints and
measures of product ubiquity in the econometric specification. Third, the data validate the model’s
predictions for the 121-country data set overall but also for Brazil in particular. Fourth, the model assigns
13

a specific probability that Brazil will gain an RCA in each product after 2008. Fifth, Brazil’s predicted
new RCA products are concentrated in the primary commodity sectors like agriculture and minerals rather
than manufactured products like machinery and equipment. Finally, these predictions about new RCA
products change significantly when we refocus our analysis on the countries’ exports to the United States
rather than their exports to the entire world.
In this paper, we have not analyzed the impact of specific trade policies on Brazil’s pattern of
trade; however, but the model’s predictions about the products in which they are likely to gain an RCA as
part of a general export expansion have some broad policy implications. For example, liberalization of a
country’s barriers to imports will generally free domestic resources that had been dedicated to import
substitution, and we expect that these resources will be reallocated to products in which the country has
(or can gain) a comparative advantage. The specific path of this expansion of exports will likely be
shaped to some extent by distances in the product space. Of course, if the trade policies narrowly
promote specific industries, then this targeting may dominate the changes predicted by the product space
analysis. In an economy in which each industry employs specific factors of production, the specific set of
products in which Brazil gains an RCA can have a significant impact on the returns to competing specific
factors within the United States.
The greatest limitation of the product space framework, in our opinion, is that the econometric
specification is not explicitly derived from a general equilibrium model with specific functional forms,
and for this reason it is outside of the mainstream of empirical international trade models, like Anderson
and van Wincoop (2003) and Helpman, Melitz, and Rubinstein (2008). Careful consideration in the
context of a general equilibrium model of international trade may help to refine the econometric
specification by identifying omitted variables and appropriate functional forms.
14

References
Abdon, Arnelyn and Jesus Felipe, (2011). “The Product Space: What Does It Say About the Opportunities for Growth and Structural Transformation of Sub-Saharan Africa?” Working Paper No 670. Annandale-on-Hudson, NY: Levy Economics Institute of Bard College.
Anderson, James and Eric van Wincoop, (2003): “Gravity with Gravitas: A Solution to the Border Puzzle.” American Economic Review 93(1): 170-192.
Bahar, Dany; Ricardo Hausmann; and César A. Hidalgo, (2012). “International Knowledge Diffusion and the Comparative Advantage of Nations,” CID Working Paper No 235. Kennedy School of Government, Harvard University.
Felipe, Jesus; Utsav Kumar; and Arnelyn Abdon, (2010). “Exports, Capabilities, and Industrial Policy in India.” Working Paper No. 638. Annandale-on-Hudson, NY: Levy Economics Institute of Bard College.
Felipe, Jesus; Utsav Kumar; Norio Usui; and Arnelyn Abdon, (2010). “Why Has China Succeeded? And Why it Will Continue to Do So.” Working Paper No. 611. Annandale-on-Hudson, NY: Levy Economics Institute of Bard College.
Hausmann, Ricardo; Jason Hwang; and Dani Rodrik, (2007). “What you export matters,” Journal of Economic Growth 12, 1: 1–25.
Hausmann, R. and Bailey Klinger, (2006a). “Structural Transformation and Patterns of Comparative Advantage in the Product Space,” CID Working Paper No 128. Kennedy School of Government, Harvard University.
Hausmann, Ricardo and Bailey Klinger, (2006b). “South Africa’s Export Predicament,” CID Working Paper No 129, Kennedy School of Government, Harvard University.
Hausmann, Ricardo and Bailey Klinger, (2007a). “Structural Transformation in Chile,” Manuscript.
Hausmann, Ricardo and Bailey Klinger, (2007b). “The Structure of the Product Space and the Evolution of Comparative Advantage.” Harvard CID Working Paper No. 146.
Hausmann, Ricardo and Bailey Klinger, (2008). “Achieving Export-Led growth in Colombia,” CID Working Paper No 182. Kennedy School of Government, Harvard University.
Hausmann, Ricardo and Bailey Klinger, (2009). “Policies for Achieving Structural Transformation in the Caribbean,” Inter-American Development Bank, Private Sector Development Discussion Paper #2, October, Washington, DC.
Hausmann, Ricardo; Bailey Klinger; and José R. López-Cálix, (2008). “Export Diversification in Algeria,” Trade Competitiveness of the Middle East and North Africa: Policies for Export Diversification, José R. López-Cálix, Peter Walkenhorst, and Ndiamé Diop, Editors, The World Bank, Washington, DC.
15

Hausmann, Ricardo and César Hidalgo, (2010). “Country Diversification, Product Ubiquity, and Economic Divergence,” CID Working Paper No 201. Kennedy School of Government, Harvard University.
Hausmann, Ricardo, César A. Hidalgo, Sebastián Bustos, Michele Coscia, Sarah Chung, Juan Jimenez, Alexander Simoes, and Muhammed A. Yıldırım, (2011). The Atlas of Economic Complexity: Mapping Paths to Prosperity, Cambridge, MA.
Helpman, Elhanan; Marc Melitz; and Yona Rubinstein, (2008). “Estimating Trade Flows: Trading Partners and Trading Volumes.” Quarterly Journal of Economics 123 (2): 441-487.
Hidalgo, César, (2009). “The Dynamics of Economic Complexity and the Product Space over a 42 year period,” CID Working Paper No 189, Kennedy School of Government, Harvard University.
Hidalgo, César, (2011): “Discovering Southern and East Africa’s Industrial Opportunities.” The German Marshall Fund of the United States, Economic Policy Paper.
Hidalgo, César, and Hausmann, Ricardo, (2009). “The Building Blocks of Economic Complexity,” Proceedings of the National Academy of Sciences of the United States of America 106, 10570-10575.
Hidalgo, César; Klinger, Baily; Barabasi, Albert-László; and Hausmann, Ricardo, (2007). “The Product Space Conditions the Development of Nations.” Science 317, 482-487.
Inter-American Development Bank, (2008). “Diversification from Energy in Trinidad and Tobago,” Country Program Evaluation: Trinidad and Tobago 2000-2008, Office of Evaluation and Oversight, Washington, DC.
Jnakowska, A.; A.J. Nagengast; and J.R. Peres, (2012). “The Product Space and the Middle Income Trap: Comparing Asia and Latin American Experiences, OECD Development Centre Working Paper No.311.
United Nations Economic and Social Commission for Asia and the Pacific, ESCAP, (2011). “Building the Economic Capacity of the least developed countries,” in Economic and Social Survey of Asia and the Pacific, chapter 4.
16

Table 1: Exports of Brazil by Sector in 2008
SITC rev 2 Share of Sectors Description Value of SITC Four-Digit
2008 Exports Products with in billions of US$ RCA > 1 in 2008
0 Food and Live Animals
37.4 0.38
1 Beverages and Tobacco
2.9 0.36
2 Crude Materials, Inedible, Except Fuel
39.3 0.30
3 Mineral Fuels 13.9 0.00
4 Animal and Vegetable Oils
3.0 0.28
5 Chemicals 12.5 0.19
6 Non-Machinery Manufactured Goods
30.6 0.21
7 Machinery and Equipment
41.8 0.19
8 Miscellaneous Manufactured Goods
5.4 0.06
17

Table 2: Brazil, Ten Four-Digit Products with Most Exports from Brazil in 2008
SITC rev 2 Value of Top Ten Product Product Description 2008 Exports RCA > 1 Export Product
Code in billions of US$ in 2008? in 1998?
3330 Petroleum Oil and Crude Oils Obtained from Bituminous Minerals
13.70 No No
2815 Iron Ore and Concentrates, Not Agglomerated
11.10 Yes Yes
2222 Soy Beans 11.00 Yes Yes
114 Poultry, Dead and Edible Offals 6.01 Yes No
2816 Iron Ore Agglomerates (Sinters, Pellets, Briquettes)
5.48 Yes Yes
7810 Passenger Motor Cars, for Transportation of Passengers and Goods
4.92 No Yes
7924 Aircraft Exceeding an Unladen Weight of 15000 kg
4.39 Yes No
813 Oil Cake and Other Residues (Except Dregs)
4.36 Yes Yes
711 Coffee, Whether or Not Roasted or Freed of Caffeine
4.17 Yes No
111 Meat of Bovine Animals, Fresh, Chilled or Frozen
4.01 Yes Yes
18

Table 3: Logit Models of the Probability of New RCA Products in 2008
,ଶܣ Dependent Variable:
Explanatory Variables Model 1 Model 2 Model 3 Model 4
,ଵଽଽܦ
,ଵଽଽܦഥ
,ଵଽଽ
,ଵଽଽ
-9.679 -11.210 -1.889 -1.992 (0.371)* (0.348)* (0.102)* (0.101)*
8.943 10.665 (0.422)* (0.404)*
-0.623 -0.648 (0.043)* (0.042)*
0.348 0.662 (0.033)* (0.032)*
Constant 0.349 1.509 -4.523 -2.675 (0.282) (0.262)* (0.091)* (0.025)*
Number of Observations 63,101 63,101 63,101 63,101
Sum of the 10,120 10,136 10,238 10,313 Absolute Deviations
AIC 36,824 36,938 37,419 37,920
Note: Robust standard errors in parentheses.
19

Table 4: Group Averages of the Estimates Probabilities
Model 1 Model 2 Model 3 Model 4
All Countries
Products in which the country gained an RCA
Products in which the country did not
gain an RCA
P-Value of Difference in Group Means
0.0959 0.0928 0.1081 0.1020
0.0824 0.0811 0.0981 0.0995
0.0005 0.0001 0.0211 0.0001
Brazil Only
Products in which Brazil gained an RCA
Products in which Brazil did not gain an RCA
P-Value of Difference in Group Means
0.1149 0.1135 0.1046 0.0980
0.0882 0.0883 0.0896 0.0899
0.0000 0.0000 0.0000 0.0000
20

Table 5: Sector Averages of the Estimated Probabilities
SITC rev 2 Standard Sectors Description Mean Deviation
0 Food and Live Animals
0.101 0.019
1 Beverages and Tobacco
0.083 0.018
2 Crude Materials, Inedible, Except Fuel
0.087 0.025
3 Mineral Fuels 0.081 0.028
4 Animal and Vegetable Oils
0.078 0.020
5 Chemicals 0.064 0.022
6 Non-Machinery Manufactured Goods
0.073 0.020
7 Machinery and Equipment
0.055 0.013
8 Miscellaneous Manufactured Goods
0.067 0.019
Products in which the United States had RCA in 2008
0.073 0.024
Products in which the United States did not have RCA in 2008
0.070 0.023
21

Table 6: Products with the Ten Highest Probabilities That Brazil Will Gain an RCA After 2008
Rank SITC Revision 2 Product Description Estimated Probability Division of Gaining an RCA
After 2008
1 3330 Petroleum Oils and Crude Oils 0.1522
2 2225 Sesame Seeds 0.1421
3 360 Crustaceans and Mollusks, Fresh 0.1393
4 342 Fish, Frozen (Excluding Fillets) 0.1385
5 5721 Propellant Powders and Other Preparations 0.1343
6 2879 Ores and Non-Ferrous Minerals 0.1339
7 459 Buckwheat, Millet, Canary Seed 0.1339
8 542 Beans, Peas, Lentils 0.1327
9 6612 Portland Cement 0.1310
10 615 Molasses 0.1309
22

Table 7: Comparison of Logit Models with Different Export Data
,ଶܣ Dependent Variable:
Explanatory Variables Using Total Exports Using Exports (from Table 3) to the United States
,ଵଽଽܦ
,ଵଽଽܦഥ
,ଵଽଽ
,ଵଽଽ
-9.679 -6.830 (0.371)* (0.420)*
8.943 5.648 (0.422)* (0.506)*
-0.623 -0.479 (0.043)* (0.034)*
0.348 0.001 (0.033)* (0.034)
Constant 0.349 0.452 (0.282) (0.201)*
Number of Observations 63,101 33,472
Sum of the 10,120 6,601 Absolute Deviations
AIC 36,824 23,113
Note: Robust standard errors in parentheses.
23

Table 8: Probability of Gaining an RCA after 2008 for Brazil, by Sector
SITC rev 2 Sectors Description Average
Probabilities for Model of Total
Exports (from Table 5)
Average Probabilities for Model of Exports to the United States
0 Food and Live Animals
0.101 0.093
1 Beverages and Tobacco
0.083 0.094
2 Crude Materials, Inedible, Except Fuel
0.087 0.086
3 Mineral Fuels 0.081 0.080
4 Animal and Vegetable Oils
0.078 0.082
5 Chemicals 0.064 0.087
6 Non-Machinery Manufactured Goods
0.073 0.086
7 Machinery and Equipment
0.055 0.080
8 Miscellaneous Manufactured Goods
0.067 0.081
24


![Institutional 18.08.2009 - Engl [Modo de Compatibilidade]€¦ · #1 in Brazil market share 28% #2 in Brazil market share 27% #1 in Brazil market share 24% 57% in exports R$ 4.1 billion](https://static.documents.pub/doc/80x56/5f6047c5cc4f171cca5c0278/institutional-18082009-engl-modo-de-compatibilidade-1-in-brazil-market-share.jpg)


