Production and Purification of Silicon by Magnesiothermic
Reduction of Silica Fume
Sarder Elius Sadique
Master of Applied Science
Department of Materials Science and Engineering
University of Toronto
2010
ABSTRACT
A new approach is discussed for the generation of high purity silicon from silica fume (SF),
which is a waste by-product from the manufacture of metallurgical grade silicon. Process steps
were developed and optimized for this purpose. These include purification of SF, reduction by
magnesium, and post-reduction acid leaching. SF is first subjected to an initial leaching with HCl
to remove soluble impurities. Reduction was carried out successfully in a sealed reaction
chamber with varying Mg/SF ratios, temperature and time. Mg/SF ratio, temperature and time
affected the production of silicon from SF with the intermediate compounds Mg2Si and Mg2SiO4
also forming. Suitable reduction conditions were found to be within the temperature range 750-
850°C and at approximately 2:1 ratio of Mg/SF. Reduction products were treated using a three
stage acid leaching. XRD, QXRD and ICP analyses of the final silicon powder product indicated
that silicon with low impurity levels particularly low boron content can be produced. Therefore,
silicon produced by magnesiothermic reduction can be an attractive source for the production of
solar grade silicon.
iii
To my beloved wife and sons, Sadid/Sami who have been giving an endless support and inspiration during my most exaggerated and jeopardized part of my life in my Canada journey which was quite
unpredictable and unprecedented
iv
ACKNOWLEDGEMENTS
I would like to acknowledge several people who contributed to this thesis and obliged for
providing me the guidance required to achieve this. First of all, I would like to express my
gratitude to my supervisors, Professors M. Barati and A. McLean, for providing me with an
opportunity to work under their supervision and without whom this project would not have been
possible. Thanks are due to Dr. Hiroshi Soda for sharing his expertise, and for showing me new
horizons.
Secondly, I would also like to thank Dr. Yang for his kind assistance to use box furnace and
carbon analysis. I would like to extend my thanks to George Kretschmann who provided
adequate support for XRD analysis of this project, Dr. Srebri Petrov who performed QXRD, Sal
Boccia for SEM, Dr. Murray Johnston and Kingsley Larbi for chemical analysis (ICP), Erfan
Sharifi and Yashashree Chaugule for invaluable support in performing experiments. I would like
to acknowledge the support given by my other research group members.
Financial support from Process Research Ortech (PRO), Ontario Center of Excellence (OCE),
and University of Toronto is also greatly appreciated. I would also like to extend my gratitude to
my friends and to the MSE administrative staff who have always been very helpful.
Finally, and definitely not least I wish to thank my family, Dalia Lucky, Sarder Sadid, Shurit
Sarder and Ruhul (immediate elder brother) for their constant love and support. I could not have
done this without you.
v
TABLE OF CONTENTS
ABSTRACT............................................................................................................................ iiiACKNOWLEDGEMENTS.................................................................................................... ivTABLE OF CONTENTS........................................................................................................ vLIST OF TABLES.................................................................................................................. viiiLIST OF FIGURES................................................................................................................. ixCHAPTER 1: INTRODUCTION........................................................................................... 1CHAPTER 2: LITERATURE REVIEW................................................................................ 3
2.1 Energy and Environment......................................................................................... 3
2.2 Solar Energy............................................................................................................ 4
2.3 Demand for Solar Grade Silicon............................................................................. 5
2.4 Specification of Solar Grade Silicon....................................................................... 7
2.5 Methods for Reduction of Silica............................................................................. 8
2.8 Initial Leaching of Silica Based Materials and Purification of Reduction Products................................................................................................................. 18
2.8.2 Removal of Other Impurities from Silicon................................................. 18CHAPTER 3: EXPERIMENTAL PROCEDURES................................................................ 19
Table 2.1 World successively increasing consumption for most types of primary energy
resources…………………………………………………………………………
3Table 2.2 Direct cost reduction potential for multi-crystalline PV modules……………… 5Table 2.3 Chemical impurities in solar grade silicon............................................................ 7Table 2.4 Target impurity concentrations in upgraded metallurgical grade (UMG) silicon
and SoG-Si. All values in ppmw............................................................................
8
Table 2.5 Obtained impurity concentrations in SoG silicon after plasma purification. All
values in ppmw, measurements by ICP and GD-MS.............................................
8Table 2.6 The chemical compositions of silica fume............................................................ 15Table 4.1 Impurities in as-received silica fume.................................................................... 26Table 4.2 Impurity levels in silica fume after initial leaching.............................................. 30Table 4.3 Comparison between impurities sequence of leaching and calcination of silica
fume.…………………………………………………………………………….
32
Table 4.4 Experimental variable (ratio of Mg/SF) for reduction and quantification of
XRD..……………………………………………………………………………
37
Table 4.5 Experimental variable (temperature) for reduction and quantification of
XRD.…………………………………………………………………………….
38
Table 4.6 Experimental variable (time) for reduction and quantification of
XRD……..………………………………………………………………………
42
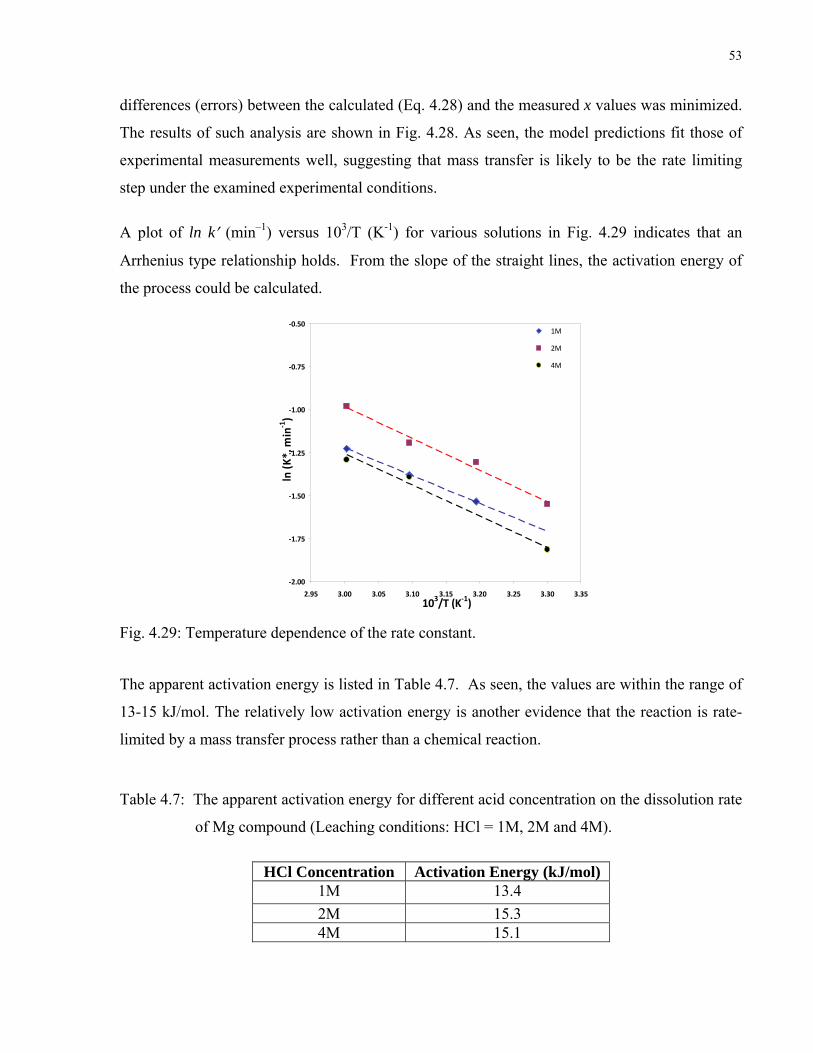
Table 4.7 The apparent activation energy for different acid concentration on the
dissolution rate of Mg compound (Leaching conditions: HCl = 1M, 2M and
4M)..…………………………………………………………………………...... 52
Table 4.8 Impurity level in silicon powder........................................................................... 56Table 4.9 Comparison of impurity level in silicon powder with original silica fume and
leached and calcined silica fume...........................................................................
57
Table 4.10 Comparison of impurity level in silicon powder with MGS……………………. 58
ix
LIST OF FIGURES Fig. 2.1: Global energy consumption demand....................................................................... 3Fig. 2.2: Demand and capacity of SoG-Si with a growth rate in the PV industry…………. 6Fig. 2.3: Schematic diagram of electric arc furnace for production of silicon……….......... 9Fig. 2.4: Refining process for high purity polycrystalline silicon. ....................................... 12Fig. 2.5: Schematic process sequence of production of solar grade silicon in
Fig. 2.6: Silica Fume: (a) white and (b) grey......................................................................... 15Fig. 2.7: XRD of silica fume................................................................. ................................ 16Fig. 2.8: Electron photomicrograph of silica fume: the white bar is 1 μm long…………… 16Fig. 2.9: Boiling point model of impurities in silica fume during production of silicon
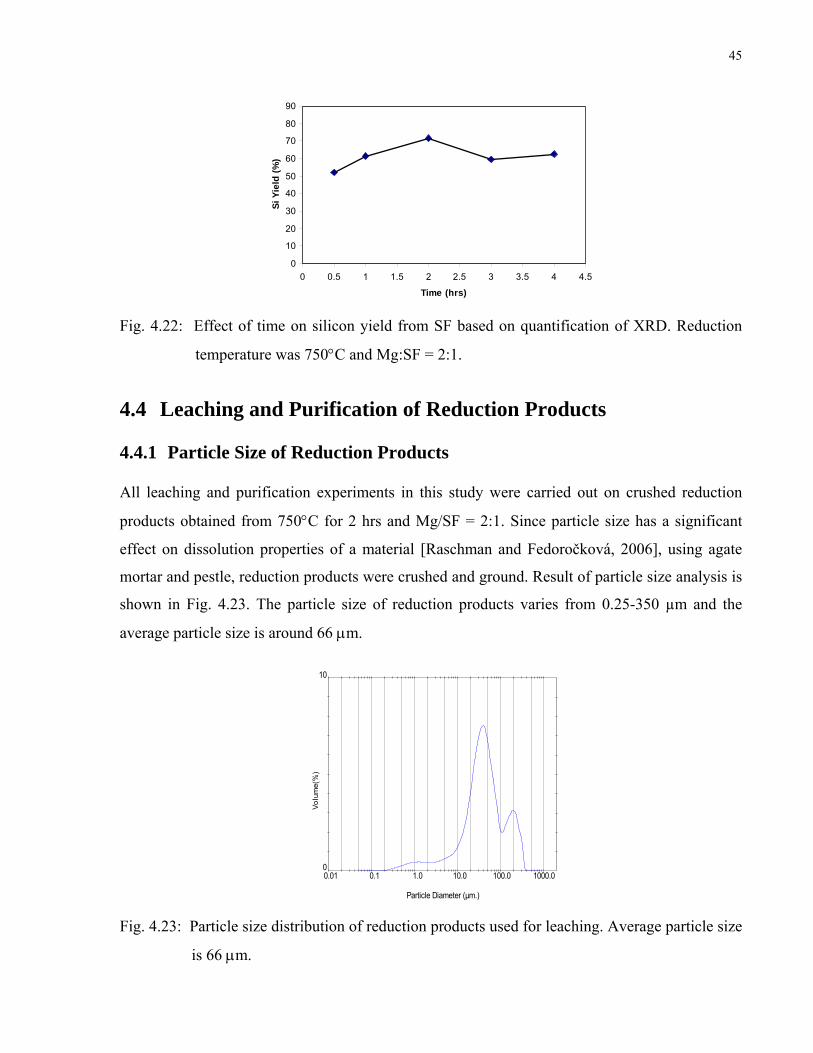
Fig. 3.1: Flow chart of the scheme of experiments. .............................................................. 19Fig. 3.2: Set up for initial leaching of SF with HCl............................................................... 22Fig. 3.3: Schematic diagram of reduction setup.................................................................... 24Fig. 4.1: As received silica fume........................................................................................... 27Fig. 4.2: (a) Typical particle size distributions of as–received silica fume. Mean particle
size is 10 μm and (b) Micrograph from scanning electron microscope showing
typical as- received silica fume............................................................................... 27
Fig. 4.3: Nitrogen adsorption with respect to relative N2 pressure. PS is the sample
pressure and P0 is the saturation pressure. .............................................................
28
Fig. 4.4: Comparison of XRD patterns of as-received silica fume and crystalline
Fig. 4.5: Impurity ratio (final/initial) for leaching of SF with 10% HCl solution………..... 30
Fig. 4.6: Change in colors of silica fume (a) before and (b) after carbon removal
(Temperature: 700°C and Time: 2 hours)...............................................................
31
Fig. 4.7: XRD pattern of as-received silica fume after leaching and decarburization at
700°C for 4 hours....................................................................................................
31
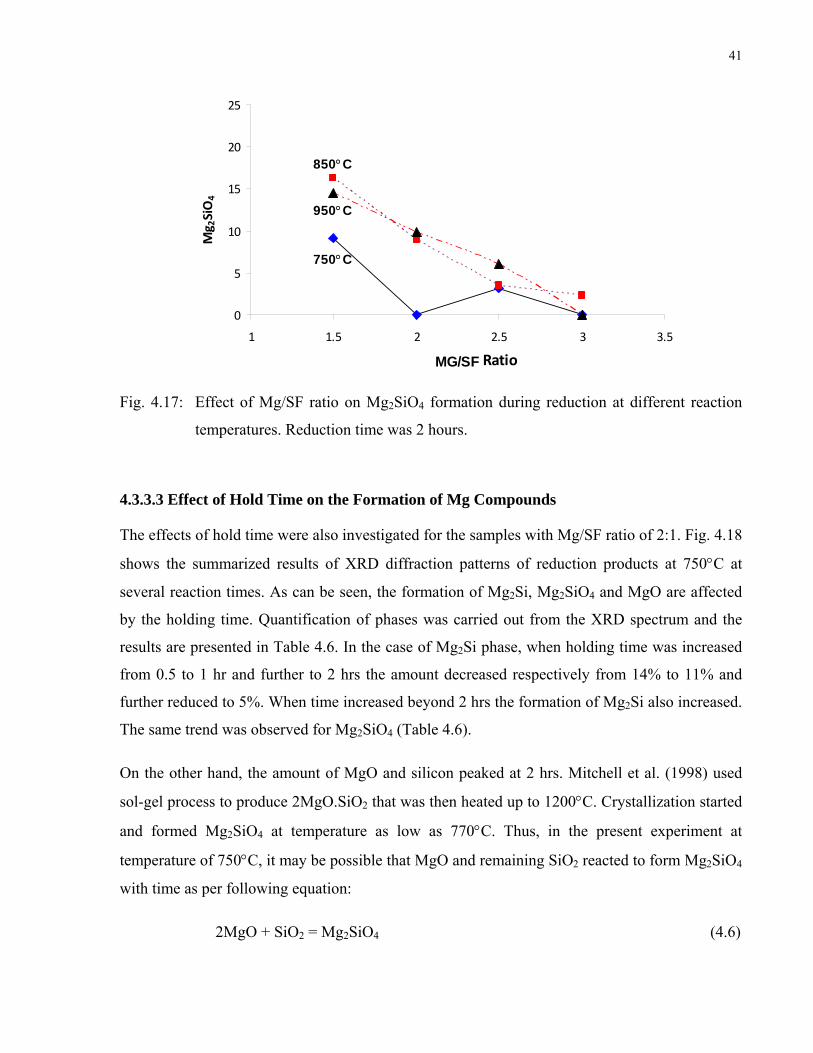
Fig. 4.8: Ellingham diagram for various oxides. .................................................................. 33Fig. 4.9: Comparison of DTA curves for Mg and Ca with silica fume mixtures…………... 33Fig. 4.10: Example of reduced silica fume at 750°C for 2 hrs with ratio of Mg:SF =
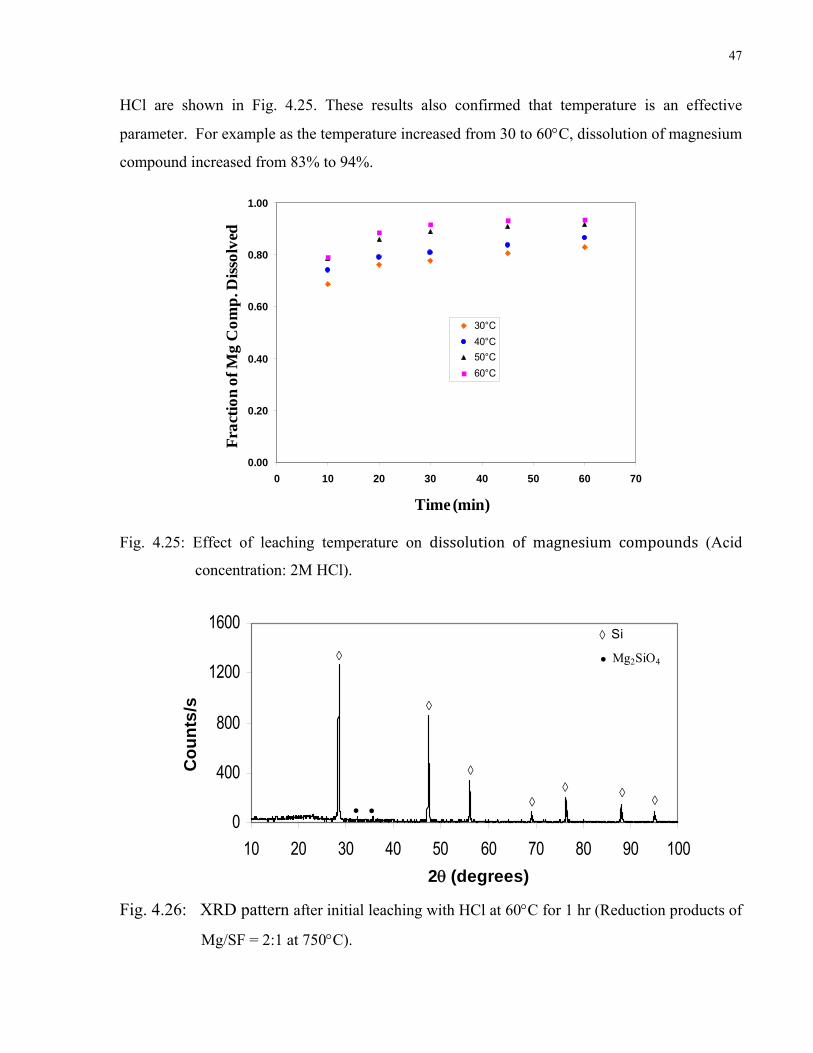
Fig. 4.26: XRD pattern after initial leaching with HCl at 60°C for 1 hr (Reduction products
of Mg/SF = 2:1 at 750°C)........................................................................................ 46
Fig. 4.27: Mass transfer model for MgO particles dissolution in HCl.................................... 47
xi
Fig. 4.28: Mass transfer model fitted by experiments to analyse the dissolution behaviour
of MgO during leaching with HCl...........................................................................
51
Fig. 4.29: Temperature dependence of the rate constant……………..................................... 52
Fig. 4.30: XRD pattern of leached product after leaching with HCl and acetic acid at 60°C
for 1 hr (Reduction products of Mg/SF = 2:1)........................................................
53
Fig. 4.31: XRD pattern of leached product after leaching with HF and acetic acid at 60°C
for 1 hr (Reduction products of Mg/SF = 2:1)........................................................
54
Fig. 4.32: XRD pattern of silicon powder after purifying with hydrofluoric acid and acetic
acid at 70°C for 1 hr (Reduction products of Mg/SF = 2:1)…………..................
54
Fig. 4.33: Silicon powder product after purifying with hydrofluoric acid and acetic acid at
70°C for 1 hr............................................................................................................
55
Fig. 4.34: Particle size distribution (PSD) of silicon powder product..................................... 55
Fig. 4.35: Scanning electron micrograph of purified silicon powder obtained by Mg
reduction and leaching of reduction products.........................................................
55
Fig. 4.36: Solid solubility in Si against segregation coefficient for various elements.
Impurity level in the silicon powder produced in this study (■), maximum
solubility at lower temperature (○) and, solubility at 1410°C (●)........................... 59
1
CHAPTER 1: INTRODUCTION
Non-renewable fossil fuels are our major sources of energy today. Due to environmental
concerns and unsustainable nature of the fossil fuels, alternative energy sources are being sought.
One of the most promising renewable energies is photovoltaic (PV). It is a safe and clean source
of electricity that can suit a wide range of applications. These include space heating and cooling
through solar architecture, house roof heating, day lighting, solar hot water, solar cooking and
high temperature process heat for industrial purposes. Although several materials are used for
manufacture of the solar cells, silicon dominates the PV industry by constituting over 90% of the
solar cells made today. Due to exponential growth of the PV industry, the demand for solar grade
silicon (SoG-Si) has increased tremendously over the past decade. At present, crude silicon
known as metallurgical grade silicon, with 98-99% purity is obtained from quartz rocks by
carbothermic reduction using electric arc furnace. This silicon is further refined into high purity
silicon through expensive and complicated purification process such as CVD process which is
used for production of electronic grade silicon. At the beginning of the PV-activities in 1980s,
the high purity scrap silicon from the microelectronic industry was used by the PV-industry
[Müller et al., 2006]. However, increased demand that surpassed the limited supply of off-
specification electronic grade silicon has created a thrust towards developing a dedicated
technology for production of solar grade silicon.
One of the approaches towards generation of SoG-Si is utilizing materials of very high purity to
produce silicon. As an industrial waste, silica fume could be one of the potential raw materials
for the production of solar grade silicon. This is based on the fact that silica fume is produced as
a byproduct of silicon and ferrosilicon process, as a rich source of SiO2. During the production of
metallurgical grade silicon (or ferrosilicon), several chemical reactions take place within the arc
furnace to produce SiO gas. The gas exits the furnace along with other gaseous species, thus
leaves a significant portion of the less volatile species inside the furnace. The SiO gas then reacts
with oxygen in air and forms silicon dioxide (SiO2) known as silica fume [Lynch, 2009].
Through the formation of silica fume distribution of impurities differ greatly between
metallurgical grade silicon and silica fume. Low content of impurities such as boron in the silica
fume offers a great advantage for production of high purity silicon from this material.
2
There is no reported work in the literature on production of silicon from silica fume. Thus the
primary objectives of this research are:
(a) To explore the possibility of converting silica fume to silicon using magnesiothermic
reduction, and
(b) To determine optimal process conditions in order to achieve a producing high purity
silicon product.
Chapter 2 of this thesis presents a background on the project and also a review of the previous
works on reduction of silica. The details of the experimental work are provided in Chapter 3.
Results are presented and discussed in Chapter 4. Finally, the significant conclusions of the
research are drawn in Chapter 5.
3
CHAPTER 2: LITERATURE SURVEY
2.1 Energy and Environment
Energy sources are divided into two categories: renewable and non-renewable. Renewable
energy sources include solar, wind, geothermal heat, biomass, hydropower, and ocean energy.
The non-renewable energy sources consist of fossil fuel as well as nuclear electricity. As shown
in Fig. 2.1 most of our energy is supplied from non-renewable energy sources, primarily because
they are cheap, easy to process and ship, and relatively non-toxic. In 2008, total global energy
consumption was 474 exajoules among which 80 to 90 percent derived from the combustion of
fossil fuels. The average world power consumption is about 15 terawatts while the usage is
successively increasing, as seen in Table 2.1.
Fig. 2.1: Global energy consumption demand [World energy resources and consumption, 2008].
Table 2.1 World successively increasing consumption for most types of primary energy
resources [World Consumption of Primary Energy, 2008].
Fuel type Average Power in TW 1980 2004 2006
Oil 4.38 5.58 5.74 Gas 1.80 3.45 3.61 Coal 2.34 3.87 4.27 Hydroelectric 0.599 0.933 0.995 Nuclear Power 0.253 0.914 0.929 Geothermal, Wind, Solar Energy, Wood 0.016 0.133 0.158 Total 9.48 15.0 15.8
4
The strong dependence on non-renewable energies poses numerous problems including emission
of greenhouse gases, limited supply resulting in price fluctuations, and depletion of such
resources. Such problems have now become major political issues and the subject of
international debates and regulations.
Supplying energy, while protecting the environment, is essential for sustainable development
[Energy and Environment, 2009] and perhaps the most important challenge of the twenty first
century. It is this need that has created a significant push towards harnessing renewable energies
that are far cleaner (in terms of greenhouse gas emissions) than fossil fuels. However,
technologies are still in the early stages to make the renewable energies a large contributor to the
energy basket. Since the focus of this work is on producing solar grade silicon (SoG-Si) for
photovoltaic applications, this form of energy is discussed in more details.
2.2 Solar Energy
Exploitation of solar energy involves the functional steps of efficient capture, conversion,
utilization and storage. A semiconductor could be used for capturing the energy of the sun’s
radiation as excited electron-hole pairs. However, this avenue is not currently competitive with
fossil fuels for a combination of cost, reliability, and performance reasons, although many routes
are available to produce electricity, fuel, and heat from solar energy.
Photovoltaics (PV) present a prime source of non-polluting energy among renewable energy
sources. The silicon-wafer based technology is the most important technology for PV today
because more than 90% of the annual solar cell production is based on crystalline silicon wafers.
The cost per Wp (Watt Peak) by the direct conversion of sunlight to electrical power by means of
wafer based solar cells has dropped and the conversion efficiency has increased as a result of
better understanding of the conversion limiting factors. The challenge of PV is to decrease the
manufacturing costs per Wp annually by 5% [Müller et al., 2006]. The cost shares per Wp of
multi-crystalline solar systems are approximately as follows:
• Solar grade silicon (SoG-Si): 20%
• Ingot and wafer production: 28%
• Solar cell processing: 13%,
5
• Solar module processing: 9%
• Installation of the PV-system including converter costs: 30%.
There are two main ways to achieve the cost reduction since approximately half of the costs are
caused by feedstock, bulk silicon production and wafer manufacturing. One way is the
development of a dedicated process for production of cheap SoG-Si feedstock material; the other
way is the development of cheap ingot manufacturing processes for multicrystalline silicon
wafers. Finally, the reduction of the silicon demand per Wp by means of the reduction of wafer
thickness and kerf loss and the increase of solar cell and module efficiency will also contribute to
the cost reduction of PV-systems.
A study shows that multi-crystalline silicon technology, currently operating at the lowest direct
production costs of 2.10 US$/Wp, still has a potential for further reductions arriving at direct
module production costs of 1.15 US$/Wp by the year 2010, and being even competitive with thin
film technologies. The cost reduction potential for the direct module of the different PV
technologies has been estimated according to four major categories: cell efficiency, yield,
production scale and material/consumables. Table 2.2 shows the estimated cost reduction
scenario for multi-crystalline silicon modules [Sarti and Einhaus, 2002].
Table 2.2 Direct cost reduction potential for multi-crystalline PV modules [Sarti and Einhaus,
2002].
Year 2000 Year 2010 Direct costs 2.10 US$/Wp 1.15 US$/Wp Cost reduction potential based on Cell efficiency (%) 14 17 Yield (%) 85 90 Production scale (MWp) 10 100 Materials ~ 20% silicon consumption
2.3 Demand for Solar Grade Silicon Fig. 2.2 shows the predicted growth in demand of silicon by the PV industry with approximately
5,000 tons in 2001 and 140,000 tons in 2020 [Müller et al., 2006]. This growth may not be
reached only by the present supply route. Securing the availability of SoG-Si at low costs would
6
be the main goal for the coming years through mass production. The shortage of SoG-Si is
leading to high prices. The PV industry experienced a deficit in silicon feedstock since 2005
resulting in prices as high as 450$/kg silicon in 2008. The need for novel technological solutions
for the processing of SoG-Si is aimed at a cost of 12-15 $/kg [Khattak and Schmid, 1987].
Therefore, it is essential to develop an independent, dedicated, energy efficient silicon feedstock
supply chain, which secures supply of low cost silicon to the PV industry [Wærnes et al., 2006].
Fig. 2.2: Demand and capacity of silicon production in tons [Müller et al., 2006].
In the metallurgical industry, metallurgical grade silicon (MG-Si) is produced by carbothermic
reduction of quartz at a capacity of 900,000 ton/yr with a purity of about 99%. The main
impurities are Fe, Al, P and B. Half of the silicon produced is used as an alloying element for
aluminum, and 45% is used in the silicone industry. The remaining 5% constitutes the raw
material for the semiconductor industry [Wærnes et al., 2006].
The silicon required for electronic application is of typical purity of 9N, thus it has to go through
a very energy consuming process in order to achieve the purity that is required by the
semiconductor industry. The quality requirements for electronic grade silicon (EG-Si) are higher
than for SoG-Si, at least for specific cases such as carbon and dopants. Silicon from the
semiconductor industry is not a very good alternative as the price is too high (30-40 times higher
than MG silicon and twice as much as the reject or non-prime material in today’s solar cells). A
new process route for feedstock to solar cells is thus of prime importance [Müller et al., 2006].
7
2.4 Specification of Solar Grade Silicon
Table 2.3 shows the specification of solar grade silicon and it is a compromise between the
necessary purity of SoG-Si and the reduction of manufacturing costs for dedicated SoG-Si
[Müller et al., 2006]. The increasing demand of SoG-Si in 2004 and 2005 led to a shortage of
SoG-Si for PV in 2005 which triggered additional discussions about the upper purity level for
SoG-Si. To achieve solar cell efficiencies of 17 or 18% on multi-crystalline silicon wafers in
particular it is crucial to minimize the level of transition metals in the raw Si material. To achieve
low enough impurity levels, usually it is essential to use a method that involves easily cleanable
silicon compounds like trichlorosilane (TCS) or monosilane. In the last five years, different
activities have been started or accelerated to purify metallurgical grade silicon by means of
directional solidification including additional steps to remove boron and phosphorus. It is a
significant challenge to achieve the mentioned impurity levels shown in Table 2.3 with low
manufacturing costs [Müller et al., 2006].
Table 2.3 Chemical impurities in solar grade silicon [Müller et al., 2006].
Element ppm
at/cm3
O 1 5x10¹⁶ C 1 5 x10¹⁶ B 0.5 2.5 x10¹⁶ P 0.025 1.25 x10¹⁶ As 0.025 1.25 x10¹⁶ Fe, Al, Cr, Ni, Ti, Mo, V, Cu, Zn Summed maximum 0.1 5 x10¹⁶ Concentration of each not mentioned metal <5.0 x10¹⁶
One purification method reported in literature is to upgrade economical metallurgical grade
silicon to higher grade of silicon using plasma purification. Target impurity concentrations are
summarized in Table 2.4 and are compared to typical impurity concentrations that are found in
MG silicon [Sarti and Einhaus, 2002]. The impurity levels of upgraded metallurgical grade
(UMG) and solar grade silicon shown in Table 2.5 have been obtained in a plasma purification
reactor [Alemany et al., 2001].
8
Table 2.4 Target impurity concentrations in upgraded metallurgical grade (UMG) silicon and
SoG-Si [Sarti and Einhaus, 2002]. All values in ppmw.
Impurities
MG-Si UMG-Si SoG-Si
B 40 <30 <1 P 20 <15 <5 O 3000 <2000 <10 C 600 <250 <10 Fe 2000 <150 <10 Al 100-200 <50 <2 Ca 500-600 <500 <2 Ti 200 <5 <1 Cr 50 <15 <1
Table 2.5 Obtained impurity concentrations in SoG silicon after plasma purification. All values in
ppmw, measurements by ICP and GD-MS [Sarti and Einhaus, 2002].
Impurities
UMG-Si SoG-Si
B 15-20 0.5-2.0 P 20-30 10-20 O 500 <10 C 100 10-15 Fe 30-90 <1.0-10 Al 80-90 <1.0-5 Ca 250-450 <1.0-10 Ti 5 <0.5
2.5 Methods for Reduction of Silica 2.5.1 Carbothermic Reduction
Silicon can be obtained from the reduction of quartz in the presence of carbon at high
temperature. At present, silicon (metallurgical grade silicon) is being produced using electric arc
furnace based on carbothermic reaction. Fig. 2.3 shows the schematic diagram of electric arc
furnace for production of metallurgical grade silicon. In this process, quartz rock and various
reducing agents such as coke, coal and wood chips are charged to the furnace and the
temperature raised up to 2400K (2127°C) by electric arc. Silica is reduced by the reaction with
9
carbon. The following intermediate reactions occur to complete the reduction process [Lynch,
2009]:
SiO2(l) + Si(l) = 2SiO(g) (2.1)
SiO(g) + 2C(s) = SiC(s) + CO(g) (2.2)
SiO(g) + SiC(s) = 2Si(l) + CO(g) (2.3)
Quartz Rock & Reducing Agents
Fume, Flames & Off-gas
Air
Quartz & Reducing Agents
Oxide RefractorySiC
Viscous Silica
Taphole
Viscous Drop of Silica formed at 2200K
Cavity SiO(g) & CO(g)
2300K
SiC & Si(l)
Furnace Centre line
SiO2
1300 - 2000K
Arc
Electrode
Fig. 2.3: Schematic diagram of electric arc furnace for production of silicon [Schei et al., 1998;
Lynch, 2009].
In this process the reductant mixture consisting of lignite, petroleum-coke, charcoal and wood
chips are the major source of various contaminants in the end product, and hence the purity level.
In Brazil, the process for obtaining metallurgical silicon uses not only high-quality quartz but
also charcoal as a reducing agent. This is reflected in the quality of Brazilian metallurgical
silicon, which, under well-controlled processing conditions and raw material, can reach a purity
of up to 99.88% [Pires et al., 2005].
2.5.2 Aluminothermic Reduction This reduction process, which uses aluminum as the reducing agent is commonly known as
aluminothermic reduction. Since aluminum is a more active metal than silicon, it can reduce
silicon dioxide to produce silicon. Such reaction is highly exothermic in nature and the liberated
heat is adequate to sustain the reaction by the rapid propagation of a combustion front without
further addition of energy. Use of aluminothermic reduction has been suggested for production
of composite materials. Examples of reactions for making composite materials are [Das et al.,
2002]:
10
Cr2O3 + 2Al = 2Cr + Al2O3 (2.4)
TiO2 + 4/3Al + C = TiC + 2/3Al2O3 (2.5)
3Fe3O4 + 8Al = 9Fe + 4Al2O3 (2.6)
SiO2 + 4/3Al + C = SiC + 2/3Al2O3 (2.7)
2MoO3 + 4Al + C = Mo2C + 2Al2O3 (2.8)
Also synthesis of alumina-aluminum-silicon composite materials has been suggested using
aluminothermic reduction with a mixture of Al and SiO2 by the following reaction [Wang and
Shi, 2002].
3SiO2 + 4Al = 2Al2O3 + 3Si (2.9)
This reaction can be applied for the production of silicon. However, once alumina is formed
through the above reaction and in presence of silica, there are other two possible reactions for the
formation of mullite and the reduction of silicon from mullite:
3Al2O3 + 2SiO2 = Al6Si2O13 (2.10)
8Al + 3Al6Si2O13 = 13Al2O3 + 6Si (2.11)
The formation of mullite and alumina as the reduction products of aluminothermic reduction
may not be suitable for acid leaching.
2.5.3 Calciothermic Reduction
Calciothermic reduction is similar to aluminothermic reduction. A research project on the
reduction of amorphous silica (obtained from rice husk) to silicon of reasonable purity by a
calciothermic process using calcium was carried out by Mishra et al. (1985). The reaction
occurred is as following:
SiO2 + 2Ca = 2CaO + Si (2.12)
Reduction of amorphous silica to silicon by calcium was carried out at 720°C. It has been
reported by Mishra et al. (1985) that final purity of silicon was 99.9% after acid leaching with
concentrated HNO3 and HF.
11
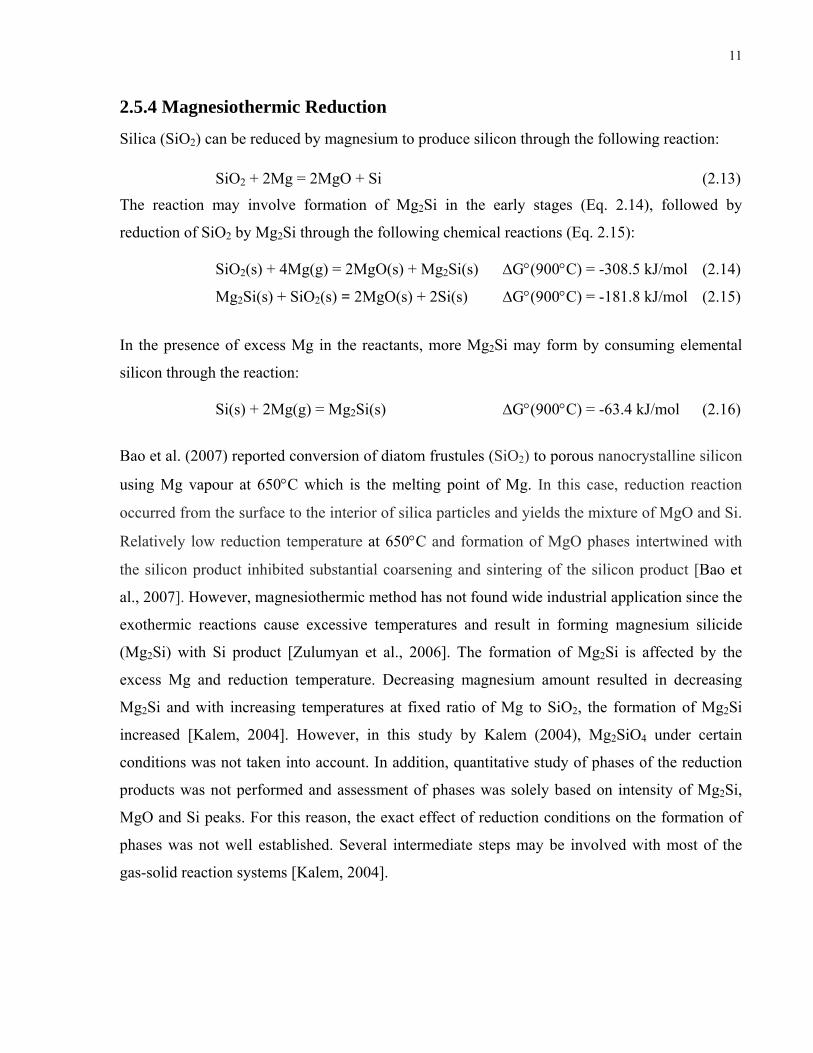
2.5.4 Magnesiothermic Reduction Silica (SiO2) can be reduced by magnesium to produce silicon through the following reaction:
SiO2 + 2Mg = 2MgO + Si (2.13)
The reaction may involve formation of Mg2Si in the early stages (Eq. 2.14), followed by
reduction of SiO2 by Mg2Si through the following chemical reactions (Eq. 2.15):
Bao et al. (2007) reported conversion of diatom frustules (SiO2) to porous nanocrystalline silicon
using Mg vapour at 650°C which is the melting point of Mg. In this case, reduction reaction
occurred from the surface to the interior of silica particles and yields the mixture of MgO and Si.
Relatively low reduction temperature at 650°C and formation of MgO phases intertwined with
the silicon product inhibited substantial coarsening and sintering of the silicon product [Bao et
al., 2007]. However, magnesiothermic method has not found wide industrial application since the
exothermic reactions cause excessive temperatures and result in forming magnesium silicide
(Mg2Si) with Si product [Zulumyan et al., 2006]. The formation of Mg2Si is affected by the
excess Mg and reduction temperature. Decreasing magnesium amount resulted in decreasing
Mg2Si and with increasing temperatures at fixed ratio of Mg to SiO2, the formation of Mg2Si
increased [Kalem, 2004]. However, in this study by Kalem (2004), Mg2SiO4 under certain
conditions was not taken into account. In addition, quantitative study of phases of the reduction
products was not performed and assessment of phases was solely based on intensity of Mg2Si,
MgO and Si peaks. For this reason, the exact effect of reduction conditions on the formation of
phases was not well established. Several intermediate steps may be involved with most of the
gas-solid reaction systems [Kalem, 2004].
12
2.6 Solar Grade Silicon Processing Methods
2.6.1 Chemical Vapor Deposition (CVD): Siemens Process
Currently, the dominant process for production of electronic and solar grade silicon uses
chemical vapor deposition technology known as the Siemens process. It is related to the
purification of silicon consisting of decomposing trichlorosilane on an inverse U-shape hot
filament (silicon seed) by the following reaction (Eq. 2.17) [Woditscha and Kochb, 2002]. High
current, up to 2 kA flows between the cathode and anode of the silicon seed where the
temperature is reached between 1050°C and 1150°C.
HSiCl3(g) + H2(g) = Si + 3HCl (2.17)
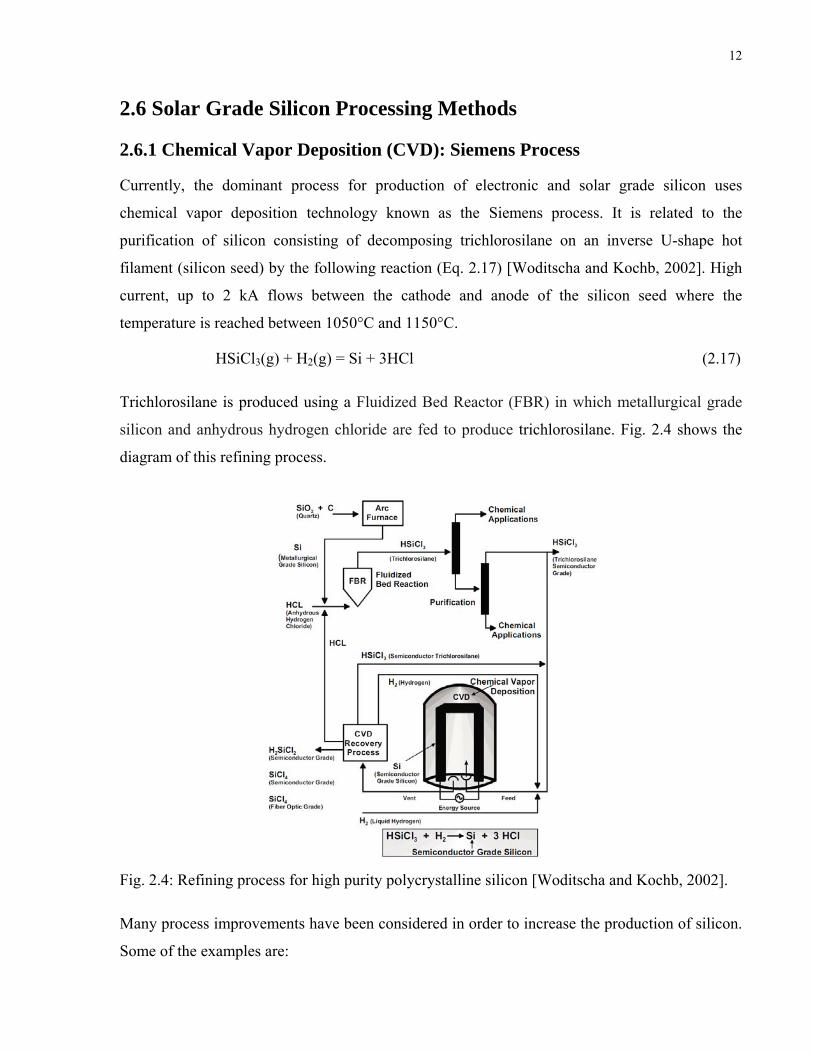
Trichlorosilane is produced using a Fluidized Bed Reactor (FBR) in which metallurgical grade
silicon and anhydrous hydrogen chloride are fed to produce trichlorosilane. Fig. 2.4 shows the
diagram of this refining process.
Fig. 2.4: Refining process for high purity polycrystalline silicon [Woditscha and Kochb, 2002].
Many process improvements have been considered in order to increase the production of silicon.
Some of the examples are:
13
i) Wacker Chemie AG Process: It is a continuous vapour deposition technique. It involves
deposition in fluid-bed reactor in which a gaseous mixture of trichlorosilane and
hydrogen flows through a bed containing silicon seed grains. A constant flow of
hydrogen is fed from the lower to the upper portion of the tube. The hydrogen flow
agitates the silicon seeds thereby creating favourable deposition of polycrystalline silicon
on the surface of the grains [Braga et al., 2008].
ii) Vapor-to-Liquid Deposition (VLD) Process: It was developed by Tokuyama Corporation
in 2005. This process is also a variation of the Siemens process. In this process,
trichlorosilane gas decomposes over a silicon liquid film instead of solid silicon seed
[Braga et al., 2008; Tokuyama Corp., 2007].
iii) MEMC process: Silane gas was produced from hexafluorosilicic acid (H2SiF6) by
reaction with sodium aluminium hydride (NaAlH4). Silane (SiH4) is decomposed in a
Fluidized Bed Reactor to silicon and hydrogen. [Woditscha and Kochb, 2002].
iv) Chisso Corporation Process: In this technology, silicon tetrachloride, produced by the
chlorination reaction of metal silicon, is reduced by zinc vapor to produce high purity
grade polysilicon. The by-product zinc chloride is separated by electrolysis into zinc and
chlorine. The latter is mixed with hydrogen to produce HCl which is recycled back to the
process [Bernreuter Research, 2010].
2.6.2 Direct Metallurgical Route Metallurgical routes involve obtaining SoG-Si directly from metallurgical grade silicon by
various processes such as slag treatment, plasma melting, vacuum melting, injection of various
gases into silicon, and acid leaching. This route for production of silicon can be more energy
efficient than the conventional Siemens process [Waernes, 2006]. In this section, the methods
that are in the development stage are discussed briefly.
i) SOLSILC Project: This proposes the development of SoG-Si by carbothermal reduction
of silicon, based on the use of high purity quartz from natural sources and high purity
carbon black. It used a two-step reduction process as shown in Fig. 2.5. First producing
SiC in a plasma furnace and the second producing Si from this SiC in a submerged arc
14
furnace. Finally, carbon removal is carried out by oxidizing dissolved carbon by Ar and
H2O [Geerligs, et al., 2002].
Fig. 2.5: Schematic process sequence of production of solar grade silicon in SOLSILC [Geerligs
et al., 2002].
ii) Elkem ASA: This process involves pyrometallurgical refining by adding calcium
containing compound in molten silicon. Purification is done by chemical treatment using
aqueous acid solutions [Ceccaroli and Friestad, 2005].
iii) Kawasaki Method: With the objective of eliminating P, Al and Ca from MG-Si, the
Japanese Kawasaki Steel Corporation uses electron beam smelting with graphite holding
vessel instead of copper vessel to achieve high heat efficiency for evaporation of
impurities [Hazanawa et al., 2001]. Argon plasma process containing water vapour over
melted silicon is used for removal of boron [Yuge et al., 1994]. Electron beam melting in
a copper vessel under high vacuum is also investigated [Pires et al., 2005]. This can
eliminate majority of impurities about 99-100% except boron.
2.7 Silica Fume (SF)
Silica fume is very fine non-crystalline silica that is produced in electric arc furnaces (EAF) as a
by-product from the production of silicon metal and also of ferrosilicon. Electric arc furnaces
(Fig. 2.4) used in the manufacture of silicon metal or ferrosilicon, release silica fume as a
byproduct. The fume has a high content of very fine spherical particles of silicon dioxide. It is a
very effective agent for strengthening cement material [Silica Fume User’s Manual, 2005]. Silica
fume is also known as condensed silica fume or microsilica. The path for formation of silica
fume is shown in Fig. 2.4 previously. Quartz rock and reducing agents are charged in the electric
15
arc furnace (EAF) and metallic silicon is produced when operating temperature rises to 2300K.
The following chemical reactions occur inside the cavity of EAF [Lynch, 2009; Wong, 1995]:
SiO2(s,l) + C(s) = SiO(g) + CO(g) (2.18)
SiO2(s,l) + Si(l) = 2SiO(g) (2.19)
SiO2(l) + C(s) = SiO(g) + CO(g) (2.20)
SiO(g) + ½O2(g) = SiO2(s) (silica fume) (2.21)
Some silicon monoxide (SiO) gas escapes from EAF as fume which reacts with oxygen in air
and forms silicon dioxide (SiO2) that is condensed as silica fume and collected in the baghouse.
The condensed fume, which has a high content of very fine spherical particles of silicon dioxide,
is collected by filtering the gases escaping from the furnaces [Malhotra and Carette, 1982]. There
are two types of silica fume commercially available: (i) white and (ii) grey which contains more
carbon (Fig. 2.6). The data of chemical analysis from literature for the silica fume are shown in
Table 2.6.
(a) (b)
Fig. 2.6: Silica Fume: (a) white and (b) grey [Silica Fume User’s Manual, 2005].
Table 2.6 The chemical compositions of silica fume. [Youssef et al., 1998; Agarwal, 2006]
Constituent wt%
wt% SiO2 93-96 90.5 Al2O3 0.20 0.90 Fe2O3 0.50 0.10 CaO - 0.40 MgO 0.50 2.0 Na2O 0.20 0.27 SO3 0-1.5 - LOI (Loss on Ignition) 0.52 2.5
16
The fume mostly is amorphous in nature according to XRD analysis shown in Fig. 2.7. Other
constituents are C, S and the oxides of Al, Fe, Ca, Mg, Na and K. The chemical composition of
the fume varies according to the type of alloy or metal being produced. For example, the fume
from a ferrosilicon furnace will generally contain more iron and magnesium oxides than that
from a furnace producing silicon metal. A typical material has a specific surface area of 28 m2/g
and 95% SiO2 content [Silica Fume User’s Manual, 2005].
Fig. 2.7: XRD of silica fume [Youssef et al., 1998].
Silica fume particles are extremely small and scanning electron micrographs of the particle size
and shape are shown in Fig. 2.8. The shape of silica fume as illustrated from the electron
micrographs is more or less spherical.
Fig. 2.8: Electron photomicrograph of silica fume: the longer white bar is 1 μm long [Silica
Fume User’s Manual, 2005]
The presence of impurities in silicon, particularly boron and phosphorus is evident from the
thermo-chemistry of the arc furnace reactions. Myrhaug and Tveit (2000) developed a boiling
point model for 30 impurity elements using mass balances at the high temperatures and the
reducing conditions in the arc furnace. The results of their study are summarized in Fig. 2.9. As
seen, some elements especially boron are expected to remain in silicon due to the fact that
boiling point of boron is higher than the operating temperature in the EAF. This means boron
17
content expected to be very low in silica fume. In contrast, elements with boiling points lower
than the operating temperature in the furnace such as sulphur and magnesium are expected to
escape into the off-gas. Elements with boiling points between two temperature limits (cavity and
top bed temperatures) were expected to distribute between the silicon, off-gas, and silica fume
(Fig. 2.9). It reveals that industrial practice is in agreement with the model, with the most serious
disagreement involving phosphorus i.e. all phosphorus should be volatilized as per prediction of
that model, whereas only approximately 25% of the phosphorus escapes from the furnace.
to Silicon
Silicon Filtered off -GasSilica Fume
Impurity Elements Expected to Report to Silicon
Expected Variation in Distribution of Impurity Element
Impurity Elements Expected to Report to Silica Fume or Off-Gas
Cavity Temp.Top Bed Temp.
Fig. 2.9: Boiling point model of impurities in silica fume during production of silicon metal
[Myrhaug and Tveit, 2000].
Up to now, there is no documented research on synthesis of silicon from silica fume. The idea of
using silica fume as the starting material for production of high purity silicon was put forward
based on the anticipation that a significant portion of the impurities do not leave to the gas phase
during the production of metallurgical grade silicon. Further, it was expected that those
impurities that volatize and appear in the gas are likely to condense at a temperature different
18
than condensation of silica fume. Thus they may not be intimately mixed with or dissolved in the
SiO2 and could potentially be removed by a purification step such as acid leaching before
reduction. It was based on this hypothesis that purification and reduction of silica fume was
undertaken to evaluate its viability for production of high purity, preferably solar grade, silicon.
2.8 Initial Leaching of Silica Based Materials and Purification of Reduction Products
2.8.1 Leaching Periclase (MgO)
Banerjee et al. (1982) and Ikram and Akhter (1988) studied magnesiothermic reduction of silica
produced from rice husk. In these reduction products one of the major phases is magnesium
oxide. Reduction products were leached with HC1 in order to remove MgO. Chemical
dissolution of periclase (MgO) has been intensively studied and it was observed by various
authors [Raschman and Fedoročková, 2004;` Segall et al., 1978; Fruhwirth et al., 1985]. For
example, Raschman and Fedoročková (2004) studied the inhibiting effect of acid concentration
on the dissolution rate of magnesium oxide during the leaching of dead-burned magnesite and
found that the dissolution of MgO was strongly affected by temperature, acid concentration and
particle size while the effect of composition of the solid was insignificant. In addition to these
detailed studies on MgO dissolution in diluted HCl, dissolution of MgO in HNO3 and H2SO4 has
also been studied [Fedoročková and Raschman, 2008]. The overall dissolution process may be
controlled by the following surface chemical reaction [Raschman and Fedoročková, 2006]:
MgO(s)+2H(aq)+ = Mg(aq)
2+ +H2O (2.22)
Also the reaction order for H+ ions seems not to be affected by the type of acid used and is
controlled by different reactions between surface anions and cations created by dissociation of
different acids [Fedoročková and Raschman, 2008].
2.8.2 Removal of Other Impurities from Silicon
Many impurities like magnesium silicate or orthosilicate were leached with HF followed by HF
and H2SO4 which were more or less completely removed [Ikram and Akhter, 1988]. On the other
hand, magnesium compounds (silicate) and untreated silica were leached with a mixture of
19
concentrated H2SO4 and HF at around 110°C in a Teflon vessel [Banerjee et al., 1982]. After
acid treatment the products were washed and dried. The final products were fine powders of
silicon.
20
CHAPTER 3: EXPERIMENTAL PROCEDURES
3.1 Overview The main purpose of this research is to characterize silica fume and to study feasibility of its use
in generation of solar grade silicon. The experiments were designed to investigate basic steps of
a complete process that consists of (i) Preliminary purification of silica fume to dissolve soluble
impurities, (ii) Reduction of silica fumes with Mg powder to produce metallic silicon and (iii)
Post-reduction leaching and refining of reduction products for the dissolution of Mg compounds.
The objective of the research is to study each of these steps and optimize the conditions to obtain
maximum yield and/or purity of Si. Fig. 3.1 shows the scope of experiments followed to achieve
the objective of this study.
Reduction by Mg
As received Silica Fume (SiO2)
XRD, QXRD, SEM
Step 1 Leaching (MgO and Mg2Si removal)
Step 2 Leaching (Mg2SiO4 removal)
Silicon
Purification
Reduction product
XRD, ICP, SEM
Characterization
Optimal Conditions
Optimal Conditions
Leaching and Decarburization
Step 3 Leaching (SiO2 removal)
Optimal Conditions
Optimal Conditions
Fig. 3.1: Flow chart of the scheme of experiments.
21
3.2 Materials Characterization
Silica fume (Country of origin: Norway) was procured from Process Research Ortech Inc.,
Mississauga, Ontario. The material was subjected to various tests to characterize its physical and
chemical characteristics.
3.2.1 Particle Size Distribution and Morphology
Malvern S Mastersizer was used to determine the particle size distribution of as-received silica
fume. It utilizes the laser diffraction method to portray particle size distribution of samples. One
gram of powder sample was suspended in water and stirred at 2100 RPM. Ultrasonic waves were
applied to break any agglomerates that might have been present in the suspended samples to
provide an accurate particle size distribution. The diffraction pattern obtained is analyzed by a
software and particle size distribution curves are plotted. The technique assumes spherical shape
of particles.
Scanning electron microscopy (SEM, Model: Hitachi S-570; URSA EDX system, Japan) was
performed on the as received silica fume to study the morphology and shape of the particles.
3.2.2 Specific Surface Area
The instrument used to measure the specific surface area was a SA3100 Surface Area and Pore
Size Analyzer, made by Coulter (Boca Raton, FL). The measurements are done in three steps:
outgassing, free space determination, and generation of an isotherm. It used helium as a backfill
gas to determine specific-surface-area (SSA) and the free space of the sample. The adsorbate gas
was nitrogen. Both of these gases were grade 5.0. Outgassing was done at 120°C for 1 hour at
less than 0.1 mmHg. The surface area was determined using the 5 point Brunauer, Emmett, and
Teller (BET) method, and the pore size distribution using the Barrett, Joyner and Halenda (BJH)
method. The purpose of outgassing is to remove volatile impurities such as moisture from the
surface of the sample before analysis. The sample and holder were then weighed, and the result
was subtracted from the mass of the holder to obtain the sample mass. At this point the analysis
was begun, the first step of which was free space calculation.
A plot of the volume of helium injected versus pressure will yield a slope that is equivalent to the
sample tube free space per unit of sample pressure, i.e., the free space correction (Coulter Corp.,
22
1996). The final step in the analysis is the creation of the adsorption isotherm. This involves a
similar measurement as is used in the calculation of the free space correction; however nitrogen
is used rather than helium. Once the injected gas volume is found, the free space determined
previously is subtracted from this value to obtain the volume of gas adsorbed by the sample. The
pressure is measured each time nitrogen is injected, as before, for a specified number of data
points. The resulting plot - called the adsorption isotherm - gives the amount of adsorbate gas
that is capable of condensing onto the sample at a given pressure and constant temperature.
In order to calculate SSA, the BET method is used. This calculation requires only the first
portion of the plot (the Coulter SA 3100 measures from near vacuum to 0.2 PS/P0, where PS is
the sample pressure and P0 is the saturation pressure), and assumes that only a uniform
monolayer of nitrogen molecules adsorbs to the surface of the specimen being analysed. The
linear form of the BET [Brunauer et al., 1938] function is expressed as follows:
0
S
MMS0A
S
PP
CV1C
CV1
PPVP
⎟⎟⎠
⎞⎜⎜⎝
⎛ −+=
− (3.1)
where VA is the volume of nitrogen adsorbed, VM is the volume of the monolayer, and C is a
constant related to the enthalpy of adsorption (Coulter Corp., 1996). The parameters VM and C
are unknown, but are determined by plotting PS/[VA(P0-PS)] versus PS/P0 and determining the
slope and y-intercept. The slope should be equal to (C-1)/(VMC) and the y-intercept equal to
1/VMC. This produces two equations with two unknowns, which may then be solved. The total
surface area of the sample, SA, is then calculated using the following equation:
g
MAM
VANVSA = (3.2)
where NA is Avogadro’s Number, AM is the cross-sectional area of a nitrogen molecule, and Vg is
the volume of one mole of an ideal gas (Coulter Corp., 1996). In this study, the adsorption
isotherm data from within the relative pressure range of 0.05 to 0.2 was used to solve Eq. 3.1.
The SSA is finally determined by dividing the result of Eq. 3.2 by the mass of the sample, which
is the only input required by the device.
23
3.2.3 X-Ray Diffraction of Silica Fume
The X-ray diffraction spectra of as-received silica fume were taken using an X-ray
diffractometer [Phillips Powder Diffractometer (Generator: PW1830); Cu X-ray tube; Control
unit: PW1310]. Copper Kα radiation with the wavelength of 1.540560 Å was used as a
monochromatic X-ray source to bombard the sample. The operating voltage and current were 40
KV and 40 mA respectively. The scans were conducted over a 2θ angular range of 10° - 100°
with a speed of 1 degree per minute. The XRD patterns obtained were used for both qualitative
and quantitative determination of the existing phases within the sample.
3.2.4 Chemical Analysis As-received silica fume was analyzed by an external laboratory (International Plasma Lab Ltd.,
British Columbia, Canada).
3.3 Purification of Silica Fume 3.3.1 Impurity Removal from as Received Silica Fume Before reducing SF, it was decided to remove the impurities that are easily leachable, to avoid
their integration into Si, due to the high temperature process of reduction. As-received silica
fume was leached initially in 0.1N HCl at 60 and 90°C for 1 and 4 hrs. The material was
subsequently washed several times with deionized water and vacuum filtered followed by drying
in an oven at 120°C for approximately 4-5 hours.
Fig. 3.2: Set up for initial leaching of SF with HCl.
24
The apparatus shown in Fig. 3.2 was used for leaching, and is composed of a Teflon beaker,
mantle heater, Teflon coated impeller and thermometer. HCl solution containing silica fume was
stirred vigorously during the leaching operation. A larger batch of SF was treated under the
optimum leaching conditions to prepare sufficient material for subsequent treatment. A sample
was analyzed by an external laboratory, as described earlier.
3.3.2 Carbon Removal
The silica fume contained about 0.5% C. It was subjected to roasting in air for 4 hours at 700°C
in a muffle furnace. The carbon content of the product was measured using the LECO
combustion technique (0.5 gm sample).
3.4 Selection of Reducing Agent for SF Two candidate reducing agents were evaluated, Mg and Ca, as both are thermodynamically
favored to reduce SiO2. To determine the exact reduction temperature of silica fume with Ca and
Mg, and to obtain an approximate idea of the reaction mechanism involved in the process, DTA
[Netzsch STA-409 ‘Luxx’ system, Netzsch, Germany; Temperature 1500°C] studies of SF-
reducing agent mixtures were conducted. 59-64mg of the powder mixture under investigation,
together with the reference sample (in this case, alumina powder), were heated at a uniform rate
of 10°C/min to 1150°C. The alumina powder used as the reference was initially fired at about
1150°C for about 4 hours to remove all moisture.
3.5 Conversion of Silica Fume to Metallic Silicon
3.5.1 Reduction Procedures A schematic diagram of the reduction setup is shown in Fig. 3.3. A mixture of purified SF and
Mg granules of 98% purity (Sigma Aldrich, Canada) was prepared by weighing appropriate
amounts of Mg and silica fume, then blending them well using a stainless steel scoop. 2 grams of
the mixture was placed within an alumina tube of 25 mm inner diameter with wall thickness of 9
mm. The tube was then inserted within another mild steel tube which was sealed tightly by two
end caps. The gap between alumina tube and mild steel tube was filled with alumina powder.
The sealed and assembled reaction tube was then inserted within a muffle furnace. The
temperature was raised at the rate of 5°C/min to the target temperature. After the desired dwell
25
time, the furnace was switched off and the sample was cooled slowly to room temperature within
the furnace. A thermocouple inserted from the front door of the furnace recorded the temperature
close to the tube. After cooling to room temperature, the reaction products were removed and
mildly hand-milled in an agate mortar.
Reaction Tube
Mg Powder and Silica Fume Mixtures
Alumina powder
Alumina Tube
Furnace
Brick Insulation
Powder Type Insulation
Thermocouple
Brick Cover
Ceramic Core
Heating Element
Steel Tube
Fig. 3.3: Schematic diagram of reduction setup.
3.5.2 Experimental Variables for Reduction
Experimental teat variables considered in this study were Mg to silica ratio, temperature and
time. Reduction tests were carried out at various Mg to silica fume ratios of 3:1, 2.5:1, 2:1, 1.5:1.
Mg to silica fume (SF) was calculated on the basis of molar ratio assuming silica content in SF is
100%. The reduction tests were conducted at three temperatures; 750, 850 and 950°C (furnace
temperatures). The dwell times were changed from 0.5 to 4 hours.
3.5.3 Characterization of Reduction Products The particle size distribution and specific surface area of the product were determined by the
methods mentioned earlier. The samples were also subjected to XRD for phase identification. In
addition, the spectra were analyzed to yield the quantity of each phase detected by XRD. The
26
method is based on the Reitveld treatment of the XRD peaks [Madsen et al., 1991]. The
computer package used for this purpose was Topas, v. 2.1, (2003).
3.6 Leaching and Purification of the Reduction Products The grounded reaction product was leached in three stages. XRD patterns show presence of
MgO, Mg2Si, Mg2SiO4, and SiO2 in addition to Si. Various leachants should be used for
effective removal of each phase. In the first stage, the powders were leached in HCl solutions of
varying concentrations (1M, 2M and 4M) to remove MgO and Mg2Si, at the temperature range
of 30 to 60°C and for 10 to 60 minutes leaching. Continuous magnetic stirring was applied for
effective leaching to take place. The HCl-leached product was washed thoroughly with deionized
water and dried after each stage of leaching. The second stage involved leaching the material
with optimized 2M HCl and 25% CH3COOH [Larbi, 2010], to dissolve Mg2SiO4. In the third
stage of leaching, the acid-purified leached products were further treated with 4.8% hydrofluoric
acid (HF) and 25% CH3COOH (60-70°C) to remove the remaining Mg2SiO4, unreacted SiO2 and
other metallic impurities. Continuous stirring was applied for effective leaching to take place.
The acid-leached product was washed thoroughly with deionized water. Finally all acid was
removed by repeated washing with warm deionized water, and the product was filtered and
dried.
3.7 Characterization of Silicon Products The final product was subjected to various characterization tests including particle size analysis,
BET surface area, XRD, SEM, and chemical assay. The chemical analysis of the Si product was
done in-house (Department of Chemistry, U of T) using ICP-OES technique and also sent to an
outside laboratory. The sample preparation involved for in-house ICP analysis was as follows:
Final silicon product (0.25 gm) was dissolved in HNO3, H2O and HF solution (ratio: 2:2:1). The
decanted solution diluted 50 times for ICP analysis. A blank sample was also prepared with the
same ratio as for digestion of silicon.
27
CHAPTER 4: RESULTS AND DISCUSSION
4.1 Characteristics of Silica Fume (SF) 4.1.1 Chemical Composition Chemical analysis of as-received silica fume shows that it contains more than 97 percent silicon
dioxide (Table 4.1). Major impurities are carbon and the oxides of phosphorus, aluminum, iron,
calcium, magnesium, sodium and potassium. However, the boron content is very low, which is a
significant advantage when solar grade silicon is the target product. As described in the literature
(Chapter 2), during the production of silicon in the electric arc furnace, boron is expected to
remain in the molten silicon due to its higher boiling temperature compared to the operating
temperature (2300K) of the furnace, whereas boiling point of phosphorus is below that of the
operating temperature. Approximately 25% of the phosphorus leaves the furnace with silica
fume [Myrhaug and Tveit, 2000]. These are reflected in the composition of silica fume given in
Table 4.1 which has low boron and relatively high phosphorus content. Silica fume contains
0.5% carbon, giving a grayish appearance to the material as shown in Fig. 4.1.
Table 4.1 Impurities in as-received silica fume.
Major Impurity Elements Percent/ppm Carbon 0.5%
P 294 ppm B <2 ppm As 12 ppm Fe 1603 ppm Al 2094 ppm Ca 2527 ppm K 7265 ppm Na 1161 ppm Mg 3004 ppm Mn 93 ppm
Silica content >97%
28
Fig. 4.1: As received silica fume.
4.1.2 Particle Size Analysis and Scanning Electron Microscopy
Result of particle size analysis is shown in Fig. 4.2(a). The particle size of as-received silica
fume varies from 0.1-100 µm and the average particle size was around 10 µm. However, it is
reported that particle size of SF is around 0.1 µm and particles tend to cluster together [Malhotra
and Carette, 1982; Silica Fume User’s Manual, 2005]. Fig. 4.2(b) shows image taken by
scanning electron microscope (SEM). It shows agglomerated particles vary in sizes confirming
the tendency to cluster.
Particle Diameter (µm.)
( )
0
10
0.01 0.1 1.0 10.0 100.0 1000.0
Volu
me(
%)
(a) (b)
Fig. 4.2: (a) Particle size distributions of as–received silica fume. Mean particle size is 10 μm
and (b) Micrograph from scanning electron microscope showing typical as- received
silica fume.
29
4.1.3 Surface Area Analysis of Silica Fume The BET method yields a specific surface area of 17.8 m2/g for as-received silica fume. This is
consistent with the values reported in the literature, showing surface area of SF of about 20 m2/g
[Phillips and Carter, 2003]. The BET isotherm allows adsorption beyond a monolayer such as
molecular adsorption of N2. It has the following shape when adsorbed volume is plotted against
pressure as shown in Fig. 4.3.
0
2
4
6
0 0.05 0.1 0.15 0.2Relative pressure Ps/P0
Volu
me A
dsor
bed
cc/g
(ST
P)
Fig. 4.3: Nitrogen adsorption with respect to relative N2 pressure. PS is the sample pressure and
P0 is the saturation pressure.
4.1.4 X-Ray Diffraction
The X-ray diffraction (XRD) of as-received silica fume is shown in Fig. 4.4. The diffraction
pattern of crystalline silica exhibits sharp peaks whereas silica fume shows a weak, broad peak
around 2θ = 22° indicating the amorphous nature of the material. This is an advantage for silica
fume, as amorphous materials are more reactive. Also, while silica is carcinogenic when
crystalline, it does not pose any health hazard in the amorphous form.
30
As received Silica Fume
Crystalline SilicaC
ount
s/s
Fig. 4.4: Comparison of XRD patterns of as-received silica fume and crystalline silica.
4.2 Purification of Silica Fume
4.2.1 Acid Leaching Due to the nature of the SF formation and collection, the associated impurities such as
phosphorus, aluminum, iron, calcium, magnesium, sodium and potassium exist as oxide within
silica fume [Agarwal, 2006]. It is anticipated that some of the oxide impurities can be removed
by acid leaching. As described in the Experimental Aspects, leaching was carried out for various
temperatures and reaction times for four conditions in a 10% HCl solution while the solid
concentration was maintained at 10%.
The impurity levels of the leached and dried silica fume were determined by inductively coupled
plasma (ICP-MS) analysis (Table 4.2). The results are also shown in Fig. 4.5 by normalizing the
concentrations in the leached product with respect to the initial concentrations. A ratio smaller
than unity shows successful removal of the impurity, the smaller the ratio, the larger is the
removal. It is clear from Fig. 4.5 that some elements like As, Pb and P were greatly reduced and
other elements such as Fe, Mg, K, Ca, Na, Mn and Sr were partially reduced; whereas B and Ti
remained unchanged.
31
Table 4.2 Impurity levels in silica fume after initial leaching (ICP analysis by International
Plasma Labs Ltd., British Columbia).
Elements B (ppm)
P (ppm)
Fe (ppm)
Al (ppm)
Ca (ppm)
K (ppm)
Na (ppm)
Mg (ppm)
Samples SF Original 2 294 1232 2153 2527 7265 1161 3004