1 Production Contracts and the Spot Market Price of Hogs Nigel Key * Selected paper prepared for presentation at the Annual Meeting of the AAEA, Denver, Colorado, July 25-27, 2010. Abstract. The increasing use of production contracts in the hog sector has reduced the number of spot market transactions, raised concerns about price manipulation and helped to spur legislation requiring price reporting by packers. Using data from the 2002 and 2007 Censuses of Agriculture, this study looks for evidence of market manipulation by examining whether the local prevalence of contracting affects the average price received by independent producers. The empirical approach uses a fixed-effects model to examine whether the change in the prevalence of contracting is correlated with the change in the spot market price received by individual farmers. This approach controls for unobservable time-invariant individual and county characteristics, such as product quality and location, that might be correlated with price and contracting prevalence. Findings indicate that a negative economically significant relationship between the share of local production delivered under production contracts and the price received by independent producers is unlikely. Key words: production contracts, alternative marketing arrangements, market power, spot market price, hogs. * Economic Research Service, U.S. Department of Agriculture. The views expressed are those of the author and do not necessarily correspond to the views or policies of ERS, or the U.S. Department of Agriculture. Direct correspondence to: Nigel Key, [email protected]. Copyright 2010 by Nigel Key. All rights reserved. Readers may make verbatim copies of this document for non-commercial purposes by any means, provided this copyright notice appears on all such copies.
Transcript
1
Production Contracts and the Spot Market Price of Hogs
Nigel Key *
Selected paper prepared for presentation at the Annual Meeting of the AAEA,
Denver, Colorado, July 25-27, 2010.
Abstract. The increasing use of production contracts in the hog sector has reduced the number of
spot market transactions, raised concerns about price manipulation and helped to spur legislation
requiring price reporting by packers. Using data from the 2002 and 2007 Censuses of
Agriculture, this study looks for evidence of market manipulation by examining whether the
local prevalence of contracting affects the average price received by independent producers. The
empirical approach uses a fixed-effects model to examine whether the change in the prevalence
of contracting is correlated with the change in the spot market price received by individual
farmers. This approach controls for unobservable time-invariant individual and county
characteristics, such as product quality and location, that might be correlated with price and
contracting prevalence. Findings indicate that a negative economically significant relationship
between the share of local production delivered under production contracts and the price
received by independent producers is unlikely.
Key words: production contracts, alternative marketing arrangements, market power, spot market
price, hogs.
*Economic Research Service, U.S. Department of Agriculture. The views expressed are those of the
author and do not necessarily correspond to the views or policies of ERS, or the U.S. Department of
Agriculture. Direct correspondence to: Nigel Key, [email protected].
Copyright 2010 by Nigel Key. All rights reserved. Readers may make verbatim copies of this
document for non-commercial purposes by any means, provided this copyright notice appears on all
the value of inputs provided by the contractor. Since there could be substantial variation in the
value of inputs provided by contractors, gross revenue is likely a poor proxy for net revenue
from contract production. For this reason this study does not examine how local contract
prevalence is associated with average remuneration per head for production contract growers.
Instead, the study considers only contract prevalence is associated with the average price per
head for independent producers.
To compare producers of relatively similar types of output the study only considers operations
that self-identified as “farrow-to-finish” or “finish-only”, and who therefore marketed primarily
finish (full-grown) hogs.2 Farrow-to-finish operations are those on which pigs are farrowed
(birthed) and raised to a slaughter weight of 240-270 pounds. Finish-only (sometimes called
“feeder-to-finish”) operations are those on which feeder pigs of 50-60 pounds are obtained
(either purchased or placed via contract) from outside the operation and fed until they reach
slaughter weight.
The Census of Agriculture reports 37,417 and 32,242 independent or production contract
growers who had positive hog production and inventory and who described their operations as
finish-only or farrow-to-finish in 2002 and 2007, respectively.3 Of these, 24,281 and 17,650
produced at least 50 head in 2002 and 2007, respectively.4 Independent operations are defined as
those selling some output not under a production contract. There were 18,967 independent
producers who responded to the 2002 Census and 12,529 in 2007.
Substantial changes in the characteristics of independent producers between 2002 and 2007
reflect ongoing structural changes in the hog sector (table 1). An average independent operation
sold about 50% more hogs in 2007 than in 2002 (table 1). At the same time, the average price
per head increased from $86.06 to $117.25, causing average value of sales to approximately
double, in nominal dollars, between 2002 and 2007. During this period, the share of independent
operations using a “farrow-to-finish” production system declined from 66.9% to 59.1%,
2 Other Census hog farm types include farrow-to-wean, farrow-to-feeder, and nursery. 3 Operators who described themselves as a “contractor or integrator” were not included in this analysis. 4 Operations with sales of fewer than 50 head were removed to increase sample homogeneity and because these
operations are more likely to be sold in organic, free-range, or other specialty meat markets, and would be less likely
to be in direct competition with larger commercial contract operations.
8
reflecting the shift to more specialized operations. The average age and farming experience of
operators both increased by about two years.
The prevalence of production contracts in the local region is measured as the share of county-
level market hog production removed under a production contract. The independent hog
producers in the sample were located in 1965 counties in 2002 and 1724 counties in 2007. On
average (table 1), the number of hog producers per county declined from 50.0 and 41.4 between
2002 and 2007, while share of total county output delivered under a production contract
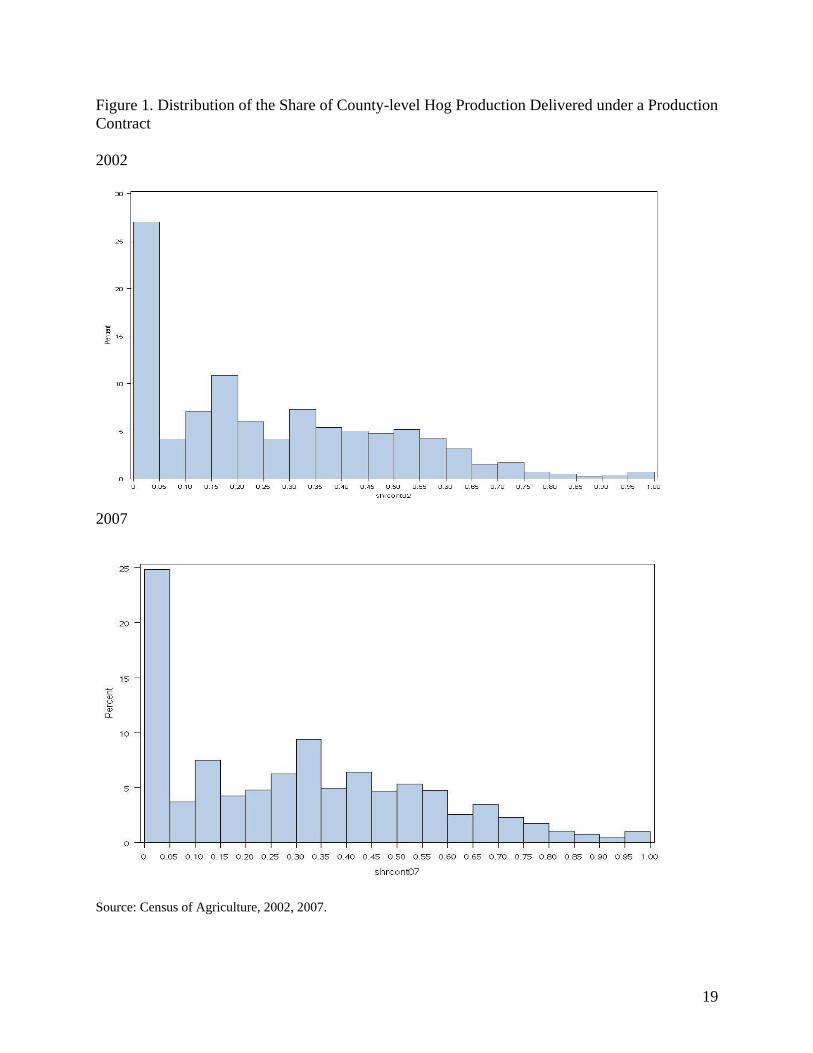
increased from 25.8% and 29.7%. Figure 1 illustrates the distribution across independent
producers of the share of county-level hog production delivered under a production contract in
the Census years. About 22% of producers were located in counties where no output was
delivered under a production contract.
Results
Table 2 illustrates correlations between the average sales price per head for independent
producers and three covariates in 2002 and 2007. The second column in the table compares the
average price for the row with the price for the first row in each category. The table shows that,
on average, farrow-to-finish operations earned $2.78 and $3.98 per head less than finish-only
operations in 2002 and 2007, respectively. The table also shows that the average price received
per head generally increases with farm size. Farms selling at least 5000 head received $5.68 and
$4.08 more per head than did farms selling fewer than 250 head. About 2% of independent
operations also removed some output under a production contract.5 Independent operations with
contracts received substantially higher prices ($12.29 and $14.16 in 2002 and 2007)) than
independent operations without contracts. These differences in average sales price could reflect
differences in animal quality or differences in local market conditions.
5 It is possible that hogs produced under contract and independently were raised at different times during the year,
reflecting a shift from one form of organization to another.
9
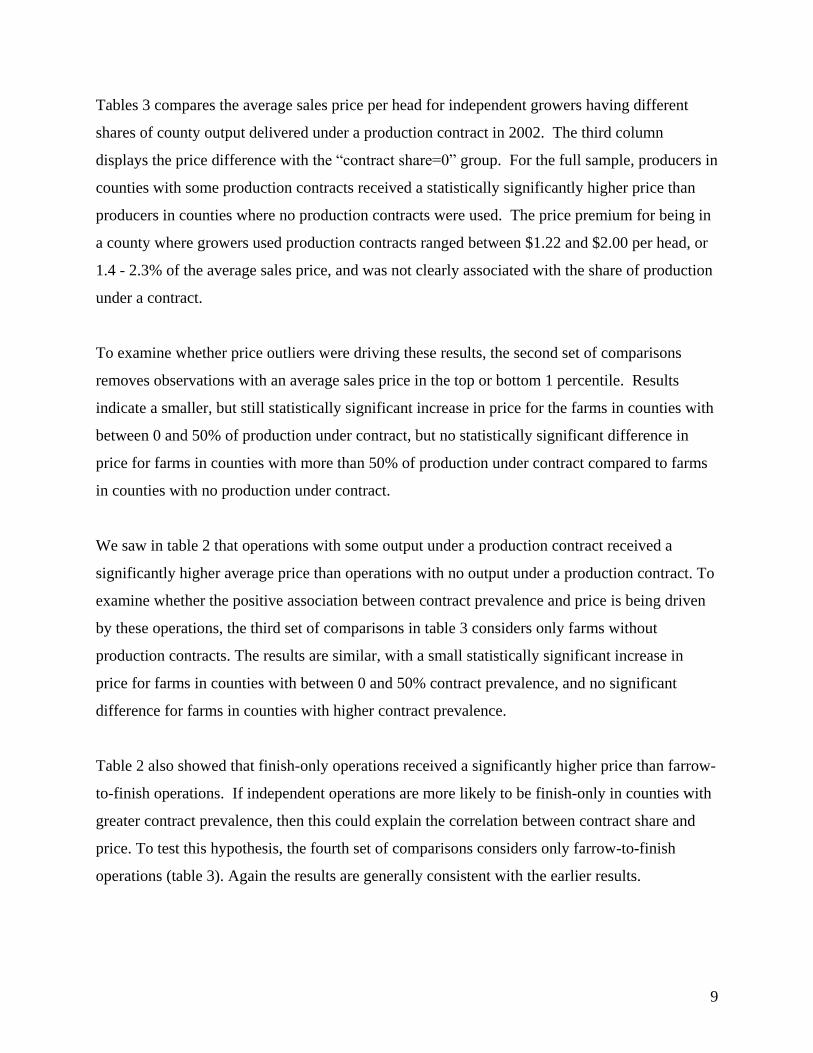
Tables 3 compares the average sales price per head for independent growers having different
shares of county output delivered under a production contract in 2002. The third column
displays the price difference with the “contract share=0” group. For the full sample, producers in
counties with some production contracts received a statistically significantly higher price than
producers in counties where no production contracts were used. The price premium for being in
a county where growers used production contracts ranged between $1.22 and $2.00 per head, or
1.4 - 2.3% of the average sales price, and was not clearly associated with the share of production
under a contract.
To examine whether price outliers were driving these results, the second set of comparisons
removes observations with an average sales price in the top or bottom 1 percentile. Results
indicate a smaller, but still statistically significant increase in price for the farms in counties with
between 0 and 50% of production under contract, but no statistically significant difference in
price for farms in counties with more than 50% of production under contract compared to farms
in counties with no production under contract.
We saw in table 2 that operations with some output under a production contract received a
significantly higher average price than operations with no output under a production contract. To
examine whether the positive association between contract prevalence and price is being driven
by these operations, the third set of comparisons in table 3 considers only farms without
production contracts. The results are similar, with a small statistically significant increase in
price for farms in counties with between 0 and 50% contract prevalence, and no significant
difference for farms in counties with higher contract prevalence.
Table 2 also showed that finish-only operations received a significantly higher price than farrow-
to-finish operations. If independent operations are more likely to be finish-only in counties with
greater contract prevalence, then this could explain the correlation between contract share and
price. To test this hypothesis, the fourth set of comparisons considers only farrow-to-finish
operations (table 3). Again the results are generally consistent with the earlier results.
10
Table 2 also revealed a positive relationship between scale and price. To control for farm size,
only large-scale operations (that sold more than 2500 head) are included in the fifth set of
comparisons in table 3. Again contract prevalence is associated with a positive price premium,
however, for the large-scale operations sample, it is not possible to reject the null hypothesis of
no difference at the 10% confidence level.
The fourth column in table 3 compares the average sales price for the row with the average sales
price of producers located in counties where between 0 and 25% of total output is delivered
under a production contract. It is possible that counties with no contracting differ in
unobservable ways from counties with production contracts, and that these differences also
influence the price. By making the comparison only among counties having some producers that
used production contracts, this potential source of bias is eliminated. Results indicate no
statistically significant difference in price for farmers in counties with a small non-zero share of
contracting to those with a larger share in 2002 for all the samples in table 3.
Table 4 repeats the analysis in table 3 using data from the 2007 Census. As in 2002, being
located in a county with between 0 and 50% of output being delivered under contract is
associated with a statistically significant increase in price, compared to being in a county with no
production contract use. However, unlike in 2002, there is evidence that being in a high contract
share county (greater than 75% of output under contract) is associated with a lower price than the
no production contract county. This negative price effect holds for the full sample, operations
without production contracts, and for farrow-to-finish operations, but does not hold when price
outliers are removed or for large-scale operations.
Results (column 4) indicate that farms in counties with more than 75% of output under contract
receive $5-8 dollars less than those with a low contract share (between 0 and 25% of output).
This negative relationship holds for all samples considered except the sample of large-scale
operations. However, because there are relatively few (84) large-scale independent operations in
the high contract share counties, the statistical test lacks sufficient precision to identify a small
difference from the low contract share group.
11
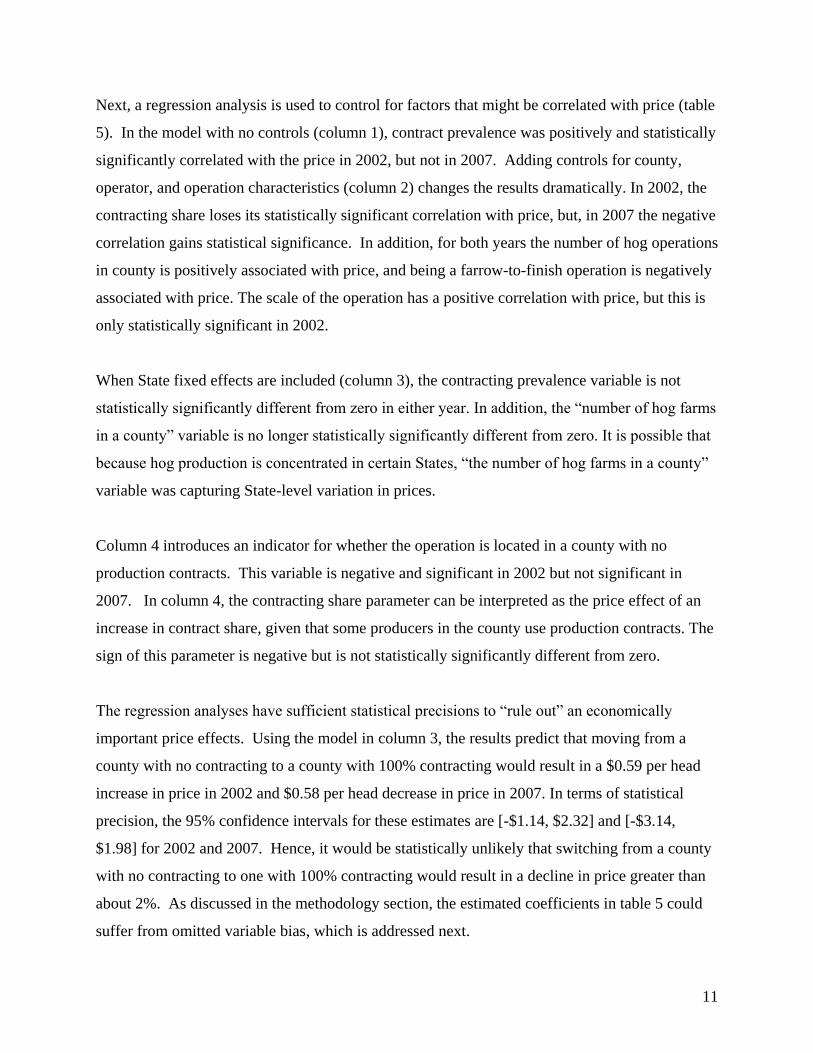
Next, a regression analysis is used to control for factors that might be correlated with price (table
5). In the model with no controls (column 1), contract prevalence was positively and statistically
significantly correlated with the price in 2002, but not in 2007. Adding controls for county,
operator, and operation characteristics (column 2) changes the results dramatically. In 2002, the
contracting share loses its statistically significant correlation with price, but, in 2007 the negative
correlation gains statistical significance. In addition, for both years the number of hog operations
in county is positively associated with price, and being a farrow-to-finish operation is negatively
associated with price. The scale of the operation has a positive correlation with price, but this is
only statistically significant in 2002.
When State fixed effects are included (column 3), the contracting prevalence variable is not
statistically significantly different from zero in either year. In addition, the “number of hog farms
in a county” variable is no longer statistically significantly different from zero. It is possible that
because hog production is concentrated in certain States, “the number of hog farms in a county”
variable was capturing State-level variation in prices.
Column 4 introduces an indicator for whether the operation is located in a county with no
production contracts. This variable is negative and significant in 2002 but not significant in
2007. In column 4, the contracting share parameter can be interpreted as the price effect of an
increase in contract share, given that some producers in the county use production contracts. The
sign of this parameter is negative but is not statistically significantly different from zero.
The regression analyses have sufficient statistical precisions to “rule out” an economically
important price effects. Using the model in column 3, the results predict that moving from a
county with no contracting to a county with 100% contracting would result in a $0.59 per head
increase in price in 2002 and $0.58 per head decrease in price in 2007. In terms of statistical
precision, the 95% confidence intervals for these estimates are [-$1.14, $2.32] and [-$3.14,
$1.98] for 2002 and 2007. Hence, it would be statistically unlikely that switching from a county
with no contracting to one with 100% contracting would result in a decline in price greater than
about 2%. As discussed in the methodology section, the estimated coefficients in table 5 could
suffer from omitted variable bias, which is addressed next.
12
Controlling for time invariant fixed effects
Evaluating how a change in the county-level prevalence of production contracts affects an
individual operator’s average sales price requires restricting the sample to continuing operations.
Of the 18,967 independent producers in 2002, only 7,108 continued to produce hogs
independently, had sales of at least 50 head, and responded to the Census in 2007. To eliminate
variations in price caused by changes in the operator, the sample includes only those
observations where the operator’s age in 2007 was 4 to 6 years greater than the operator’s age in
2002. Matching by operator age results in a final sample of 6,331 continuing independent
operations.
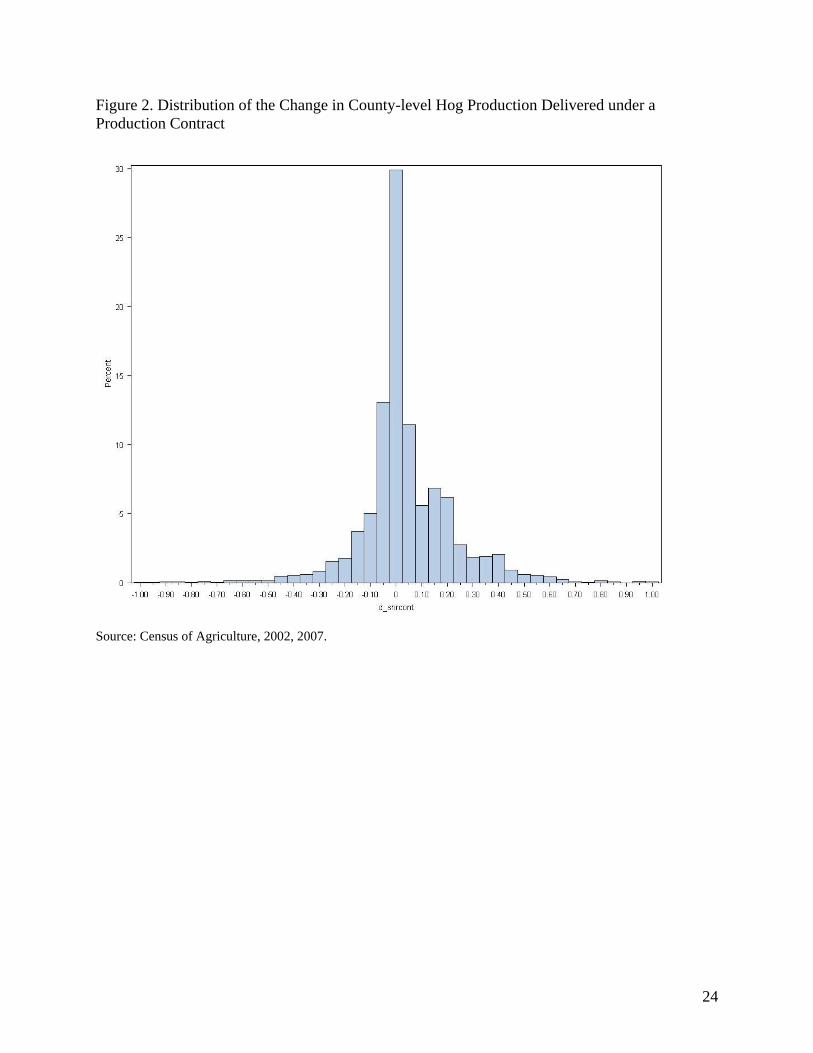
Figure 2 illustrates the distribution across continuing operations of the change in the share of
county-level hog production that is delivered under a production contract. About 15% of
producers were located in counties that experienced no change in the share of output under
contract.6 Most (85%) producers were located in counties where the contract share changed less
than 25 percentage points (including no change).
Table 6 compares the average change in price of hogs for continuing operations with varying
changes in the share of county output under a production contract. For the full sample and for the
sample with the price change outliers removed, there was no statistically significant difference
between groups. Operators in counties that experienced a large (greater than 25 percentage
points) increase in contract share experienced a smaller increase in price than those in counties
with a large contract share decline. In contrast, those in counties experiencing a large increase in
contract share had a slightly greater increase in price than those experiencing no change in
contract share. There was very little difference in the average price change for producers in
counties with a small (between 0 and 25 points) increase in contract prevalence compared to
those in counties with a small decrease.
6 This is a much smaller percentage than displayed in the bin centered at zero in figure 2 because this zero bin
includes all producers in counties where the contract share changed between -0.25 and 0.25 percentage points.
13
Table 7 presents the results of the fixed effects regression model (equations (3) and (4)). Column
1 has no controls, column 2 introduces the time-varying covariates, column 3 adds controls for
initial operator and operation characteristics, and column 4 includes state fixed effects.7 For all
models, an increase in farm size is associated with a decrease in price – with an additional 1000
head lowering the average sales price by about $0.60. This contrasts with the positive association
between scale and price reflected in tables 2 and 5. It is possible that some time invariant factors
are correlated with farm size and price, causing the positive relationship in the cross-sectional
analysis. For example, if hog quality were correlated with price and size, one would observe a
spurious positive correlation between size and price. The fixed-effects model controls for these
time invariant confounders.
For all models, the coefficients associated with the change in contract share variable are
negative, but not statistically significantly different from zero. The data provide sufficient
precision to rule out a large price effect from contracting prevalence. The estimate of a $1.71
decrease in price resulting from a 100 percentage point increase in the share of county
production under contract (column 4) has a 95% confidence interval of [-$6.41, $2.99]. In other
words, results indicate that it would be statistically unlikely that shifting all county production
from independent to contract production would results in a price decline of more than about
5.5% of the 2007 price.
Conclusion
The increasing use of production contracts in the hog sector has caused the number of spot
market transactions to decline. Thinning spot markets have raised concerns about price
manipulation, which has helped spur legislation to require price reporting by packers. Recently,
Congress debated proposed Farm Bill provisions that would have substantially limited the ability
of packers to use alternative marketing arrangements commonly used to purchase hogs from
contractors (integrators). Contracts that bind growers to a particular firm can tie up local
production, which would raise costs for packers who enter the market. Hence, in the hog sector,
7 The coefficient on a dummy variable indicating whether the county had no change in the contracting share was not
significantly different from zero. Including this dummy variable had little effect on the other model coefficients.
14
production contracts could enhance the local market power of packers by helping to restrict the
entry of competitors.
Using data from the 2002 and 2007 Census of Agriculture, this paper looks for evidence of
market manipulation by examining whether the local prevalence of contracting affects the
average price received by independent producers. The study first compares the average price per
head received by growers in counties with different levels of contracting. The simple price
comparisons reveal no evidence that growers in counties with a low prevalence of contracting
receive a low price. In fact, average prices in counties having between 0-50% of output
produced under contract were generally higher than prices in counties with no contracting.
However, being located in a high contract prevalence county (more than 75% of output under
contract) was associated with a lower price in 2007, though there was no correlation to price in
2002.
Single-period regression analyses are used to control for observable operator and operation
characteristics that might cause the correlation between contract prevalence and prices. The
regressions provide no evidence of price manipulation related to contract use. Results indicate
that having some contracting in a county is generally associated with a higher price. Given that
there is some contracting in a county, there no statistically significant relationship between the
share of production under contract and prices. The large dataset provides sufficient statistical
precision to rule out negative price effect greater than about 2%.
To control for time invariant factors that might be correlated with price and contract share, such
as product quality or location, the study first compared the change in the price received by
operators experiencing different changes in the local prevalence of contracting. Results indicate
no statistically significant difference in price between operators experiencing an increase or
decrease in the local contracting share. Results of a regression analysis that controlled for
operation and operator characteristics indicate that a change in the share of contracting at the
county level has no statistically significant price effect. For the fixed-effects model, the data
rules out as statistically unlikely a negative price effect greater than about 5.5%.
15
In sum, the study finds that in 2002 and 2007, a negative economically significant relationship
between the share of local production delivered under production contracts and the price
received by independent producers is unlikely. However, while an increase in the use of
production contracts does not appear to substantially lower spot prices for independent growers,
it could increase transaction costs. Lower spot market volume is likely to be associated with
higher transportation costs (which are correlated with animal weight loss and risk of injury),
greater risk of no sale (due to an insufficient number of buyers), and higher commission costs
(Hobbs, 1997). Higher spot market transaction costs can provide an incentive for farmers to
begin to contract, which can further thin the spot market, leading to a greater prevalence of
contracting and perhaps eventually to the elimination of independent production as a viable
option (Roberts and Key, 2005).
Operations that use production contracts represent an increasing share of hog farms and output.
A substantial number of these contract operations are located in counties with thin or no spot
markets, which could limit non-contract production opportunities for growers and thereby lower
their bargaining power vis-à-vis contractors. Because of data limitations, the study was not able
to address whether the remuneration received by production contract growers was related to the
local prevalence of contracts. This remains an important area for future research.
16
References
Azzam, A. 1998. “Captive supplies, market conduct, and the open market price.” American
Journal of Agricultural Economics, 80, 76–83.
Elam, E. 1992 “Cash forward contracting vs. hedging of fed cattle, and the impact of cash
contracting on cash prices.” Journal of Agricultural and Resource Economics, 17, 205–217.
GAO (2009) Agricultural Concentration and Agricultural Commodity and Retail Food Prices.
United States Government Accountability Office. GAO-09-746R. April 24, 2009. Accessed at:
http://www.gao.gov/new.items/d09746r.pdf
Hayenga, M. and O’Brien, D. 1992. Packer competition, forward contracting price impacts, and
the relevant market for fed cattle In W. Purcell Ed., Pricing and coordination in consolidated
2002 Head removed 2224 14644 592 Head removed, not under contract 2157 14599 560 Head removed, under production contract 67.09 973.5 0 Value of sales, not under contract (dollars) 190845 1431332 47680 Average price per head, not under contract (dollars) 86.06 27.11 85 Share of county hog output under contract 0.258 0.260 0.204 Number of hog farms in county 49.98 60.82 33 Operator’s age (years) 50.88 13.70 50 Operator’s farming experience (years) 24.11 14.32 24 Farrow-to-finish operation (yes=1, no=0) 0.669 0.523 1 N 18967
2007
Head removed 3404 20636 650 Head removed, not under contract 3323 20597 606 Head removed, under production contract 81.15 1095 0 Value of sales, not under contract (dollars) 390277 2367972 72000 Average price per head, not under contract (dollars) 117.25 34.57 120 Share of county hog output under contract 0.297 0.281 0.286 Number of hog farms in county 41.43 53.83 25 Operator’s age (years) 52.82 13.63 52 Operator’s farming experience (years) 26.46 14.86 27 Farrow-to-finish operation (yes=1, no=0) 0.591 0.542 1 N 12529
Source: Census of Agriculture, 2002, 2007.
19
Figure 1. Distribution of the Share of County-level Hog Production Delivered under a Production
Contract
2002
2007
Source: Census of Agriculture, 2002, 2007.
20
Table 2. Average Price per Head, Independent Finish Hog Producers by Type
Farm Category Mean Std. Err. Difference1
N 2002
Production system Finish only 87.92 0.234 6380 Farrow to finish 85.14 0.237 -2.78*** 12587 Head removed 50-249 84.26 0.314 5511 250-999 85.74 0.243 1.48*** 5853 1000-2499 86.56 0.287 2.30*** 3839 2500-4999 88.76 0.555 4.50*** 1749 5000+ 89.94 1.072 5.68*** 2015 Some output under prod. contract No 85.80 0.161 18528 Yes 98.09 3.509 12.29*** 439
2007 Production system Finish only 119.60 0.405 5285 Farrow to finish 115.62 0.381 -3.98*** 7244 Head removed 50-249 114.99 0.646 3571 250-999 117.11 0.495 2.12*** 3277 1000-2499 117.92 0.541 2.93*** 2217 2500-4999 120.82 0.894 5.83*** 1418 5000+ 119.07 0.479 4.08*** 2046 Some output under prod. contract No 116.95 0.274 12246 Yes 131.11 3.524 14.16*** 283
Note: 1 Difference between row and first row in category. The asterisks indicate statistical significance of the test of
the null hypothesis that the mean for the row is equal to the mean of the first row at the (*) 10%; (**) 5%; and (***)
1% levels.
Source: Census of Agriculture, 2002, 2007.
21
Table 3. Average Price per Head by Share of County Output under Production Contract,
Notes: 1 The asterisks indicate statistical significance of the test of the null hypothesis that the mean for the row is
equal to the mean of the base comparison row at the (*) 10%; (**) 5%; and (***) 1% levels. 2 Top and bottom 1% outliers for average price per head are removed from sample.
Source: Census of Agriculture, 2002, 2007.
22
Table 4. Average Price per Head by Share of County Output under Production Contract,
Notes: 1 The asterisks indicate statistical significance of the test of the null hypothesis that the mean for the row is
equal to the mean of the base comparison row at the (*) 10%; (**) 5%; and (***) 1% levels. 2 Top and bottom 1% outliers for average price per head are removed from sample.
Source: Census of Agriculture, 2002, 2007.
23
Table 5. Least Squares Estimates, Dependent Variable: Average Price per Head