37
Production of Health FGS - Chapter 5 © Allen C. Goodman, 2015
| Date post: | 25-Dec-2015 |
| Category: |
Documents |
| Upload: | derick-cannon |
| View: | 216 times |
| Download: | 0 times |

Production of Health
FGS - Chapter 5
© Allen C. Goodman, 2015
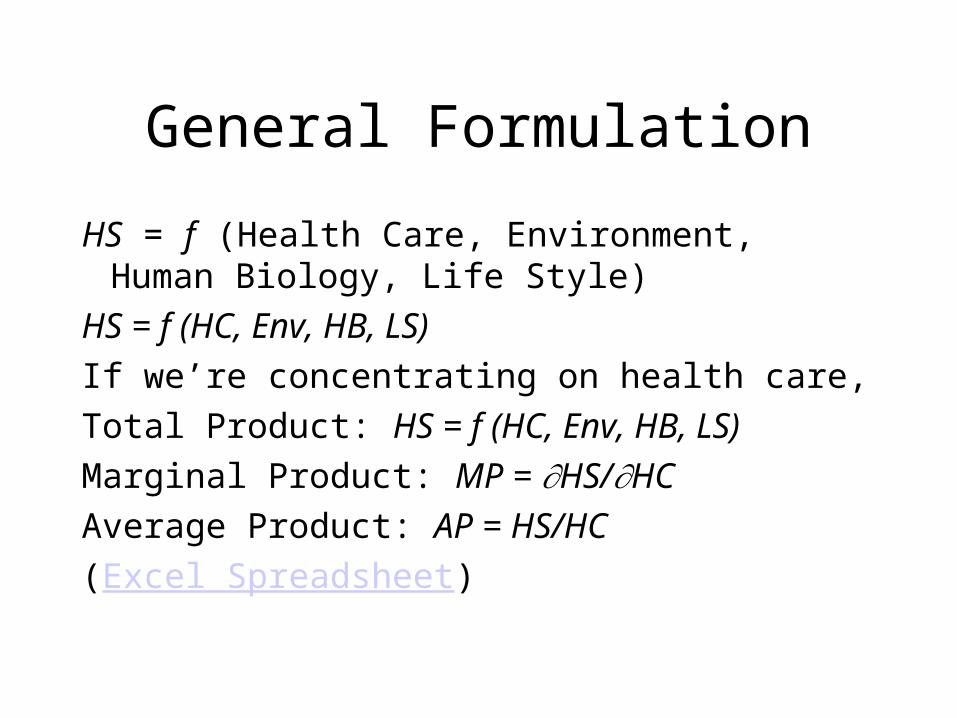
General Formulation
HS = f (Health Care, Environment, Human Biology, Life Style)
HS = f (HC, Env, HB, LS)
If we’re concentrating on health care,
Total Product: HS = f (HC, Env, HB, LS)
Marginal Product: MP = HS/HC
Average Product: AP = HS/HC
(Excel Spreadsheet)

Measures of Health Status
• Death rates (easiest to measure)• Healthy days• Morbidity rates
It may be critical to distinguish between total and marginal contributions, since low marginals may accompany high totals.

Total v. Marginal
• It may turn out that although the total contribution may be substantial, the marginal contribution may be very small. Why do we care?
• Because many decisions are made at the margin. Additions to the amount spent, may not be “worth it.”

Some Models
Impacts of Medical Care
H = f (x, y)
x = medical care
y = everything else
dH = fx dx + fy dy
Marginal products are partial derivatives

Some Models (2)
Production Functions
- Cobb-Douglas
H = xy
Partial derivatives
H/x = H/x; H/y = H/y
Ratio of marginal products Hx/Hy = (/)(y/x) = [/(1-)](y/x)] if + = 1.
Problem - Constrains substitution elasticity to 1.
dH = fx dx + fy dydH = H/x dx + H/y dy
dH/H = (dx/x) + (dy/y)

Some Models (3)CES
H = A [x + (1-)y]R/
H/x = (AR/) x - 1 [■](R/)-1;
H/y = (AR/) (1-) y - 1 [■](R/)-1.
Ratio of the marginal products
Hx/Hy = [/(1-)](x/y) - 1
This is the same as C-D if = 0; if so, elasticity of substitution = 1.
= 1/(1 - )

Marginal Products
Under most conditions, marginal products are going to be non-negative. Why?
Can dH/dx be negative?
<A> Yes! 2 Possibilities

Iatrogenic (physician caused) disease
Iatrogenic (physician caused) disease. All procedures have their risks. For example, in anesthesia, you kill someone a little bit -- You may do it too much.
Some medicines react with each other. Not good!
Suppose, that we model the risk of procedure x as R(x).
We then get:
H = f (x, y) - R(x)

Iatrogenic (physician caused) disease (2)dH = fx dx + fy dy - Rx dx
H/x < 0, if fx - Rx < 0
We take partial derivatives because we are holding y constant.
H/x < 0 if Mgl Risk > Marginal Product.
Examples: smallpox vaccine is a prime example; flu shots, for many, are another. Medical malpractice may be a third (i.e. the more done, the more possible mistakes).
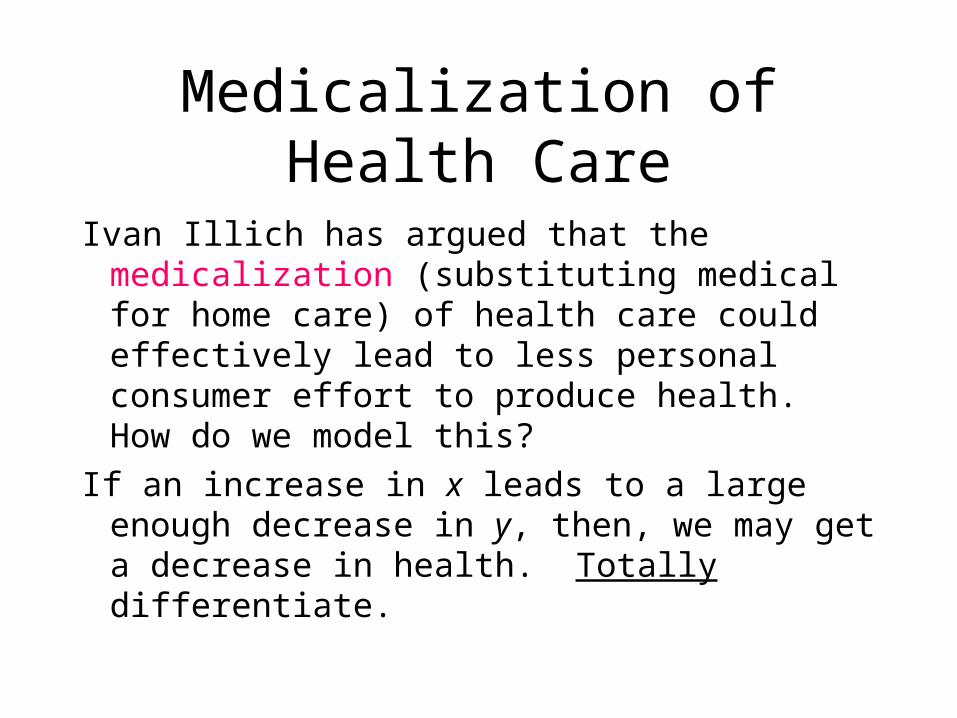
Medicalization of Health Care
Ivan Illich has argued that the medicalization (substituting medical for home care) of health care could effectively lead to less personal consumer effort to produce health. How do we model this?
If an increase in x leads to a large enough decrease in y, then, we may get a decrease in health. Totally differentiate.

Medicalization of Health Care (2)
If dH/dx = fx + fy (dy/dx) - Rx < 0, then
fy (dy/dx) - Rx < - fx .
(dy/dx) - Rx /fy < -fx/fy.
Under normal production circumstances, the LHS = 0. With iatrogenic risk, - Rx < 0. If (dy/dx) is also negative then the sum may be less than the negative of the marginal products.

Medicalization of Health Care (2)
To clarify, ignore Rx. We get:
dH/dx < 0, if
(dy/dx) < -fx/fy.
(mgl prod. y) (y) < -(mgl prod. x) (x)

On the Historical Role of Medicine and Health Care
McKeown focused on dramatic rise in population in England and Wales since 1750.
It seems that world population rose and fell without any upward trend, up until that time.
How does population increase? (Discuss)
<A> Increased births
Decreased deaths
Increased in-migration

Population Growth
http://www.ciese.org/curriculum/popgrowthproj/worldpop.html
Not much

KEY !!!
Decreased deaths due to:
1. airborne causes -- tuberculosis, bronchitis, pneumonia, and influenza
2. waterborne causes
[Table 5.1].

Table 5.1 Death Rates (per million) in 1848-1854, 1901, 1971
% of % fall1. Microorganisms 1848-54 1901 1971 Reduc. Pre-1901
Airborne diseases 7259 5122 619 39% 32%Water and foodborne 3562 1931 35 21% 46%Other 2144 1415 60 12% 35%
Total 12965 8468 714 72% 37%
2. Diseases not attributable to microorganisms 8891 8490 4070 28% 8%
All Diseases 21856 16958 4784 100% 29%

McKinlay and McKinlay
• Figure 5.3 shows that availability of effective medical intervention occurred well after the largest mortality decline.

Public Health
If not medical care, than what?
McKeown argues that it’s public health
Immunization of populations
Quarantines
Sanitary standards for water and sewage
Sanitary standards for food handling and treatment
Key point, though is increased nutrition

Increased Nutrition
“Infectious disease creates a relationship between host and parasite. While control of the parasite is directly helpful in reducing disease incidence, the condition of the host helps to determine its resistance to disease. A person who is better housed, better rested, and ... better fed, will be more resistant and less likely to die subsequent to exposure.” [Fogel in FGS/4, Ch. 4, P.81]

Medical Research?
Useless?
NO !!!
Can provide disease origins
Can address specific diseases
Moreover, just because marginal impact isn’t big, it doesn’t mean that the total impact isn’t big.

Modern Day Analysis
• What do we measure?
• Omitted variable problems
Suppose that appropriate regression is:
H = x + y.
x = physicians per capita
y = exercise per capita
If we can’t measure y, we may estimate:

Modern Day (2)H = αx + y. TrueH = x. EstimatedBUT, x and y may be correlated
y = x.What we're really getting, when we estimate:
H = x. is two relations -- the impact of x alone, and the
impact of y on x:

Modern Day (3)
H = x + x, or:
H = ( + )x.
H = x + y.
H = x.
We may think that variable x is important. However, it could be that the real relationship is between H and y, and that x is only serving as a proxy. This problem is not unique to health economics, but the measurement problems are tricky.
This is what thecomputer sees!
This discussion is an example of the distinction between “econometrics” and “running regressions”!

Early contributions.
• Auster, Leveson, and Sarachek, found . elasticity of medical services expenditures on mortality was about -0.1, and not statistically significant. Is it worth it?
• ALS found elasticity of education to be -0.2, and significant.
• So was cigarette smoking.

More Early Contributions
• Dorothy Rice suggested (1966) that total costs of future earnings loss (then) approx. $50B. Cutting that by 0.1 percent would give benefits of $50M. Increased expenditures would have been $320M. What does this imply?
A LL-OO-NN-GGtime ago!

Age Group Males Females
<1 42% 35%
1-19 16% 26%
20-39 44% 42%
40-49 54% 69%
50-59 38% 28%
60-69 26% 17%
70-79 20% 6%
Fuchs -- Utah/Nevada
Excess Death Rates (Nevada - Utah)

Neonate Mortality
• Table 5.4 looks at neonate mortality. Rate is the ratio of infant deaths aged 1 month or less per thousand live births. It fell 1964-1982 from 17.9 to 7.7. Corman, Joyce, and Grossman were able to estimate the contributions of specific types of medical care and specific types of neonate-related programs.
• WIC - Women, Infants and Children (improved nutrition program) is means tested, directed toward the poor.
• For whites - 25% of the reduction can be explained
• For blacks - 56% can be explained.
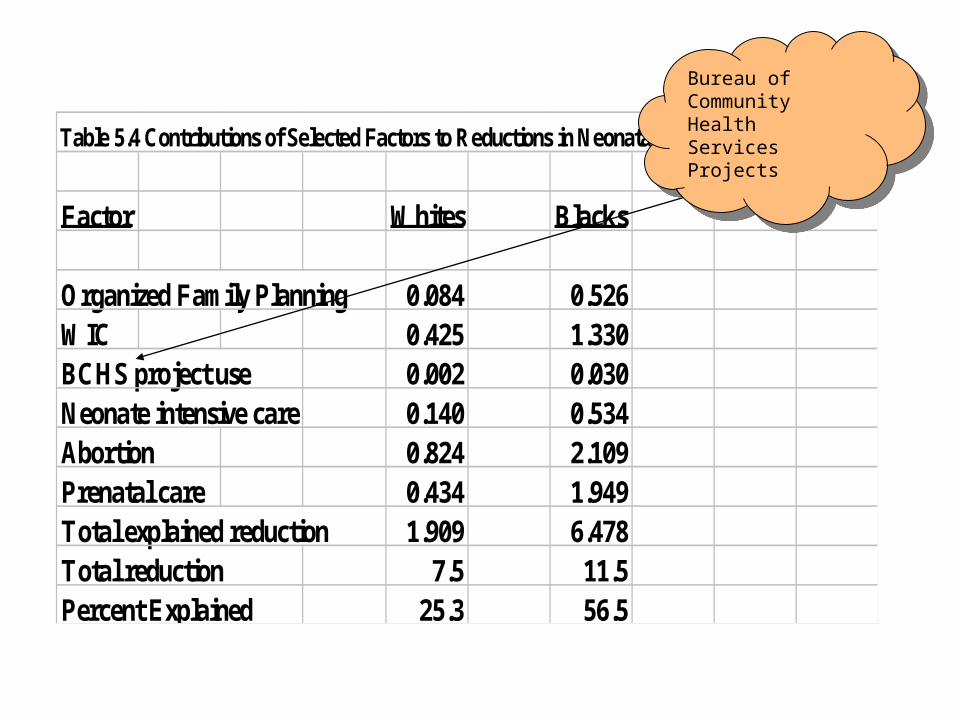
Table 5.4 Contributions of Selected Factors to Reductions in Neonatal Mortality Rates
Factor Whites Blacks
Organized Family Planning 0.084 0.526WIC 0.425 1.330BCHS project use 0.002 0.030Neonate intensive care 0.140 0.534Abortion 0.824 2.109Prenatal care 0.434 1.949Total explained reduction 1.909 6.478Total reduction 7.5 11.5Percent Explained 25.3 56.5
Bureau of Community Health Services Projects
Bureau of Community Health Services Projects

Morbidity
Mortality is useful because it is easy to measure. Morbidity refers to illness.
What might we expect? If most diseases are either self-limiting, or irreversible, the possibilities for additional medical services to reverse morbidity are small. May work for some services (hypertension, periodontal disease), and not for others. That's about what is found.

Schooling - Two Different Theories
• Grossman - Educated people produce health more efficiently. Why? If so, it makes sense to transfer resources from medical care to education.
• Fuchs - Education is an investment with a long time horizon. So is health! Since individuals with low time discount rates, or “long time horizons” will tend to invest both in education and health, the two (health and education) will be correlated.
• This debate has been around for a while, and they’re still arguing about it.

CutlerStarts with a simple model:
U = V(q) – C(q), where q = health output
To maximize utility w.r.t. q, we differentiate:
dU/dq = V' – C' = 0
Or
Mgl. Value = Mgl. Cost
Nothing profound here.
What we’ve done thus far in all of our analyses today is Mgl cost. What about Mgl value?

Example
We’re (collectively) willing to pay $300 for an air bag.
Air bag will save life of 1 in 10,000. So:MC ≤ MB$300 ≤ probability of dying * Value of life
.0001 * Value of lifeValue of life ≥ $300/0.0001 = $3,000,000Depending on how we discount it, this is worth
about $100,000 per year.

Look at Cardiovascular Care
Cutler asserts that “average 45 year old” will spend $30,000 in present value on CV care.
Average person will live 3 years longer because of the medical advance? Is it worth it?
Turns out that average discounted benefit is $120,000.
Yes, it is worth it!B/C = 4!

But
We want to look not only at marginal product marginal costs, but at marginal valuation relative to marginal costs!
Low marginal product, may mean increasing marginal costs, but it doesn’t mean that care is not valuable.
$
Quantity of Care
Mgl. Valuation
Mgl. Costs
Source: David M. Cutler Are the Benefits of MedicineWorth What We Pay for It? FIFTEENTH ANNUALHERBERT LOURIE MEMORIAL LECTURE ON HEALTH POLICY, Syracuse University, 2004

So
We want to look not only at marginal product, but also at marginal valuation relative to marginal costs!
• Next (Ch. 7)


