Production of HONO from NO2 uptake on illuminated TiO2 aerosolparticles and following the illumination of mixedTiO2/ammonium nitrate particlesJoanna E. Dyson1, Graham A. Boustead1, Lauren T. Fleming1, Mark Blitz1,2, Daniel Stone1, Stephen R. Arnold3,Lisa K. Whalley1,2, and Dwayne E. Heard1
1School of Chemistry, University of Leeds, Leeds, LS2 9JT, UK2National Centre of Atmospheric Science, University of Leeds, Leeds, LS2 9JT, UK3School of Earth and Environment, University of Leeds, Leeds, LS2 9JT, UK
Received: 25 November 2020 – Discussion started: 1 December 2020Revised: 13 February 2021 – Accepted: 23 February 2021 – Published: 16 April 2021
Abstract. The rate of production of HONO from illumi-nated TiO2 aerosols in the presence of NO2 was measuredusing an aerosol flow tube system coupled to a photo-fragmentation laser-induced fluorescence detection appa-ratus. The reactive uptake coefficient of NO2 to formHONO, γNO2→HONO, was determined for NO2 mixing ra-tios in the range 34–400 ppb, with γNO2→HONO spanningthe range (9.97± 3.52)× 10−6 to (1.26± 0.17)× 10−4 ata relative humidity of 15± 1 % and for a lamp photonflux of (1.63± 0.09)×1016 photons cm−2 s−1 (integrated be-tween 290 and 400 nm), which is similar to midday am-bient actinic flux values. γNO2→HONO increased as a func-tion of NO2 mixing ratio at low NO2 before peaking at(1.26± 0.17)×10−4 at ∼ 51 ppb NO2 and then sharply de-creasing at higher NO2 mixing ratios rather than levellingoff, which would be indicative of surface saturation. The de-pendence of HONO production on relative humidity was alsoinvestigated, with a peak in production of HONO from TiO2aerosol surfaces found at ∼ 25 % RH. Possible mechanismsconsistent with the observed trends in both the HONO pro-duction and reactive uptake coefficient were investigated us-ing a zero-dimensional kinetic box model. The modellingstudies supported a mechanism for HONO production onthe aerosol surface involving two molecules of NO2, aswell as a surface HONO loss mechanism which is depen-dent upon NO2. In a separate experiment, significant pro-duction of HONO was observed from illumination of mixednitrate/TiO2 aerosols in the absence of NO2. However, no
production of HONO was seen from the illumination of ni-trate aerosols alone. The rate of production of HONO ob-served from mixed nitrate/TiO2 aerosols was scaled to am-bient conditions found at the Cape Verde Atmospheric Ob-servatory (CVAO) in the remote tropical marine boundarylayer. The rate of HONO production from aerosol particulatenitrate photolysis containing a photocatalyst was found to besimilar to the missing HONO production rate necessary to re-produce observed concentrations of HONO at CVAO. Theseresults provide evidence that particulate nitrate photolysismay have a significant impact on the production of HONOand hence NOx in the marine boundary layer where mixedaerosols containing nitrate and a photocatalytic species suchas TiO2, as found in dust, are present.
1 Introduction
A dominant source of OH radicals in polluted environmentsis the photolysis of nitrous acid (HONO) (Platt et al., 1980;Winer and Biermann, 1994; Harrison et al., 1996; Alicke etal., 2002; Whalley et al., 2018; Crilley et al., 2019; Lu etal., 2019; Slater et al., 2020; Whalley et al., 2021). Duringa recent study in winter in central Beijing, HONO photol-ysis accounted for over 90 % of the primary production ofOH averaged over the day (Slater et al., 2020). Oxidation byOH radicals is the dominant removal mechanism for manytropospheric trace gases, such as tropospheric methane, as
Published by Copernicus Publications on behalf of the European Geosciences Union.
5756 J. E. Dyson et al.: HONO production from illuminated aerosols
well as the formation of secondary species, including tropo-spheric ozone (Levy, 1971), nitric and sulfuric acids whichcondense to form aerosols, and secondary organic aerosols.Understanding the formation of HONO in highly pollutedenvironments is crucial to fully understand both the concen-tration and distribution of key atmospheric radical species,as well as secondary products in the gas and aerosol phasesassociated with climate change and poor air quality.
Atmospheric concentrations of HONO range from a fewparts per trillion by volume (pptv) in remote clean environ-ments (Reed et al., 2017) to more than 10 ppb in highlypolluted areas such as Beijing (Crilley et al., 2019). Themain gas-phase source of HONO in the troposphere is thereaction of nitric oxide (NO) with the OH radical. HONOhas also been shown to be directly emitted from vehicles(Kurtenbach et al., 2001; Li et al., 2008), for which the rateof emission is often estimated as a fraction of known NOx(NO2+NO) emissions. Many heterogeneous HONO sourceshave also been postulated, including the conversion of ni-tric acid (HNO3) on ground or canopy surfaces (Zhou et al.,2003; George et al., 2005), bacterial production of nitriteon soil surfaces (Su et al., 2011; Oswald et al., 2013), and,more recently, particulate nitrate photolysis, thought to be animportant source in marine environments (Ye et al., 2016;Reed et al., 2017; Ye et al., 2017a, b). Rapid cycling of gas-phase nitric acid to gas-phase nitrous acid via particulate ni-trate photolysis in the clean marine boundary layer has beenobserved during the 2013 NOMADSS aircraft measurementcampaign over the North Atlantic Ocean (Ye et al., 2016).Ground-based measurements of HONO made at Cabo Verdein the tropical Atlantic Ocean (Reed et al., 2017) providedevidence that a mechanism for renoxification in low-NOx ar-eas is required (Reed et al., 2017; Ye et al., 2017a).
Recent model calculations show a missing daytime sourceof HONO, which is not consistent with known gas-phase pro-duction mechanisms, direct emissions or dark heterogeneousformation (e.g. prevalent at night). It has been suggested thatthis source could be light driven and dependent on NO2 (Kl-effmann, 2007; Michoud et al., 2014; Spataro and Ianniello,2014; Lee et al., 2016).
It is estimated that between 1604 and 1960 Tg yr−1 ofdust particles are emitted into the atmosphere (Ginoux etal., 2001). Titanium dioxide (TiO2) is a photocatalytic com-pound found in dust particles at mass mixing ratios of be-tween 0.1 % and 10 % depending on the location wherethe particles were suspended (Hanisch and Crowley, 2003).When exposed to UV light (λ< 390 nm) TiO2 promotes anelectron (e−CB) from the conduction band to the valence band,leaving behind a positively charged hole (h+VB) in the valenceband (Chen et al., 2012):
TiO2+hν→ e−CB+h+
VB, (R1)
which can then lead to both reduction and oxidation reac-tions of any surface-adsorbed gas-phase species such as NO2leading to HONO.
In previous studies of the reaction of NO2 on TiO2 aerosolsurfaces, HONO was observed as a major gas-phase prod-uct (Gustafsson et al., 2006; Dupart et al., 2014). Gustafs-son et al. (2006) observed a yield of gas-phase HONO of∼ 75 % (for each NO2 removed) and showed the rate of thephotoreaction of NO2 on pure TiO2 aerosols dependent onrelative humidity, emphasising the superhydrophilic natureof TiO2 surfaces under UV irradiation. Dupart et al. (2014)also reported a relative humidity dependence of the uptake ofNO2 onto Arizona test dust containing TiO2, with the maingas-phase products measured being NO and HONO, witha HONO yield of 30 % in experiments with 110 ppb NO2.Dupart et al. (2014) postulated the following mechanism ofHONO production, which is consistent with the formation ofthe NO−2 anion seen in a previous study on TiO2 surfaces(Nakamura et al., 2000):
h+VB+H2O→ H++OH, (R2)e−CB+O2→ O−2 , (R3)NO2+O−2
(or e−CB
)→ NO−2 +O2, (R4)
NO−2 +H+→ HONO, (R5)NO2+OH→ HNO3. (R6)
In areas with high mineral dust loading, such as desert re-gions, far from anthropogenic sources, NO2 concentrationsare typically low. However, when dust is transported to ur-ban areas, this source of HONO may become significant. Onestudy reported that TiO2 composed 0.75–1.58 µgm−3 whenaerosol loadings were 250–520 µgm−3 over the same timeperiod in southeast Beijing, when air had been transportedfrom the Gobi desert (Schleicher et al., 2010).
In this study, the production of HONO on the surface ofTiO2 particles in the presence of NO2 is investigated as afunction of NO2 mixing ratio, aerosol surface area densityand relative humidity using an aerosol flow tube system cou-pled to a photo-fragmentation laser-induced fluorescence de-tector (Boustead, 2019). The uptake coefficient of NO2 togenerate HONO is then determined, and a mechanistic inter-pretation of the experimental observations is presented. Theproduction of HONO directly in the absence of NO2 from theillumination of a mixed sample of nitrate and TiO2 aerosolis also presented. Using a similar apparatus, previous workhad showed that TiO2 particles produce OH and HO2 radi-cals directly under UV illumination (Moon et al., 2019). Theatmospheric implications of these results and the role of pho-tocatalysts for the formation of HONO are also discussed.
2 Method
2.1 Overview of the experimental setup
The production of HONO from illuminated aerosol surfacesis studied using an aerosol flow tube system coupled toa photo-fragmentation laser-induced fluorescence (PF-LIF)
J. E. Dyson et al.: HONO production from illuminated aerosols 5757
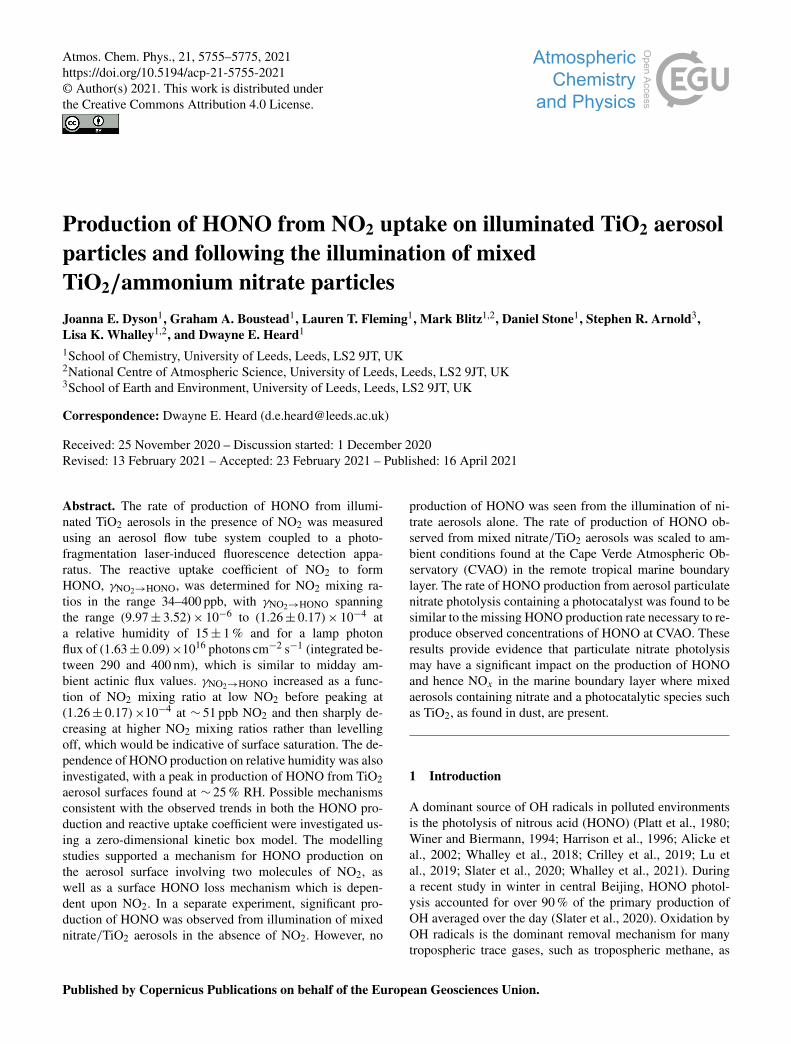
cell which allows the highly sensitive detection of the OHradical formed through photo-fragmentation of HONO intoOH and NO followed by laser-induced fluorescence (LIF)detection at low pressure. The experimental setup used inthis investigation is described in detail in Boustead (2019), aswell as similar systems having been used to measure HONOin the field (Liao et al., 2006; Wang et al., 2020), and there-fore only a brief description of the setup is given here. Aschematic of the experimental setup is shown in Fig. 1.
All experiments were conducted at room temperature(295± 3 K) using nitrogen (BOC, 99.998 %) or air (BOC,21± 0.5 % O2) as the carrier gas. A humidified flow ofaerosols, ∼ 6 L min−1 (total residence time of 104 s in theflow tube), was introduced through an inlet at the rear ofthe aerosol flow tube (Quartz, 100 cm long, 11.5 cm i.d.),which was covered by a black box to eliminate the presenceof room light during experiments. A 15 W UV lamp (XX-15LW bench lamp, λpeak = 365 nm) was situated on the out-side of the flow tube to illuminate aerosols and promote theproduction of HONO (half the length of the flow tube was il-luminated, leading to an illumination time of 52 s). The con-centration of HONO is measured by PF-LIF with samplingfrom the end of the flow tube via a protruding turret contain-ing a 1 mm diameter pinhole, through which the gas exitingthe flow tube was drawn into the detection cell at 5 L min−1.The detection cell was kept at low pressure, ∼ 1.5 Torr, us-ing a rotary pump (Edwards, E1M80) in combination with aroots blower (Edwards, EH1200). All gas flows in the exper-iment were controlled using mass flow controllers (MKS andBrooks). The relative humidity (RH) and temperature of theaerosol flow was measured using a probe (Rotronics HC2-S,accuracy ±1 % RH) the former calibrated against the H2Ovapour concentration measured by a chilled mirror hygrom-eter (General Eastern Optica) in the exhaust from the flowtube.
2.2 Aerosol generation and detection
Solutions for the generation of TiO2 aerosol solutions wereprepared by dissolving 5 g of titanium dioxide (AldrichChemistry 718467, 99.5 % Degussa, 80 % anatase : 20 % ru-tile) into 500 mL of Milli-Q water. Polydisperse aerosolswere then generated from this solution using an atomiser(TSI model 3076), creating a 1 L min−1 flow of TiO2 aerosolparticles in nitrogen hereafter referred to as the aerosol flow.This aerosol flow was then passed through a silica dryingtube (TSI 3062, capable of reducing 60 % RH incoming flowto 20 % RH) to remove water vapour and then passed througha neutraliser to apply a known charge distribution and reduceloss of aerosols to the walls. After the neutraliser the aerosolflow was mixed with both a dry and a humidified N2 flow(controlled by mass flow controllers) to regulate the relativehumidity of the system by changing the ratio of dry to hu-mid nitrogen flows. A conditioning tube was then used toallow for equilibration of water vapour adsorption and re-
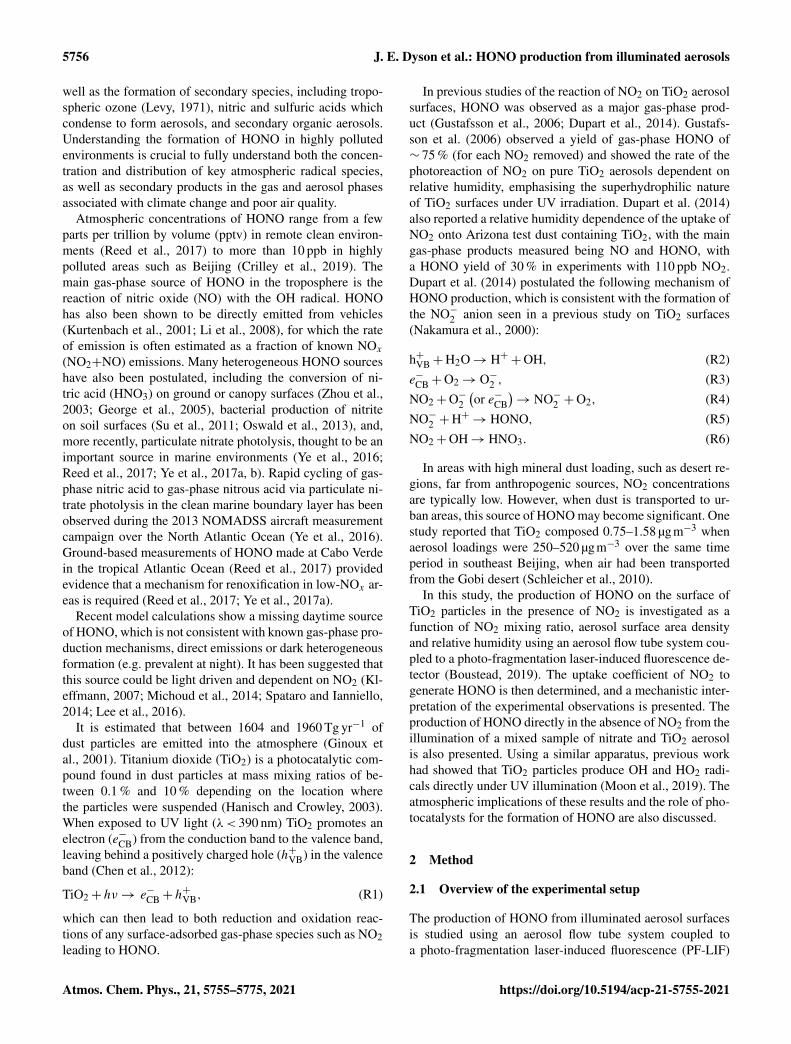
evaporation to and from the aerosol surfaces for the cho-sen RH, which was controlled within the range∼ 10 %–70 %RH. A portion of the aerosol flow was then passed througha high-efficiency particle filter (HEPA) fitted with a bypassloop and bellows valve allowing control of the aerosol num-ber concentration entering the aerosol flow tube. Previousstudies (George et al., 2013; Boustead, 2019) have shownthe loss of aerosol to the walls of the flow tube to be negli-gible. Aerosol size distributions were measured for aerosolsexiting the flow tube using a scanning mobility particle sizer(SMPS, TSI 3081) and a condensation particle counter (CPC,TSI 3775) which was calibrated using latex beads. Anyaerosol surface area not counted due to the upper diameterrange of the combined SMPS/CPC (14.6–661.2 nm, sheathflow of 3 L min−1, instrumental particle counting error of10 %–20 %) was corrected for during analysis by assum-ing a log-normal distribution, which was verified for TiO2aerosols generated in this manner (Matthews et al., 2014).However, the majority of aerosols, > 90 %, had diametersin the range that could be directly detected. In addition tothe experiments with single-component TiO2, mixed ammo-nium nitrate/TiO2 and single-component ammonium nitrateaerosols were also generated using the atomiser for inves-tigations of HONO production from nitrate aerosols withoutNO2 present. An example of an aerosol size distribution fromthis work for single-component ammonium nitrate aerosols,mixed ammonium nitrate/TiO2 and single-component TiO2aerosols is shown in Fig. 2.
2.3 Detection of HONO
As HONO is not directly detectable via LIF, it was nec-essary to fragment the HONO produced into OH and NO(Liao et al., 2007), with detection of OH via LIF. A 355 nmphotolysis laser (Spectron Laser Systems, SL803) with apulse repetition frequency (PRF) of 10 Hz and pulse duration∼ 10 ns was used to fragment HONO into OH. This frag-mentation wavelength was chosen as HONO has a strong ab-sorption peak at ∼ 355 nm, leading to the breakage of theHO–NO bond to form NO and OH in their electronic groundstates (Shan et al., 1989). A Nd:YAG pumped dye probelaser (JDSU Q201-HD, Q series, Sirah Cobra Stretch) witha PRF of 5000 Hz was used for the detection of OH viathe fluorescence assay by gas expansion (FAGE) technique,which employs the expansion of gas through a small pin-hole into the detection cell. The OH radical was measuredusing on-resonance detection by LIF via the excitation of theA26+ (ν′ = 0)←X25i (ν′′ = 0)Q1(2) transition at 308 nm(Heard, 2006). A multi-channel plate (MCP) photomultiplier(Photek, MCP 325) equipped with an interference filter at308 nm (Barr Associates, 308 nm, FWHM – 8 nm, ∼ 50 %transmission) was used to measure the fluorescence signal. Areference OH cell in which a large LIF signal could be gener-ated was utilised to ensure the wavelength of the probe laserremained tuned to the peak of the OH transition at 308 nm.
5758 J. E. Dyson et al.: HONO production from illuminated aerosols
Figure 1. Schematic of the Leeds aerosol flow tube system coupled to a laser-fragmentation laser-induced fluorescence detector for HONO.The paths of the 355 nm (blue) and 308 nm (purple, depicted as travelling out of the page perpendicular to the 355 nm light) light are alsoshown. CPC: condensation particle counter; DMA: differential mobility analyser; HEPA: high-efficiency particle air filter; FAGE: fluores-cence assay by gas expansion; MCP: microchannel plate photomultiplier; MFC: mass flow controller; RH/T : relative humidity/temperatureprobe; SMPS: scanning mobility particle sizer.
Figure 2. Typical aerosol surface area distribution for pure am-monium nitrate aerosols (green) and pure TiO2 aerosols (red) and50 : 50 mixed nitrate/TiO2 aerosols (purple) measured after theflow tube.
OH measurements are taken both before and after each pho-tolysis laser pulse, allowing measurement of any OH alreadypresent in the gas flow to be determined as a background sig-nal for subtraction. The OH generated from HONO photoly-sis was measured promptly (∼ 800 ns) after the 355 nm pulseto maximise sensitivity to OH before it was spatially dilutedaway from the measurement region (Boustead, 2019). Offlinemeasurements, with the probe laser wavelength moved away
from the OH transition (by 0.02 nm), were taken to allowthe signal generated from detector dark counts and scatteredlaser light to be measured and subtracted from the online sig-nal. To determine an absolute value of the HONO concentra-tion, [HONO], a calibration was performed, in order to con-vert from the HONO signal, SHONO, using SHONO = CHONO[HONO], as described fully in Boustead (2019). A glass cali-bration wand was used to produce OH and HO2 in equal con-centrations from the photolysis of water vapour at 185 nm:
H2O+ hνλ=185 nm−→ OH+H, (R7)
H+O2+M→ HO2+M. (R8)
An excess flow of NO was then added to generate HONO,which was then detected as OH in the cell. The excess flow ofNO (BOC, 99.5 %) ensures rapid and complete conversion ofOH and HO2 to HONO. The concentration of OH and HO2produced, and therefore the amount of HONO produced inthe wand, is calculated using
[OH]= [HO2]= [H2O] σH2O φOHF t, (1)
where [H2O] is the concentration of water vapour in thehumidified gas flow, σH2O is the absorption cross sectionof H2O at 185 nm 7.14× 10⁻²⁰ cm2 molec.−1 (Cantrell etal., 1997), φOH is the quantum yield of OH for the photo-dissociation of H2O at 185 nm (= 1), F is the lamp flux andt is the irradiation time (the product of which is determinedusing ozone actinometry (Boustead, 2019).
J. E. Dyson et al.: HONO production from illuminated aerosols 5759
A typical value of the calibration factor was CHONO =
(3.63±0.51)×10−9 counts mW−1 for N2, leading to a calcu-lated limit of detection of 12 ppt for a 50 s averaging periodand a signal-to-noise ratio (SNR) of 1 (Boustead, 2019). Thetypical error in the HONO concentration was 15 % at 1σ , de-termined by the error in the calibration.
2.4 Experimental procedure and data analysis
The experiments were performed with a minimum flow of6 L min−1 through the aerosol flow tube, giving a Reynoldsnumber of ∼ 150, which ensured a laminar flow regime. TheHONO signal, converted to an absolute concentration usinga calibration factor, was measured over a range of aerosolsurface area densities, both in the presence and absence of il-lumination, and background measurements without aerosolspresent were also performed.
The HONO signal originates from several sources: the il-luminated aerosol surface, the illuminated quartz flow tubewalls, dark reactions on aerosol surfaces, dark reactions onthe flow tube surface, and finally from impurities in the NO2(Sigma Aldrich,> 99.5 %, freeze pump thawed to further re-move any remaining NO or O2) and N2 flows (either HONOitself or a species which photolyses at 355 nm to give OH).Of interest here is the HONO production from both dark andilluminated aerosol surfaces which is atmospherically rele-vant. Following transit through the flow tube, and in the pres-ence of NO2, the total concentration of HONO measured bythe PF-LIF detector is given by
[HONO]= [HONO]illuminated aerosols
+ [HONO]illuminated walls+ [HONO]dark aerosols
+ [HONO]dark walls+ [HONO]impurities. (2)
Any HONO seen without the presence of aerosol wastherefore due to HONO impurities in the N2 or NO2 gas,the dark production of HONO from the flow tube walls orfrom the production of HONO from the illuminated reac-tor walls, which may include production from TiO2 aerosolscoating the flow tube in the presence of NO2. This back-ground HONO concentration depended on the experimentalconditions and on how recently the flow tube and PF-LIF cellhad been cleaned to remove any build-up of TiO2 deposits.However, the build-up of TiO2 on the flow tube walls wasrelatively slow, and back-to-back measurements were madein the presence and absence of aerosols to obtain an accu-rate background. Additional experiments showed no signif-icant production of HONO on TiO2 aerosol surfaces with-out the presence of NO2. Even though the aerosol surfacearea density (∼ 0.02 m2 m−3) was small compared to the sur-face area density of the reactor walls (35 m2 m−3), very littleHONO signal was produced without the presence of aerosolsand was always subtracted from the signal in the presenceof aerosols. The HONO signal was measured both with thelamp on and off for each aerosol surface area density to in-vestigate the production of HONO from illuminated aerosol
surfaces. The HONO signal was averaged over 50 s (aver-age of 500 of the 355 nm photolysis laser pulses with a PRFof 10 Hz). Once aerosols were introduced into the flow tubesystem, a period of ∼ 30 min was allowed for equilibrationand the measured aerosol surface area density to stabilise. Ingeneral, the relative humidity of the system was kept con-stant at RH ∼ 15 % for all experiments investigating HONOproduction as a function of NO2 mixing ratio over the range34–400 ppb. In a number of experiments, however, RH wasvaried in the range ∼ 12 %–37 %.
The mixing ratio of NO2 entering the flow tube was cal-culated using the concentration of the NO2 in the cylinderand the degree of dilution. The NO2 mixing ratio withinthe cylinder was determined using a commercial instrumentbased on UV–Vis absorption spectroscopy (Thermo Fisher42TL, limit of detection 50 pptv, precision 25 pptv). For eachindividual experiment, the mixing ratio of NO2 was keptconstant (within the range 34–400 ppb), and the aerosol sur-face area density was varied from zero up to a maximum of0.04 m2 m−3, in order to obtain the HONO produced fromilluminated aerosol surfaces in the flow tube for a given mix-ing ratio of NO2. As well as subtraction of any backgroundHONO, a correction must be made for any loss of HONOowing to its photolysis occurring within the flow tube.
In order to determine the rate of photolysis of HONO, therate of photolysis of NO2 was first determined using chem-ical actinometry, and the known spectral output of the lampand the literature values of the absorption cross sections andphoto-dissociation quantum yields for NO2 and HONO wereused to determine the rate of photolysis of HONO. When justflowing NO2 in the flow tube, the loss of NO2 within the illu-minated region is determined only by photolysis and is givenby
−d[NO2]
dt= j (NO2)[NO2], (3)
where j (NO2) is the photolysis frequency of NO2 for thelamp used in these experiments. From the measured loss ofNO2 in the illuminated region, and with knowledge of theresidence time, the photolysis frequency, j (NO2), was deter-mined to be (6.43± 0.30)× 10−3 s−1 for the set of experi-ments using one lamp to illuminate the flow tube. j (NO2) isgiven by
j (NO2)=
λ2∫λ1
σλφλFλdλ, (4)
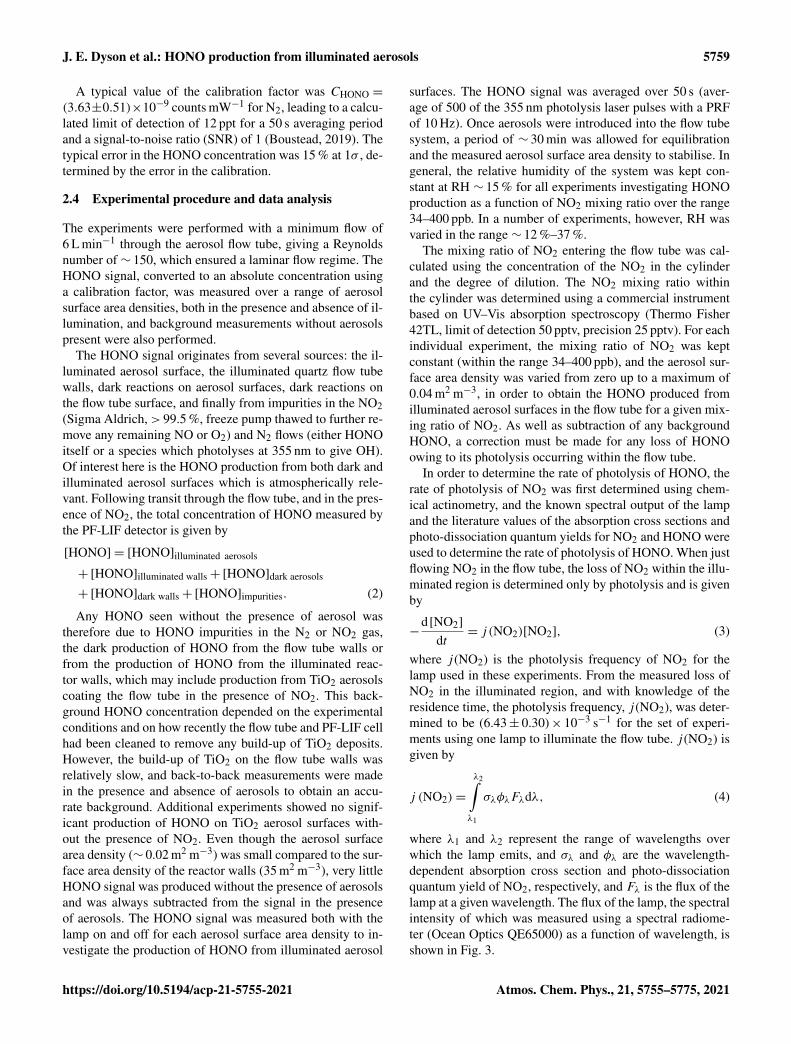
where λ1 and λ2 represent the range of wavelengths overwhich the lamp emits, and σλ and φλ are the wavelength-dependent absorption cross section and photo-dissociationquantum yield of NO2, respectively, and Fλ is the flux of thelamp at a given wavelength. The flux of the lamp, the spectralintensity of which was measured using a spectral radiome-ter (Ocean Optics QE65000) as a function of wavelength, isshown in Fig. 3.
5760 J. E. Dyson et al.: HONO production from illuminated aerosols
Figure 3. UVA emission spectrum for the 15 W bench lampused in these experiments between 290–400 nm. The inte-grated photon flux over this wavelength range is (1.63± 0.09)×1016 photons cm−2 s−1 determined from the measured j (NO2) of(6.43± 0.30)× 10−3 s−1.
From the measured j (NO2), and with knowledge of σλand ϕλ for NO2, the flux of the lamp was determinedto be (1.63± 0.09)× 1016 photons cm−2 s−1 integrated overthe 290–400 nm wavelength range of the lamp. Usingthis flux, and the known σλ and ϕλ for HONO over thesame wavelength range, j (HONO) was determined to be(1.66± 0.10)× 10−3 s−1.
In the presence of aerosols under illuminated conditions,the rate of heterogeneous removal of NO2 at the aerosol sur-face to generate HONO is given by
−d[NO2]
dt= k[NO2], (5)
where k is the pseudo-first-order rate coefficient for loss ofNO2 at the aerosol surface, which leads to the generationof HONO. The postulated mechanism for HONO productionfrom NO2 is discussed in Sect. 3.3.2 below, but for the defi-nition of k it is assumed to be a first-order process for NO2.Integration of Eq. (5) gives
k =−ln(
[NO2]0−[HONO]t[NO2]0
)t
, (6)
where [NO2]0−[HONO]t is the concentration of NO2 at timet , assuming that each NO2 molecule is quantitatively con-verted to a HONO molecule following surface uptake (seeSect. 3.3.2 for the proposed mechanism), and [NO2]0 is theinitial concentration of NO2. Hence k can be determinedfrom Eq. (6) using the measurement of the concentration ofHONO, [HONO], that has been generated from TiO2 aerosolsurfaces for an illumination time of t (and after subtractionof any background HONO produced from other sources andafter correction for loss via photolysis; see above) and withknowledge of [NO2]0.
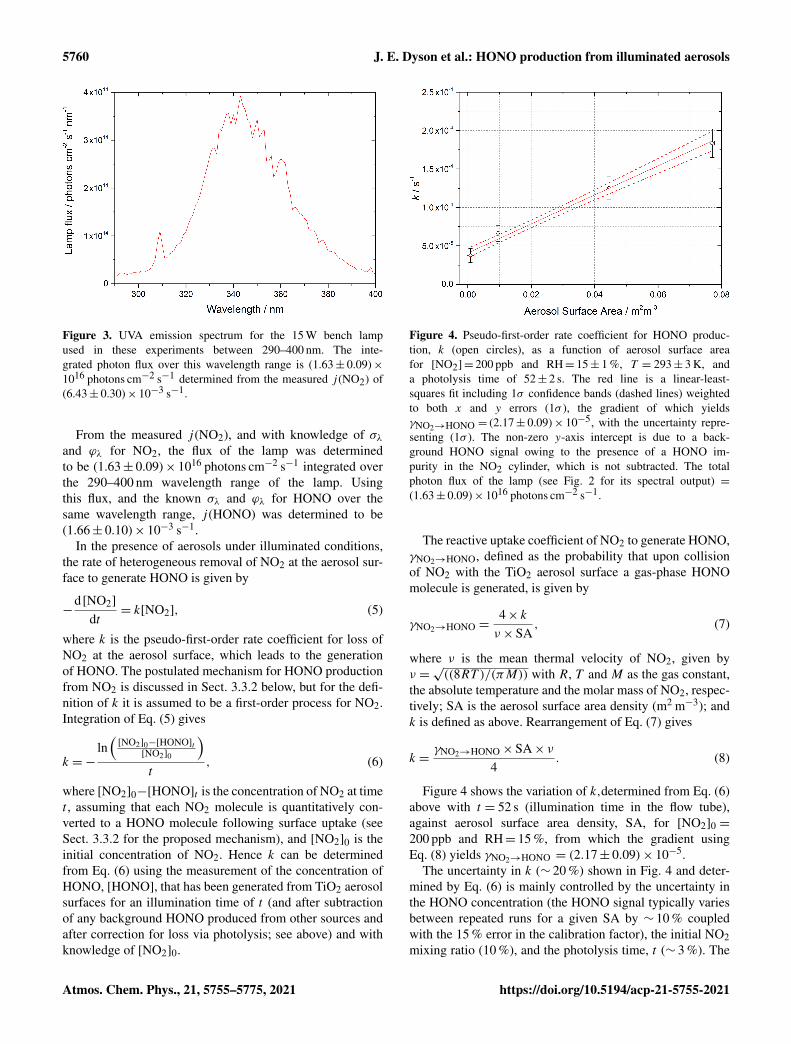
Figure 4. Pseudo-first-order rate coefficient for HONO produc-tion, k (open circles), as a function of aerosol surface areafor [NO2]= 200 ppb and RH= 15± 1 %, T = 293± 3 K, anda photolysis time of 52± 2 s. The red line is a linear-least-squares fit including 1σ confidence bands (dashed lines) weightedto both x and y errors (1σ ), the gradient of which yieldsγNO2→HONO = (2.17± 0.09)× 10−5, with the uncertainty repre-senting (1σ ). The non-zero y-axis intercept is due to a back-ground HONO signal owing to the presence of a HONO im-purity in the NO2 cylinder, which is not subtracted. The totalphoton flux of the lamp (see Fig. 2 for its spectral output) =(1.63± 0.09)× 1016 photons cm−2 s−1.
The reactive uptake coefficient of NO2 to generate HONO,γNO2→HONO, defined as the probability that upon collisionof NO2 with the TiO2 aerosol surface a gas-phase HONOmolecule is generated, is given by
γNO2→HONO =4× kν×SA
, (7)
where ν is the mean thermal velocity of NO2, given byν =√((8RT )/(πM)) with R, T and M as the gas constant,
the absolute temperature and the molar mass of NO2, respec-tively; SA is the aerosol surface area density (m2 m−3); andk is defined as above. Rearrangement of Eq. (7) gives
k =γNO2→HONO×SA× ν
4. (8)
Figure 4 shows the variation of k,determined from Eq. (6)above with t = 52 s (illumination time in the flow tube),against aerosol surface area density, SA, for [NO2]0 =
200 ppb and RH= 15 %, from which the gradient usingEq. (8) yields γNO2→HONO = (2.17± 0.09)× 10−5.
The uncertainty in k (∼ 20 %) shown in Fig. 4 and deter-mined by Eq. (6) is mainly controlled by the uncertainty inthe HONO concentration (the HONO signal typically variesbetween repeated runs for a given SA by ∼ 10 % coupledwith the 15 % error in the calibration factor), the initial NO2mixing ratio (10 %), and the photolysis time, t (∼ 3 %). The
J. E. Dyson et al.: HONO production from illuminated aerosols 5761
uncertainty in SA is determined by the uncertainty in theSMPS (15 %). The error in the value of γNO2→HONO (typi-cally 20 %) is calculated from the 1σ statistical error of theweighted fit shown in Fig. 4. An experiment performed us-ing air yielded an uptake coefficient value within 7 % of theequivalent experiment done in N2, which is well within theexperimental error.
2.5 Box model description
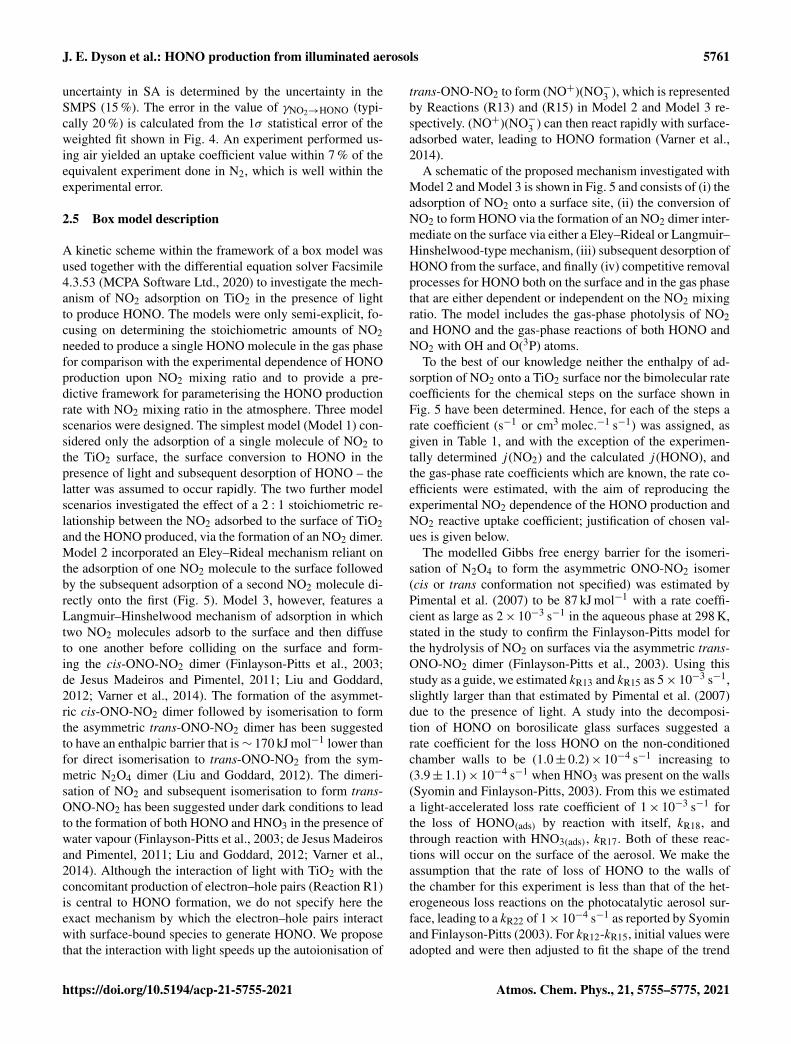
A kinetic scheme within the framework of a box model wasused together with the differential equation solver Facsimile4.3.53 (MCPA Software Ltd., 2020) to investigate the mech-anism of NO2 adsorption on TiO2 in the presence of lightto produce HONO. The models were only semi-explicit, fo-cusing on determining the stoichiometric amounts of NO2needed to produce a single HONO molecule in the gas phasefor comparison with the experimental dependence of HONOproduction upon NO2 mixing ratio and to provide a pre-dictive framework for parameterising the HONO productionrate with NO2 mixing ratio in the atmosphere. Three modelscenarios were designed. The simplest model (Model 1) con-sidered only the adsorption of a single molecule of NO2 tothe TiO2 surface, the surface conversion to HONO in thepresence of light and subsequent desorption of HONO – thelatter was assumed to occur rapidly. The two further modelscenarios investigated the effect of a 2 : 1 stoichiometric re-lationship between the NO2 adsorbed to the surface of TiO2and the HONO produced, via the formation of an NO2 dimer.Model 2 incorporated an Eley–Rideal mechanism reliant onthe adsorption of one NO2 molecule to the surface followedby the subsequent adsorption of a second NO2 molecule di-rectly onto the first (Fig. 5). Model 3, however, features aLangmuir–Hinshelwood mechanism of adsorption in whichtwo NO2 molecules adsorb to the surface and then diffuseto one another before colliding on the surface and form-ing the cis-ONO-NO2 dimer (Finlayson-Pitts et al., 2003;de Jesus Madeiros and Pimentel, 2011; Liu and Goddard,2012; Varner et al., 2014). The formation of the asymmet-ric cis-ONO-NO2 dimer followed by isomerisation to formthe asymmetric trans-ONO-NO2 dimer has been suggestedto have an enthalpic barrier that is∼ 170 kJ mol−1 lower thanfor direct isomerisation to trans-ONO-NO2 from the sym-metric N2O4 dimer (Liu and Goddard, 2012). The dimeri-sation of NO2 and subsequent isomerisation to form trans-ONO-NO2 has been suggested under dark conditions to leadto the formation of both HONO and HNO3 in the presence ofwater vapour (Finlayson-Pitts et al., 2003; de Jesus Madeirosand Pimentel, 2011; Liu and Goddard, 2012; Varner et al.,2014). Although the interaction of light with TiO2 with theconcomitant production of electron–hole pairs (Reaction R1)is central to HONO formation, we do not specify here theexact mechanism by which the electron–hole pairs interactwith surface-bound species to generate HONO. We proposethat the interaction with light speeds up the autoionisation of
trans-ONO-NO2 to form (NO+)(NO−3 ), which is representedby Reactions (R13) and (R15) in Model 2 and Model 3 re-spectively. (NO+)(NO−3 ) can then react rapidly with surface-adsorbed water, leading to HONO formation (Varner et al.,2014).
A schematic of the proposed mechanism investigated withModel 2 and Model 3 is shown in Fig. 5 and consists of (i) theadsorption of NO2 onto a surface site, (ii) the conversion ofNO2 to form HONO via the formation of an NO2 dimer inter-mediate on the surface via either a Eley–Rideal or Langmuir–Hinshelwood-type mechanism, (iii) subsequent desorption ofHONO from the surface, and finally (iv) competitive removalprocesses for HONO both on the surface and in the gas phasethat are either dependent or independent on the NO2 mixingratio. The model includes the gas-phase photolysis of NO2and HONO and the gas-phase reactions of both HONO andNO2 with OH and O(3P) atoms.
To the best of our knowledge neither the enthalpy of ad-sorption of NO2 onto a TiO2 surface nor the bimolecular ratecoefficients for the chemical steps on the surface shown inFig. 5 have been determined. Hence, for each of the steps arate coefficient (s−1 or cm3 molec.−1 s−1) was assigned, asgiven in Table 1, and with the exception of the experimen-tally determined j (NO2) and the calculated j (HONO), andthe gas-phase rate coefficients which are known, the rate co-efficients were estimated, with the aim of reproducing theexperimental NO2 dependence of the HONO production andNO2 reactive uptake coefficient; justification of chosen val-ues is given below.
The modelled Gibbs free energy barrier for the isomeri-sation of N2O4 to form the asymmetric ONO-NO2 isomer(cis or trans conformation not specified) was estimated byPimental et al. (2007) to be 87 kJ mol−1 with a rate coeffi-cient as large as 2× 10⁻³ s−1 in the aqueous phase at 298 K,stated in the study to confirm the Finlayson-Pitts model forthe hydrolysis of NO2 on surfaces via the asymmetric trans-ONO-NO2 dimer (Finlayson-Pitts et al., 2003). Using thisstudy as a guide, we estimated kR13 and kR15 as 5× 10⁻³ s−1,slightly larger than that estimated by Pimental et al. (2007)due to the presence of light. A study into the decomposi-tion of HONO on borosilicate glass surfaces suggested arate coefficient for the loss HONO on the non-conditionedchamber walls to be (1.0± 0.2)× 10−4 s−1 increasing to(3.9± 1.1)× 10−4 s−1 when HNO3 was present on the walls(Syomin and Finlayson-Pitts, 2003). From this we estimateda light-accelerated loss rate coefficient of 1× 10⁻³ s−1 forthe loss of HONO(ads) by reaction with itself, kR18, andthrough reaction with HNO3(ads), kR17. Both of these reac-tions will occur on the surface of the aerosol. We make theassumption that the rate of loss of HONO to the walls ofthe chamber for this experiment is less than that of the het-erogeneous loss reactions on the photocatalytic aerosol sur-face, leading to a kR22 of 1× 10⁻⁴ s−1 as reported by Syominand Finlayson-Pitts (2003). For kR12-kR15, initial values wereadopted and were then adjusted to fit the shape of the trend
5762 J. E. Dyson et al.: HONO production from illuminated aerosols
Figure 5. Schematic diagram of proposed mechanism of uptake of NO2 on an aerosol surface in the presence of water to form HONO. BothEley–Rideal, Model 2, and Langmuir–Hinshelwood, Model 3, mechanisms are shown with relevant estimated and calculated rate coefficientsused in the models. NO2-dependent and independent loss reactions of HONO are also depicted. Nitrogen is shown in black, oxygen is shownin red and hydrogen is shown in blue. ∗ denotes intermediate steps of the isomerisation of symmetric N2O4 to trans-ONO-NO2, which isthen predicted to form HONO.
in experimental results of [HONO] and γNO2→HONO versus[NO2], discussed fully in Sect. 3.3.2. For completeness, gas-phase loss reactions of HONO and NO2 with OH and thereactions of O(3P) with NO, NO2 and O2 were also includedin the model, Reactions (R23)–(R27), though their inclusionhad no effect on the HONO concentration. The rates of Re-actions (R23)–(R27) within the model are much smaller thanHONO loss reactions on the surface, Reactions (R17)–(R19),and the photolysis Reaction (R21). For both Model 2 andModel 3, the adsorption of an NO2 molecule to the surface,kR9, was assumed to be rapid and not the rate-determiningstep. Likewise, the desorption of HONO was also assumedto be rapid – faster than the loss rates of adsorbed HONO butslower than the adsorption of NO2; this was necessary for
the model to reproduce the trend in the experimental resultsof [HONO] versus [NO2], discussed fully in Sect. 3.3.2.
3 Results and discussion
3.1 HONO production from TiO2 aerosol surfaces inthe presence of NO2
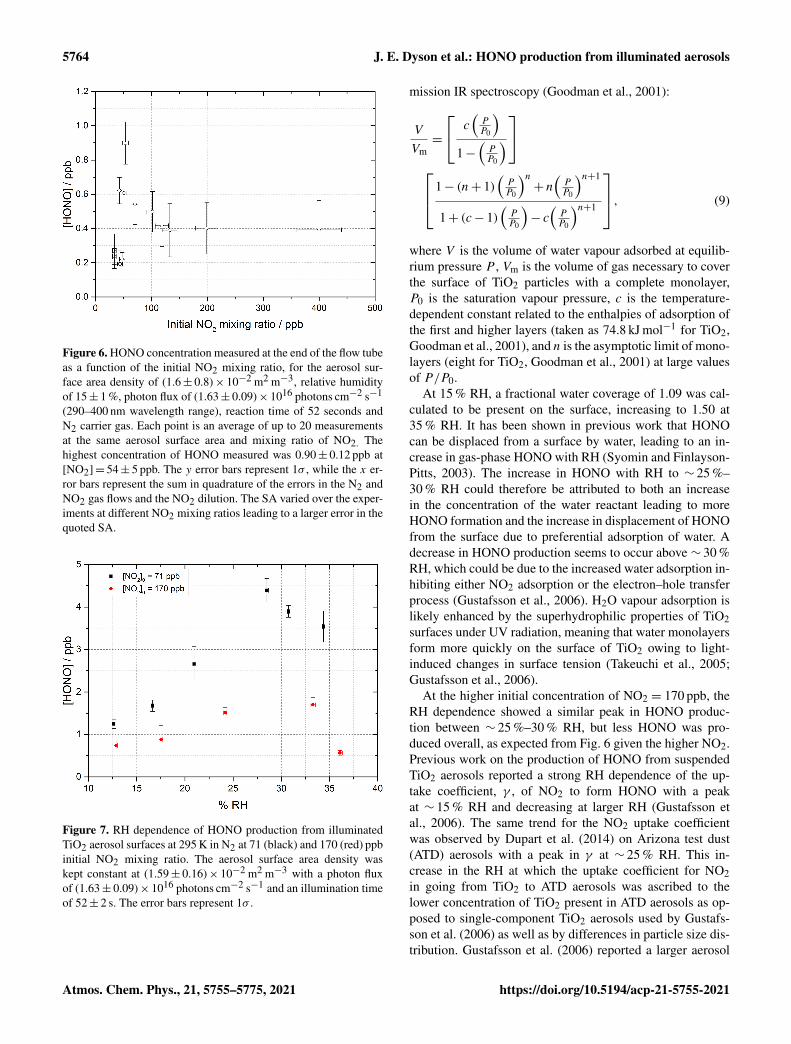
The production of HONO on TiO2 aerosol surfaces was mea-sured as a function of the initial NO2 mixing ratio. Figure 6shows the dependence of the HONO concentration, mea-sured at the end of the flow tube, on the initial NO2 mixing ra-tio for an aerosol surface area of (1.6± 0.8)× 10−2 m2 m−3.A sharp increase in HONO production at a low mixing ratioof NO2 was seen, followed by a more gradual reduction in
J. E. Dyson et al.: HONO production from illuminated aerosols 5763
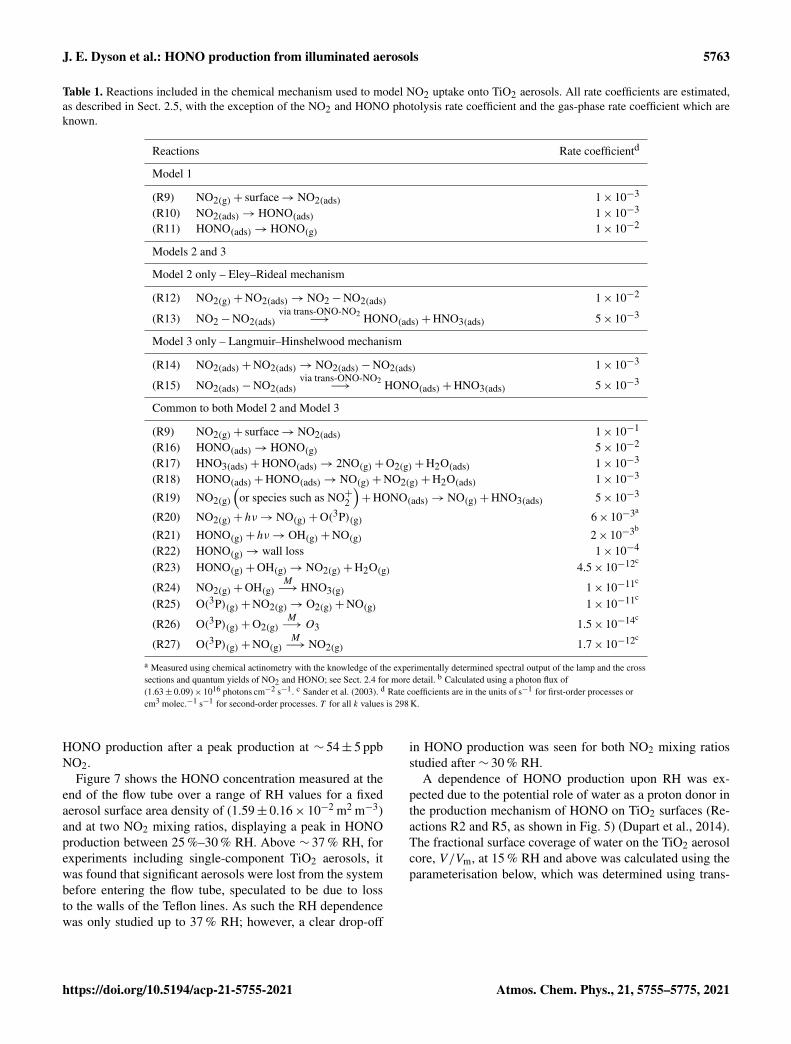
Table 1. Reactions included in the chemical mechanism used to model NO2 uptake onto TiO2 aerosols. All rate coefficients are estimated,as described in Sect. 2.5, with the exception of the NO2 and HONO photolysis rate coefficient and the gas-phase rate coefficient which areknown.
a Measured using chemical actinometry with the knowledge of the experimentally determined spectral output of the lamp and the crosssections and quantum yields of NO2 and HONO; see Sect. 2.4 for more detail. b Calculated using a photon flux of(1.63± 0.09)× 1016 photons cm−2 s−1. c Sander et al. (2003). d Rate coefficients are in the units of s−1 for first-order processes orcm3 molec.−1 s−1 for second-order processes. T for all k values is 298 K.
HONO production after a peak production at ∼ 54± 5 ppbNO2.
Figure 7 shows the HONO concentration measured at theend of the flow tube over a range of RH values for a fixedaerosol surface area density of (1.59± 0.16× 10⁻² m2 m−3)and at two NO2 mixing ratios, displaying a peak in HONOproduction between 25 %–30 % RH. Above ∼ 37 % RH, forexperiments including single-component TiO2 aerosols, itwas found that significant aerosols were lost from the systembefore entering the flow tube, speculated to be due to lossto the walls of the Teflon lines. As such the RH dependencewas only studied up to 37 % RH; however, a clear drop-off
in HONO production was seen for both NO2 mixing ratiosstudied after ∼ 30 % RH.
A dependence of HONO production upon RH was ex-pected due to the potential role of water as a proton donor inthe production mechanism of HONO on TiO2 surfaces (Re-actions R2 and R5, as shown in Fig. 5) (Dupart et al., 2014).The fractional surface coverage of water on the TiO2 aerosolcore, V/Vm, at 15 % RH and above was calculated using theparameterisation below, which was determined using trans-
5764 J. E. Dyson et al.: HONO production from illuminated aerosols
Figure 6. HONO concentration measured at the end of the flow tubeas a function of the initial NO2 mixing ratio, for the aerosol sur-face area density of (1.6± 0.8)× 10−2 m2 m−3, relative humidityof 15± 1 %, photon flux of (1.63± 0.09)× 1016 photons cm−2 s−1
(290–400 nm wavelength range), reaction time of 52 seconds andN2 carrier gas. Each point is an average of up to 20 measurementsat the same aerosol surface area and mixing ratio of NO2. Thehighest concentration of HONO measured was 0.90± 0.12 ppb at[NO2]= 54± 5 ppb. The y error bars represent 1σ , while the x er-ror bars represent the sum in quadrature of the errors in the N2 andNO2 gas flows and the NO2 dilution. The SA varied over the exper-iments at different NO2 mixing ratios leading to a larger error in thequoted SA.
Figure 7. RH dependence of HONO production from illuminatedTiO2 aerosol surfaces at 295 K in N2 at 71 (black) and 170 (red) ppbinitial NO2 mixing ratio. The aerosol surface area density waskept constant at (1.59± 0.16)× 10−2 m2 m−3 with a photon fluxof (1.63± 0.09)× 1016 photons cm−2 s−1 and an illumination timeof 52± 2 s. The error bars represent 1σ .
mission IR spectroscopy (Goodman et al., 2001):
V
Vm=
c(PP0
)1−
(PP0
)
1− (n+ 1)(PP0
)n+ n
(PP0
)n+1
1+ (c− 1)(PP0
)− c
(PP0
)n+1
, (9)
where V is the volume of water vapour adsorbed at equilib-rium pressure P , Vm is the volume of gas necessary to coverthe surface of TiO2 particles with a complete monolayer,P0 is the saturation vapour pressure, c is the temperature-dependent constant related to the enthalpies of adsorption ofthe first and higher layers (taken as 74.8 kJ mol−1 for TiO2,Goodman et al., 2001), and n is the asymptotic limit of mono-layers (eight for TiO2, Goodman et al., 2001) at large valuesof P/P0.
At 15 % RH, a fractional water coverage of 1.09 was cal-culated to be present on the surface, increasing to 1.50 at35 % RH. It has been shown in previous work that HONOcan be displaced from a surface by water, leading to an in-crease in gas-phase HONO with RH (Syomin and Finlayson-Pitts, 2003). The increase in HONO with RH to ∼ 25 %–30 % RH could therefore be attributed to both an increasein the concentration of the water reactant leading to moreHONO formation and the increase in displacement of HONOfrom the surface due to preferential adsorption of water. Adecrease in HONO production seems to occur above ∼ 30 %RH, which could be due to the increased water adsorption in-hibiting either NO2 adsorption or the electron–hole transferprocess (Gustafsson et al., 2006). H2O vapour adsorption islikely enhanced by the superhydrophilic properties of TiO2surfaces under UV radiation, meaning that water monolayersform more quickly on the surface of TiO2 owing to light-induced changes in surface tension (Takeuchi et al., 2005;Gustafsson et al., 2006).
At the higher initial concentration of NO2 = 170 ppb, theRH dependence showed a similar peak in HONO produc-tion between ∼ 25 %–30 % RH, but less HONO was pro-duced overall, as expected from Fig. 6 given the higher NO2.Previous work on the production of HONO from suspendedTiO2 aerosols reported a strong RH dependence of the up-take coefficient, γ , of NO2 to form HONO with a peakat ∼ 15 % RH and decreasing at larger RH (Gustafsson etal., 2006). The same trend for the NO2 uptake coefficientwas observed by Dupart et al. (2014) on Arizona test dust(ATD) aerosols with a peak in γ at ∼ 25 % RH. This in-crease in the RH at which the uptake coefficient for NO2in going from TiO2 to ATD aerosols was ascribed to thelower concentration of TiO2 present in ATD aerosols as op-posed to single-component TiO2 aerosols used by Gustafs-son et al. (2006) as well as by differences in particle size dis-tribution. Gustafsson et al. (2006) reported a larger aerosol
J. E. Dyson et al.: HONO production from illuminated aerosols 5765
size distribution with a bimodal trend with mode diametersof ∼ 80 and ∼ 350 nm for single-component TiO2 aerosols,whereas Dupart et al. (2014) reported a smaller unimodalaerosol size distribution for ATD aerosols with a mode di-ameter of∼ 110 nm. In this work we also see a larger aerosolsize distribution, with a lower mode diameter of ∼ 180 nmsimilar to Dupart et al. (2014) but for pure TiO2 aerosols(aerosol size distribution shown in Fig. 2). Similar to the re-sults of Dupart et al. (2014) we observe a trend inversion in[HONO] vs. RH at higher RH, between 25 %–30 %. An in-crease in HONO as a function of RH has also been observedon TiO2-containing surfaces (Langridge et al., 2009; Gan-dolfo et al., 2015; Gandolfo et al., 2017) with a similar profilefor the observed RH dependence of HONO being observedby Gandolfo et al. (2015) from photocatalytic paint surfaceswith a maximum in HONO mixing ratio found at 30 % RH.In comparison, a study focusing on the products of the up-take of NO2 on TiO2 surfaces showed a maximum in thegas-phase HONO yield at 5 % RH, with the yield of HONOplateauing off with further increase in humidity (Bedjanianand El Zein, 2012).
3.2 Dependence of reactive uptake coefficient on initialNO2 mixing ratio
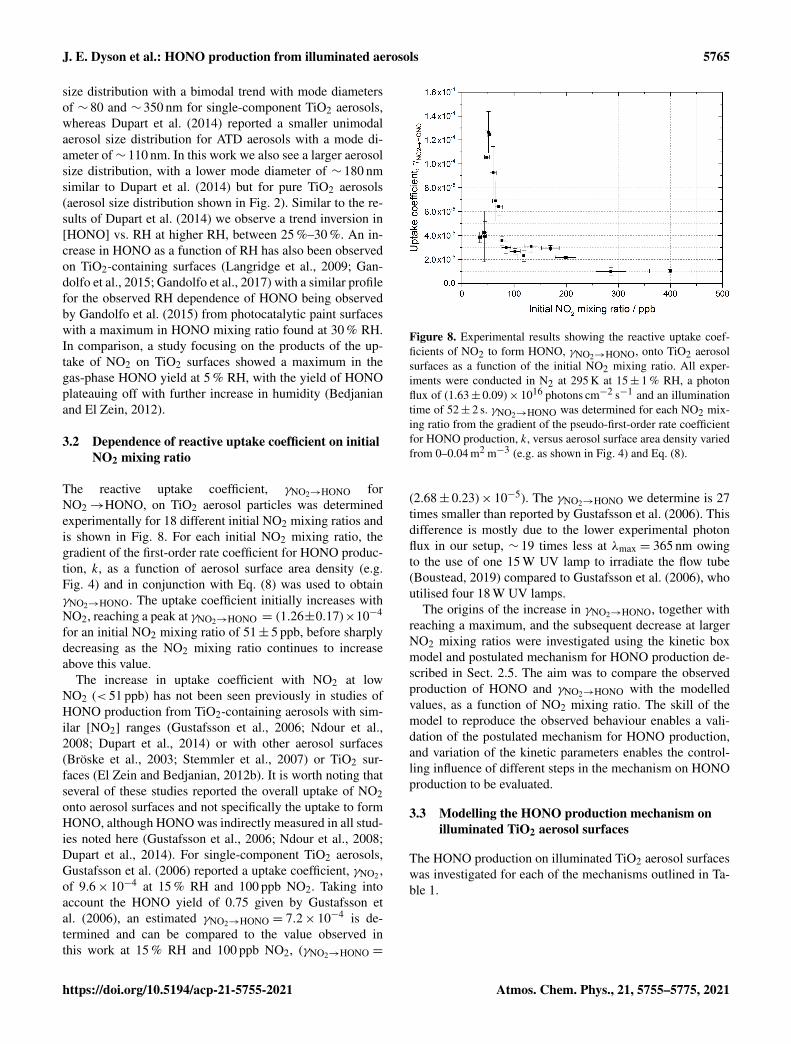
The reactive uptake coefficient, γNO2→HONO forNO2→HONO, on TiO2 aerosol particles was determinedexperimentally for 18 different initial NO2 mixing ratios andis shown in Fig. 8. For each initial NO2 mixing ratio, thegradient of the first-order rate coefficient for HONO produc-tion, k, as a function of aerosol surface area density (e.g.Fig. 4) and in conjunction with Eq. (8) was used to obtainγNO2→HONO. The uptake coefficient initially increases withNO2, reaching a peak at γNO2→HONO = (1.26±0.17)×10−4
for an initial NO2 mixing ratio of 51± 5 ppb, before sharplydecreasing as the NO2 mixing ratio continues to increaseabove this value.
The increase in uptake coefficient with NO2 at lowNO2 (< 51 ppb) has not been seen previously in studies ofHONO production from TiO2-containing aerosols with sim-ilar [NO2] ranges (Gustafsson et al., 2006; Ndour et al.,2008; Dupart et al., 2014) or with other aerosol surfaces(Bröske et al., 2003; Stemmler et al., 2007) or TiO2 sur-faces (El Zein and Bedjanian, 2012b). It is worth noting thatseveral of these studies reported the overall uptake of NO2onto aerosol surfaces and not specifically the uptake to formHONO, although HONO was indirectly measured in all stud-ies noted here (Gustafsson et al., 2006; Ndour et al., 2008;Dupart et al., 2014). For single-component TiO2 aerosols,Gustafsson et al. (2006) reported a uptake coefficient, γNO2 ,of 9.6× 10⁻⁴ at 15 % RH and 100 ppb NO2. Taking intoaccount the HONO yield of 0.75 given by Gustafsson etal. (2006), an estimated γNO2→HONO = 7.2× 10⁻⁴ is de-termined and can be compared to the value observed inthis work at 15 % RH and 100 ppb NO2, (γNO2→HONO =
Figure 8. Experimental results showing the reactive uptake coef-ficients of NO2 to form HONO, γNO2→HONO, onto TiO2 aerosolsurfaces as a function of the initial NO2 mixing ratio. All exper-iments were conducted in N2 at 295 K at 15± 1 % RH, a photonflux of (1.63± 0.09)× 1016 photons cm−2 s−1 and an illuminationtime of 52± 2 s. γNO2→HONO was determined for each NO2 mix-ing ratio from the gradient of the pseudo-first-order rate coefficientfor HONO production, k, versus aerosol surface area density variedfrom 0–0.04 m2 m−3 (e.g. as shown in Fig. 4) and Eq. (8).
(2.68± 0.23)× 10−5). The γNO2→HONO we determine is 27times smaller than reported by Gustafsson et al. (2006). Thisdifference is mostly due to the lower experimental photonflux in our setup, ∼ 19 times less at λmax = 365 nm owingto the use of one 15 W UV lamp to irradiate the flow tube(Boustead, 2019) compared to Gustafsson et al. (2006), whoutilised four 18 W UV lamps.
The origins of the increase in γNO2→HONO, together withreaching a maximum, and the subsequent decrease at largerNO2 mixing ratios were investigated using the kinetic boxmodel and postulated mechanism for HONO production de-scribed in Sect. 2.5. The aim was to compare the observedproduction of HONO and γNO2→HONO with the modelledvalues, as a function of NO2 mixing ratio. The skill of themodel to reproduce the observed behaviour enables a vali-dation of the postulated mechanism for HONO production,and variation of the kinetic parameters enables the control-ling influence of different steps in the mechanism on HONOproduction to be evaluated.
3.3 Modelling the HONO production mechanism onilluminated TiO2 aerosol surfaces
The HONO production on illuminated TiO2 aerosol surfaceswas investigated for each of the mechanisms outlined in Ta-ble 1.
5766 J. E. Dyson et al.: HONO production from illuminated aerosols
3.3.1 Model 1
Model 1 (see Table 1 and Fig. 5), which contains the sim-plest mechanism, was designed to reproduce the decreas-ing value of the NO2 uptake coefficient to form HONO,γNO2→HONO, with increasing NO2 and also the plateauingat higher NO2 mixing ratios caused by NO2 reaching a max-imum surface coverage, as seen by Stemmler et al. (2007).A decrease in the uptake coefficient of NO2, γNO2 , onto dustaerosol surfaces was also seen in studies where the forma-tion of HONO from NO2 uptake was not directly studied(Ndour et al., 2008; Dupart et al., 2014). The mechanism forModel 1 which is given in Table 1 describes the adsorptionof one NO2 molecule to a surface site which then undergoesthe reaction which forms HONO, followed by desorption ofHONO to the gas phase, Reactions (R9)–(R11). Any repre-sentation of the specific chemical processes which convertNO2 to HONO on the surface following the initial photo-production of electron–hole pairs in the TiO2 structure (Re-action R2) was not included here as the primary focus was toproduce the relationship between γNO2→HONO and the NO2mixing ratio. Gustafsson et al. (2006) reported that the mea-sured rate of photo-induced HONO production is 75 % thatof the rate of NO2 removal, whereas the dark disproportiona-tion reaction (Reaction R28) would predict a 50 % yield, andhence that the HONO observed in their studies is not simplya photo-enhancement of
2NO2(ads)+H2O(ads)→ HONO(g)+HNO3(ads). (R28)
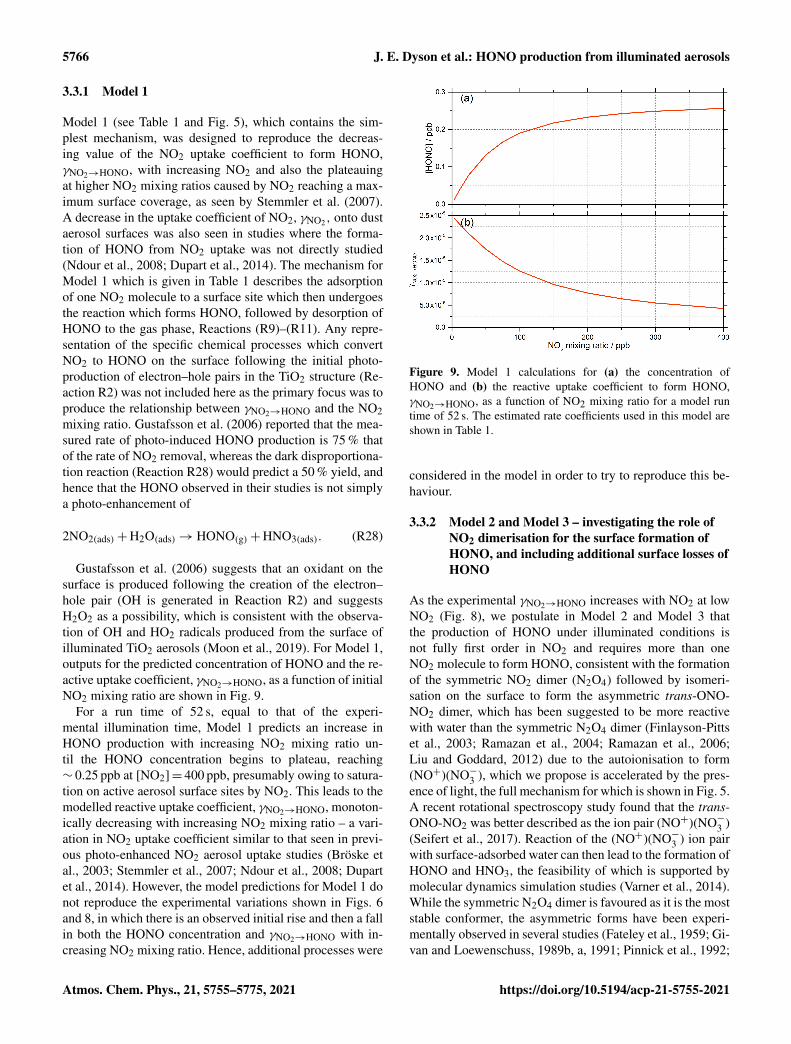
Gustafsson et al. (2006) suggests that an oxidant on thesurface is produced following the creation of the electron–hole pair (OH is generated in Reaction R2) and suggestsH2O2 as a possibility, which is consistent with the observa-tion of OH and HO2 radicals produced from the surface ofilluminated TiO2 aerosols (Moon et al., 2019). For Model 1,outputs for the predicted concentration of HONO and the re-active uptake coefficient, γNO2→HONO, as a function of initialNO2 mixing ratio are shown in Fig. 9.
For a run time of 52 s, equal to that of the experi-mental illumination time, Model 1 predicts an increase inHONO production with increasing NO2 mixing ratio un-til the HONO concentration begins to plateau, reaching∼ 0.25 ppb at [NO2]= 400 ppb, presumably owing to satura-tion on active aerosol surface sites by NO2. This leads to themodelled reactive uptake coefficient, γNO2→HONO, monoton-ically decreasing with increasing NO2 mixing ratio – a vari-ation in NO2 uptake coefficient similar to that seen in previ-ous photo-enhanced NO2 aerosol uptake studies (Bröske etal., 2003; Stemmler et al., 2007; Ndour et al., 2008; Dupartet al., 2014). However, the model predictions for Model 1 donot reproduce the experimental variations shown in Figs. 6and 8, in which there is an observed initial rise and then a fallin both the HONO concentration and γNO2→HONO with in-creasing NO2 mixing ratio. Hence, additional processes were
Figure 9. Model 1 calculations for (a) the concentration ofHONO and (b) the reactive uptake coefficient to form HONO,γNO2→HONO, as a function of NO2 mixing ratio for a model runtime of 52 s. The estimated rate coefficients used in this model areshown in Table 1.
considered in the model in order to try to reproduce this be-haviour.
3.3.2 Model 2 and Model 3 – investigating the role ofNO2 dimerisation for the surface formation ofHONO, and including additional surface losses ofHONO
As the experimental γNO2→HONO increases with NO2 at lowNO2 (Fig. 8), we postulate in Model 2 and Model 3 thatthe production of HONO under illuminated conditions isnot fully first order in NO2 and requires more than oneNO2 molecule to form HONO, consistent with the formationof the symmetric NO2 dimer (N2O4) followed by isomeri-sation on the surface to form the asymmetric trans-ONO-NO2 dimer, which has been suggested to be more reactivewith water than the symmetric N2O4 dimer (Finlayson-Pittset al., 2003; Ramazan et al., 2004; Ramazan et al., 2006;Liu and Goddard, 2012) due to the autoionisation to form(NO+)(NO−3 ), which we propose is accelerated by the pres-ence of light, the full mechanism for which is shown in Fig. 5.A recent rotational spectroscopy study found that the trans-ONO-NO2 was better described as the ion pair (NO+)(NO−3 )(Seifert et al., 2017). Reaction of the (NO+)(NO−3 ) ion pairwith surface-adsorbed water can then lead to the formation ofHONO and HNO3, the feasibility of which is supported bymolecular dynamics simulation studies (Varner et al., 2014).While the symmetric N2O4 dimer is favoured as it is the moststable conformer, the asymmetric forms have been experi-mentally observed in several studies (Fateley et al., 1959; Gi-van and Loewenschuss, 1989b, a, 1991; Pinnick et al., 1992;
J. E. Dyson et al.: HONO production from illuminated aerosols 5767
Forney et al., 1993; Wang and Koel, 1998, 1999; Beckers etal., 2010). A more recent ab initio study of NO2 adsorptionat the air–water interface suggested an orientational prefer-ence of NO2 on the surface, with both oxygen atoms facingaway from the interface, which may imply that the asym-metric dimer ONO-NO2 can form directly, meaning the highbarrier between the symmetric and asymmetric forms doesnot need to be overcome (Murdachaew et al., 2013).
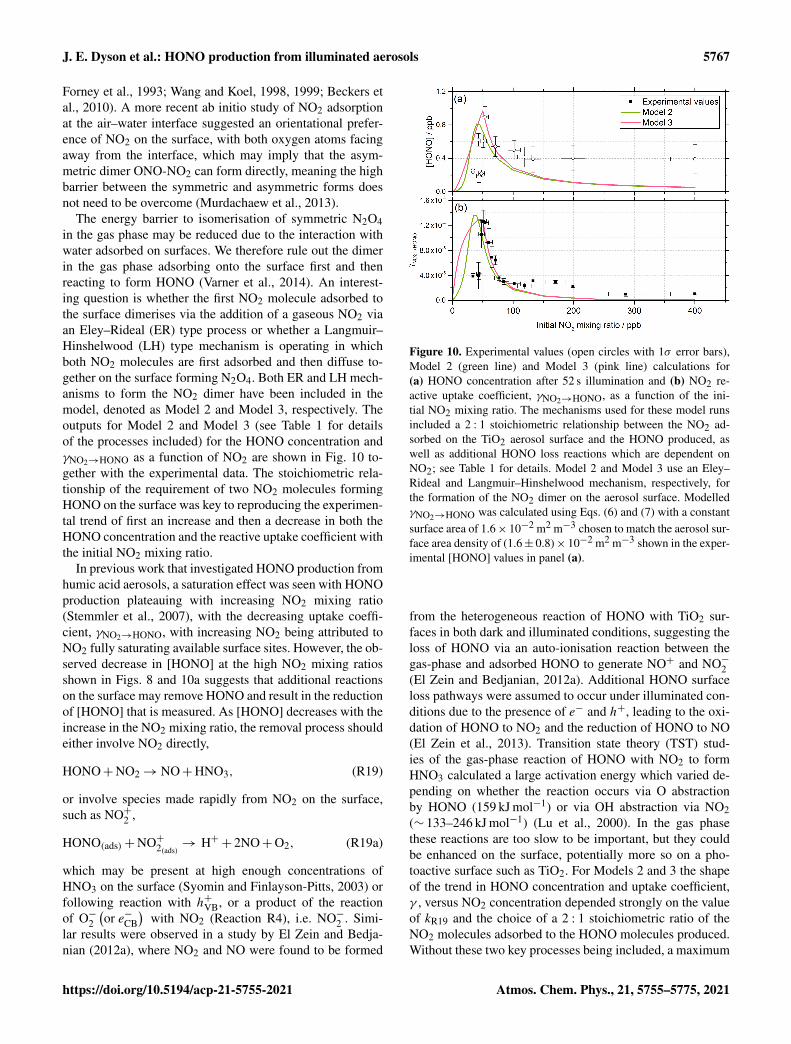
The energy barrier to isomerisation of symmetric N2O4in the gas phase may be reduced due to the interaction withwater adsorbed on surfaces. We therefore rule out the dimerin the gas phase adsorbing onto the surface first and thenreacting to form HONO (Varner et al., 2014). An interest-ing question is whether the first NO2 molecule adsorbed tothe surface dimerises via the addition of a gaseous NO2 viaan Eley–Rideal (ER) type process or whether a Langmuir–Hinshelwood (LH) type mechanism is operating in whichboth NO2 molecules are first adsorbed and then diffuse to-gether on the surface forming N2O4. Both ER and LH mech-anisms to form the NO2 dimer have been included in themodel, denoted as Model 2 and Model 3, respectively. Theoutputs for Model 2 and Model 3 (see Table 1 for detailsof the processes included) for the HONO concentration andγNO2→HONO as a function of NO2 are shown in Fig. 10 to-gether with the experimental data. The stoichiometric rela-tionship of the requirement of two NO2 molecules formingHONO on the surface was key to reproducing the experimen-tal trend of first an increase and then a decrease in both theHONO concentration and the reactive uptake coefficient withthe initial NO2 mixing ratio.
In previous work that investigated HONO production fromhumic acid aerosols, a saturation effect was seen with HONOproduction plateauing with increasing NO2 mixing ratio(Stemmler et al., 2007), with the decreasing uptake coeffi-cient, γNO2→HONO, with increasing NO2 being attributed toNO2 fully saturating available surface sites. However, the ob-served decrease in [HONO] at the high NO2 mixing ratiosshown in Figs. 8 and 10a suggests that additional reactionson the surface may remove HONO and result in the reductionof [HONO] that is measured. As [HONO] decreases with theincrease in the NO2 mixing ratio, the removal process shouldeither involve NO2 directly,
HONO+NO2→ NO+HNO3, (R19)
or involve species made rapidly from NO2 on the surface,such as NO+2 ,
HONO(ads)+NO+2(ads)→ H++ 2NO+O2, (R19a)
which may be present at high enough concentrations ofHNO3 on the surface (Syomin and Finlayson-Pitts, 2003) orfollowing reaction with h+VB, or a product of the reactionof O−2
(or e−CB
)with NO2 (Reaction R4), i.e. NO−2 . Simi-
lar results were observed in a study by El Zein and Bedja-nian (2012a), where NO2 and NO were found to be formed
Figure 10. Experimental values (open circles with 1σ error bars),Model 2 (green line) and Model 3 (pink line) calculations for(a) HONO concentration after 52 s illumination and (b) NO2 re-active uptake coefficient, γNO2→HONO, as a function of the ini-tial NO2 mixing ratio. The mechanisms used for these model runsincluded a 2 : 1 stoichiometric relationship between the NO2 ad-sorbed on the TiO2 aerosol surface and the HONO produced, aswell as additional HONO loss reactions which are dependent onNO2; see Table 1 for details. Model 2 and Model 3 use an Eley–Rideal and Langmuir–Hinshelwood mechanism, respectively, forthe formation of the NO2 dimer on the aerosol surface. ModelledγNO2→HONO was calculated using Eqs. (6) and (7) with a constantsurface area of 1.6× 10⁻² m2 m−3 chosen to match the aerosol sur-face area density of (1.6± 0.8)× 10−2 m2 m−3 shown in the exper-imental [HONO] values in panel (a).
from the heterogeneous reaction of HONO with TiO2 sur-faces in both dark and illuminated conditions, suggesting theloss of HONO via an auto-ionisation reaction between thegas-phase and adsorbed HONO to generate NO+ and NO−2(El Zein and Bedjanian, 2012a). Additional HONO surfaceloss pathways were assumed to occur under illuminated con-ditions due to the presence of e− and h+, leading to the oxi-dation of HONO to NO2 and the reduction of HONO to NO(El Zein et al., 2013). Transition state theory (TST) stud-ies of the gas-phase reaction of HONO with NO2 to formHNO3 calculated a large activation energy which varied de-pending on whether the reaction occurs via O abstractionby HONO (159 kJ mol−1) or via OH abstraction via NO2(∼ 133–246 kJ mol−1) (Lu et al., 2000). In the gas phasethese reactions are too slow to be important, but they couldbe enhanced on the surface, potentially more so on a pho-toactive surface such as TiO2. For Models 2 and 3 the shapeof the trend in HONO concentration and uptake coefficient,γ , versus NO2 concentration depended strongly on the valueof kR19 and the choice of a 2 : 1 stoichiometric ratio of theNO2 molecules adsorbed to the HONO molecules produced.Without these two key processes being included, a maximum
5768 J. E. Dyson et al.: HONO production from illuminated aerosols
in either the HONO concentration or γ as the NO2 concen-tration is increased could not be obtained in the model. Athird key condition was the requirement that the desorptionrate coefficient, kR16, be larger than the rate coefficient forthe loss of HONO, kR17 and kR18 = 1×10⁻³ s−1, but slowerthan the adsorption rate coefficient, kR9. Changing the val-ues of all other kinetic parameters in the model had an ef-fect on the absolute concentration of HONO but cruciallynot on the shape of the trends in HONO or the uptake co-efficient versus NO2 concentration. Changing the values ofthe rate coefficients for the gas-phase loss Reactions (R23)–(R27) only had a very small impact on the HONO concen-tration. The addition of an NO2-dependent loss reaction toboth Model 2 and Model 3 had the most significant effecton the trend in modelled HONO concentration. Though it isalso possible that a secondary product could remain adsorbedand therefore block active sites on the TiO2 surface, effec-tively poisoning the photocatalyst, NO2-independent loss re-actions in the model, kR17 and kR18, had little effect on thetrend in [HONO] vs. NO2, only having an effect on the over-all [HONO]. HNO3 has however been shown to remain ad-sorbed to surfaces once formed (Sakamaki et al., 1983; Pittset al., 1984; Finlayson-Pitts et al., 2003; Ramazan et al.,2004) and may also react with adsorbed HONO, further re-ducing the product yield (Finlayson-Pitts et al., 2003): theseNO2-independent loss reactions may therefore become moreimportant at higher NO2 concentrations and hence surfaceconcentrations of HONO and HNO3:
HONO(ads)+HNO3(ads)→ 2NO(g)+H2O(ads)+O2(g).
(R17)
The photolysis of particulate nitrate was not considered inModel 2 or Model 3, due to the lack of particulate nitrate inthe system at t = 0. The gas-to-particle conversion of anyHNO3 formed was not considered to be important due tothe assumption that most HNO3 formed would remain ad-sorbed to the aerosol surface (Sakamaki et al., 1983; Pitts etal., 1984; Finlayson-Pitts et al., 2003; Ramazan et al., 2004).
For Model 2, which includes the production of HONOvia the Eley–Rideal mechanism, in order to reproduce theexperimentally observed sharp increase followed by a de-crease in both [HONO] and γNO2→HONO as a function of in-creasing NO2 mixing ratio, the modelled rate coefficient forthe adsorption of a gas-phase NO2 molecule to another, thesurface-adsorbed NO2 to initially form the symmetric N2O4dimer, kR12, had to be larger than for the isomerisation step toform HONO and HNO3 via trans-ONO-NO2, kR13. Interest-ingly, for HONO production via the Langmuir–Hinshelwoodmechanism, Model 3, the modelled rate coefficient for thediffusion of one NO2 molecule across the surface to form thedimer with another NO2 molecule, kR14, had to be smallerthan for the isomerisation step, kR15, to more closely repre-sent the experimental results for the uptake coefficient. Ad-ditionally, in order to reproduce the experimental trend in
HONO formation as a function of NO2 mixing ratio, the ratecoefficient for the NO2-dependent loss reaction, kR19, had tobe larger than the NO2-independent reactions, kR17 and kR18,leading to kR19 = 5× 10⁻³ s−1. The modelled HONO con-centration is also sensitive to the active site surface concen-tration: Model 3 required an active site surface concentration2.5 times that of Model 2 to reproduce the peak in [HONO]at ∼ 51 ppb NO2 observed in the experimental results. Thereason for this is due to the difference in active site occupa-tion in the two models: one active site is being occupied bytwo NO2 molecules per HONO formed in Model 2 as op-posed to Model 3, where two active sites are occupied perHONO formed. Regardless of the choice of an Eley–Ridealor Langmuir–Hinshelwood mechanism, both models repro-duce the general shape of [HONO] and γNO2→HONO withNO2, providing evidence that two NO2 molecules are re-quired to form HONO.
3.4 HONO production from illumination of a mixedNH4NO3 / TiO2 aerosol in the absence of NO2
The photolysis of particulate nitrate has been postulated as asource of HONO under ambient sunlit conditions during sev-eral field campaigns, from both aircraft- and ground-basedmeasurements (Reed et al., 2017; Ye et al., 2017a, b). Here,experiments were carried out to investigate the formation ofHONO from particulate nitrate photolysis, with and withoutthe addition of a photocatalyst. This is of significant inter-est for marine environments downwind of arid desert regionsdue to the availability of TiO2 or other photocatalytic mate-rials within aerosols in dust plumes that are transported fromthese regions (Hanisch and Crowley, 2003).
Using the aerosol flow tube setup described in Sect. 2.1–2.4, an aqueous solution of ammonium nitrate (5 g NH4NO3in 500 mL Milli-Q water) was used to generate nitrateaerosols. At the RH used in this experiment, ∼ 50 %, theaerosols were still deliquesced. For these experimentsthe residence time of the aerosols in the illuminated re-gion of the flow tube was 30 s (flow rate ∼ 6 L min−1),with the production of HONO following illuminationmeasured as a function of aerosol surface area density.The number of lamps was increased from one to four,increasing the photon flux from (1.63± 0.09)× 1016 to(8.21± 2.39)× 1016 photons cm−2 s−1 and j (NO2) from(6.43± 0.30)× 10−3 to (3.23± 0.92)× 10−2 s−1. Thej (NO2), j (HONO) and flux values for four lamps weremore than 4 times that of one lamp only due to the lampcasings being mirrored, and so with four lamps, with twolamps on either side of the flow tube, the casings reflectedthe light back into the flow tube, increasing the effectivelight intensity. For these experiments, no gaseous NO2 wasadded to the gas entering the flow tube. As shown in Fig. 11,for the illumination of pure nitrate aerosols, although a smallamount of HONO was observed at higher aerosol loadings,no statistically significant production of HONO was seen.
J. E. Dyson et al.: HONO production from illuminated aerosols 5769
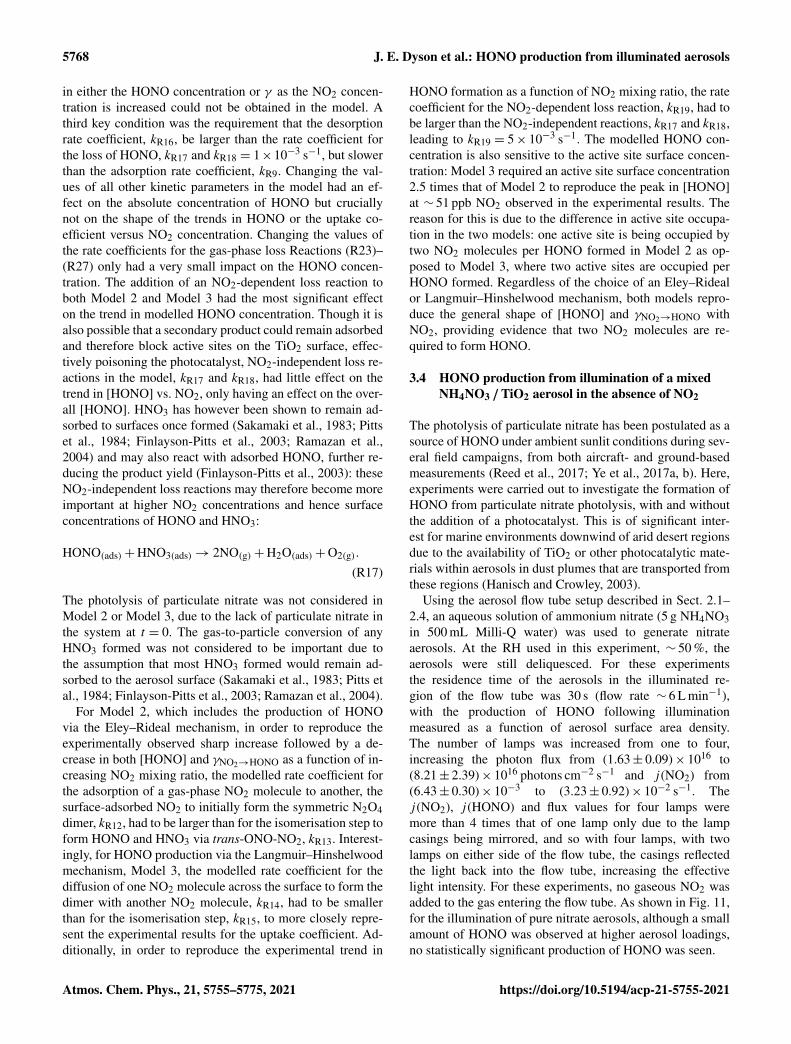
Figure 11. Dependence of the HONO concentration generatedas a function of aerosol surface area density for pure NH4NO3aerosol (black open squares, error bars represent 1σ ) and 1 : 1TiO2 /NH4NO3 mixed aerosol (red open circles, error bars rep-resent 1σ ). Both experiments were performed in N2 at 295 K,an illuminated residence time of 30 s and a lamp photon flux of(8.29± 2.39)× 1016 photons cm−2 s−1. The NH4NO3-only exper-iment was performed at∼ 50± 5 % RH, while the TiO2 /NH4NO3mix experiment was performed at 20± 2 % RH. For all points, thebackground HONO observed without illumination has been sub-tracted. At zero aerosol surface area density there is no HONO gen-erated from the walls of the flow tube.
A second set of experiments were performed with an aque-ous solution of titanium dioxide and ammonium nitrate com-bined in a 1 : 1 mass ratio to give a TiO2 /NH4NO3 aerosolmixture (5 g NH4NO3 and 5 g TiO2 in 500 mL Milli-Q wa-ter) to investigate if the photocatalytic properties of TiO2 fa-cilitate the production of HONO in the presence of nitrate.The RH was decreased to ensure the maximum TiO2 photo-catalytic activity (Jeong et al., 2013). A recent study usingRaman micro-spectroscopy to observe phase changes in saltparticles reported an efflorescence point of pure ammoniumnitrate to be between 13.7 %–23.9 % RH (Wu et al., 2019). Itis possible therefore that at the RH used in this experiment,∼ 20 %, the aerosols were still deliquesced. As shown inFig. 11, the presence of TiO2 in the aerosol mixture showeda significant production of HONO without the presence ofNO2, a potentially significant result for the production ofHONO in low-NOxenvironments in the presence of mixeddust/nitrate aerosols, for example in oceanic regions off thecoast of West Africa or in continental regions impacted byoutflow from the Gobi desert. Using the Aerosol InorganicModel (AIM) (Clegg et al., 1998; Wexler and Clegg, 2002),the nitrate content of the aerosol at both 20 % and 50 % RHwas calculated, in accordance with the experimental RH con-ditions. From this and the aerosol volume distribution givenby the SMPS, the [NO−3 ] within the aerosols could be calcu-lated. The formation of HONO by photolysis of particulate
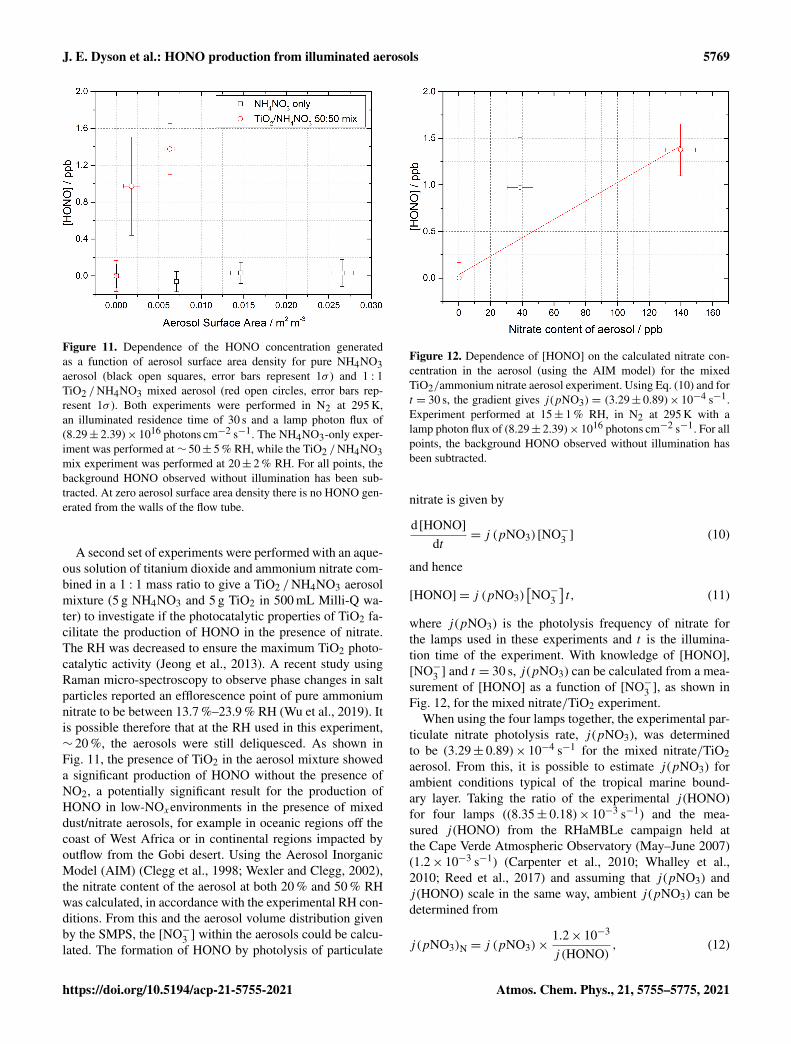
Figure 12. Dependence of [HONO] on the calculated nitrate con-centration in the aerosol (using the AIM model) for the mixedTiO2/ammonium nitrate aerosol experiment. Using Eq. (10) and fort = 30 s, the gradient gives j (pNO3)= (3.29± 0.89)× 10−4 s−1.Experiment performed at 15± 1 % RH, in N2 at 295 K with alamp photon flux of (8.29± 2.39)× 1016 photons cm−2 s−1. For allpoints, the background HONO observed without illumination hasbeen subtracted.
nitrate is given by
d[HONO]dt
= j (pNO3) [NO−3 ] (10)
and hence
[HONO]= j (pNO3)[NO−3
]t, (11)
where j (pNO3) is the photolysis frequency of nitrate forthe lamps used in these experiments and t is the illumina-tion time of the experiment. With knowledge of [HONO],[NO−3 ] and t = 30 s, j (pNO3) can be calculated from a mea-surement of [HONO] as a function of [NO−3 ], as shown inFig. 12, for the mixed nitrate/TiO2 experiment.
When using the four lamps together, the experimental par-ticulate nitrate photolysis rate, j (pNO3), was determinedto be (3.29± 0.89)× 10−4 s−1 for the mixed nitrate/TiO2aerosol. From this, it is possible to estimate j (pNO3) forambient conditions typical of the tropical marine bound-ary layer. Taking the ratio of the experimental j (HONO)for four lamps ((8.35± 0.18)× 10−3 s−1) and the mea-sured j (HONO) from the RHaMBLe campaign held atthe Cape Verde Atmospheric Observatory (May–June 2007)(1.2× 10⁻³ s−1) (Carpenter et al., 2010; Whalley et al.,2010; Reed et al., 2017) and assuming that j (pNO3) andj (HONO) scale in the same way, ambient j (pNO3) can bedetermined from
5770 J. E. Dyson et al.: HONO production from illuminated aerosols
where j(pNO3)N is the photolysis rate coefficient of par-ticulate nitrate at Cabo Verde, j (pNO3) is the experimen-tally determined photolysis rate coefficient of particulate ni-trate to form HONO and j (HONO) is the HONO photoly-sis rate coefficient calculated from the experimentally deter-mined j (NO2).
Using j (pNO3)= (3.29± 0.89)× 10−4 s−1, the rate ofHONO production from nitrate photolysis at Cabo Verde wascalculated to be j(pNO3)N = (4.73±1.01)×10−5 s−1 fromthe mixed nitrate/TiO2 aerosol experiment. Although forpure nitrate aerosol in the absence of TiO2 the data were scat-tered and the HONO production was small (Fig. 11), an up-per limit estimate of j(pNO3)N =(1.06± 1.15)× 10−6 s−1
under conditions at Cabo Verde could be made usingEq. (11), as done for rate of HONO production from mixednitrate/TiO2 aerosols. The atmospheric implications of thiswill be considered below.
4 Implications of HONO production from TiO2 fortropospheric chemistry
4.1 Production of HONO from sunlit aerosolscontaining TiO2 in the presence of NO2
For the reactive uptake of NO2 onto illuminated TiO2particles as a function of the initial NO2 mixingratio, as shown in Fig. 8, a maximum value ofγNO2→HONO = (1.26± 0.17)× 10−4 was determined at51± 5 ppb NO2 for a photon flux from the lamp of(1.63± 0.09)× 1016 photons cm−2 s−1. These experimentswere for single-component TiO2 particles, and so for dustaerosols a value of γNO2→HONO = (1.26± 0.17)× 10−5 isappropriate, assuming a 10 % fraction of TiO2 and/or otherphotoactive materials (which behave similarly for HONOproduction) in mineral dust (Hanisch and Crowley, 2003).Dust aerosols are transported from the Gobi desert to urbanareas of China where high NOx and nitrate aerosol concen-trations have been observed, and in these areas HONO pro-duction facilitated by photocatalysts may be important (Sal-iba et al., 2014).
Using an average daytime maximum for [NO2], j (NO2)and aerosol surface area measurements for a non-hazeperiod in May–June in 2018 in Beijing, of 50 ppb,1× 10−2 s−1 and 2.5× 10⁻³ m2 m−3 (of which a max-imum of 0.3 % was assumed to be TiO2, though thiscould be higher in dust impacted events, Schleicher etal., 2010) respectively, a production rate of HONO of1.70× 105 molec. cm−3 s−1 (∼ 24.8 ppt h−1) has been esti-mated using the maximum reactive uptake coefficient mea-sured in this work, γNO2→HONO = (1.26± 0.17)× 10−4. Theaverage RH in Beijing during summertime is significantlyhigher than the range of RH used in the TiO2 aerosol ex-periments. In previous work (Gustafsson et al., 2006), theNO2 reactive uptake coefficient decreased for relative hu-
midities above those studied here, and hence the HONOproduction calculated under the conditions in Beijing mayrepresent an upper limit. The lamp used to illuminate theTiO2 aerosols in these experiments gives rise to j (NO2)=
(6.43± 0.3)× 10−3 s−1, and so γNO2→HONO has been scaledby a factor of 1.55 to match the noon j (NO2) measuredin May–June 2018 in Beijing (10−2 s−1), to take into ac-count the relatively small difference in experimental and at-mospheric photon flux for Beijing. The HONO productionrate estimated here for noontime summer (May–June 2018)in Beijing (∼ 25 ppt h−1) is similar to the value for the maxi-mum production of HONO from urban humic acid aerosolsurfaces in Europe, 17 ppt h−1 at 20 ppb NO2 reported byStemmler et al. (2007). For comparison, the net gaseous pro-duction rate of HONO at noon in May–June (2018) Beijingwas determined from the measured rate of gas-phase produc-tion and losses:
for an average maximum noontime OH concentration of8× 106 molec. cm−3 (Whalley et al., 2021), NO concen-tration of 1.45 ppb (Whalley et al., 2021) and HONOconcentration of 0.8 ppb (Whalley et al., 2021).
The net gas-phase production of HONO from Eq. (13) wascalculated to be −3.8 ppb h−1 (a net loss) as expected dueto HONO loss by photolysis peaking at solar noon, suggest-ing the production of HONO heterogeneously from TiO2 andNO2 (∼ 25 ppt h−1) would have little effect on the overallHONO budget for Beijing summertime at noon.
4.2 Production of HONO from photolysis of mixeddust/nitrate aerosols
Particulate nitrate photolysis could be an important sourceof HONO in oceanic environments, for example the AtlanticOcean, where both dust aerosols from the Sahara and highconcentrations of mixed nitrate aerosols from sea spray arepresent, despite low NO2 concentrations (Hanisch and Crow-ley, 2003; Ye et al., 2017b). From the particulate nitrate pho-tolysis experiments in the absence of NO2 conducted here,a j(pNO3)N = (4.73± 1.01)× 10−5 s−1 was determined inthe presence of the TiO2 photocatalysts (Sect. 3.4). Usingthe experimental j (pNO3), scaled to typical ambient lightlevels, and a mean noon concentration of nitrate aerosols of400 ppt measured at Cabo Verde (Reed et al., 2017), taken asan example marine boundary layer environment with a highconcentration of mineral dust aerosols, a rate of HONO pro-duction from particulate nitrate at Cabo Verde was calculatedas 4.65× 10⁵ molec. cm−3 s−1 (68 ppt h−1). We note that thisvalue would be ∼ 50 times smaller for pure nitrate aerosols.The missing rate of HONO production, i.e. not taken into ac-
J. E. Dyson et al.: HONO production from illuminated aerosols 5771
count by the gas-phase production and loss, Pother, from theCabo Verde RHaMBLe campaign, can be calculated usingthe observed HONO concentration, [HONO], and the knowngas-phase routes for HONO production and loss:
for average maximum measured concentrations of1× 107 molec. cm−3 for OH (Whalley et al., 2010),5.41× 107 molec. cm−3 for NO (Whalley et al., 2010) and1.23× 108 molec. cm−3 for HONO (Whalley et al., 2010).
Using Eq. (14) this missing HONO production rate forCabo Verde was 34.6 ppt h−1, which is within a factor of 2of the rate of HONO production (68 ppt h−1) calculated fromnitrate photolysis using our experimental HONO productiondata for mixed nitrate/TiO2 aerosols. These results providefurther evidence that particulate nitrate photolysis in the pres-ence of photocatalytic compounds such as TiO2 found in dustcould be significant in closing the HONO budget for this en-vironment (Whalley et al., 2010; Reed et al., 2017; Ye et al.,2017a).
5 Conclusions
The experimental production of HONO from both illumi-nated TiO2 aerosols in the presence of NO2 and frommixed nitrate/TiO2 aerosols in the absence of NO2 wasobserved, with the HONO concentrations measured us-ing photo-fragmentation laser-induced fluorescence spec-troscopy. Using experimental data, the reactive uptake ofNO2 onto the TiO2 aerosol surface to produce HONO,γNO2→HONO, was determined for NO2 mixing ratios rang-ing from 34 to 400 ppb, with a maximum γNO2→HONO valueof (1.26± 0.17)× 10−4 for single-component TiO2 aerosolsobserved at 51 ppb NO2 and for a lamp photon flux of(1.63± 0.09)× 1016 photons cm−2 s−1 (integrated between290 and 400 nm). The measured reactive uptake coefficient,γNO2→HONO, showed an increase and then a subsequentdecrease as a function of NO2 mixing ratio, peaking at51± 5 ppb. Box modelling studies supported a mechanisminvolving two NO2 molecules on the aerosol surface perHONO molecule generated, providing evidence for the for-mation of a surface-bound NO2 dimer intermediate. The ex-act mechanism for HONO formation, for example the step(s)which is accelerated in the presence of light, remains unclear,although previous studies would suggest the process occursvia the isomerisation of the symmetric N2O4 dimer to givetrans-ONO-NO2, either via cis-ONO-NO2 or directly, sug-gested to be more reactive with water than the symmetricdimer (Finlayson-Pitts et al., 2003; Ramazan et al., 2004; Ra-mazan et al., 2006; de Jesus Madeiros and Pimentel, 2011;
Liu and Goddard, 2012; Murdachaew et al., 2013; Varneret al., 2014). Investigations into the RH dependence of theHONO production mechanism on TiO2 aerosols showed apeak in production between ∼ 25 %–30 % RH, with lowerHONO production at higher NO2 mixing ratios observed forall RHs tested. The increase in HONO production with in-creasing RH can be attributed to a higher concentration ofH2O on the surface increasing its availability for the hydrol-ysis reaction to give HONO, whereas a decrease in HONOproduction after RH ∼ 30 % could be due to the increasedwater surface concentration inhibiting the adsorption of NO2.Using the laboratory reactive uptake coefficient for HONOproduction, γNO2→HONO, the rate of production of HONOfrom illuminated aerosols in Beijing in summer for typicalNO2 mixing ratios and aerosol surface areas was found tobe similar to that estimated previously for the production ofHONO from urban humic acid aerosol surfaces in Europe.
In the absence of NO2, significant HONO production from50 : 50 mixed nitrate/TiO2 aerosols was measured. Usingthe experimental HONO concentrations observed, a rate ofHONO production from nitrate photolysis was calculated,which was then scaled to the ambient conditions encoun-tered at the Cape Verde Atmospheric Observatory in thetropical marine boundary layer. A HONO production rateof 68 ppt h−1 for the mixed nitrate/TiO2 aerosol was foundfor CVAO conditions, similar in magnitude to the missingHONO production rate that had been calculated previously inorder to bring modelled HONO concentrations into line withfield-measured values at CVAO. These results provide fur-ther evidence that aerosol particulate nitrate photolysis maybe significant as a source of HONO, and hence NOx , in theremote marine boundary layer, where mixed aerosols con-taining nitrate and a photocatalytic species such as TiO2, asfound in dust, are present.
However, the production of HONO from pure, deliquescedammonium nitrate aerosols alone could not be definitivelyconfirmed over the range of conditions used in our experi-ments, suggesting that another component within the aerosolis necessary for HONO production. Future work should bedirected towards studying pure nitrate aerosols over a widerrange of conditions, for example varying the aerosol pH, andalso adding other chemical species into the aerosol whichmay promote HONO production.
Data availability. Data presented in this study can be obtainedfrom the authors upon request ([email protected])
Author contributions. JED and GAB carried out the measurementswith assistance from LTF, MB and LKW. JED and LKW devel-oped the model, and JED carried out the calculations. JED, LKWand DEH prepared the manuscript, with contributions from all co-authors.
5772 J. E. Dyson et al.: HONO production from illuminated aerosols
Competing interests. The authors declare that they have no conflictof interest.
Acknowledgements. We are grateful to the Natural EnvironmentalResearch Council for funding a SPHERES PhD studentship (JoannaE. Dyson) and for funding the EXHALE project (grant numberNE/S006680/1).
Financial support. This research has been supported by the NaturalEnvironment Research Council (grant no. NE/S006680/1).
Review statement. This paper was edited by Markus Ammann andreviewed by two anonymous referees.
References
Alicke, B., Platt, U., and Stutz, J.: Impact of nitrous acid pho-tolysis on the total hydroxyl radical budget during the Lim-itation of Oxidant Production/Pianura Padana Produzione diOzono study in Milan, J. Geophys. Res.-Atmos., 107, 8196,https://doi.org/10.1029/2000JD000075, 2002.
Atkinson, R., Baulch, D. L., Cox, R. A., Crowley, J. N., Hamp-son, R. F., Hynes, R. G., Jenkin, M. E., Rossi, M. J., andTroe, J.: Evaluated kinetic and photochemical data for atmo-spheric chemistry: Volume I – gas phase reactions of Ox , HOx ,NOx and SOx species, Atmos. Chem. Phys., 4, 1461–1738,https://doi.org/10.5194/acp-4-1461-2004, 2004.
Beckers, H., Zeng, X., and Willner, H.: Intermediates in-volved in the oxidation of nitrogen monoxide: Photo-chemistry of the cis-N2O2· O2 complex and of sym-N2O4 in Solid Ne Matrices, Chemistry, 16, 1506–1520,https://doi.org/10.1002/chem.200902406, 2010.
Bedjanian, Y. and El Zein, A.: Interaction of NO2 with TiO2 SurfaceUnder UV Irradiation: Products Study, J. Phys. Chem. A, 116,1758–1764, https://doi.org/10.1021/jp210078b, 2012.
Boustead, G. A.: Measurement of nitrous acid production fromaerosol surfaces using Photo-Fragmentation Laser-Induced Flu-orescence, School of Chemistry, University of Leeds, 2019.
Bröske, R., Kleffmann, J., and Wiesen, P.: Heterogeneous con-version of NO2 on secondary organic aerosol surfaces: A pos-sible source of nitrous acid (HONO) in the atmosphere?, At-mos. Chem. Phys., 3, 469–474, https://doi.org/10.5194/acp-3-469-2003, 2003.
Cantrell, C., Zimmer, A., and Tyndall, G. S.: Adsorption cross sec-tions for water vapor from 183 to 193 nm, Geophys. Res. Lett.,24, 2195–2198, https://doi.org/10.1029/97GL02100, 1997.
Carpenter, L. J., Fleming, Z. L., Read, K. A., Lee, J. D., Moller,S. J., Hopkins, J. R., Purvis, R. M., Lewis, A. C., Müller, K.,Heinold, B., Herrmann, H., Fomba, K. W., van Pinxteren, D.,Müller, C., Tegen, I., Wiedensohler, A., Müller, T., Niedermeier,N., Achterberg, E. P., Patey, M. D., Kozlova, E. A., Heimann,M., Heard, D. E., Plane, J. M. C., Mahajan, A., Oetjen, H., Ing-ham, T., Stone, D., Whalley, L. K., Evans, M. J., Pilling, M. J.,Leigh, R. J., Monks, P. S., Karunaharan, A., Vaughan, S., Arnold,S. R., Tschritter, J., Pöhler, D., Frieß, U., Holla, R., Mendes, L.
M., Lopez, H., Faria, B., Manning, A. J., and Wallace, D. W.R.: Seasonal characteristics of tropical marine boundary layer airmeasured at the Cape Verde Atmospheric Observatory, J. Atmos.Chem., 67, 87–140, https://doi.org/10.1007/s10874-011-9206-1,2010.
Chen, H., Nanayakkara, C. E., and Grassian, V. H.: Titanium diox-ide photocatalysis in atmospheric chemistry, Chem. Rev., 112,5919–5948, https://doi.org/10.1021/cr3002092, 2012.
Clegg, S. L., Brimblecombe, P., and Wexler, A. S.: Thermody-namic model of the system H+- NH+4 - Na+- SO2−
4 - NO−3 -Cl−- H2O at 298.15 K, J. Phys. Chem. A, 102, 2155–2171,https://doi.org/10.1021/jp973043j, 1998.
Crilley, L. R., Kramer, L. J., Ouyang, B., Duan, J., Zhang, W., Tong,S., Ge, M., Tang, K., Qin, M., Xie, P., Shaw, M. D., Lewis, A.C., Mehra, A., Bannan, T. J., Worrall, S. D., Priestley, M., Ba-cak, A., Coe, H., Allan, J., Percival, C. J., Popoola, O. A. M.,Jones, R. L., and Bloss, W. J.: Intercomparison of nitrous acid(HONO) measurement techniques in a megacity (Beijing), At-mos. Meas. Tech., 12, 6449–6463, https://doi.org/10.5194/amt-12-6449-2019, 2019.
de Jesus Madeiros, D. and Pimentel, A. S.: New insightsin the atmospheric HONO formation: new pathwaysfor N2O4 isomerisaton and NO2 dimerisation in thepresence of water, J. Phys. Chem. A, 115, 6357–6365,https://doi.org/10.1021/jp1123585, 2011.
Dupart, Y., Fine, L., D’Anna, B., and George, C.: Heteroge-neous uptake of NO2 on Arizona Test Dust under UV-A irra-diation: an aerosol flow tube study, Aeolian Res., 15, 45–51,https://doi.org/10.1016/j.aeolia.2013.10.001, 2014.
El Zein, A. and Bedjanian, Y.: Reactive Uptake of HONO to TiO2Surface: “Dark” Reaction, J. Phys. Chem. A, 116, 3665–3672,https://doi.org/10.1021/jp300859w, 2012a.
El Zein, A. and Bedjanian, Y.: Interaction of NO2 withTiO2 surface under UV irradiation: measurements of theuptake coefficient, Atmos. Chem. Phys., 12, 1013–1020,https://doi.org/10.5194/acp-12-1013-2012, 2012b.
El Zein, A., Bedjanian, Y., and Romanias, M. N.: Kinet-ics and products of HONO interaction with TiO2 sur-face under UV irradiation, Atmos. Environ., 67, 203–210,https://doi.org/10.1016/j.atmosenv.2012.11.016, 2013.
Fateley, W. G., Bent, H. A., and Crawford Jr., B.: Infrared spectraof the frozen oxides of nitrogen, J. Chem. Phys., 31, 204–217,https://doi.org/10.1063/1.1730296, 1959.
Finlayson-Pitts, B. J., Wingen, L. M., Summer, A. L., Syomin, D.,and Ramazan, K. A.: The heterogeneous hydrolysis of NO2 inlaboratory systems in outdoor and indoor atmospheres: An in-tergrated mechanism, Phys. Chem. Phys. Chem, 5, 223–242,https://doi.org/10.1039/b208564j, 2003.
Forney, D., Thompson, W. E., and Jacox, M. E.: The vibra-tional spectra of molecular ions isolated in solid neon. XI.NO+2 , NO−2 , and NO−3 , J. Chem. Phys., 99, 7393–7403,https://doi.org/10.1063/1.465720, 1993.
Gandolfo, A., Bartolomei, V., Gomez Alvarez, E., Tlili, S.,Gligorovski, S., Kleffmann, J., and Wortham, H.: The ef-fectiveness of indoor photocatalytic paints on NOx andHONO levels, Appl. Catal. B-Environ., 166–167, 84–90,https://doi.org/10.1016/j.apcatb.2014.11.011, 2015.
Gandolfo, A., Rouyer, L., Wortham, H., and Gligorovski,S.: The influence of wall temperature on NO2 re-
J. E. Dyson et al.: HONO production from illuminated aerosols 5773
moval and HONO levels released by indoor photocat-alytic paints, Appl. Catal. B-Environ., 209, 429–436,https://doi.org/10.1016/j.apcatb.2017.03.021, 2017.
George, C., Strekowski, R. S., Kleffmann, J., Stemmler, K., andAmmann, M.: Photoenhanced uptake of gaseous NO2 on solidorganic compounds: a photochemical source of HONO?, Fara-day Discuss., 130, 195–210, https://doi.org/10.1039/b417888m,2005.
George, I. J., Matthews, P. S. J., Whalley, L. K., Brooks, B., God-dard, A., Baeza-Romero, M., and Heard, D. E.: Measurementsof uptake coefficients for heterogeneous loss of HO2 onto sub-micron inorganic salt aerosols, Phys. Chem. Chem. Phys., 15,12829–12845, https://doi.org/10.1039/c3cp51831k, 2013.
Ginoux, P., Chin, M., Tegen, I., Prospero, J. M., Holben,B., Dubovik, O., and Lin, S. J.: Sources and distri-butions of dust aerosols simulated with the GOCARTmodel, J. Geophys. Res.-Atmos., 106, 20255–20273,https://doi.org/10.1029/2000JD000053, 2001.
Givan, A. and Loewenschuss, A.: Fourier transform infrared andRaman studies on solid nitrogen dioxide: Temperature cycling ofordered, disordered, and multicomponent layers, J. Chem. Phys.,90, 6135–6142, https://doi.org/10.1063/1.456379, 1989a.
Givan, A. and Loewenschuss, A.: On the intermolecularity or in-tramolecularity of nitrosonium nitrate formation in thin films ofnitrogen dioxide: A Fourier transform infrared study, J. Chem.Phys., 91, 5126–5127, https://doi.org/10.1063/1.457609, 1989b.
Givan, A. and Loewenschuss, A.: Fourier transform in-frared study of amorphous N2O4 solid: Destabilizationwith inert impurities, J. Chem. Phys., 94, 7562–7563,https://doi.org/10.1063/1.460192, 1991.
Goodman, A. L., Bernard, E. T., and Grassian, V. H.: Spec-troscopic study of nitric acid and water adsorption on ox-ide particles: enhanced nitric acid uptake kinetics in the pres-ence of adsorbed water, J. Phys. Chem. A, 105, 6443–6457,https://doi.org/10.1021/jp0037221, 2001.
Gustafsson, R. J., Orlov, A., Griffiths, P. T., Cox, R. A., and Lam-bert, R. M.: Reduction of NO2 to nitrous acid on illuminatedtitanium dioxide aerosol surfaces: implications for photocataly-sis and atmospheric chemistry, Chem. Commun., 37, 3936–3938,https://doi.org/10.1039/b609005b, 2006.
Hanisch, F. and Crowley, J. N.: Ozone decomposition on Saharandust: an experimental investigation, Atmos. Chem. Phys., 3, 119–130, https://doi.org/10.5194/acp-3-119-2003, 2003.
Harrison, R. M., Peak, J. D., and Collins, G. M.: Tropospheric cy-cle of nitrous acid, J. Geophys. Res.-Atmos., 101, 14429–14439,https://doi.org/10.1029/96JD00341, 1996.
Heard, D. E.: Atmospheric field measurements of thehydroxyl radical using Laser-Induced Fluorescencespectroscopy, Annu. Rev. Phys. Chem., 57, 191–216,https://doi.org/10.1146/annurev.physchem.57.032905.104516,2006.
Jeong, M.-G., Park, E. J., Seo, H. O., Kim, K.-D., Kim, Y. D., andLim, D. C.: Humidity effect on photocatalytic activity of TiO2and regeneration of deactivated photocatalysts, Appl. Surf. Sci.,271, 164–170, https://doi.org/10.1016/j.apsusc.2013.01.155,2013.
Kleffmann, J.: Daytime sources of nitrous acid (HONO) in the at-mospheric boundary layer, Chem. Phys. Chem., 8, 1137–1144,https://doi.org/10.1002/cphc.200700016, 2007.
Kurtenbach, R., Becker, K. H., Gomes, J. A. G., Kleffmann, J.,Lörzer, J. C., Spittler, M., Wiesen, P., Ackermann, R., Geyer,A., and Platt, U.: Investigations of emissions and heterogeneousformation of HONO in road traffic tunnel, Atmos. Environ.,35, 3385–3394, https://doi.org/10.1016/S1352-2310(01)00138-8, 2001.
Langridge, J. M., Gustafsson, R. J., Griffiths, P. T., Cox, R. A., Lam-bert, R. M., and Jones, R. L.: Solar driven nitrous acid formationon building material surfaces containing titanium dioxide: A con-cern for air quality in urban areas?, Atmos. Environ., 43, 5128–5131, https://doi.org/10.1016/j.atmosenv.2009.06.046, 2009.
Lee, J. D., Whalley, L. K., Heard, D. E., Stone, D., Dunmore, R.E., Hamilton, J. F., Young, D. E., Allan, J. D., Laufs, S., and Kl-effmann, J.: Detailed budget analysis of HONO in central Lon-don reveals a missing daytime source, Atmos. Chem. Phys., 16,2747–2764, https://doi.org/10.5194/acp-16-2747-2016, 2016.
Levy, H.: Normal atmosphere: large radical and formalde-hyde concentrations predicted, Science, 173, 141–143,https://doi.org/10.1126/science.173.3992.141, 1971.
Li, S., Matthews, J., and Sinha, A.: Atmospheric hydroxyl radicalproduction from electronically excited NO2 and H2O, Science,319, 1657–1660, https://doi.org/10.1126/science.1151443, 2008.
Liao, W., Hecobian, A., Mastromarino, J., and Tan, D.: Develop-ment of a photo-fragmentation/laser-induced fluorescence mea-surement of atmospheric nitrous acid, Atmos. Environ., 40, 17–26, https://doi.org/10.1016/j.atmosenv.2005.07.001, 2006.
Liao, W., Hecobian, A., Mastromarino, J., and Tan, D.: Develop-ment of a photo-fragmentation/laser-induced fluorescence mea-surement of atmospheric nitrous acid, Atmos. Envrion., 40, 17–26, https://doi.org/10.1016/j.atmosenv.2005.07.001, 2007.
Liu, W. G. and Goddard, W. A.: First-principle study of the roleof interconversion between NO2, N2O4, cis-ONO-NO2, andtrans-ONO-NO2 in chemical processes, J. Am. Chem. Soc., 134,12970–12978, https://doi.org/10.1021/ja300545e, 2012.
Lu, K., Fuchs, H., Hofzumahaus, A., Tan, Z., Wang, H., Zhang,L., Schmitt, S. H., Rohrer, F., Bohn, B., Broch, S., Dong, H.,Gkatzelis, G. I., Hohaus, T., Holland, F., Li, X., Liu, Y., Liu, Y.,Ma, X., Novelli, A., Schlag, P., Shao, M., Wu, Y., Wu, Z., Zeng,L., Hu, M., Kiendler-Scharr, A., Wahner, A., and Zhang, Y.: FastPhotochemistry in Wintertime Haze: Consequences for PollutionMitigation Strategies, Environ. Sci. Technol., 53, 10676–10684,https://doi.org/10.1021/acs.est.9b02422, 2019.
Lu, X., Park, J., and Lin, M. C.: Gas phase reactions of HONO withNO2, O3 and HCl: Ab initio and TST study, J. Phys. Chem. A,104, 8730–8738, https://doi.org/10.1021/jp001610o, 2000.
Matthews, P. S. J., Baeza-Romero, M. T., Whalley, L. K., and Heard,D. E.: Uptake of HO2 radicals onto Arizona test dust particlesusing an aerosol flow tube, Atmos. Chem. Phys., 14, 7397–7408,https://doi.org/10.5194/acp-14-7397-2014, 2014.
Michoud, V., Colomb, A., Borbon, A., Miet, K., Beekmann, M.,Camredon, M., Aumont, B., Perrier, S., Zapf, P., Siour, G., Ait-Helal, W., Afif, C., Kukui, A., Furger, M., Dupont, J. C., Haef-felin, M., and Doussin, J. F.: Study of the unknown HONO day-time source at a European suburban site during the MEGAPOLIsummer and winter field campaigns, Atmos. Chem. Phys., 14,2805–2822, https://doi.org/10.5194/acp-14-2805-2014, 2014.
5774 J. E. Dyson et al.: HONO production from illuminated aerosols
Moon, D. R., Ingham, T., Whalley, L. K., Seakins, P. W.,Baeza-Romero, M. T., and Heard, D. E.: Production of OHand HO2 radicals from near-UV irradiated airborne TiO2nanoparticles, Phys. Chem. Phys. Chem, 21, 2325–2336,https://doi.org/10.1039/C8CP06889E, 2019.
Murdachaew, G., Varner, M. E., Philips, L. F., Finlayson-Pitts,B. J., and Gerber, R. B.: Nitrogen dioxide at the air-waterinterface: trapping, adsorption, and solvation in the bulk andat the surface, Phys. Chem. Chem. Phys., 15, 204–212,https://doi.org/10.1039/c2cp42810e, 2013.
Nakamura, I., Sugihara, S., and Takeuchi, K.: Mechanism forNO photooxidation over the oxygen-deficient TiO2 powderunder visible light irradiation, Chem. Lett., 29, 1276–1277,https://doi.org/10.1246/cl.2000.1276, 2000.
Ndour, M., D’Anna, B., George, C., Ka, O., Balkanski, Y.,Kleffman, J., Stemmler, K., and Ammann, M.: Photoen-hanced uptake of NO2 on mineral dust: Laboratory experi-ments and model simulations, Geophys. Res. Lett., 35, L05812,https://doi.org/10.1029/2007GL032006, 2008.
Oswald, R., Behrendt, T., Ermel, M., Wu, D., Su, H., Cheng,Y., Breuninger, C., Moravek, A., Mougin, E., Delon, C.,Loubet, B., Pommerening-Röser, A., Sörgel, M., Pöschl, U.,Hoffmann, T., Andeae, M. O., Meixner, F. X., and Trebs,I.: HONO emissions from soil bacteria as a major sourceof atmospheric reactive nitrogen, Science, 341, 1233–1235,https://doi.org/10.1126/science.1242266, 2013.
Pimental, A. S., Lima, F. C. A., and da Silva, A. B. F.: Theisomerization of dinitrogen tetraoxide: O2N−NO2→ONO−NO2, J. Phys. Chem. A, 2007, 2913–2920,https://doi.org/10.1021/jp067805z, 2007.
Pinnick, D., Agnew, S., and Swanson, B.: Fluid dinitrogen tetrox-ide at very high pressure and high temperature: observa-tion of the nitrite isomer, J. Phys. Chem., 96, 7092–7096,https://doi.org/10.1021/j100196a046, 1992.
Pitts, J. N., Sanhueza, E., Atkinson, R., Carter, W. P. L.,Winer, A. M., Harris, G. W., and Plum, C. N.: An in-vestigation of the dark formation of nitrous acid in en-vironmental chambers, Int. J. Chem. Kinet., 16, 919–939,https://doi.org/10.1002/kin.550160712, 1984.
Platt, U., Perner, D., Harris, G. W., Winer, A. M., and Pitts,J. N.: Observations of nitrous acid in an urban atmo-sphere by differential optical absorption, Nature, 285, 312–314,https://doi.org/10.1038/285312a0, 1980.
Ramazan, K. A., Syomin, D., and Finlayson-Pitts, B. J.: The pho-tochemical production of HONO during the heterogeneous hy-drolysis of NO2, Phys. Chem. Chem. Phys., 6, 3836–3843,https://doi.org/10.1039/B402195A, 2004.
Ramazan, K. A., Wingen, L. M., Miller, Y., Chaban, G. M.,Gerber, R. B., Xantheas, S. S., and Finlayson-Pitts, B. J.:New experimental and theoretical approach to the hetero-geneous hydrolysis of NO2: key role of molecular nitricacid and its complexes, J. Phys. Chem. A, 110, 6886–6897,https://doi.org/10.1021/jp056426n, 2006.
Reed, C., Evans, M. J., Crilley, L. R., Bloss, W. J., Sherwen,T., Read, K. A., Lee, J. D., and Carpenter, L. J.: Evidencefor renoxification in the tropical marine boundary layer, At-mos. Chem. Phys., 17, 4081–4092, https://doi.org/10.5194/acp-17-4081-2017, 2017.
Sakamaki, F., Hatakeyama, S., and Akimoto, H.: Forma-tion of nitrous acid and nitric oxide in the heteroge-neous dark reaction of nitrogen dioxide and water vaporin a smog chamber, Int. J. Chem. Kinet., 15, 1013–1029,https://doi.org/10.1002/kin.550151006, 1983.
Saliba, N. A., Moussa, S. G., and El Tayyar, G.: Contribution ofairborne dust particles to HONO sources, Atmos. Chem. Phys.Discuss., 14, 4827–4839, https://doi.org/10.5194/acpd-14-4827-2014, 2014.
Sander, S., Friedl, R., Barker, J., Golden, D., Kurylo, M., Wine, P.,Abbatt, J., Burkholder, J., Kolb, C., and Moortgat, G.: Chemicalkinetics and photochemical data for use in atmospheric studies,evaluation number 14, JPL Publ. 02-25, 2003.
Schleicher, N., Norra, S., Chai, F., Chen, Y., Wang, S., and Stüben,D.: Anthropogenic versus geogenic contribution to total sus-pended atmospheric particulate matter and its variations during atwo-year sampling period in Beijing, China, J. Environ. Monit.,12, 434–441, https://doi.org/10.1039/B914739J, 2010.
Seifert, N. A., Zaleski, D. P., Fehnel, R., Goswami, M., Pate,B. H., Lehmann, K. K., Leung, H. O., Marshall, M. D.,and Stanton, J. F.: The gas-phase structure of the asymmet-ric, trans-dinitrogen tetroxide (N2O4), formed by dimerizationof nitrogen dioxide (NO2), from rotational spectroscopy andab initio quantum chemistry, J. Chem. Phys., 146, 134305,https://doi.org/10.1063/1.4979182, 2017.
Shan, J. H., Wategaonkar, S. J., and Vasudev, R.: Vibrational statedependence of the A state lifetime of HONO, Chem. Phys. Lett.,158, 317–320, https://doi.org/10.1016/0009-2614(89)87343-9,1989.
Slater, E. J., Whalley, L. K., Woodward-Massey, R., Ye, C., Lee,J. D., Squires, F., Hopkins, J. R., Dunmore, R. E., Shaw, M.,Hamilton, J. F., Lewis, A. C., Crilley, L. R., Kramer, L., Bloss,W., Vu, T., Sun, Y., Xu, W., Yue, S., Ren, L., Acton, W. J.F., Hewitt, C. N., Wang, X., Fu, P., and Heard, D. E.: El-evated levels of OH observed in haze events during winter-time in central Beijing, Atmos. Chem. Phys., 20, 14847–14871,https://doi.org/10.5194/acp-20-14847-2020, 2020.
Spataro, F. and Ianniello, A.: Sources of atmospheric ni-trous acid: State of the science, current research needs,and future prospects, J. Air Waste Ma., 64, 1232–1250,https://doi.org/10.1080/10962247.2014.952846, 2014.
Stemmler, K., Ndour, M., Elshorbany, Y., Kleffmann, J., D’Anna,B., George, C., Bohn, B., and Ammann, M.: Light inducedconversion of nitrogen dioxide into nitrous acid on submi-cron humic acid aerosol, Atmos. Chem. Phys., 7, 4237–4248,https://doi.org/10.5194/acp-7-4237-2007, 2007.
Su, H., Cheng, Y., Oswald, R., Behrendt, T., Trebs, I., Meixner, F.C., Andreae, M. O., Cheng, P., Zhang, Y., and Pöschl, U.: Soilnitrate as a source of atmospheric HONO and OH radicals, Sci-ence, 333, 1616–1618, https://doi.org/10.1126/science.1207687,2011.
Syomin, D. A. and Finlayson-Pitts, B. J.: HONO decomposition onborosilicate glass surfaces: implications for environmental cham-ber studies and field experiments, Phys. Chem. Chem. Phys., 5,5236–5242, https://doi.org/10.1039/b309851f, 2003.
Takeuchi, M., Sakamoto, K., Martra, G., Coluccia, S., and Anpo,M.: Mechanism of photoinduced superhydrophilicity on theTiO2 photocatalyst surface, J. Phys. Chem. B, 109, 15422–15428, https://doi.org/10.1021/jp058075i, 2005.
J. E. Dyson et al.: HONO production from illuminated aerosols 5775
Varner, M. E., Finlayson-Pitts, B. J., and Gerber, R. B.: Re-action of a charge-separated ONONO2 species with wa-ter in the formation of HONO: an MP2 molecular dy-namics study, Phys. Chem. Chem. Phys., 16, 4483–4487,https://doi.org/10.1039/c3cp55024a, 2014.
Wang, C., Bottorff, B., Reidy, E., Rosales, C. M. F., Collins, D. B.,Novoselac, A., Farmer, D. K., Vance, M. E., Stevens, P. S., andAbbatt, J. P. D.: Cooking, Bleach Cleaning, and Air Condition-ing Strongly Impact Levels of HONO in a House, Environ. Sci.Technol., 54, 13488–13497, 10.1021/acs.est.0c05356, 2020.
Wang, J. and Koel, B. E.: IRAS studies of NO2, N2O3,and N2O4 adsorbed on Au (111) surfaces and reactionswith coadsorbed H2O, J. Phys. Chem. A, 102, 8573–8579,https://doi.org/10.1021/jp982061d, 1998.
Wang, J. and Koel, B. E.: Reactions of N2O4 with ice at lowtemperatures on the Au (111) surface, Surf. Sci., 436, 15–28,https://doi.org/10.1016/S0039-6028(99)00457-4, 1999.
Wexler, A. S. and Clegg, S. L.: Atmospheric aerosol models forsystems including the ions H+, NH+4 , Na+, SO2−
4 , NO−3 , Cl−,Br−, and H2O, J. Geophys. Res.-Atmos., 107, ACH 14-11–ACH14-14, https://doi.org/10.1029/2001JD000451, 2002.
Whalley, L. K., Furneaux, K. L., Goddard, A., Lee, J. D., Maha-jan, A., Oetjen, H., Read, K. A., Kaaden, N., Carpenter, L. J.,Lewis, A. C., Plane, J. M. C., Saltzman, E. S., Wiedensohler,A., and Heard, D. E.: The chemistry of OH and HO2 radi-cals in the boundary layer over the tropical Atlantic Ocean, At-mos. Chem. Phys., 10, 1555–1576, https://doi.org/10.5194/acp-10-1555-2010, 2010.
Whalley, L. K., Stone, D., Dunmore, R., Hamilton, J., Hopkins, J.R., Lee, J. D., Lewis, A. C., Williams, P., Kleffmann, J., Laufs,S., Woodward-Massey, R., and Heard, D. E.: Understanding insitu ozone production in the summertime through radical ob-servations and modelling studies during the Clean air for Lon-don project (ClearfLo), Atmos. Chem. Phys., 18, 2547–2571,https://doi.org/10.5194/acp-18-2547-2018, 2018.
Whalley, L. K., Slater, E. J., Woodward-Massey, R., Ye, C., Lee,J. D., Squires, F., Hopkins, J. R., Dunmore, R. E., Shaw, M.,Hamilton, J. F., Lewis, A. C., Mehra, A., Worrall, S. D., Bacak,A., Bannan, T. J., Coe, H., Percival, C. J., Ouyang, B., Jones, R.L., Crilley, L. R., Kramer, L. J., Bloss, W. J., Vu, T., Kotthaus, S.,Grimmond, S., Sun, Y., Xu, W., Yue, S., Ren, L., Acton, W. J. F.,Hewitt, C. N., Wang, X., Fu, P., and Heard, D. E.: Evaluating thesensitivity of radical chemistry and ozone formation to ambientVOCs and NOx in Beijing, Atmos. Chem. Phys., 21, 2125–2147,https://doi.org/10.5194/acp-21-2125-2021, 2021.
Winer, A. M. and Biermann, H. W.: Long pathlength dif-ferential optical absorption spectroscopy (DOAS) measure-ments of gaseous HONO, NO2 and HCNO in the CaliforniaSouth Coast Air Basin, Res. Chem. Intermed., 20, 423–445,https://doi.org/10.1163/156856794X00405, 1994.
Wu, L., Li, X., and Ro, C.: Hygroscopic behavior of am-monium sulfate, ammonium nitrate, and their mixtureparticles, Asian J. Atmos. Environ., 13.3, 196–211,https://doi.org/10.5572/ajae.2019.13.3.196, 2019.
Ye, C., Zhou, X., Pu, D., Stutz, J., Festa, J., Spolaor, M., Tsai,C., Cantrell, C., Mauldin, R. L., Campos, T., Weinheimer, A.,Hornbrook, R. S., Apel, E. C., Guenther, A., Kaser, L., Yuan,B., Karl, T., Haggerty, J., Hall, S., Ullmann, K., Smith, J.N., Ortega, J., and Knote, C.: Rapid cycling of reactive ni-trogen in the marine boundary layer, Nature, 532, 489–491,https://doi.org/10.1038/nature17195, 2016.
Ye, C., Heard, D. E., and Whalley, L. K.: Evaluation of novel routesfor NOx formation in remote regions, Environ. Sci. Technol., 51,7442–7449, ht 2017a.
Ye, C., Zhang, N., Gao, H., and Zhou, X.: Photolysis of particulatenitrate as a source of HONO and NOx , Environ. Sci. Technol.,51, 6849–6856, https://doi.org/10.1021/acs.est.7b00387, 2017b.