Page 1
International Journal of Business and Management Review
Vol.4, No.1, pp.11-32, February 2016
___Published by European Centre for Research Training and Development UK (www.eajournals.org)
11 ISSN: 2052-6393(Print), ISSN: 2052-6407(Online)
PRODUCTION PLANNING AND PROFITABILITY OF SELECTED
MANUFACTURING FIRMS IN NIGERIA.
Dr. Ikon, M. A. and Nwankwo, Catherine Nkechi
Department of Business Administration, Nnamdi Azikwe University, Awka, Nigeria.
ABSTRACT: This research focuses on Production Planning and Profitability. A study of
Flour Mill of Nigeria Plc, Dangote Flour Mill Plc, and Honeywell Flour Mill Plc was adopted.
Production Planning is important in providing better and more economic goods to customers
at lower investment. Inventory shortage as a result of stock out and unexpected increase in
demand, supply challenge associated with inadequate capacity installation of machines, poor
technology, poor capacity utilization, inability to meet budgetary target as a result of change
in demand and supply variable and poor demand forecasting are established as the problem
of this study. In view of the problem identified, the objectives of this study are to examine the
effect of inventory shortage on turnover, to examine the problems of value added by supply
chain on profitability and to ascertain the influence of budget on investment of selected
manufacturing firms in Nigeria. This work is anchored on the Economic Theory of Production
and Rational Economic Man Theory. Data collected for this research were based on Secondary
information. Data obtained were analyzed using Ordinary Least Square (OLS) technique by
the use of time series. The finding of this study shows that the estimated coefficient of the
constant term is statistically significant at better than 0.1 per cent for Dangote Flour Mill Plc
and Honeywell Flour Mill Plc and statistically significant at 0.6 per cent for Flour Mill of
Nigeria Plc. This implies that increase in turnover (sales) lead to subsequent increase in
inventory which in turn increases level of production. The increase in turnover subsequently
increases profitability in Dangote Flour Mill Plc and Honeywell Flour Mill Plc. This study
concludes that increase in turnover, profitability and budget are vital sources of facilitating
growth in flour milling firms in Nigeria. The study recommends that flour millers should
integrate their supply chain management operations efficiently to enhances their sales and
profitability and also adopt the supply chain strategy/models that were developed in this study
to align with their operations and target customers
KEYWORDS: Production Planning, Profitability, Capacity Utilisation and Budgetary Target
INTRODUCTION
The business terrain in which firms operate has witnessed tremendous change in the past in
terms of material sourcing, customer satisfaction, inventory management and overall
profitability. The level of globalization, which entails that many organizations find themselves
operating in a highly competitive international market and the use of highly advanced strategy
and technologies have challenged the very basic principles and ideologies of business
management and marketing Management. To compete in a global environment, therefore,
organizations have had to change in order to sustain growth and break new frontiers. As a
result, most industries have transformed completely from manual processes to complicated,
automated and computerized technologies and strategies (Minoli, 2005).
Page 2
International Journal of Business and Management Review
Vol.4, No.1, pp.11-32, February 2016
___Published by European Centre for Research Training and Development UK (www.eajournals.org)
12 ISSN: 2052-6393(Print), ISSN: 2052-6407(Online)
Production planning is associated with planning (that is the acquisition, time of usage, quantity)
of the resources required to perform these transformation steps, in order to satisfy the customers
in the most efficient or economical way (Ahuja, 2004). In other words, the production decisions
are typically taken by looking at the best trade-off between financial objectives and customer
service or satisfaction objectives. Profitability is a state or condition of yielding financial profit
or gain, in other words, profitability refers to the operating efficiency of the enterprise
(Business Dictionary, 2012). It is the ability of enterprise to get sufficient return on the capital
and employees used in the business operation. Revenue and profits are driven solely by market
share and efficiency, therefore success is determined mainly by the ability of a company to
ensure superior capacity utilisation.
Statement of the Problem
In manufacturing environments, production planning is associated with decisions about the size
of the production lots of the different products to be manufactured. This therefore has to do
with processing the time at which those lots have to be produced, as well as the machine and/or
production facility for the final production.
Flour Mills of Nigeria Plc, Dangote Flour Mills Plc and Honeywell Flour Mills Plc have jointly
continued to grapple with operating environment problems ranging from high exchange rate to
high production cost as well as poor infrastructure in Nigeria. Furthermore, Flour Milling
Industries in Nigeria, are experiencing slow sales growth, inventory shortage, rising cost-
income ratio (that is driven by rising interest expenses on the company’s large borrowings),
high cost of operations which result in reduction of improved profit.
Objectives of the Study
The overall objective of this paper is to determine the effect of production planning on
profitability of manufacturing firms in Nigeria.
This paper seeks to achieve the objectives stated below:
i. To examine the influence of inventory shortages on turnover of Flour Milling firms in
Nigeria.
ii. To examine the value added by supply chain on profitability of flour milling firms in
Nigeria.
iii. To ascertain the influence of budget on the investment of flour milling firms in Nigeria
REVIEW OF RELATED LITERATURE
Jolayemi and Oloruniwo (2010) developed a deterministic model for planning production and
transportation quantities in a multi-plant and multi-warehouse environment, where
opportunities to increase capacity levels were available. A mixed integer linear programming
model was applied to analyse this model.
Hong-Sen , Qi-Feng , Min-Ru, and Xia-Ling (2013) addressed the closely related problems of
production planning and scheduling on mixed model automobile assembly lines. They
proposed an integrated solution, in which a production plan that was feasible with respect to
Page 3
International Journal of Business and Management Review
Vol.4, No.1, pp.11-32, February 2016
___Published by European Centre for Research Training and Development UK (www.eajournals.org)
13 ISSN: 2052-6393(Print), ISSN: 2052-6407(Online)
aggregate capacity constraint was developed and then a sequence that was feasible with respect
to this plan was sought. They proposed three tabu-search-based algorithms that explore the
solution spaces for both problems to different degrees to find a combination of a production
plan and schedule that were feasible and that approximately optimized the objective function (
involving the overproduction and underproduction of finished automobiles, the set up cost, the
idle times of work cells on the line, the make span and the load deviations among work cells).
Simulation was used to evaluate alternative schedules.
Mula, Poler, and Garcia, (2012), presented a new linear programming model for medium term
production planning in a capacity constrained MRP, multi-product, multi-level and multi-
period manufacturing environment. This paper provided three fuzzy models with flexibility in
the objective function. The paper demonstrated the usefulness and significance of MRP
modeling with flexible constraints under uncertainty in demand. Their model was tested using
real data from an automobile seat manufacturer.
METHODOLOGY
The classical linear regression models also known as Ordinary Least Square technique were
employed in analyzing the data. This statistical tool seeks to establish the strength or degree of
association between the dependent variables and independent variables. The software used for
analysis is GrettI.
Model Specification
Turnover Equation: these equations examine the influence of inventory shortages on turnover
of Flour Milling Industries in Nigeria.
The estimation model is as stated below:
TNOR=a (INVT, PRT, BGT, TECH, EXCHR, IMPᵼ-1, FAST, CAST) ᵉᵼ …………….. (i)
This could be restated as follows:
TNOR= a₀ + a₁ LINVT + a₂LPRT+ a₃LBGT + a₄LTECH + a₅L EXCHR+ a₆L IMPᵼ-1+
a7LFAST
+ a8L CASTᵉᵼ -----------------------……………………………….. (ii)
Where:
ᵉᵼ = Stochastic term
a₀ - a8 =Parameter Estimate or error term
TNOR = turnover
LINVT = log of inventory
LPRT = log of profitability
LBG = log of budget
LTECH = log of technology
Page 4
International Journal of Business and Management Review
Vol.4, No.1, pp.11-32, February 2016
___Published by European Centre for Research Training and Development UK (www.eajournals.org)
14 ISSN: 2052-6393(Print), ISSN: 2052-6407(Online)
LEXCHR = log of exchange rate
LIMPᵼ- 1 = log of import at particular point in time
LFAST = log of fixed asset
LCAST = log of current asset
Profitability Equation: these equations examine the value added by supply chain on
profitability of Flour Milling Industries in Nigeria.
PROF = f (CPROD, CAST, EXCH, TNOR, INVT, PRCUST,TECH, CAPU) ᵉᵼ ---------- (iii)
Econometrically the model can be restated as:
PRT = b₀+ b₁ LCPROD+ b₂ LCAST+ b₃LEXCH+ b₄LTNOR+ b₅LINVT+ b₆ LPRCUST+
b7LTEC+ b8LCAPU ᵉᵼ( iv)
Where:
Supply chain is proxy for procurement cost
bo-b8 = parameter estimates / parameter structure
ᵉᵼ = stochastic or error term
PRT = Profitability
LCPROD = log of cost of production
LFAST = log of fixed asset
LCAST = log of current asset
LEXCH = log of exchange rate
LTNOR = log of turnover
LINVT = log inventory
LPRCUST = log of procurement cost
LTECH = log of technology
LCAPU = log of capacity utilization
Budget Equation: These equations ascertain the influence of budget on investment of the Flour
Milling Industries in Nigeria.
BGT = f(INV, PRT, TNOR, FAST, CASST, CAPU, EXCHR,) ᵉᵼ -------------------------------- (IX)
The model is restated in econometric form as follows:-
BGT =eo+e1LINV+e2LPRT+e3LTNOR+e4CAST+e5FAST+ e₆LCAPU+ e7LEXCHR ᵉᵼ -------(X)
Where:
e0 – e7 = parameter estimates / parameter structure
ᵉᵼ = stochastic or error term
Page 5
International Journal of Business and Management Review
Vol.4, No.1, pp.11-32, February 2016
___Published by European Centre for Research Training and Development UK (www.eajournals.org)
15 ISSN: 2052-6393(Print), ISSN: 2052-6407(Online)
BGT = budget
LINV =log of investment
LPRT = log of profitability
LTNOR= log of turnover
L CAST = log of current asset
LFAST = log of fixed asset
LCAPU = log of capacity utilisation
LEXCHR = log of exchange rate
Data Presentation and Analysis of Data
The data used for model estimation of equation i, ii and iii in relation to production planning
and profitability of selected manufacturing firms in Nigeria is presented below. In the
equations, dependent variables include turnover, profitability and budget. The explanatory
variables includes: inventory, profitability, budget, technology, exchange rate, turnover,
import, fixed asset, current asset, cost of production, procurement cost, investment, and
capacity utilization.
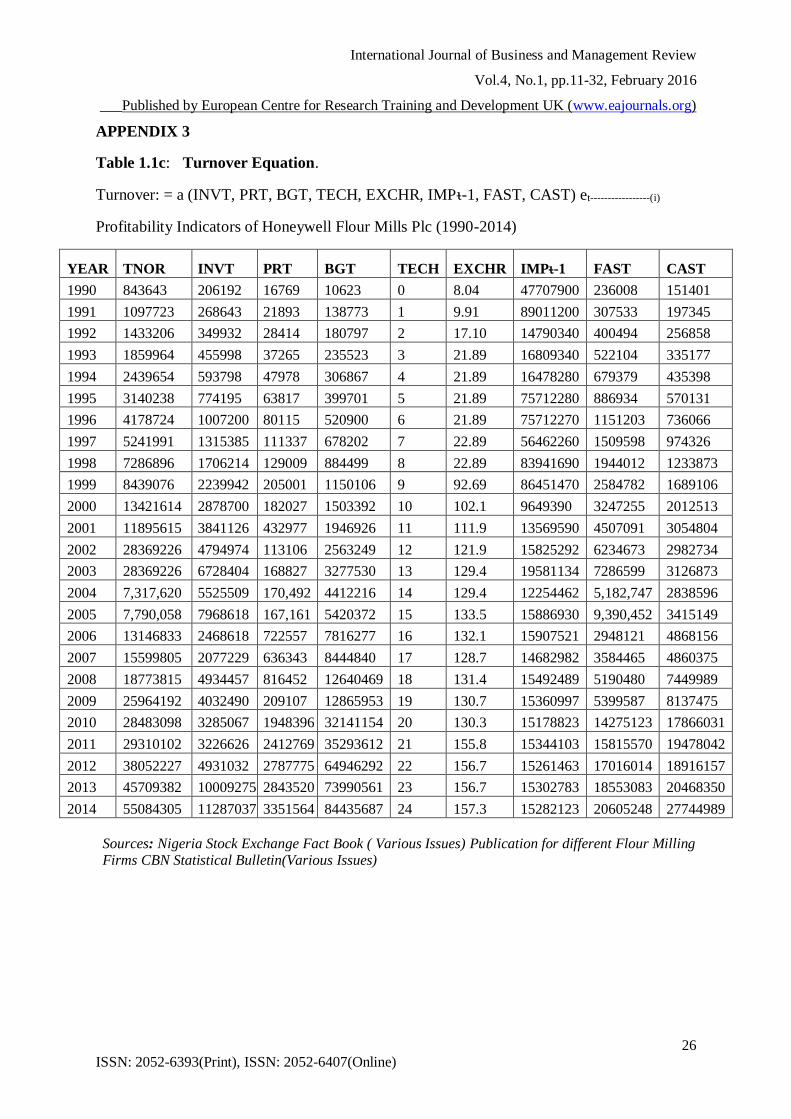
Table 1.1a, 1.1b and 1.1c presents the variables used for estimating turnover equation. Column
1 of the table presents the range of years which the study covers. Column 2 of the tables
presents the yearly data for turnover. Column 3 shows the yearly figures for profitability within
the range of year covered by the study. Column 4 presents the yearly data for budget over the
period under study. Column 5 presents yearly figures for technology within the years covered
by the study. Column 6 presents the yearly data for exchange rate over the period under study.
Column 7 shows the yearly figures for import within the range of year covered by the study
Column 8 presents the yearly data for fixed asset over the period under study. Column 9
presents the yearly figures for current asset within the range of year covered by the study.( see
appendix 1,2 &3)
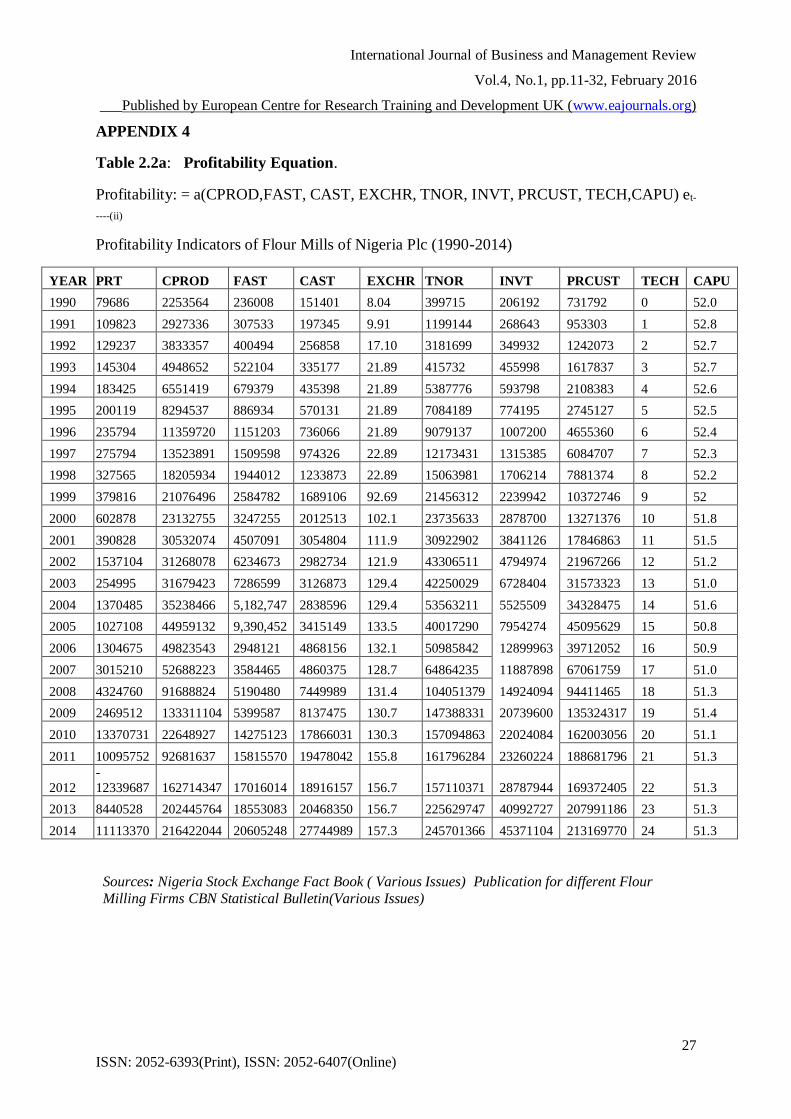
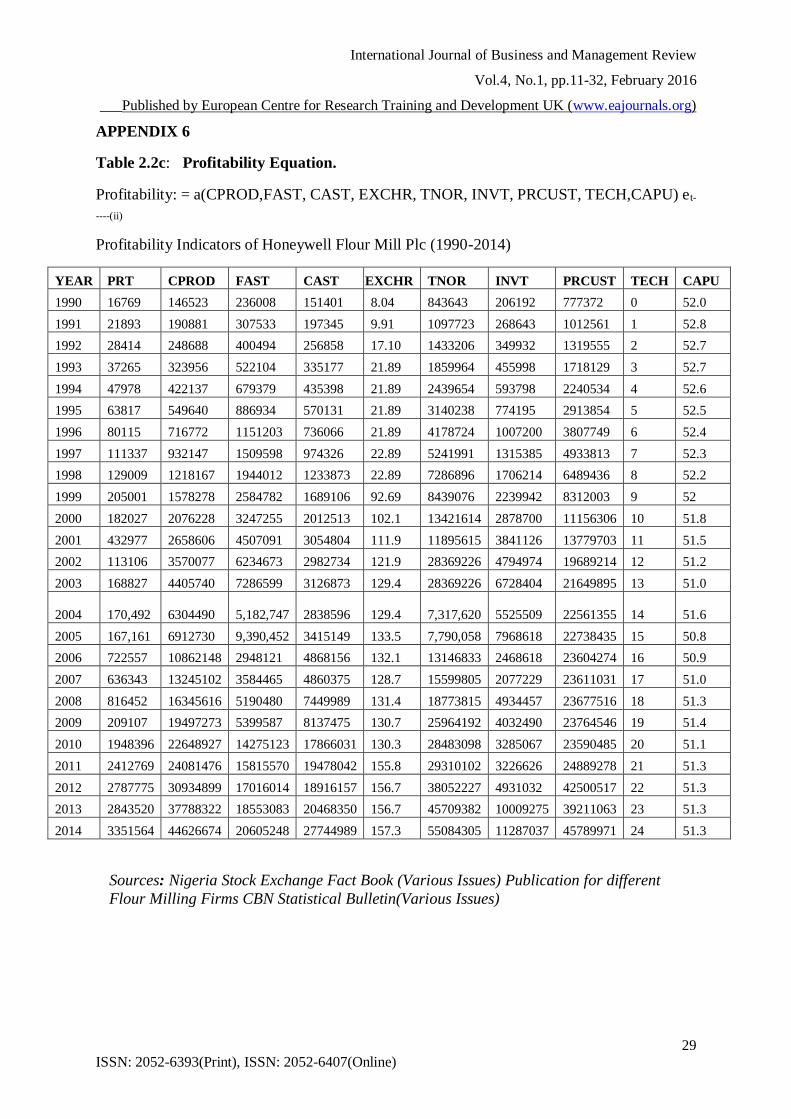
Table 2.2a, 2.2b and 2.2c, presents the variables used for estimating profitability equation.
Column 1 of the table presents the range of years which the study covers. Column 2 of the
tables presents the yearly data for profitability. Column 3 shows the yearly figures for cost of
production within the range of year covered by the study. Column 4 presents the yearly data
for fixed asset over the period under study. Column 5 presents yearly figures for current asset
within the years covered by the study. Column 6 presents the yearly data for exchange rate over
the period under study. Column 7 shows the yearly figures for turnover within the range of year
covered by the study Column 8 presents the yearly data for inventory over the period under
study. Column 9 presents the yearly figures for procurement cost within the range of year
covered by the study. Column 10 presents the yearly data for technology within the range of
years covered by the study. Column 11 presents the yearly data for capacity utilisation within
the range of years covered by the study. (See appendix 4, 5 &6)
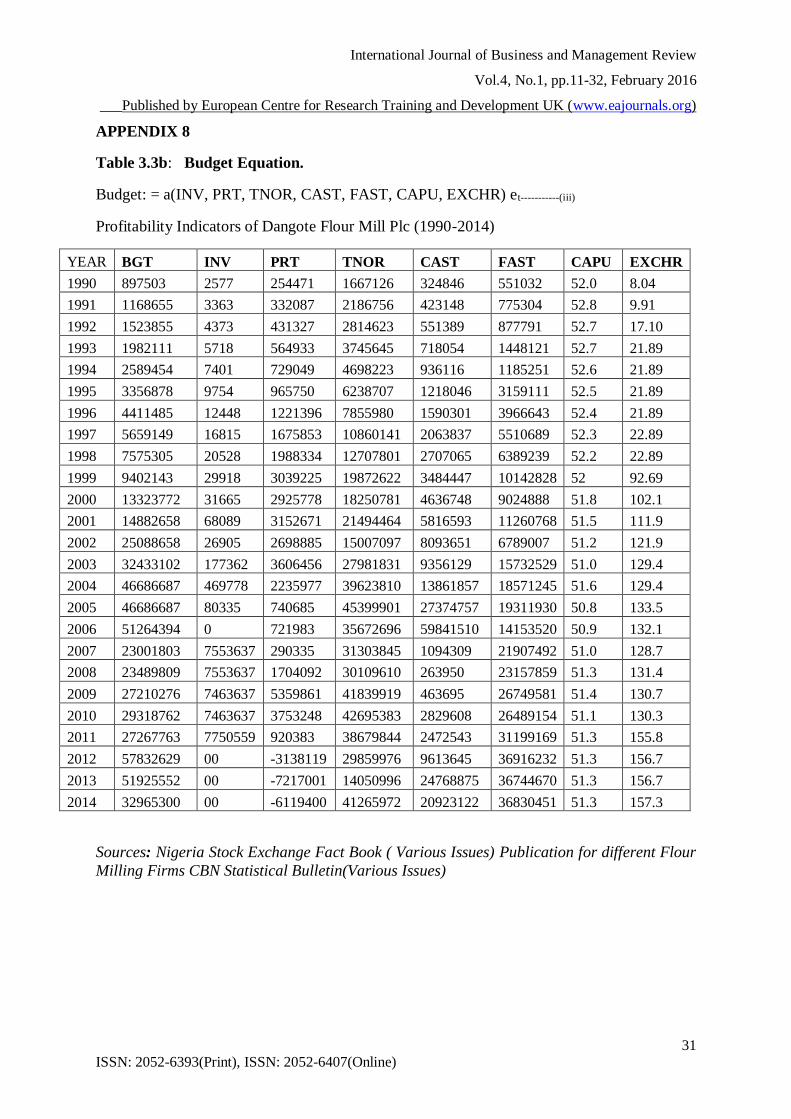
Table 3.3a, 3.3b and 3.3c, presents the variables used for estimating budget equation. Column
1 of the table presents the range of years which the study covers. Column 2 of the tables
presents the yearly data for budget. Column 3 shows the yearly figures for investment within
the range of year covered by the study. Column 4 presents the yearly data for profitability over
the period under study. Column 5 presents yearly figures for turnover within the years covered
Page 6
International Journal of Business and Management Review
Vol.4, No.1, pp.11-32, February 2016
___Published by European Centre for Research Training and Development UK (www.eajournals.org)
16 ISSN: 2052-6393(Print), ISSN: 2052-6407(Online)
by the study. Column 6 presents the yearly data for current asset over the period under study.
Column 7 shows the yearly figures for fixed asset within the range of year covered by the study
Column 8 presents the yearly data for capacity utilisation over the period under study. Column
9 presents the yearly figures for exchange rate within the range of year covered by the study.
(See appendix 7, 8 & 9)
ANALYSIS OF RESULTS
This study focused on Production planning variables such as turnover, profitability and budget
and profitability of selected manufacturing firms in Nigeria. These set of regressions were run
using the ordinary least square method to obtain the results.
Turnover Equation
Table 1.1a: Regression result of inventory shortage on turnover of Flour Mill of Nigeria
plc.
Method of Estimation = ordinary least squares
F (Zero slopes) = 2.54127 [.062]
R-square = 2.266345
Adjusted R-squared = .161537
Variable Estimated
coefficient
Standard Error t-statistic P-value
C 244.098 497.122 3.491022 [.627]
LINVT -268.351 791.836 1-338897 [.737]
LPRT -391.948 1103.46 2.355200 [.725]
LBGT -287.030 121.193 -2.36837 [.908]
LTECH .130993E-02 .011201 2.116949 [.908]
LEXCHR .448271 .785111 1.99871 [.611]
LIMP .38421 .861819 1.337181 [.781]
LFAST .567382 .132399 2.254301 [.400]
LCAST .691846 .674222 1.446261 [.0121]
Source: Gret L. package
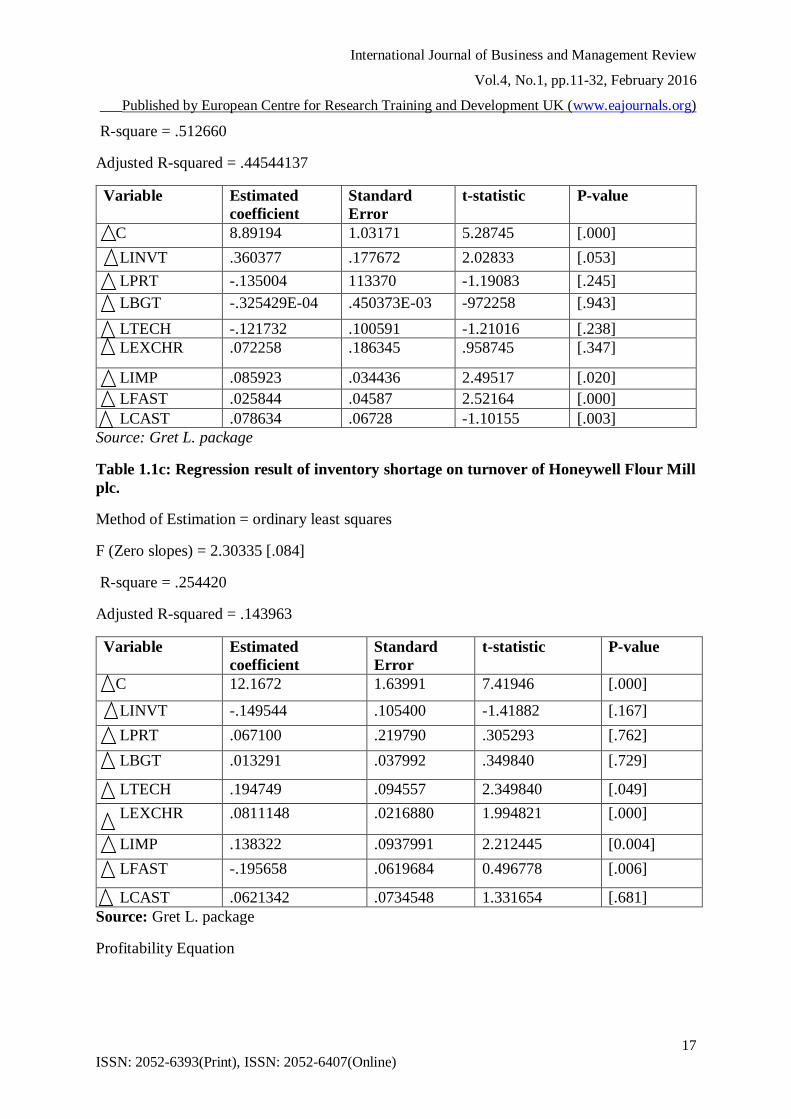
Table 1.1b: Regression result of inventory shortage on turnover of Dangote Flour Mill
plc.
Method of Estimation = ordinary least squares
F (Zero slopes) = 7.62668 [.000]
Page 7
International Journal of Business and Management Review
Vol.4, No.1, pp.11-32, February 2016
___Published by European Centre for Research Training and Development UK (www.eajournals.org)
17 ISSN: 2052-6393(Print), ISSN: 2052-6407(Online)
R-square = .512660
Adjusted R-squared = .44544137
Variable Estimated
coefficient
Standard
Error
t-statistic P-value
C 8.89194 1.03171 5.28745 [.000]
LINVT .360377 .177672 2.02833 [.053]
LPRT -.135004 113370 -1.19083 [.245]
LBGT -.325429E-04 .450373E-03 -972258 [.943]
LTECH -.121732 .100591 -1.21016 [.238]
LEXCHR .072258 .186345 .958745 [.347]
LIMP .085923 .034436 2.49517 [.020]
LFAST .025844 .04587 2.52164 [.000]
LCAST .078634 .06728 -1.10155 [.003]
Source: Gret L. package
Table 1.1c: Regression result of inventory shortage on turnover of Honeywell Flour Mill
plc.
Method of Estimation = ordinary least squares
F (Zero slopes) = 2.30335 [.084]
R-square = .254420
Adjusted R-squared = .143963
Variable Estimated
coefficient
Standard
Error
t-statistic P-value
C 12.1672 1.63991 7.41946 [.000]
LINVT -.149544 .105400 -1.41882 [.167]
LPRT .067100 .219790 .305293 [.762]
LBGT .013291 .037992 .349840 [.729]
LTECH .194749 .094557 2.349840 [.049]
LEXCHR .0811148 .0216880 1.994821 [.000]
LIMP .138322 .0937991 2.212445 [0.004]
LFAST -.195658 .0619684 0.496778 [.006]
LCAST .0621342 .0734548 1.331654 [.681]
Source: Gret L. package
Profitability Equation
Page 8
International Journal of Business and Management Review
Vol.4, No.1, pp.11-32, February 2016
___Published by European Centre for Research Training and Development UK (www.eajournals.org)
18 ISSN: 2052-6393(Print), ISSN: 2052-6407(Online)
Table 2.2a: Regression result of value added by supply chain on profitability of Flour Mill
of Nigeria plc.
Method of Estimation = ordinary least squares
F (Zero slopes) = 7.62668 [.000]
R-square + 512660
Adjusted R-squared = 445441
Variable Estimated
coefficient
Standard Error t-statistic P-value
C 15.5529 3.98060 3,90718 [.001]
LPROD -179243 .171230 -1.04680 [.304]
LCAST -014780 .826302E-02 -178871 [.084]
LEXCHR .289034 .181993 1.58816 [.123]
LTNOR -1.69249 .745011 -2.27177 [.031]
LNVT .48792 .041235 2.116138 [.638]
LPRCUST .228917 0.231185 1.99872 [.7718]
LTECH -346728 0.52146 2.66731 [.000]
LCAPU 294261 0.332464 1.99344 [.616]
Source: Gret L. package
Table 2.2b: Regression result of value added by supply chain on profitability of Dangote
Flour Mill plc.
Method of Estimation = Ordinary Least Squares
F (zero slopes) = 2.19421 [.096]
R-squared = .245321
Adjusted R-squared = .133517
Variable Estimated
Coefficient
Standard Error t-statistic p-value
C 11.9486 1.60526 7.44336 [.000]
LPROD -119611 .092745 -1.28968 [.208]
LCAST .52447 .219705 .237817 [.813]
LEXCHR .01449 .038174 .377724 [.709]
LTNOR .182497 .092997 1.96240 [.060]
LNVT .0411821 .318604 1.61330 [.000]
LPRCUST .0623618 .046412 1.18920 [0.101]
LTECH .0812322 .063141 -2.34350 [.818]
LCAPU 0.0431631 .046824 1.181176 [.005]
Source: Gret L. Package
Page 9
International Journal of Business and Management Review
Vol.4, No.1, pp.11-32, February 2016
___Published by European Centre for Research Training and Development UK (www.eajournals.org)
19 ISSN: 2052-6393(Print), ISSN: 2052-6407(Online)
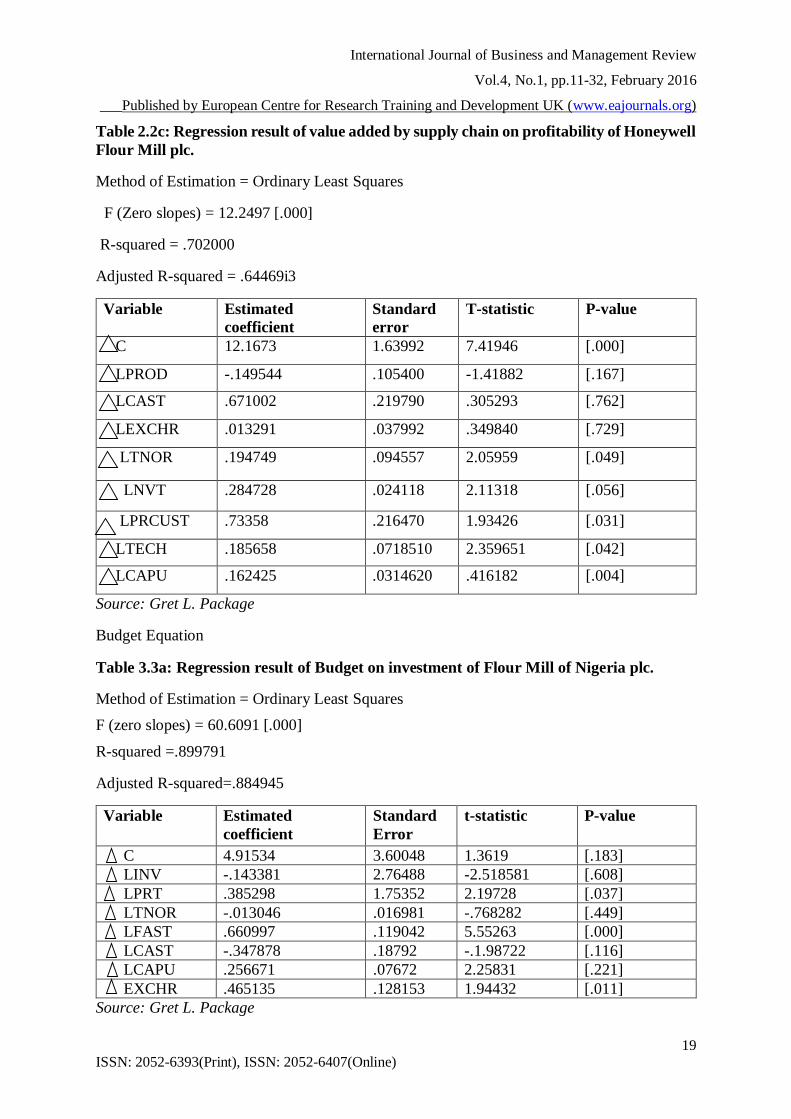
Table 2.2c: Regression result of value added by supply chain on profitability of Honeywell
Flour Mill plc.
Method of Estimation = Ordinary Least Squares
F (Zero slopes) = 12.2497 [.000]
R-squared = .702000
Adjusted R-squared = .64469i3
Variable Estimated
coefficient
Standard
error
T-statistic P-value
C 12.1673 1.63992 7.41946 [.000]
LPROD -.149544 .105400 -1.41882 [.167]
LCAST .671002 .219790 .305293 [.762]
LEXCHR .013291 .037992 .349840 [.729]
LTNOR .194749 .094557 2.05959 [.049]
LNVT .284728 .024118 2.11318 [.056]
LPRCUST .73358 .216470 1.93426 [.031]
LTECH .185658 .0718510 2.359651 [.042]
LCAPU .162425 .0314620 .416182 [.004]
Source: Gret L. Package
Budget Equation
Table 3.3a: Regression result of Budget on investment of Flour Mill of Nigeria plc.
Method of Estimation = Ordinary Least Squares
F (zero slopes) = 60.6091 [.000]
R-squared =.899791
Adjusted R-squared=.884945
Variable Estimated
coefficient
Standard
Error
t-statistic P-value
C 4.91534 3.60048 1.3619 [.183]
LINV -.143381 2.76488 -2.518581 [.608]
LPRT .385298 1.75352 2.19728 [.037]
LTNOR -.013046 .016981 -.768282 [.449]
LFAST .660997 .119042 5.55263 [.000]
LCAST -.347878 .18792 -.1.98722 [.116]
LCAPU .256671 .07672 2.25831 [.221]
EXCHR .465135 .128153 1.94432 [.011]
Source: Gret L. Package
Page 10
International Journal of Business and Management Review
Vol.4, No.1, pp.11-32, February 2016
___Published by European Centre for Research Training and Development UK (www.eajournals.org)
20 ISSN: 2052-6393(Print), ISSN: 2052-6407(Online)
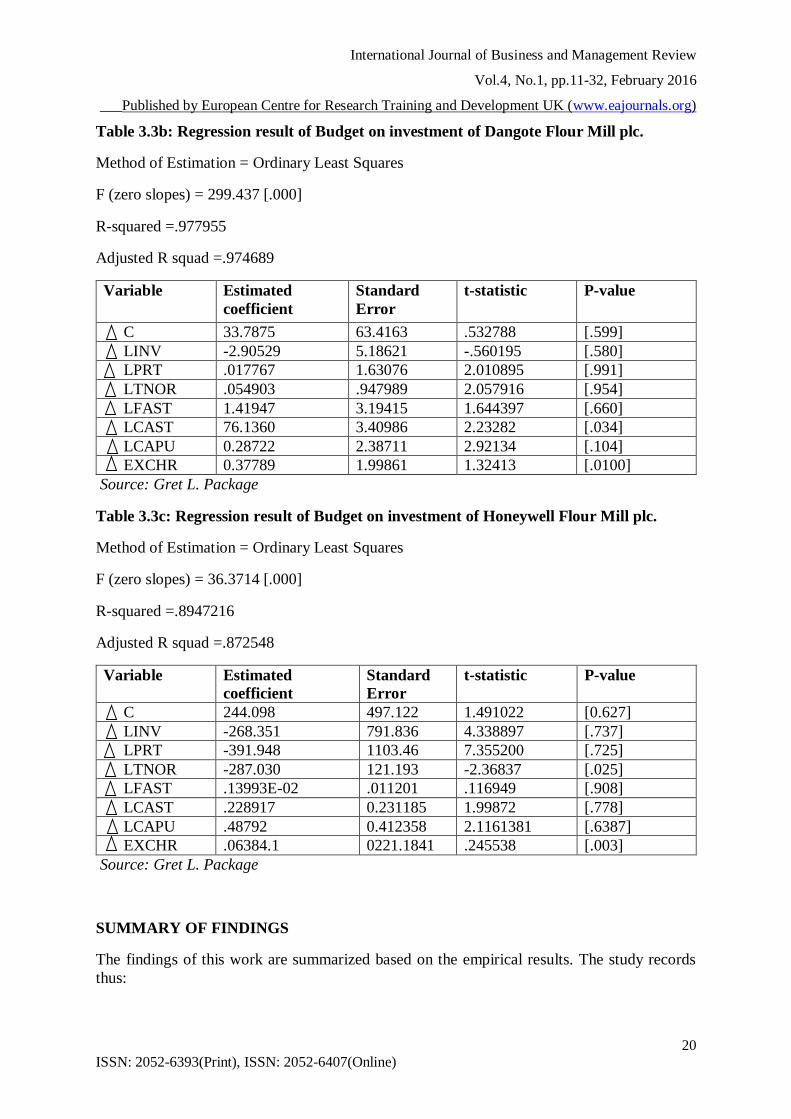
Table 3.3b: Regression result of Budget on investment of Dangote Flour Mill plc.
Method of Estimation = Ordinary Least Squares
F (zero slopes) = 299.437 [.000]
R-squared =.977955
Adjusted R squad =.974689
Variable Estimated
coefficient
Standard
Error
t-statistic P-value
C 33.7875 63.4163 .532788 [.599]
LINV -2.90529 5.18621 -.560195 [.580]
LPRT .017767 1.63076 2.010895 [.991]
LTNOR .054903 .947989 2.057916 [.954]
LFAST 1.41947 3.19415 1.644397 [.660]
LCAST 76.1360 3.40986 2.23282 [.034]
LCAPU 0.28722 2.38711 2.92134 [.104]
EXCHR 0.37789 1.99861 1.32413 [.0100]
Source: Gret L. Package
Table 3.3c: Regression result of Budget on investment of Honeywell Flour Mill plc.
Method of Estimation = Ordinary Least Squares
F (zero slopes) = 36.3714 [.000]
R-squared =.8947216
Adjusted R squad =.872548
Variable Estimated
coefficient
Standard
Error
t-statistic P-value
C 244.098 497.122 1.491022 [0.627]
LINV -268.351 791.836 4.338897 [.737]
LPRT -391.948 1103.46 7.355200 [.725]
LTNOR -287.030 121.193 -2.36837 [.025]
LFAST .13993E-02 .011201 .116949 [.908]
LCAST .228917 0.231185 1.99872 [.778]
LCAPU .48792 0.412358 2.1161381 [.6387]
EXCHR .06384.1 0221.1841 .245538 [.003]
Source: Gret L. Package
SUMMARY OF FINDINGS
The findings of this work are summarized based on the empirical results. The study records
thus:
Page 11
International Journal of Business and Management Review
Vol.4, No.1, pp.11-32, February 2016
___Published by European Centre for Research Training and Development UK (www.eajournals.org)
21 ISSN: 2052-6393(Print), ISSN: 2052-6407(Online)
I. The regression result of table 1.1a, 1.1b and 1.1c indicates that the estimated
coefficient for these results are statistically significant at 0.6 per cent (Flour Mill of
Nigeria plc), better than 0.1 per cent for both (Dangote flour mill Plc) and (Honeywell
flour mill Plc). This implies that Dangote Flour Mill Plc and Honeywell Flour Mill
Plc increase turnover, leads to increase in inventory which in turn increase level of
profitability. The regression coefficient of inventory for Flour Mill of Nigeria plc and
Honeywell Flour Mill Plc are statistically not significant at 0.7 per cent and 0.1 per
cent but Dangote Flour Mill Plc is statistically significant at better than 0.1 per cent.
This implies that in Flour Mills of Nigeria plc, Dangote Flour Mills Plc and Honeywell
Flour Mills Plc increase in inventory shortage leads to decrease in profitability which
is against management expectation. The coefficient of profitability, budget and
technology are statistically significant at 0.7 per cent (profitability), 0.9 per cent
(budget) and 0.9 per cent for (technology). This further reveals that turnover
contributes meaningfully to high profitability, budget and through the application of
technology and innovation installed of companies studied as well as high level of
economic growth in the country.
II. From regression analysis of table 2.2a, 2.2b and 2.2c, the estimated coefficient for
these results are statistically significant at better than 0.1 per cent Flour mill of Nigeria
plc,
Dangote flour Mill of Nigeria and Honeywell flour Mill plc. This implies that at zero
performance of all the independent variables, profitability facilitate performance at
15.5529 for Flour Mill of Nigeria Plc, 11.9486 for Dangote flour mill and 12.1673
for Honeywell flour mill Plc respectively. The regression coefficient of production
cost for Flour mill of Nigeria Plc, Dangote flour mill Plc and Honeywell flour mill Plc
are statistically not significant at 0.3 per cent, 0.2 per cent and 0.1 per cent. The
coefficients of inventory, turnover and capacity utilization are statistically significant
at 0.6 per cent (inventory), better than 0.1 per cent (turnover) and 0.6 per cent (capacity
utilization). This further reveals that efficient use of inventory as well as high turnover
and high capacity utilization and installation facilitate the profitability of flour milling
sub sector.
III. The regression result of table 3.3a, 3.3b and 3.3c shows the estimated coefficient of
investment, profitability, current asset and capacity utilization are statistically
significant at various levels. This implies that budget variables associated with
investment contributes meaningfully to the profitability of the flour milling industries.
CONCLUSIONS
This study has been able to provide empirical information on production planning and
Profitability of manufacturing firms in Nigeria, on the basis of the findings the following
conclusions are made:
Inventory increase turnover of flour milling industry sub sector, value added by supply chain
have the potential of facilitating profitability and sustaining the growth of the flour milling
firms in Nigeria. Budget influence on investment has linkages to the profitability of flour
milling sub sector. Thus, there is functional relationship between production planning variables
Page 12
International Journal of Business and Management Review
Vol.4, No.1, pp.11-32, February 2016
___Published by European Centre for Research Training and Development UK (www.eajournals.org)
22 ISSN: 2052-6393(Print), ISSN: 2052-6407(Online)
and profitability, particularly in the manufacturing sub-sector, these linkages are important for
the growth of organizations. The study concludes that increase in turnover, profitability and
budget are vital sources of facilitating growth in the flour milling firms. The growth facilitates
improvement in investment, technology, rate of turnover, profitability, reduction in
procurement and, production cost and inventory shortage.
RECOMMENDATIONS
Based on the findings and conclusions, the following recommendations are made:
1. Top management of Flour mill of Nigeria Plc, Dangote flour mill Plc, and Honeywell
flour mill Plc in making corrective decisions well in time should use the of linear
regression methodsin their production planning. This method will determine the future
production patterns and outlook resulting in the establishment of new production units,
while planning for maximizing profits of the company.
2. Profitability growth as one of the key preconditions to survive in the market is forcing
companies to compete on global markets and at the same time defend domestic market
share from their global competitors, the effect of that is increased complexity of supply
chains, pressure to decrease cost burden and improve service level. To cope with the
complexity of production, increase customer requirements, and profitability efficient
management of the supply chain is a prerequisite.
3. Production firms most especially the flour millers should integrate their supply chain
management operations efficiently to enhance their sales and profitability and also
adopt the supply chain strategy/models that was developed in this study to align with
their operations and target customers.
SUGGESTIONS FOR FURTHER STUDY
The study focuses on Production planning and profitability of manufacturing firms in Nigeria
for the period 1990 -2014. The use of other tools like linear programming, and forecasting
technique of analysis may provide different results from the one used in this study on
Production Planning and profitability of manufacturing firms in Nigeria
Another useful extension of this work could be to analyze uncertainties in production
situations. Some of the uncertainties in the form of machine failures and demand forecast errors
often exist in real life situations. Production planning with stochastic demand would be a good
generalization of this research. Situations like variability in processing times of jobs and
variability in process yields are very common, especially in process industries. We have
focused primarily on deterministic production planning in this research. The information about
the problem instances is known with certainty in deterministic planning. Modeling production
planning decisions with stochastic parameters would help in capturing some common
uncertainties in production planning.
Page 13
International Journal of Business and Management Review
Vol.4, No.1, pp.11-32, February 2016
___Published by European Centre for Research Training and Development UK (www.eajournals.org)
23 ISSN: 2052-6393(Print), ISSN: 2052-6407(Online)
REFERENCE
Anene, E. C. (2010): “Production Planning and Control in a Small-Scale Garment Industry”;
An
Unpublished Research Paper Presented to the Faculty of Administration, Obafemi Awolowo
University, Ile-Ife, in Partial Fulfilment of the Requirement for the Award of the Post-
graduate Diploma in Management Studies.
Anthony, R.N., (2009) “Planning and control systems: a framework for analysis”, Cambridge:
Harvard University Press
Bonavia, T., & Marin, J. A. (2009). An empirical study of lean production in the ceramic tile
industry in Spain. International Journal of Operations & Production Management, 26(5),
505-531.
Bruun, P., & Mefford, R. N. (2010). Lean production and the Internet. International Journal of
Production Economics, 89(3), 247-260.
Hong-Sen Y, Qi-Feng X., Min-Ru Z., & Xia-Ling L., (2013) Integrated Production Planning
and Scheduling on Automobile Assembly lines, volume 35, issue 8, pages 711-725.
Jolayemi, J. K. & Olorunniwo, F. O., (2010), A Deterministic Model for Planning Production
Quantities in a Multi-Plant, Multi-Warehouse Environment with Extensible Capacities,
International Journal of Production Economics, Vol. 87, 99-113.
Lewin., R., (2009). Production /Operations Management: Contemporary Policy for Managing
Operating Systems, Cambridge: Harvard University Press
Mula, J., Poler, R. & Garcia, J.P., (2012), MRP with Flexible Constraints: A Fuzzy
Mathematical Programming Approach, Fuzzy Sets and Systems, Vol. 157, 74-97.
Orga, C.C (2006). Production Management: A Quantitative Approach, Enugu: Veamaks
Publishers
Salomon, M., (2011) “Deterministic lotsizing models for production planning”, Netherlands:
PhD. Thesis, Erasmus Universiteit Rotterdam.
Sánchez, A. M., & Pérez, M. P. (2001). Lean indicators and manufacturing strategies.
International Journal of Operations & Production Management, 21(11), 1433-1452.
Vollman, T.E., Berry, W.L., & Whybark, D .C. (2010) “Manufacturing Planning and Control
Systems”, (3rd ed), New York: Irwin.
Page 14
International Journal of Business and Management Review
Vol.4, No.1, pp.11-32, February 2016
___Published by European Centre for Research Training and Development UK (www.eajournals.org)
24 ISSN: 2052-6393(Print), ISSN: 2052-6407(Online)
APPENDIX 1
Table 1.1a: Turnover Equation.
Turnover: = a (INVT, PRT, BGT, TECH, EXCHR, IMPᵼ-1, FAST, CAST) et-----------------(i)
Profitability Indicators of Flour Mills of Nigeria Plc (1990-2014)
YEAR TNOR INVT PRT BGT TECH EXCHR IMPᵼ-1 FAST CAST
1990 399715 206192 79686 306916 0 8.04 47707900 283546 35205
1991 1199144 268643 109823 399578 1 9.91 89011200 369102 45975
1992 3181699 349932 129237 521170 2 17.10 14790340 481535 59640
1993 415732 455998 145304 677565 3 21.89 16809340 625770 78285
1994 5387776 593798 183425 885945 4 21.89 16478280 818836 100636
1995 7084189 774195 200119 1146751 5 21.89 75712280 1058475 134218
1996 9079137 1007200 235794 1511085 6 21.89 75712270 1398033 167689
1997 12173431 1315385 275794 1929167 7 22.89 56462260 1777390 234965
1998 15063981 1706214 327565 2604089 8 22.89 83941690 2416710 268103
1999 21456312 2239942 379816 3183411 9 92.69 86451470 2915461 436792
2000 23735633 2878700 602878 4628855 10 102.1 9649390 4334669 367518
2001 30922902 3841126 390828 4355615 11 111.9 13569590 3976256 942857
2002 43306511 4794974 1537104 5500059 12 121.9 15825292 5103860 159696
2003 42250029 6728404 254995 6295028 13 129.4 19581134 5067655 2668874
2004 53563211 5525509 1370485 7130930 14 129.4 12254462 5958094 2574855
2005 40017290 7954274 1027108 117830866 15 133.5 15886930 5261612 437538
2006 50985842 12899963 1304675 12891483 16 132.1 15907521 10770073 2121410
2007 64864235 11887898 3015210 17289423 17 128.7 14682982 13785283 3804140
2008 104051379 14924094 4324760 29395534 18 131.4 15492489 21951793 7443741
2009 147388331 20739600 2469512 23660692 19 130.7 15360997 22868239 4171386
2010 157094863 22024084 13370731 64307716 20 130.3 15178823 35384783 5359078
2011 161796284 23260224 10095752 54153698 21 155.8 15344103 42063788 26657467
2012 0 28787944 -12339687 847475251 22 156.7 15261463 79495468 29867608
2013 225629747 40992727 8440528 113405605 23 156.7 15302783 92601111 27326132
2014 245701366 45371104 11113370 90606309 24 157.3 15282123 98943111 25143051
Sources: Nigeria Stock Exchange Fact Book ( Various Issues) Publication for different Flour
Milling Firms CBN Statistical Bulletin (Various Issues)
Page 15
International Journal of Business and Management Review
Vol.4, No.1, pp.11-32, February 2016
___Published by European Centre for Research Training and Development UK (www.eajournals.org)
25 ISSN: 2052-6393(Print), ISSN: 2052-6407(Online)
APPENDIX 2
Table 1.1b: Turnover Equation.
Turnover: = a (INVT, PRT, BGT, TECH, EXCHR, IMPᵼ-1, FAST, CAST) et-----------------(i)
Profitability Indicators of Dangote Flour Mills Plc (1990-2014)
YEAR TNOR INVT PRT BGT TECH EXCHR IMPᵼ-1 FAST CAST
1990 1667126 54902 254471 897503 0 8.04 47707900 551032 324846
1991 2186756 71522 332087 1168655 1 9.91 89011200 775304 423148
1992 2814623 93183 431327 1523855 2 17.10 14790340 877791 551389
1993 3745645 121384 564933 1982111 3 21.89 16809340 1448121 718054
1994 4698223 158166 729049 2589454 4 21.89 16478280 1185251 936116
1995 6238707 205986 965750 3356878 5 21.89 75712280 3159111 1218046
1996 7855980 268511 1221396 4411485 6 21.89 75712270 3966643 1590301
1997 10860141 349446 1675853 5659149 7 22.89 56462260 5510689 2063837
1998 12707801 456088 1988334 7575305 8 22.89 83941690 6389239 2707065
1999 19872622 592251 3039225 9402143 9 92.69 86451470 10142828 3484447
2000 18250781 776012 2925778 13323772 10 102.1 9649390 9024888 4636748
2001 21494464 1000741 3152671 14882658 11 111.9 13569590 11260768 5816593
2002 15007097 1327294 2698885 25088658 12 121.9 15825292 6789007 8093651
2003 27981831 1674928 3606456 32433102 13 129.4 19581134 15732529 9356129
2004 39623810 2138288 2235977 46686687 14 129.4 12254462 18571245 13861857
2005 45399901 5106133 740685 46686687 15 133.5 15886930 19311930 27374757
2006 35672696 4289231 721983 51264394 16 132.1 15907521 14153520 59841510
2007 31303845 1094309 290335 23001803 17 128.7 14682982 21907492 1094309
2008 30109610 337950 1704092 23489809 18 131.4 15492489 23157859 263950
2009 41839919 460695 5359861 27210276 19 130.7 15360997 26749581 463695
2010 42695383 2829608 3753248 29318762 20 130.3 15178823 26489154 2829608
2011 38679844 2556286 920383 27267763 21 155.8 15344103 31199169 2472543
2012 29859976 9785585 -3138119 57832629 22 156.7 15261463 36916232 9613645
2013 14050996 13359244 -7217001 51925552 23 156.7 15302783 36744670 24768875
2014 41265972 15997510 -6119400 32965300 24 157.3 15282123 36830451 20923122
Sources:
Sources: Nigeria Stock Exchange Fact Book ( Various Issues) Publication for different Flour
Milling Firms CBN Statistical Bulletin (Various Issues)
Page 16
International Journal of Business and Management Review
Vol.4, No.1, pp.11-32, February 2016
___Published by European Centre for Research Training and Development UK (www.eajournals.org)
26 ISSN: 2052-6393(Print), ISSN: 2052-6407(Online)
APPENDIX 3
Table 1.1c: Turnover Equation.
Turnover: = a (INVT, PRT, BGT, TECH, EXCHR, IMPᵼ-1, FAST, CAST) et-----------------(i)
Profitability Indicators of Honeywell Flour Mills Plc (1990-2014)
YEAR TNOR INVT PRT BGT TECH EXCHR IMPᵼ-1 FAST CAST
1990 843643 206192 16769 10623 0 8.04 47707900 236008 151401
1991 1097723 268643 21893 138773 1 9.91 89011200 307533 197345
1992 1433206 349932 28414 180797 2 17.10 14790340 400494 256858
1993 1859964 455998 37265 235523 3 21.89 16809340 522104 335177
1994 2439654 593798 47978 306867 4 21.89 16478280 679379 435398
1995 3140238 774195 63817 399701 5 21.89 75712280 886934 570131
1996 4178724 1007200 80115 520900 6 21.89 75712270 1151203 736066
1997 5241991 1315385 111337 678202 7 22.89 56462260 1509598 974326
1998 7286896 1706214 129009 884499 8 22.89 83941690 1944012 1233873
1999 8439076 2239942 205001 1150106 9 92.69 86451470 2584782 1689106
2000 13421614 2878700 182027 1503392 10 102.1 9649390 3247255 2012513
2001 11895615 3841126 432977 1946926 11 111.9 13569590 4507091 3054804
2002 28369226 4794974 113106 2563249 12 121.9 15825292 6234673 2982734
2003 28369226 6728404 168827 3277530 13 129.4 19581134 7286599 3126873
2004 7,317,620 5525509 170,492 4412216 14 129.4 12254462 5,182,747 2838596
2005 7,790,058 7968618 167,161 5420372 15 133.5 15886930 9,390,452 3415149
2006 13146833 2468618 722557 7816277 16 132.1 15907521 2948121 4868156
2007 15599805 2077229 636343 8444840 17 128.7 14682982 3584465 4860375
2008 18773815 4934457 816452 12640469 18 131.4 15492489 5190480 7449989
2009 25964192 4032490 209107 12865953 19 130.7 15360997 5399587 8137475
2010 28483098 3285067 1948396 32141154 20 130.3 15178823 14275123 17866031
2011 29310102 3226626 2412769 35293612 21 155.8 15344103 15815570 19478042
2012 38052227 4931032 2787775 64946292 22 156.7 15261463 17016014 18916157
2013 45709382 10009275 2843520 73990561 23 156.7 15302783 18553083 20468350
2014 55084305 11287037 3351564 84435687 24 157.3 15282123 20605248 27744989
Sources: Nigeria Stock Exchange Fact Book ( Various Issues) Publication for different Flour Milling Firms CBN Statistical Bulletin(Various Issues)
Page 17
International Journal of Business and Management Review
Vol.4, No.1, pp.11-32, February 2016
___Published by European Centre for Research Training and Development UK (www.eajournals.org)
27 ISSN: 2052-6393(Print), ISSN: 2052-6407(Online)
APPENDIX 4
Table 2.2a: Profitability Equation.
Profitability: = a(CPROD,FAST, CAST, EXCHR, TNOR, INVT, PRCUST, TECH,CAPU) et-
----(ii)
Profitability Indicators of Flour Mills of Nigeria Plc (1990-2014)
YEAR PRT CPROD FAST CAST EXCHR TNOR INVT PRCUST TECH CAPU
1990 79686 2253564 236008 151401 8.04 399715 206192 731792 0 52.0
1991 109823 2927336 307533 197345 9.91 1199144 268643 953303 1 52.8
1992 129237 3833357 400494 256858 17.10 3181699 349932 1242073 2 52.7
1993 145304 4948652 522104 335177 21.89 415732 455998 1617837 3 52.7
1994 183425 6551419 679379 435398 21.89 5387776 593798 2108383 4 52.6
1995 200119 8294537 886934 570131 21.89 7084189 774195 2745127 5 52.5
1996 235794 11359720 1151203 736066 21.89 9079137 1007200 4655360 6 52.4
1997 275794 13523891 1509598 974326 22.89 12173431 1315385 6084707 7 52.3
1998 327565 18205934 1944012 1233873 22.89 15063981 1706214 7881374 8 52.2
1999 379816 21076496 2584782 1689106 92.69 21456312 2239942 10372746 9 52
2000 602878 23132755 3247255 2012513 102.1 23735633 2878700 13271376 10 51.8
2001 390828 30532074 4507091 3054804 111.9 30922902 3841126 17846863 11 51.5
2002 1537104 31268078 6234673 2982734 121.9 43306511 4794974 21967266 12 51.2
2003 254995 31679423 7286599 3126873 129.4 42250029 6728404 31573323 13 51.0
2004 1370485 35238466 5,182,747 2838596 129.4 53563211 5525509 34328475 14 51.6
2005 1027108 44959132 9,390,452 3415149 133.5 40017290 7954274 45095629 15 50.8
2006 1304675 49823543 2948121 4868156 132.1 50985842 12899963 39712052 16 50.9
2007 3015210 52688223 3584465 4860375 128.7 64864235 11887898 67061759 17 51.0
2008 4324760 91688824 5190480 7449989 131.4 104051379 14924094 94411465 18 51.3
2009 2469512 133311104 5399587 8137475 130.7 147388331 20739600 135324317 19 51.4
2010 13370731 22648927 14275123 17866031 130.3 157094863 22024084 162003056 20 51.1
2011 10095752 92681637 15815570 19478042 155.8 161796284 23260224 188681796 21 51.3
2012
-
12339687 162714347 17016014 18916157 156.7 157110371 28787944 169372405 22 51.3
2013 8440528 202445764 18553083 20468350 156.7 225629747 40992727 207991186 23 51.3
2014 11113370 216422044 20605248 27744989 157.3 245701366 45371104 213169770 24 51.3
Sources: Nigeria Stock Exchange Fact Book ( Various Issues) Publication for different Flour
Milling Firms CBN Statistical Bulletin(Various Issues)
Page 18
International Journal of Business and Management Review
Vol.4, No.1, pp.11-32, February 2016
___Published by European Centre for Research Training and Development UK (www.eajournals.org)
28 ISSN: 2052-6393(Print), ISSN: 2052-6407(Online)
APPENDIX 5
Table 2.2b: Profitability Equation.
Profitability:= a(CPROD,FAST, CAST, EXCHR, TNOR, INVT, PRCUST, TECH,CAPU) et-
------(ii)
Profitability Indicators of Dangote Flour Mills Plc (1990-2014)
YEAR PRT CPROD FAST CAST EXCHR TNOR INVT PRCUST TECH CAPU
1990 254471 96699 551032 324846 8.04 1667126 54902 1297530 0 52.0
1991 332087 126106 775304 423148 9.91 2186756 71522 1691182 1 52.8
1992 431327 163991 877791 551389 17.10 2814623 93183 2201409 2 52.7
1993 564933 214328 1448121 718054 21.89 3745645 121384 2782138 3 52.7
1994 729049 277644 1185251 936116 21.89 4698223 158166 3732088 4 52.6
1995 965750 365341 3159111 1218046 21.89 6238707 205986 4884325 5 52.5
1996 1221396 467592 3966643 1590301 21.89 7855980 268511 6311940 6 52.4
1997 1675853 628429 5510689 2063837 22.89 10860141 349446 8341035 7 52.3
1998 1988334 774347 6389239 2707065 22.89 12707801 456088 105494787 8 52.2
1999 3039225 1110937 10142828 3484447 92.69 19872622 592251 14428318 9 52
2000 2925778 1212109 9024888 4636748 102.1 18250781 776012 17356043 10 51.8
2001 3152671 1313280 11260768 5816593 111.9 21494464 1000741 25928911 11 51.5
2002 2698885 1515622 6789007 8093651 121.9 15007097 1327294 26139225 12 51.2
2003 3606456 1920307 15732529 9356129 129.4 27981831 1674928 27312555 13 51.0
2004 2235977 3811142 18571245 13861857 129.4 39623810 2138288 27489661 14 51.6
2005 740685 5152188 19311930 27374757 133.5 45399901 5106133 27843874 15 50.8
2006 721983 5063299 14153520 59841510 132.1 35672696 4289231 27135449 16 50.9
2007 290335 5107744 21907492 1094309 128.7 31303845 1094309 28552300 17 51.0
2008 1704092 5295523 23157859 263950 131.4 30109610 337950 25718597 18 51.3
2009 5359861 31842774 26749581 463695 130.7 41839919 460695 32155962 19 51.4
2010 3753248 33659644 26489154 2829608 130.3 42695383 2829608 33019066 20 51.1
2011 920383 31372618 31199169 2472543 155.8 38679844 2556286 32634410 21 51.3
2012
-
3138119 39310274 36916232 9613645 156.7 29859976 9785585 50976880 22 51.3
2013
-
7217001 42699112 36744670 24768875 156.7 14050996 13359244 78497790 23 51.3
2014
-
6119400 48204693 36830451 20923122 157.3 41265972 15997510 49737335 24 51.3
Sources: Nigeria Stock Exchange Fact Book ( Various Issues) Publication for different Flour Milling Firms CBN Statistical Bulletin(Various Issues)
Page 19
International Journal of Business and Management Review
Vol.4, No.1, pp.11-32, February 2016
___Published by European Centre for Research Training and Development UK (www.eajournals.org)
29 ISSN: 2052-6393(Print), ISSN: 2052-6407(Online)
APPENDIX 6
Table 2.2c: Profitability Equation.
Profitability: = a(CPROD,FAST, CAST, EXCHR, TNOR, INVT, PRCUST, TECH,CAPU) et-
----(ii)
Profitability Indicators of Honeywell Flour Mill Plc (1990-2014)
YEAR PRT CPROD FAST CAST EXCHR TNOR INVT PRCUST TECH CAPU
1990 16769 146523 236008 151401 8.04 843643 206192 777372 0 52.0
1991 21893 190881 307533 197345 9.91 1097723 268643 1012561 1 52.8
1992 28414 248688 400494 256858 17.10 1433206 349932 1319555 2 52.7
1993 37265 323956 522104 335177 21.89 1859964 455998 1718129 3 52.7
1994 47978 422137 679379 435398 21.89 2439654 593798 2240534 4 52.6
1995 63817 549640 886934 570131 21.89 3140238 774195 2913854 5 52.5
1996 80115 716772 1151203 736066 21.89 4178724 1007200 3807749 6 52.4
1997 111337 932147 1509598 974326 22.89 5241991 1315385 4933813 7 52.3
1998 129009 1218167 1944012 1233873 22.89 7286896 1706214 6489436 8 52.2
1999 205001 1578278 2584782 1689106 92.69 8439076 2239942 8312003 9 52
2000 182027 2076228 3247255 2012513 102.1 13421614 2878700 11156306 10 51.8
2001 432977 2658606 4507091 3054804 111.9 11895615 3841126 13779703 11 51.5
2002 113106 3570077 6234673 2982734 121.9 28369226 4794974 19689214 12 51.2
2003 168827 4405740 7286599 3126873 129.4 28369226 6728404 21649895 13 51.0
2004
170,492 6304490 5,182,747 2838596 129.4 7,317,620 5525509 22561355 14 51.6
2005 167,161 6912730 9,390,452 3415149 133.5 7,790,058 7968618 22738435 15 50.8
2006 722557 10862148 2948121 4868156 132.1 13146833 2468618 23604274 16 50.9
2007 636343 13245102 3584465 4860375 128.7 15599805 2077229 23611031 17 51.0
2008 816452 16345616 5190480 7449989 131.4 18773815 4934457 23677516 18 51.3
2009 209107 19497273 5399587 8137475 130.7 25964192 4032490 23764546 19 51.4
2010 1948396 22648927 14275123 17866031 130.3 28483098 3285067 23590485 20 51.1
2011 2412769 24081476 15815570 19478042 155.8 29310102 3226626 24889278 21 51.3
2012 2787775 30934899 17016014 18916157 156.7 38052227 4931032 42500517 22 51.3
2013 2843520 37788322 18553083 20468350 156.7 45709382 10009275 39211063 23 51.3
2014 3351564 44626674 20605248 27744989 157.3 55084305 11287037 45789971 24 51.3
Sources: Nigeria Stock Exchange Fact Book (Various Issues) Publication for different
Flour Milling Firms CBN Statistical Bulletin(Various Issues)
Page 20
International Journal of Business and Management Review
Vol.4, No.1, pp.11-32, February 2016
___Published by European Centre for Research Training and Development UK (www.eajournals.org)
30 ISSN: 2052-6393(Print), ISSN: 2052-6407(Online)
APPENDIX 7
Table 3.3a: Budget Equation.
Budget : = a(INV, PRT, TNOR, CAST, FAST, CAPU, EXCHR) et-----------(iii)
Profitability Indicators of Flour Mill of Nigeria Plc (1990-2014)
YEAR BGT INV PRT TNOR CAST FAST CAPU EXCHR
1990 306916 23326 79686 399715 35205 283546 52.0 8.04
1991 399578 30343 109823 1199144 45975 369102 52.8 9.91
1992 521170 39635 129237 3181699 59640 481535 52.7 17.10
1993 677565 51395 145304 415732 78285 625770 52.7 21.89
1994 885945 67109 183425 5387776 100636 818836 52.6 21.89
1995 1146751 88276 200119 7084189 134218 1058475 52.5 21.89
1996 1511085 113052 235794 9079137 167689 1398033 52.4 21.89
1997 1929167 151776 275794 12173431 234965 1777390 52.3 22.89
1998 2604089 187379 327565 15063981 268103 2416710 52.2 22.89
1999 3183411 267950 379816 21456312 436792 2915461 52 92.69
2000 4628855 294186 602878 23735633 367518 4334669 51.8 102.1
2001 4355615 319359 390828 30922902 942857 3976256 51.5 111.9
2002 5500059 396199 1537104 43306511 159696 5103860 51.2 121.9
2003 6295028 1227373 254995 42250029 2668874 5067655 51.0 129.4
2004 7130930 1050055 1370485 53563211 2574855 5958094 51.6 129.4
2005 117830866 1050055 1027108 40017290 437538 5261612 50.8 133.5
2006 12891483 1050796 1304675 50985842 2121410 10770073 50.9 132.1
2007 17289423 1513320 3015210 64864235 3804140 13785283 51.0 128.7
2008 29395534 999999 4324760 104051379 7443741 21951793 51.3 131.4
2009 23660692 404500 2469512 147388331 4171386 22868239 51.4 130.7
2010 64307716 240000 13370731 157094863 5359078 35384783 51.1 130.3
2011 54153698 4307969 10095752 161796284 26657467 42063788 51.3 155.8
2012 847475251 24705717 -12339687 0 29867608 79495468 51.3 156.7
2013 113405605 24780625 8440528 225629747 27326132 92601111 51.3 156.7
2014 90606309 30925712 11113370 245701366 25143051 98943111 51.3 157.3
Sources: Nigeria Stock Exchange Fact Book ( Various Issues) Publication for different Flour
Milling Firms CBN Statistical Bulletin(Various Issues)
Page 21
International Journal of Business and Management Review
Vol.4, No.1, pp.11-32, February 2016
___Published by European Centre for Research Training and Development UK (www.eajournals.org)
31 ISSN: 2052-6393(Print), ISSN: 2052-6407(Online)
APPENDIX 8
Table 3.3b: Budget Equation.
Budget: = a(INV, PRT, TNOR, CAST, FAST, CAPU, EXCHR) et-----------(iii)
Profitability Indicators of Dangote Flour Mill Plc (1990-2014)
YEAR BGT INV PRT TNOR CAST FAST CAPU EXCHR
1990 897503 2577 254471 1667126 324846 551032 52.0 8.04
1991 1168655 3363 332087 2186756 423148 775304 52.8 9.91
1992 1523855 4373 431327 2814623 551389 877791 52.7 17.10
1993 1982111 5718 564933 3745645 718054 1448121 52.7 21.89
1994 2589454 7401 729049 4698223 936116 1185251 52.6 21.89
1995 3356878 9754 965750 6238707 1218046 3159111 52.5 21.89
1996 4411485 12448 1221396 7855980 1590301 3966643 52.4 21.89
1997 5659149 16815 1675853 10860141 2063837 5510689 52.3 22.89
1998 7575305 20528 1988334 12707801 2707065 6389239 52.2 22.89
1999 9402143 29918 3039225 19872622 3484447 10142828 52 92.69
2000 13323772 31665 2925778 18250781 4636748 9024888 51.8 102.1
2001 14882658 68089 3152671 21494464 5816593 11260768 51.5 111.9
2002 25088658 26905 2698885 15007097 8093651 6789007 51.2 121.9
2003 32433102 177362 3606456 27981831 9356129 15732529 51.0 129.4
2004 46686687 469778 2235977 39623810 13861857 18571245 51.6 129.4
2005 46686687 80335 740685 45399901 27374757 19311930 50.8 133.5
2006 51264394 0 721983 35672696 59841510 14153520 50.9 132.1
2007 23001803 7553637 290335 31303845 1094309 21907492 51.0 128.7
2008 23489809 7553637 1704092 30109610 263950 23157859 51.3 131.4
2009 27210276 7463637 5359861 41839919 463695 26749581 51.4 130.7
2010 29318762 7463637 3753248 42695383 2829608 26489154 51.1 130.3
2011 27267763 7750559 920383 38679844 2472543 31199169 51.3 155.8
2012 57832629 00 -3138119 29859976 9613645 36916232 51.3 156.7
2013 51925552 00 -7217001 14050996 24768875 36744670 51.3 156.7
2014 32965300 00 -6119400 41265972 20923122 36830451 51.3 157.3
Sources: Nigeria Stock Exchange Fact Book ( Various Issues) Publication for different Flour
Milling Firms CBN Statistical Bulletin(Various Issues)
Page 22
International Journal of Business and Management Review
Vol.4, No.1, pp.11-32, February 2016
___Published by European Centre for Research Training and Development UK (www.eajournals.org)
32 ISSN: 2052-6393(Print), ISSN: 2052-6407(Online)
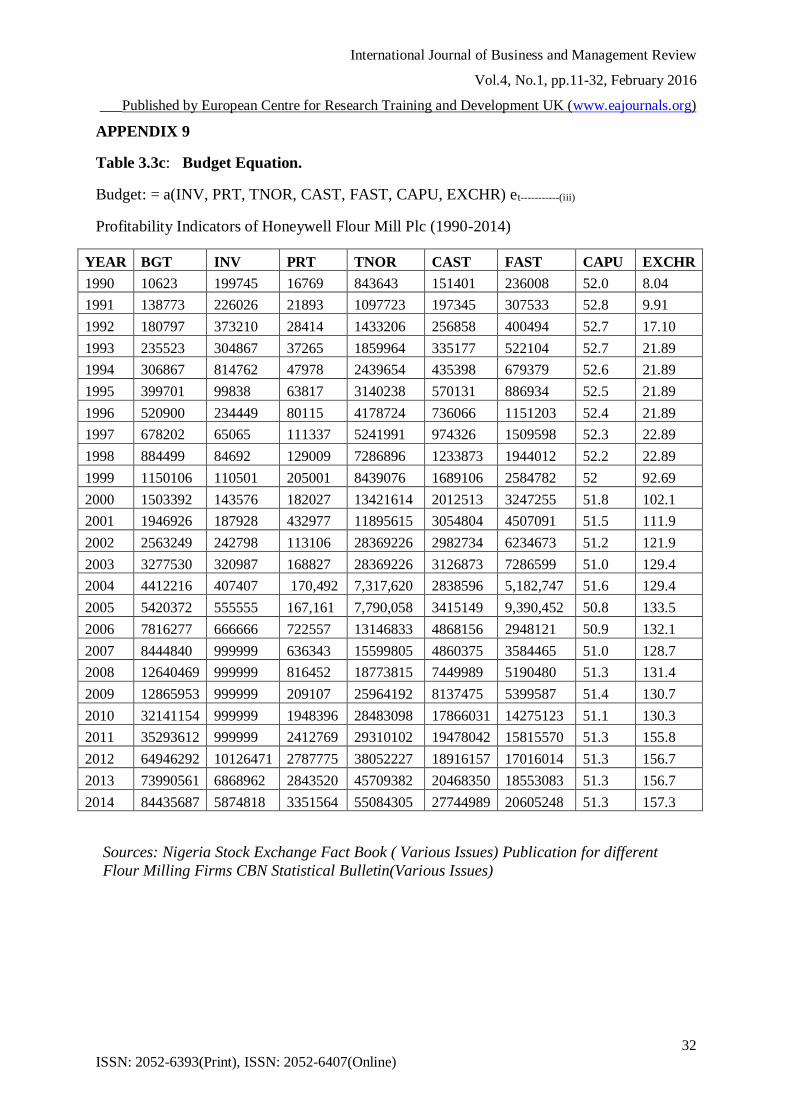
APPENDIX 9
Table 3.3c: Budget Equation.
Budget: = a(INV, PRT, TNOR, CAST, FAST, CAPU, EXCHR) et-----------(iii)
Profitability Indicators of Honeywell Flour Mill Plc (1990-2014)
YEAR BGT INV PRT TNOR CAST FAST CAPU EXCHR
1990 10623 199745 16769 843643 151401 236008 52.0 8.04
1991 138773 226026 21893 1097723 197345 307533 52.8 9.91
1992 180797 373210 28414 1433206 256858 400494 52.7 17.10
1993 235523 304867 37265 1859964 335177 522104 52.7 21.89
1994 306867 814762 47978 2439654 435398 679379 52.6 21.89
1995 399701 99838 63817 3140238 570131 886934 52.5 21.89
1996 520900 234449 80115 4178724 736066 1151203 52.4 21.89
1997 678202 65065 111337 5241991 974326 1509598 52.3 22.89
1998 884499 84692 129009 7286896 1233873 1944012 52.2 22.89
1999 1150106 110501 205001 8439076 1689106 2584782 52 92.69
2000 1503392 143576 182027 13421614 2012513 3247255 51.8 102.1
2001 1946926 187928 432977 11895615 3054804 4507091 51.5 111.9
2002 2563249 242798 113106 28369226 2982734 6234673 51.2 121.9
2003 3277530 320987 168827 28369226 3126873 7286599 51.0 129.4
2004 4412216 407407 170,492 7,317,620 2838596 5,182,747 51.6 129.4
2005 5420372 555555 167,161 7,790,058 3415149 9,390,452 50.8 133.5
2006 7816277 666666 722557 13146833 4868156 2948121 50.9 132.1
2007 8444840 999999 636343 15599805 4860375 3584465 51.0 128.7
2008 12640469 999999 816452 18773815 7449989 5190480 51.3 131.4
2009 12865953 999999 209107 25964192 8137475 5399587 51.4 130.7
2010 32141154 999999 1948396 28483098 17866031 14275123 51.1 130.3
2011 35293612 999999 2412769 29310102 19478042 15815570 51.3 155.8
2012 64946292 10126471 2787775 38052227 18916157 17016014 51.3 156.7
2013 73990561 6868962 2843520 45709382 20468350 18553083 51.3 156.7
2014 84435687 5874818 3351564 55084305 27744989 20605248 51.3 157.3
Sources: Nigeria Stock Exchange Fact Book ( Various Issues) Publication for different
Flour Milling Firms CBN Statistical Bulletin(Various Issues)