34
Production Possibility Curve Chapter 2-1
| Date post: | 27-Dec-2015 |
| Category: |
Documents |
| Upload: | allen-perry |
| View: | 221 times |
| Download: | 2 times |

Production Possibility Curve
Chapter 2-1
Laugher Curve
Q. How many Marxists does it take to screw in a light bulb?
A. None.
The bulb contains within itself the seeds of its own revolution.

Introduction
An economic system has to solve three coordination problems: What, and how much, to produce. How to produce it. For whom to produce it.
Introduction
All economic knowledge can be boiled down to a single phrase:
There ain’t no such thing as a free lunch.
Introduction
Every decision has an opportunity cost – the cost in foregone opportunities.

Introduction
A production possibility curve is used to illustrate opportunity cost.

The Production Possibilities Model
The production possibilities curve shows the trade-offs among choices we make.
The Production Possibility Table
A production possibility table lists a choice's opportunity costs by summarizing what alternative outputs you can achieve with your inputs.
The Production Possibility Table
Output – an output is simply a result of an activity.
Input – an input is what you what you put into a production process to achieve an output.
The Production Possibility Curve for an Individual
A production possibility curve measures the maximum combination of outputs that can be achieved from a given number of inputs.
It slopes downward from left to right.

The Production Possibility Curve for an Individual
Eco
nom
ics
grad
e
100
88
70
4640
58 66 78 94 98History grade
20 hours of history
0 hours of economics
ED
C
B
20 hours of economics 0 hours of historyA
Hours of study in history
Grade inhistory
Hours of study in economics
Grade ineconomics
20 19 18 17 16 15 14 13 12 11 10
9 8 7 6 5 4 3 2 1 0
98 96 94 92 90 88 86 84 82 80 78 76 74 72 70 68 66 64 62 60 58
0 1 2 3 4 5 6 7 8 9 10 11 12 13 14 15 16 17 18 19 20
40 43 46 49 52 55 58 61 64 67 70 73 76 79 82 85 88 91 94 97
100
McGraw-Hill/Irwin © 2004 The McGraw-Hill Companies, Inc., All Rights Reserved.
The Production Possibility Curve for an Individual
The production possibility curve not only represents the opportunity cost concept, it also measures the opportunity cost.

The Production Possibility Curve for an Individual
The production possibility curve demonstrates that:
There is a limit to what you can achieve, given the existing institutions, resources, and technology.
Every choice made has an opportunity cost—you can get more of something only by giving up something else.

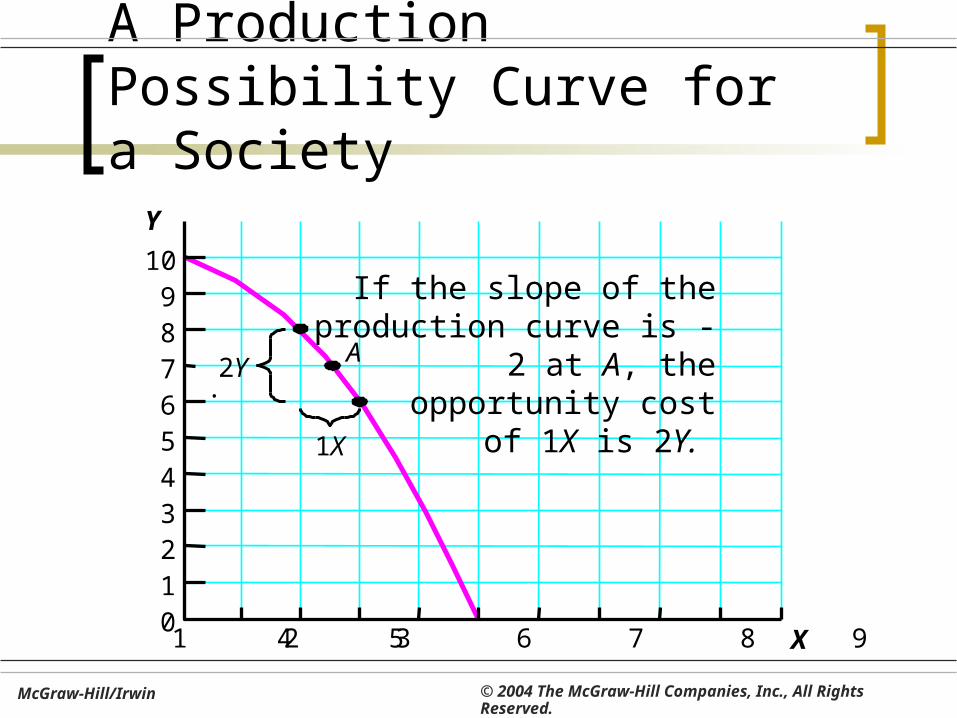
A Production Possibility Curve for a Society
The production possibility curve is generally bowed outward. Some resources are better suited for the
production of some goods than others.
A Production Possibility Curve for a Society
Y
1098
6543210
.2Y
1X
A
X1 2 3 4 5 6 7 8 9
If the slope of the production curve is -2 at A, the
opportunity cost of 1X is 2Y.
7
McGraw-Hill/Irwin © 2004 The McGraw-Hill Companies, Inc., All Rights Reserved.
A Production Possibility Curve for a Society
Comparative advantage explains why opportunity costs increase as the consumption of a good increases. Some resources are better suited for the
production of some goods than to the production of other goods.

A Production Possibilities Table and Curve
% of resources devoted toproduction of guns
Number of guns
% of resources devoted toproduction of butter
Pounds of butter Row
0 20 40 60 80
100
0 4 7 9 11 12
100 80 60 40 20 0
15 14 12 9 5 0
A B C D E F
McGraw-Hill/Irwin © 2004 The McGraw-Hill Companies, Inc., All Rights Reserved.

1211
A Production Possibilities Table and Curve
AB
utte
r
Guns4 7 90
1 gun
5 pounds of butter
5
9
15
3 guns
2 pounds of butter
B
C
D
E
F
14
12
4 guns
1 pound of butter
McGraw-Hill/Irwin © 2004 The McGraw-Hill Companies, Inc., All Rights Reserved.
Increasing Marginal Opportunity Cost
The principle of increasing marginal opportunity cost states that opportunity costs increase the more you concentrate on an activity.
In order to get more of something, one must give up ever-increasing quantities of something else.

Increasing Marginal Opportunity Cost
But
ter
Slope is flat at A. Low opportunity cost of
guns.
Slope is steep at B. High opportunity cost of guns.
Guns
B
A

Efficiency
In production, we’d like to have productive efficiency – achieving as much output as possible from a given amount of inputs or resources.
Efficiency
Efficiency involves achieving a goal as cheaply as possible.
Efficiency has meaning only in relation to a specified goal.
Efficiency
Any point within the production possibility curve represents inefficiency. Inefficiency – getting less output from
inputs which, if devoted to some other activity, would produce more output.

Efficiency
Any point outside the production possibility curve represents something unattainable, given present resources and technology.
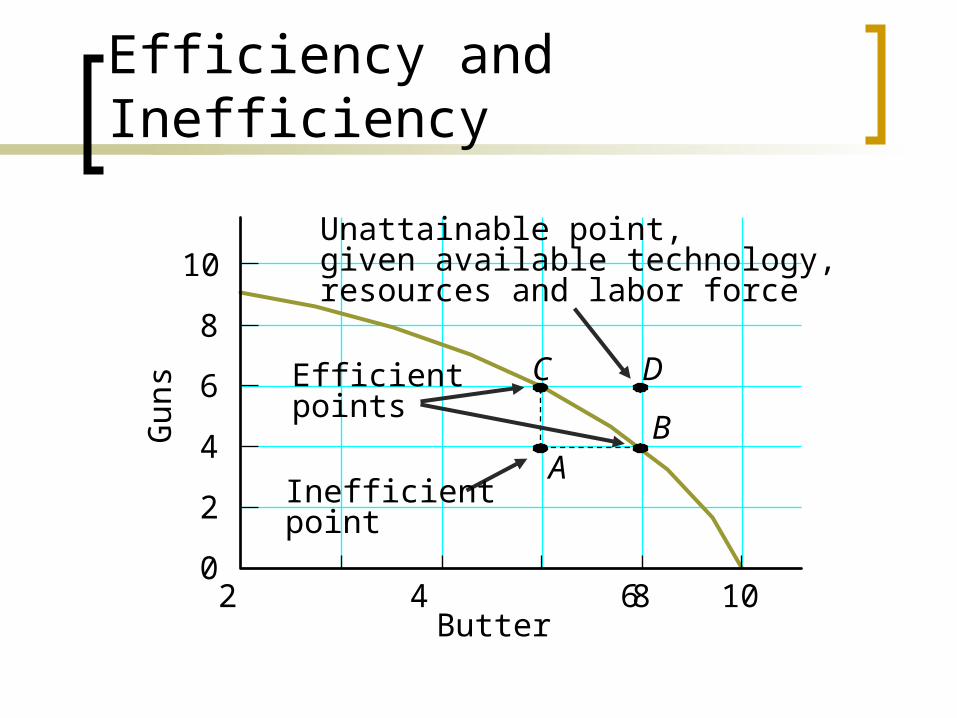
Efficiency and InefficiencyG
uns
10
8
6
4
2
0 2 4 6 8 10
Butter
C D
A
B
Efficientpoints
Inefficientpoint
Unattainable point, given available technology, resources and labor force
Shifts in the Production Possibility Curve
Society can produce more output if: Technology is improved. More resources are discovered. Economic institutions get better at
fulfilling our wants.
Shifts in the Production Possibility Curve
More output is represented by an outward shift in the production possibility curve.
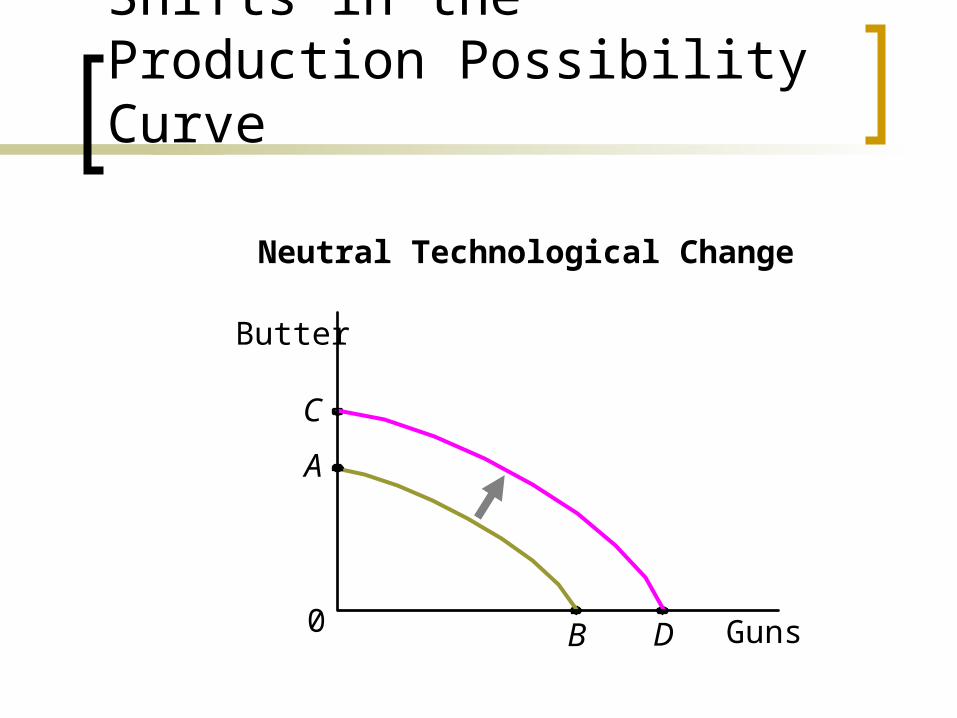
Neutral Technological Change
Butter
A
B Guns0
Shifts in the Production Possibility Curve
C
D

Biased Technological Change
Shifts in the Production Possibility Curve
0
B
A
Butter
Guns
C
Distribution and Production Efficiency
The production possibilities curve focuses on productive efficiency and ignores distribution.
Distribution and Production Efficiency
In our society, more is generally preferred to less and many policies have relatively small distributional effects.
Examples of Shifts in the Production Possibility Curve
Test your understanding: A meteor hits the world and destroys half
the earth’s natural resources. Nanotechnology is perfected that lowers
the cost of manufactured goods.
Examples of Shifts in the Production Possibility Curve
Test your understanding: A new technology is discovered that doubles
the speed at which all goods can be produced.
Global warming increases the cost of producing agricultural goods.
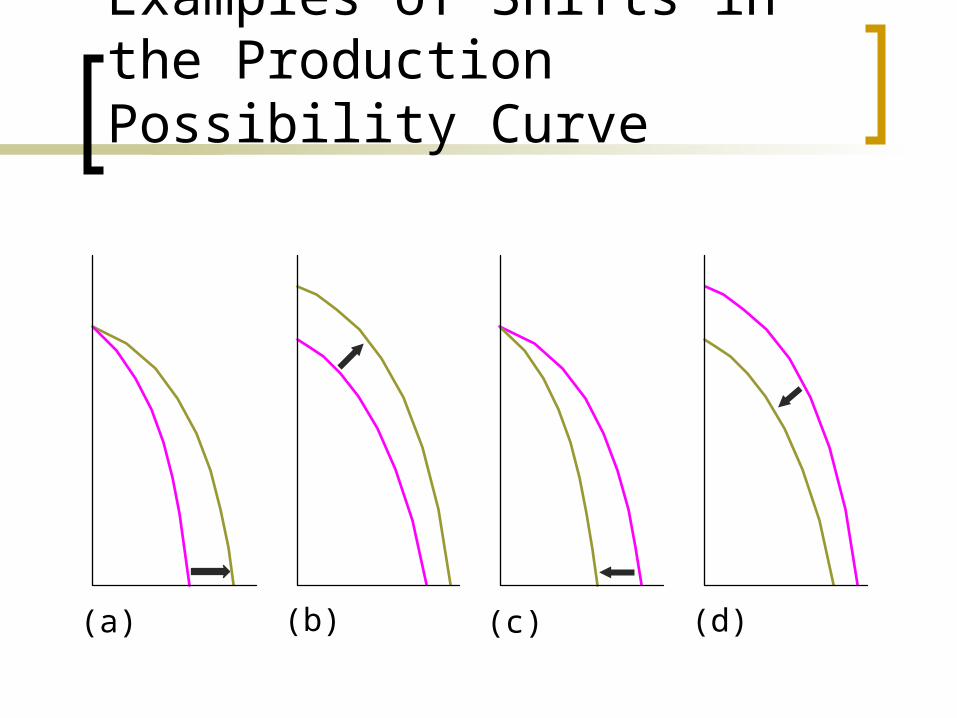
(a) (c) (d)(b)
Examples of Shifts in the Production Possibility Curve


