Production, Purification, Properties and Application of the Cellulases from a Wild type Strain of a Yeast isolate Dissertation for attaining the Degree of Doctor of Natural Sciences At the Faculty of Biology of the Johannes Gutenberg-University Mainz Mohamed Korish Born in Kafr Elsheikh, Egypt Mainz 2003
Transcript
Production, Purification, Properties and Application of
the Cellulases from a Wild type Strain of a Yeast isolate
Dissertation for attaining the Degree of Doctor of Natural Sciences
At the Faculty of Biology of the
Johannes Gutenberg-University Mainz
Mohamed Korish
Born in Kafr Elsheikh, Egypt
Mainz 2003
These investigations were performed at the Institute of Microbiology and
Wine Research at the Johannes Gutenberg-University, Mainz, Germany,
from December 1999 to May 2003 under the supervision of Prof. Dr.
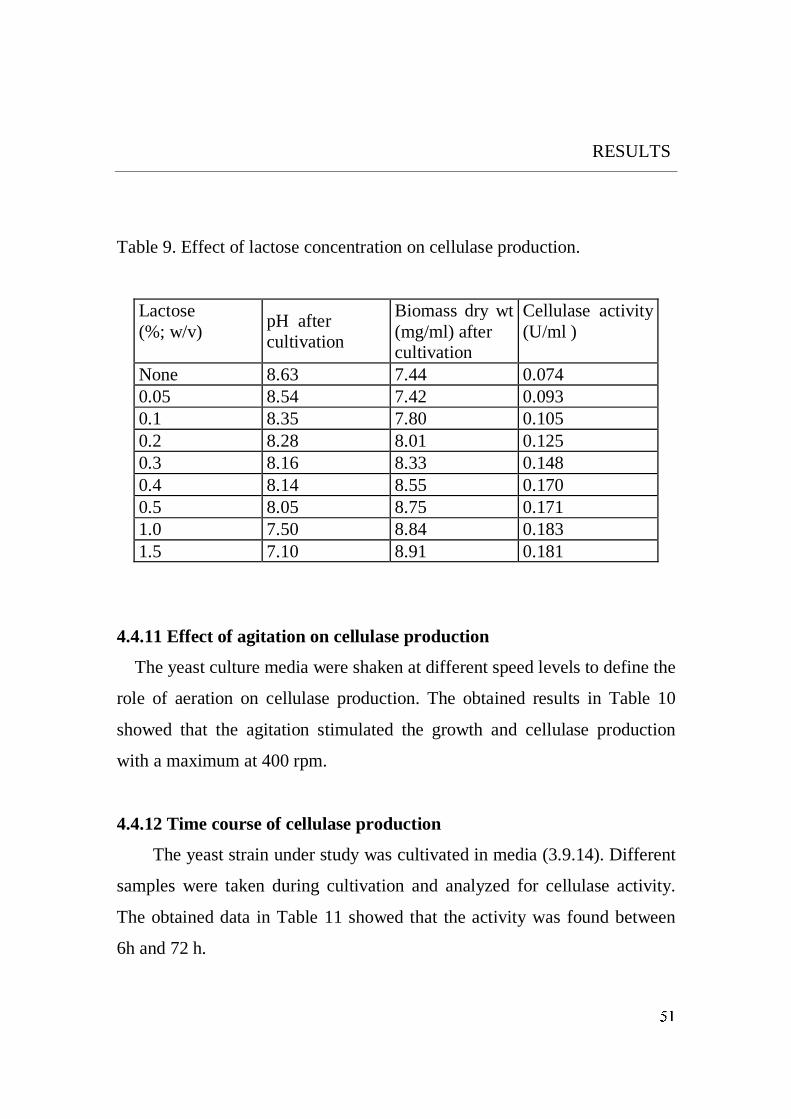
% v/v) and lactose (1%; w/v) were inoculated, incubated with shaking at 200
rpm at 30 oC. Samples were withdrawn at different times to measure the
cellulolytic activity.
3.10 Purification of cellulase
3.10.1 Preparation of crude enzyme
All procedures were carried out at 4 oC. Yeast culture was centrifuged at
10000 x g for 20 min to remove the cells. For partial purification, solid
ammonium sulfate (30 % saturation; 176 g/l) was added to the supernatant.
The mixture was centrifuged at 10000 x g for 20 min. The sediment was
discarded. Solid ammonium sulfate was added under stirring to a final
saturation of 80 % (351g/l) saturation. The suspension was stirred for 1 h
and kept overnight. The precipitate was collected by centrifugation at 38000
x g for 30 min. The pellet was dissolved in 20 mM Tris/HCl, pH 7.6 which
contained NaN3 (0.32 g/l) to prevent microbial growth.
For desalting, dialysis was carried out against 20 mM Tris/HCl buffer pH
7.6 overnight at 4 oC under stirring. Finally, the desalted protein solution
was centrifuged at 13000 rpm to remove any undissolved material for 5 min
(Eppendorf centrifuge Model 5415D).
31
METHODS
3.10.2 Chromatography
All purification steps were performed at room temperature, all solutions
used for chromatography and enzyme tests were prepared by dissolving
compounds in water (Millipore ultra-pure water system, Milli-Q Plus 185).
In addition the solutions were filtered through a 0.45 µm filter and degassed
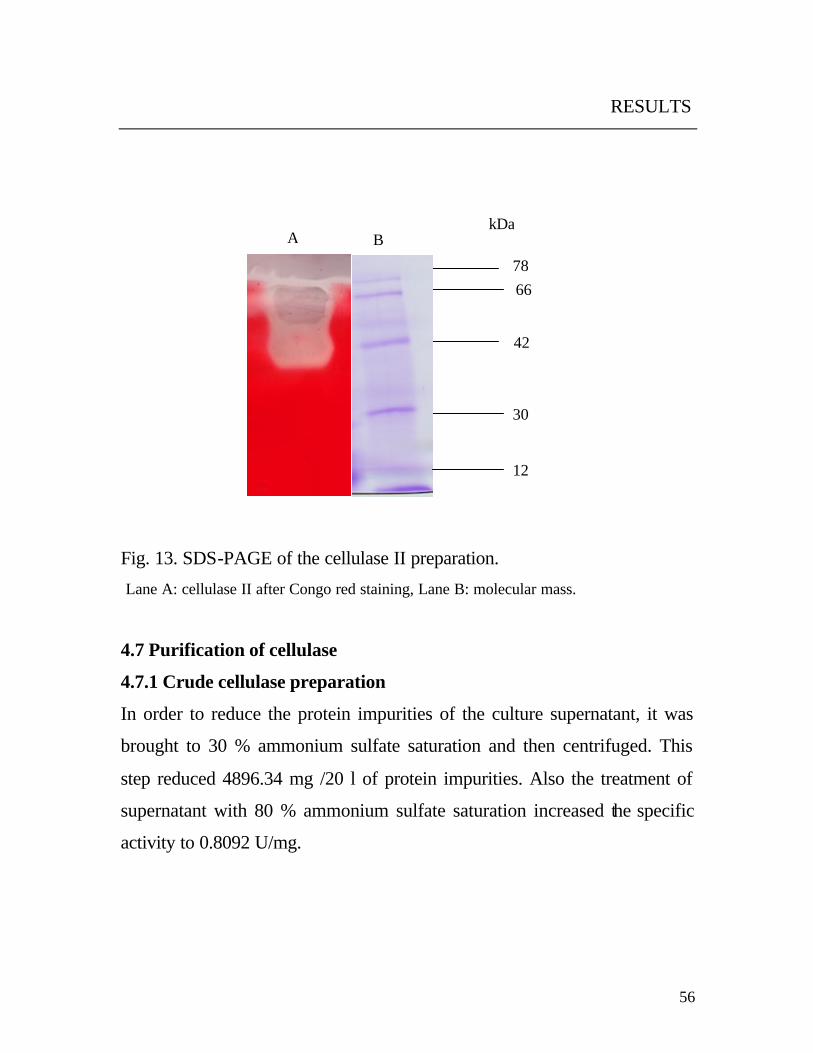
by stirring for 30 min under vacuum. The purity of different enzyme
preparations was tested by SDS-gel electrophoresis.
Enzyme purification was performed with fast protein liquid
chromatography (FPLC, Pharmacia Biotech) at room temperature. The
system was equipped with two columns; Mono Q HR 5/5 for anion-
exchange chromatography and Recourse ISO for hydrophobic interaction
chromatography.
3.10.2.1 Separation by anion-exchange
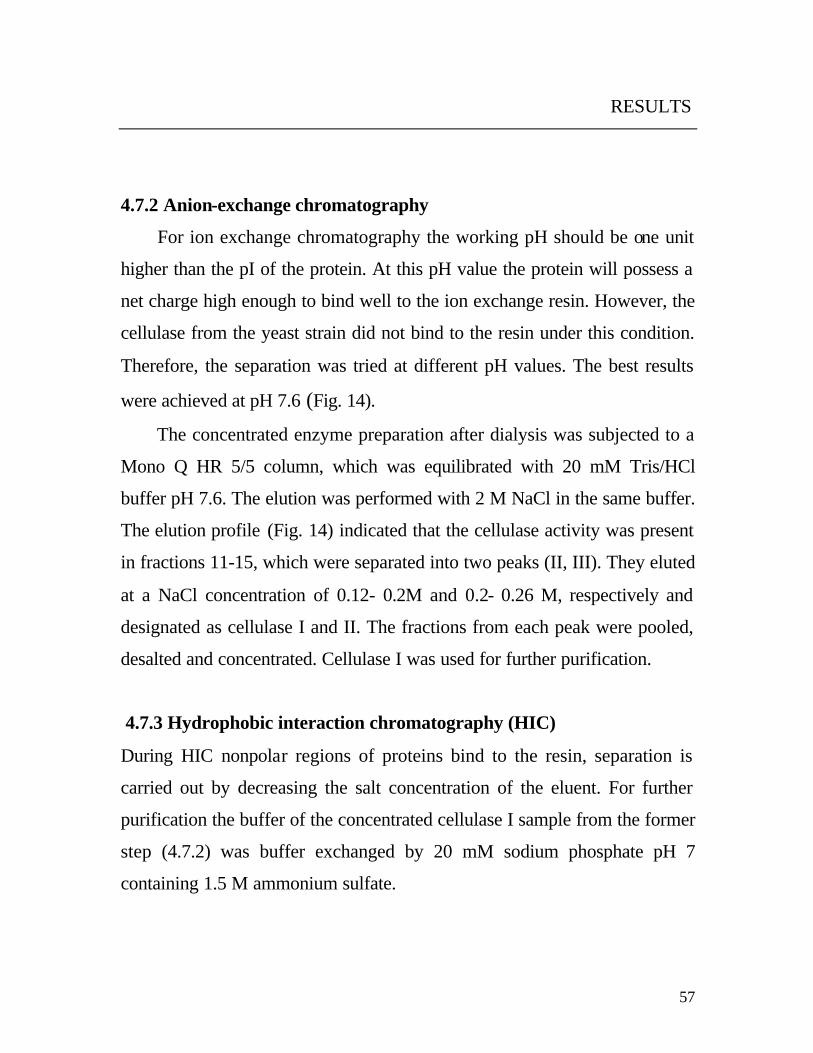
The Mono Q column was equilibrated with 20 mM Tris / HCl buffer at
pH 7.6. Then, the sample was applied. Elution was performed with a linear
gradient of 2 M NaCl in 20 mM Tris/HCl buffer at a flow rate of 1 ml/min.
Fractions (1 ml) were collected and assayed for enzyme activity. The
activity was observed in fractions 11 - 15 as 2 major peaks (PII, PIII, Fig. 14 14). The fractions were pooled, desalted, concentrated and buffer exchanged
by 20 mM sodium phosphate buffer pH 7 by using Amicon centrifugal
filters (Microcon YM-10).
32
METHODS
3.10.2.2 Fractionation by hydrophobic interaction (HIC)
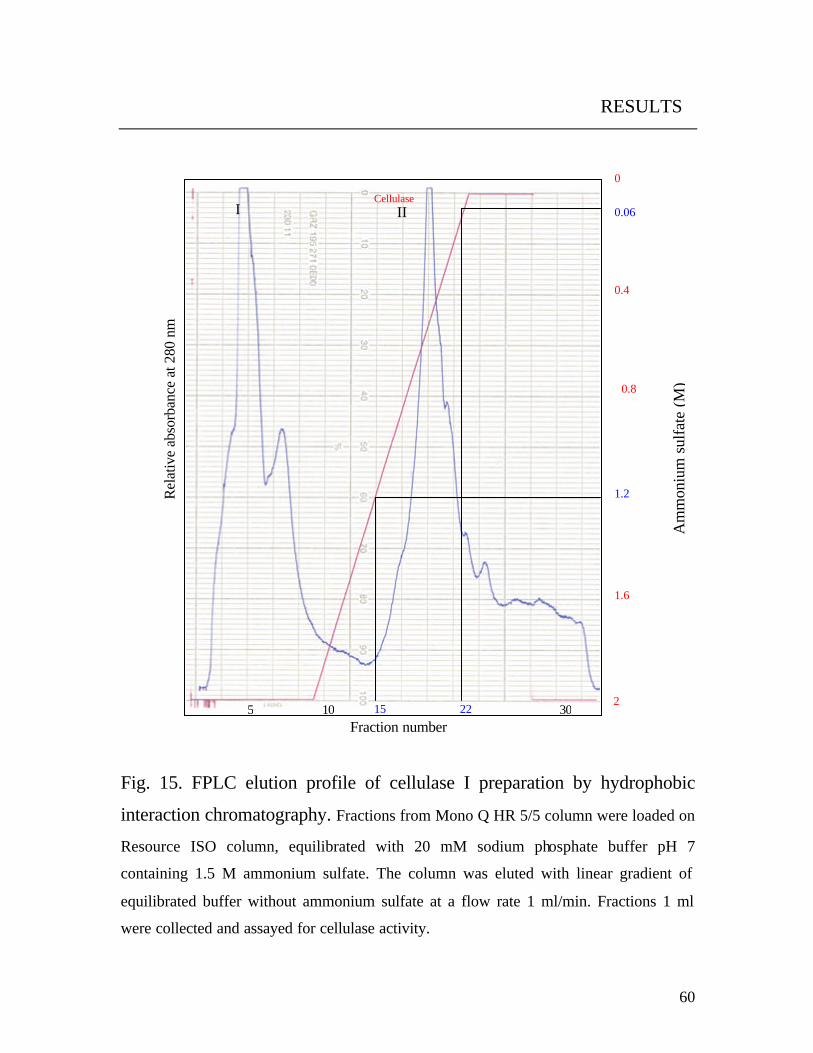
The enzyme solution of peak II (Fig. 15) was adjusted to 1.5 M
ammonium sulfate by adding solid ammonium sulfate and loaded onto the
Resourse ISO column, which was then equilibrated with 20 mM sodium
phosphate buffer pH 7 containing 2 M ammonium sulfate. Elution was
performed with the same buffer but without ammonium sulfate at a flow rate
of 1 ml/min. Fractions (1 ml) were collected and assayed for enzyme
activity. Fractions with enzyme activity were combined, desalted and
concentrated. The buffer was exchanged with 20 mM Tris / HCl buffer, pH
8, by using Amicon centrifugal filters (Microcon YM-10).
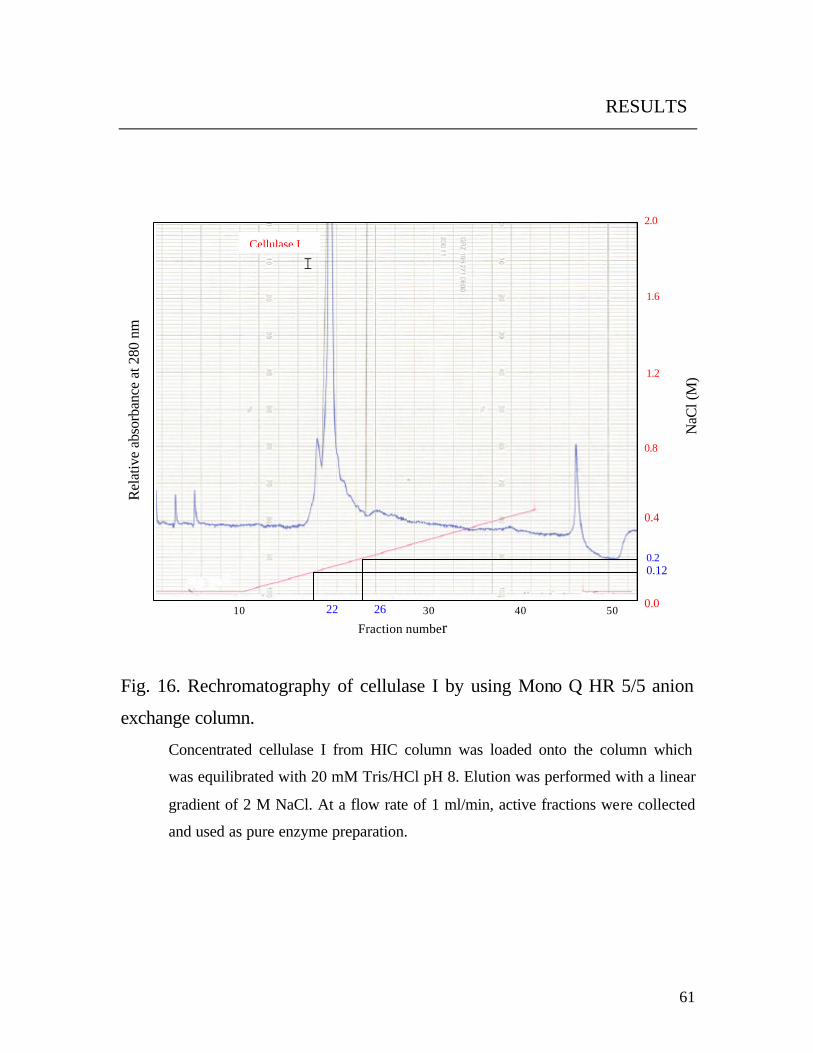
3.10.2.3 Rechromatography
The enzyme preparation of peak II (Fig. 16) was separated with a
Pharmacia Mono Q HR 5/5 column.
The column was equilibrated with 20 mM Tris/HCl buffer, pH 8. Elution
was carried out with a linear gradient of 2M NaCl in 20 mM Tris /HCl
buffer pH 8, at a flow rate of 1 ml/min. Active fractions (peak I, Fig.16 )
were combined, desalted and used as pure enzyme preparation (cellulase I)
for further characterization.
3.11 Characterization of cellulase
All determinations were performed in duplicates and measured against
blank samples.
33
METHODS
3.11.1 pH dependence
The pH value of the purified enzyme solution was adjusted between 2 and
11 by using an Amicon centrifugal filter tube (0.5 ml). The substrate was
solved in the same buffer as the enzyme. The enzyme (0.1 units) was
incubated with 800 µl of substrate (CMC; 1 %; w/v) for 30 min. Afterwards
the enzyme activity was estimated with the DNS method (Miller, 1959). The
following buffers (50 mM) were used: (a) glycin / HCl, pH 2 – 3, (b) citrate
pH 4 – 5, (c) sodium phosphate pH 6 – 7, (b) Tris / HCl pH 8 and glycin /
NaOH pH 9 - 11.
3.11.2 pH stability
The enzyme (0.1 units) was incubated in different buffer at 4 oC for 3h
(3.12.1). The pH was adjusted to 5. The remaining activity was determined
with the DNS standard method (Miller, 1959).
3.11.3 Temperature optimum
The purified enzyme (0.1 units) was incubated with the substrate (1 %
CMC) in citrate buffer (pH 5) at various temperatures from 4 oC to 60 oC for
30 min. The reducing sugars were determined with DNS method.
3.11.4 Thermal stability
The purified enzyme (0.1 units) was incubated in 50 mM citrate buffer at
different temperatures ranging from 4 oC to 70 oC for 30 min. Then the
remaining activities were determined with the DNS standard method.
34
METHODS
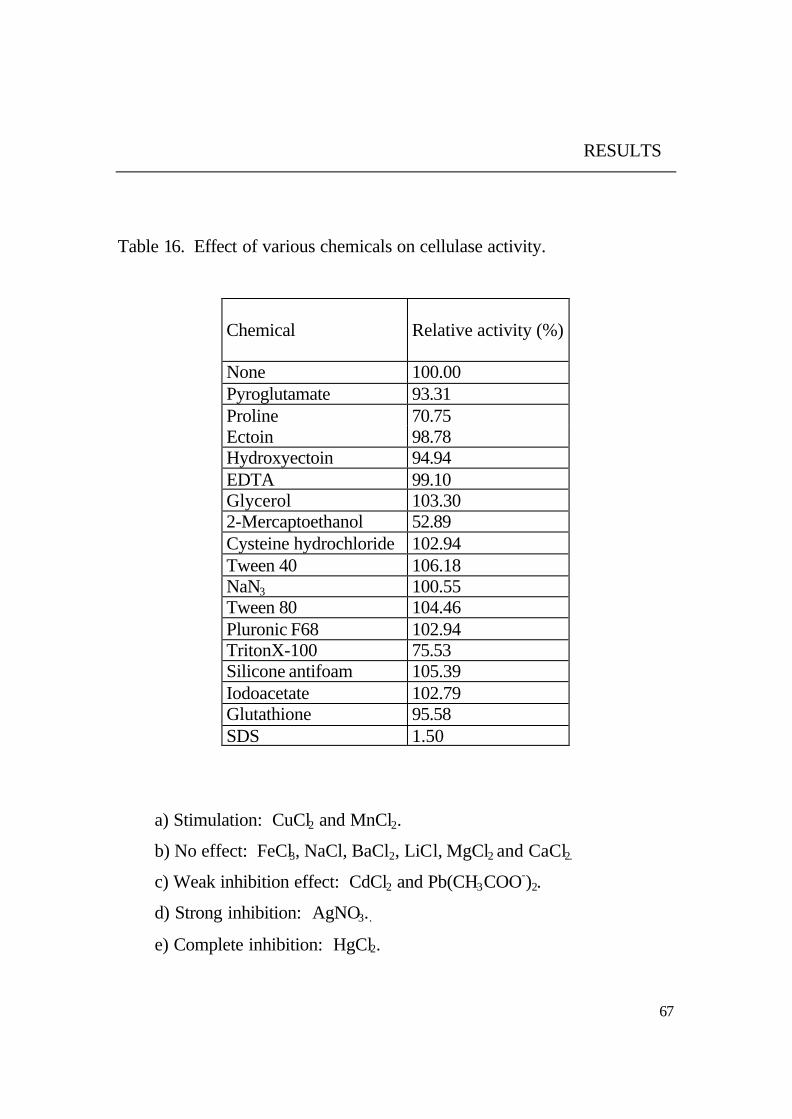
3.11.5 Chemical compounds
The enzyme activities were measured with DNS method in the presence
of various compounds: pyroglutamate, proline, ectoin, hydroxyectoin,
The enzyme had apparent Km value of 0.91 % and V max value of 191.98
µmol/min/mg for hydrolysis of CMC.
73
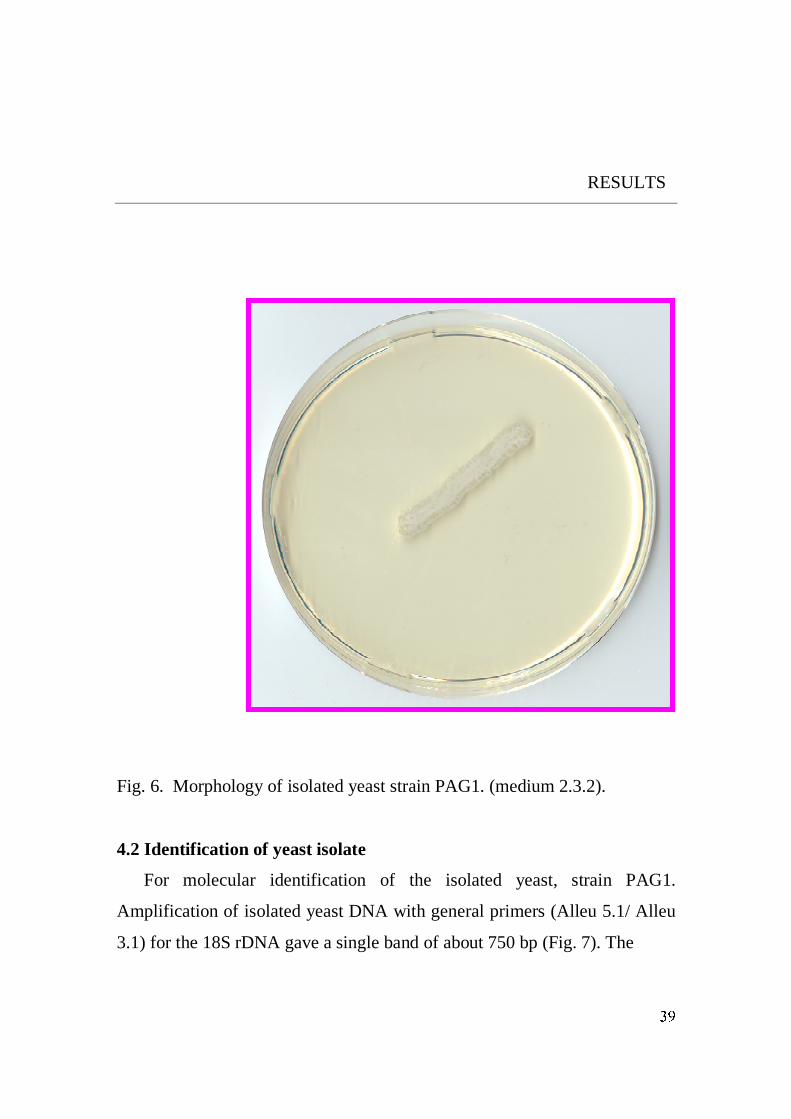
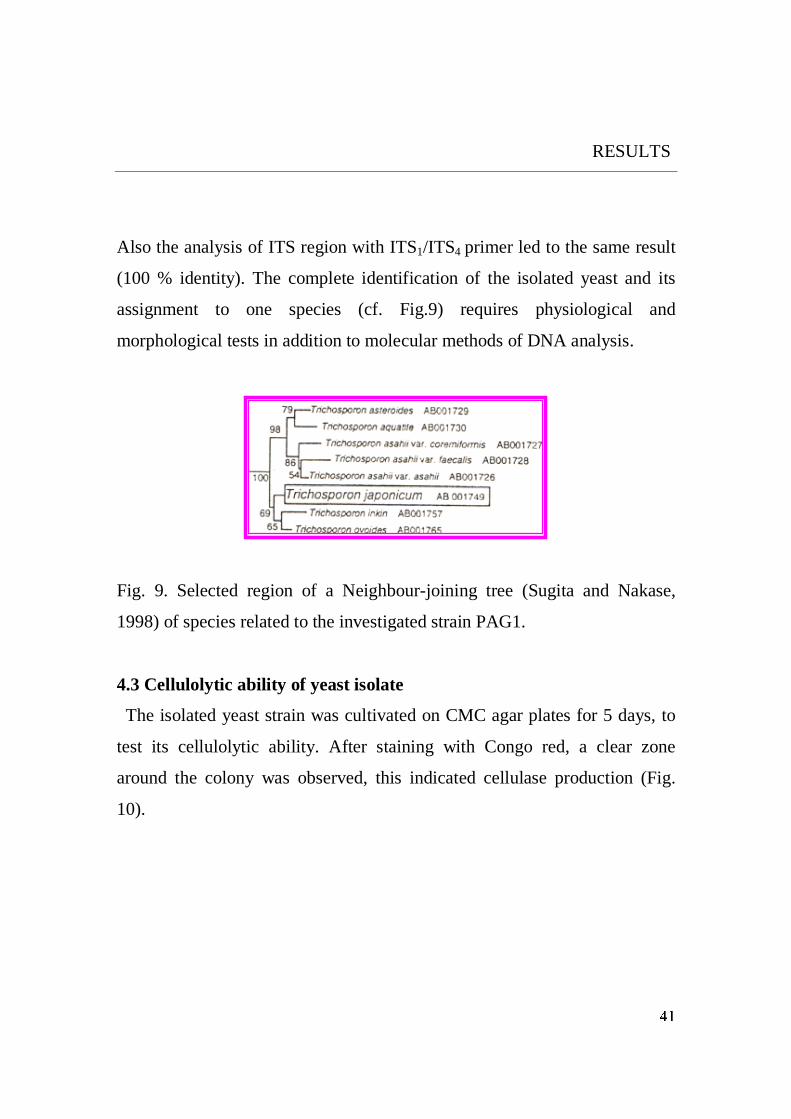
RESULTS
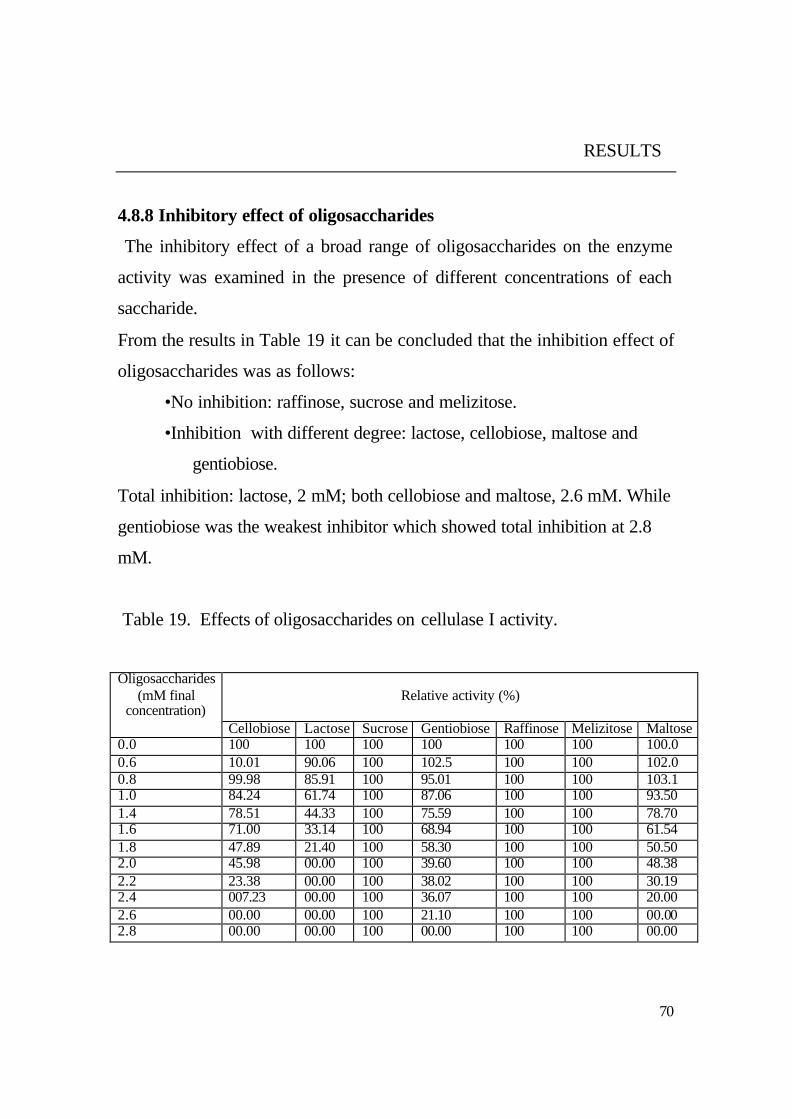
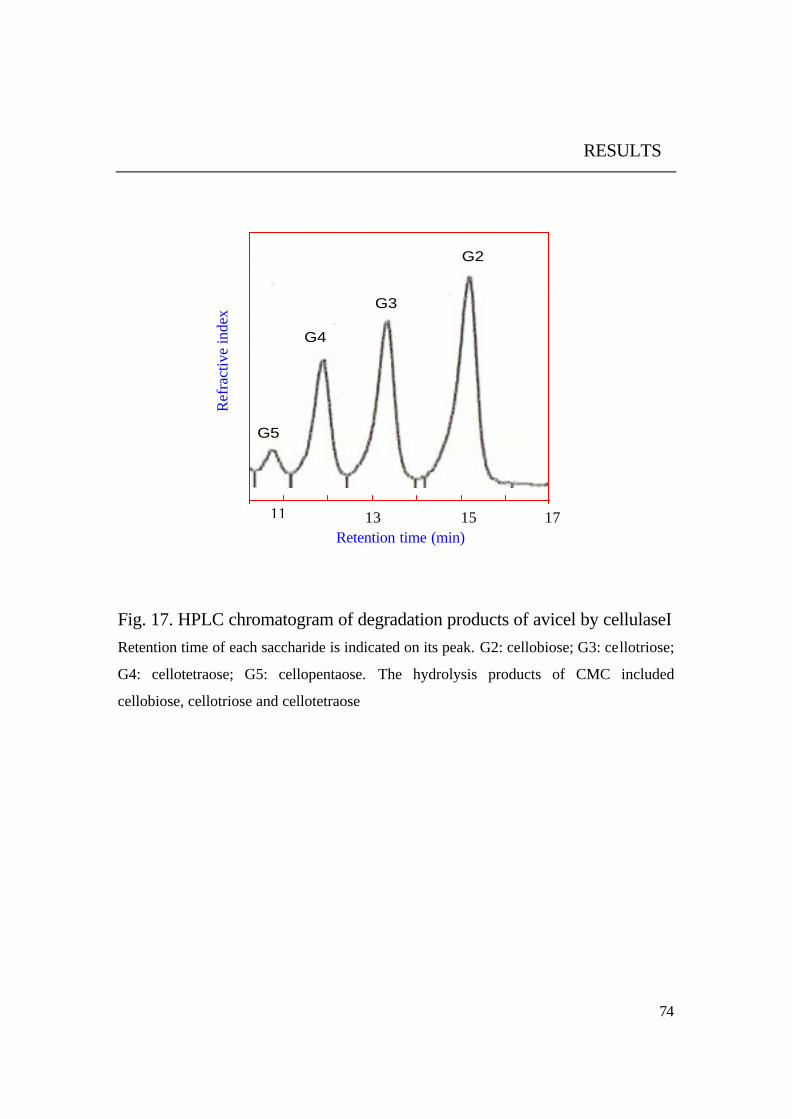
4.8.11 Saccharification products
To obtain available glucose from cellulosic materials, the enzyme was
incubated with acid swollen avicel and CMC in the presence and absence of
ß- glucosidase from the same yeast. The reaction products were analyzed by
HPLC.
Results in Fig. 17 and 18 showed that the purified cellulase could
degrade both soluble (CMC) and insoluble (avicel) cellulosic materials to
small chains of ß-(1,4) oligosaccharides. Among the degradation products of
avicel it could be observed that the smallest produced oligosaccharide was
cellobiose (2 glucose units) and the longest one was cellopentaose (5 glucose
units).
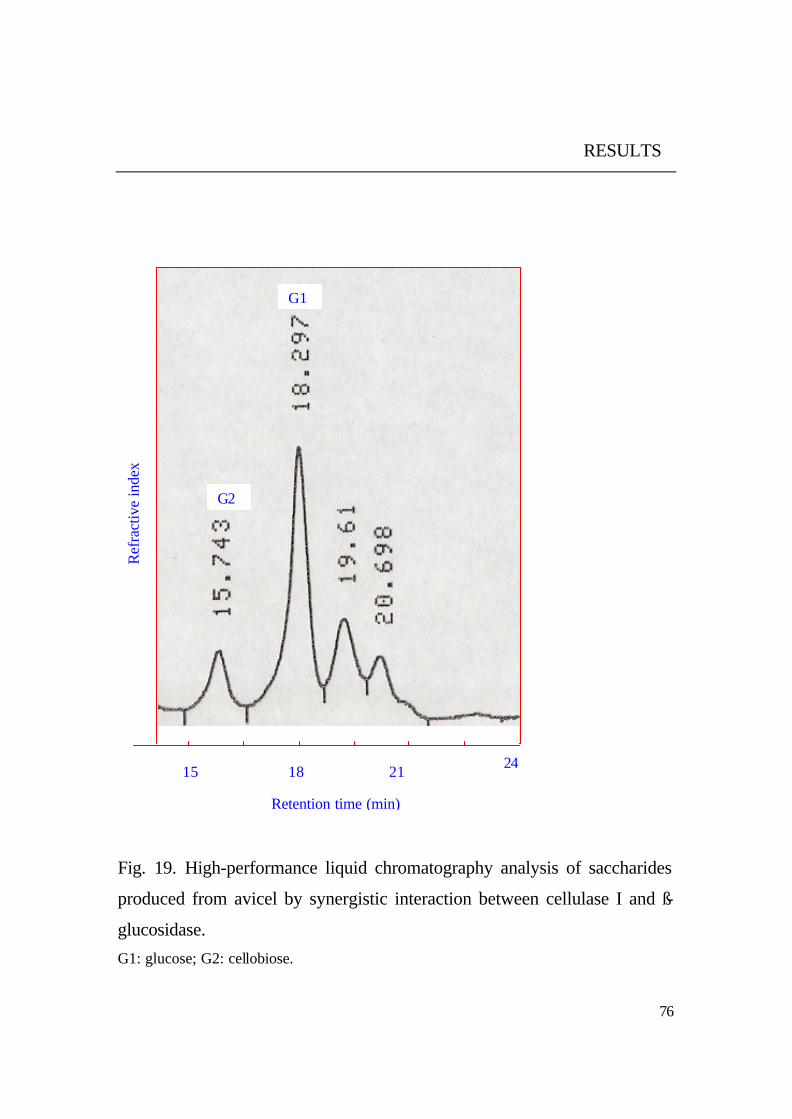
It was noticed that no glucose was found among the degradation
products of both substrates (CMC, avicel). Glucose was only observed as
main product beside cellobiose when purified cellulase I and ß- glucosidase
from the same yeast were added Fig. 19. This means that ß - glucosidase
from the same yeast acts synergistically with the cellulase to complete the
hydrolysis of cellulosic materials to available glucose.
74
RESULTS
Fig. 17. HPLC chromatogram of degradation products of avicel by cellulaseI Retention time of each saccharide is indicated on its peak. G2: cellobiose; G3: cellotriose;
G4: cellotetraose; G5: cellopentaose. The hydrolysis products of CMC included
cellobiose, cellotriose and cellotetraose
G4
G5
G3
G2
G4
G5
G3
G2
11 13 15 17 Retention time (min)
Ref
ract
ive
inde
x
75
RESULTS
Fig. 18. HPLC analysis of degradation products of CMC after incubation
with purified cellulase I. G2: cellobiose; G3: cellotriose; G4: cellotetraose; G5: cellopentaose.
G4 G3
G2
12 14 16
Retention time (min)
Ref
ract
ive
inde
x
76
RESULTS
Fig. 19. High-performance liquid chromatography analysis of saccharides
produced from avicel by synergistic interaction between cellulase I and ß-
glucosidase.
G1: glucose; G2: cellobiose.
G2
G1
Retention time (min)
Ref
ract
ive
inde
x
15 18 21 24
77
DISCUSSION
5 DISCUSSION
5.1 Optimal conditions for cellulase production
Optimization of the medium for cellulase production by selecting the
best nutritional and environmental conditions is important to increase the
produced cellulase yield (Gomes et al., 2000)
5.1.1 Optimal temperature
The upper temperatures limit for growth of psychrophilic, mesophilic,
thermotolerant and thermophilic yeasts were found to be 20, 35, 42 and 45 oC, respectively (Arthur and Watson, 1976).
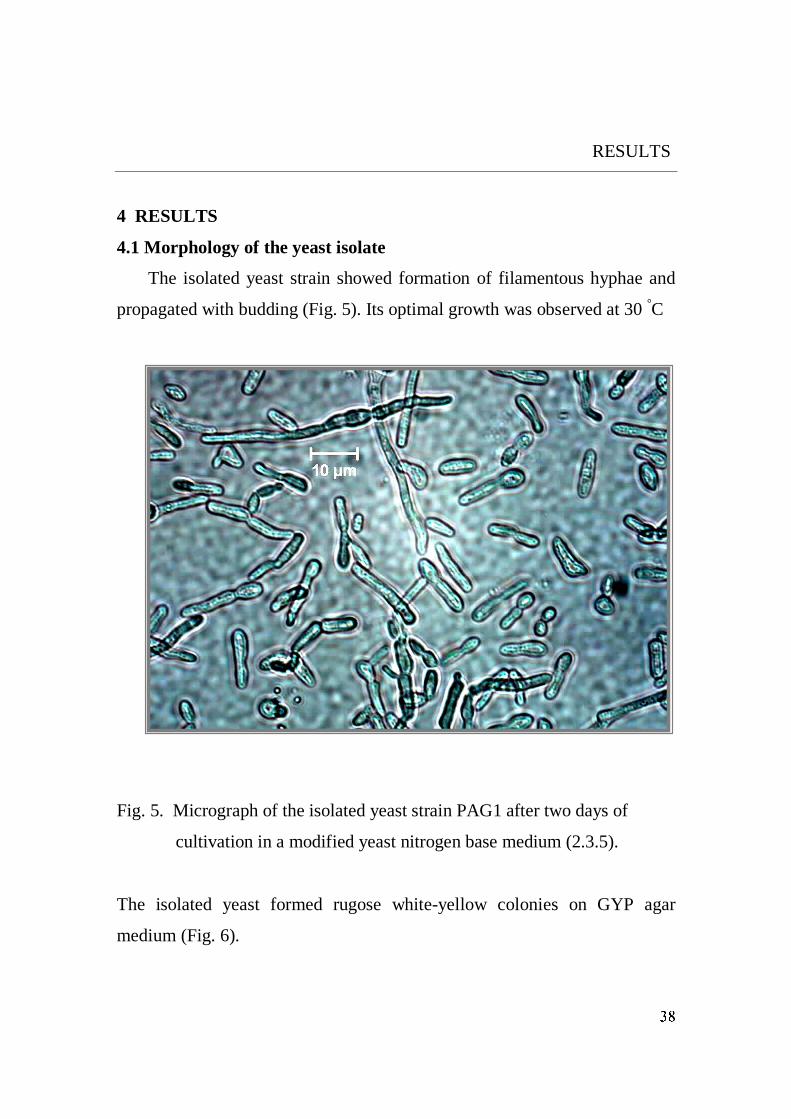
The isolated yeast strain PAG1 in this study was able to survive over a
broad range of temperature Fig. 20. The most significant growth and
cellulase production were observed between 20 oC and 35 oC. The optimal
growth of the isolated yeast was determined at 30 oC. Therefore, the isolated
strain was classified as a mesophilic yeast. It was reported that the best
temperature for cellulase production is 30 oC for Penicillium citrinum
(Olutiola, 1976) and 30 oC – 37 oC for Bacillus KSM-635 (Ito, 1997). In the
case of Sporotrichum thermophile maximum production of cellulases
occurred at 45 oC (Coutts and Smith, 1976). On the other hand, Aspergillus
fumigatus IMI 143864 showed maximum growth and cellulase production at
temperature between 30 oC and 45 oC (Stewart and Parry, 1981). However,
the optimum cultivation temperature for endo-ß-glucanase production by
Rhodotorula glutinis is 20 oC (Oikawa et al, 1998).
78
DISCUSSION
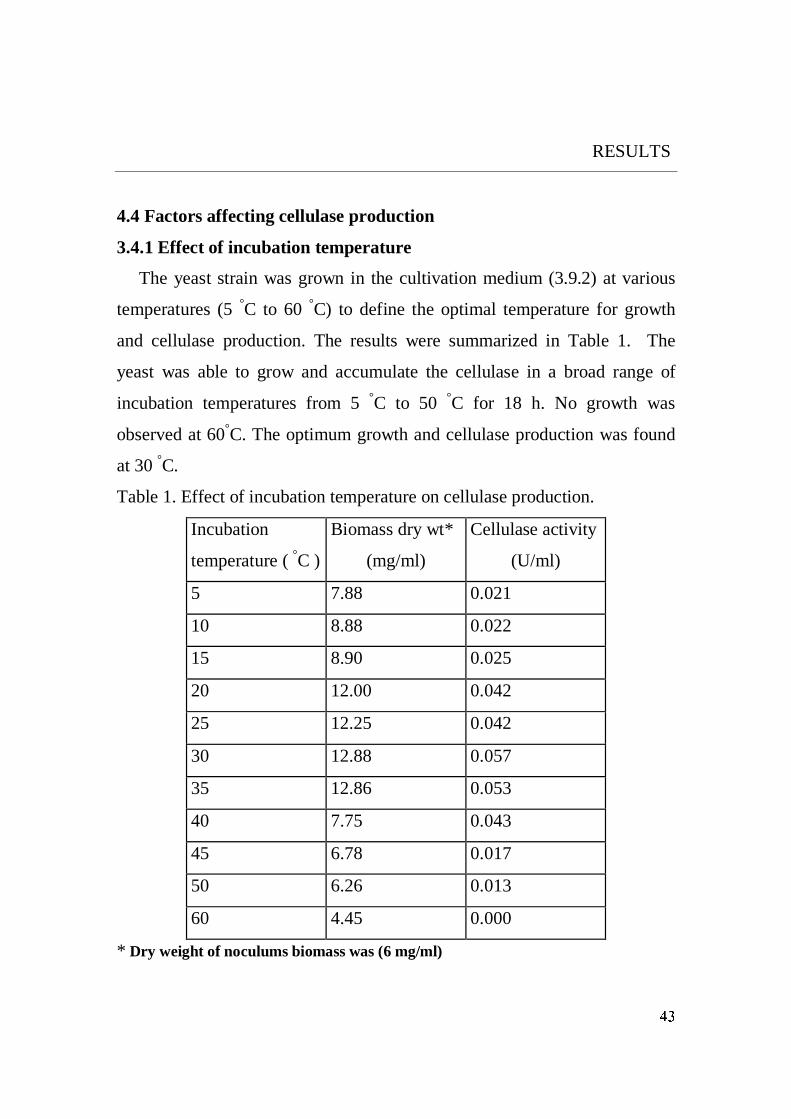
Fig. 20. Effect of incubation temperature on cellulase production.
5.1.2 Optimal carbon source
The obtained results indicated that cellulase production was stimulated
in the cultivation medium by soluble and insoluble cellulose substrates.
Cellulase induction depended on the presence of low levels of cellulase
(constitutive enzyme) in the uninduced organism. This basal cellulase
0
0.01
0.02
0.03
0.04
0.05
0.06
5 15 25 35 45 60
Temperature
Cell
ulas
e ac
tivi
ty (
U/ml
)
(oC)
79
DISCUSSION
activity would digest cellulose releasing oligosaccharides that could enter
the cell and trigger expression of cellulases (Carle-Urioste et al., 1997).
The obtained results showed that CMC stimulated higher cellulase yield
compared to avicel, and the poorest cellulase production was detected with
amorphous cellulose as a carbon source. This may be explained on the basis
of absorption of the enzymes onto cellulose (Stewart and Parry, 1981).
Similarly, CMC also stimulated the highest yield of cellulase in the case of
Penicillium citrinum, when it was the sole carbon source (Olutiola, 1976).
CMC was also required for the cellulase production by members of genus
Bacillus (Ito, 1997). Lactose and CMC were optimal inducers of cellulase
production by Myceliophthora thermophila D-14 (Sen et al, 1983). In
contrary, amorphous celluloses stimulated higher yields of cellulase from
Aspergillus fumigatus (Stewart and Parry, 1981). Microcrystalline cellulose
induced the highest yield of cellulase when it was used in grown cultures of
Thermomonospora fusca (Spiridonov and Wilson, 1998). The highest
cellulases produced by Schizophyllum commune were recorded with
thiocellobiose, but CMC, cellobiose and avicel as inducers stimulated lower
enzyme yields (Rho et al., 1982).
In the order, D-glucose followed by D-saccharose, glycerol and finally D-
fructose, was the best carbon source for cellulase production by Rhodotorula
glutinis (Oikawa et al, 1998).
80
DISCUSSION
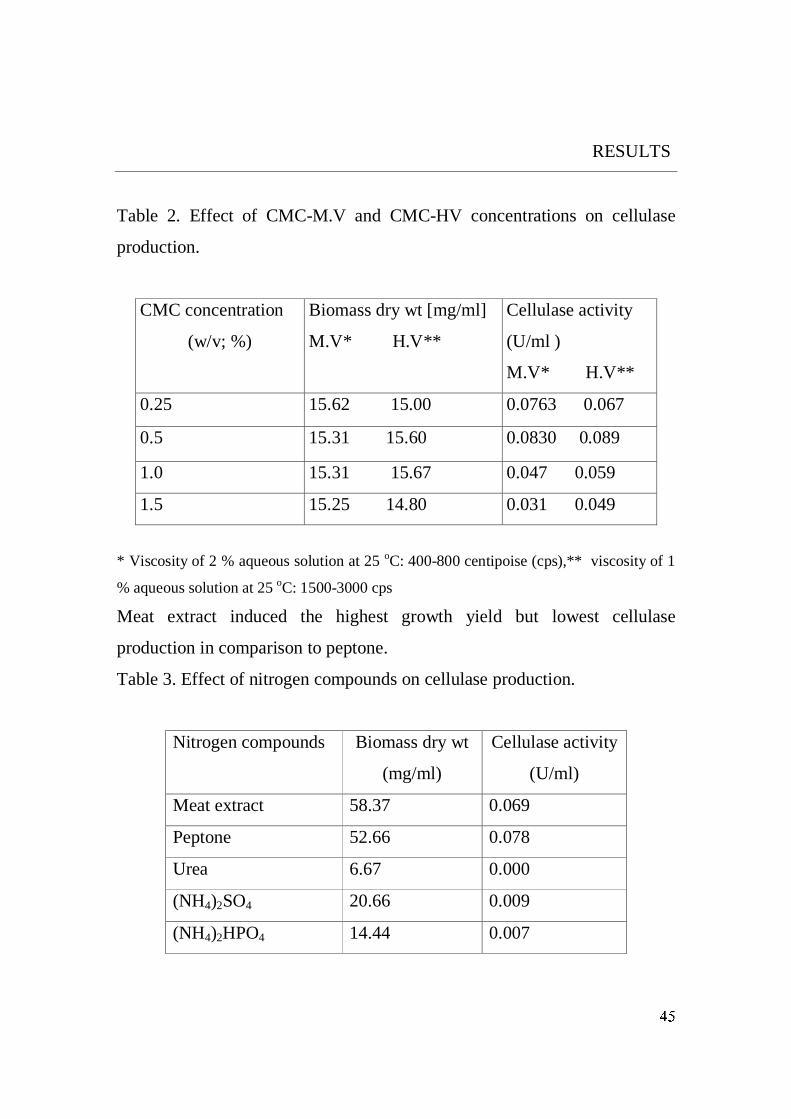
5.1.3 Carbon source concentration
The results demonstrated that medium viscosity CMC stimulated higher
yield than high viscosity CMC. The yield was decreased in the presence of
high concentration of MV-CMC and the growth was approximately stable.
The high viscosity medium led to the cease of the growth. This is probably
due to the high viscosity of the medium, which decreases the oxygen supply
to the cells. Oxygen is necessary for synthesis of cell membrane components
(sterols, nonsaturated fatty acids) in the yeast. High viscosity leads to retard
cell division, resulted in low production metabolism and cellulase excretion
(Fritsche, 1999).
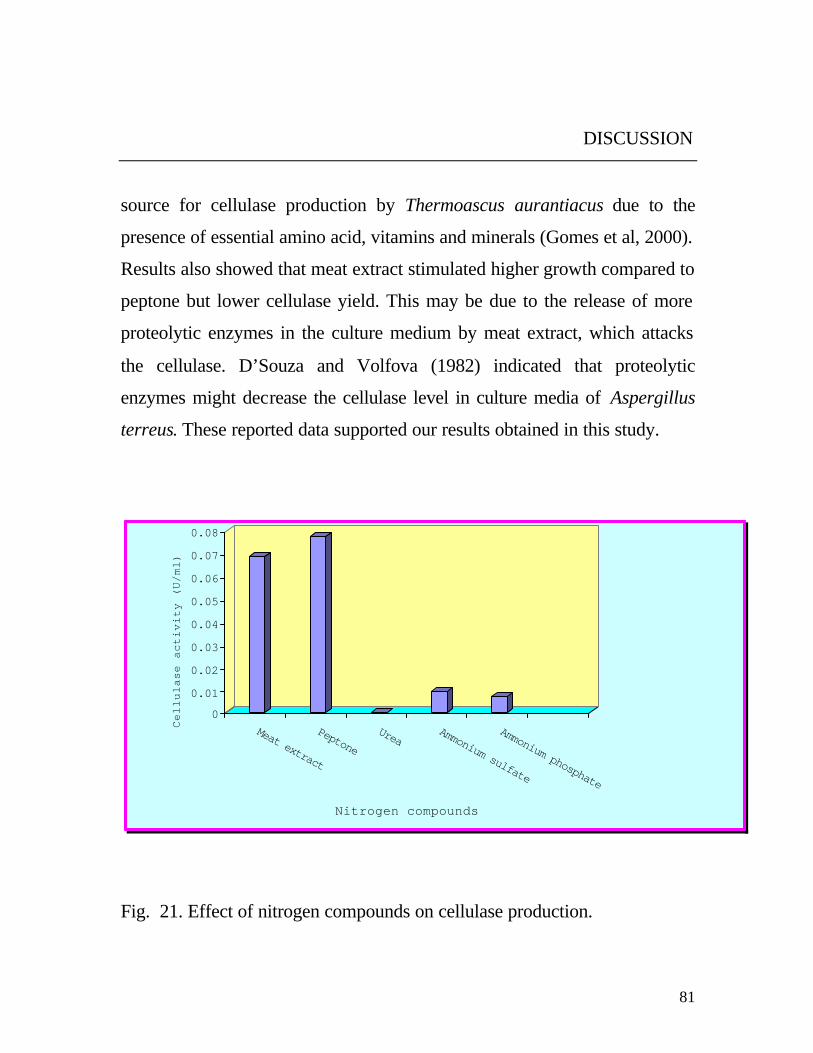
5.1.4 Optimal nitrogen source
The obtained data (Fig. 21) revealed that the organic nitrogen
compounds stimulated higher growth and cellulase production than
inorganic compounds. This finding probably could be attributed to the lack
of amino acids in inorganic compounds (Rakshit and Sahai, 1989). On the
other hand, the maximum cellulase yield was found with peptone, which
may function as a source for certain essential amino acids to enhance
enzyme production (Rakshit and Sahai, 1989). Similar results were reported
with the wild strain of Chaetomium globosum which produced maximum
yield of cellulases in the presence of peptone as nitrogen source followed by
yeast extract, urea, KNO3 and (NH4)2SO4 (Umikalsom et al, 1997). In
agreement with the present results, soymeal was found to be the best organic
nitrogen
81
DISCUSSION
source for cellulase production by Thermoascus aurantiacus due to the
presence of essential amino acid, vitamins and minerals (Gomes et al, 2000).
Results also showed that meat extract stimulated higher growth compared to
peptone but lower cellulase yield. This may be due to the release of more
proteolytic enzymes in the culture medium by meat extract, which attacks
the cellulase. D’Souza and Volfova (1982) indicated that proteolytic
enzymes might decrease the cellulase level in culture media of Aspergillus
terreus. These reported data supported our results obtained in this study.
Fig. 21. Effect of nitrogen compounds on cellulase production.
0
0.01
0.02
0.03
0.04
0.05
0.06
0.07
0.08
Cell
ulas
e ac
tivi
ty (
U/ml
)
Meat extract
PeptoneUrea
Ammonium sulfate
Ammonium phosphate
Nitrogen compounds
82
DISCUSSION
5.1.5 Concentration of nitrogen source
Higher concentrations of peptone in the culture media were followed by
an increase of cellulase production. The optimal peptone concentration was
shown to be 0.5 and 0.8 % (w/v). These results were in agreement with those
of Umikalsom et al. (1997), Rakshit, and Sahai (1989). They found that 0.6
% (w/v) peptone induced the highest cellulase production in the case of
Chaetomium globosum and Trichoderma reesei. The published data also
revealed that above the optimal concentration of peptone, cellulase yield
decreased. This phenomenon was also observed from Umikalsom et al.
(1997). They reported that a yeast extract and peptone concentration above 9
g/l were inhibitory to cellulase production by Chaetomium globosum.
One assumes that an excess of peptone in the culture media may induce
proteases that hydrolyzes the cellulase protein.
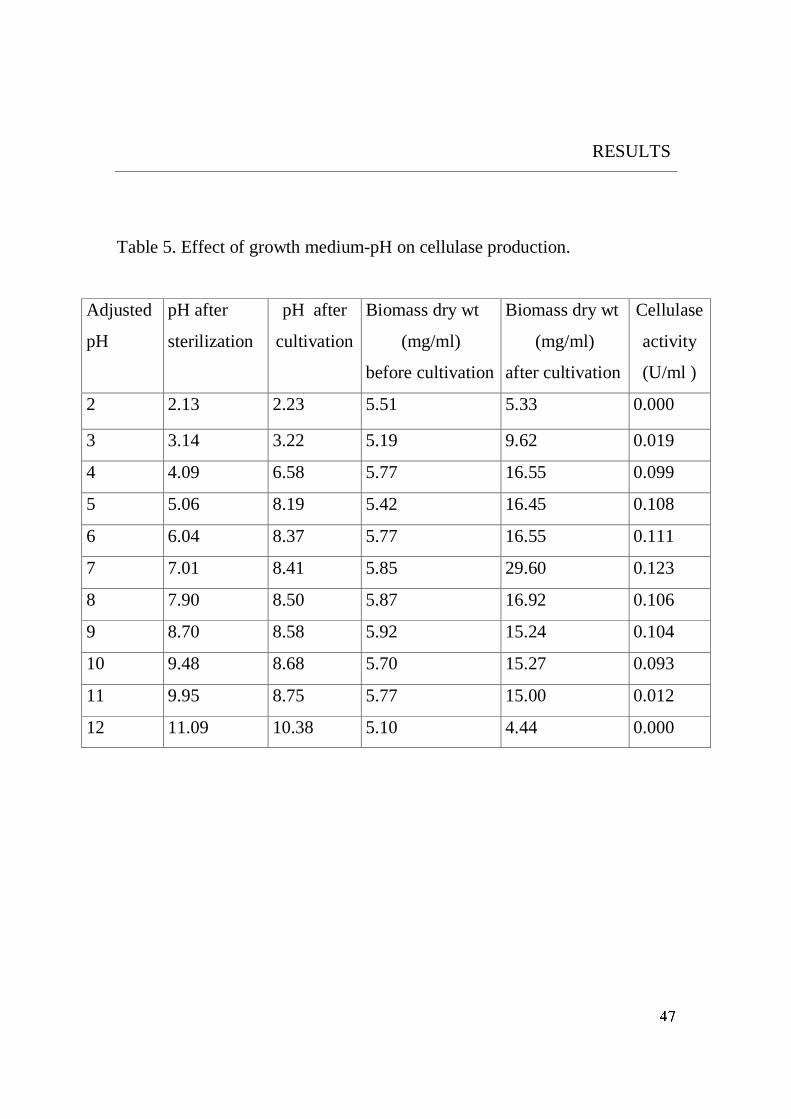
5.1.6 Optimal pH value of culture
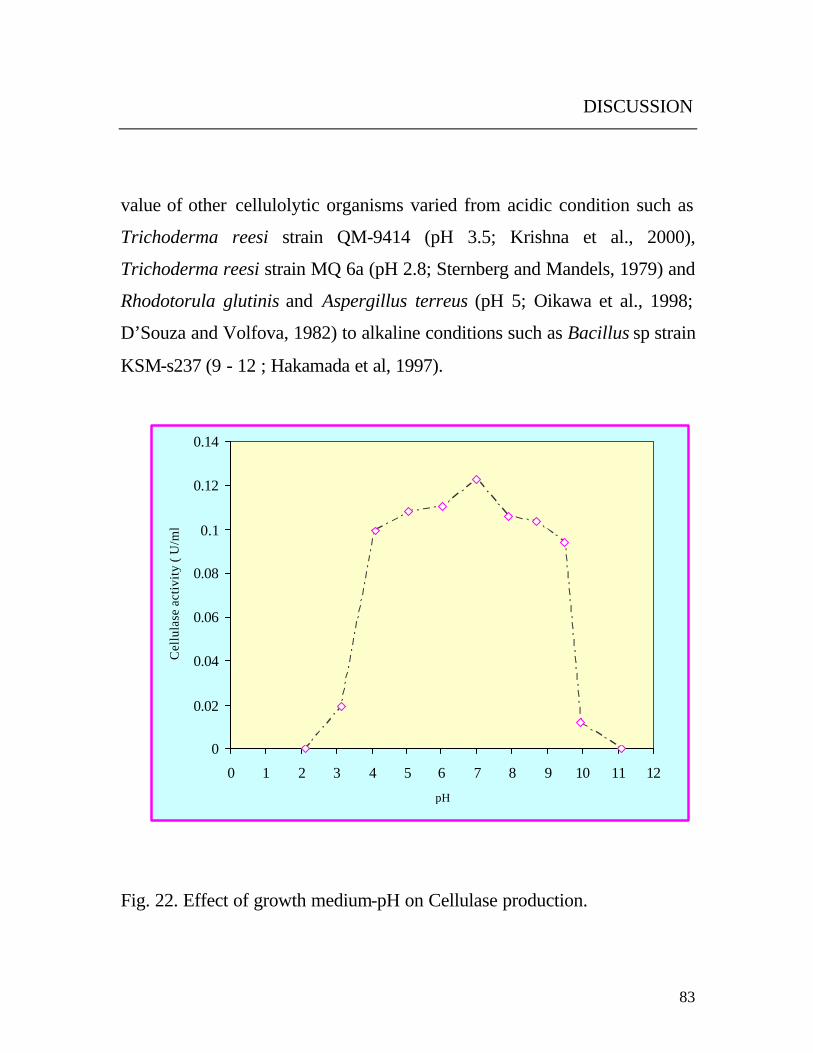
Yeast strain was able to grow at a wide initial pH between 3 and 10.
After cultivation, the pH was about 8.5 in all media. This proved that the
organism was able to optimize the pH in the culture medium for its growth,
but no explanation was concluded. Results (Fig. 22) also revealed that the
optimal growth and cellulase production was at pH 7. On comparison with
other organisms, the optimum initial pH value 7 of the yeast under study was
found to be the same as of various cellulolytic organisms such as Aspergillus
fumigatus, Neurospora crassa and Sporotrichum thermophile (Stewart and
Parry, 1981; Eberhart et al., 1977; Coutts and Smith, 1976). The optimal pH
83
DISCUSSION
value of other cellulolytic organisms varied from acidic condition such as
Trichoderma reesi strain QM-9414 (pH 3.5; Krishna et al., 2000),
Trichoderma reesi strain MQ 6a (pH 2.8; Sternberg and Mandels, 1979) and
Rhodotorula glutinis and Aspergillus terreus (pH 5; Oikawa et al., 1998;
D’Souza and Volfova, 1982) to alkaline conditions such as Bacillus sp strain
KSM-s237 (9 - 12 ; Hakamada et al, 1997).
Fig. 22. Effect of growth medium-pH on Cellulase production.
0
0.02
0.04
0.06
0.08
0.1
0.12
0.14
0 1 2 3 4 5 6 7 8 9 10 11 12
pH
Cel
lula
se a
ctiv
ity (
U/m
l)
84
DISCUSSION
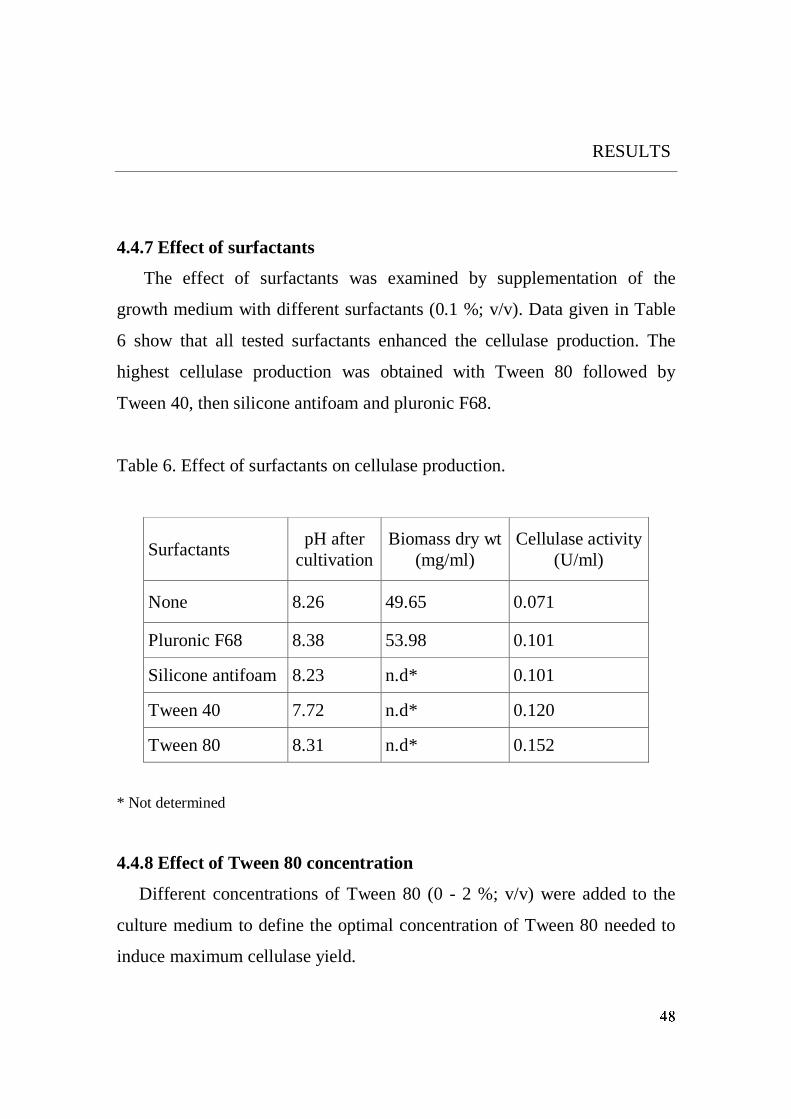
5.1.7 Surfactants effect
All tested surfactants (3.9.9) enhanced cellulase production. Highest yield
was induced by Tween 80 (0.5 % v/v). At higher concentration of Tween 80
(>0.5 %; v/v) the cellulase yield did not increase. The stimulatory effect of
surfactants may be a consequence of its action on cell membranes causing
increased permeability and /or by promoting the release of cell-bound
enzymes. On the other hand, the lower stimulatory effect was found with
pluronic F68 and silicone antifoam (Fig. 23). This may be due to a decrease
in oxygen supply, resulting a diminution of growth (Pardo, 1996). In
accordance with the present results, Tween 80 at a concentration of 0.22
(v/v) was the optimal concentration for the production of cellulase by
Nectria catalinensis (Pardo, 1996). The cellobiase was optimally produced
by Aspergillus niger A 20 in the presence of 0.2 % (v/v) Tween 80 (Abdel-
Fatth et al., 1997). In order to induce a high cellulase production 0.1% and
0.2 % (v/v) of Tween 80 were added to the cellulase production media of
Trichoderma reesei strain QM-9414 and Streptomyces flavogriseus (Krishna
et al., 2000; Ishaque and Kluepfel, 1980), respectively.
85
DISCUSSION
Fig. 23. Effect of surfactants on growth and cellulase production.
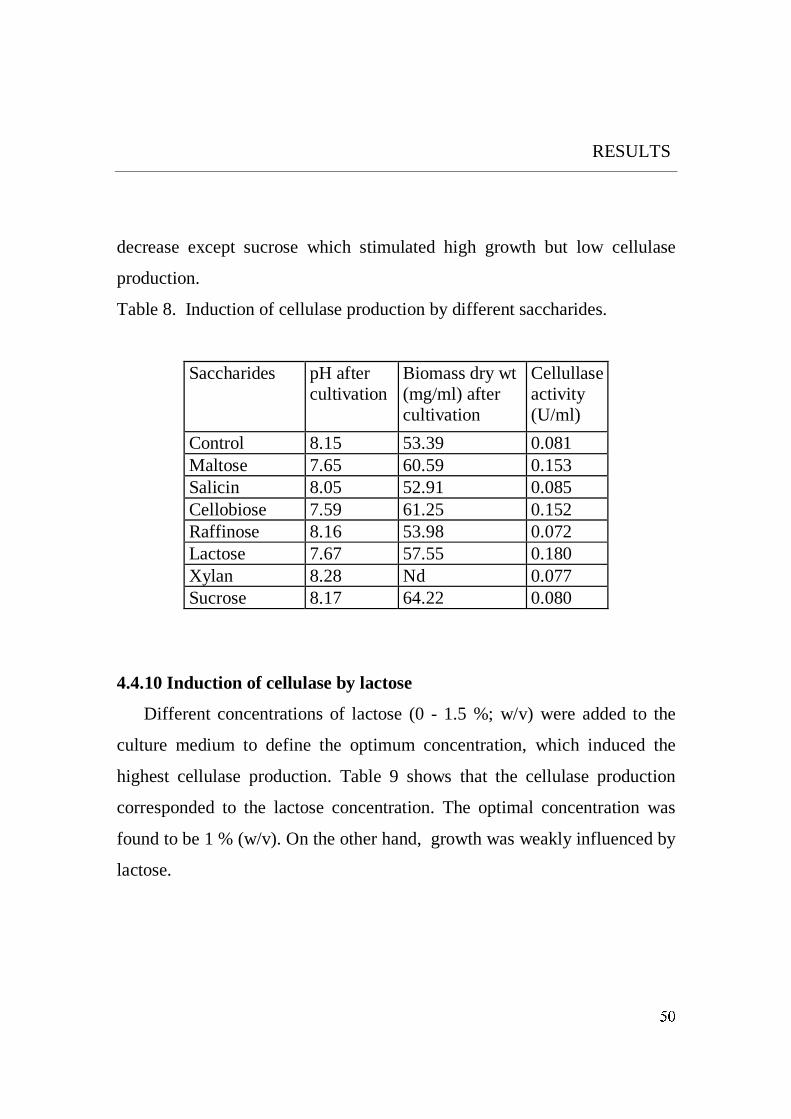
5.1.8 Induction of cellulase by lactose
The results revealed that the synthesis of cellulase by the yeast under
study is inducible by oligosaccharides being in agreement with the results of
Rho et al., (1982), Sen et al., (1983) Wood et al., (1984), Morikawa et al.,
(1995), Carle-Urioste et al., (1997).
The induction effect of the tested saccharides (Fig. 24) did not depend on
the linkages e.g maltose possessing an a -(1,4 ) linkage exhibited the same
effect as lactose and cellobiose, which have ß- (1,4) linkages.
0
0.02
0.04
0.06
0.08
0.1
0.12
0.14
0.16C
ellu
lase
act
ivity
(U
/ml)
NonePluronic F68
Silicon antifoam
Tween 40
Tween 80
Surfactants
86
DISCUSSION
On the other hand, sucrose and raffinose possessing a- and ß-linkage did not
induce any cellulase production.
It is also evident from the results that the chain length of the tested
saccharides did not play a role in the enzyme induction process.
Therefore, it would not be unjustifiable to assume that an inducer should
have a- or ß-linkages or special molecule structure. However, this may not
be considered as only criterion, but may be one of the major factors
responsible for cellulase induction (Sen et al., 1983).
It is noteworthy to pinpoint that the examined saccharides had a reducing
or non-reducing end. All reducing sugars provoked the secretion of the
cellulase and all nonreducing sugars did not stimulate cellulase production.
From these results, it is suggested that the reducing end of the
oligosaccharides is required for the enzyme induction process.
The maximum cellulase production was induced in the presence of lactose
followed by cellobiose. These results are in agreement with that of Sen et al.,
(1983). They found that lactose and cellobiose were the best inducers for
cellulase production by Myceliophthora thermophila strain D-14. Similar
results were reported by Geimba et al., (1999). They indicated that cellulase
production by Bipolaris sorokiniana was stimulated by lactose. Also lactose,
starch and cellobiose induced the cellulolytic and xylanolytic enzymes
production by Piromyces sp. (Teunissen et al., 1992). Thiocellobiose and
cellobiose induced the cellulase production by Schizophyllum commune
(Rho et al., 1982). The highest activity against filter paper produced by
Aspergillus fumigatus was induced by filter paper and lactose (Ximenes et
87
DISCUSSION
al., 1996). Cellobiose was the best inducer for cellulase production by
Neurospora crassa (Eberhart et al., 1977).
Fig. 24. Induction of cellulase in growth medium by different saccharides.
5.1.9 Inducer concentration
The induction of cellulase was directly proportional of concentration of
lactose up to 1 % (w/v). Eriksson and Hamp (1978) reported that when
degradable inducer such cellobiose is used, the inducing effect in
Sporotrichum pulverulentum will disapper because of the depletion of the
00.02
0.040.060.080.10.120.140.160.18
Cellulase (U/ml)
Control
Maltose
Salicin
Cellobiose
Raffinose
Lactose
XylanSucrose
Saccharides
88
DISCUSSION
inducer. Increasing the inducer concentration will result in catabolite
repression due to the accumulation of glucose (Rho et al., 1982).
Accordingly, it could be suggested that the increase of lactose higher than 1
% may lead to similar results in the induction of cellulase in the case ofthe
studied yeast.
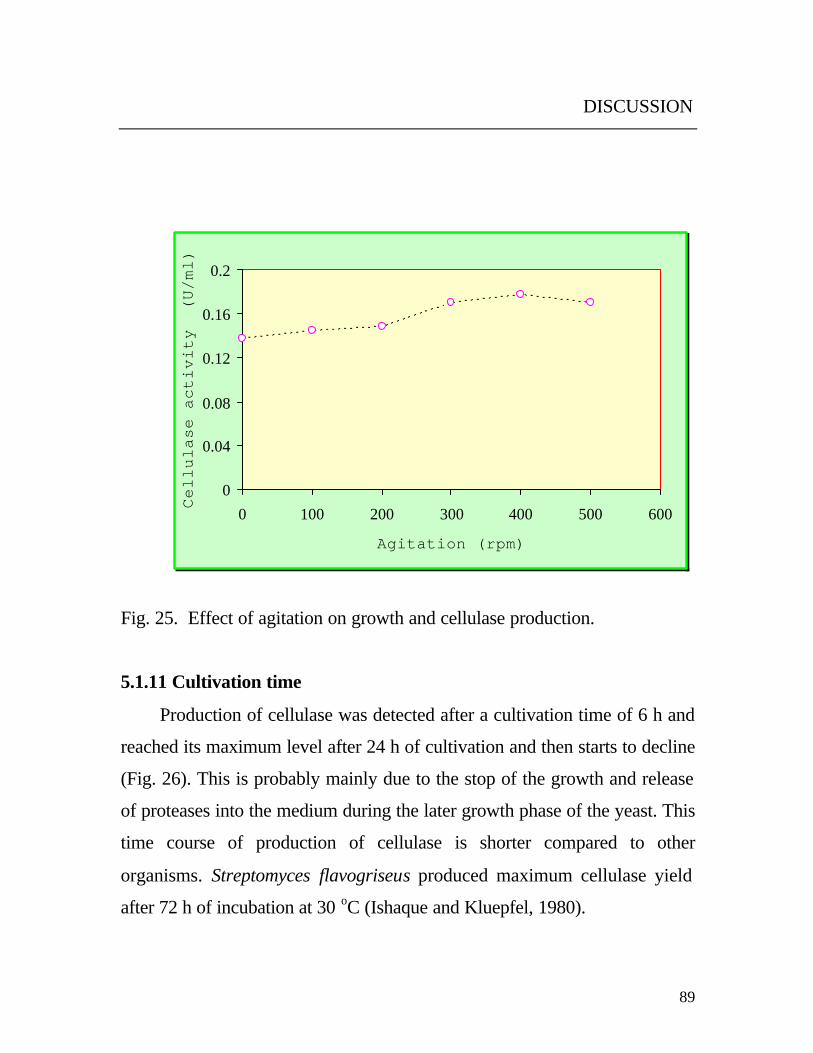
5.1.10 Culture agitation
The obtained results in Fig. 25. revealed that both growth and cellulase
production are highly depended on the agitation rate. This may be explained
by the fact that the agitation increased the dissolved oxygen in the medium,
which is necessary for cell membrane components (sterol, non-saturated
fatty acid) and uniform distribution of the medium contents such as
foodstuffs and catabolites (Fritsche, 1999). This prevents the repression
through the catabolite. This observation is in accordance with the results of
Wood et al., (1984). They reported that the extracellular catabolite
accumulation might be a factor in endoglucanase repression in case of
Thermomonospora curvata . Mountfort and Asher (1985) reported that
CMCase was improved by shaking the culture media of the anaerobe
Neocallimastix frontalis PN-1. Higher agitation rates favored the production
of xylosidase, arabinofuranosidase and glucosidase by Thermomyces
lanuginosus strain SSBP, whereas the lower agitation rates favored xylanase
production (Singh et al., 2000).
89
DISCUSSION
Fig. 25. Effect of agitation on growth and cellulase production.
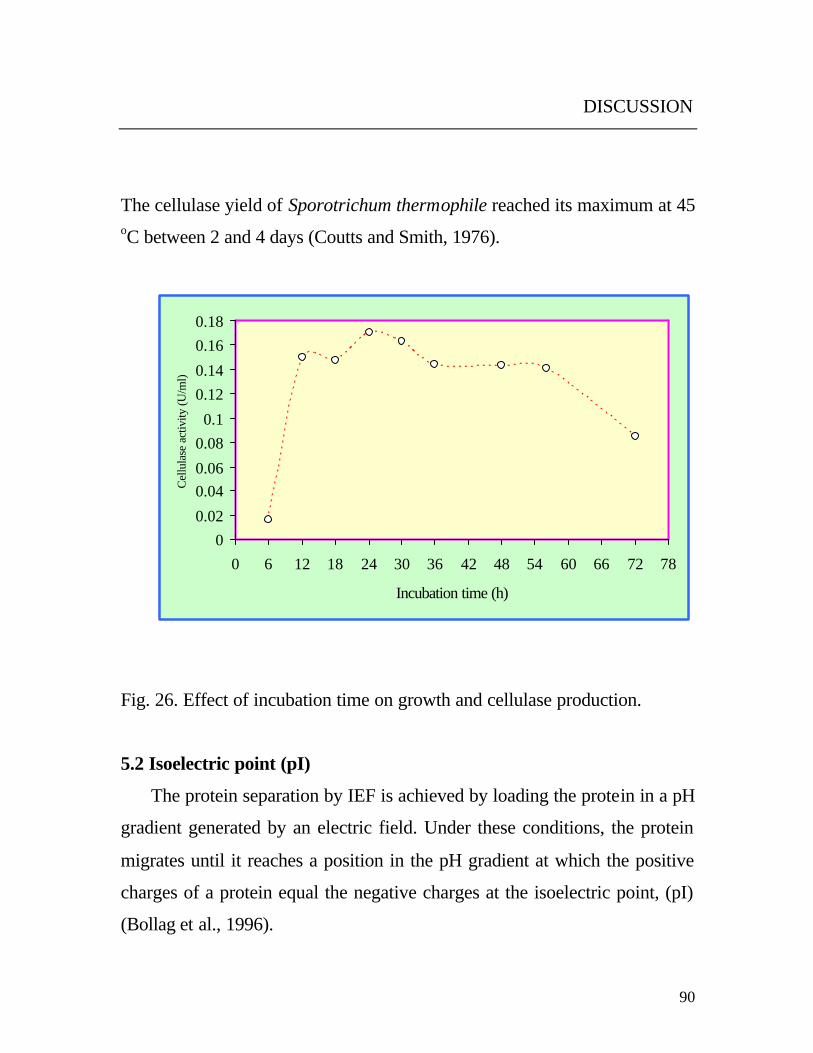
5.1.11 Cultivation time
Production of cellulase was detected after a cultivation time of 6 h and
reached its maximum level after 24 h of cultivation and then starts to decline
(Fig. 26). This is probably mainly due to the stop of the growth and release
of proteases into the medium during the later growth phase of the yeast. This
time course of production of cellulase is shorter compared to other
organisms. Streptomyces flavogriseus produced maximum cellulase yield
after 72 h of incubation at 30 oC (Ishaque and Kluepfel, 1980).
0
0.04
0.08
0.12
0.16
0.2
0 100 200 300 400 500 600
Agitation (rpm)
Cell
ulas
e ac
tivi
ty
(U/m
l)
90
DISCUSSION
The cellulase yield of Sporotrichum thermophile reached its maximum at 45 oC between 2 and 4 days (Coutts and Smith, 1976).
Fig. 26. Effect of incubation time on growth and cellulase production.
5.2 Isoelectric point (pI)
The protein separation by IEF is achieved by loading the protein in a pH
gradient generated by an electric field. Under these conditions, the protein
migrates until it reaches a position in the pH gradient at which the positive
charges of a protein equal the negative charges at the isoelectric point, (pI)
(Bollag et al., 1996).
00.02
0.040.06
0.080.1
0.120.14
0.160.18
0 6 12 18 24 30 36 42 48 54 60 66 72 78
Incubation time (h)
Cel
lula
se a
ctiv
ity (U
/ml)
91
DISCUSSION
The isoelectrophoretic (IEF) analysis of the cellulase protein in this study
showed a pI between 4.8 and 5.0. This means that a positive net charge of
the protein. Therefore, the presence of the amino acids arginine, histidine
and lysine on the protein surface should be high (Bollag et al., 1996). Since
the pI of the cellulase protein is acidic (4.8-5.0), it can be expected that the
enzyme is reasonably stable under alkaline conditions (Oikawa et al., 1998).
Compared to the pI of previously reported cellulases, these are acidic
cellulases such as that from Bacilluls sp No1139 (3.1), Bacillus sp KSM 237
10.5) and KCl/NaOH buffer (pH 11-12.8) (Fukumori et al., 1985). However,
an endoglucanase from Thermoascus aurantiacus showed stability at pH (4 -
8) for 48 h at 50 oC (Gomes et al., 2000). Endoglucanase from Chalara
paradoxa retained > 90 % of their activity after incubation at pH 8 or 9 for
30 min (Lucas et al., 2001). The residual activity of alkalic cellulase from
Bacillus stearothermophilus remained 90 % of its initial activity after
treatment at pH 12, while the remaining activity of the neutral cellulase was
about 80 % (Kume and Fujio, 1991). The cellulase from Bacillus sp. KSM-
635 was stable at pH 6-11 at 5 oC for 3 h (Ito, 1997). Bacillus circulans
cellulase was stable at pH from 4 to 10 for 24 h at 30 oC (Kim, 1995).
0
20
40
60
80
100
120
0 1 2 3 4 5 6 7 8 9 10 11 12
pH
Relative a
ctivity
(%)
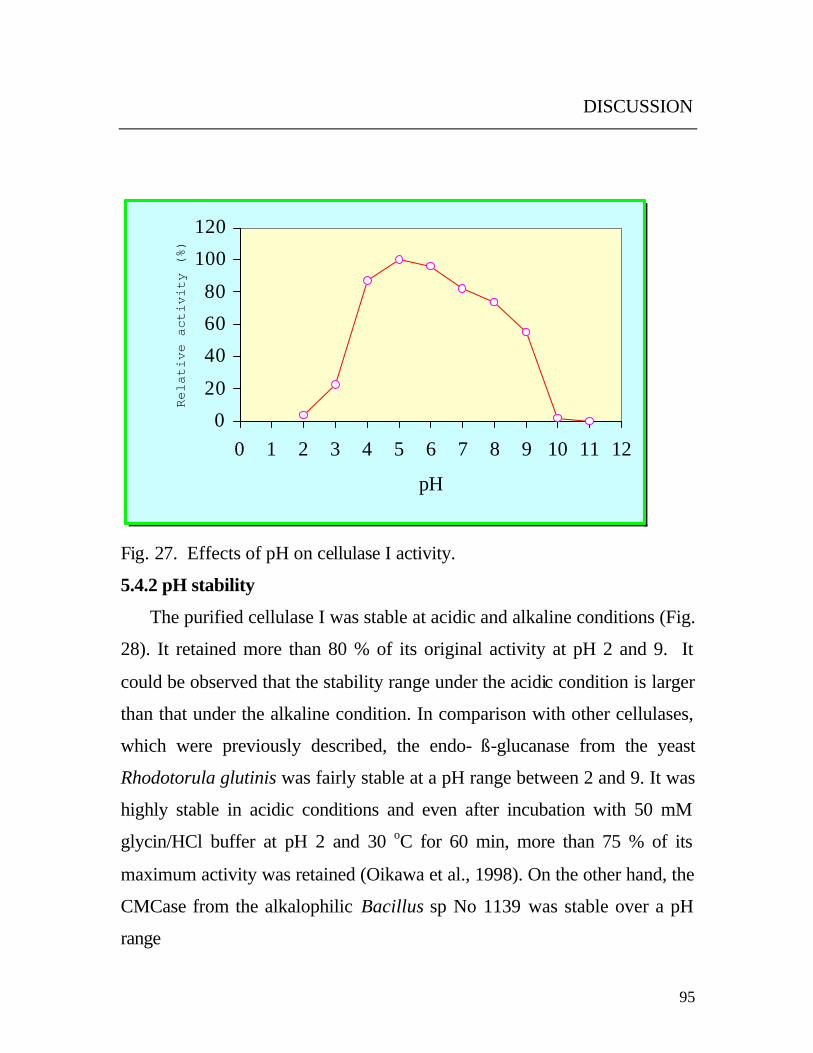
Fig. 28. Effect of pH on cellulase I stability.
97
DISCUSSION
5.4.3 Temperature optimum
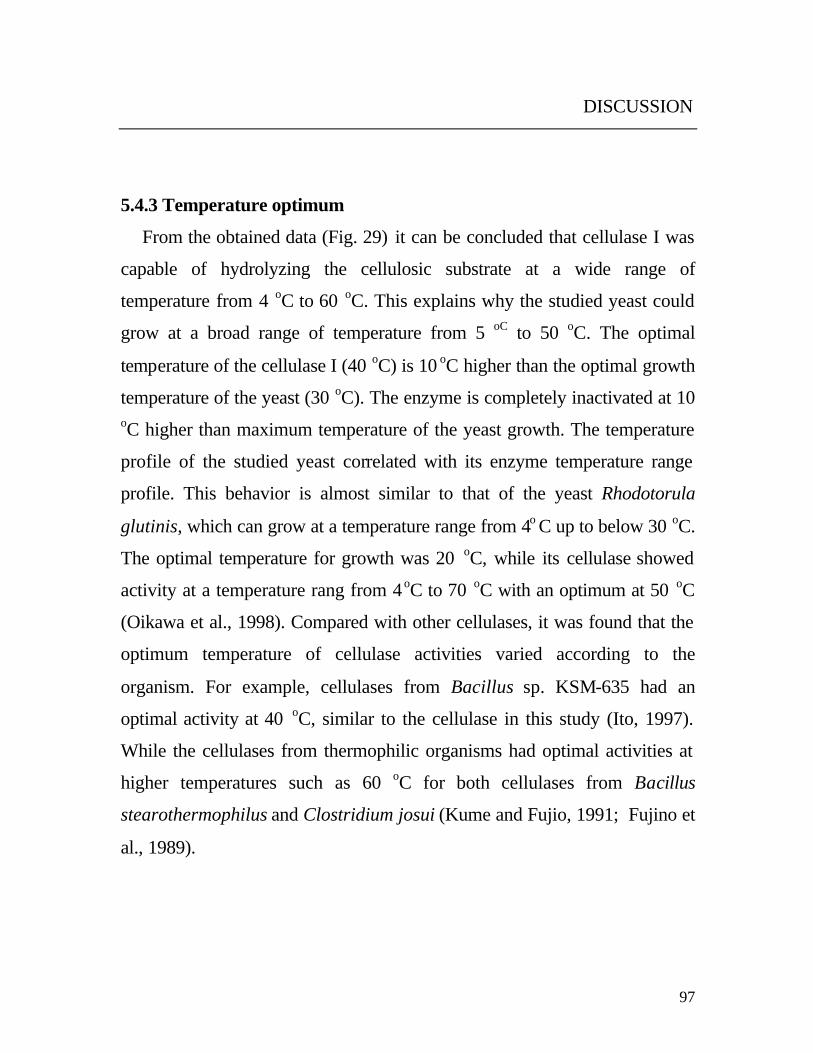
From the obtained data (Fig. 29) it can be concluded that cellulase I was
capable of hydrolyzing the cellulosic substrate at a wide range of
temperature from 4 oC to 60 oC. This explains why the studied yeast could
grow at a broad range of temperature from 5 oC to 50 oC. The optimal
temperature of the cellulase I (40 oC) is 10 oC higher than the optimal growth
temperature of the yeast (30 oC). The enzyme is completely inactivated at 10 oC higher than maximum temperature of the yeast growth. The temperature
profile of the studied yeast correlated with its enzyme temperature range
profile. This behavior is almost similar to that of the yeast Rhodotorula
glutinis, which can grow at a temperature range from 4o C up to below 30 oC.
The optimal temperature for growth was 20 oC, while its cellulase showed
activity at a temperature rang from 4 oC to 70 oC with an optimum at 50 oC
(Oikawa et al., 1998). Compared with other cellulases, it was found that the
optimum temperature of cellulase activities varied according to the
organism. For example, cellulases from Bacillus sp. KSM-635 had an
optimal activity at 40 oC, similar to the cellulase in this study (Ito, 1997).
While the cellulases from thermophilic organisms had optimal activities at
higher temperatures such as 60 oC for both cellulases from Bacillus
stearothermophilus and Clostridium josui (Kume and Fujio, 1991; Fujino et
al., 1989).
98
DISCUSSION
Fig. 29. Effect of temperature on cellulase I activity.
5.4.4 Temperature stability
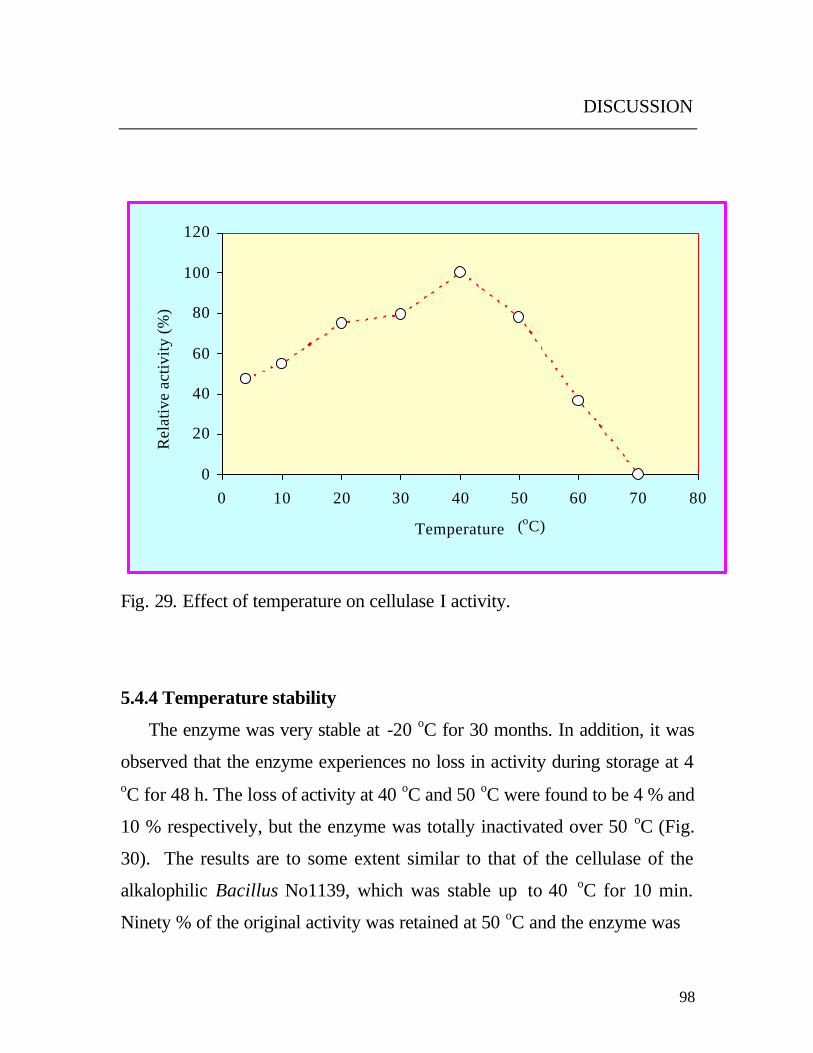
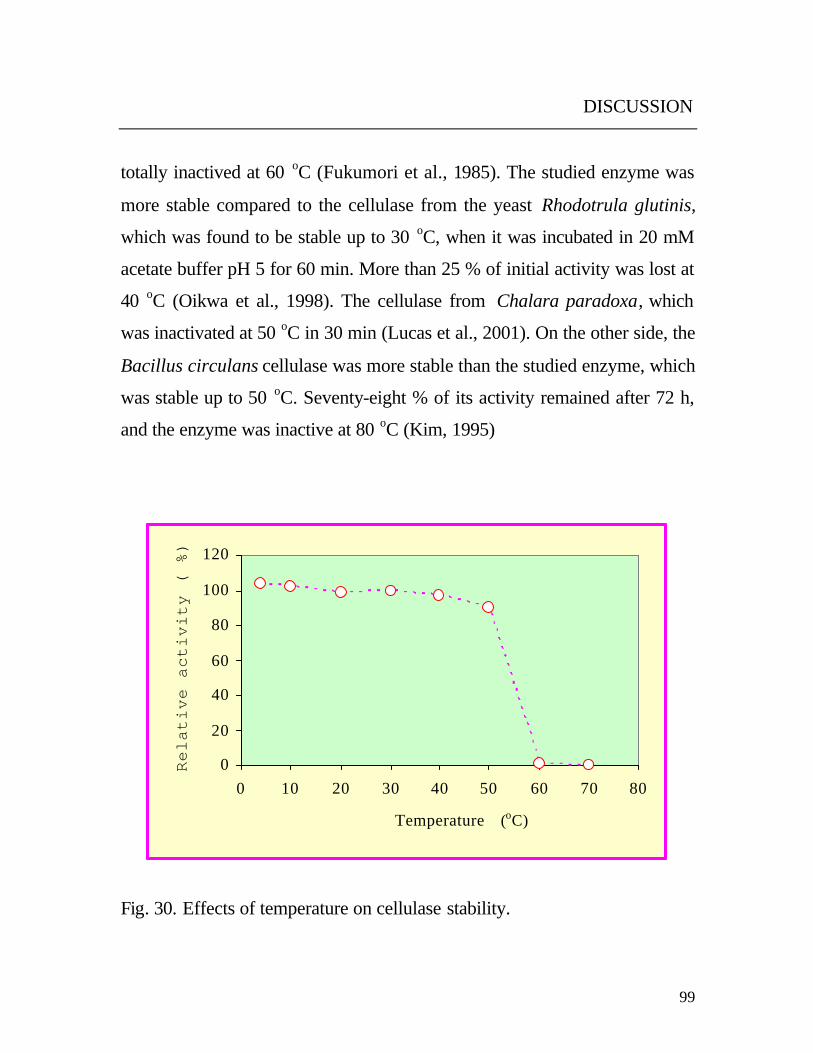
The enzyme was very stable at -20 oC for 30 months. In addition, it was
observed that the enzyme experiences no loss in activity during storage at 4 oC for 48 h. The loss of activity at 40 oC and 50 oC were found to be 4 % and
10 % respectively, but the enzyme was totally inactivated over 50 oC (Fig.
30). The results are to some extent similar to that of the cellulase of the
alkalophilic Bacillus No1139, which was stable up to 40 oC for 10 min.
Ninety % of the original activity was retained at 50 oC and the enzyme was
0
20
40
60
80
100
120
0 10 20 30 40 50 60 70 80
Temperature
Rel
ativ
e ac
tivity
(%)
(oC)
99
DISCUSSION
totally inactived at 60 oC (Fukumori et al., 1985). The studied enzyme was
more stable compared to the cellulase from the yeast Rhodotrula glutinis,
which was found to be stable up to 30 oC, when it was incubated in 20 mM
acetate buffer pH 5 for 60 min. More than 25 % of initial activity was lost at
40 oC (Oikwa et al., 1998). The cellulase from Chalara paradoxa, which
was inactivated at 50 oC in 30 min (Lucas et al., 2001). On the other side, the
Bacillus circulans cellulase was more stable than the studied enzyme, which
was stable up to 50 oC. Seventy-eight % of its activity remained after 72 h,
and the enzyme was inactive at 80 oC (Kim, 1995)
Fig. 30. Effects of temperature on cellulase stability.
0
20
40
60
80
100
120
0 10 20 30 40 50 60 70 80
Temperature
Rela
tive
act
ivit
y (
%)
(oC)
100
DISCUSSION
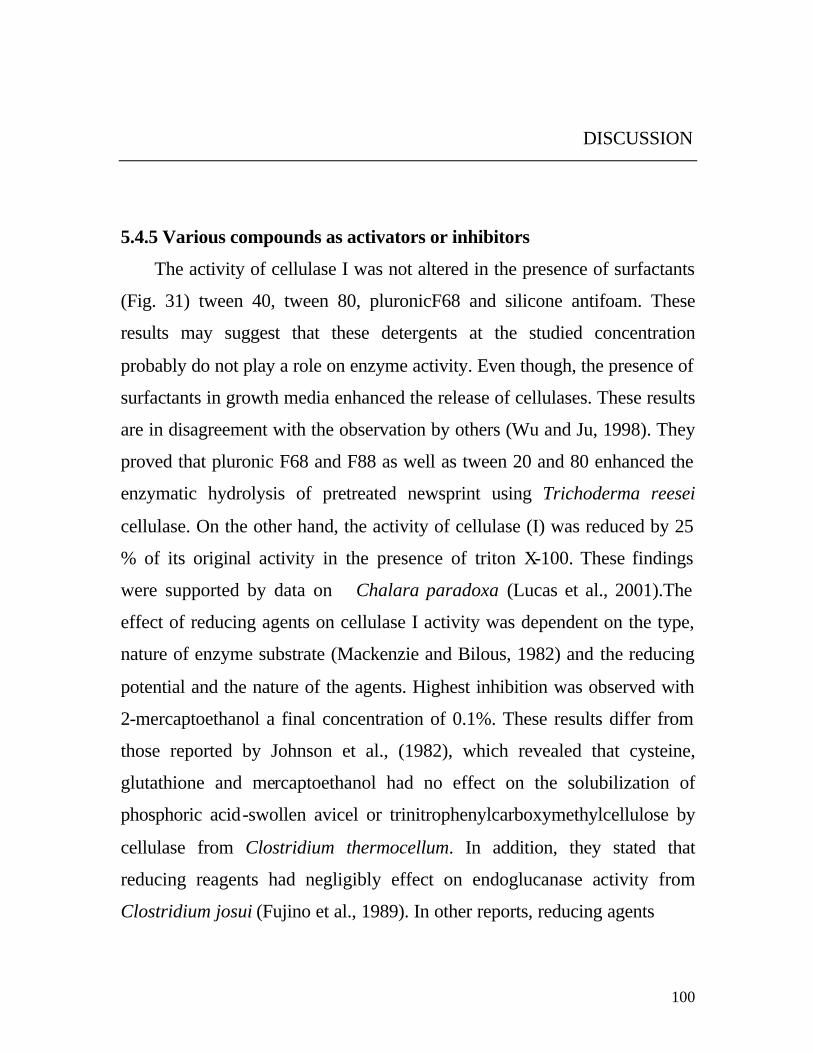
5.4.5 Various compounds as activators or inhibitors
The activity of cellulase I was not altered in the presence of surfactants
(Fig. 31) tween 40, tween 80, pluronicF68 and silicone antifoam. These
results may suggest that these detergents at the studied concentration
probably do not play a role on enzyme activity. Even though, the presence of
surfactants in growth media enhanced the release of cellulases. These results
are in disagreement with the observation by others (Wu and Ju, 1998). They
proved that pluronic F68 and F88 as well as tween 20 and 80 enhanced the
enzymatic hydrolysis of pretreated newsprint using Trichoderma reesei
cellulase. On the other hand, the activity of cellulase (I) was reduced by 25
% of its original activity in the presence of triton X-100. These findings
were supported by data on Chalara paradoxa (Lucas et al., 2001).The
effect of reducing agents on cellulase I activity was dependent on the type,
nature of enzyme substrate (Mackenzie and Bilous, 1982) and the reducing
potential and the nature of the agents. Highest inhibition was observed with
2-mercaptoethanol a final concentration of 0.1%. These results differ from
those reported by Johnson et al., (1982), which revealed that cysteine,
glutathione and mercaptoethanol had no effect on the solubilization of
phosphoric acid-swollen avicel or trinitrophenylcarboxymethylcellulose by
cellulase from Clostridium thermocellum. In addition, they stated that
reducing reagents had negligibly effect on endoglucanase activity from
Clostridium josui (Fujino et al., 1989). In other reports, reducing agents
101
DISCUSSION
significantly enhanced cellulose-solubilizing activity from Acetivibrio
cellulolyticus (Mackenzie and Bilous, 1982).
Data obtained from this study also revealed that EDTA as a chelating
agent had no effect on the activity. This may rule out that cations are not
involved in active catalytic site of the enzyme. Similar results were reported
by Ng and Zeikus (1981). Their observation showed that EDTA had no
effect on the activity of cellulase from Clostridium thermocellum. Also ß-
glucosidase from Aspergillus oryzae and Candida peltata were not affected
by 10 mM EDTA (Riou et al., 1998; Saha and Bothast, 1996).
Strong inhibition of cellulase I was observed with SDS at 0.1% final
concentration. Similar results were obtained by 10 mM SDS on
endoglucanase from Bacillus circulans (Kim, 1995).
Cellulase from Chalara paradoxa was inhibited by Triton X-100,
Tween 80 and SDS, but DTT, 2-mercaptoethanol and cystine did not inhibit
the activity (Lucas et al ., 2001). The purified ß-glucosidase from the above
organism was inhibited by detergents such as SDS, Tween 80 and Triton X-
100, but was not inhibited by DTT, 2-mercaptoethanol and cysteine, (Lucas
et al., 2000). Dithiothreitol and SDS at a concentration of 5 mM reduced the
activity of purified ß -glucosidase from Bacillus polymyxa by 30 % and 85
%, respectively (Painbeni et al., 1992). The chelating agent EDTA did not
inhibit the purified ß-glucosidase from Aspergillus oryzae, but the activity
was significantly inactivated by SDS and N-bromosuccinimide (Riou et al.,
1998).
102
DISCUSSION
Fig. 31. Effects of various chemicals on cellulase I activity.
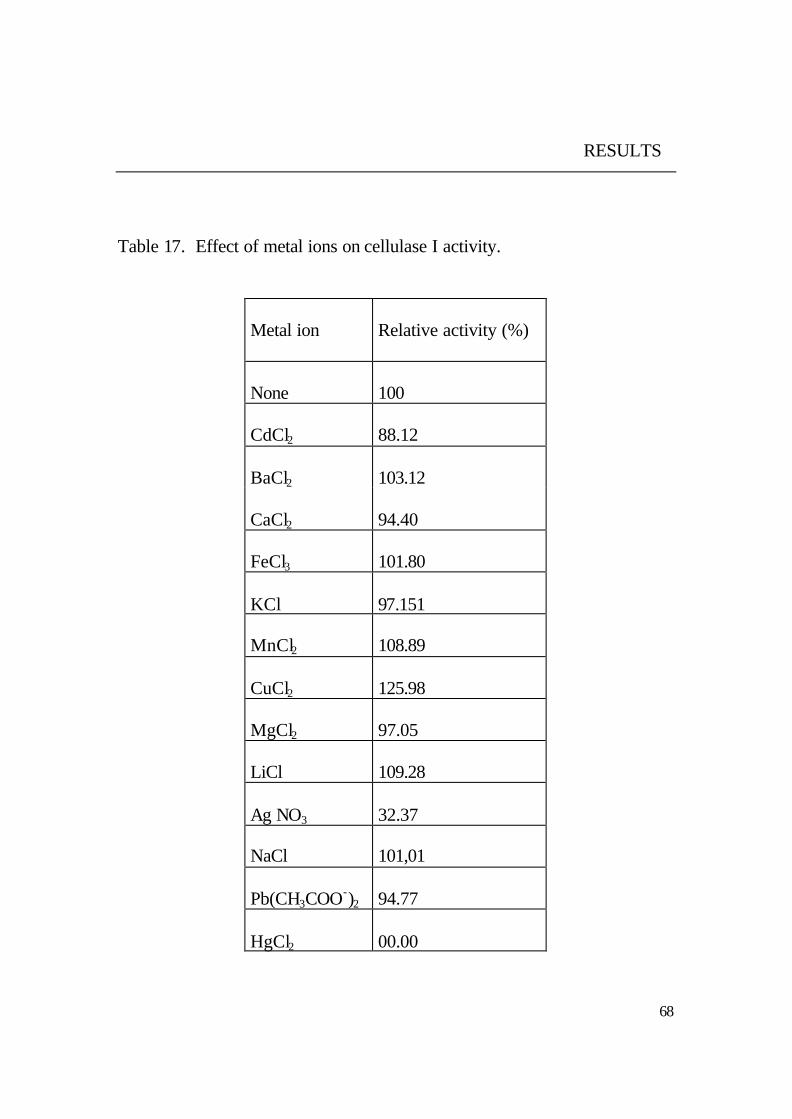
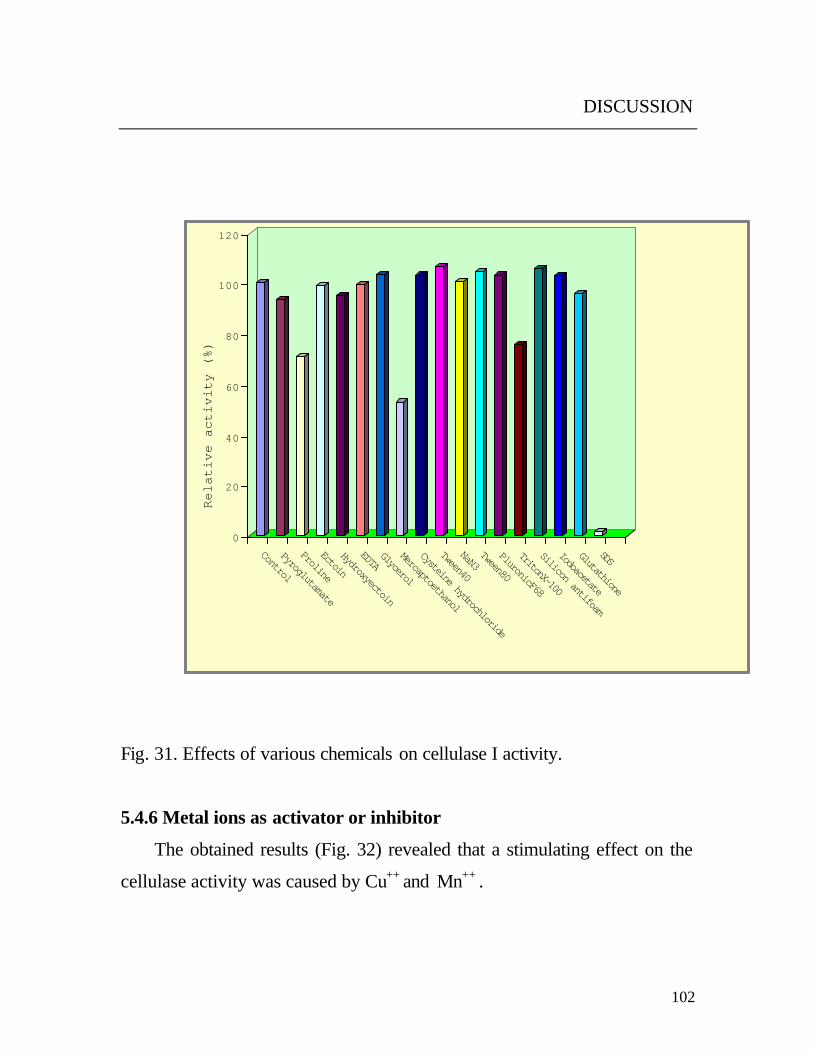
5.4.6 Metal ions as activator or inhibitor
The obtained results (Fig. 32) revealed that a stimulating effect on the
cellulase activity was caused by Cu++ and Mn++ .
0
20
40
60
80
100
120
Rela
tive
act
ivit
y (%
)
Control
Pyroglutamate
Proline
Ectoin
Hydroxyectoin
EDTAGlycerol
Mercaptoethanol
Cysteine hydrochloride
Tween40
NaN3Tween80
PluronicF68
TritonX-100
Silicon antifoam
Iodoacetate
Glutathione
SDS
103
DISCUSSION
In accordance, Mn++ stimulated the activity of cellulases from Chalara
paradoxa and Acetivibrio cellulolyticus (Lucas et al., 2001; Mackenzie and
Bilous, 1982) respectively.
However, variable inhibition on the activity was found by the heavy metals
Pb++, Cd++, Ag+ and Hg++.
The inhibition by sulfhydryl oxidant metals (Ag+ and Hg++) may indicate
that the thiol groups are involved in the active catalytic site. The inhibition
by reducing agents such as mercaptoethanol also supported this assumption.
On the other hand, divalent cations such as Cu++ and Mn++ stimulated the
activity whereas they also can bind on thiol groups, when it is (thiol group)
located in the active site. From the former observations, it can be concluded
that sulfhydryl groups may not be involved in the catalytic center of the
enzyme but rather may be essential for maintenance of the three dimensional
structure of the active protein (Riou et al., 1998; Rutter and Daniel , 1993).
On the other side the no effect of EDTA on the cellulase I activity
indicated that divalent cations are not required for enzyme activation.
However, both Cu++ and Mn++ stimulated the cellulase I activity. Since they
are not involved in the stability of the enzyme, these cations could play a
role in the enzyme function, e.g. by modulating its activity according to
environmental conditions (Riou et al., 1998). The cellulases enzymes vary in
their response to different metal ions. Cellulase from Bacillus sp. No. 1139
was stimulated by addition of Na+ or K+ but completely inhibited by Hg+ or
Cd++ (Fukumori et al., 1985). In other study, the cellulases activity from
104
DISCUSSION
Bacillus stearothermophilus was stimulated by Na+ and Ca++ and inhibited
by Hg++ (Kume and Fujio, 1991).
0
20
40
60
80
100
120
Rela
tive
act
ivit
y (%
)
ControlCd++
Ba++
Ca++
Fe+++K+ Mn++
Cu++
Mg++
Li+
Ag+
Na+
Pb++
Hg++
Metal ions
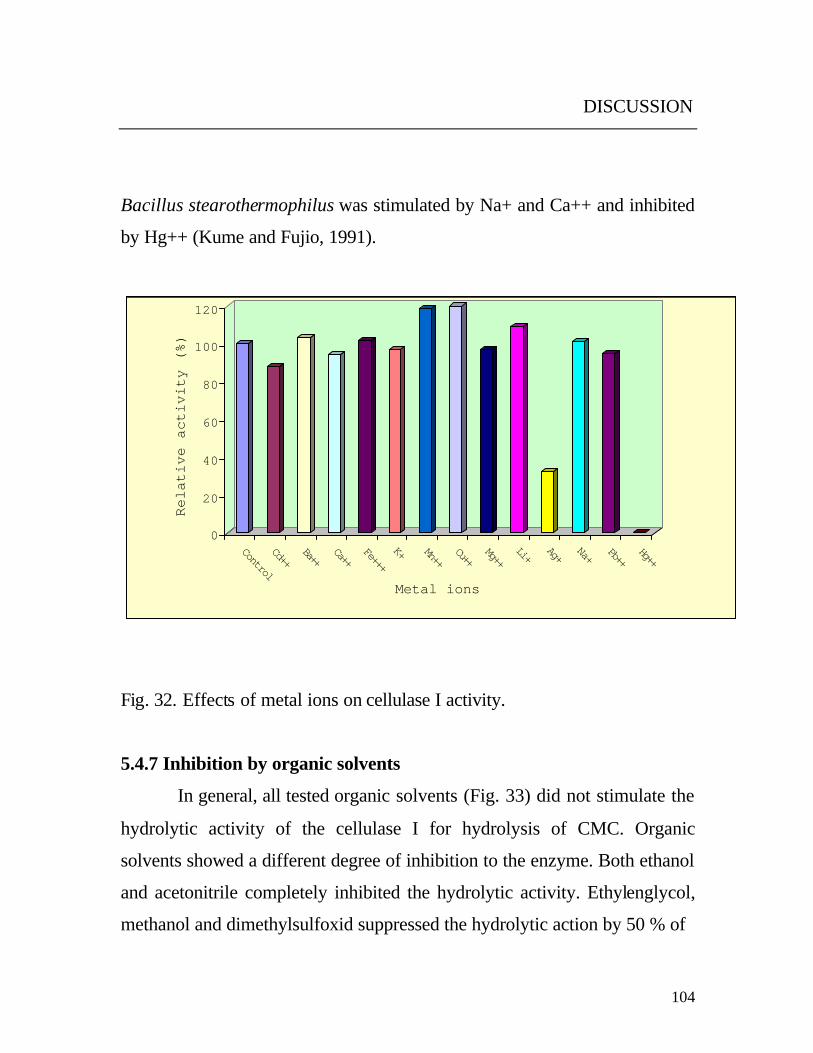
Fig. 32. Effects of metal ions on cellulase I activity.
5.4.7 Inhibition by organic solvents
In general, all tested organic solvents (Fig. 33) did not stimulate the
hydrolytic activity of the cellulase I for hydrolysis of CMC. Organic
solvents showed a different degree of inhibition to the enzyme. Both ethanol
and acetonitrile completely inhibited the hydrolytic activity. Ethylenglycol,
methanol and dimethylsulfoxid suppressed the hydrolytic action by 50 % of
105
DISCUSSION
the original activity. Although the scarce information available on the effects
of organic solvents. It can be suggested that the inhibition effect of tested
organic solvents is most likely due to their denaturation effect on the enzyme
protein. These results are in accordance with those by Lucas et al., (2001).
They found that organic solvents (methanol, ethanol, acetonitrile, ethyl
acetate and dimethylsulfoxide) caused inhibition of the activity of cellulase
from Chalara paradoxa at different degrees.
0
20
40
60
80
100
120
Rela
tive
act
ivit
y (%
)
ControlMethanol
EthanolEthylenglycol
TolueneAcetonitrile
Dimethylsulfoxide
Acetone
Fig. 33. Effects of organic solvents on cellulase I activity.
106
DISCUSSION
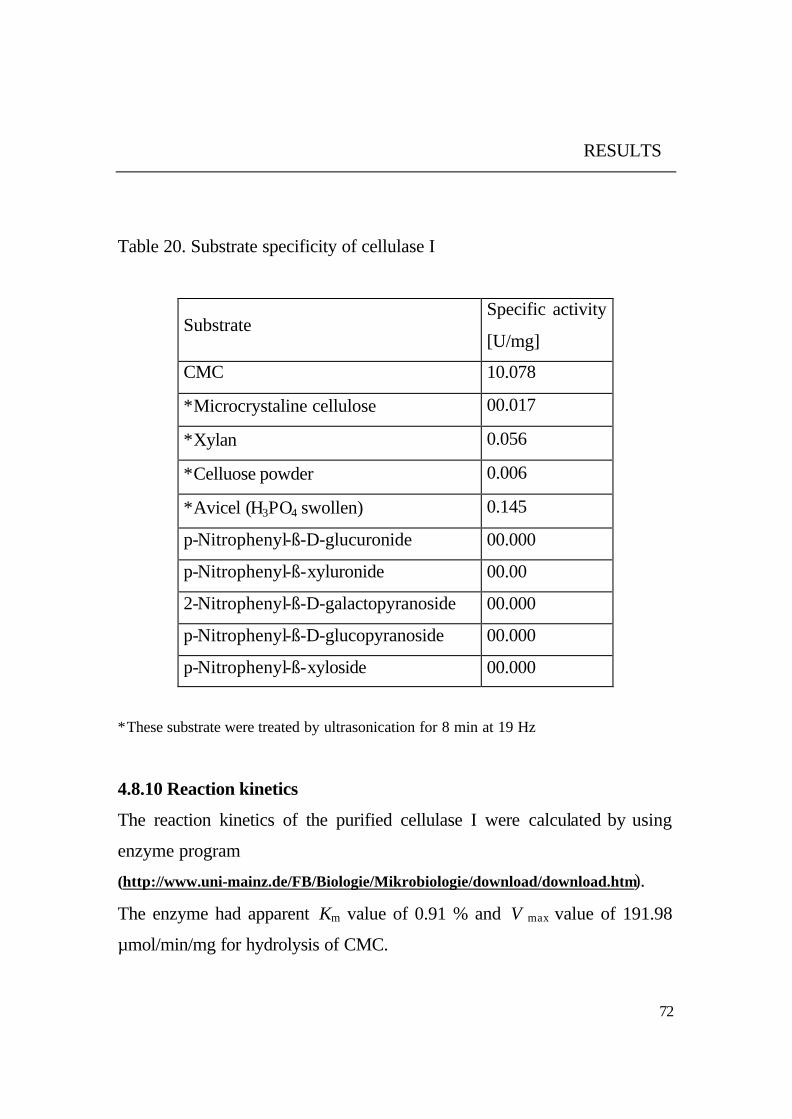
5.4.8 Substrate specificity
The purified cellulase I had relatively high substrate specificity. It can
tolerate a variety of cellulosic substrates. Its specific activity was dependent
on the characteristics of the cellulosic material. CMC was the favorite
substrate, which was hydrolyzed with 36 U/mg. Also the specific activity of
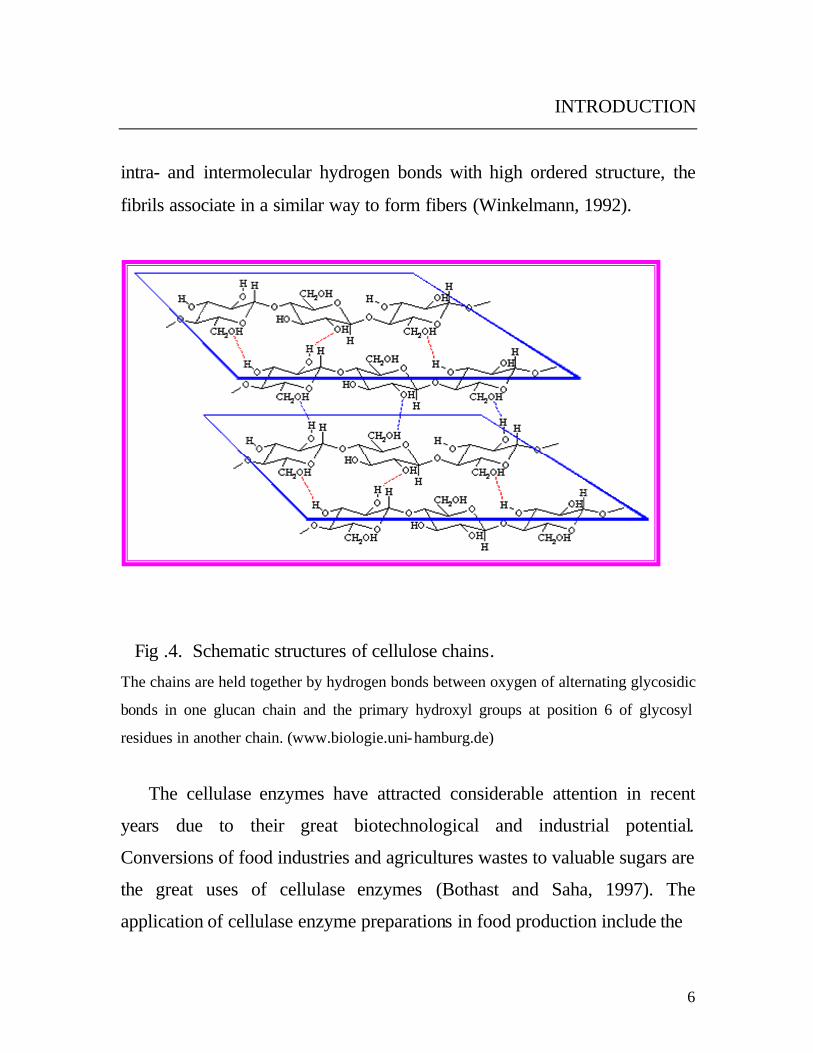
the enzyme against acid swollen avicel was higher than that of sigmacell,
whereas the treatment with phosphoric acid broke the hydrogen bonds
between oxygen of alternating glycosidic bonds in one glucan chain and the
primary hydroxyl groups at position 6 of glycosyl residues in another chain
(Wood et al., 1995). Data also pointed out that the lowest specific activity
was found with cellulose powder. These may be due to the production of an
irreversible tight complex between cellulase and amorphous cellulose
(Carrard et al., 2000). The significant specific activity of cellulase I towards
xylan explained that the enzyme has a flexible specificity for the C-6
position of the glucopyranosyl unit of cellulose. On the other hand, the
enzyme showed no ability to attack the tested di- and trisaccharides with
different ß -linkages. This indicated that all ß-glucosidase enzymes that are
required for hydrolysis of these saccharides were separated efficiently during
the purification process. In comparison of the obtained results with exo-1,4-
ß-glucanase (Avicelase II) from Clostridium stercorarium. It can be
observed that both enzymes were similar in displaying activity towards
microcrystalline cellulose, increase the activity by acid treatment of
microcrystalline cellulose, exhibiting activity towards xylan and showed no
activity towards p-nitrophenyl-ß-derivatives. However, the studied cellulase
107
DISCUSSION
had high specificity towards CMC, while avicellase II had no activity
towards CMC (Bronnenmeier et al., 1991). Results also are in accordance
with those of endo-1,4 ß-glucanase from Clostridium josui which
hydrolyzed significantly microcrystalline cellulose avicel but the extent of
hydrolysis was remarkably lower than that of CMC (Fujino et al., 1989).
5.5 Mode of action and synergism of cellulases
HPLC results demonstrated that the enzyme was capable to degrade the
cellulosic material and its derivatives to ß-(1,4)oligosaccharides with
different chain length. Avicel or CMC were degraded to oligosaccharides
cellobiose; cellotriose; cellotetraose; cellopentaose at a molar ratio; 32 : 16 :
8 : 1, respectively. On the other hand, glucose was not found among the
degradation products. From the degradation products and their molar ratio,
the degradation behavior of the used enzyme can be supposed as follows:
The enzyme hydrolyzed the cellulosic substrates to cellopentaose and
cellotetraose, and then cleaved the cellopentaose to cellobiose and
cellotriose. It splits also the cellotetraose into two units of cellobiose.
However, it could not attack both cellobiose and cellotriose therefore;
glucose was not detected among the hydrolysis products. Similar behavior
was reported from the endo-ß-1,4-glucanase I (Avicelase I) from Bacillus
circulans (Kim, 1995) and endo-ß-1,4-glucanase from Clostridium josui
(Fujino et al., 1989). These reported data supported our supposition.
Whenever the cellulase reaction was supplemented with ß-glucosidase from
108
DISCUSSION
the same yeast, the detected products were only glucose and cellobiose in a
molar ratio of 10:1, respectively. These results showed that Cellulase I had a
synergistic interaction with ß-glucosidase from the same yeast to complete
hydrolysis of the cellulosic materials up to glucose units. Both enzymes
work together as a complete enzyme system, in a sequential manner.
5.6 Systematic position of the yeast isolate .
The systematic position of the yeast isolate PAG1 was determined by
18S rDNA sequence analysis. It showed a close relationship to the described
species Trichosporon. The complete identification of the isolated yeast and
its assignment to one species requires physiological and morphological tests
in addition to molecular methods of DNA analysis.
109
SUMMARY
6 SUMMARY
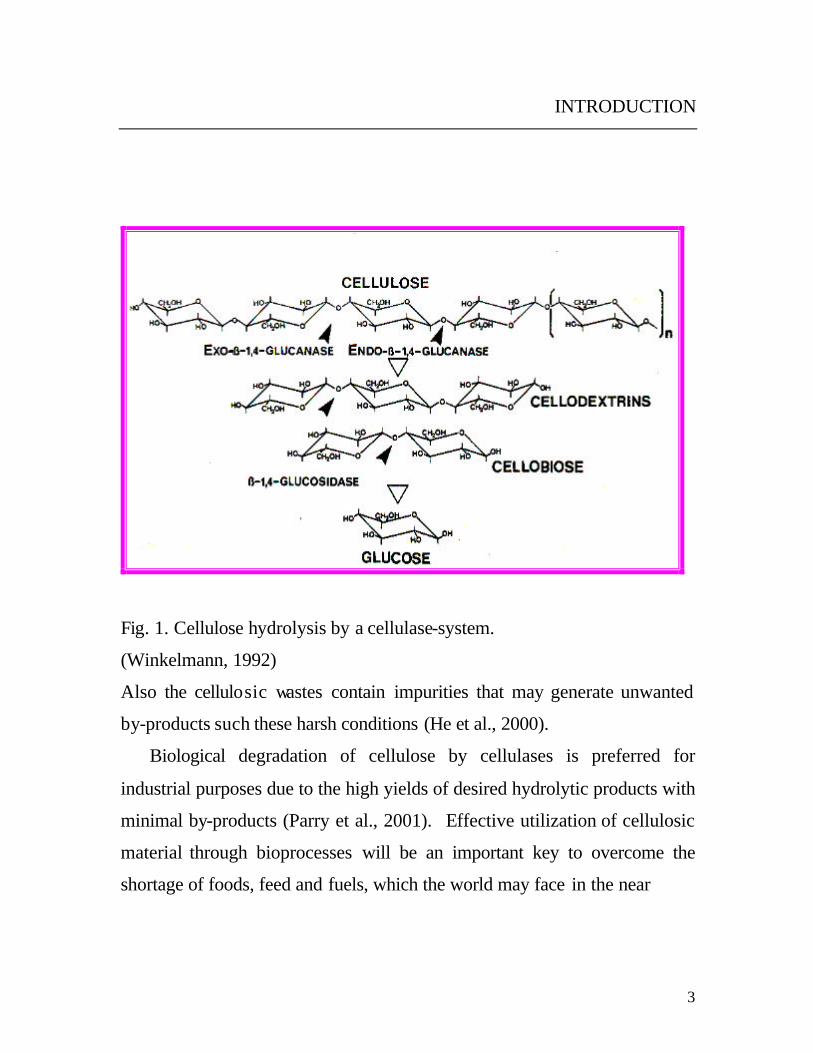
Cellulose is the most abundant organic biopolymer on earth. It is a
linear polysaccharide of glucose residues connected by ß-1,4 linkages.
Effective utilization of cellulosic material through bioprocesses will be an
important key to overcome the shortage of foods, feed and fuels, which the
world may face in the near future because of the explosive increase in
human population. Therefore, cellulose degrading enzymes stimulated our
interest to conduct an extensive study on new cellulase sources from
different perspectives. This work was aimed to isolate, screen a wild type
strain of a cellulolytic yeast and study the suitability of its cellulases for
bioprocesses. The isolated yeast was partially identified by using PCR. It
showed 100 % sequence identity with Trichosporon japonicum, T. asahii, T.
aquatile, T. faecale, T. coremiiforme, T. aquatile and T. asteroids. The
complete identification of the isolated yeast and its assignment to one
species requires physiological and morphological tests in addition to
molecular methods of DNA analysis.
Nutritional and environmental factors which were extensively studied to
monitor the growth and cellulase production. The isolated strain showed
growth and cellulase production at a broad range of temperature from 5 oC to
50 oC with an optimal cellulase production at 30 oC.
Different cellulosic materials and oligosaccharides stimulated the cellulase
excretion, but the best induction was exhibited by lactose 1 % w/v.
110
SUMMARY
The organic nitrogen compounds stimulated higher cellulase yield than
inorganic sources. Peptone at concentration between 0.5 and 0.8 (w/v)
induced the best yield. The yeast survived in media of pH values from 3 to
10. At pH 7 the optimal growth and cellulase production was observed.
Surfactants enhanced the release of cellulase. Highest yield was obtained in
the presence of 0.5 % Tween 80. The cellulase production was induced by
some oligosaccharides but the best induction was exhibited by lactose 1 %
w/v. Culture agitation improved the cellulase excretion; maximum release of
cellulase was noticed at 400 rpm. Cellulase was detected in the cultivation
medium, after 6 h and remained up to more than 72 h of cultivation. The
optimum yield was found at 24 h. Enzymes purification was carried out
using FPLC technique.
Two cellulase peaks (Cellulase I and cellulase II) were found, but only
cellulase I was obtained in a pure preparation. The purified cellulase I was
active over a broad pH range from pH 3 to 9. The highest activity was found
at pH 5.
The enzyme was stable in a broad pH range; it retained more than 80 %
of its normal activity after incubation at pH values from 2 to 9. The enzyme
was also active over a broad range of temperatures from 4 oC to 60 oC). The
temperature optimum was at 40 oC. The enzyme was thermal stable. It
retained more than 90 % of its activity after incubation at 50 oC. No loss of
the enzyme activity was observed during the incubation at 4 oC for 48 h. The
enzyme retained full activity after storage at -20 oC for 30 months. The
effects of chemical compounds on the enzyme activity were determined. The
tested surfactants showed no effect on the activity, except Triton X-100
111
SUMMARY
which reduced 25 % of the original activity. Most of the tested reducing
agents had no effect or showed slightly inhibition on the activity except 2-
mercaptoethanol which reduced 50 % of the optimal activity. On the other
hand, SDS was the strongest inhibitor. The enzyme was inhibited by the
classic metal ion inhibitors such as AgNO3 and HgCl2. In contrary CuCl2 and
MnCl2 stimulated the enzyme activity. Organic solvent caused variable
degrees of inhibition. Inhibition effect on the enzyme activity with different
potential was observed in case of lactose, cellobiose, maltose and
gentiobiose. Total inhibition occurred at 2 mM lactose, while both cellobiose
and maltose caused complete inhibition at 2.6 mM. The purified cellulase I
showed activity towards many types of cellulosic materials such as CMC,
sigmacell, xylan, cellulose powder and acid swollen avicel, while it did not
show any activity towards the different types of the tested oligosaccharides
and p-nitrophenyl derivatives. HPLC analysis of the degradation products
demonstrated that the enzyme was capable to degrade the cellulosic material
and its derivatives to ß-(1,4) oligosaccharides with different chain length.
Avicel or CMC was degraded to the oligosaccharides cellobiose; cellotriose;
cellotetraose and cello- pentaose, at a molar ratio; 32:16:8:1, respectively.
On the other hand, glucose was not found among the degradation products.
Whenever the cellulase reaction was supplemented with ß-glucosidase from
the same yeast, the detected products were only glucose and cellobiose in a
molar ratio of 10:1 respectively.
112
7 Abstract
Production, Purification, Properties and Application of the Cellulases
from a Wild type Strain of a Yeast isolate.
The effective and economic utilization of cellulosic materials will be an
important means to overcome the shortage of foods, feed and fuels, which
the world may face in the near future. Therefore, we have performed
intensive investigations on cellulases from newly isolated yeast strain. The
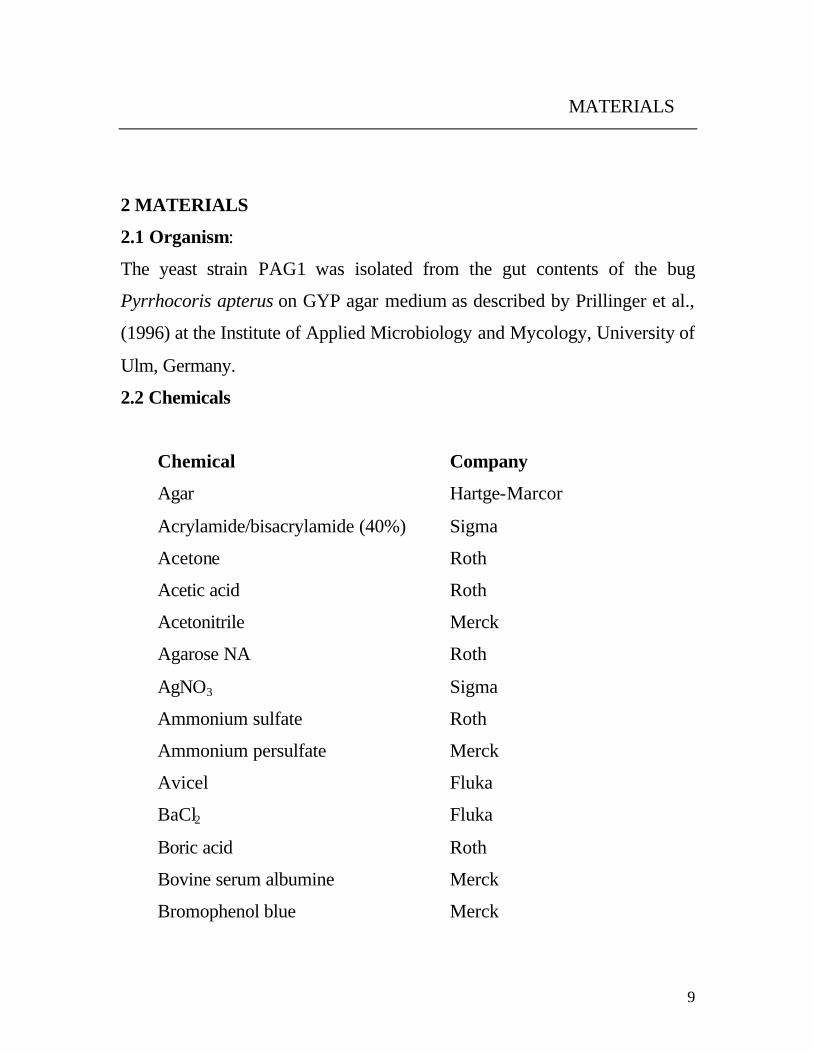
cellulase producing capability of one yeast strain from the soldier bug
Pyrrhocoris apterus was studied in more detail. The systematic position of
the yeast isolate PAG1 was determined by 18S rDNA sequence analysis. It
showed a close relationship to the described species Trichosporon. The
growth conditions for optimal cellulase production were studied. One of the
produced cellulases was purified to homogeneity. Its biochemical
characteristics, e.g. substrate specificity, temperature and pH optimal as well
as the influence of chemical compounds, were determined. Analysis of the
degradation products demonstrated that crystalline cellulose and carboxy-
methylcellulose were degraded to cellobiose, cellotriose, cellotetraose and
cellopentaose in a molar ratio of 32:16:8:1, respectively. When ß-
glucosidase from the same yeast strain was added only glucose and
cellobiose in a molar ratio of 10:1 were detected. Only one report on
cellulase production by yeast strains has been published so far. Our
investigations show for the second time that also wild type yeast strains can
produce cellulases with some interesting features.
113
8 Kurzzusammenfassung
Produktion, Reinigung, Eigenschaften und Anwendung von Cellulasen
eines Wildtyp-Hefeisolates.
Die effiziente Verwendung von Cellulose wird in naher Zukonft ein
wichtiges Instrument zur Vermeidung einer Nahrungsmittel- und
Energieknappheit werden. Deshalb haben wir uns intensiv mit Cellulasen
befaßt, die aus Hefestämmen isoliert wurden. Die Fähigkeit der Cellulase-
produktion eines Hefe-Stammes der Feuerwanze Pyrrhocoris apterus wurde
genauer untersucht. Die systematische Stellung des Hefe-Isolates PAG1
wurde durch Sequenzierung der 18S rDNA bestimmt. Es zeigte eine nahe
Verwandtschaft zu einem bereits beschriebenen Stämme der Gattung
Trichosporon. Außerdem wurden die Wachstums-bedingungen für eine
optimale Cellulase–Produktion bestimmt. Anschließend konnte eine der
produzierten Cellulasen mit FPLC aufgereinigt und deren biochemische
Eigenschaften (z.B. Substratspezifität, Temperatur optimum, optimaler pH-
Wert, Einfluß von Chemikalien) untersucht werden. Eine Analyse der
Abbau-Produkte zeigte, daß kristalline Cellulose und CMC zu Cellobiose,
Cellulotriose, Cellulotetraose und Cellulopentaose in einem molaren
Verhältnis von 32:16:8:1 umgesetezt wurden. Bei Zusatz von ß-Glykosidase
aus demselben Hefestamm entstand nur Glucose und Cellobiose in einem
molaren Verhältnis von 1:10. Da bisher nur eine Publikation über Cellulase-
produzierende Hefe-Stämme erschienen ist, zeigen auch unsere
Untersuchungen, daß Wildtyp-Hefestämme Cellulasen mit interessanten
Eigenschaften produzieren können.
114
REFERENCES
7 REFERENCES
ABDEL-FATTAH, A. F., OSMAN,M. Y.& ABDEL-NABY, M.A. (1997)
Production and immobilization of cellobiase from Aspergillus niger
A20. Chem. Eng. J. 68, 189-196.
AMOR. Y., HAIGLER, C., JOHNSON, S., WAINSCOTT, M. & DELMER,
D. (1995) A membrane-associated form of sucrose synthase and its
potential role in synthesis of cellulose and calose in plants. Proc. Natl.
Acad. Sci. USA. 92, 9353- 9357.
ARTHUR, H. & WATSON, K. (1976) Thermal adaptation in yeast: growth
temperature membrane lipid and cytochrome composition of
psychrophilic, mesophilic and thermophilic yeasts J. Bacteriol. 128,
56- 68.
BÉGUIN, P. & AUBERT, J. P. (1994) The biological degradation of