FIW, a collaboration of WIFO (www.wifo.ac.at), wiiw (www.wiiw.ac.at) and WSR (www.wsr.ac.at) FIW – Working Paper Productivity Effects of Knowledge Transfers through Labour Mobility Johannes Pöschl 1 and Neil Foster The paper addresses the link between productivity and labour mobility. The hypothesis tested is that technology is transmitted across industries through the movement of skilled workers embodying human capital. The embodied knowledge is then diffused within the new environment creating spillovers and leading to productivity improvements. The empirical analysis is based on household survey and industry-level data for a sample of 12 EU countries covering the years 1995-2005. The estimates document the importance of positive cross-sectoral knowledge spillovers and indicate that labour mobility has considerable beneficial effects on industry productivity. Possible endogeneity problems related to labour mobility are tackled by employing a two stage instrumental variables approach. Moreover we show that the spillover effects vary considerably by technology level of the giving industry. While workers moving away from high and medium-tech industries are found to produce positive productivity effects for the receiving industry, no effect is found for those coming from low-tech industries. JEL: J24, J60, O47 Keywords: Knowledge Spillovers, Labour Mobility, Productivity, Human Capital, Industry Level 1 The Vienna Institute for International Economic Studies Email: [email protected], Tel: +43 1 53366 10-18 Abstract Authors FIW Working Paper N° 117 April 2013
Transcript
FIW, a collaboration of WIFO (www.wifo.ac.at), wiiw (www.wiiw.ac.at) and WSR (www.wsr.ac.at)
FIW – Working Paper
Productivity Effects of Knowledge Transfers through Labour Mobility
Johannes Pöschl1 and Neil Foster
The paper addresses the link between productivity and labour mobility. The hypothesis tested is that technology is transmitted across industries through the movement of skilled workers embodying human capital. The embodied knowledge is then diffused within the new environment creating spillovers and leading to productivity improvements. The empirical analysis is based on household survey and industry-level data for a sample of 12 EU countries covering the years 1995-2005. The estimates document the importance of positive cross-sectoral knowledge spillovers and indicate that labour mobility has considerable beneficial effects on industry productivity. Possible endogeneity problems related to labour mobility are tackled by employing a two stage instrumental variables approach. Moreover we show that the spillover effects vary considerably by technology level of the giving industry. While workers moving away from high and medium-tech industries are found to produce positive productivity effects for the receiving industry, no effect is found for those coming from low-tech industries. JEL: J24, J60, O47 Keywords: Knowledge Spillovers, Labour Mobility, Productivity, Human
Capital, Industry Level
1 The Vienna Institute for International Economic Studies Email: [email protected], Tel: +43 1 53366 10-18
Abstract
Authors
FIW Working Paper N° 117 April 2013
Productivity Effects of Knowledge Transfers
through Labour Mobility
Abstract
The paper addresses the link between productivity and labour mobility. The hypothesis
tested is that technology is transmitted across industries through the movement of
skilled workers embodying human capital. The embodied knowledge is then diffused
within the new environment creating spillovers and leading to productivity
improvements. The empirical analysis is based on household survey and industry-level
data for a sample of 12 EU countries covering the years 1995-2005. The estimates
document positive cross-sectoral knowledge spillovers and indicate that labour
mobility has considerable beneficial effects on industry productivity. Possible
endogeneity problems related to labour mobility are tackled by employing a two stage
instrumental variables approach. Moreover we show that the spillover effects vary
considerably by technology level of the giving industry. While workers moving away
from high and medium-tech industries are found to produce positive productivity
effects for the receiving industry, no effect is found for those coming from low-tech
industries.
JEL Classification
J24, J60, O47
Keywords
Knowledge Spillovers, Labour Mobility, Productivity, Human Capital
Productivity Effects of Knowledge Spillovers resulting from Labour Mobility (2013) 2
1 Introduction
In the two decades before and after the millennium, we have experienced in almost all European
countries a restructuring of industries with medium and high skilled workers moving away from
low-tech to medium and high-tech industries. The essential question that arises is: What effect does
this labour mobility have on industry productivity? Are those people able to make good use of their
previously obtained knowledge or does this process possibly lead to negative productivity effects
for higher tech industries?
The recent spillover literature provides estimates for the productivity effects of knowledge and
technology transfers across firms, industries and countries. The main channels of technology
diffusion that have been considered in the literature are trade (Coe and Helpman 1995), input-
output linkages (Terleckyj 1974; Keller 2002a) and FDI (Lichtenberg and van Pottelsberghe de la
Potterie 2001; Lee 2006). Labour mobility has also been analysed (Almeida and Kogut 1999;
Guarino and Tedeschi 2006), though a theoretical framework and precise estimates are still missing.
In this paper, we aim to fill this gap by building on previous efforts in the input-output and trade
spillover literature.
Initial efforts at estimating the productivity effects of inter-industry R&D spillovers were made
by Griliches (1973) and Terleckyj (1974). In their pioneering work, they underline the importance
of domestic spillovers focussing on input-output relations as a transmission channel. Keller (2002a)
follows this and other earlier studies (Bernstein and Nadiri 1988; Coe and Helpman 1995) and
analyses the role of trade in advanced intermediate goods for technology transmission across
industries and countries. The results suggest that spillovers from R&D activities of other industries
are substantial and that the resulting productivity effect is approximately of the same magnitude as
the one from the industry’s own R&D efforts. The size of the spillover effect has been found to
depend on the absorptive capacity of the industry or country however. A number of studies
confirm that increases in human capital augment absorptive capacity and enhance productivity
Productivity Effects of Knowledge Spillovers resulting from Labour Mobility (2013) 3
gains resulting from spillover effects (for developing countries see Engelbrecht 2002, Falvey et al.
2007 and Wang 2007 and for OECD countries see Engelbrecht 1997 and Frantzen 2000).
Related to the concept of absorptive capacity are spillovers through FDI and labour mobility.
They arise because of the imperfect appropriability of knowledge associated with innovations
(Cincera and van Pottelsberghe de la Potterie 2001). Arrow (1962) addresses this problem and
states that “no amount of legal protection can make a thoroughly appropriable commodity of
something as intangible as information”. This becomes clear when looking at the two main outputs
of innovative activities. The standard goal of applied research is the creation of information leading
to the production of new goods. To a large extent, this usually non-rivalrous information can be
codified by patents. Moreover, conducting R&D leads to an increase in the researchers’ knowledge
in the respective field (Zucker et al. 1998) and this intellectual human capital is very difficult to
protect. Firm specific information or knowledge referring to patented innovations of the company
may be protected by contracts, but not the full set of ideas that a worker acquires during the
research process. Through R&D collaborations or mobility of personnel between firms,
information is spread since workers apply and share the prior obtained experience and knowledge
in the new environment.
Almeida and Kogut (1999) contribute to the empirical research regarding spillovers from
labour mobility by demonstrating that the driving force for knowledge externalities is the mobility
of technical key engineers and patent holders. Song et al. (2003) confirm this learning-by-hiring
effect studying patenting activities in the semiconductor industry. The overall labour mobility
pattern is found to be strongly related to the proximity of industries (Guarino and Tedeschi 2006).
Workers are more likely to move to related industries as they are better able to use prior obtained
technological knowledge there. Since labour mobility poses a threat to the innovating firm by
reducing returns to innovative activity, firms need to account for them (Kim and Marschke 2005).
Productivity Effects of Knowledge Spillovers resulting from Labour Mobility (2013) 4
Moen (2005) has shown that R&D intensive companies are able to cultivate more durable
employer-employee relationships as a result of steeper wage curves.
Regarding the connection between labour mobility and productivity, the literature is rather
scarce. While the spillover literature has analysed human capital with respect to its importance for
absorptive capacity, its role as a direct source of spillovers has been widely neglected in this strand
of literature. A study by Thulin (2009) estimates the effect of labour mobility on regional wage
growth and finds a positive effect. A very recent paper by Stoyanov and Zubanov (2012) looks a
Danish manufacturing data and finds that firms that hire workers from more productive firms
experience productivity gains one year after the hiring. To our knowledge, no estimates exist for the
effects of domestic labour mobility spillovers on overall industries’ productivity.
In the face of intensified labour mobility in the new economy, understanding spillover effects
resulting from these transfers of human capital across industries is vital (Magnani 2008). Our study
shortens this gap in the literature and provides estimates for the productivity effects of knowledge
spillovers resulting from labour mobility. In particular we investigate to what extent knowledge
acquired in a research intensive environment can be transferred across industries in the form of
human capital. The estimation is carried out on a sample of 12 EU countries using a comparable
dataset based on guidelines from Eurostat. The dataset does not however have information on
cross-country labour mobility, which thus forces us to concentrate on job mobility across industries
within each of the countries. The estimated empirical model is constructed on the basis of a
theoretical model presented below. The basic model is then extended and re-estimated with
separate coefficients for high, medium and low technology industries to account for the
heterogeneity of the manufacturing sector. Furthermore, we control for spillovers resulting from
improved intermediate products.
Another issue that we need to address is the possible endogeneity of labour flows. Looking at
labour mobility, we identify two main reasons for job switches. First of all, workers may want to
Productivity Effects of Knowledge Spillovers resulting from Labour Mobility (2013) 5
increase the match between the job requirements and their abilities and goals (Topel and Ward
1992). “Goal” can be defined as a rather broad term, including job plans for the future, work-life
balance, the desire for learning opportunities and so on. In general, a better match in terms of
abilities should lead to higher wages. This brings us to the second reason for job switches: many
employees switch firms simply in order to receive higher wages. If some industries pay higher
wages for the same qualification profile, this leads to endogeneity issues with respect to labour
flows, which we address in our paper by employing an instrumental variable approach.
Last but not least we perform a counterfactual analysis. According to our theory, knowledge is
transmitted across industries foremost via the mobility of medium and high skilled workers. In
order to strengthen this hypothesis, productivity effects resulting from flows of lower skilled
workers are estimated.
The remainder of the paper is set out as follows: section 2 provides a theoretical model,
section 3 describes the datasets used, section 4 gives information on the empirical approach,
section 5 reports main results and section 6 concludes.
2 Theoretical background
This section will provide the theoretical background for the empirical analysis. The framework fits
into the category of endogenous growth models with the focus on labour augmenting knowledge
spillovers. The goal is to provide estimates for the effects of labour mobility on an industry’s
productivity, in a similar manner to the recent literature on trade and input-output spillovers (Coe
and Helpman 1995; Keller 2002a; Wang 2007).
Productivity Effects of Knowledge Spillovers resulting from Labour Mobility (2013) 6
In the model, output Y of an industry i is assumed to be produced according to a Cobb
Douglas production function with the inputs labour ��, information and communication
technology (ICT) capital services ���� and non ICT capital services ��.
� � �� ����� �� � � � � � 1 �, �, � � 0 (1)
�� is a positive constant and �� denotes effective labour input in industry i. In the EU KLEMS
database, which will be used for the subsequent empirical analysis, multifactor productivity (MFP) is
estimated controlling for the inputs ICT and non-ICT capital services and the number of
employees, differentiated by skill groups (Inklaar et al. 2008), that is:
where ��, �� and �! represent the numbers of high, medium and low skilled workers,
with $, % and & being the respective coefficients in the production function. The sum of these
estimated coefficients is assumed to be equal to the coefficient � of the effective labour input � in equation (1). Combining equations (2) and (1) leads to an industry specific multifactor productivity
of
��� � �� ����� �� �� ����� ������ �! "# � ��
����� �! " (3)
While the real labour productivity function � remains unobservable, it is clear that the
productivity of workers does not solely depend on their initial education level as in the MFP
measure, but also on experience. Working in a setting which provides access to valuable
information increases the employee’s human capital stock and thus their market value. The on-the-
job learning curve is therefore influenced by the working environment as well as education and of
Productivity Effects of Knowledge Spillovers resulting from Labour Mobility (2013) 7
course personal characteristics of the employee, though the latter are unlikely to matter at the
aggregated industry level.
Once employees have acquired additional information, the employer faces the possibility of
knowledge outflows as the employee might be tempted to join or set up a rival. Due to the
imperfect appropriability of knowledge associated with innovation (Cincera and van Pottelsberghe
de la Potterie 2001), the employer is unable to fully protect the firm’s knowledge stock. Especially
in research intensive working areas, labour mobility is a major knowledge diffusion channel, as
state-of-the-art technologies are often tacit knowledge (Hoisl 2007; Winter 1987).
Pakes and Nitzan (1983) provide a theoretical framework for this dilemma of hiring scientists
for R&D projects who might use the acquired knowledge afterwards in a rival enterprise. The
solution to their theoretical model implies that scientists and engineers in R&D intensive firms
accept a significant wage discount at the beginning of their career in the face of on-the-job learning
opportunities. After some years of experience, this wage discount transforms into a premium,
taking into account the increased market value of the employee. Similarly, Gersbach and
Schmutzler (2003) state that firms can keep their employees from leaving by offering sufficiently
high wages. These predictions were empirically tested and confirmed by Moen (2005). Additionally,
Moen finds that innovative companies tend to cultivate more durable employer-employee
relationships, indicating that the potential loss in human capital per worker seems to be higher for
R&D intensive firms. These findings strongly support the theory that the R&D intensity of a firm
affects learning opportunities for the employees. Hence it seems feasible to use R&D intensity as a
proxy for human capital acquisition in our model.
We assume that workers start with a knowledge stock '()*, depending on their education level, which in our model will be approximated by years of schooling. While working in an industry, they
gain access to its knowledge approximated by the R&D stock of the industry, +. The extent to which a worker has absorbed the industry’s knowledge depends on the transferability of
Productivity Effects of Knowledge Spillovers resulting from Labour Mobility (2013) 8
knowledge, �,.1 In an aggregate form, the approximated effective labour productivity function �-. , accounting for the different skill composition and absent labour mobility can thus be written as
�-. /��� 0 �� 0 �! " 0 1'-* 0 +2�345� (4)
where ��, �� and �! are again the numbers of high, medium and low skilled workers
respectively, and 1'-* 0 +2�3 represents the experience term, expressed as an increase in the
human capital stock of the average worker through R&D. Differently put, that means that R&D
effects productivity through an increase in the human capital stock of the employees. For reasons
of empirical tractability we assume that the knowledge absorption capabilities from R&D depend
linearly on years of schooling.
If workers now leave the firm and enter another company, they take ideas and past experiences
with them, which they are likely to share with their new colleagues. Song et al. (2003) provide
evidence for this learning-by-hiring effect using patent data from the American semiconductor
industry. The degree to which skills are transferable however varies across pairs of industries. That
means that for example knowledge acquired in the rubber and plastics sector may be of great value
in the petroleum industry, but less applicable in the paper production sector. Hence workers from
the rubber and plastics sector are more likely to move to the petroleum industry. More generally,
workers are expected with a higher probability to move to “closer” industries where they can make
better use of their accumulated human capital, where they are more productive and where they
receive higher wages. Pack and Paxson (1999) analyse this topic and confirm that labour mobility
patterns are strongly linked to industry proximity, measured by input-output linkages and/or
similarity of inputs. They also look at the effects of industry proximity on wages, which can be seen
1 Unfortunately, there is no complete working history available for the dataset. Therefore we can only include working experiences
directly before the last employer switch into the estimations of the human capital stock.
Productivity Effects of Knowledge Spillovers resulting from Labour Mobility (2013) 9
as a proxy for worker productivity. The authors find that a move to more similar industries
produces larger wage gains, controlling for observable factors like age, years of education, marital
status, gender and a set of dummy variables for firm size, year and job tenure.
Based on these finding, we will use labour mobility patterns to provide information on
knowledge flows between industries. A very important issue hereby is the usage of knowledge in
the receiving industry. We have chosen to weight the transmitted human capital stock by labour
flows only and decided against an additional weighting by industry proximity, which would be an
extra measure of how well knowledge embodied in mobile workers can be used in the receiving
industry. This was done for three reasons: Firstly, Pack and Paxson have shown that labour
mobility patterns are closely related to industry proximity and thus these patterns already reflect the
utility of knowledge in another industry. Secondly, Song et al. (2003) and Mowery et al. (1998)
propose that mobility can be more likely to result in inter-firm knowledge transfer when “the hired
engineers possess technological expertise distant from that of the hiring firm” – therefore weighting
the knowledge flows by industry proximity might be counterproductive. Thirdly, firms usually do
not employ people if their working history does not match the job description. Therefore people
who move to industries which are not closely linked to the one of origin are most likely doing so
because their new environment is able to make good use of their abilities regardless of the general
industry proximity. In addition, job changes are only considered where people were already part of
the workforce one year before. Thus, many changes occur voluntarily, strengthening the previous
matching argument.
In order to estimate the impact of this knowledge transfer through labour mobility on the
productivity in the receiving sector, we include the knowledge stocks of the workers who moved to
industry i. With this addition, the new approximated effective labour productivity function �. depends upon the human capital stocks of the workers staying in the industry (6,) as well as the stocks of workers moving to the analysed industry (67). The two terms 6, and 68, that is:
Productivity Effects of Knowledge Spillovers resulting from Labour Mobility (2013) 10
where =F represents the number of workers moving from industry j to i and =F stands for the total number of people employed in industry j. Accordingly = denotes the people staying in industry i, '-F* is the average education level of workers moving from industry j to industry i
approximated by years of schooling and '-* the level of those staying in industry i, while + and +F are the R&D stocks of the industries. Finally, �7 denotes the transferability of knowledge from the
R&D stocks of other industries, made available through the movement of skilled workers
embodying human capital. The two terms 6, and 68 enter in a multiplicative form as the
knowledge stock of workers moving to the analysed industry diffuses within the new environment
and has an effect on other workers as well.
6, is defined similarly to the experience term in equation (4) but now weighted by the share of
people staying in the industry =/=. This weighting is applied because labour outflows create knowledge outflows that firms have to take into account. As a result, labour mobility out of the
industry leads to a lower actual human capital stock of the analysed industry in our model. If we
had assumed that knowledge in an industry is similar to a club good and can be used by all workers,
it would remain completely in the industry. But the assumption in this framework is that the ideas
and experience that employees acquire during their work is mostly private knowledge. As these
ideas are the basis for future productivity increases, an outflow of this knowledge affects
productivity increases negatively. Nonetheless, a sensitivity analysis based on the assumption that
the knowledge remains completely in the industry is provided in the empirical section.
Productivity Effects of Knowledge Spillovers resulting from Labour Mobility (2013) 11
67 represents the sum of the received human capital stocks from other industries weighted by
the respective labour movements. The knowledge flows from industry j to i depends upon the
number of people moving from j to i (=F), their average initial human capital stock and their past
learning opportunities approximated by the R&D stock +F of industry j. The weighting as applied can be described or interpreted in a number of ways. We can say for
example that industry j’s overall knowledge base '-F 0 +F is weighted by the people moving from
industry j to industry i (=F) scaled by the total number of workers originally employed in industry j
(=F). An alternative interpretation would be that the average human capital stock per worker in
industry j ('-F 0 +F/=F) is multiplied by the number of people =F switching from a job in industry j to
one in industry i. Similar to the argument above, the assumption here is that the private nature of
the employee’s ideas and knowledge leads to a knowledge outflow if he leaves the industry.
A number of other possible weighting schemes could be considered. We discuss two
alternatives here and explain why they are not suitable for our framework. One possibility would be
to simple weight the human capital stock '-F 0 +F by the level of workers moving from industry i to
j without scaling the measure by =F . With this specification we would need to make the strong
assumption that knowledge is completely public however. This would mean that each worker
moving from industry j would be able to transfer the whole knowledge stock to another industry
which is in contrast to findings for example by Almeida and Kogut (1999) and Hoisl (2007).
A second possibility would be to scale by the number of people in the target industry (=# rather than the number in the origin industry (=F). This is consistent with the idea of an inflow of knowledge to industry i expressed relative to the share of new labour. With different industry sizes,
this is problematic however. If the industry of origin is small and the target industry big, then the
resulting knowledge flow would be extremely small. Workers who move could be a large share of
the people originally working in industry j, taking a great amount of tacit knowledge with them, but
Productivity Effects of Knowledge Spillovers resulting from Labour Mobility (2013) 12
they would only be a small fraction of the people then working in i. Since the R&D stock already
accounts for differences in industry size, this weighting would disproportionately diminish
spillovers from small industries and not properly capture relative knowledge flows.
We can now substitute the real labour productivity function � in equation (3) by the approximated function �. of equation (5). Equation (6) now yields the starting point for our empirical analysis with MFP depending on a technology constant �O and the human capital
Notes: All indicators in %; country figures do not include NACE 20, 23 and 36t37 for reasons of distortion; R&D investment is based on PPP adjusted USD data which was deflated using the GFCF deflator from Eurostat; *Mean annual average growth of value added MFP between 1995 and 2005, weighted by value added; **Based on R&D investment in 2000; †Based on total number of employees in 2000; ‡Based on gross value added in 2000 calculated from the WIOD database.
TABLE 2
High and medium educated workers moving from industry i to j in percent of all moving workers in the sample (average across years)
from \ to 15t16 17t19 20 21t22 23 24 25 26 27t28 29 30t33 34t35 36t37 D
where ���WX denotes the multifactor productivity of industry i in country c at time t, and �, and �7 are the two coefficients to be estimated for the explanatory human capital variables. The
construction of these variables follows directly from equation (5). Year dummies �X are included to account for global shocks that affect all countries and industries. Country fixed effects �W control for differences in human capital, institutions or regulation in the labour market, while a set of
industry dummies � are included to account for differences in productivity across sectors due for example to automatisation possibilities that may vary by industry. Finally YWX denotes the error term. Note that we do not include labour flows on its own as a covariate. This is because the MFP
function already accounts for the skill structure as the estimation of MFP uses information on
Productivity Effects of Knowledge Spillovers resulting from Labour Mobility (2013) 20
workers differentiated by the education levels low, medium and high at the industry level. Thus,
changes in the skill structure through labour mobility are already accounted for.
4.2 Cointegration issues
There are a couple of issues that have to be addressed and accounted for before moving on to
the estimation. The primary concerns are cointegration, simultaneity and serial correlation. The
standard OLS estimator is consistent even under panel cointegration but produces invalid standard
errors due to a second-order asymptotic bias (Kao et al. 2000). Furthermore it suffers from an
endogeneity bias. Newly available cointegration estimation techniques such as Dynamic OLS
(DOLS) or Fully Modified OLS (FMOLS) correct for endogeneity biases and serial correlation and
thus allow us to construct valid t-statistics (Banerjee 1999; Breitung and Pesaran 2005). These
techniques have been employed in a number of articles in the spillover literature (Lee 2006; López-
Pueyo et al. 2008; Coe et al. 2009) as well as in other strands of research.
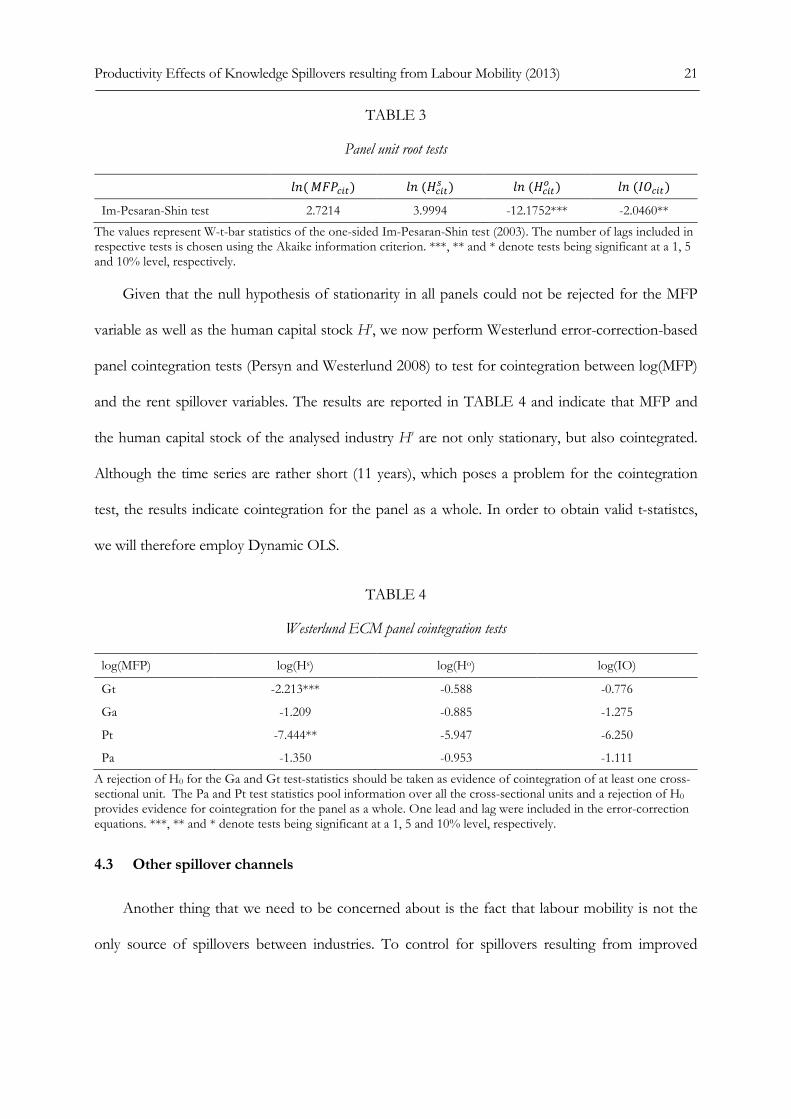
First, we test for the existence of unit roots in the dataset using the Im-Pesaran-Shin test (IPS)
(2003). If the null hypothesis of the IPS test cannot be rejected, it indicates that all panels have a
unit root (H0: Z 0 [�). The alternative hypothesis is that at least one panel is stationary. In contrast to other tests such as the Levin-Lin-Chu test (LLC), the IPS test relaxes the assumption of
a common Z for the whole panel. TABLE 3 presents the results for the panel unit root tests. For MFP and Hs there is a strong indication that all panels contain a unit root. The fraction of non-
stationary panels is not equal to zero for the spillover variable Ho as well as the input-output control
variable IO.
Productivity Effects of Knowledge Spillovers resulting from Labour Mobility (2013) 21
The values represent W-t-bar statistics of the one-sided Im-Pesaran-Shin test (2003). The number of lags included in respective tests is chosen using the Akaike information criterion. ***, ** and * denote tests being significant at a 1, 5 and 10% level, respectively.
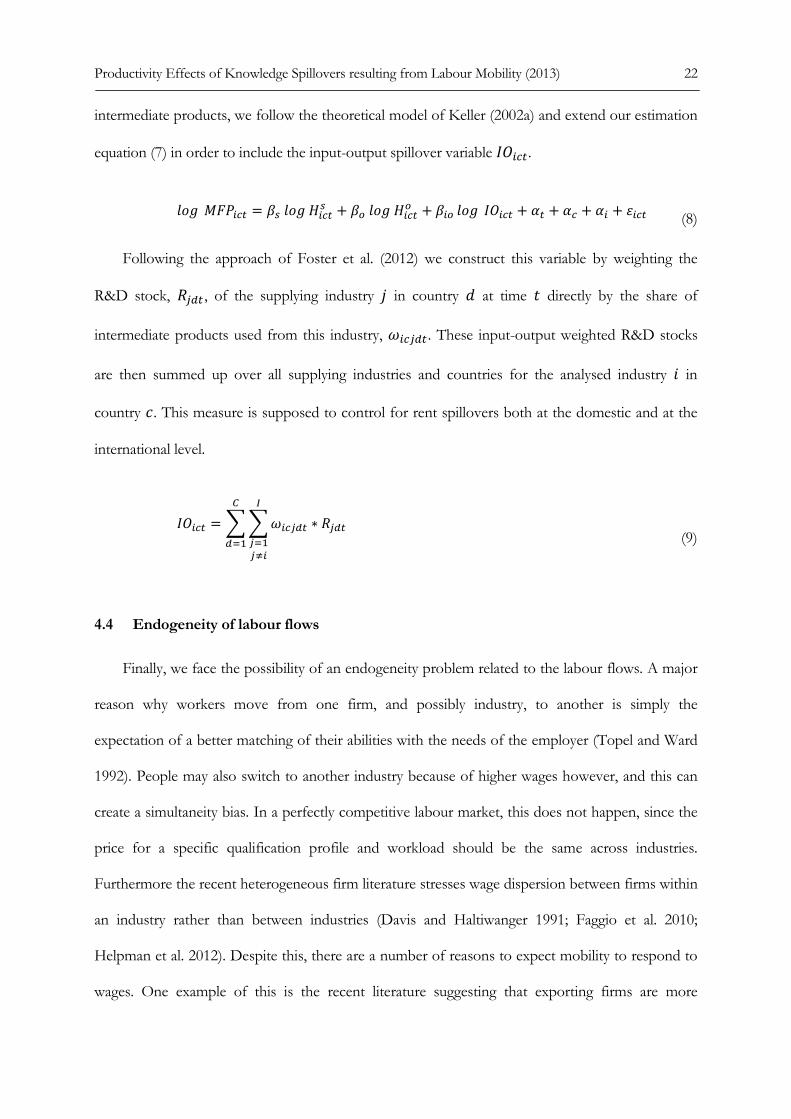
Given that the null hypothesis of stationarity in all panels could not be rejected for the MFP
variable as well as the human capital stock Hs, we now perform Westerlund error-correction-based
panel cointegration tests (Persyn and Westerlund 2008) to test for cointegration between log(MFP)
and the rent spillover variables. The results are reported in TABLE 4 and indicate that MFP and
the human capital stock of the analysed industry Hs are not only stationary, but also cointegrated.
Although the time series are rather short (11 years), which poses a problem for the cointegration
test, the results indicate cointegration for the panel as a whole. In order to obtain valid t-statistcs,
we will therefore employ Dynamic OLS.
TABLE 4
Westerlund ECM panel cointegration tests
log(MFP) log(Hs) log(Ho) log(IO)
Gt -2.213*** -0.588 -0.776
Ga -1.209 -0.885 -1.275
Pt -7.444** -5.947 -6.250
Pa -1.350 -0.953 -1.111
A rejection of H0 for the Ga and Gt test-statistics should be taken as evidence of cointegration of at least one cross-sectional unit. The Pa and Pt test statistics pool information over all the cross-sectional units and a rejection of H0 provides evidence for cointegration for the panel as a whole. One lead and lag were included in the error-correction equations. ***, ** and * denote tests being significant at a 1, 5 and 10% level, respectively.
4.3 Other spillover channels
Another thing that we need to be concerned about is the fact that labour mobility is not the
only source of spillovers between industries. To control for spillovers resulting from improved
Productivity Effects of Knowledge Spillovers resulting from Labour Mobility (2013) 22
intermediate products, we follow the theoretical model of Keller (2002a) and extend our estimation
equation (7) in order to include the input-output spillover variable Q]WX.
Following the approach of Foster et al. (2012) we construct this variable by weighting the
R&D stock, +F^X , of the supplying industry _ in country ` at time a directly by the share of intermediate products used from this industry, bWF^X. These input-output weighted R&D stocks
are then summed up over all supplying industries and countries for the analysed industry � in country c. This measure is supposed to control for rent spillovers both at the domestic and at the
international level.
Q]WX E E bWF^X 0 +F^X�
FH5FI
�^H5
(9)
4.4 Endogeneity of labour flows
Finally, we face the possibility of an endogeneity problem related to the labour flows. A major
reason why workers move from one firm, and possibly industry, to another is simply the
expectation of a better matching of their abilities with the needs of the employer (Topel and Ward
1992). People may also switch to another industry because of higher wages however, and this can
create a simultaneity bias. In a perfectly competitive labour market, this does not happen, since the
price for a specific qualification profile and workload should be the same across industries.
Furthermore the recent heterogeneous firm literature stresses wage dispersion between firms within
an industry rather than between industries (Davis and Haltiwanger 1991; Faggio et al. 2010;
Helpman et al. 2012). Despite this, there are a number of reasons to expect mobility to respond to
wages. One example of this is the recent literature suggesting that exporting firms are more
Productivity Effects of Knowledge Spillovers resulting from Labour Mobility (2013) 23
productive and pay higher wages than non-exporters. Such a pattern could impact upon labour
mobility patterns at the industry-level if firms in some industries have a higher propensity to export
than others. Industry restructuring can also leave firms or even industries with a need for certain
qualification profiles for which they are willing to pay a premium over other market participants. A
downturn in a certain industry most likely results in lower productivity and in turn to lower labour
inflows, which may create a correlation between productivity and human capital inflows, that is to
some extent spurious.
In order to remove these biases, we perform a two-stage instrumental variable regression. In
the first step, the decision of workers to stay or move to another industry is modelled. Then the
predicted labour mobility values are summed up and plugged back into the estimation of equation
(7). This procedure is similar to that used elsewhere, for example by Frankel and Romer (1999) in
their study of trade and growth. As the sum of the normally distributed errors is still normally
distributed, this aggregation should not lead to an estimation bias in the second stage.
=VT �Vdef7FWgX �5 =V T �hdFWgXi5 � �j=VT �hdWgXi5 � E �kele
hTme �
� E �nfof
�pcm`f � E �qr7
�pcV7 � �WX � �Wg � �F � Yef7FWgX (10)
Labour flows are estimated for each subcategory of workers of age h, with education level m and occupation V, which move from industry _ to � in region s of country c at time a. The two main explanatory variables are the values of employment in the source (�hdFWgXi5) and receiving (�hdWgXi5) industries in the previous year at the regional level. Moreover, we use general inter-
industry labour mobility patterns across countries by including interacted industry dummies of the
receiving and source industry �F . By not using these patterns for each country separately, country
Productivity Effects of Knowledge Spillovers resulting from Labour Mobility (2013) 24
specific industry relations are ignored (e.g. the movement of workers to an industry because of
higher wages paid there specifically in that country).
A further dimension is the geographical aspect. Labour market legislation certainly differs over
the analysed countries and changes over time. To account for changes in legislation and other
factors that affect the labour mobility picture at the country level, country-time dummies �WX are included. In addition to the differences across countries, mobility differs greatly by region. In dense
areas labour mobility tends to be higher – thus we include dummies for NUTS2 regions �Wg. Additionally, a number of characteristics of the workers are controlled for which likely
influence the mobility of workers. As young people are more mobile, age is surely a major factor.
Our dataset contains information on employees in the following groups h t � {15-24, 25-39, 40-54, 55-64, >65}. Furthermore, occupations based on the International Standard Classification of
Occupations (ISCO) are used at the one digit level. Finally, workers are differentiated according to
the education levels low, medium and high based on the International Standard Classification of
Education (ISCED). Descriptive statistics from our dataset show that higher educated workers are
less likely to switch industries. This is consistent with the theory that employers try to avoid
knowledge outflows resulting from workers leaving the firm. These outflows are of course on
average greater, the higher the education of the employee. Thus, firms are expected to prevent
strong mobility of higher educated workers.
In order to be valid, the instruments have to be orthogonal to our productivity measure. As
stated before, our MFP measure controls for education levels – thus including these as instruments
does not pose a problem. Regarding the relationship between age, productivity and wages, the
literature is not really consistent. When looking at piece-rates, a study of the U.S. Department of
Labor (1957), analysing a broad range of industries finds that job performance increases until the
age of 35 and steadily declines thereafter. This measure however is more related to low skilled
workers, which are excluded from our study. Some papers cautiously point in the direction of a
Productivity Effects of Knowledge Spillovers resulting from Labour Mobility (2013) 25
negative productivity-age relationship (Hellerstein et al. 1996; Kotlikoff and Gokhale 1992), others
like Cardoso et al. (2011) suggest a positive relationship, even after controlling for wages, while
others find no conclusive evidence at all (Hellerstein et al. 1999; Hellerstein and Neumark 1995 ). A
number of studies find a form of inverted U-shaped work performance profile (Cardoso et al. 2011;
Göbel and Zwick 2009; Crépon et al. 2003; Ilmakunnas et al. 1999). The peak with the highest
productivity is however not clear and depending on the worker’s skill level. Recent studies by
Cardoso et al. (2011) and Göbel and Zwick (2009) find an increase in productivity until the mid
50ies and only a slight decrease in productivity afterwards. Cardoso et al. (2011) thus conclude that
“older workers are, in fact, worthy of their pay”. The reasons for this strong increase in firm
productivity through older employees are their large knowledge stock and resulting spillovers to
younger employees, a positive selection of older people which are still in the workforce as well as a
usually better matching of their abilities with the needs of the employer compared to younger
workers. Regarding the wage-productivity relationship, which is important to ensure orthogonality
of age and MFP, this leaves us with no conclusive evidence. We thus do not expect this variable to
bias our IV regression.
5 Results and Discussion
The following section provides estimates for the size of the spillovers. The first regression (i) in
TABLE 5 shows the results of the basic equation (7). The coefficients can be interpreted as
elasticities of multifactor productivity with respect to human capital stocks weighted by labour
movement. �, is a measure of the impact of the industry’s own knowledge stock on MFP after
adjusting for labour and thus human capital outflows. An industry can increase its own knowledge
stock by investing more in R&D. Similarly �7 measures the degree to which industry i will profit
from the human capital of other industries by hiring their workers. Basically there are two ways of
increasing this spillover effect. First of all, the giving industry can enhance their R&D activities and
Productivity Effects of Knowledge Spillovers resulting from Labour Mobility (2013) 26
thus add to their human capital stock. Assuming that the labour flows stay the same, this would
lead to an increase in the knowledge flow. Secondly, the receiving industry can hire more workers
from other industries or relatively more from those with higher human capital stocks.
The elasticities from estimation (i) indicate that the effect of knowledge built up in the industry
itself �, is around seven times larger than the productivity gains resulting from workers of other
industries �7. An annual increase in the human capital stock of around 3.5%, which can be
observed in the sample over the analysed period, would, ceteris paribus, result in an overall 0.8%
increase in productivity through labour mobility over ten years. The effect of the industry’s own
human capital stock, increased through R&D, results in a 5.8% higher MFP over the same time
period (the human capital stock overall increased by a factor of 1.41, which is taken to the power of
0.164).
The provided estimates should be regarded as a lower bound to the true productivity effects
since we are just able to consider labour movements from the year before and do not have
information on the complete working history. Knowledge spillovers through labour mobility likely
need more time to affect productivity in the new sector as workers need to first get acquainted with
their new environment and the possibilities to bring in their knowledge may be somewhat limited
during this period. Furthermore, knowledge sharing between employees does not happen overnight
and knowledge spillovers also need time to affect productivity.
To account for the heterogeneity of the manufacturing sector, including both traditional and
high technology industries, the empirical model was then extended and re-estimated with separate
coefficients for high, medium and low technology industries. The knowledge spillovers from other
industries have been differentiated by providing industry.
Productivity Effects of Knowledge Spillovers resulting from Labour Mobility (2013) 27
TABLE 5
Estimation results
(i) (ii) (iii) (iv) (v) (vi)
DOLS DOLS DOLS DOLS DOLS OLS
�, 0.164*** 0.166***
(0.020) (0.020)
�, �u�XfW� 0.205*** 0.227*** 0.246*** 0.161***
(0.029) (0.033) (0.030) (0.022)
�, �f^XfW� 0.170*** 0.172*** 0.183*** 0.158***
(0.021) (0.021) (0.022) (0.019)
�, !7vXfW� 0.143*** 0.127*** 0.146*** 0.126***
(0.027) (0.026) (0.027) (0.024)
�7 0.023*** 0.022***
(0.006) (0.006)
�7 �u�XfW� 0.012*** 0.011** 0.015*** 0.008***
(0.005) (0.005) (0.005) (0.003)
�7 �f^XfW� 0.020*** 0.019*** 0.018*** 0.007**
(0.006) (0.006) (0.006) (0.004)
�7 !7vXfW� -0.008 -0.008 -0.006 0.002
(0.007) (0.007) (0.007) (0.004)
�7 0.230***
(0.046)
Country effects yes yes yes yes yes yes
Industry effects yes yes yes yes yes yes
Year effects yes yes yes yes yes yes
R2 0.726 0.732 0.729 0.739 0.743 0.702
Observations 741 741 741 741 741 979
Standard deviations in parentheses. The dependent variable is ln(MFP). Coefficients are estimated using dynamic ordinary least squares (DOLS) with one lead and lag of the differenced human capital variables. <***>, <**> and <*> denote coefficients being significantly different from zero at a 1, 5 and 10% level, respectively.
In regression (ii), separate coefficients were estimated for the industry’s own knowledge stock
differentiated by technology segments (high, medium and low-tech). Regression (iii) subsequently
uses coefficients for knowledge spillovers from other industries split up by technology level. Finally,
in estimation (iv) both original coefficients �WX, and �WX7 were estimated for each technology
segment.
Productivity Effects of Knowledge Spillovers resulting from Labour Mobility (2013) 28
Quite striking is the fact that the productivity effects differ greatly by technology segment.
High tech industries generate the highest productivity effects with respect to their own human
capital stock, increased through R&D, while low tech industries produce the lowest ones. Taking
again the 41% overall increase in human capital stock over the whole analysed period and the
coefficients from estimation (iv), this leads to a productivity effect of 4.5% for low-tech, 6.1% for
medium-tech and 8.1% for high-tech industries respectively. Turning to the spillover coefficients,
we find that while the spillover coefficients for high and medium technology industries are positive
and significant across specifications (ii) to (iv), they are insignificant (and negative) in low
technology industries. Workers from medium and high tech industries possess a greater stock of
state-of-the-art transferable knowledge and create higher spillovers, whereas workers from low tech
industries seem to be able to use their prior obtained knowledge less in the new working
environment. Thus the restructuring process which has taken place in Europe, with high and
medium educated people moving away from low tech sectors, could have resulted in a negative
impact on the productivity of other industries.
In a next step (v) we include spillovers through input-output linkages. The estimates suggest
that spillovers arising from the use of intermediate products of other domestic and also
international industries play an important role for productivity developments. The magnitude of the
effect is similar to that found for industries’ own human capital stocks, suggesting productivity
effects of 8.3% over the analysed period of ten years. The coefficients for knowledge spillovers
through labour mobility remain significant and are of a similar size.
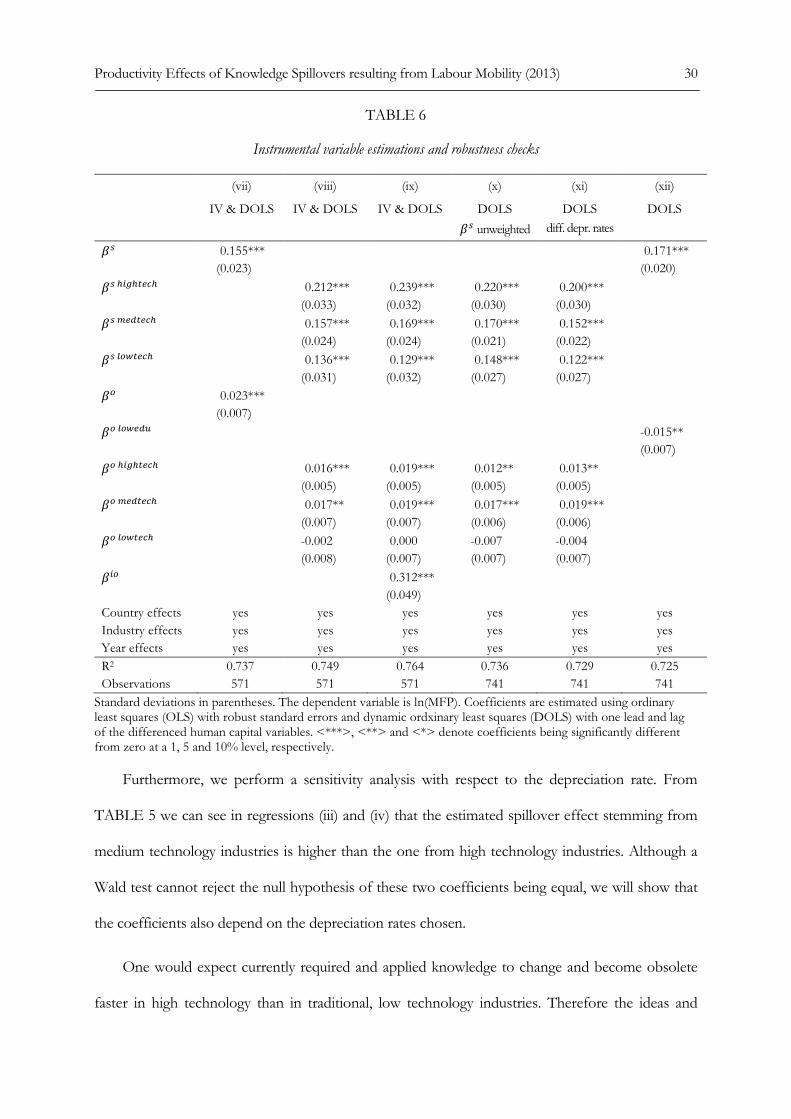
Regressions (vii) to (ix) in TABLE 6 present the results of the two stage instrumental variable
estimations. As there are various reasons for endogeneity problems related to labour mobility, we
first estimate labour mobility flows, using the instruments shown in equation (10), and aggregate up
the results in order to estimate the resulting productivity effects. The sample size decreases again
due to the loss of one year, as the industry characteristics in t-1 are used as instruments for labour
Productivity Effects of Knowledge Spillovers resulting from Labour Mobility (2013) 29
mobility flows. In the simple version of our model, presented in estimation (vii), the results stay
very similar to the ones shown in estimation (i) before. Differentiating the human capital variables
by technology segment again yields similar results for the industry’s own human capital stock.
Regarding spillovers from other industries, the productivity effect of worker inflows from high-tech
industries however becomes stronger and of similar size to the one of medium-tech industries.
Overall the results remain significant and underline the positive spillovers from labour mobility and
intermediate inputs.
To complete the analysis, we perform a number of additional robustness checks. As noted in a
footnote earlier, one can assume that knowledge produced in an industry is similar to a club good,
an assumption different to the one employed above. In this case all knowledge can be codified or is
completely shared with other employees and thus still remains entirely in the industry when
essential employees move to another industry. This mobility would still create knowledge flows to
other industries, but the industry itself would not lose knowledge. In regression (x) we examine this
assumption by including the human capital variables of the analysed industry 6, solely without any mobility weighting. We observe that the elasticities of productivity with respect to human capital in
the industry (�, �u�XfW�, �, �f^XfW� and �, !7vXfW�) are lower as opposed to (iv) if we do not account for knowledge outflows through labour mobility. The changes however are minor as the
industries’ labour outflows per year are mostly below 10%. As another robustness check we also
include the simple OLS regression (vi) in TABLE 5. The results are more or less in line with
previous findings – however they suffer from serial correlation and cointegration bias.
Productivity Effects of Knowledge Spillovers resulting from Labour Mobility (2013) 30
TABLE 6
Instrumental variable estimations and robustness checks
Standard deviations in parentheses. The dependent variable is ln(MFP). Coefficients are estimated using ordinary least squares (OLS) with robust standard errors and dynamic ordxinary least squares (DOLS) with one lead and lag of the differenced human capital variables. <***>, <**> and <*> denote coefficients being significantly different from zero at a 1, 5 and 10% level, respectively.
Furthermore, we perform a sensitivity analysis with respect to the depreciation rate. From
TABLE 5 we can see in regressions (iii) and (iv) that the estimated spillover effect stemming from
medium technology industries is higher than the one from high technology industries. Although a
Wald test cannot reject the null hypothesis of these two coefficients being equal, we will show that
the coefficients also depend on the depreciation rates chosen.
One would expect currently required and applied knowledge to change and become obsolete
faster in high technology than in traditional, low technology industries. Therefore the ideas and
Productivity Effects of Knowledge Spillovers resulting from Labour Mobility (2013) 31
experience that employees acquire during their work that could lead to future productivity increases
also become obsolete faster in the more rapidly changing environment of high technology sectors.
For this reason, we present a sensitivity analysis in TABLE 6, regression (xi) wherein we reproduce
regression (iv) from TABLE 5 but use different depreciation rates according to the technology level
of the industry. The depreciation rates for low, medium and high technology segments have been
arbitrarily set to 7.5%, 10% and 12.5% respectively. The results of regression (x) show that the
relative size of the coefficients for the different technology segments changes in comparison with
the results shown in (iv) and high technology sectors become a more important source of
knowledge spillovers.
The estimations in the literature for input-output spillovers should be looked at in this context.
For the sensitivity analysis done in many papers (Coe and Helpman 1995; Keller 2002a), different
depreciation rates are always used for the whole sample. By looking at knowledge in the textile
industry and the computer industry it seems obvious that the assumption of one fixed depreciation
rate across all sectors is not met.
Finally, a counterfactual analysis is performed. We have assumed that knowledge is transmitted
across industries foremost via the mobility of medium and high skilled workers. This hypothesis is
put to the test by estimating productivity effects similar to regression (i), but with flows of lower
skilled workers. Since these workers are not expected to transmit much state-of-the-art knowledge
across industries, productivity effects from these flows should be minor. In fact, we find that a
movement of lower skilled workers affects productivity in the target industry negatively in the
subsequent year as can be seen in regression (xii) in TABLE 6. Note that changes in the overall skill
composition are already accounted for. Therefore this is not a direct affect resulting from a higher
stock of lower skilled workers, but an indicator that the adjustment costs to the new job outweigh
knowledge transmission effects for lower skilled workers.
Productivity Effects of Knowledge Spillovers resulting from Labour Mobility (2013) 32
6 Conclusions
Recent growth literature has emphasised the importance of domestic as well as international
spillovers across industries. The paper tries to establish a role for knowledge spillovers through the
mobility of a higher educated workforce in this framework. Based on theoretical findings that were
recently substantiated by empirical evidence, a theoretical model is developed that explains changes
in productivity with respect to growth in human capital stocks and labour mobility.
The empirical analysis documents the importance of labour mobility that goes hand in hand
with the diffusion of knowledge across industries for productivity growth. The estimates suggest
that spillovers through labour mobility overall increased productivity in the sample by 0.8% over
the analysed period. The estimate has to be seen as a lower bound to the true effect of labour
mobility, as we are able to only consider labour movements to other industries from the year
before. The knowledge diffusion in the receiving industry will usually take more time and the
effects on productivity will only follow thereafter.
Given the heterogeneity of the manufacturing sector, including both traditional and high
technology segments, the spillover effects were then estimated separately for high, medium and low
technology industries. The results confirm the hypothesis that spillover effects differ considerably
by technological classification of the giving industry. Workers moving away from the medium and
high technology segment of the manufacturing sector are found to create substantial productivity
effects to other industries, whereas those from low technology industries induce no significant
spillovers.
Due to endogeneity problems associated with the analysis – a downturn in an industry for
example might lead to lower labour inflows – a two stage instrumental variable approach is
employed. First, labour mobility patterns are estimated using characteristics of the source and
receiving industry as well as regional information. Then these flows are used to again investigate the
Productivity Effects of Knowledge Spillovers resulting from Labour Mobility (2013) 33
productivity effects resulting from the associated knowledge spillovers. The results using this
method confirm the previous findings and underline their robustness. Furthermore, we perform a
number of robustness checks and control for spillovers through intermediate use. Again, the
existence of positive productivity effects stemming from the mobility of higher educated workers is
confirmed.
Finally a counterfactual analysis reveals that the application of our model to the flows of lower
skilled workers results in negative spillovers, indicating that for lower skilled workers, adjustment
costs to the new job dominate knowledge transmission effects.
7 Acknowledgements and Funding
This publication was produced in the framework of MicroDyn (www.micro-dyn.eu), a project
funded by the EU Sixth Framework Programme and extended within the scope of the WIOD
project (www.wiod.org), which is funded by the EU Seventh Framework Programme.
We would like to thank Robert Stehrer for his suggestions and support in retrieving the
necessary data. Furthermore we are grateful for comments and ideas from Michael Landesmann,
Alejandro Cunat, Ashish Arora, and participants of the MicroDyn workshop in Zalesie.
8 References
Almeida, P. and Kogut, B., 1999. “Localization of Knowledge and the Mobility of Engineers in