Productivity, Profitability and Growth Giulio Bottazzi 1 Marco Grazzi 1 Angelo Secchi 2 Federico Tamagni 1 1 LEM, Scuola Superiore Sant’Anna 2 DSE, University of Pisa MFJ-RIETI-WASEDA International Conference Maison Franco Japonaise, Tokyo, 14-15 November, 2008 Giulio Bottazzi, Marco Grazzi, Angelo Secchi and Federico Tamagni Productivity, Profitability and Growth
Transcript
Productivity, Profitability and Growth
Giulio Bottazzi1 Marco Grazzi1 Angelo Secchi2
Federico Tamagni1
1 LEM, Scuola Superiore Sant’Anna
2 DSE, University of Pisa
MFJ-RIETI-WASEDA International ConferenceMaison Franco Japonaise, Tokyo, 14-15 November, 2008
Giulio Bottazzi, Marco Grazzi, Angelo Secchi and Federico Tamagni Productivity, Profitability and Growth
Theoretical Background
Market efficiency: underlying selection process which operateson heterogeneous producers, via reallocation of market sharesfrom the least to the more “efficient” business units
Definition of fitness: productivity, profitability, growth ?
Transmission mechanism: Which dimension is the first driver?What’s the genotype? What’s the phenotype?
Giulio Bottazzi, Marco Grazzi, Angelo Secchi and Federico Tamagni Productivity, Profitability and Growth
Empirical Background
Meso-economic analysis Sectoral decomposition of productivitydynamics: entry, exit and reallocation among incumbents.
Micro-economic analysis Characteristics of entrants or exitingfirms.
Shortcomings Only one dimension considered. No bridgebetween technical efficiency dynamics and the financialconditions often affecting firms exit.
Giulio Bottazzi, Marco Grazzi, Angelo Secchi and Federico Tamagni Productivity, Profitability and Growth
3 issues and 3 lines of investigation
A first issue regards the possibility that productivity is not theonly and the proper fitness measure (cfr. Foster et al., 2008)
Giulio Bottazzi, Marco Grazzi, Angelo Secchi and Federico Tamagni Productivity, Profitability and Growth
3 issues and 3 lines of investigation
We explore existence and asses the strength of the link betweenPRODUCTIVITY and PROFITABILITY . . .
Giulio Bottazzi, Marco Grazzi, Angelo Secchi and Federico Tamagni Productivity, Profitability and Growth
3 issues and 3 lines of investigation
We explore existence and asses the strength of the link betweenPRODUCTIVITY and PROFITABILITY . . .
This naturally brings us to the productivity-growth andprofitability-growth links
Giulio Bottazzi, Marco Grazzi, Angelo Secchi and Federico Tamagni Productivity, Profitability and Growth
3 issues and 3 lines of investigation
We explore existence and asses the strength of the link betweenPRODUCTIVITY and PROFITABILITY . . .
. . . focusing at the same time on thePRODUCTIVITY-GROWTH and PROFITABILITY-GROWTHlinks
Another relatively unexplored issue concerns the role of “time”(if any)
Giulio Bottazzi, Marco Grazzi, Angelo Secchi and Federico Tamagni Productivity, Profitability and Growth
3 issues and 3 lines of investigation
We explore existence and asses the strength of the link betweenPRODUCTIVITY and PROFITABILITY . . .
. . . focusing at the same time on thePRODUCTIVITY-GROWTH and PROFITABILITY-GROWTHlinks
we look at the relations between the three measures also usingdifferent time horizons
Giulio Bottazzi, Marco Grazzi, Angelo Secchi and Federico Tamagni Productivity, Profitability and Growth
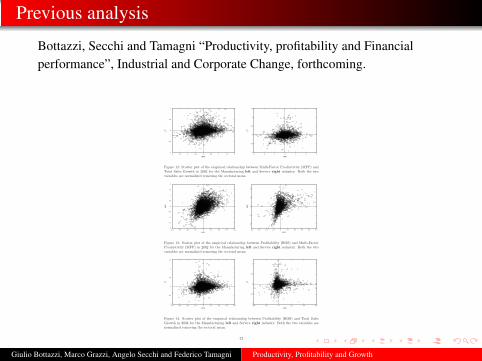
Previous analysis
Bottazzi, Secchi and Tamagni “Productivity, profitability and Financialperformance”, Industrial and Corporate Change, forthcoming.
-1
-0.5
0
0.5
1
-2 -1.5 -1 -0.5 0 0.5 1 1.5 2
gT
S
MFP
-1
-0.5
0
0.5
1
1.5
-3 -2 -1 0 1 2 3
gT
S
MFP
Figure 12: Scatter plot of the empirical relationship between Multi-Factor Productivity (MFP) andTotal Sales Growth in 2002 for the Manufacturing left and Service right industry. Both the twovariables are normalized removing the sectoral mean.
-2
-1.5
-1
-0.5
0
0.5
1
1.5
2
-0.4 -0.3 -0.2 -0.1 0 0.1 0.2 0.3 0.4
MF
P
ROS
-2
-1
0
1
2
-0.4 -0.3 -0.2 -0.1 0 0.1 0.2 0.3 0.4 0.5
MF
P
ROS
Figure 13: Scatter plot of the empirical relationship between Profitability (ROS) and Multi-FactorProductivity (MFP) in 2002 for the Manufacturing left and Service right industry. Both the twovariables are normalized removing the sectoral mean.
-1
-0.5
0
0.5
1
1.5
-0.4 -0.3 -0.2 -0.1 0 0.1 0.2 0.3 0.4
gT
S
ROS
-1
-0.5
0
0.5
1
-0.4 -0.2 0 0.2 0.4 0.6
gT
S
ROS
Figure 14: Scatter plot of the empirical relationship between Profitability (ROS) and Total SalesGrowth in 2002 for the Manufacturing left and Service right industry. Both the two variables arenormalized removing the sectoral mean.
32
Giulio Bottazzi, Marco Grazzi, Angelo Secchi and Federico Tamagni Productivity, Profitability and Growth
Outline
1 Data Description
2 Static unconditional analyses
3 Panel data analyses
4 Deepening the investigations
Giulio Bottazzi, Marco Grazzi, Angelo Secchi and Federico Tamagni Productivity, Profitability and Growth
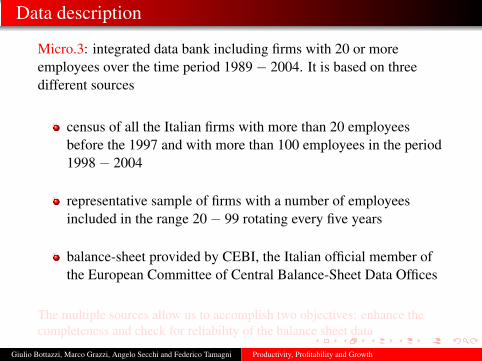
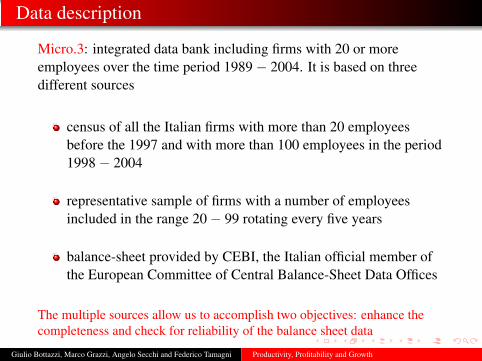
Data description
Micro.3: integrated data bank including firms with 20 or moreemployees over the time period 1989− 2004. It is based on threedifferent sources
census of all the Italian firms with more than 20 employeesbefore the 1997 and with more than 100 employees in the period1998− 2004
representative sample of firms with a number of employeesincluded in the range 20− 99 rotating every five years
balance-sheet provided by CEBI, the Italian official member ofthe European Committee of Central Balance-Sheet Data Offices
The multiple sources allow us to accomplish two objectives: enhance thecompleteness and check for reliability of the balance sheet data
Giulio Bottazzi, Marco Grazzi, Angelo Secchi and Federico Tamagni Productivity, Profitability and Growth
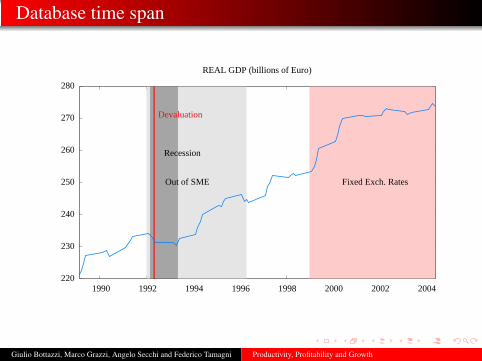
Database time span
220
230
240
250
260
270
280
1990 1992 1994 1996 1998 2000 2002 2004
REAL GDP (billions of Euro)
Out of SME
Devaluation
Recession
Fixed Exch. Rates
Giulio Bottazzi, Marco Grazzi, Angelo Secchi and Federico Tamagni Productivity, Profitability and Growth
Database time span
15000
15500
16000
16500
17000
17500
18000
18500
1990 1992 1994 1996 1998 2000 2002 2004
EMPLOYMENT, (Thousands of Persons)
Out of SME
Devaluation
Recession
Fixed Exch. Rates
Giulio Bottazzi, Marco Grazzi, Angelo Secchi and Federico Tamagni Productivity, Profitability and Growth
This paper focuses on the manufacturing sector
we consider 60084 firms over the period 1989− 2004
they represent more than 50% of the GDP generated by all theItalian manufacturing firms and more than 40% of the totalemployment in manufacturing
Proxies selection:
TS =Total Sales (Annual Revenues)
L = Number of Employees
VA = Value Added (TS − cI)
GOM = Gross Operative Margin (VA− wL)
Giulio Bottazzi, Marco Grazzi, Angelo Secchi and Federico Tamagni Productivity, Profitability and Growth
Measures of performances
We define growth, profitability and productivity
Productivity
Πt =VAt
Lt(1)
Profitability
Pt =GOMt
TSt(2)
GrowthgTS
t = ∆ log(TSt) (3)
Giulio Bottazzi, Marco Grazzi, Angelo Secchi and Federico Tamagni Productivity, Profitability and Growth
1 Data Description
2 Static unconditional analyses
3 Panel data analyses
4 Deepening the investigations
Giulio Bottazzi, Marco Grazzi, Angelo Secchi and Federico Tamagni Productivity, Profitability and Growth
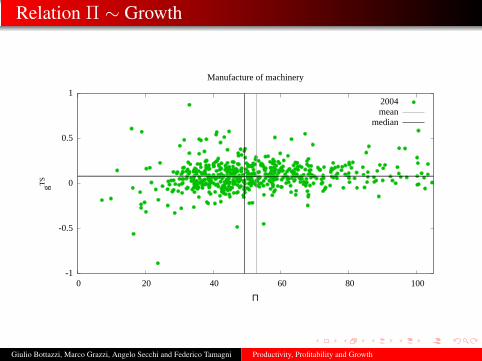
Relation Π ∼ Growth
-1
-0.5
0
0.5
1
0 20 40 60 80 100
gTS
Π
Manufacture of machinery
2004mean
median
Giulio Bottazzi, Marco Grazzi, Angelo Secchi and Federico Tamagni Productivity, Profitability and Growth
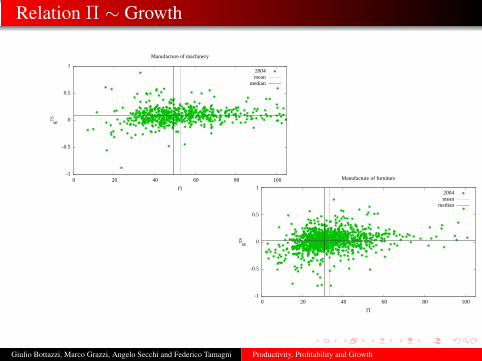
Relation Π ∼ Growth
-1
-0.5
0
0.5
1
0 20 40 60 80 100
gTS
Π
Manufacture of machinery
2004mean
median
-1
-0.5
0
0.5
1
0 20 40 60 80 100
gTS
Π
Manufacture of furniture
2004mean
median
Giulio Bottazzi, Marco Grazzi, Angelo Secchi and Federico Tamagni Productivity, Profitability and Growth
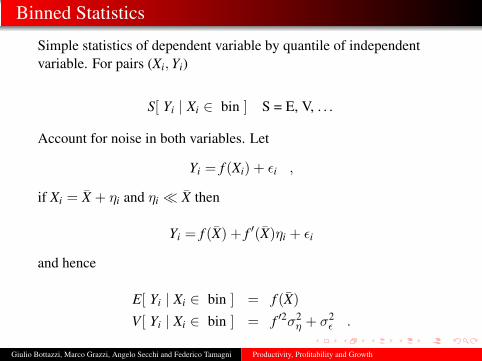
Binned Statistics
Simple statistics of dependent variable by quantile of independentvariable. For pairs (Xi, Yi)
S[ Yi | Xi ∈ bin ] S = E, V, . . .
Account for noise in both variables. Let
Yi = f (Xi) + εi ,
if Xi = X + ηi and ηi � X then
Yi = f (X) + f ′(X)ηi + εi
and hence
E[ Yi | Xi ∈ bin ] = f (X)V[ Yi | Xi ∈ bin ] = f ′2σ2
η + σ2ε .
Giulio Bottazzi, Marco Grazzi, Angelo Secchi and Federico Tamagni Productivity, Profitability and Growth
Relation Π ∼ Growth
-1
-0.5
0
0.5
1
0 20 40 60 80 100
gTS
Π
Manufacture of machinery
2004Binned relation
Giulio Bottazzi, Marco Grazzi, Angelo Secchi and Federico Tamagni Productivity, Profitability and Growth
Relation Π ∼ Growth
-1
-0.5
0
0.5
1
0 20 40 60 80 100
gTS
Π
Manufacture of machinery
2004Binned relation
-1
-0.5
0
0.5
1
0 20 40 60 80 100
gTS
Π
Manufacture of furniture
2004Binned relation
Giulio Bottazzi, Marco Grazzi, Angelo Secchi and Federico Tamagni Productivity, Profitability and Growth
Kernel Regression
Generalization of Binned Statistics: smooth weighting ofobservation pairs
From the definition of Conditional Expectation:
E[Y | X] =∫
dY YP(Y | X) =∫
dY YP(Y, X)
P(X)
Using the “plug-in” principle: P → P
E[Y | X] =∫
dY Y
∑i K
(Y−Yi
hY, X−Xi
hX
)∑
i K(
X−XihX
) =
∑i YiK
(X−Xi
hX
)∑
i K(
X−XihX
)with symmetric kernel function K(·) .
Giulio Bottazzi, Marco Grazzi, Angelo Secchi and Federico Tamagni Productivity, Profitability and Growth
-1
-0.5
0
0.5
1
0 20 40 60 80 100
gTS
Π
Manufacture of machinery
2004Binned relation
Non parametric regression
Giulio Bottazzi, Marco Grazzi, Angelo Secchi and Federico Tamagni Productivity, Profitability and Growth
-1
-0.5
0
0.5
1
0 20 40 60 80 100
gTS
Π
Manufacture of machinery
2004Binned relation
Non parametric regression
-1
-0.5
0
0.5
1
0 20 40 60 80 100
gTS
Π
Manufacture of furniture
2004Binned relation
Non parametric regression
Giulio Bottazzi, Marco Grazzi, Angelo Secchi and Federico Tamagni Productivity, Profitability and Growth
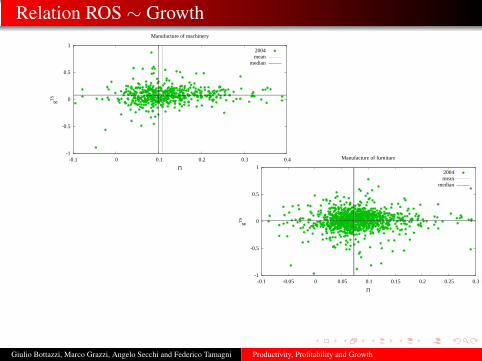
Relation ROS ∼ Growth
-1
-0.5
0
0.5
1
-0.1 0 0.1 0.2 0.3 0.4
gTS
Π
Manufacture of machinery
2004mean
median
-1
-0.5
0
0.5
1
-0.1 -0.05 0 0.05 0.1 0.15 0.2 0.25 0.3
gTS
Π
Manufacture of furniture
2004mean
median
Giulio Bottazzi, Marco Grazzi, Angelo Secchi and Federico Tamagni Productivity, Profitability and Growth
Relation ROS ∼ Growth
-1
-0.5
0
0.5
1
-0.1 0 0.1 0.2 0.3 0.4
gTS
Π
Manufacture of machinery
2004Binned relation
-1
-0.5
0
0.5
1
-0.1 -0.05 0 0.05 0.1 0.15 0.2 0.25 0.3
gTS
Π
Manufacture of furniture
2004Binned relation
Giulio Bottazzi, Marco Grazzi, Angelo Secchi and Federico Tamagni Productivity, Profitability and Growth
Relation ROS ∼ Growth
-1
-0.5
0
0.5
1
-0.1 0 0.1 0.2 0.3 0.4
gTS
Π
Manufacture of machinery
2004Binned relation
Non parametric regression
-1
-0.5
0
0.5
1
-0.1 -0.05 0 0.05 0.1 0.15 0.2 0.25 0.3
gTS
Π
Manufacture of furniture
2004Binned relation
Non parametric regression
Giulio Bottazzi, Marco Grazzi, Angelo Secchi and Federico Tamagni Productivity, Profitability and Growth
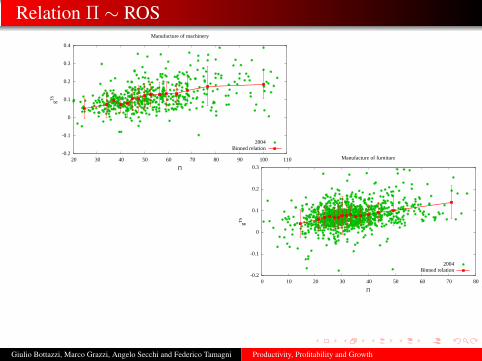
Relation Π ∼ ROS
-0.2
-0.1
0
0.1
0.2
0.3
0.4
20 30 40 50 60 70 80 90 100 110
gTS
Π
Manufacture of machinery
2004mean
median
-0.2
-0.1
0
0.1
0.2
0.3
0 10 20 30 40 50 60 70 80
gTS
Π
Manufacture of furniture
2004mean
median
Giulio Bottazzi, Marco Grazzi, Angelo Secchi and Federico Tamagni Productivity, Profitability and Growth
Relation Π ∼ ROS
-0.2
-0.1
0
0.1
0.2
0.3
0.4
20 30 40 50 60 70 80 90 100 110
gTS
Π
Manufacture of machinery
2004Binned relation
-0.2
-0.1
0
0.1
0.2
0.3
0 10 20 30 40 50 60 70 80
gTS
Π
Manufacture of furniture
2004Binned relation
Giulio Bottazzi, Marco Grazzi, Angelo Secchi and Federico Tamagni Productivity, Profitability and Growth
Relation Π ∼ ROS
-0.2
-0.1
0
0.1
0.2
0.3
0.4
20 30 40 50 60 70 80 90 100 110
gTS
Π
Manufacture of machinery
2004Binned relation
Non parametric regression
-0.2
-0.1
0
0.1
0.2
0.3
0 10 20 30 40 50 60 70 80
gTS
Π
Manufacture of furniture
2004Binned relation
Non parametric regression
Giulio Bottazzi, Marco Grazzi, Angelo Secchi and Federico Tamagni Productivity, Profitability and Growth
Kendall’s τ
Global, non-parametric measure of probabilistic dependence
Couples of ordered variables (Xi, Yi) i ∈ 1, . . . , N
Consider the G = N(N − 1)/2 matching
(Xi − Xj)(Yi − Yj) ={
1 concordant−1 discordant
i, j ∈ N (4)
Kendall’s coefficient reads
τ =Nc − Nd
G= Pr{concordant} − Pr{discordant} (5)
with Nc = # of concordant and Nd = # of discordant.
Giulio Bottazzi, Marco Grazzi, Angelo Secchi and Federico Tamagni Productivity, Profitability and Growth
Kendall’s τ - Manufacture of machinery
Rank Correlations
Year Πt vs gTSt Πt vs Pt Pt vs gTS
t
1992 0.168 0.000 0.486 0.000 0.119 0.001
1994 0.182 0.000 0.503 0.000 0.150 0.000
1996 0.113 0.002 0.474 0.000 0.056 0.135
1998 0.111 0.002 0.495 0.000 0.073 0.055
2000 0.115 0.000 0.473 0.000 0.057 0.035
2002 0.170 0.000 0.490 0.000 0.141 0.000
2004 0.115 0.000 0.510 0.000 0.123 0.000
Giulio Bottazzi, Marco Grazzi, Angelo Secchi and Federico Tamagni Productivity, Profitability and Growth
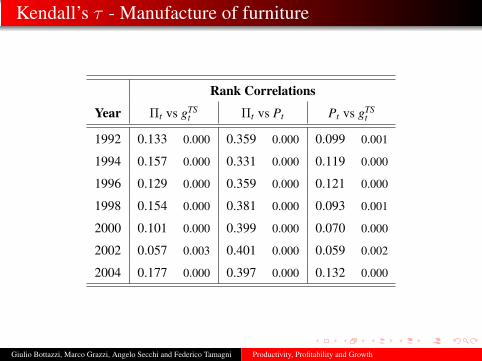
Kendall’s τ - Manufacture of furniture
Rank Correlations
Year Πt vs gTSt Πt vs Pt Pt vs gTS
t
1992 0.133 0.000 0.359 0.000 0.099 0.001
1994 0.157 0.000 0.331 0.000 0.119 0.000
1996 0.129 0.000 0.359 0.000 0.121 0.000
1998 0.154 0.000 0.381 0.000 0.093 0.001
2000 0.101 0.000 0.399 0.000 0.070 0.000
2002 0.057 0.003 0.401 0.000 0.059 0.002
2004 0.177 0.000 0.397 0.000 0.132 0.000
Giulio Bottazzi, Marco Grazzi, Angelo Secchi and Federico Tamagni Productivity, Profitability and Growth
Relationships: summing up
Productivity
Profitability Growth
��
��
��
��
��
��+
weak
��
��
��
���3
?
?
Giulio Bottazzi, Marco Grazzi, Angelo Secchi and Federico Tamagni Productivity, Profitability and Growth
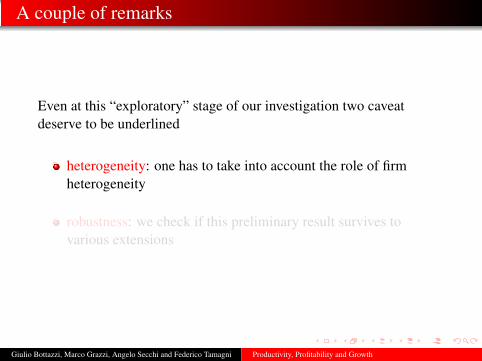
A couple of remarks
Even at this “exploratory” stage of our investigation two caveatdeserve to be underlined
heterogeneity: one has to take into account the role of firmheterogeneity
robustness: we check if this preliminary result survives tovarious extensions
Giulio Bottazzi, Marco Grazzi, Angelo Secchi and Federico Tamagni Productivity, Profitability and Growth
1 Data Description
2 Static unconditional analyses
3 Panel data analyses
4 Deepening the investigations
Giulio Bottazzi, Marco Grazzi, Angelo Secchi and Federico Tamagni Productivity, Profitability and Growth
Panel data analysis
We exploit the panel dimension of our data to include the effect ofunobserved, firm specific variables. We estimate
Yi,t = c + ui + αXi,t + εi,t , (6)
where Y and X cab be gTSt , Πt and Pt respectively. We also include
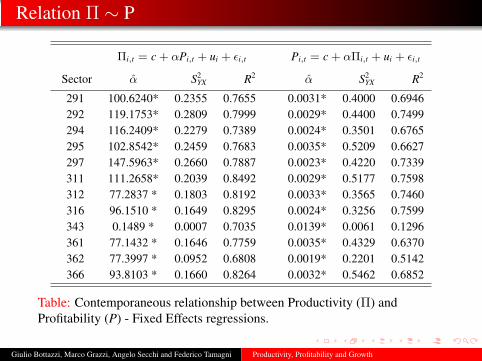
year dummies to control for common time effects.
Giulio Bottazzi, Marco Grazzi, Angelo Secchi and Federico Tamagni Productivity, Profitability and Growth
Panel data analysis
We exploit the panel dimension of our data to include the effect ofunobserved, firm specific variables. We estimate
Yi,t = c + ui + αXi,t + εi,t , (6)
where Y and X cab be gTSt , Πt and Pt respectively. We also include
year dummies to control for common time effects.
Giulio Bottazzi, Marco Grazzi, Angelo Secchi and Federico Tamagni Productivity, Profitability and Growth
A measure for the strength of relations
In order to say something about the relative strength of therelationships we consider
SYX = |α|σX
σY, (7)
where α is the Fixed Effects estimate of the α coefficient, and σstands for the standard deviation of the two variables included in eachregression.
Note: SYX is the square root of a standard R2, computed ignoring theterms due to annual dummies and fixed effects
Giulio Bottazzi, Marco Grazzi, Angelo Secchi and Federico Tamagni Productivity, Profitability and Growth
Relation Π ∼ Growth
Gi,t = c + αΠi,t + ui + εi,t Πi,t = c + αGi,t + ui + εi,t
Giulio Bottazzi, Marco Grazzi, Angelo Secchi and Federico Tamagni Productivity, Profitability and Growth
A comment on heterogeneity
In all the relationships the single regressor considered displays only aweak effect, largely residual with respect to the one provided by theunobserved component. Two possible explanations
we know that all the variables involved (Total sales, ValueAdded, Employees) are very sticky over time then firm-specificfactors ui are very likely to capture a significant fraction of eachdependent variable
strength of the relationships largely depends on the idiosyncraticcharacteristics of the firm: links are weak on average while it isheterogeneity that matters most
Giulio Bottazzi, Marco Grazzi, Angelo Secchi and Federico Tamagni Productivity, Profitability and Growth
Deepening the analysis
We begin considering
1 the role (if any) of different time horizons
2 a first attempt to perform international comparisons
3 the role (if any) of investments
4 a finer look at the relation between productivity and profitability
Giulio Bottazzi, Marco Grazzi, Angelo Secchi and Federico Tamagni Productivity, Profitability and Growth
Extending the time horizon
Giulio Bottazzi, Marco Grazzi, Angelo Secchi and Federico Tamagni Productivity, Profitability and Growth
Towards long-run relations
It can be the case that the relations under investigation are intrinsicallydynamic. Hence we define 5-years time average of our proxies
Xi,p =15
5∑t=1
Xi,t X = Π, P, G , (8)
and we run again the same regressions using time-averages
Yi,t = c + ui + αXi,t + εi,t . (9)
Essentially the conclusions reached so far are confirmed!
Giulio Bottazzi, Marco Grazzi, Angelo Secchi and Federico Tamagni Productivity, Profitability and Growth
Growth vs. productivity
Gi,s = c + αΠi,s + ui + εi,s Πi,s = c + αGi,s + ui + εi,s
Table: Contemporaneous relationship between 5-years averaged Productivity(Π) and 5-years averaged Profitability (P) - Fixed Effects regressions.
Giulio Bottazzi, Marco Grazzi, Angelo Secchi and Federico Tamagni Productivity, Profitability and Growth
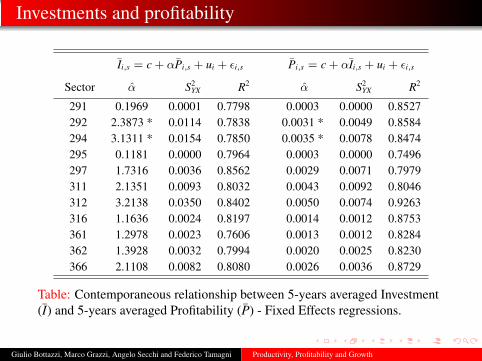
Productivity vs. profitability
The picture is even clearer if with introduce a lag (i.e. we use theaverage of the previous 5 years) in the independent variable
Giulio Bottazzi, Marco Grazzi, Angelo Secchi and Federico Tamagni Productivity, Profitability and Growth
International comparisons(a first attempt)
Giulio Bottazzi, Marco Grazzi, Angelo Secchi and Federico Tamagni Productivity, Profitability and Growth
French data
We have access (thanks to a research project with Nadia Jacoby,Université Paris I Panthéon-Sorbonne) to the EAE individualfirm databank maintained by the French Statistical Office(INSEE).
This database contains longitudinal data on a virtually exhaustivepanel of French firms with 20 employees or more over the period1989-2004.
Firms are classified according to their sector of principal activity.We exclude firms that have undergone any kind of modificationof structure, such as merger or acquisition or any other kind ofstructural modification.
The database encompasses about 22000 firms per year for eachyear of the period.
Giulio Bottazzi, Marco Grazzi, Angelo Secchi and Federico Tamagni Productivity, Profitability and Growth
Productivity
Profitability Growth
��
��
��
��
��
��+
��
��
��
���3
?
?
Giulio Bottazzi, Marco Grazzi, Angelo Secchi and Federico Tamagni Productivity, Profitability and Growth
Introducing investments
Giulio Bottazzi, Marco Grazzi, Angelo Secchi and Federico Tamagni Productivity, Profitability and Growth
The role of investments
What is (if any) the role of investments?
We introduce a new dimension: investments(I) are defined as (log) ofthe variation of (real) tangible assets,
next we correlate I with Π,P and G using the same functional formwith fixed effects.
Essentially Investments do not change the picture: they are not relatedwith any of our proxy!
Giulio Bottazzi, Marco Grazzi, Angelo Secchi and Federico Tamagni Productivity, Profitability and Growth
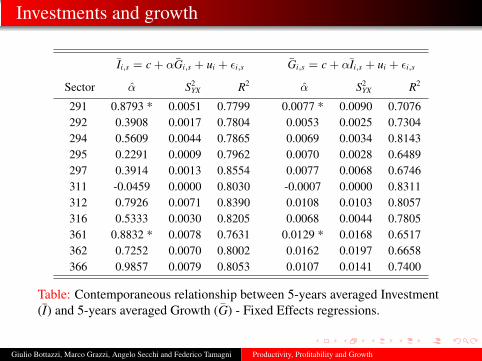
Investments and growth
Ii,s = c + αGi,s + ui + εi,s Gi,s = c + αIi,s + ui + εi,s
Table: Contemporaneous relationship between 5-years averaged Investment(I) and 5-years averaged Productivity (Π) - Fixed Effects regressions.
Giulio Bottazzi, Marco Grazzi, Angelo Secchi and Federico Tamagni Productivity, Profitability and Growth
A closer look to diversity offirms
Giulio Bottazzi, Marco Grazzi, Angelo Secchi and Federico Tamagni Productivity, Profitability and Growth
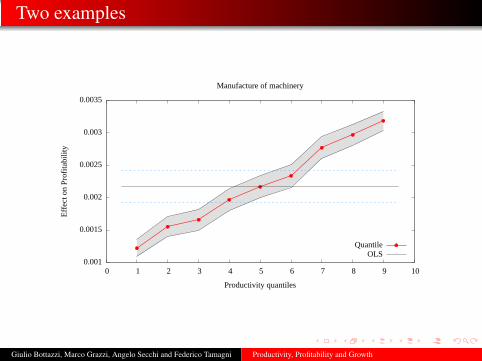
Quantile investigations
Traditionally (at least in economics) to bring order out of the diversityof empirical observations we explore how AVERAGES of certainvariables depend on the values of other “conditioning” variables. Veryoften this way is very effective
Still one may question whether the exclusive focus on conditionalmean relations ignores some “charm of variety” in matters statistical.
Quantile regressions offers the opportunity for a more complete viewof the statistical landscape and the relationships among stochasticvariables
Giulio Bottazzi, Marco Grazzi, Angelo Secchi and Federico Tamagni Productivity, Profitability and Growth
Two examples
0.001
0.0015
0.002
0.0025
0.003
0.0035
0 1 2 3 4 5 6 7 8 9 10
Effe
ct o
n Pr
ofita
bilit
y
Productivity quantiles
Manufacture of machinery
QuantileOLS
Giulio Bottazzi, Marco Grazzi, Angelo Secchi and Federico Tamagni Productivity, Profitability and Growth
Two examples
0.0013
0.0014
0.0015
0.0016
0.0017
0.0018
0.0019
0.002
0.0021
0.0022
0.0023
0.0024
0 1 2 3 4 5 6 7 8 9 10
Effe
ct o
n Pr
ofita
bilit
y
Productivity quantiles
Manufacture of furniture
QuantileOLS
Giulio Bottazzi, Marco Grazzi, Angelo Secchi and Federico Tamagni Productivity, Profitability and Growth
Concluding remarks
To sum up our investigations in a conclusion
we have a lot of work to do!
can we bring some order out of all these sources ofheterogeneity? Do sectoral patterns emerge?
exploring the “fixed effect” black-box
deeper investigation of the directions of causation; what are wemissing?
Giulio Bottazzi, Marco Grazzi, Angelo Secchi and Federico Tamagni Productivity, Profitability and Growth