1 THE CHALLENGES OF SUSTAINABLE THE CHALLENGES OF SUSTAINABLE ENERGY DEVELOPMENT IN NIGERIA ENERGY DEVELOPMENT IN NIGERIA * * By Prof A. S. Prof A. S. Sambo Sambo , , OON, NPOM, FNSE OON, NPOM, FNSE Director-General, Energy Commission of Nigeria, Abuja Email: [email protected] or [email protected]*Paper Presented to the *Paper Presented to the “ “ Nigerian Society of Engineers Forum Nigerian Society of Engineers Forum ” ” , 2 , 2 nd nd April , 2009 April , 2009 Shehu Shehu Yar Yar ’ ’ Adua Adua Centre, Abuja Centre, Abuja
Transcript
1
THE CHALLENGES OF SUSTAINABLE THE CHALLENGES OF SUSTAINABLE ENERGY DEVELOPMENT IN NIGERIAENERGY DEVELOPMENT IN NIGERIA**
By
Prof A. S. Prof A. S. SamboSambo, , OON, NPOM, FNSEOON, NPOM, FNSE
Director-General, Energy Commission of Nigeria, Abuja
*Paper Presented to the *Paper Presented to the ““Nigerian Society of Engineers ForumNigerian Society of Engineers Forum””, 2, 2ndnd April , 2009 April , 2009 ShehuShehu YarYar’’AduaAdua Centre, AbujaCentre, Abuja
2
CONTENTCONTENT
1.1. INTRODUCTIONINTRODUCTION
22 ENERGY RESOURCES IN NIGERIAENERGY RESOURCES IN NIGERIA
33 PROJECTED ENERGY DEMAND AND SUSTAINABLE PROJECTED ENERGY DEMAND AND SUSTAINABLE SUPPLY FOR NIGERIASUPPLY FOR NIGERIA
44 ENERGY SUPPLY INFRASTRUCTURE IN NIGERIAENERGY SUPPLY INFRASTRUCTURE IN NIGERIA
55 CHALLENGES OF THE ENERGY SECTOR CHALLENGES OF THE ENERGY SECTOR
6.6. WAY FORWARD FOR SUSTAINABLE ENERGY WAY FORWARD FOR SUSTAINABLE ENERGY SUPPLY IN NIGERIASUPPLY IN NIGERIA
7.7. CONCLUSIONCONCLUSION
3
1. 1. INTRODUCTIONINTRODUCTION
Energy is an essential ingredient for socio-economic growth of all nationsEnergy exists in various forms like chemical, mechanical, electrical, heat, light etcThe objective of an energy system is to provide energy service in the industrial, transport, household and services sectors of the economy. Energy is therefore the oil that lubricates the engine of growth of national economies.Nigeria is well endowed with a variety of fossil and renewable energy types.
4
Fossil energy carriers are hydrocarbon substances and include crude oil, natural gas, tar sands and coal. They are depletable at any rate of consumption.Also when ordinarily consumed, fossil fuels upset the natural balance of carbon dioxide (CO2) in the atmosphere and thus contribute to global warming. Renewable energy carriers are resources, which are available ona continuous or cyclic basis and include solar, wind, hydro, tidal, wave, geothermal, and biodegradable biomass (fuelwood, animal and crop residues, energy crops, etc.). They are, on theother hand, non-depletable on consumption. Apart from large hydro, and some form of biomass, renewable energy utilization has relatively little negative effects on theenvironment. They are therefore energy resources suitable for sustainable development.
Sustainable development refers to the pattern of resource use that meets human needs while preserving the environment so that generations yet unborn can also meet their needs in the future.Despite the abundance of energy resources in Nigeria, the reality is that there is a big gap between the demand and supply of the final end-use energy, which are mainly fuels and electricity.The objective of this presentation is to briefly discuss the nation’s energy resources; status of the sector, its major challenges and the way forward for sustainable development.
445,000 barrels/day2.06 million barrels/day36.22 billion barrelsCrude Oil1.
Utilization (natural units)
Production Level (natural units
Reserves (Natural Units)Resource TypeS/No.
Sources: (i) Nigerian National Petroleum Corporation (NNPC) 2007)(ii) Renewable Energy Masterplan (REMP) 2005(iii) Ministry of Mines and Steel Development (2008
22 ENERGY RESOURCES IN NIGERIA ENERGY RESOURCES IN NIGERIA (a) Energy Resources(a) Energy Resources
7
2(b) Commercial Primary Energy Consumption by Type
It should be noted that while coal has over a long period been neglected, petroleum has constituted over 80% of the commercial primary energy consumed in the country.
8
2(c) Per Capita Primary Energy Consumption in Nigeria
2 Energy Resources in Nigeria ………. Cont’d
Source: CBN (2006, 2007), NBS (2007)
0.079144.20311.3872007
0.089140.00312.4212006
0.132133.70217.7072005
0.125129.92716.2672004
0.151126.15319.1062003
0.153122.36518.7532002
Per Capita Energy Consummed(toe/capita)
Population (million)
Energy Consumed
(million toe)Year
These values may be compared with the world average of 1.78 toe/capita and the average for Africa of 0.68 toe/capita
9
2(d) Comparative Per Capita Electricity Consumption of African Continent
2 Energy Resources in Nigeria …………. Cont’d
4,848South Africa
3,336Libya
1,226Egypt
932Gabon
271Ghana
152Senegal
144Kenya
136Nigeria
563Africa (Average)
2,596World (Average)
Per Capita Electricity
Consumption (kWh/capita)
Continent/Country
Source: IEA, Key World Energy Statistics, (2007)
Nigeria’s per capita electricity consumption is 4 times less than the African average and about 19 times less than the world’s average
10
2(e) Changes in Petroleum Products Consumption (2003 2(e) Changes in Petroleum Products Consumption (2003 –– 2007)2007)
-42.8-42.5010.820Low Pour Fuel Oil
(LPFO)
-52.4-25.80-19.2-28.3Dual Purpose
Kerosene (DPK)
-2.96-0.190110.44Premium Motor Spirit
-0.26-8.10.330.5-6.4Liquified Petroleum
Gas (LPG)
20072006200520042003
Changes in Consumption Levels (%)
Fuel Product
It should be noted that petroleum products constituted the highest energy resources consumed in the country. However, the table above shows that its consumption has been falling over the years.
2 Energy Resources in Nigeria ………. Cont’d
Source: CBN Annual Report (2007), Base year 2002
11
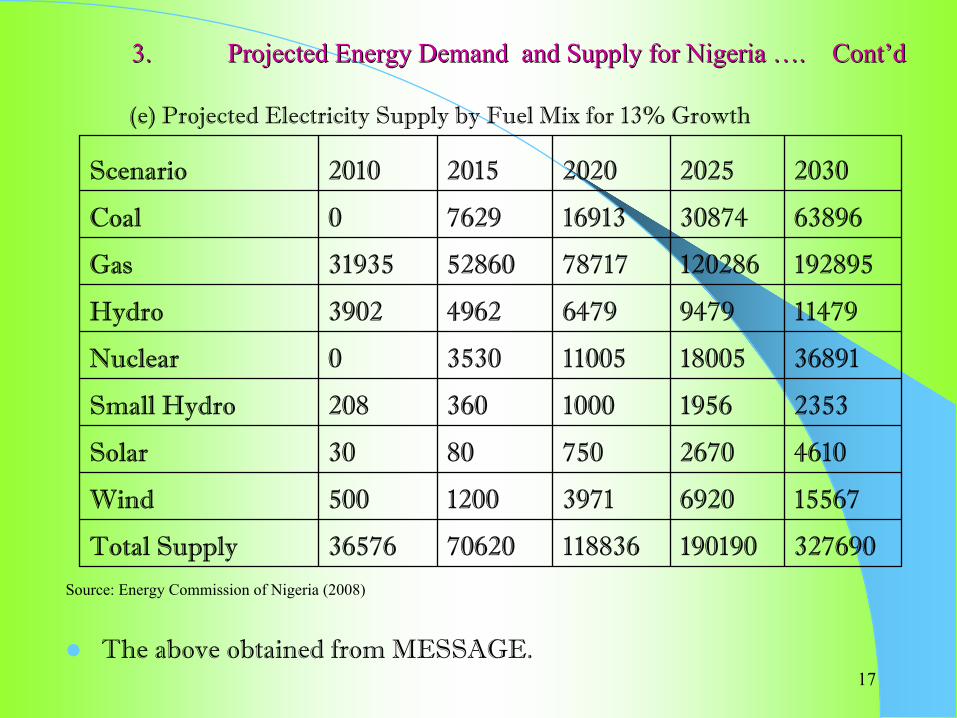
3. PROJECTED ENERGY DEMAND AND 3. PROJECTED ENERGY DEMAND AND SUPPLY FOR NIGERIASUPPLY FOR NIGERIA
Energy Demand and Supply Projections– The IAEA developed Model for the Analysis of Energy
Demand (MAED), which is scenario based, was used to model the demand structure of Nigerian energy sector in four scenarios. The Model for Energy Supply Strategy Alternative and General Environmental Impacts (MESSAGE) also developed by IAEA was used to estimate the supply strategy for meeting the demand. The four scenarios used were:
– Reference Growth ScenarioGDP grows by an average of 7% per annum.The main driver of growth is the manufacturing sectorManufacturing accounts for 15% of GDP by 2020Consistent with the MDG objective of reducing poverty by half by 2015
12
PROJECTED ENERGY DEMAND AND SUPPLY PROJECTED ENERGY DEMAND AND SUPPLY FOR NIGERIAFOR NIGERIA…………contcont’’dd
– High Growth ScenarioGDP grows by an average of 10% p.a.Manufacturing contributes 22% to GDP by 2030Nigeria is transiting from an agrarian economy to an industrializing nation
– Optimistic Growth Scenario IGDP grows by an average of 11.5% p.a. Manufacturing contributes 22% to GDP by 2030Nigeria is transiting from an agrarian economy to an industrializing nation
– Optimistic Growth Scenario IIGDP grows by an average of 13% p.a. Manufacturing contributes 22% to GDP by 2030Nigeria is transiting from an agrarian economy to an industrializing nation
13
33 PROJECTED ENERGY DEMAND AND PROJECTED ENERGY DEMAND AND SUPPLY FOR NIGERIASUPPLY FOR NIGERIA…….cont.cont’’dd
Source: Energy Commission of Nigeria (2006)
(a) Total Projected Energy Demand in Mtoe
715.70429.11312.61148.9772.8132.01
Optimistic (13%)
553.26331.32245.97108.5756.1832.01
Optimistic (11.5%)
414.52259.19190.7394.1856.1832.01
High Growth (10%)
245.19169.18118.1479.3651.432.01Reference (7%)
203020252020201520102000Scenario
The above total energy demand is obtained from MAED
14
(b) Projected Electricity Demand in MW
3.3. Projected Energy Demand and Supply for Nigeria Projected Energy Demand and Supply for Nigeria ……. Cont. Cont’’dd
3.3. Projected Energy Demand and Supply for Nigeria Projected Energy Demand and Supply for Nigeria ……. Cont. Cont’’dd
Renewable energy, and in particular fuelwood would continue to dominate the non-electricity energy needs for the majority of the people in the country.
Source: ECN-REMP (2005)
19
Fuelwood Supply and its efficient use
33 Projected Energy Demand and Supply for Nigeria Projected Energy Demand and Supply for Nigeria ……. Cont. Cont’’dd
20
LongMediumShort
50%20%(B20)
5%(B5)
% contribution to diesel fuel supply
20.51.950.30Demand (billion litres/year)
Bio-diesel
50%15%(E15)
10%(E10)
% contribution to Motor spirit supply
473.401.4Demand (billion litres/year)
Bio-ethanol
Time frame
BiofuelShort Term = 2010Medium Term = 2015Long term = 2030
(g) Projected Contributions of Biofuels
33 Projected Energy Demand and Supply for Nigeria Projected Energy Demand and Supply for Nigeria ……. Cont. Cont’’dd
21
4.4. ENERGY SUPPLY INFRASTRUCTURE IN ENERGY SUPPLY INFRASTRUCTURE IN NIGERIANIGERIA
(a) Policy Framework
In 1999 the Federal Government took a bold decision to get the national economy to be private sector driven.
The strong nexus between energy and socio-economic development made the Federal Government of Nigeria to approve, in 2003, an overall National Energy Policy (NEP) for the nation.
The NEP, hinged on private sector driven energy sector in line with the national economic policy.
The NEP has the following objectives:– To ensure the development of nation’s energy resources,
with diversified energy resources option for enhanced achievement of national energy security.
22
- To guarantee adequate, reliable and sustainable supply of energy at appropriate costs and in an environmentally friendly manner.
- To guarantee an efficient and cost effective consumption pattern of energy resources.
- To accelerate the process of acquisition and diffusion of technology and managerial expertise in the energy sector.
- To promote increased private sector investments and development of the energy sector industries.
– To ensure a comprehensive, coherent and coordinated energy sector plans and programmes.
– To foster international cooperation in energy trade and projects development in Africa and the world at large.
44 Energy Supply Infrastructure Energy Supply Infrastructure …… ……. Cont. Cont’’dd
23
In 2005, the Electric Power sector Reform Act (EPSR) was passed that liberalized the power sector and removed government’s monopoly on generation and distribution.To this effect, the Nigerian Electricity Regulatory Commission (NERC) was established to create level playing field for all stakeholders and to licenceplayers in the sub-sector.In 2007, the Federal Executive Council approved a biofuel Policy framework presented by the NNPC.In 2007/2008, Government established the OGIC. Its report was accepted as the blue print for the reform of the oil and gas sector.New laws are now being put in place to get the legal backing for the reforms in the petroleum sub-sector.
44 Energy Supply Infrastructure Energy Supply Infrastructure …… ……. Cont. Cont’’dd
National Integrated Power Project (NIPP) – NG Powered
4.4. Energy Supply Infrastructure Energy Supply Infrastructure …… ……. Cont. Cont’’dd
29
Independent Power Producers (Independent Power Producers (IPPsIPPs) ) –– Licensed by NERC as at 20Licensed by NERC as at 20thth February 2009February 2009
140LagosAgbaraGas100MW28/09/07“Agbara Shoreline Power Co. Ltd
17
640RiversAfamGas640MW23/05/07Generation on GridShell Distribution Co. Ltd16
200OgunIbafoGas200MW23/05/07“Ibafo Power Station Ltd15
--150OgunWarewaGas150MW23/05/07“Hudson Power Station Ltd14
--95RiversElemeGas95MW23/05/07“First Independent Power Co. Ltd
13
--136RiversTrans AmadiGas136MW11/5/2007“First Independent Power Co. Ltd
12
--150RiversOmokuGas150MW11/5/2007“First Independent Power Co. Ltd
11
--90LagosAgbaraGas90MW12/4/2007“Anita Energy Ltd10
4.4. Energy Supply Infrastructure Energy Supply Infrastructure …… ……. Cont. Cont’’dd
30
Independent Power Producers (Independent Power Producers (IPPsIPPs) ) –– Licensed by NERC as at 20Licensed by NERC as at 20thth February 2009 February 2009 …….. Cont.. Cont’’dd
316266354678446MWGRAND TOTAL
306797MWSUB-TOTAL
20OgunOta"20MW22/12/08"Tower Power Utility Ltd28
5LagosNigerian Breweries Ltd Iganmu
"5MW
22/12/08
"CET Power Project Ltd27
--20Cross River
TinapaGas20MW28/09/07Generation off-Grid
CET Power Project Ltd26
-309LagosIkoroduGas39MW23/02/07Embedded Gen.Ikorodu Ind. Power Ltd25
---LagosIkorodu--7/12/2006Distribution“Ikorodu Ind. Power Ltd24
(vi)(vi) Capacity Utilization of Refineries in NigeriaCapacity Utilization of Refineries in Nigeria
Refinery Capacity Utilization, %
0
10
20
30
40
50
60
1997
1998
1999
2000
2001
2002
2003
2004
2005
2006
2007
Year
Cap
acity
Utilization, %
With a projected demand of about 36 million litres/day for PMS, 8 million litres/day for DPK and 15 million litres/day for AGO, the supply in 2007 of about 24.27 millions/day of PMS, 3.8 million litres/day of AGO and 1.5 million litres/day were inadequate. Even then, over 80% of the PMS consumed was imported due to low capacity utilization of the local refineries that arose due to technical problems and vandalization of crude supply lines to the refineries.
4. 4. Energy Supply Infrastructure Energy Supply Infrastructure ……. Cont. Cont’’dd
Source: NNPC, ASB (2007)
33
5.5. CHALLENGES OF THE ENERGY SECTORCHALLENGES OF THE ENERGY SECTORDespite the installed petroleum products refining capacity of 445,000 barrel/day and electricity generation capacity in excess of 8,000 MW, Nigeria imports over 70% of its petroleum products requirement, while electricity supply is inadequate at just about 3,000 MW now.
The rate at which new power plants and new oil refineries together with associated infrastructure are added to into the system is very low.
The new licencees of NERC have not made appreciable progress due to problems of bankability of proposals, agreements on power purchase and securitization.
Coal and Renewable energy resources are grossly under utilized in the country despite their availability in reasonable quantities.
Natural gas supply is grossly inadequate for the existing gas power plants
34
5.5. CHALLENGES OF THE ENERGY SECTORCHALLENGES OF THE ENERGY SECTOR…….cont.cont’’dd
Oil and Gas exploration in the inland basins of Lake Chad and Upper Benue Trough have not been concluded.
Policy reversals in the energy sector due to lack of an overall energy law.
The uncontrolled large-scale use of fuelwood in the rural and peri-urban areas is a recipe for desert encroachment, erosion and loss of soil fertility.
Lack of adequate manpower for the energy sector.
Consumption of energy in Nigeria is very wasteful.
Community relations problem in the Niger-Delta region.
35
6.6. WAY FORWARDWAY FORWARD
The on-going reforms in the oil, gas, and power sub-sectors of the country should be pursued with vigour.
Existing under utilized energy infrastructure in the country should be rehabilitated and upgraded to operate at optimum conditions.
New energy infrastructure should be put in place in the country at a faster rate.
The energy supply mix into the economy should be diversified to include nuclear, coal, solar, wind, biomass and biofuels.
36
Establishment of plantations of quick growing tree species to provide for fuelwood in the interim along with popularizing efficient wood burning stoves is necessary.
Quantification of coal and Uranium reserves of the country should be undertaken.
Completion of the oil exploration activities around Lake Chad and Upper Benue Trough should also be undertaken.
The passage of the National Energy Policy and the National Energy Masterplan into law is expected to stabilize development in the energy sector by ensuring minimal changes in Government policies on energy.
6.6. Way ForwardWay Forward …….... ContCont’’dd
37
6.6. Way ForwardWay Forward …….... ContCont’’dd
The take-off of the Ministry of Niger-Delta is expected to resolve the problems of the region.
The adoption of energy conservation and efficiency practices and technologies should be actively promoted to ensure rationalized consumption of energy in the country.
Continuous capacity building in the entire spectrum of energy development should be pursued with all seriousness.
Adequate and appropriate incentives to be adopted to attract private funds in the development of the energy sector.
38
7. CONCLUSION7. CONCLUSIONDespite the abundant conventional and renewable energy resources in Nigeria, the supply of processed energy is far below the demand.
The only way to ensure the attainment of Vision 20-2020 is to emulate the developed and fast growing economies of the world by mainstreaming energy planning into overall national plans.
There should be an overall energy law that will harmonisesub-sectoral energy enactments, to fast-track socio-economic development of the country.


![qäm-›p-I-fnse ss[j-WnI {]h-W-X-I˜ - SCERT - The State ... · qäm-›p-I-fnse ss[j-WnI {]h-W-X-I˜ - SCERT - The State ... ... i](https://static.documents.pub/doc/80x56/5e1593b8a9eba101874b1d6d/qm-ap-i-fnse-ssj-wni-h-w-x-ioe-scert-the-state-qm-ap-i-fnse-ssj-wni.jpg)


