127


Prof. Natika Jain*
Abstract: Retailing is important as it gives an opportunity to study the target consumers closely, to
understand their shopping habits and what are the things they look for at the point of Purchase
(POP). This helps the manufacturer to understand their customer in a better way and customize their
product offerings to suit the needs of the customer. The survey is conducted at two stores regarding
customer satisfaction. The data is presented considering the various factors such as Store Layout,
Total area, Location of the store, No of Staff, Average foot falls per day, Parking facilities, No of “In
house brands”, Targeted growth, Expansion Plans, Security System, Loyalty program, Frequency of
Visit, Demographics of Customer, Visual Recall, Average Shopping Expense, Pricing, Friendliness, of
salesperson, Visual Merchandising, etc.
[1]
1. GENESIS OF THE STATEMENT
1.1 Introduction to the retail sector inIndia
The word retailer has been derived from theFrench word 'retaillier' which means to cut apiece off or 'to break bulk'. In simple terms itmeans a first hand transaction with thecustomer. The dictionary meaning of the wordretailer is 'to sell in small quantities.'
Retailing is important as it gives an opportunityto study the target consumers closely, tounderstand their shopping habits and what arethe things they look for at the point of Purchase(POP). This helps the manufacturer tounderstand their customer in a better way andcustomize their product offerings to suit theneeds of the customer.
Retailing Definition:
Retailing involves:
1) Buying the correct merchandise (Sourcing)
2) Putting a judicious price to it (pricing)
3) Displaying it beautifully & Conveniently(Visual merchandising) and
4) Final selling it to the customer.
Though it seems simple, retailing is a carefullybalanced act where the customer is the keyagent for all decisions. In India the retail sector
is the second largest employer after agriculture.The retailing sector in India is highlyfragmented and predominantly consists ofsmall independent, owner-managed shops.There are some 12 million retail outlets inIndia. The Indian retail industry is highlyunorganized. There are nearly twelve millionretail outlets in India and the number isgrowing. Two thirds of these stores are in rurallocation. The vast majority of the twelve millionstores are small “father and son” outlets.According to the “Retailing in India” reportpublished by the PwC Global Retail IntelligenceProgram, share of the unorganized sector is98%.
The Indian Retail industry isfragmented. Retail stores in India are mostlysmall individually owned businesses. Theaverage size of an outlet is 50 sq. ft. and thoughIndia has the highest number of retail outletsper capita in the world, the retail space percapital at 2 sq. ft. per person is amongst thelowest in the world. The Indian retail Industryhas rural bias. Nearly two thirds of the storesare located in rural areas. The retail Industry inrural India has typically two forms: “Haats” and“melas”. Even in urban areas, organized retailin India is restricted to the top few cities of thecountry like Mumbai, NCR, Chennai,Bangalore and Hyderabad.
* Sr. Lecturere, St. Francis Institute of MGMT and Research, Mt. Poisur Road, Borivili (W),Mumbai.
Volume 2 Issue 1 Consumer Buying Behaviour At Retail Outlet/Shopping Mall
Keywords: Pop, Sourcing, Pricing, Visual merchandising, retaillier, mall, stopovers
Consumer Buying Behaviour At Retail Outlet/Shopping Mall

[2]
Volume 2 Issue 1 APOTHEOSIS : Tirpude's National Journal of Business Research (TNJBR)
INDIAN RETAIL MARKET 2009
Retail Segments Indian
Retail Value
(Rs. In
Crore)
Organized
Retail (Rs.
In Crore)
% Organized
in 2009
Clothing, Textiles & Fashion Accessories 1,13,500 21,400 18.9
Jewellery 60,200 1,680 2.8
Watches 3,950 1,800 45.6
Footwear 13,750 5,200 37.8
Heath and Beauty care service 3,800 400 10.6
Pharmaceuticals 42,200 1,100 2.6
Consumer durables, Home appliances 48,100 5,000 10.4
Mobile Handsets, accessories & Services 21,650 1,740 8
Furnishings, Utensils, Furniture – home and
office
40,650 3,700 9.1
Food and Grocery 7,43,900 5,800 0.8
Catering Services (F & B) 57,000 3,940 6.9
Books, Music & Gifts 13,300 1,680 12.6
Entertainment 38,000 1,560 4.1
Total 12,00,000 55,000 4.6
Health

[3]
Volume 2 Issue 1
There is range of retail formats as follows:
Supermarkets:
These stores offer a wide range of food andhousehold items meant for daily consumption.These are FMCG kind of products, where quickinventory turnover is possible. The targetcustomers are families shopping for theirhousehold requirements. Products offeredrange from personal hygiene and health careproducts like soaps, shampoos etc., to food itemssuch as pickles, masalas, papads, jam, butter,cheese to food grains. These stores provide thecustomers with the convenience of finding allthe products under one roof.
Specialty Stores:
The products offered at these stores are focusedto a particular category only. There is a largevariety in the product category. The productscan be classified as per product categories, forexample, shoes, jewelry, etc. These stores followthe strategy of focused differentiation. Thestores have a high degree of focus on aparticular product category, and a high degreeof variety in that particular category. Examplesof specialty stores are Bata, the store focuses ononly one product category i.e. Footwear, underfootwear there are three broad categories men'swear, women's wear and children wear.
Departmental Stores:
As the name itself suggests, these are storeswith various departments offering differentproducts. Departmental stores are large sizedstores offering a range of products, which areskewed on the basis of brands. The productsoffered mostly belong to the shopping goodscategory. The products essentially comprise ofapparels, cosmetics, jewelry, leatheraccessories, electronic gadgets etc. Initiallysouth Indian cities witnessed a great boom inc o m m e r c i a l e s t a b l i s h m e n t l i k e th edepartmental stores. This was due to variousreasons such as:
Low real estate prices: The price of land inthese regions was very low in comparison toother cities in west and north India, thus the
initial outflow of funds was competitively lower.
Socio economic background: The literacylevels in south India are above the nationalaverage, so there is high level of awareness, alsothis region has been the hub for the InformationTechnology boom, thus there is highemployment and the consumers have highpurchase power which made retail businesseven more attractive.
The Mall:
The mall is relatively very new concept in India.These are huge areas with self containedindependent shops. The mall developers arelike real estate agents; it's their job to lease outthe mall space to prospective clients (retailers).The product ranges are broad right fromshopping items like food, apparels, Jewelry,leather accessories to dining and tapestry.These malls also have entertainment zonesfrom games to movies to food courts. Incountries like Dubai and Singapore which areregarded as shopping destinations, the mallsare so huge that it may require a customer acouple of days to just have a look around theplace. Crossroads at Mumbai was one of thefirst malls in India, providing internationalstandard quality, ambiance and services. It wasthe first mall to have a parking lot on the terraceof the building and 2 large lifts to ferry the cars.The whole mall is centrally air conditioned.They employ a huge staff for the maintenance,securities and other purposes. The occupancyrate in a mall is the most important aspect toensure a sturdy income to the developers. Theoccupancy rate at crossroads is close to 95%.The international occupancy rate the world overis about 85%.
Stopovers:
These kinds of stores are found at petrolstations, the major target customers for thesestores are people traveling long distances andstopping over at petrol stations for refuelingtheir cars. As these people are traveling longdistances they would probably but impulsepurchases - goods like wafers, candies, colddrinks etc. In recent times the margins to petroldealers has shrunk as the costs of
Consumer Buying Behaviour At Retail Outlet/Shopping Mall
Sitara. The company also operates an onlineportal, Futurebazaar.com. A Subsidiarycompany, Home Solutions Retail (India)Limited, operates 'Home Town', a large formathome solutions store, collection, selling homefurniture products and 'E Zone' focused oncatering to the consumer electronics segment.
1.5 Shopper Stop
Introduction:
Setting up shop in 1991 with its flagshipstore in Andheri, Mumbai, Shoppers' Stop is amember of the K. Raheja Corp. of companies.Shoppers' Stop is the first retail venture by the K. Raheja Corp., promoted by Mr. Chandru L.Raheja, Mr. Ravi C. Raheja and Mr. Neel C.Raheja Corp. and have been leaders in theconstruction business for over 48 years.
With its wide range of merchandise,exclusive shopinshop counters of internationalbrands and worldclass customer serviceshoppers' stop brought international standardsof shopping to the Indian consumer providingthem with a world class shopping experience.
Expanding its operations to Bangalore,Hyderabad, Jaipur, Delhi, Chennai, Mumbai(Andheri, Bandra, Chembur, Kandivali,Mulund), Pune, Gurgoan and Kolkata,Shoppers' Stop is today recognized as India'spremier shopping destination. With a customerentry of about 50,000 customers a day, anational presence with over 6,00,000 squarefeet of retail space and stocking over 250 brandsof garments and accessories, Shoppers' Stop hasclearly become a one stop shop for all customers.
Shopper's Stop's core customers fallbetween the age group of 16 years to 35 years,the majority of them being families and youngcouples with a monthly household income aboveRs. 20,000 and an annual spend of Rs. 15,000. Alarge number of Non Resident Indians visit theshop for ethnic clothes in the internationalenvironment they are accustomed to.
The stores offer a complete range ofapparel and lifestyle accessories for the entirefamily. From apparel brands like Provogue,Color Plus, Arrow, Levi's, Scullers & Zodiac to
transportation and tamper proof lockingsystems etc have increased the expenses.
Discount Stores / Bazars:
This is a new format of stores adapted from thedepartmental stores; these stores providecohesive mix of products. These stores provideproducts at a reduced price range and arespecifically targeted at price consciouscustomers. Big Bazar is an example of such adiscount store, promoted by Pantaloon RetailIndia. It is spread across 54,000 square feet andstocks 1,60,000 products encompassing everymajor category. The store is broadly divided into3 categories, namely apparels, food (packagedand unpackaged) and non apparel (whichincludes everything from plastics to utensils,luggage, durables, toys and gifts.)
Single Price Stores: This is a very famousconcept in western countries which is now beingtried in India too. These are normally small sizestores, popularly called as the dollar shop.These stores offer products at two fixed prices i.e. Rs. 49 and Rs. 99. The products offeredmostly comprise of gift items like show pieces,wall hangings, small paintings and such othernovelty items.
1.4 Pantaloon
Introduction:
Pantaloon Retail (India) Limited is India'sleading retailer that operates multiple retailformats in both the value and lifestyle segmentof the Indian consumer market. Headquarteredin Mumbai (Bombay) the company operatesover 7 million square feet of retail space, hasover 1000 stores across 53 cities in India andemploys over 25,000 people. The Company'sleading formats include Pantaloons, a chain offashion outlets, Big Bazaar, a uniquely Indianhypermarket chain, Food Bazaar, asupermarket chain blends the look, touch andfeel of Indian bazaars with aspects of modernretail like choice, convenience and quality and'Central', a chain of seamless destination malls.Some of its other formats include, Depot, ShoeFactory, Brand Factory, Blue Sky FashionStation, aLL, Top 10, mBazaar and Star and
[4]
Volume 2 Issue 1 APOTHEOSIS : Tirpude's National Journal of Business Research (TNJBR)

14) Demographics of customer
15) Visual recall
16) Average shopping expense
17) Pricing
18) Friendliness of salespersons
19) No. of sales personnel.
2.3 Research Design
The Research design is a plan specifying thevarious methods and procedures for colleting,analyzing and interpreting data. This has to bedone keeping the objectives of the research inmind. The design is based on the availability ofdata, the objectives, the cost of obtaining dataand the given time frame. It was decided thatsurvey technique would be the best in this casedue to time & cost limitations.
2.4 Sampling:
A sample size of 50 respondents was consideredper outlet. The sample technique used here isconvenience sampling due to time and budgetconstraints.
2.5 Data collection:
Primary data: Primary data was collectedthrough the use of questionnaire and personalinterview. The respondents were interviewed asthey were leaving the store after completingtheir shopping. Data was also collected byobservation method on some parameters.
Secondary data: For the purpose of this study,information was also collected from various websites and articles.
3. Data Analysis
A survey was conducted at 2 outlets to study thecustomer satisfaction level of retail outlets,namely Shoppers Stop (Malad) and Pantaloons(Lower Parel). The data was collected with thehelp of questionnaire survey from therespondents. Primary information regardingfactor like location, total area of outlets, type oflayout, No. of employees, average foot fall andsecurity system is collected through higher levelemployees of the respective retail chains. Asample size of 50 respondents was considered
[5]
Volume 2 Issue 1
cosmetic brand like Lakme, Chambor, Le Teint,Ricci etc., Shoppers' Stop caters to everylifestyle need. Shoppers' Stop retails its ownline of clothing namely Stop, life, Kashish,Vettorio, Fratini and DIY. The merchandise atShoppers' stop is sold at a quality and priceassurance backed by its guarantee stamp onevery bill. Their motto is: “We are responsiblefor the goods we sell.”
Shoppers' Stop's customer loyaltyprogram is called the First Citizen. Theprogram offers its members an opportunity tocollect points and avail of innumerable specialbenefits. Currently, Shoppers' Stop hasdatabase of over 2.5 lakh members whocontribute to nearly 50% of the total sales ofShoppers' Stop.
2. Research Methodology
2.1 Research Objective:
The research objective is to have a comparativeanalysis between two players of the retailindustry:
1) Shoppers Stop
2) Pantaloons
2.2 Definition of parameters and variablesfor comparison
1) Store layout
2) Total area
3) Location of the store
4) No. of staff
5) Average foot-falls per day
6) Parking facilities
7) No. of “in house brands”
8) Targeted Growth
9) Expansion Plans
10) Security system
11) Loyalty Program
12) Customer Satisfaction
13) Frequency of visit
14) Demographics of customer
Consumer Buying Behaviour At Retail Outlet/Shopping Mall

[6]
Volume 2 Issue 1 APOTHEOSIS : Tirpude's National Journal of Business Research (TNJBR)
per outlet for the customer satisfaction survey.
4. Data Analysis and Interpretation
The survey conducted at two stores regardingcustomer satisfaction showed the followingresults. The data is presented considering thevarious factors such as Store Layout, total area,Location of the store, No of Staff, Average foot falls per day, Parking facilities, No of “In housebrands”, Targeted growth, Expansion Plans,Security System, Loyalty program, Frequencyof Visit, Demographics of Customer, VisualRecall, Average Shopping Expense, Pricing,Friendl iness , o f salesperson, VisualMerchandising. The data is presented factorwise, with finding form each store and with thehighest rating presented first, and so on.
Observations
(A) Gender
Pantaloons:
1) 44% of the respondents visiting Pantaloonstore were male.
2) 56% of the respondents visiting Pantaloonstore were Female.
Shoppers Stop:
1) 60% of the respondents visiting Shopper Stopwere male.
2) 40% of the respondents visiting Shopper Stopwere Female.
(B) Average Shopping expenses
Pantaloons:
1) 32% of the respondents have shoppingexpense between Rs. 2001 Rs. 3000.
2) 24% of the respondents have shoppingexpense between Rs. 3001 above.
3) 36% of the respondents have shoppingexpense between Rs. 1001 Rs. 2000.
Shoppers Stop:
1) 32% of the respondents have shopping expense between Rs. 2001 Rs. 3000.
2) 16% of the respondents have shoppingexpense between Rs. 501-Rs. 1000.
3) 12% of the respondents have shoppingexpense between Rs. 3001 above.
4) 4% of the respondents have shopping expensebelow Rs. 500. expense between Rs. 2001 Rs.3000.
2) 16% of the respondents have shoppingexpense between Rs. 501-Rs. 1000.
3) 12% of the respondents have shoppingexpense between Rs. 3001 above.
4) 4% of the respondents have shopping expensebelow Rs. 500.
(C) Frequency of visit
Pantaloon:
1) 42% of the respondents visit the store once in3 months
2) 32% of the respondents visit the store once in6 months
3) 16% of the respondents visit the store once ina year.
4) 10% of the respondents visit the store once ina months
Shoppers Stop:
5) 50% of the respondents visit the store once in3 months
6) 28% of the respondents visit the store once in6 months
7) 18% of the respondents visit the store once ina year.
8) 6% of the respondents visit the store once in amonths
(D)Mode of Payment
Pantaloons:
1) 52% of the respondents use cash as the modeof payment.
2) 32% of the respondents use Credit card/ DebitCard as the mode of payment.
Shopper Stop:
3) 76% of the respondents visiting ShopperStop store can recall the visual display andcan describe it.
4) 24% of the respondents visiting ShopperStop store can't recall the visual display andcan describe it.
(G) Variety of products
Pantaloons:
1) 48% of the respondents visitingPantaloon store are satisfied with thevariety of products.
2) 24% of the respondents visitingPantaloon store are highly satisfied withthe variety of products.
3) 22% of the respondents visitingPantaloon store are neither satisfied nordissatisfied with the variety of products.
4) 6% of the respondents visiting Pantaloonstore are dissatisfied with the variety ofproducts.
5) None of the respondents visitingPantaloon store are highly dissatisfied withthe variety of products.
Shoppers Stop:
1) 48% of the respondents visiting ShopperStop store are satisfied with the variety ofproducts.
2) 20% of the respondents visiting ShopperStop store are highly satisfied with thevariety of products.
3) 14% of the respondents visiting ShopperStop store are neither satisfied nordissatisfied with the variety of products.
4) 4% of the respondents visiting ShopperStop store are dissatisfied with the varietyof products.
5) None of the respondents visiting ShopperStop store are highly dissatisfied with thevariety of products.
(H) Display of products
[7]
Volume 2 Issue 1
3) 16% of the respondents use Credit card /Debit card and cash as modes of payment.
Shopper Stop:
1) 46% of the respondents use cash as the modeof payment.
2) 38% of the respondents use Credit card /Debit Card as the mode of payment.
3) 16% of the respondents use Credit card /Debit card and cash as modes of payment.
(E) Pricing
Pantaloons:
1) 54% of the respondents felt that pricejustified quality of products. 20% of therespondents felt that prices of products are“Inexpensive”.
2) 16% of the respondents felt that prices ofthe products are “Expensive”.
3) 10% of the respondents felt that prices ofthe products are “Very expensive”.
4) None of the respondents felt that prices ofthe products are “Very Inexpensive”.
Shopper Stop:
1) 48% of the respondents felt that pricejustified quality of products.
2) 28% of the respondents felt that prices ofthe products are “Inexpensive”.
3) 16% of the respondents felt that prices ofthe products are “Expensive”.
4) 4% of the respondents felt that price ofproducts are “Very expensive”.
5) 4% of the respondents felt that price ofproducts are “Very Inexpensive”.
(F) Recall any visual display in the store
Pantaloons:
1) 66% of the respondents visitingPantaloons store can recall the visualdisplay and can describe it.
2) 34% of the respondents visitingPantaloons store can't recall the visualdisplay and can describe it.
Consumer Buying Behaviour At Retail Outlet/Shopping Mall
[8]
Volume 2 Issue 1 APOTHEOSIS : Tirpude's National Journal of Business Research (TNJBR)
Pantaloons:
1) 38% of the respondents visiting
1) 46% of the respondents visiting ShopperStop store are satisfied with serviceprovided by sales person.
2) 24% of the respondents visiting ShopperStop store are neither satisfied nordissatisfied with service provided by salesperson.
3) 14% of the respondents visiting ShopperStop store are dissatisfied with serviceprovided by sales person.
4) 12% of the respondents visiting ShopperStop store are highly satisfied with serviceprovided by Sales person.
5) 4% of the respondents visiting ShopperStop store are highly dissatisfied withservice provided by sales person.
(K) Salespersons' promptness inapproaching the costumer.
Pantaloons:
1) 40% of the respondents visitingPantaloon store are neither satisfied nordissatisfied with salespersons' promptnessin approaching them.
2) 32% of the respondents visitingPantaloon store are satisfied withsalespersons' promptness in approachingthem.
3) 16% of the respondents visitingPantaloons store are dissatisfied withsalespersons' promptness in approachingthem.
4) 6 % of the respondents visitingPantaloons store are highly satisfied withsalespersons' promptness in approachingthem.
5) None of the respondents visitingPantaloons store are highly dissatisfiedwith salespersons' promptness inapproaching them.
Shoppers Stop:
1) 36% of the respondents visiting ShopperStop store are satisfied with salespersons'

[9]
Volume 2 Issue 1 Consumer Buying Behaviour At Retail Outlet/Shopping Mall
promptness in approaching them.
2) 28% of the respondents visiting ShoppersStop store are neither satisfied nordissatisfied with salespersons' promptnessin approaching them.
3) 16% of the respondents visiting ShoppersStop store are highly satisfied withsalespersons' promptness in approachingthem.
4) 12 % of the respondents visiting ShoppersStop store are dissat is f ied withsalespersons' promptness in approachingthem.

Pantaloon store are neither satisfied nordissatisfied with willingness to exchangeproducts.
2) 34% of the respondents visitingPantaloon store are satisfied withwillingness to exchange products.
3) 28% of the respondents visitingPantaloons store are highly satisfied withwillingness to exchange products.
4) None of the respondents visitingPantaloons store are dissatisfied withwillingness to exchange products.
5) None of the respondents visitingPantaloons store are highly dissatisfiedwith Willingness to exchange products.
Shoppers Stop:
1) 42% of the respondents visitingShoppers Stop store are neithersatisfied nor dissatisfied withWillingness to exchange products.
2) 26% of the respondents visitingShoppers Stop store are highly satisfiedwith willingness to exchange products.
3) 16% of the respondents visitingShoppers Stop store are satisfied withwillingness to exchange products.
4) None of the respondents visitingShopper Stop store are dissatisfied withwillingness to exchange products.
5) None of the respondents visitingShoppers Stop store are highlydissatisfied with willingness toexchange products.
(N) Parking Facilities
Pantaloons:
1) 42% of the respondents visitingPantaloon store are highly satisfiedwith parking facilities
2) 32% of the respondents visitingPantaloon store are satisfied withparking facilities.
3) 12% of the respondents visitingPantaloons store are neither satisfied
[10]
Volume 2 Issue 1 APOTHEOSIS : Tirpude's National Journal of Business Research (TNJBR)
'
'
'
's
s '
s '
s
s '
s
s '
Stop store are neither satisfied nor
's
s
s '
s
's
nor dissatisfied with parking facilities.
4) 8% of the respondents visitingPantaloons store are dissatisfied withparking facilities.
5) 6% of the respondents visitingPantaloons store are highly dissatisfiedwith parking facilities.
Shopper Stop:
1) 46% of the respondents visitingShopper Stop store are satisfied withparking acilities
2) 34% of the respondents visitingShopper Stop store are highly satisfiedwith parking facilities.
3) 10% of the respondents visitingShopper Stop store are neither satisfiednor dissatisfied with parking facilities.
4) 10% of the respondents visitingShopper Stop store are dissatisfied withparking facilities.
5) None of the respondents visitingShopper Stop store are highlydissatisfied with Parking Facilities.
(O)Preference of the shopping centers
1) 56% of total respondents prefershoppers stop than Pantaloons forshopping purpose.
2) 44% of total respondents preferPantaloons than shoppers stop forshopping purpose.
5. RECOMMENDATIONS
More efficient Staff : The staff needs to bemore efficient in handling customers, speciallyat billing counter so there will be less timeconsumption.
Better direction within the store: Accordingto some of the respondents direction of variousdepartments is confusing in store and causesproblem for them in finding what they want.
Parking Space: According to manyrespondents, parking space is not adequate and
it takes more time for them to find parkingspace.
[11]
Volume 2 Issue 1 Consumer Buying Behaviour At Retail Outlet/Shopping Mall
Children – zone: Children play zone wassuggested by some shoppers.
Visual merchandising: Better emphasisshould be given to visual merchandising.
Customer Focus: There should be more focuson customer satisfaction and giving them greatshopping experience.
6) CONCLUSIONS
1. Consumer behavior is a study of howindividuals make decisions to spend theiravailable resources (time, effort, money etc.)
2. Marketing needs to be standardised,because cross - cultural styles, habits,tastes, prevent such standardisation.
3. Marketer's success in influencingpurchase behavior depends largely on howwell they understand consumer behavior.
4. Understanding the major factorsinfluencing consumer behavior, knowingand recognizing the types of buying decisionbehavior is of great importance in retailing.
5. Other people often influence a consumer'spurchase decision. The marketer needs toknow which people are involved in thebuying decision and what role each personplays, so that marketing strategies can alsobe aimed at these people.
6. Offer extensive information on highinvolvement products.
7. In-store promotion & placement isimportant for low involvement products.
8. Linking low-involvement product to high-involvement issue can increase sales.
7) REFERENCES
[1] Perspectives in consumer behavior: Harold H. Kassarjian, Thomas S. Robertson
[2] Exploratory consumer buying behavior:conceptualization by Hans Baumgartner,Jan-Benedict E.M. Steenkap – 1994
[3] Models In Consumer Buying Behaviour byDr. Sadia Samar Ali
[4] Buying behavior of consumer durables inIndia by Nabi,M.K. & Raut,K.C

Volume 2 Issue 1 APOTHEOSIS : Tirpude's National Journal of Business Research (TNJBR)
ABSTRACT : During the 1990s, the Indian economy began a period of rapid growth as the country'slow labor costs, intellectual capital, and improving telecommunications technology allowed India tooffer its commercial services on a global basis. Major Private Sector banks successfully adopted thecore banking and so as SBI. The implementation of the Tata Consultancy Services (TCS) BaNCS CoreBanking at the State Bank of India (SBI) and its affiliate banks represents the largest centralized coresystem implementation ever undertaken. The overall effort included the conversion of approximately140 million accounts held at 14,600 domestic branches of SBI and its affiliate banks. The paper statesthe present status of SBI and the benefits of BaNCs for SBI. The paper also narrates the criticalsuccess factors for the implementation of BaNCs. The paper enumerates the migration of SBI to corebanking system and tries to critically evaluate all the facets of cloud computing.
[12]
*Asst.Prof, Deptt. Of Business management, C.V.Raman College of Engineering, BBSR**Prof & Principal, Academy of Management Studies, Krupajal Group of Institutions, BBSR***Teaching Associate, National Society of Education and Research, BBSR Deptt.of Business Management, C.V.Raman College of Engineering, Bhubaneswar, Orissa, India
Keywords: Cloud Computing, Vendor Consortium, Real Time Gross Settlement, SWIFTJEL classification: L-86, M-15, N-75, O-31, O-32
Introduction
A lack of reliable communications andpower (particularly in rural areas) hindered theimplementation of computerization at Indianbanks throughout the 1970s and 1980s. Duringthis period, account information was typicallymaintained at the local branches with eithersemi automated or manual ledger cardprocessing. During the 1990s, the Indianeconomy began a period of rapid growth as thecountry's low labor costs, intellectual capital,and improving telecommunications technologyallowed India to offer its commercial services onglobal basis. This growth was also aided by thegovernment's decision to allow the creation ofprivate-sector banks (they had beennationalized in the 1960s). The private-sectorbanks, such as ICICI Bank and HDFC Bank,altered the banking landscape in India. Theyimplemented modern centralized core bankingsystems and electronic delivery channels thatallowed them to introduce new products andprovide greater convenience to customers. As aresult, the private-sector banks attractedmiddle and upper-class customers at the
expense of the public-sector banks.Additionally, foreign banks such as StandardChartered Bank and Citigroup used theiradvanced automation capabilities to gainmarket share in the corporate and high-net-worth markets.
The paper has been divided into sevensections. First section narrates the meaningand application of cloud computing, secondsection shows the present status of SBI, thirdsection enumerates the application of IT in SBI,fourth section describes the core systemsmodernization in SBI, fifth section tries toemphasize the importance of core banking forSBI and the sixth section narrates theapplication made by TCS in core banking andseventh section concludes the paper. Along withthat some important tables have been given inthe appendix.
Prof.Suresh Ch. Das*, Bishnupriya Mishra**, Sthitipragyan Biswal***
Banking Innovation And Cloud Computing : A Case Study OnState Bank Of India And TCS

2] SECTION-1- Introduction To CloudComputing
Cloud computing is outsourcing serverspace. The term "cloud computing" meansoutsourced, pay-as-you-go, on-demand,somewhere in the Internet, etc. Cloudcomputing refers to Internet-based computingwhere delivery of services is from servers,storage and other resources served from theWeb rather than on-premise assets. It has beenconsidered a great idea for years, but adoption isyet to accelerate. Cloud computing is nowassociated with a higher level abstraction of thecloud. Instead of there being data pipes, routersand servers, there are now services. Theunderlying hardware and software ofnetworking is of course still there but there arenow higher level service capabilities availableused to build applications. Behind the servicesare data and compute resources. A user of theservice doesn't necessarily care about how it isimplemented, what technologies are used orhow it's managed. Only that there is access to itand has a level of reliability necessary to meetthe application requirements.
T h e c l o u d m a n a g e s m u l t i p l einfrastructures across multiple organizationsand consists of one or more frameworks overlaidon top of the infrastructures tying themtogether. The frameworks provide mechanismsfor:
1) self-healing
2) self monitoring
3) resource registration and discovery
4) service level agreement definitions
5) automatic reconfiguration
Data crunching is computing-intensive,and standalone computers are not good enoughto provide good results quickly. The cloud on theother hand, distributes the resources like theprocessor and storage provides multiple inputsand outputs, and thus speeds up data crunchingsignificantly. In a recent project for a Japanesebanking firm, “we found that cloud analyticsreduces the time from the usual 12 hours to afew minutes," says Wishnu Bhat, vice-president
[13]
and head of systems integration at Infosys.
The adoption of cloud computing is donein several stages. The first is preparation, byconsolidating servers and optimising throughvirtualisation. The second is the movement ofenterprise computing to the cloud, either to aprivate cloud (where the infrastructure isowned by the private company itself) or a publiccloud (which is a service offered by anothercompany). The final stage is to use the cloud forinnovation, for cutting-edge technologies likeanalytics.
Cloud computing also enables what isknown as consumerisation of IT. It is a termused to describe several things at once, but itsessence is as follows. Over the years, consumerdevices have become more powerful than thoseused in the enterprise. This is true of manylaptops as well as mobile phones and nowtablets. Also, over the years, the publicinfrastructure has become more resourcefulthan those in the enterprise. There isavailability of high-speed broadband at home,wireless hotspots around the city, VoIP servicesand so on. Those who offer these services arelarge companies that cannot afford aninterruption in service. If these trends are puttogether, it will have a powerful medium forcorporations to use.
2.1 The Development of Cloud Computing
1. 1960s: American computer scientist JohnMcCarthy says that future computation willbe organised as a public utility.
2. 1997: Professor T Ramnath K. Chellappacoins the term cloud computing.
3. 2006: Amazon starts the first cloudcomputing service by launching the AmazonWeb service.
4. 2007: Google and IBM begin a cloudresearch project for five US universities.
5. 2008: The first set of private cloudplatforms are developed, beginning with theopen-source Eucalyptus.
6. 2009: All vendors come up with theirstrategies and start serious work on
Volume 2 Issue 1 Banking Innovation And Cloud Computing : A Case Study On State Bank Of India And TCS

[14]
developing platforms and applications.
7. 2010: Many new cloud computingplatforms become commercially available(e.g. Microsoft Azure). A few early adopters ofthe private cloud are Verizon, Wipro, EMG2.
2011: Large shifts to the private cloudexpected, providing technology consultingopportunity for IT companies.
3] SECTION-2-The Present Status Of SBI
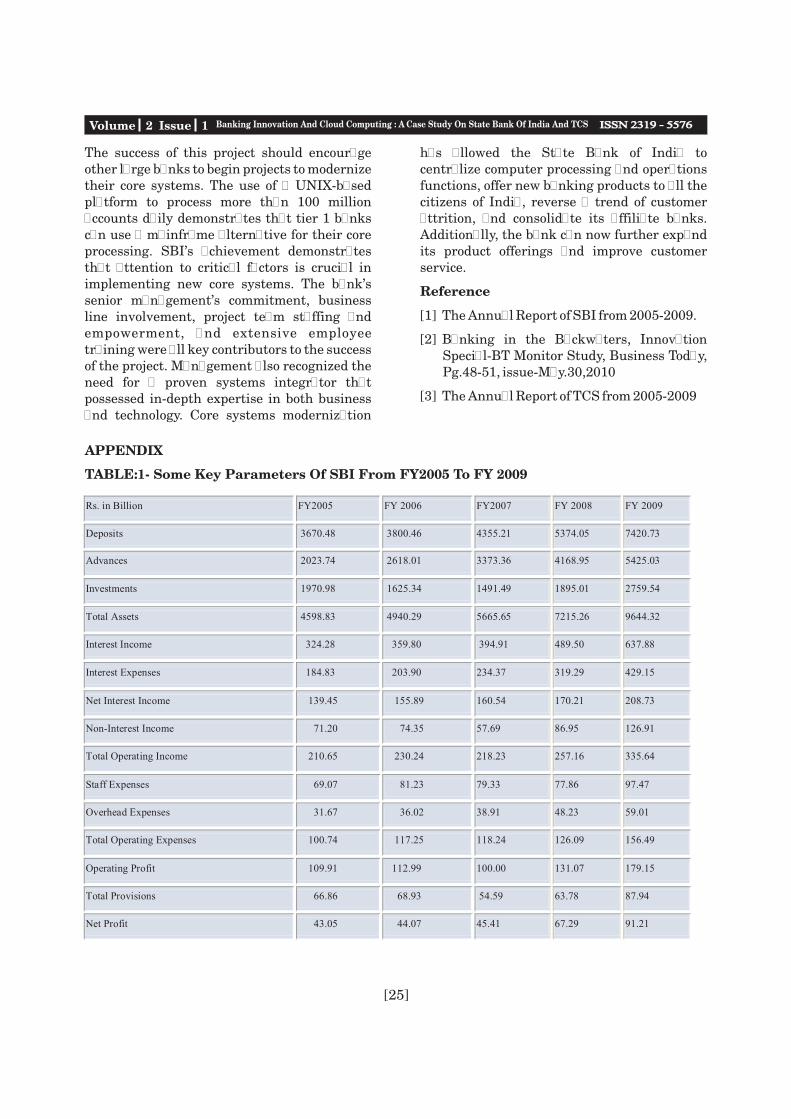
The market capitalization of SBI in 2005was 345.75 Rs. in bn. where as in 2009 it is677.13 Rs. in bn. The deposits in FY 2005 wasRs.3670.48 in bn. whereas in 2009 it Rs.7420.73
in bn. Net profit has increased from 43.05 bnrupees in 2005 to 91.21 bn rupees (see table-1,appendix). EPS was 81.79 Rs. in 2005 whereasin 2009 it was 143.77 Rs (see table-2, appendix).
3.1 Branches
The State Bank of India, including itsAssociate Banks, has 17,385 branches. Let's putthis into perspective: Bank of America has6 , 1 5 3 b r a n c h e s ; J P M o r g a n C h a s e(+Washington Mutual) has 5,126; Wells Fargo(+ Wachovia) has 6,741. All three of these too-big- to-fail American banks combined have atotal of 18,521 branches, just slightly more thanthe State Bank of India at 17,385 branches, asshown in Figure 1.
Figure : 1- A comparison of number of branches of SBI and other selected banks
Source: Annual reports
Bank of America has announced that it will be closing branches, while State Bank of India isadding them. It is likely that next year State Bank of India will have more branches than Bank ofAmerica, JPMorgan Chase, and Wells Fargo combined. It has slightly fewer branches than Sberbank,the massive Russian retail bank, and ICBC, the Industrial and Commercial Bank of China, as shown inFigure 2.
Figure : 2- Branches of different banks
Source: Annual reports
Volume 2 Issue 1 APOTHEOSIS : Tirpude's National Journal of Business Research (TNJBR)
[15]
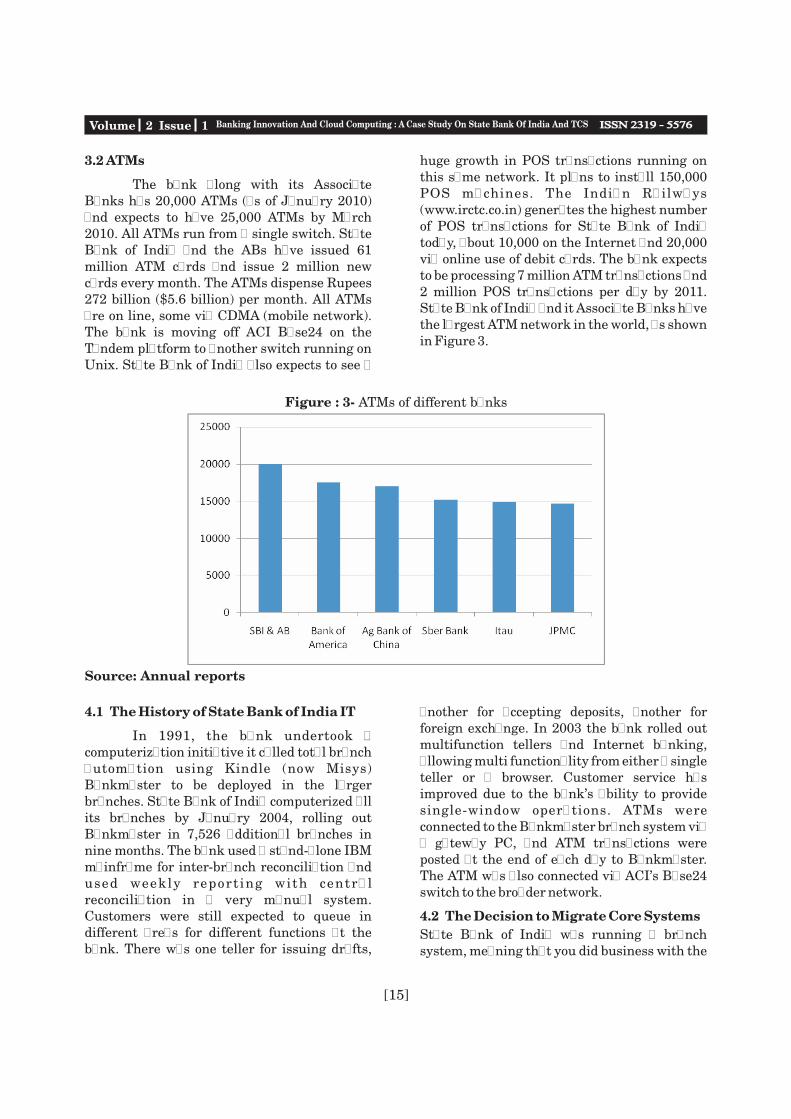
3.2 ATMs
The bank along with its AssociateBanks has 20,000 ATMs (as of January 2010)and expects to have 25,000 ATMs by March2010. All ATMs run from a single switch. StateBank of India and the ABs have issued 61million ATM cards and issue 2 million newcards every month. The ATMs dispense Rupees272 billion ($5.6 billion) per month. All ATMsare on line, some via CDMA (mobile network).The bank is moving off ACI Base24 on theTandem platform to another switch running onUnix. State Bank of India also expects to see a
huge growth in POS transactions running onthis same network. It plans to install 150,000POS machines. The Indian Railways(www.irctc.co.in) generates the highest numberof POS transactions for State Bank of Indiatoday, about 10,000 on the Internet and 20,000via online use of debit cards. The bank expectsto be processing 7 million ATM transactions and2 million POS transactions per day by 2011.State Bank of India and it Associate Banks havethe largest ATM network in the world, as shownin Figure 3.
Figure : 3- ATMs of different banks
Source: Annual reports
4.1 The History of State Bank of India IT
In 1991, the bank undertook acomputerization initiative it called total branchautomation using Kindle (now Misys)Bankmaster to be deployed in the largerbranches. State Bank of India computerized allits branches by January 2004, rolling outBankmaster in 7,526 additional branches innine months. The bank used a stand-alone IBMmainframe for inter-branch reconciliation andused weekly report ing with centralreconciliation in a very manual system.Customers were still expected to queue indifferent areas for different functions at thebank. There was one teller for issuing drafts,
another for accepting deposits, another forforeign exchange. In 2003 the bank rolled outmultifunction tellers and Internet banking,allowing multi functionality from either a singleteller or a browser. Customer service hasimproved due to the bank's ability to providesingle-window operations. ATMs wereconnected to the Bankmaster branch system viaa gateway PC, and ATM transactions wereposted at the end of each day to Bankmaster.The ATM was also connected via ACI's Base24switch to the broader network.
4.2 The Decision to Migrate Core Systems
State Bank of India was running a branchsystem, meaning that you did business with the
Volume 2 Issue 1 Banking Innovation And Cloud Computing : A Case Study On State Bank Of India And TCS
[16]
branch, not the bank. All records of accountactivity resided in the branch. The bank founditself at a competitive disadvantage withrespect to both the global banks (Citi, StandardChartered, HSBC) and the private (as opposedto publicly owned) banks such as ICICI Bankand HDFC Bank, which had a single centralizedcore banking system in India so that customerscould do business with any branch. Corporatecustomers were moving to other banks thatcould work with a single bank operating acrossthe country rather than multiple branches thatcouldn't offer real time consolidation ofpositions.
Because SBI was at a technologydisadvantage with the branch system, the bankwas losing deposit share due to new entrants tothe market. The Indian banking market isdynamic and competitive. The private bankswere rolling out new products on modernsystems, and State Bank of India had troublekeeping up with this innovation. On theBankmaster branch system, patches needed tobe shipped out to every branch and applied toevery branch server. This alone made it muchmore difficult to compete in the Indian market.
The big winners in past years have beenthe commercial (private) banks such as ICICIBank, HDFC Bank, Yes Bank, Axis Bank, andothers. Their share has grown from 8% ofdeposits in 1996 to 20% of deposits in 2008.Nationalized banks (excluding State Bank ofIndia) have been losing share steadily, from 56%of deposits down to 48% over the same timeperiod. State Bank of India and its Associatesdid not have the same fate. Share declined muchmore modestly, from 26% to 23% over this sametime period, and share actually grew from 2007to 2008 and increased further in 2009. Aftermigrating to TCS BaNCS, the State Bank ofIndia has recently turned the tide and seengrowing deposit market share in India, asshown in Figure. Note that while State Bank ofIndia now has 100% of its branches on acentralized core system, the nationalized bankshave been lagging with only 56% of theirbranches on centralized core banking as ofMarch 2008.
At SBI, Reconciliation was painful.Each branch would compile reports (on paper)and send them to a central point where theywould be keyed into a single system. Clerkswould match these reports against branchbatches on a weekly basis. When there werediscrepancies, clerks would send memos to thebranch, and the mismatched batch was mailedback to the central office for reconciliation.There was no network connectivity acrossbranches. There was a requirement that largepayments from the government be reconciled atthe end of the same day to settle with StateBank of India. Within the current system, thiswas impossible. Today the bank has bettercontrol of reconciliation due to a centralizedview of branch books for system suspenseaccounts, interbranch accounts, etc. The entireclearing process is now totally automated withminimal manual intervention.
A branch was almost a bank in itselfwhere the branch manager was responsible formany activities such as account opening,customer management, data management,management of funds, daily report generation,etc. Launching of products, services, andpolicies across all branches was handled at thebranch level. Since the whole system wasdecentralized, the bank had little control overbranch activities and their decisions, therebyfacing numerous governance issues.
Activities such as end of day (EOD),start of day (SOD), and report generation wererepeated across all the branches, resulting induplication of effort and a drain on resources.
4.3 The Selection of FNS BaNCS
As a government-owned entity, thebank had strict procurement procedures thathad to be transparent and could not be changedmid-stream. State Bank of India hired KPMG toprovide guidance on a future architecture for ITat State Bank of India and help with the RFPprocess. The bank also engaged the assistanceof Dr. D. B. Phatak of the Indian Institute ofTechnology (IIT) Bombay. The bank hadestablished criteria that said that any system tobe considered should be running somewhereelse and supporting at least 500 branches. At
Volume 2 Issue 1 APOTHEOSIS : Tirpude's National Journal of Business Research (TNJBR)

[17]
the time two Indian solutions, FLEXCUBE andFinacle, were unable to provide referencesrunning over 500 branches. They weretherefore eliminated from the process. At thetime Bank of America was running 1,800
branches on Systematics, and ANZ in Melbourne was running 750 branches onBANCS. The bank was looking at threedifferent possibilities, shown in Table 1.
Table 1: SBI Was Looking at Three Possibilities
Integrator Software Package Hardware Platform
TCS FNS BANCS IBM Mainframe
TCS FNS BANCS HP Superdome
IBM Alltel Systematics IBM Mainframe
Source: State Bank of India
The bank evaluated the solutions basedupon five criteria: architecture, softwareprocess engineering, scalability, field proofpoints, and functionality. FNS had a small andcreative engineering team, but processes werenot very strictly implemented. A testingmethodology was in place, but not fullyexecuted. Because TCS was taking over themaintenance of the code, this moved theevaluation from one of just FNS to one of FNSand TCS. Solution architecture was good, but itwasn't clear that either system could scale to10,000 branches. Neither vendor could provethis at the time. Alltel had 3,000 branchesversus 750 branches for FNS, but neither was at10,000. The greatest concerns were around end-of-day processing. Both systems met thefunctionality requirements of the bank. Neithersystem was especially easy to customize.
The process said that both solutionswere able to meet the needs of the bank. Thebank negotiated with both sets of vendors, butIBM and Alltel could not come close to the priceof solution provided by TCS, HP, and FNS. Theprocess was structured such that the lowestpriced solution among all sufficient solutionswas to be awarded the contract.
A few features of FNS BANCS which helped winthe deal were:
1. 24 x 7 availability providing continuouscustomer service.
2. Online real time Internet banking, ATM,
POS, RTGS, SWIFT, for multiple channeloperations.
3. Message-based interfaces.
4. Browser-based front end providing easymaneuverability for users and ease ofoperations.
5. Offline branch functionality for keytransactions (in case of network failure).
Parameterized product setup and cloning,allowing faster product launches.
4.4 Technology and Functionality
The State Bank of India decided to movefrom a branch system based on Kindle (nowMisys) Bankmaster to a centralized real timesystem, as shown in Table 2. Modernization andcentralization of infrastructure, database, andstorage also followed from this migration.
Volume 2 Issue 1 Banking Innovation And Cloud Computing : A Case Study On State Bank Of India And TCS

5] SECTION-4-: State Bank Of India CoreSystems Modernization
5.1 Drivers for a new core system
SBI had undertaken a massivecomputerization effort in the 1990s to automateall of its branches, implementing a highlycustomized version of Kindle Banking Systems'Bankmaster core banking system (now ownedby Misys). However, because of the bank'shistoric use of local processing and the lack ofreliable telecommunications in some areas, itdeployed a distributed system with operationslocated at each branch. Although thecomputerization improved the efficiency andaccuracy of the branches, the localimplementation restricted customers' use totheir local branches and inhibited theintroduction of new banking products andcentralization of operations functions. The localimplementation prevented the bank from easilygaining a single view of corporate accounts, andmanagement lacked readily availableinformation needed for decision making andstrategic planning.
The advantages in products and
efficiency of the private-sector banks becameincreasing evident in the late 1990s as SBI (andIndia's other public-sector banks) lost existingcustomers and could not attract the rapidlygrowing middle market in India. In fact, thistechnology-savvy market segment viewed thepublic-sector banks as technology laggards thatcould not meet their banking needs. As a result,the Indian government sought to have thepublic-sector banks modernize their corebanking systems. In response to the competitivethreats and entreaties from the government,SBI engaged KPMG Peat Marwick (KPMG) in2000 to develop a technology strategy and amodernization road map for the bank.
In 2002, bank management approvedthe KPMG-recommended strategy for a new ITenvironment that included the implementationof a new centralized core banking system. Thiseffort would encompass the largest 3,300branches of the bank that were located in cityand suburban areas. The State Bank of India'sobjectives for its project to modernize coresystems included:
* The delivery of new product
[18]
Table-2: From Old to New
OLD NEW
Software Kindle Bankmaster FNS BANCS (now TCS BáNCS)
Programming
Language
Assembly, COBOL COBOL, .NET on front end
OS Novell Netware HP UX
Database Btrieve Oracle 9i
Processor One per branch, varies by branch
size: Pentium 3
HP Superdome: 2 application servers;
2 database servers, PA RISC
Storage Local server with 2GB, periodically
archived
HP XP24K SAN, 320 TB
Source: State Bank of India
The State Bank of India has some unique connectivity challenges to link the 17,385 branches. Theyachieve this with over 20,000 leased lines and a VSAT (very small aperture terminal) satellite networkwith 6,000 connections. This VSAT system consisted of a small dish of 1.2 meters in diameter thatdelivers up to 64 kbps connectivity from the branches to the data centers.
Volume 2 Issue 1 APOTHEOSIS : Tirpude's National Journal of Business Research (TNJBR)
[19]
capabilities to all customers, including those inrural areas
* The unification of processes across the bankto realize operational efficiencies andimprove customer service
* Provision of a single customer view of allaccounts
* The ability to merge the affiliate banks intoSBI
* Support for all SBI existing products
* Reduced customer wait times in branches
* Reversal of the customer attrition trend
5.2 Challenges for the bank
The bank faced several extraordinarychallenges in implementing a centralized coreprocessing system. These challenges includedfinding a new core system that could processapproximately 75 million accounts daily anumber greater than any bank in the world wasprocessing on a centralized basis. Moreover, thebank lacked experience in implementingcentralized systems, and its large employeebase took great pride in executing complextransactions on local in-branch systems. Thispractice led some people to doubt that theemployees would effectively use the newsystem.
Another challenge was meeting SBI'sunique product requirements that wouldrequire the bank to make extensivemodifications to a new core banking system.The products include gold deposits (by weight),savings accounts with overdraft privileges, andan extraordinary number of passbook savingsaccounts.
5.3 Vendor Consortium Selection
TCS had the prime relationship withthe bank. While originally TCS was the systemintegrator, it had the source code to FNSBANCS and committed to maintain this code.The company later acquired FNS and with it theentire BANCS code base. The TCS project teamresides at State Bank of India. Millions of linesof code have been added to the base code at State
Bank of India. Because the code base ismaintained by TCS, which also owns theproduct, TCS is migrating the vast majority ofState Bank of India customizations into themain TCS BaNCS code base, thus saving thebank the cost of continuing to support thecustomizations while improving thefunctionality of the TCS product. In anycomplex environment, there can be challengest o c u s t o m i z a t i o n , w i t h u n i n t e n d e dconsequences. TCS undertakes full systemtesting for every customization while StateBank of India does the regression testing anduser acceptance testing (UAT) to guard againstthis possibility. State Bank of India keeps a testregion with a separate database for UAT.Regression testing sits in yet another region.
Ta t a C o n s u l t a n c y S e r v i c e s ,headquartered in Mumbai, India, is one of theworld's largest technology companies withparticular expertise in systems integration andbusiness process outsourcing. The company hasmore than 130,000 employees located in 42countries and achieved revenues of $5.7 billionin fiscal 2008. Although TCS has long been aleader in core systems integration services forbanks, after it purchased FNS in 2005, thecompany also became a leading global providerof core banking software for large banks. TheBaNCS system is based on service-orientedarchitecture (SOA) and is platform anddatabase independent. In addition to SBI, TCSBaNCS clients include the Bank of China(installation in process), China Trust, BankNegara Indonesia, India's Bank Maharashtra ,National Commercial Bank (Saudi Arabia), andKoram Bank (Korea). TCS has also expandedits US footprint with the opening of its largestresource delivery center in North America (nearCincinnati, Ohio) that can house 20,000personnel. The company is seeking to licenseand implement the BaNCS system in NorthAmerica and recently completed a major part ofan effort to ensure that the BaNCS systemmeets US regulatory and compliancerequirements.
5 . 4 I n i t i a l S B I C o r e S y s t e m sModernization Project
Volume 2 Issue 1 Banking Innovation And Cloud Computing : A Case Study On State Bank Of India And TCS
[20]
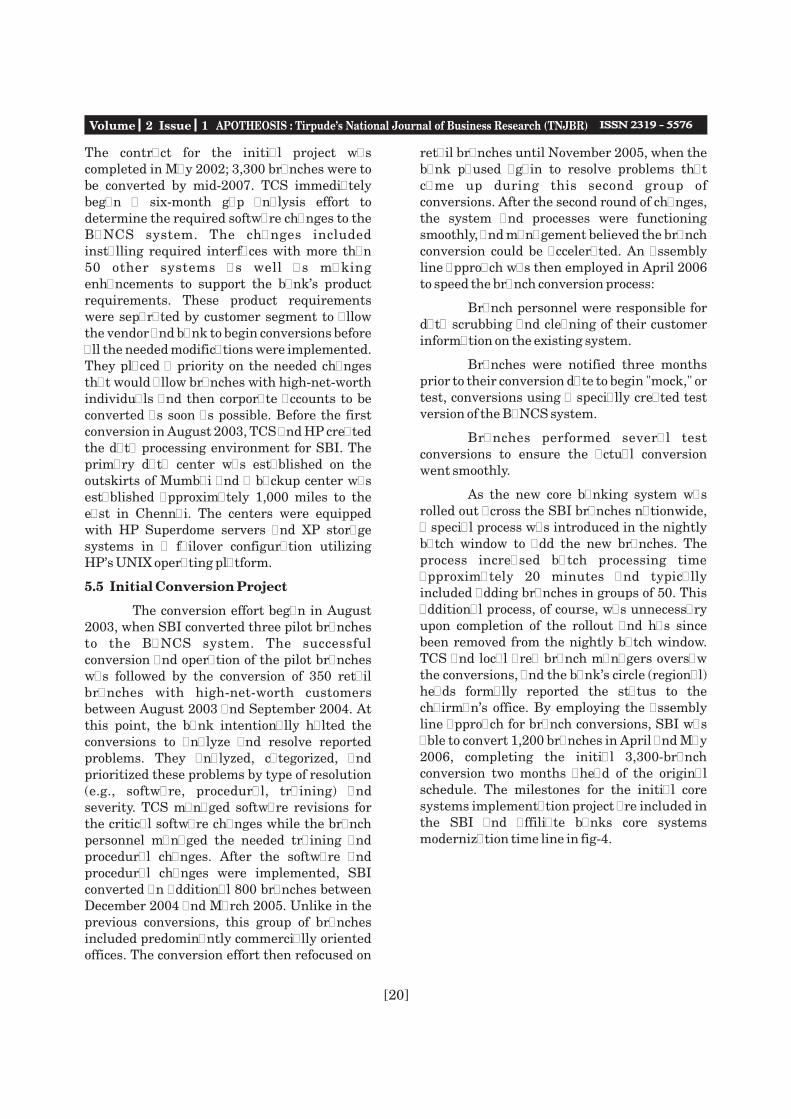
The contract for the initial project wascompleted in May 2002; 3,300 branches were tobe converted by mid-2007. TCS immediatelybegan a six-month gap analysis effort todetermine the required software changes to theBaNCS system. The changes includedinstalling required interfaces with more than50 other systems as well as makingenhancements to support the bank's productrequirements. These product requirementswere separated by customer segment to allowthe vendor and bank to begin conversions beforeall the needed modifications were implemented.They placed a priority on the needed changesthat would allow branches with high-net-worthindividuals and then corporate accounts to beconverted as soon as possible. Before the firstconversion in August 2003, TCS and HP createdthe data processing environment for SBI. Theprimary data center was established on theoutskirts of Mumbai and a backup center wasestablished approximately 1,000 miles to theeast in Chennai. The centers were equippedwith HP Superdome servers and XP storagesystems in a failover configuration utilizingHP's UNIX operating platform.
5.5 Initial Conversion Project
The conversion effort began in August2003, when SBI converted three pilot branchesto the BaNCS system. The successfulconversion and operation of the pilot brancheswas followed by the conversion of 350 retailbranches with high-net-worth customersbetween August 2003 and September 2004. Atthis point, the bank intentionally halted theconversions to analyze and resolve reportedproblems. They analyzed, categorized, andprioritized these problems by type of resolution(e.g., software, procedural, training) andseverity. TCS managed software revisions forthe critical software changes while the branchpersonnel managed the needed training andprocedural changes. After the software andprocedural changes were implemented, SBIconverted an additional 800 branches betweenDecember 2004 and March 2005. Unlike in theprevious conversions, this group of branchesincluded predominantly commercially orientedoffices. The conversion effort then refocused on
retail branches until November 2005, when thebank paused again to resolve problems thatcame up during this second group ofconversions. After the second round of changes,the system and processes were functioningsmoothly, and management believed the branchconversion could be accelerated. An assemblyline approach was then employed in April 2006to speed the branch conversion process:
Branch personnel were responsible fordata scrubbing and cleaning of their customerinformation on the existing system.
Branches were notified three monthsprior to their conversion date to begin "mock," ortest, conversions using a specially created testversion of the BaNCS system.
Branches performed several testconversions to ensure the actual conversionwent smoothly.
As the new core banking system wasrolled out across the SBI branches nationwide,a special process was introduced in the nightlybatch window to add the new branches. Theprocess increased batch processing timeapproximately 20 minutes and typicallyincluded adding branches in groups of 50. Thisadditional process, of course, was unnecessaryupon completion of the rollout and has sincebeen removed from the nightly batch window.TCS and local area branch managers oversawthe conversions, and the bank's circle (regional)heads formally reported the status to thechairman's office. By employing the assemblyline approach for branch conversions, SBI wasable to convert 1,200 branches in April and May2006, completing the initial 3,300-branchconversion two months ahead of the originalschedule. The milestones for the initial coresystems implementation project are included inthe SBI and affiliate banks core systemsmodernization time line in fig-4.
Volume 2 Issue 1 APOTHEOSIS : Tirpude's National Journal of Business Research (TNJBR)

[21]
Figure : 4- The journey of core systems modernization in SBI
5.6 Affiliate Banks' Conversion
As the rollout plans for State Bank ofIndia were being finalized, the bank decided toextend the scope of the core bankingimplementation to include its (then) eightaffiliate banks. TCS created a separateprocessing environment within the Mumbaidata center used to support SBI. The conversioneffort for each of the affiliate banks spanned 18to 24 months; the first six months were used forplanning, training, and establishing theprocessing environment for the banks. Thebranch conversions overlapped among thebanks, allowing all the affiliate banks to beconverted in 30 months. The project was begunin July 2003 for the State Bank of Patiala and in2004 for the other affiliate banks. All theaffiliate bank branches were converted to theBaNCS system by the end of 2005, as reflectedin Exhibit 2.
5.7 State Bank of India Full BranchConversion
The success of the initial 3,300-branchconversion for SBI demonstrated that:
TCS had the technical capabilities tosupport the bank's IT initiative and scale ofoperations. Bank personnel had the skills toadopt new processes and support theconversions.
The Indian customer base would react to new
technology by adopting new electronic servicesand demanding new, more sophisticatedbanking products.
An assembly line approach could beused effectively to support large-scale branchconversions.
Given the success of the initial projectand SBI's desire to offer new products to all itscustomers, a new IT plan was created thatwould encompass all branches. TCS and thebank would have to demonstrate the capabilityto process 100 million accounts in a singleprocessing environment. TCS and HP thenconducted another scalability test in September2006 to determine if the system could processSBI's entire base of 100 million accounts(excluding the affiliate banks, which use aseparate processing environment) withsustained peak online throughput of 1,500transactions per second. They conducted thetest at HP Labs in Cupertino, California, usingtwo 32-CPU HP 9000 Superdome applicationservers and two 32-processor Itanium Core HPIntegrity servers for the database. The testachieved a sustained peak real-timetransaction rate of more than 1,575transactions per second, meeting the projectedprocessing demands of SBI. Additionally, batchtests were run for both deposits and loanaccount processing. The month-end batchprocess for loans required 1 hour and 5 minutes,
Volume 2 Issue 1 Banking Innovation And Cloud Computing : A Case Study On State Bank Of India And TCS

[22]
and deposit processing was completed in 2hours and 27 minutes.
Based on the successful scalability test,SBI decided to convert the approximately 6,700remaining SBI branches to the BaNCS system.The conversion of the remaining branchesbegan in June 2006, with the stated goal ofcompleting the conversion by year-end 2008.Utilizing the assembly line conversionapproach established in the initial phase, thebank converted 1,400 of these branches byMarch 2007. Because the conversionmethodology and BaNCS system werethoroughly proven and stable, the assembly lineconversion approach allowed the bank tocomplete the conversion ahead of schedule.Between April 2007 and March 2008 (the bank'sfiscal year end), SBI converted 4,600 branchesto the new system. The remaining brancheswere converted between April and July 2008.
6] SECTION-5 Core Banking And BenifitTo SBI
6.1 Critical Success Factors
L a r g e - s c a l e c o r e s y s t e m simplementations are typically the most costlyand risky IT projects undertaken by banks.Failures of core systems projects are notuncommon at large banks and result in bothf inanc ia l impact and lost bus inessopportunities. Further, failed projects leadother banks to delay needed core systemsreplacements because they measure the risk offailure against the potential benefits of a newsystem. Several critical factors contributed tothe success of the SBI core implementationeffort:
6.1.1 Senior management commitment. Theproject was driven by the chairman of SBI, whomet every month with the informationtechnology (IT) and the business sector heads.The chairman monitored the overall status andensured that sufficient resources were allocatedto the project. TCS senior managers werethoroughly committed to the project as well andperiodically met with the SBI chairman toreview the project status.
6.1.2 Staffing and empowerment of project
team. The core banking team consisted of thebank's managing director of IT acting as teamhead and 75 business and IT people selected bythe bank. TCS also staffed the project withapproximately 300 IT professionals trained onthe BaNCS system. Importantly, the SBIbusiness people were viewed not just ascontributors to a key project but as future bankleaders. This team reported to the SBIchairman and was empowered with all decision-making authority.
6.1.3 Ownership by business heads. Theregional business line heads were responsiblefor the success of conversion of their respectivebranches and reported the status to thechairman. Thus, the business heads' objectiveswere aligned with those of the project team.
6.1.4 Focus on training. SBI used its network of58 training centers across India to trainemployees on the new system. TCS personnelfirst educated approximately 100 SBIprofessional trainers, who then trained 100,000SBI employees at the centers; the remainingemployees trained at their respective job sites.
6.2 Benefits of New Core SystemsImplementation
The new core system has resulted inbenefits throughout the bank for both thecustomers and the employees of SBI. Forexample, the new core banking system hasallowed the bank to redesign processes. Itestablished 400 regional processing centers forall metro and urban branches that haveassumed functions previously performed in theindividual branches. The bank recentlyreported that business per employee increasedby 250% over the last five years. The bank hasachieved its goal of offering its full range ofproducts and services to its rural branches. Itdelivers economic growth to the rural areas andoffers financial inclusion for all of India'scitizens. Implementation of the TCS BaNCSsystem has provided the bank with the ability toconsolidate the affiliate banks into SBI. In fact,the bank recently completed the consolidationof State Bank of Saurashtra into SBI. The bankhas reversed the trend of customer attrition andis now gaining new market share. Completion of
Volume 2 Issue 1 APOTHEOSIS : Tirpude's National Journal of Business Research (TNJBR)

[23]
the core conversion project has also allowed thebank to undertake several new initiatives tofurther improve service and support futuregrowth. These initiatives include thedeployment of more than 3,000 rural sales staff,redesign of over 2,200 branches in the last fiscalyear, opening of more than 1,000 new branches,establishment of a call center, and an activeplan to migrate customers to electronic deliverychannels. The improvement in productivity andgrowth of business for the SBI Group isreflected in Exhibit 4.
7] SECTION-6: Cloud Computing - TCS
Tata Research Development andDesign Centre, also known as Tata InnovationLabs, a subsidiary of Tata Consultancy Services(TCS), innovation entails meeting a criticalneed. It sometimes also means adapting aproject for a totally different market than it wasoriginally blueprinted for. For instance, how toadapt TCS, core banking solution and bankingsoftware, branded BaNCS, with customersacross 80 countries, and take this solutiondirectly to millions of unbanked Indiansupcountry. To take on the particularly hairyproblem of rural banking, TCS used its robustinnovation infrastructure-a combination ofinternal resources and strategic partnersincluding Tata Group companies and otherentities like emerging technology companies,academic institutions and others. It also lookedcarefully at the needs of the end users andleveraged those insights to design newsolutions.
For banks, reaching rural Indiathrough the traditional branch banking modelisn't viable because of the low value oftransaction per customer and a dispersedpopulation. There is little experience inmanaging remote information technology (IT)infrastructure and guaranteeing security andservices. From a consumer perspective, the timespent in banking transactions set off againstthe opportunity cost of lost employment posedchallenges, to adoption of banking services inrural areas, as also did the habit of storingmoney at home (typically stuffed into pillowcovers or under mattresses).
Still, banks could ill-afford to ignorerural India as it increasingly became a hub ofeconomic activity. Mobile phone and TVpenetration is high and rising, has made anumber of people "connected" and represented amajor opportunity for TCS. But that's only if theIT services major was able to deliver a productor service that is designed specifically for ruralbanking needs within the cost parameters thatwould make business and social sense.
The solution: Branchless bankingusing cloud computing to take banking servicesto the unbanked. (Cloud computing refers toInternet-based computing where delivery ofservices is from servers, storage and otherresources served from the Web rather thanonpremise assets.) TCS' financial solutionsbusiness unit had pioneered bankingautomation and branchless banking in India.State Bank of India was its biggest successstory. The company had an understanding ofthe challenges and needs of Regional RuralBanks and cooperative banks. TCS recognisedthat the branchless banking solution could notjust be technologydriven, but ecosystem-driven,by which the products and services offered aremeaningful and addresses the needs andconcerns of the customer segment. For example,how does one enable repayments on a microloan whenever the consumer wants it ratherthan only when an agent of the bank visits?
TCS leveraged cloud computing to takeon the challenge. Today, it has 60-70 rural banksusing its offerings connecting more than a 1,000branches. Typically, a bank would be able toconnect 20-30 branches in a 200-mile radius.Shared resources, software and informationwere provided to computers and other deviceson demand. A banks operational data could betransferred to a cloud (a server that customersand branches can connect to through the net),enabling banks to offer basic banking facilitieson mobile, lnternet enabled computers andother devices. Ease of configuration andelimination of regular maintenance helpedgreatly reduce the IT overheads required to getonto the platform. Granular or pay-per-usepricing models enabled the banks to managethe capital expenditure to operating
Volume 2 Issue 1 Banking Innovation And Cloud Computing : A Case Study On State Bank Of India And TCS

expenditure ratio of IT investments. Banks areable to integrate with this platform rapidly(within 2-3 weeks), thereby effectivelyovercoming their primary barrier toadoptiontheir limited exposure to technology.
The branchless solution has a smartcard or a debit card given to the account holder,containing his personal information, and abiometric handheld device operated by thebank's agents. The handheld device is smallenough to carry around and has the memoryand battery power to capture a full day's work.This would enable electronic financialtransactions as well as full integration andseamless experience of using the mobile phone
as a device for business transactions. TCSInnovation Labs is also testing banking via atelevision set-top box so that TV users (andpenetration of TVs is significantly higher thanof computers in rural India) will get theexperience of Internet banking without accessto computers, but with the help of a morefamiliar user interface that doesn't requireInternet fluency.
Banking 3.0: Organizational Drivers for Cloud Computing- Financial Institutions
The drivers for the banking sector toadopt cloud computing are represented in thefig:5.
Figure : 5- Drivers of cloud computing in a bank.
8] SECTION-7: Concluding Remarks
Moving to a centralized modern coresystem was a competitive requirement for theState Bank of India. As they saw from theirnationalized brethren, those who did not do sowould lose share to the privately held andforeign banks. Moving to a Unix solution wasnot an obvious solution given the size of thebank, but the boldness of State Bank of Indiacreated a considerable cost advantage over the
mainframe solution that State Bank of Indiacontinues to enjoy. Banks looking to reduce ITcosts should consider moving to an open systemthat can provide the reliability, scalability, andavailability that the largest banks in the worldrequire.
The implementation of the TataConsultancy Services (TCS) BaNCS system atthe State Bank of India (SBI) represents thelargest core systems project ever undertaken.
Volume 2 Issue 1 APOTHEOSIS : Tirpude's National Journal of Business Research (TNJBR)
[24]
[25]
The success of this project should encourageother large banks to begin projects to modernizetheir core systems. The use of a UNIX-basedplatform to process more than 100 millionaccounts daily demonstrates that tier 1 bankscan use a mainframe alternative for their coreprocessing. SBI's achievement demonstratesthat attention to critical factors is crucial inimplementing new core systems. The bank'ssenior management's commitment, businessline involvement, project team staffing andempowerment, and extensive employeetraining were all key contributors to the successof the project. Management also recognized theneed for a proven systems integrator thatpossessed in-depth expertise in both businessand technology. Core systems modernization
has allowed the State Bank of India tocentralize computer processing and operationsfunctions, offer new banking products to all thecitizens of India, reverse a trend of customerattrition, and consolidate its affiliate banks.Additionally, the bank can now further expandits product offerings and improve customerservice.
Reference
[1] The Annual Report of SBI from 2005-2009.
[2] Banking in the Backwaters, InnovationSpecial-BT Monitor Study, Business Today,Pg.48-51, issue-May.30,2010
[3] The Annual Report of TCS from 2005-2009
APPENDIX
TABLE:1- Some Key Parameters Of SBI From FY2005 To FY 2009
Rs. in Billion FY2005 FY 2006 FY2007 FY 2008 FY 2009
Deposits 3670.48 3800.46 4355.21 5374.05 7420.73
Advances 2023.74 2618.01 3373.36 4168.95 5425.03
Investments 1970.98 1625.34 1491.49 1895.01 2759.54
Total Assets 4598.83 4940.29 5665.65 7215.26 9644.32
Interest Income 324.28 359.80 394.91 489.50 637.88
Interest Expenses 184.83 203.90 234.37 319.29 429.15
Net Interest Income 139.45 155.89 160.54 170.21 208.73
Non-Interest Income 71.20 74.35 57.69 86.95 126.91
Total Operating Income 210.65 230.24 218.23 257.16 335.64
Staff Expenses 69.07 81.23 79.33 77.86 97.47
Overhead Expenses 31.67 36.02 38.91 48.23 59.01
Total Operating Expenses 100.74 117.25 118.24 126.09 156.49
Operating Profit 109.91 112.99 100.00 131.07 179.15
Total Provisions 66.86 68.93 54.59 63.78 87.94
Net Profit 43.05 44.07 45.41 67.29 91.21
Volume 2 Issue 1 Banking Innovation And Cloud Computing : A Case Study On State Bank Of India And TCS
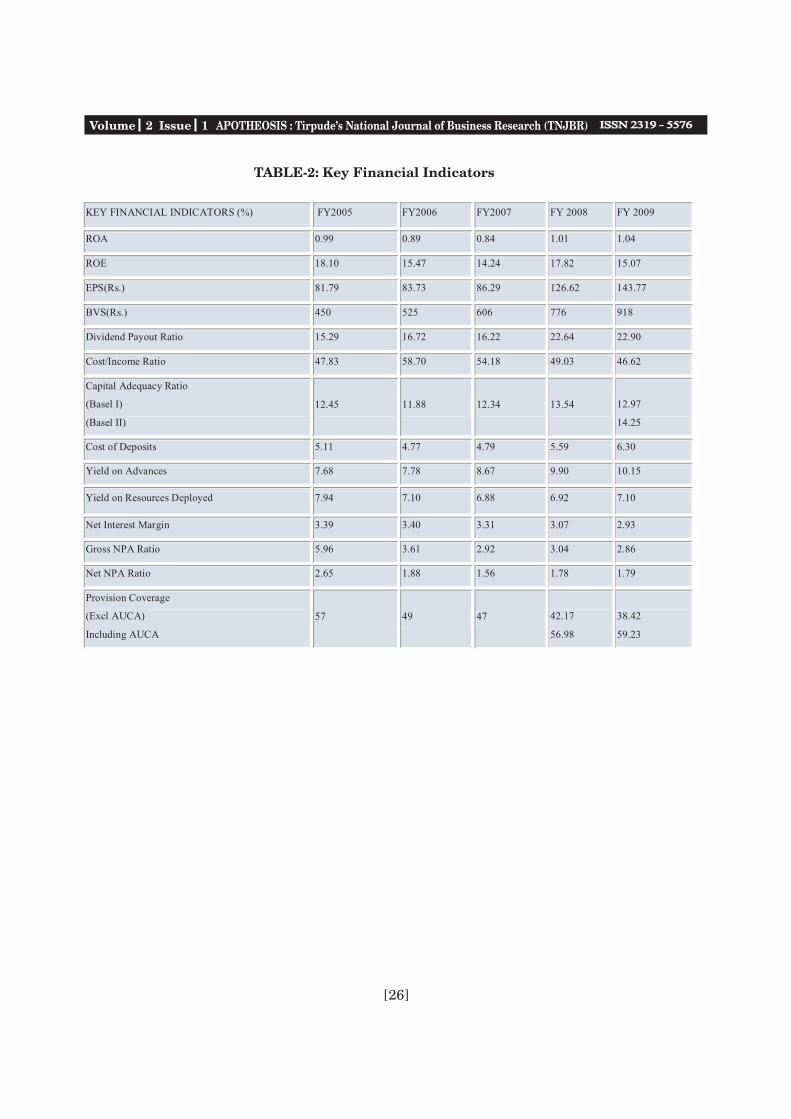
TABLE-2: Key Financial Indicators
KEY FINANCIAL INDICATORS (%) FY2005 FY2006 FY2007 FY 2008 FY 2009
ROA 0.99 0.89 0.84 1.01 1.04
ROE 18.10 15.47 14.24 17.82 15.07
EPS(Rs.) 81.79 83.73 86.29 126.62 143.77
BVS(Rs.) 450 525 606 776 918
Dividend Payout Ratio 15.29 16.72 16.22 22.64 22.90
Cost/Income Ratio 47.83 58.70 54.18 49.03 46.62
Capital Adequacy Ratio
(Basel I)
(Basel II)
12.45 11.88 12.34 13.54 12.97
14.25
Cost of Deposits 5.11 4.77 4.79 5.59 6.30
Yield on Advances 7.68 7.78 8.67 9.90 10.15
Yield on Resources Deployed 7.94 7.10 6.88 6.92 7.10
Net Interest Margin 3.39 3.40 3.31 3.07 2.93
Gross NPA Ratio 5.96 3.61 2.92 3.04 2.86
Net NPA Ratio 2.65 1.88 1.56 1.78 1.79
Provision Coverage
(Excl AUCA)
Including AUCA
57 49 47 42.17
56.98
38.42
59.23
Volume 2 Issue 1 APOTHEOSIS : Tirpude's National Journal of Business Research (TNJBR)
[26]
Professor (Dr.) Parimal H. Vyas*
Abstract : The Patient Safety is one of the global issues that have affected both developed anddeveloping countries and is a new healthcare concerning prevention of medical error that often leadsto adverse healthcare events. It was not familiar till 1990s, when various countries began to report onstaggering numbers of patients who were either harmed and or killed mainly due to medical errors.According to the World Health Organization [WHO] patient safety is an endemic concern recognizingits impact of 1 in every 10 patients around the world. The science of patient safety has grown and isconstantly seeking to identify how and why things go wrong in patients care and what one can learnfrom other industries and from other disciplines such as psychology to make healthcare safer. Theemphasis has moved away from blame towards looking at how modern healthcare is delivered incomplex, busy hospitals and clinics and recognizing that sometimes the systems themselves createproblems. Each year the treatment and care of hundreds of millions of patients worldwide iscomplicated by infections acquired during healthcare. The impact of healthcare-associated infectionmay imply prolonged stays in hospital, long-term disability, massive additional financial burden,and deaths. This paper offers a brief factual review of healthcare sector of India supported with somereal live illustrations relating to Patients' Safety. An attempt has been made to raise diverse relevantas well as prevalent issues, and emerging challenges concerning the healthcare sector of India.
[27]
* Department of Commerce Including Business Administration, Faculty of Commerce The M.S.University of Baroda
Volume 2 Issue 1 “Patients' Safety : Emerging Concerns & Defies"
Keywords : Patient Safety, Patients' Satisfaction, Healthcare Error, Health Care
Prologue:
Health is a state of complete physical,mental and social well-being and not merely theabsence of disease or infirmity (www.who.int),and healthcare is the prevention, treatment,and management of illness and thepreservation of mental and physical well-beingthrough the services offered by the medical anda l l i e d h e a l t h p r o f e s s i o n s(www.thefreedictionary.com). Patients'satisfaction is the degree to which the patientregards the health care service or product or themanner in which it is delivered by the medicalservice provider as useful, effective, orbeneficial to patient (www.biology-online.org).
It has been found that the modernhealthcare facilities continues to achieveexcellent results in improving health conditionsof people worldwide, but, one can still comeacross the events that show that the patientsare put at risk either through errors ofhealthcare service providers through failure toassess patients' needs properly, or manage theircare and recognize deterioration in the patients'h e a l t h c o n d i t i o n s
(http://www.healthfirsteurope.org). HealthCare Error is a preventable adverse effect ofcare, whether or not it is evident or harmful tothe patient that occurs due to complex and diverse Health Care System in form of structure that is nursing units, pharmacies,emergency departments, operating rooms, andprofessional mix that is nurses, physicians,pharmacists, administrators, therapists madeup of multiple interconnected elements withadaptive tendencies having the capacity to change and l earn f r om exper i ence(http://www.en.wikipedia.org).
Such healthcare errors are responsiblefor the emerging issues related with PatientSafety. Patient Safety is the mechanism thatprevents or mitigates patients' harm stemmingfrom complex and diverse healthcare processesthat are compromised due to medical errorsviz., an improper and wrong medication;improper medical treatment; incorrect &delayed test results; and avoidance ofh e a l t h c a r e - r e l a t e d i n f e c t i o n s(http://www.healthfirsteurope.org).
It is a global issue affecting developed
“Patients' Safety : Emerging Concerns & Defies"

Volume 2 Issue 1 “Patients' Safety : Emerging Concerns & Defies"
[28]
Volume 2 Issue 1 APOTHEOSIS : Tirpude's National Journal of Business Research (TNJBR)
and developing countries and the healthcareerrors are more prevalent in countries havingweak healthcare systems. The major causes ofinsufficient patient safety are lack of training ofhealthcare workers; time constraints onhealthcare workers; and insufficient reportingand learning systems to prevent errors in thefuture. To illustrate, the World HealthOrganization [WHO] globally launched theworld alliance for patient safety to tacklehealthcare-associated infections regardless ofthe level of development of healthcare systemsand the availability of resources as well as to co-ordinate and accelerate improvements inp a t i e n t s a f e t y i n O c t o b e r 2 0 0 4(http://linkinghub.elsevier.com).
2] Objectives of the Paper on Patients'Safety
The research study was based onsecondary data sources and undertaken mainlykeeping in mind following major objectives.
1) To critically review (in brief) and appraisethe status of the healthcare sector of India;
2) To raise varied, pertinent as well asprevalent issues, and emerging challengesconcerning to the healthcare sector of Indiaand critically review the available literatureon Patients' Safety along with real lifeillustrations, and
3) To make an attempt to put forward fewprinciples related to Patient Safety forproviding Quality in Health Care Services.
3] Rationale & Methodology of the Paperon Patients' Safety
Based on Research Reports (publishedby Government of India, World Healthorganizat ion and report on Humandevelopment in South Asia); BusinessMagazines; Research Journals and various websites, an attempt has been made in thisconceptual paper to critically appraise onemerging issues and challenges concerningpatient safety to showcase that patients havebeen suffering mainly due to laxity ofhealthcare service providers. This paper offers acomprehensive but critical appraisal on the
healthcare sector of India with a specific andclear thought on 'Patient Safety' based on significant review of literature. It includes abroad-minded approach with a heavy emphasison multy-party deliberations, consultative andcollaborative discussion for avoidance andminimization of magnitude of medical errorsand strengthening of initiatives for the patientsafety.
4] A Concise Appraisal of the Health Sectorof India An attempt to put forward a cursory overviewon the health care sector of India is being madein this part on basis of available factual dataconcerning Health Care Indicators of India,Infrastructure for health, and Expenditureincurred for the Health Care Sector although incase of certain selected health indicators, Indiahas improved substantially during 1951 to2001. To illustrate, life expectancy had reachedto 64 years; the Infant Mortality Rate (IMR) hasfallen to 63 per 1,000 Population; Crude BirthRate has declined to 25 whereas Crude DeathRate has fallen to 8.1 (J. Kishore, 2006).
As per the Report “Macro-Economics & Health, 2005” of the National Commission,longevity in India had reached to 66 in the year2004 whereas IMR has declined by over 70 percent in the year 1990. A significantimprovement in the Quality of Health Care overthe years becomes evident as shown in Table I.It shows improvement in Crude Birth Rate andDeath Rate; Total Fertility Rate (Per Woman);reduction in IMR; Mortality Rate; LifeExpectancy at Birth for Males and Females hadincreased (The Economic Survey, 2006-2007,2007 2008 & 2008-2009).
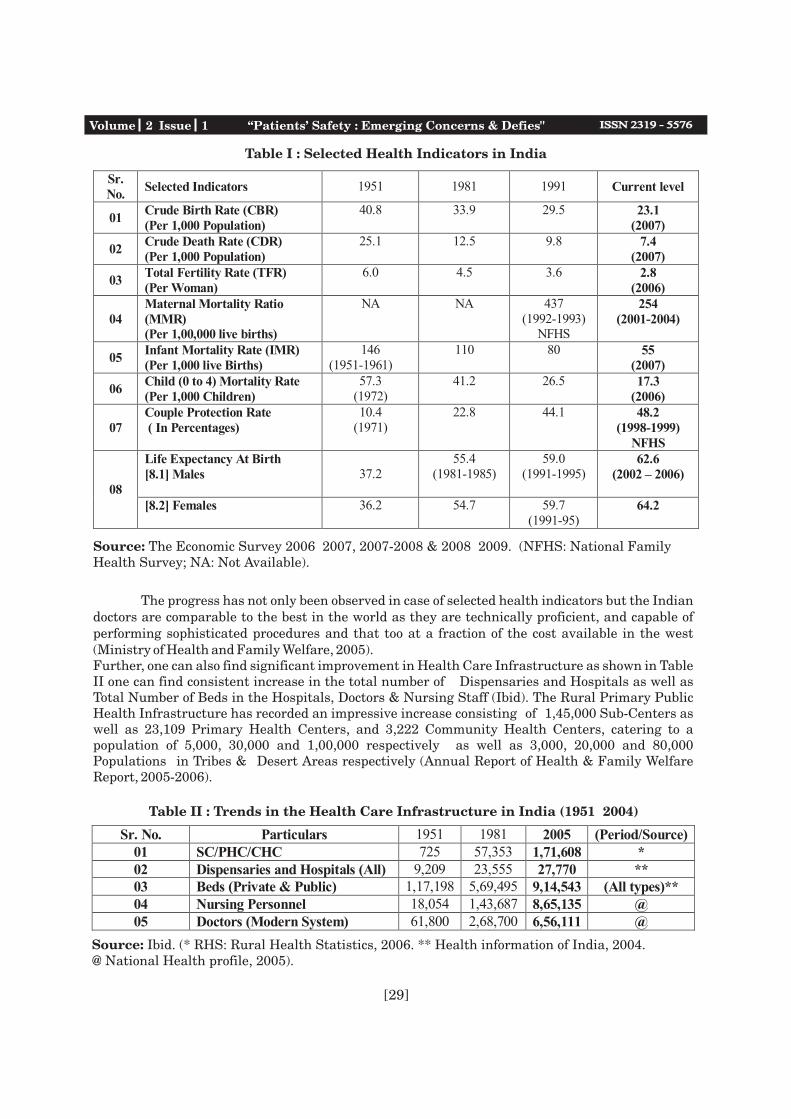
[29]
Table I : Selected Health Indicators in India
Sr. No.
Selected Indicators 1951 1981 1991 Current level
01 Crude Birth Rate (CBR) (Per 1,000 Population)
40.8 33.9 29.5 23.1 (2007)
02 Crude Death Rate (CDR) (Per 1,000 Population)
25.1 12.5 9.8 7.4 (2007)
03 Total Fertility Rate (TFR) (Per Woman)
6.0 4.5 3.6 2.8 (2006)
04 Maternal Mortality Ratio(MMR) (Per 1,00,000 live births)
NA NA 437(1992-1993)
NFHS
254 (2001-2004)
05 Infant Mortality Rate (IMR) (Per 1,000 live Births)
146(1951-1961)
110 80 55 (2007)
06 Child (0 to 4) Mortality Rate (Per 1,000 Children)
57.3(1972)
41.2 26.5 17.3 (2006)
07 Couple Protection Rate ( In Percentages)
10.4(1971)
22.8 44.1 48.2(1998-1999)
NFHS Life Expectancy At Birth [8.1] Males 37.2
55.4(1981-1985)
59.0(1991-1995)
62.6(2002 – 2006)
08 [8.2] Females 36.2 54.7 59.7
(1991-95) 64.2
Source: The Economic Survey 2006 2007, 2007-2008 & 2008 2009. (NFHS: National FamilyHealth Survey; NA: Not Available).
The progress has not only been observed in case of selected health indicators but the Indiandoctors are comparable to the best in the world as they are technically proficient, and capable ofperforming sophisticated procedures and that too at a fraction of the cost available in the west(Ministry of Health and Family Welfare, 2005). Further, one can also find significant improvement in Health Care Infrastructure as shown in TableII one can find consistent increase in the total number of Dispensaries and Hospitals as well asTotal Number of Beds in the Hospitals, Doctors & Nursing Staff (Ibid). The Rural Primary PublicHealth Infrastructure has recorded an impressive increase consisting of 1,45,000 Sub-Centers aswell as 23,109 Primary Health Centers, and 3,222 Community Health Centers, catering to apopulation of 5,000, 30,000 and 1,00,000 respectively as well as 3,000, 20,000 and 80,000Populations in Tribes & Desert Areas respectively (Annual Report of Health & Family WelfareReport, 2005-2006).
Table II : Trends in the Health Care Infrastructure in India (1951 2004)
Sr. No. Particulars 1951 1981 2005 (Period/Source)01 SC/PHC/CHC 725 57,353 1,71,608 * 02 Dispensaries and Hospitals (All) 9,209 23,555 27,770 ** 03 Beds (Private & Public) 1,17,198 5,69,495 9,14,543 (All types)**04 Nursing Personnel 18,054 1,43,687 8,65,135 @05 Doctors (Modern System) 61,800 2,68,700 6,56,111 @
Source: Ibid. (* RHS: Rural Health Statistics, 2006. ** Health information of India, 2004.@ National Health profile, 2005).
Volume 2 Issue 1 “Patients' Safety : Emerging Concerns & Defies"

[30]
Volume 2 Issue 1 APOTHEOSIS : Tirpude's National Journal of Business Research (TNJBR)
Public health is of crucial importance to any community and it needs to be given priority. If one considers the Health Expenditure of India in view of prevalent trends on basis of the various Five Year Plans of India as shown in the Table III, it becomes evident that the priority to Health Sector of India showed declining trend in terms of Expenditure incurred on Health as a per cent of Total Development Plans of India.
Table III : Trends in Health Expenditure of India (1951 2002): ( Rupees in Millions)
Health (Central & States) Five Year
Plans Period Amount
Total Plan Investment(All Development
Heads) Outlay/
Expenditure
Per centof Total
Plan First 1951-1956 Actual 1,960 652 3.33
Second 1956-1961 Actual 4,672 1,408 3.01 Third 1661-1966 Actual 8,576.5 2,259 2.63
Annual 1966-1969 Actual 6,625.4 1,402 2.12 Fourth 1969-1974 Actual 15,778.8 3,355 2.13 Fifth 1974-1979 Actual 39,426.2 7,608 1.93
1979-1980 Actual 12,176.5 2,231 1.83 Sixth 1980-1985 Outlay 97,500 1,821 1.87 Sixth 1980-1985 Actual 1,09,291.7 20,252 1.85
Seventh 1985-1990 Outlay 1,80,000 33,929 1.88Seventh 1985-1990 Actual 2,18,729 36,886 1.69
1990-1991 Actual 61,518 9,609 1.56 1991-1992 Actual 65,855 10,422 1.58
Eighth 1992-1997 Outlay 4,34,100 75,822 1.75Ninth 1997-2002 Outlay 8,59,200 19,818.4 2.31Tenth 2002-2007 Outlay 14,84,131.3 31023.3 2.09
Eleventh 2007-2012 Outlay 36,44 ,718 - -
Source: http://www.cbhidghs.nic.in (Central Bureau of Health Intelligence, Ministry of health &Family Welfare) & Human Development in South Asia, 2004.
5] A Critical Analysis of Healthcare Sectorof India
According to the Ernst & Young Healthcare Survey in the year 2007, the IndianHealthcare Industry is poised to grow at aCompounded Annual Growth Rate of 15 percent. Nearly, 90 per cent of this growth inhealthcare will come from the Private Sector. Further, Private Hospitals in India are expectedto collect $35.9 Billion (Rs. 1, 47,154.1 Crores) inthe year 2012 compared to $15.5 Billion (Rs.63,534.5 Crores) of the year 2006.
In the early 2000s, healthcare waslooked upon as a sunrise sector, three bigcorporate houses, Fortis Healthcare promotedby Ranbaxy Labs, Wockhardt Hospitals, and
Max Healthcare announced its plans to set uphospital chains across India. Further, Mumbai-based Asian Heart Hospital and GlobalHospitals and Care hospital in Hyderabadsprung up, which specialized in niche areassuch as Cardiac Care, Eye Care, Orthodonticsand Laparoscopy.
An Ernst & Young and Business Worldundertook the very first of its kind of Survey toidentify and define the Key FinancialOperational Parameters & Benchmarks ofIndia's Healthcare Sector highlighted newchange-agents and drivers of this sector coupledwith emergence of multi-specialty hospitalsthat have been successful in garnering the mostrevenues. One also witnesses on the crucialinfluence of Third-Party Players that is

[31]
insurance companies pushing hospitals forgreater financial and operational efficiency. Theother major growth drivers of India'sHealthcare Sector are rising literacy levels;growing public health awareness; higherincidence of lifestyle-related diseases; thissector's recognition by Government of India as aPriority Sector, and growth of Medical Tourismin India.
The flip-side to this progress is thePrivate Investments which are way below thelevels of its actual requirement needed to bridgethe financial gap of growing India's HealthcareSector's (http://www.businessworld.in).
As per the Survey of Ernst & Young onthe business of Healthcare: An industrydiagnostic revealed that the boom in Indianeconomy has catapulted India's HealthcareSector on to the evolutionary roadmap. Growthrates have been frenetic with both privateplayers and the Government evincing keeninterest to nurture the industry with a view toproviding universal healthcare.
So, it is hardly surprising thathealthcare is widely seen as being India's nextbig growth story. But, such a high investmenttrajectory in the health sector with the absenceof any standard operational and financialbenchmarks is a lacuna that needs to beaddressed. As per the World HealthOrganization's (WHO) estimates, China had aratio of two beds for every 1,000 people in theyear 2002 compared to just a miniscule figure of 1.1 Per 1,000 of India in the year 2006.To get towhere China was in 2002, India needs six moreyears, subject to an addition of about 1.2 Millionmore beds and an investment of $90 billion.
In view of corporatizing of investmentin healthcare and considering element of theprofitability of existing hospitals variousquestions have become pertinent concerningfinancial records of hospitals that are not opento the public. Besides, very few healthcarecompanies of India have been listed on the stockexchanges which too make the task of itsbenchmarking of the business performancedifficult of such hospitals.
The survey revealed that a majority ofthe hospitals are not generating operatingmargins close to a competing industry likehospitality. Private investors always seekhigher profitability. While the primary reasonfor low profitability of some hospitals may bethe lack of proven business models that areglobally aligned and more mature.
The profitability of hospitals is alsobeing affected by the increasing influence ofHealth Insurance Companies and Third PartyAdministrators (TPAs); issues such asutilization of high-end capital equipment;inadequate planning of capacity usage betweenvarious departments of hospitals, weakcontrols to arrest revenue leakages and theaverage length of stay, and resourceavailability. With a low supply and highdemand for doctors, nurses and paramedicalstaff, the war for talent is expected to intensifyfurther, resulting in mounting payroll costs.There will most likely be a deficit of 500,000Doctors and a Million Nurses in India by theyear 2012 (Ibid).
6] Review of LiteratureAn attempt has been made to offer a
comprehensive review of literature on patients'satisfaction and patients' safety as follows.Patients' Satisfaction:
The strongest and most consistentpredictors of patients' satisfaction were olderage and better self-reported health. Patients'characteristics were found as associated formore of the variance in satisfaction than didfacilities characteristics. (Robert Rossenbeck,Nancy J. Wilson, and Mark Meterko, 1997). Inchoosing a hospital patients gave firstpreference to the efficiency of doctors followedb y p r i o r - f a m i l y e x p e r i e n c e , a n drecommendations of friends and relatives.Those service encounters that were largelyresponsible for producing increased satisfactionwere v i z . , knowledge ; c oopera t i on ;interpersonal warmth; adequate and timelyinformation; prompt services; efficiency of thestaff, and convenience. (R.D. Sharma andHardeep Chahal, 1999). Patients' overallsatisfaction favourably reported on the major
Volume 2 Issue 1 “Patients' Safety : Emerging Concerns & Defies"

[32]
Volume 2 Issue 1 APOTHEOSIS : Tirpude's National Journal of Business Research (TNJBR)
dimensions viz., accessibility; availability;convenience; communication; financial aspect;general satisfaction; interpersonal aspects;technical quality; and time spent with doctor.
Corruption is the major cause ofdissatisfaction apart from poor utilities such aswater supply, fans, lights and poor maintenanceof toilets and lack of cleanliness; poorinterpersonal and communication skills(Prasanta Mahapatra, Srilatba S. Sridbar P.,2001).
Patients' perceptions' found very highlevels of satisfaction on doctors' work andtechnical aspects of nursing care. Moderatelevels of satisfaction were recorded regardingthe general attitude of nurses and wardservants. (Arpita Bhattacharya, 2003). Theresults of parents' satisfaction based on use ofan instrument Youth Services Survey forFamilies (YSSF) provided for support to thereliability of the YSSF in evaluating children'smental health services in Community MentalHealth Centers (CMHCs) (Sharon E.Riley,2005). Venkatapparao Mummalaneni(1995) offered two models on patients'satisfaction called as the Meditational Modeland the Moderator Model. Its results indicatedthat a huge proportion of the variance inpatients' satisfaction was accounted for by thed e l i v e r y s y s t e m c h a r a c t e r i s t i c s .(Venkatapparao Mummalaneni, 1995). D.Andrew Loblawa (2004) undertook study andasked respondents to complete twoquestionnaires called as t1 and t2 packages andconcluded that the two (t1 & t2) questionnaireswere brief, valid and reliable questionnairesthat tap two complementary facets of patientsatisfaction (D. Andrew Loblawa, 2004). IrisGourdji (2003) measured the patients'satisfaction and importance of ratings of qualityin an out-patient Oncology Center whichindicated that patients were satisfied with theircare. Patients' perception of waiting time andlack of questioning regarding their medicationsby the pharmacist were identified as two areasthat called for an improvement. (Iris Gourdji,et. al., 2003).
6] Patients' Safety
A brief summary on available literatureon Patients' Safety is offered herewith asfollows.
Thomas V. Perneger, (2006) consideredPatient Safety as global level problem that callsfor global solutions. The study described thatthe rich field of research area that offersexciting opportunities to researchers of manydisciplines includes In-depth studies of errors,mishaps, and Patient Safety incidents;epidemiologic studies of incidents and errorsidentification of risk factors for Patient Safetyevents; research on human factors; patientinvolvement in safety; development of PatientSafety indicators; and evaluation ofinterventions to improve safety have been(Thomas V. Perneger, 2006).
Improving Patients' Safety should beconsidered as an issue that has affected healthsystems in both developed and developingcountries. To co-ordinate and accelerateimprovements in patient safety, the WorldHealth Organization (WHO) has supported thecreation of the World Alliance for Patient Safetylaunched in the month of October 2004. Its focuswas on the six action areas viz., Taxonomy;Research; Solutions for Patient Safety;Reporting and Learning, and a Biennial GlobalPatient Safety challenge. (Didier Pittet, LiamDonaldson, 2006).
Patient Safety Culture includesselected dimensions viz., Patients' Safety; Non-Punitive Response to Error; Hospital Transfers& Transitions; Staffing; Teamwork AcrossHospital Units & Within Hospital Units foundto be low to average in all the selected hospitalsand called for an improvement (Johan Hellings,2007). The use of Patient Safety Initiatives(PSIs) included approaches such as opendiscussion of Errors, Education and Training,and System Redesign. The identified barrierswhich significantly impeded implementation ofPSIs were lack of top management support;lack of resources; lack of incentives, and lack ofknowledge, while other factors related withperceived importance of PSIs facilitated theimplementation of PSIs (Kathleen L.McFadden, et. al., 2006). Patients' feedback

plays an important role as a contributing factorin the endeavor for continuous qualityimprovement in the health-care system.(Rachel Javetz, Zvi Stern, 1996).
The complaint handlers wereinsufficiently empowered; information sharingw a s l i m i t e d w i t h i n t h e h o s p i t a l s ;communication among professional Staff andbetween management was inadequate. Itbecame evident that the hospital failed to usepatients' complaints as a source of learning topromote higher standards of medical care. Itwas found that hospitals need to establish clearpolicies and mechanism that sufficientlyempowered complaint handlers to deal withdifferent kinds of patients' complaints. Aneffective communication network betweendepartments is highly essential to makerequired follow up on the procedure of patients'complaints handling (Sophie Y. Hsieh et. al.,2005).
6.2 An Impact of Health Care & MedicalErrors in Patients' Safety: A Critique:
An attempt has been made by the researchers tooutline the areas of medical errors due to whichpatient has to suffer, as follows:
There are many areas which can beattributed to healthcare errors such asreceiving the wrong drug or wrong surgery orcomplications of surgery and other treatmentsor failure to diagnose correctly or to spot thepatient whose condition is deteriorating and todo something about it. It can be in terms ofpatients' health improvement; permanentdisability or even death. The earlier researchsupports evidence that a significant number ofhealthcare errors are preventable. (SarahWilliamson, www.asianhhm.com)
According to estimate of the EuropeanCommission in Europe, 1 out of 10 patients areaffected by healthcare-related infections. 3Million Deaths are caused by healthcare-related infections. 50,000 people die each yearbecause of healthcare-related infections whichcan be attributed to health care errors(http://www.healthfirsteurope.org). It isestimated that in European Union (EU)
Member States around 8 to 12 per cent ofpatients admitted to hospitals suffer fromhealthcare errors much of which arepreventable (http://ec.europa.eu).
A conservative average of the Instituteof Medicine and Health Grades Reports, USAhad indicated that there were about 400,000 to 1.2 Million healthcare error-induced deathsattributed to human factors, medicalcomplexity, system failures, infrastructurefailure during the year 1996 to 2006. Humanfactors that causes healthcare errors consists ofvariations in healthcare provider training &experience, fatigue, depression and burnout;diverse patients', unfamiliar settings, timepressures, and failure to acknowledge theprevalence and seriousness of medical errors.
Reasons for the healthcare error may be due toMedical complexity caused due to complicatedtechnologies; powerful drugs; Intensive careand prolonged stay in hospital; increase inpatient to nurse staffing ratio; an impressionthat action is being taken by other groupswithin the institution; reliance on automatedsystems to prevent error; inadequate systems toshare information about medical errorshampering analysis of contributory causes, andimprovement strategies.
The healthcare error is many times aresult of cost-cutting measures put in byhospitals in response to reimbursementcutbacks; environment and design factors. TheAmerican Institute of Architects has identifiedconcerns for the safe design and construction ofhealth care facilities. According to the WHO, 50per cent of medical equipment in developingcountries is only partly usable due to lack ofs k i l l e d o p e r a t o r s o r p a r t s .(http://en.wikipedia.org/wiki/Patient _safety).
An attempt has been made by theresearchers to offer few illustrations ofhealthcare errors to highlight the fact thatpatients have suffered largely due to negligenceof healthcare service providers.
* On 23/06/1997, MS. Sheetali Bhargawa, aged
[33]
Volume 2 Issue 1 “Patients' Safety : Emerging Concerns & Defies"

[34]
Volume 2 Issue 1 APOTHEOSIS : Tirpude's National Journal of Business Research (TNJBR)
17 years, was given blood transfusion, the 5units of blood platelet concentrate prepared inblood bank from five different donors wastransfused. On 25/06/1997, patient's blood wastested and found that patient was sufferingfrom Hepatitis C and had to spend hugeamounts for her treatment due to thenegligence of hospital and compensation of 18lakhs was ordered by National ConsumerDisputes Redressal Commission, New Delhi toIndraprastha Apollo Hospital (MS. S.S.Purnapatre, 2004).
* A lady was admitted in Civil Hospital,Aurangabad, on 10/07/1963, for delivery of childand subsequent sterilization operation. Thehospital is associated with a Medical College.After operation, the patient developed highfever and acute pain in abdomen. The patientwas examined by surgeon attached to thehospital and advised that patient should bereopened and on reopening it was found that amop (Towel) was left in the abdomen of patientduring sterilization operation. Condition ofpatient did not improved and patient diedbecause of negligence of Gynecologists andMedical Officer. Trial Court held MedicalOfficer guilty of negligence and orderedcompensation of Rs. 36,000 to be paid byMedical Officer, Gynecologist and Governmentof Maharashtra. High Court reverses thedecision but Supreme Court set aside HighCourt decision and upheld Trial Court decision.[Decision of Supreme Court in Civil Appeal No.3318/1979 dated 20/02/1996. published in AIR1996 Supreme Court 2377].
* A Patient was operated for Hernia by Surgeon,on 08/01/1995, under general anesthesia andthe Anesthetist and Surgeon left OperationTheatre immediately after operation withoutchecking whether the patient is out ofAnesthesia. Patient's breathing stopped andSurgeon rushed to hospital but patientremained unconscious and died. District Forumheld Anesthetist and Surgeon negligent andcompensation of Rs. 4 lakh was awarded.Appeal of doctors was not considered and StateCommission too upheld decision of DistrictForum due to Anesthetist and Surgeon being
found guilty [Ibid].
6.3 World Health Organization'sInitiatives on Patients' Safety
The World Health Organization (WHO)launched the World Alliance for Patient Safetyin response to World Health AssemblyResolution In the month of October, 2004 thaturged WHO and Member States to pay theclosest possible attention to the problem ofpatients' safety. It is aimed at raisingawareness and political commitment toimprove Patients' Safety, and Medical Care andalso for developing Patients' Safety Policy andPractices. Each year the core element is theformulation of Global Patient SafetyChallenges.
The first Challenge focused on healthcare
associated aspect of infection, while safesurgery was chosen as the topic for the secondchallenge of the global patient safety. As theincidents of traumatic injuries, cancers andcardiovascular disease continue to increase, theimpact of surgical intervention on public healthsystems will grow. An estimated 234 Millionmajor operations are performed around theworld each year, corresponding to one operationfor every 25 people alive. Yet, surgical servicesare unevenly distributed with 30 per cent of theworld's population receiving 75 per cent ofmajor operations.
Lack of access to high quality surgicalcare remains a significant problem in much ofthe world despite the fact that surgicalinterventions can be cost effective in terms ofl i ves saved and d i sab i l i ty aver ted( ).
6.4 WHO's World Alliance Action Areas forPatients' Safety
The World Alliance for Patient Safetyhas identified six action areas viz., PatientTaxonomy, Research; Solutions for PatientSafety; Reporting; Learning, and a biennialGlobal Patient Safety Challenge. The firstChallenge covered in the year 2005 to 2006launched in the month of October, 2005 underthe banner of Clean Care is Safer Care affecting
concerning patients' safety has
http://www.who.int

hundreds of millions of people worldwide.Second, a focus on improving the ways to detectand learn from information about PatientSafety problems within and across countries,with a particular emphasis on methods andtools for detecting Patient Safety problems indeveloping countries. Third, a need to build upthe knowledge base of interventions which havebeen shown to help solve Patient Safetyproblems, together with a more rapid andsystematic dissemination of informationworldwide on successful strategies (DidierPittet, Liam Donaldson, 2006).
Patients for Patient Safety (PFPS)emphasizes the central role patients andconsumers can play in efforts to improve thequality and safety of healthcare around theworld. It works with a global network ofpatients, consumers, caregivers, and consumerorganizations to support patient involvement inPatient Safety programmes, both withincountries and in the global programmes of theworld alliance for patient safety. Its ultimatepurpose was to improve health care safety in allhealth care settings throughout the world byinvolving consumers and patients as partners.
Research for Patient Safety is an attempt todevelop an agreed International ResearchAgenda for Patient Safety that was set up by theWHO to foster research on Patient Safetyresearch agendas aimed at to facilitate thespread and use of research findings to informsafer health care in all WHO Member States.The goal of Solutions for Patient Safety is toincrease International Collaborations for thepromotion of existing Patient Safetyinterventions and better co-ordination of effortsto develop future solutions.
The International Steering Committeeapproved 09 solutions available for use by WHOMember States from the month of May, 2007viz, look-alike, sound-alike medication names;patient identification; Communication duringpatient hand-over; Performance of correctprocedure at correct body site; Control ofconcentrated electrolyte solutions; Assuringmedication accuracy at transitions in care;avoiding catheter and tubing misconnections;
Single use of injection devices, and Improvedhand hygiene to prevent health care associatedinfections.
Healthcare errors are often provoked byweak systems and often have common rootcauses which can be generalized and corrected.Although, each event is unique, there are likelyto be similarities and patterns in sources of riskwhich may otherwise go unnoticed if incidentsa r e n o t r e p o r t e d a n d a n a l y z e d(http://www.who.int/patientsafety/research/en)
6.5 A Bird's eye view on WHO Guidelineson Health Care
WHO has developed new Guidelinesdescribed as 'Hand Hygiene in Health Care(Advanced Draft)' with a thorough review, andspecific recommendations to improve practicesand reduce transmission of pathogenicmicroorganisms to patients and HCWs toprovide Health Care Workers [HCWs], HospitalAdministrators, & Health Authorities with thebest scientific evidence and recommendationsto improve practices intended to beimplemented in any situation for delivery of thehealthcare to a patient or a specific group ofpopulation (World Alliance for Patient Safety,2006).
6.6 Principles & Quality of Health Care
The basic principles for patient safetyare the principles for quality of healthcarewhich includes to do the right thing for the rightpatient using the right method & at the righttime & to communicate well with the patientand the rest of the clinical team to facilitaterecording of the findings; planning of promptand clear actions to ensure that instructions areunderstood and carried out, and reportconcerns to a senior colleague when necessary.(Sarah Williamson, www.asianhhm.com).
In order to ensure the conduct of thecorrect test in line with the patient's symptomsbased on choosing of correct drug that is givenin the correct doze, and that surgery isperformed on the correct side of the bodysupported with recording of correctobservations on a sick patient at the correctfrequency. The procedures and training to guide
[35]
Volume 2 Issue 1 “Patients' Safety : Emerging Concerns & Defies"

all the staff implies improving safety andquality of care in form of unambiguous and clearprescription of drugs, proper and safeadministration of drugs, marking andpreparing patients for surgery, knowledge ofappropriate timing of tests and differentmethods of interpretation of results that areprovided. Although it sounds painfully obvious,many health care errors occur because patientshave similar names. Errors could occur whenthe wrong patient is taken to X-ray, or a doctorpicks up the wrong set of notes, or specimens aremislabeled, or even because in a busy wardthere is a new patient on the bed. It should beroutine for staff to check at each stage of carethat they are dealing with the correct patient.
Using the Right Method impliesensuring of diagnostic tests that are correctlyperformed and interpreted. Similarly, manyerrors occur where drugs are given by the wrongroute or in the wrong concentration. It is alsovery important that untrained staff know that,and abstain from performing certain tasks thatcarry significant risks. Providing MedicalTreatment at the Right Time includes giving ofdrugs as prescribed time as well as checking thepatient and recording observations to avoid thepatient's deteriorating condition. Use of earlywarning systems designed to alert staff about adeteriorating patient will be helpful. Ensuringeffective communication and maintainingproper medical records of patients are equallyimportant. In most cases, faulty treatments canbe attributed to improper communication ofcritical data. It helps not only patients inunderstanding their condition but alsohealthcare providers in providing proper care topatients. To have a culture for listening topatients and respecting their wishes shall formthe basis of offering effective healthcare in the21st century. Multiple medical teams areinvolved for record keeping and providinghealth care facilities to the patients consistingof Doctors, Nurses, Therapists, Technicians,and Pharmacists whose relationship with eachother requires sharing of information andacting on instructions. It is highly desirablethat in each of their shift s/he must recordchanges in the patient's condition, results of
tests, new plans for care, and anything else thateveryone caring for the patient needs to know.Finally, there exists a need to set up policies,procedures and for providing training tomultiple medical teams involved for recordkeeping and providing health care facilities tothe patients for ensuring patient safety. Theseteams should clearly understand instructions;ensure proper use of the equipment to avoidinfection and improve hygiene by followingsafety norms and use of incident reportings y s t e m ( S a r a h W i l l i a m s o n ,
).
7] Epilogue
Though modern healthcare facilitiescontinue to achieve excellent results inimproving health conditions of peopleworldwide, one can still come across the eventsthat show that the patients are put at riskthrough errors. Healthcare error is apreventable adverse effect of care and isresponsible for the emerging issues related withPatient Safety. There are many causes ofinsufficient patient safety and World HealthOrganization [WHO] globally launched theworld alliance for safety of patients.
In order to overcome the issues relatedwith patients' safety an attempt should bemade to follow some principles. The basicprinciples for Patient Safety are the principlesfor Quality of Health Care which includesenhancing effectiveness by doing the rightthing; offering medical treatment to the rightpatient; providing medical treatment using theright method; providing medical treatment att h e r i g h t t i m e ; e n s u r i n g e f f e c t i v ecommunication; maintaining proper medicalrecords of patients; developing a culture &systems of patients' safety, and implementationof guidelines provided by WHO's World Alliancefor Patient Safety.
To ensure better implementation of theWHO's World Alliance for Patient Safety aimedat handling the global challenge of PatientSafety and for ensuring a high level of hygiene, it is essential that health care facilities focus onclean hands; clean equipment; clean products;
www.asianhhm.com
[36]
Volume 2 Issue 1 APOTHEOSIS : Tirpude's National Journal of Business Research (TNJBR)
[37]
clean practices; and above all cleanenvironment. One also finds presence of a largenumber of innovative technologies aimed atenhancing and strengthening patient safety.There is a significant transdisciplinary body oftheoretical and research literature available onthe science of patient safety. It has emerged as adistinct healthcare discipline supported by animmature yet developing scientific framework.It calls for system-wide action on a broad rangeof fronts to identify and manage actual andpotential risks concerning Patient Safety thatcalls for actions in areas like PerformanceImprovement, Environmental Safety & RiskManagement, including Infection Control, Safeuse of Medicines, Equipment Safety, SafeClinical Practice & Safe Environment of healthcare. It embraces that the challenges faced bythe world population for Patient Safety areenormous, but the rewards too are important ifappropriate actions are planned andimplemented in near future.
References
[1] Annual Report of Health & Family Welfare(2005-06); Ministry of Health and familyWelfare; (www.mohfw.nic.in).
[2] Arpita Bhattacharya, Prema Menon, VipinKoushal, K.L.N. Rao (2003); “Study ofPatient Satisfaction in a Tertiary ReferralHospital”; Journal of the Academy ofHospital Administration, Vol. 15, No. 1, Jan- June 2003.
[3] D. Andrew Loblawa, B Andrea Bezjaka, P.Mony Singhc, Andrew Gotowiecd, DavidJouberte, Kenneth Mahe And Gerald M.Devins (2004); “Psychometric RefinementOf An Outpatient , Visit -Speci f icSatisfaction With Doctor Questionnaire”;Psycho-Oncology 13: PP. 223234.[Published online 27 May 2003 in WileyI n t e r S c i e n c e (www.interscience.wiley.com). DOI: 10.1002/pon.715].
[4] Didier Pittet, Liam Donaldson (2006);
“Challenging the World: Patient Safetyand Health Care-Associated Infection”;International Journal for Quality inHealth Care, Published by OxfordUniversity Press, Vol. No.18, No. 1, 2006,PP. 4-8.
[5] Health information of India, 2004;http://cbhidghs.nic.in/HII2004/content1.asp, Retrieved on 16/09/2009
Volume 2 Issue 1 “Patients' Safety : Emerging Concerns & Defies"

Branding imperatives in Indian Organized Retailing: an Exploratory Study
Sanjay Jena*, Rabinarayan Patnaik**, Dr. Chinmaya Kumar Dash***
Abstract : With an unprecedented growth in the retail formats, volume of business, space utilizationand more importantly the number of business houses coming into this form of business, the organizedretailing in India is in its best possible shape and promises to do better in the time to come. But withthis growth, the challenges to sustain and keep itself on the minds of consumers a place to visit againand again will be tremendous for the retailers irrespective of the location, facilities and the scale ofbusiness. Decoding a brand's DNA and to make it applicable in the retailing context will be what everyretailer should look forward to. Thus it is the right time for the retailers to create a framework ofunderstanding its customers and provide them all the reasons to prefer their outlet to others for allpossible shopping reasons. This leads to the perennial concept of creating a brand and making asystematic branding process. It is required to extract all possible factors that undermine the brandingdimensions of retailing and construct a framework for further scope of research which will not onlyhelp the academicians but also the retailers to effectively cater to their target group of shoppers in thetime to come.
[38]
* Innovation Business School, Bhubaneswar
Keywords: DNA, brand assortment, experiential marketing, signature, private labels, consumerism
1. Introduction
Organized retail, besides benefiting theconsumers by way of competitive productpricing and quality service, is introducing theIndian consumer to a shopping experience likenever before. The modern shopping complexesare becoming the destination point for shoppersas well as 'window-shoppers'. There iseverything for everyone shopping,entertainment and food all of it under one roof. From 95 currently operational shoppingcentres with approximately 22-million sq.ftspace, India will have over 375 shoppingcentres/ Malls covering over 90 million sq.ftquality retail space in the years to come. Inaddition to that 50 hypermarkets, 305 largedepartment stores, 1500 supermarkets andover 10,000 new outlets under construction andretail space will add 300 billion of business toorganised retail (Deloitte Touche Tohmatsu,2007). While the statistics promise greatopportunity, they would also presentsubstantial challenges. One of them iscommoditization. There is a fear that the pricewars in the organized retail sector will make abig dent in the brand image of theseenterprises. They will need to create amindshare and rise above price wars and
shopping ambience.
Critical in this regard seems to be thefocus on branding. It is essential to understandthe term 'brand' before getting into the processof branding and its imperatives in any form ofbusiness including retailing. Among severalschools of thought which have explained theterm brand, one of the most popular ones that ofOxford American Dictionary (1980) has definedbrand as 'a trade mark, goods of a particularmake and so on' where as The Pocket OxfordDictionary of Current English (1934) says abrand is 'Piece of burning or smoldering wood,torch, (literary); sword (poet.); iron stamp usedred-hot to leave an indelible mark, mark left byit and so on'. Almost irrespective of how theword is used today, it has always meant, in itspassive form, the object by which an impressionis formed, and in its active form the process offorming this impression.
A brand refers to the tangible andintangible values of a product, service or place.On their own and in their generic forms;products, services, towns, regions and countriesare similar to each other. In a saturated andhighly competitive market place, theimportance of brands and branding to marketshare growth and product success cannot be
Volume 2 Issue 1 APOTHEOSIS : Tirpude's National Journal of Business Research (TNJBR)

Volume 2 Issue 1 Branding imperatives in Indian Organized Retailing: an Exploratory Study
[39]
overemphasized. Companies, countries,regions, towns and organizations who are ableto grasp the principles of brand DNA are morelikely to eclipse those who do not, in terms ofdelivering value to shareholder investments, orin the ability to attract inwards and foreigndirect investments (FDIs).
Decoding a brand's DNA will berequiring establishing its Distinctiveness,Novelty and Attributes, as compared to those ofthe competition (Uche Nworah, 2005). A brandmust be unique in its own way; it must havecharacteristics that make it stand apart fromcompetitors, such that these characteristicsbecome easily identifiable by the consumers.Marketers must then seek to discover or createtheir brand's distinct characteristics andcommunicate them to consumers; also anybrand promise made must be constantlyfulfilled and matched by action. In addition to abrand's distinction in terms of brand qualityand superior performance, brand novelty refersto brand evolution through a process of researchand development, the brand has to sum itself upin a brand charter and state what it is all about.The brand attributes therefore encompasses allthe tangible and intangible aspects of thebrand, which is also consciously andunconsciously communicated to customers andstakeholders.
Retailers' Branding Dimensions In the lastdecade retailing has witnessed tremendousgrowth in almost everywhere in the world in alltypes of merchandising like food and non- fooditems. This has on one extreme givenopportunities to the retailers to bank upon thepromotions and private labels and on anotherextreme to diversify to different store formatsdue to the emergence of warehouses anddistribution centers. As because a substantialportion of the retailers' top- line growth hasbeen contributed by the established brands andthese brands are also dealt by the competitivestores as well, the onus lies with the retailers tostart thinking about building their own brandequity.
With the application of many brandingprinciples to retailers as well, the difference
remains in understanding the dimensions ofretailer brands which are more of consumersensory driven than understanding traditionaltangibility of a product brand. Retailers alsocreate their brand images in different ways,e.g., by attaching unique associations to thequality of their service, their productassortment and merchandising, pricing andcredit policy, etc. As far as retail stores areconcerned, the manufacturer brands in mostconsumer industries, the image and equity ofretailer brands also depends on themanufacturer brands they carry and the equityof those brands. Retailers use manufacturerbrands to generate consumer interest,patronage, and loyalty in a store.
The Dimensions of Retailer ImageFo l l owing the Amer i can Market ingAssociation's definition of a brand, a retailbrand identifies the goods and services of aretailer and differentiates them from those ofcompetitors. A retailer's brand equity isexhibited in consumers responding morefavorably to its marketing actions than they doto competing retailers. The image of the retailerin the minds of consumers is the basis of thisbrand equity.
Researchers have studied a multitudeof retailer attributes that influence overallimage, e.g., the variety and quality of products,services, and brands sold; the physical storeappearance; the appearance, behavior andservice quality of employees; the price levels,depth and frequency of promotions; and so on.Different dimensions which influence retailbranding exercises can be: 1) access, 2) storeatmosphere, 3) price & promotion, 4) cross-category product/service assortment, 5) brandassortment, 6) Private Labels and 7)Experiential marketing.
1.1 AccessThe location of a store and the distance
that the consumer (D L Huff, 1964) must travelto shop there are basic criteria in their storechoice decisions. Currently, suburban sprawl,greater driving distances, the appearance ofnew warehouse retail formats that are oftenlocated in large spaces away from residentialareas, and online retailing have made location

[40]
somewhat less central as a store choicecriterion. Subsequently on the lines of thistrend, it was found that location no longerexplains most of the variance in store choicedecisions. Rather, store choice decisions seem tobe consistent with a model where consumers'optimize their total shopping costs, effort toaccess the store location being one component oftheir fixed cost of shopping (D R Bell, T H Hoand C S Tang, 1998). That is not to say, however,that location is unimportant. Consumers' storechoice may be based on different criteriadepending upon the nature of the trip. Forinstance, small basket, fill-in trips are veryunlikely to be made to distant or inconvenientlocations. And, retailers in some formats, likeconvenience, drug, or supermarket have lessflexibility in their location decision than massmerchandisers or warehouse clubs
1.2 Store AtmosphereThe response that atmosphere elicits
from consumers varies along three maindimensions of pleasantness, arousal, anddominance (J A Russel and A Mehrabian, 1977).This response, in turn, influences behavior,with greater likelihood of purchase in morepleasant settings and in settings ofintermediate arousal level. Different elementsof a retailer's in-store environment, e.g., color,music, and crowding, can influence consumers'perceptions of a store's atmosphere, whether ornot they visit a store, how much time they spendin it, and how much money they spend there.F u r t h e r r e s e a r c h ( J u l i e B a k e r, A .Parasuraman, Dhruv Grewal, Glenn B. Voss,2002) on store atmosphere has categorized theelements of in-store atmosphere into physicalfeatures like design, lighting, and layout,ambient features like music and smell, andsocial features like type of clientele, employeeavailability and friendliness. It is also notedthat atmosphere can affect consumers'perceptions of the economic and psychologicalcosts of shopping in a store and find thatpleasing physical design lowers both economicand psychological costs while music lowers thelatter.
A pleasing in-store atmosphereprovides substantial hedonic utility toconsumers and encourages them to visit more
often, stay longer, and buys more. Although italso improves consumers' perceptions of thequality of merchandise in the store, consumerstend to associate it with higher prices. From abranding perspective, an appealing in-storeatmosphere offers much potential in terms ofcrafting a unique store image and establishingdifferentiation. Increasingly, brands are beingpositioned on the basis of their intangibles andattributes and benefits that transcend productor service performance. Even if the productsand brands stocked by a retailer are similar toothers, the ability to create a strong in-storepersonality and rich experiences can play acrucial role in building retailer brand equity.
1.3 Price and PromotionNo matter how the characteristics of theconsumer, product, store, or purchase situationmight differ, price represents the monetaryexpenditure that the consumer must incur inorder to make a purchase. From the vastliterature on pricing, three areas that are ofdirect relevance to consumers' image and choiceof retailers can be described as given in thesubsequent paragraphs.
1.3.1 Store price perceptionsA retailer's price image should be
influenced by attributes like average level ofprices, how much variation there is in pricesover time, the frequency and depth ofpromotions, and whether the retailer positionsitself as EDLP (Every Day Low Price) or HILO(High-Low Promotional Pricing). It has beenfound that the difference between consumers'perceptions (F E Brown, 1969) of price levels invarious stores and reality, showing thatconsumers may use non-price related cues likeservice offerings and quality levels to form theirprice perceptions. Another research hasdeveloped a product-price saliency framework(K K Desai and D Talukdar, 2003) to examinehow consumers form an overall store priceimage (OSPI). It has shown that products withhigh unit prices and high purchase frequencyare more salient and therefore contribute moreto OSPI, with purchase frequency dominatingunit price in importance.\
1.3.2 Retailer pricing formatA retailer's price format, which is on a
Volume 2 Issue 1 APOTHEOSIS : Tirpude's National Journal of Business Research (TNJBR)
[41]
continuum between EDLP and HILO, alsoinfluences consumers' store choice andshopping behavior. It has been found (DR Bell &JM Lattin, 1998) that “large basket shoppers”prefer EDLP stores whereas “small basketshoppers” prefer HILO stores. The intuitionbehind the finding is straight-forward. Largebasket shoppers are captive to the pricingacross a large set of product categories at a timeand do not have the flexibility to take advantageof occasional price deals on individual products.They therefore prefer EDLP because it givesthem a lower expected price for their shoppingbasket. Small basket shoppers, on the otherhand, can take advantage of variations in pricesof individual products and, by buying on deal,can lower their basket price even if averageprices in the store are high.
1.3.3 Price promotion induced store switching
It has been found (V Kumar & RPLeone, 1988) that retailer price promotionsresult in store switching by consumers andthere is a significant impact of promotions onstore switching/traffic. Consumers typicallyshop in more than one store. They maypurchase a promoted product in the store theyhappen to be visiting whereas they wouldotherwise have purchased it in another store.This also reiterates the important moderatingeffect of in-store atmosphere. The impact ofpromotions will be higher in a pleasantatmosphere because the longer consumers stayin a store, the more likely they are to noticepromotions and buy more than planned duringthe shopping trip.
Consumers are more likely to develop afavorable price image when retailers offerfrequent discounts on a large number ofproducts than when they offer less frequent, butsteeper discounts. Further, products that havehigh unit price and are purchased morefrequently are more salient in determining theretailer's price image. One pricing format doesnot dominate another, but large basketshoppers prefer EDLP stores while smallbasket shoppers prefer HILO, and it is optimalfor HILO stores to charge an average price that
is higher than the EDLP. Finally, pricepromotions are associated with store switchingbut the effect is indirect, altering consumers'category purchase decisions while they are inthe store rather than altering their choice ofwhich store to visit.
1.4 Cross-category product/serviceassortment
Consumers' perception of the breadth ofdifferent products and services offered by aretailer under one roof significantly influencestore image (PR Messinger and C Narasimhan,199). The benefits of a wide assortment areclear. First, the greater the breadth of productassortment, the greater the range of differentsituations in which the retailer is recalled andconsidered by the consumer, and therefore thestronger its salience. Salience is the most basicbuilding block for a brand. Second, the one-stopshopping convenience that a broad productassortment enables is becoming moreimportant than ever for today's time-constrained consumer, putting pressure onretailers to broaden their assortment. Third,consumers regularly shop at more than onestore, and, as noted earlier, they may purchasea category in the store that they are visitingbased on in-store assortment and marketingmix activities whereas they would otherwisehave purchased it in another store. Togetherwith the fact that unplanned purchasescomprise a significant portion of consumers'total shopping basket, this gives an advantageto retailers with broader assortments.
Certain types of product categorieshave “signature” associations with specificchannels, e.g., supermarkets with food, drugchannel with medications and health products,and mass merchandisers with household items.But, research has shown that a brand that isseen as prototypical of a product category can bedifficult to extend outside the category.Therefore, if a retailer has strong signatureassociations with certain categories, consumersmay find it difficult to think of the retailer inconnection with other, very different categories.1.4.1 Within-Category Assortment
Depth of a retailer's assortment withina product category is also an important
Volume 2 Issue 1 Branding imperatives in Indian Organized Retailing: an Exploratory Study

[42]
dimension of consumer's perception of storeimage and subsequently of store choice. Forvariety seeking consumers (L McAlister & EPessemier, 1982), increases in the perceivedassortment of brands, flavors, and sizes resultin perceived greater utility and consumers withuncertain future preferences will believe theyhave more flexibility in their choices and, ingeneral, it is more likely that consumers willfind the item they desire (BE Kahn, 1995). Moreofferings in a category, however, can be costlyboth for the retailer and the consumer. Theorganization and symmetry of an assortmentmoderate the impact of actual assortmentvariety on perceived variety and consumption,with organized and asymmetric assortmentshaving a more positive effect (BE Kahn & BWansink, 2004). Greater perceived assortmentdoes influence store image, store choice, andsatisfaction with the store, but a greaternumber of SKUs need not directly translate tobetter perceptions. Retailers can reduce thenumber of SKUs substantially withoutadversely affecting consumer perceptions, aslong as they pay attention to the most preferredbrands, the organization of the assortment andthe availability of diverse product attributes.
1.5 Brand Assortment
Brand assortment has becomeparticularly important in the last decade as atool for retailers to influence their image anddevelop their own brand name. Most retailerscarry manufacturer brands but, increasingly,they also offer private label products. Onemotivation for offering private labels is thehigher percent margins that they provide toretailers, the negotiating leverage they provideover manufacturers (SJ Hoch & S Banerji,1993) and a third is the implicit assumptionthat providing a private label brand engendersloyalty to the retailer (VR Nijs, MG Dekimpe &JBEM Steenkamp, 2001).
1.6 Private Labels
Although the growth of private labelshas been interpreted by some as a sign of the"decline of brands," it could easily be arguedthat the opposite conclusion is more valid, asprivate label growth could be seen in some waysas a consequence of cleverly designed branding
strategies. Researches on private labels haverevealed some pertinent dimensions like:
1) Is there any consumer who is prone toprivate labels (P Richardson, AK Jain & A Dick,1996)?
2) Whether private labels give retailersnegotiating leverage over national brandmanufacturers (David E. Mills, 1995).
3) Category specific, differential price,perceived quality and so on (SJ Hoch, ALMontgomery & YH Park, 2004).
The Impact of Manufacturer Brands onPrivate Label Success
Since consumers' representations ofprivate labels, which are not advertised muchand vary from one retailer to another, may notbe as well elaborated as their representations ofwell known manufacturer brands, extrinsiccues are more likely to affect perceptions ofprivate labels. The manufacturer brandscarried by the retailer can serve as oneimportant extrinsic cue. However, the influenceof manufacturer brands on private labelevaluation and choice may vary dependingupon the assortment of price-quality tiers anddisplay structure in the store. Studies (ISimonson, 1999) have shown that adding aneven higher quality option to an existingassortment leads consumers to prefer a higher-quality, higher-price option, with the cheapestoption losing the most. On the other hand,adding a lower quality option does not shiftchoices to lower quality levels. This reiteratesthe importance of quality in private labelsuccess and shows that the strategy of stockingan even lower quality manufacturer brand tomake a low quality private label look moreappealing will not be effective.
Consumer perceptions of a private labelproduct branded under the store name are morelikely to color their impressions of the store aswhole and vice versa than if a different namewere used to brand the product. Yet, thedifferent inherent qualities of a retail store andits products suggest that the flow of meaningand equity may not always be strong. In otherwords, consumers may be able to mentally
Volume 2 Issue 1 APOTHEOSIS : Tirpude's National Journal of Business Research (TNJBR)
[43]
compartmentalize product offerings as distinctfrom retailing activities such that, even if theydeemed a particular store brand product asunacceptable, they may be less inclined todowngrade their evaluations of the retailer as awhole. If the retailer chooses not to use the storename for private label products, the feedbackeffects, both positive and negative, wouldpresumably be less strong. In summary,stocking high quality manufacturer brandsimproves the valuation of a retailer's privatelabel by improving consumer perceptions of theretailer's overall image. However, theassortment of price quality tiers that theretailer carries and displays along with theprivate label can influence private label choice.Positioning the private label as a compromisebetween high and low tier manufacturer brandsmay increase its share in some categories butnot in others. And, whether a mixed or separatedisplay is better for private labels may dependupon whether it has superior price and productfeatures.
1.7 Experiential marketing
One emerging trend in marketing isexperiential marketing company-sponsoredactivities and programs designed to create dailyor special brand-related interactions as alreadymentioned under the heading 'Experience'.Retailers are obviously in an ideal position tocreate experiences for their customers. Theseexperiences may involve their own privatelabels, manufacturer brands, or not be tied to aspecific product but the store as a whole. A hostof questions are raised by such strategies. Whatkinds of feelings can be engendered by aretailer's event? How can that become linked tothe retailer's brand? How do retailers developtheir communication strategies as a whole? Canretailers use the Web to provide further eventsupport and additional experiences? A relatedissue is how retailers can engage in activities,perhaps in collaboration with nationalmanufacturers, to encourage product use andcommunicate or demonstrate productinformation to build brand awareness andenhance brand image for the individualproducts or services that are sold. How can in-
store merchandising, signage, displays, andother activities leverage the equity of thebrands that the retailer sells while still buildingits own equity?
These dimensions are basically theindicators of DNA of branding vis-à-visretailing. Thus the constructs as taken out fromthe previous work lay a foundation to make anexploration into this ever-increasing issue ofretail branding particularly in the organizedform of this business in India.
2. Research Methodology
In view of the preceding works on retailbranding, this research work of ours has beendesigned with the extraction of all possibleconstructs and identification of severalvariables related to the branding aspects oforganized retailing in India.
2.1 Objectives
1) To explore the important variableswhich stand for maximum emphasis for theretailers to make a strategic branding decision.
2) To create an inroad into the employeesconsiderations of retail branding constructs soas to provide scope of research for brandingdimension of retailing from the customer'sperspectives.
3) To formulate hypothesis on the resultsof the study so as to construct a brandingframework for effectiveness in retailing.
2.2 Research design and data collection
This has been an exploratory studywhere a structured questionnaire (please seethe Annexure) was used for collecting data.Data has been collected from 400 employeesfrom various places and retail organizations inIndia like Shoppers Stop, Westside, ITC, FutureGroup etc.
3. Data analysis
Data collected has been tabulated andput into analysis with the use of SPSS. TheDiscrimination measures have been identifiedby using HOMALS, Version 1.0, Data TheorySelling System Group. The results have beengiven in the following paragraphs.
Volume 2 Issue 1 Branding imperatives in Indian Organized Retailing: an Exploratory Study

[44]
Findings and interpretations The data collected from 400 employees on the various questions have been put in the followingparagraphs and interpreted subsequently.
Figure 1 : Designation of respondents
Designation Number of respondents Departmental manager 120Assistant departmental manager 160 Store manager 60 Assistant store manager 60
Designation of respondents
30%
15%15%
40%
Departmental managers Store managers
Assistant store manager Assistant Departmental managers
The respondents targeted were generally of four broad types, i.e. departmental and assistantdepartmental managers in a departmental store format like Shopper's stop or a hyper market formatlike Star Bazaar and store managers and assistant store managers in EBO (Exclusive Brand Outlet)formats like Turtle, Planet M etc. The logic behind taking these designations of employees lies in thefact that these are the kinds of employees who always deal with the customers and are responsible tomaintain the floor.
Fig- 2 : Association with the same department
Opinion Number of respondents Yes 180 No 220
Association with the same
department
45%
55%
Yes No
When asked about the association with the same type of department in terms of merchandise, most ofthe respondents said 'No' as depicted from the above figure. It shows that the respondents have got avaried experience of customers' requirements and preferences across merchandises and categories.
Volume 2 Issue 1 APOTHEOSIS : Tirpude's National Journal of Business Research (TNJBR)

[45]
These groups of respondents while asked about their varied experiences across the retail sectorresponded in terms of formats like supermarket, standalone stores, hypermarkets etc. andmerchandises like food & grocery, electronic items, lifestyle products and so on. The other group ofrespondents with an opinion of 'Yes' though smaller in comparision to the first group, were found to builda confidence of understanding several differentiating dimensions of customers looking for thedepartment, facilities, merchandises etc. in their concerned areas.
Figure 3 : First organization of retail profession
Opinion Number of respondents
Yes 140
No 260
First organization in Retail Profession
35%
65%
Yes No
As obvious, when asked whether the current organization is the first of their professional workplace in retail, many of the respondents (65% as shown in the Figure) have said 'No', indicating that theyare competent enough to give an indicative picture of retail sector vis-à-vis other sectors where they hadhad experiences.
In the later part of the questionnaire, we enquired about the employees understanding of severalaspects of retail branding. In this process, a set of 33 constructs was put to the respondents and theirresponses were recorded in a 3- point rating scale, like 'Very Important', 'Somehow Important' and 'Notso Important' with the ratings of 3, 2 and 1 respectively. Then with the help of SPSS, the Discriminationmeasures have been identified by using HOMALS, Version 1.0, Data Theory Selling System Group.
From the figure (Refer 'Discrimination Measures'), it is very much clear that constructs with .000value on both the dimensions can be unanimously be described as those variables which are havingabsolute impact on the process of retail branding. These variables are: 'Store hype', 'Parking space','Location of the store', 'Skillful employees', 'Store layout', 'Required merchandise', 'Store environment','Required facilities', 'Established brands', 'Private labels', 'Returns and exchanges', 'Query handlingskills', 'Motivated employees', 'Loyal customers', 'Post- purchase relationships', 'One stop solution' and'Unique advertisements'. A close look at these variables can indicate its inclusion into three majorgroups, which have been mentioned in the following manner.
Group- I: Shopping Experience (Parking space, Required facilities, Store layout, Storeenvironment, Employee factor, One stop solution, Returns and exchanges)
Group- II: Brands and merchandises (Established brands, Private labels, Required merchandise)Group- III: Image building efforts (Store hype, Unique advertisements, Loyal customers, Post- purchaserelationships)
Volume 2 Issue 1 Branding imperatives in Indian Organized Retailing: an Exploratory Study

[46]
Table 1 : Discrimination Measures
Dimension
1 2
Store hype .000 .000 Modern looking façade .753 .068 Parking space .000 .000 Location of the store .000 .000 Skillful employees .000 .000 Store layout .000 .000 Required merchandise .000 .000 Convenience of customers .141 .672 Store environment .000 .000 Required facilities .000 .000 Discounts and schemes .037 .080 Stock availability .707 .126 Effective pricing .094 .422 Delivery of information to the customers .394 .191 No waiting time for customers .289 .199 Mode of payment .202 .424 Established brands .000 .000 Private labels .000 .000 Substantial product range .439 .148 Cash rich customers .666 .063 In store events .502 .117 Returns and exchanges .000 .000 Query handling skills .000 .000 Motivated employees .000 .000 Home delivery facilities .624 .034 After sales service .387 .000 Loyal customers .000 .000 Post- purchase relationships .000 .000 New arrivals .338 .137 One stop solution .000 .000 Sales effort .317 .461 Innovations on the floor .329 .130 Unique advertisements .000 .000
The above broad group of variables along with the factors that affect the reasons for shopping inorganized form of retailing can necessitate the strategic thinking of retail branding. It also aims atfinding the hypothetical relationship between the broad group of variables for formulating aframework of the branding dimension in retailing. For example, it can be experimented whetherthere is a significant relationship between:
1) 'Brands and merchandises' and 'Shopping Experience'
2) 'Brands and merchandises' and 'Image building efforts' 'Image building efforts' and 'Shopping Experience'
Volume 2 Issue 1 APOTHEOSIS : Tirpude's National Journal of Business Research (TNJBR)
[47]
4. Conclusion and Further Scope ofResearch
The Indian socio-economic fabric is acollage of variegated customs, climates,languages, and economic makeup. Successfulbrands establishing a connection with theIndian consumers have more often than notshown sensitivity towards these heterogeneouscontexts. The Indian retailer has to innovate inorder to create new demand and capture theexisting one. Retail brands in India haverealized this and are gearing up to meet withthis challenge. There has been an attempt toreflect the cultural consciousness and economictendencies behind the shopping orientations oftheir customers. Shopping in India had alwaysbeen a frenzied activity, whether it was thehigh-street shops in central marketplaces or thesmall mom-and-pop stores in the busy streets.One of the biggest factors contributing to thegrowth and promising the same in the years tocome is the new avtar of Indian consumerism.Favorable demographics, combined withincreas ing d i sposab le incomes , areprogressively changing the face of Indianconsumerism. The economics of Indianconsumerism is buoyant, with India ranking asthe fourth largest economy in terms ofPurchasing Power Parity (PPP), next only toUnited States, Japan and China. India isexpected to outplace Japan by 2010 (A C NielsenResearch 2007).
Thanks to the rapid growth o furbanization, the Indian consumer is graduallymaking a shift from the local “mom & pop storeshopping” to “newly developed mall shopping”.With a number of domestic and internationalbrands available in stores in metros andsmaller cities and with a wide range of productofferings from food and grocery to furniture andfixtures, the Indian consumer is fast embracingmodern retail.
The past or the traditional strategy waslargely dependent on low price andconvenience. The current strategies are morebased on value, customer relationship andcustomer experience. It is essential to know
what the customer expects or what “value” tohim is and once the offer is made it in a mannerin which the retailer has an edge over thecompetitor, then there is no reason why theformer should not be a winner.
This work of ours has revealed someimportant variables which can be furtherworked to construct a branding framework foreffectiveness in an emerging area like retailing.There can be further study to understand:
- Whether the variables identified from theemployees prospects can be studied from thecustomers' point- of- view for a specificconclusion.
- Whether there is a significant relationshipsbetween the groups of variable, viz. 'Shoppingexperience', 'Brands and merchandises' and'Image building efforts'
- Whether these variables help in formulatinga framework of branding dimension foreffectiveness in retailing.
The constructs explored for understanding theDNA of a brand in the organized retailing inIndia can be having a strategic impact ifformulated in an effective manner and at thesame time it can also lead to academic researchin the same direction to fillip the brandingefforts of retailer as well.
Reference/ Bibliography
[1] Retail Trade, Deloitte Touche Tohmatsu,2007
[2] What is a Brand? A Chapter from Brandsand Branding. An Economist BookInterbrand 2004
[3] Kevin Lane Keller. Strategic BrandManagement Building, Measuring, andManaging Brand Equity, PHI PrivateLimited. 2003
[4] D L Huff. Defining and estimating atrading area. The Journal of Marketing,JSTOR (1964)
[5] D R Bell, T H Ho and C S Tang.Determining where to shop: fixed and
Volume 2 Issue 1 Branding imperatives in Indian Organized Retailing: an Exploratory Study

variable costs of shopping. Journal ofMarketing Research, JSTRO (1998)
[6] J A Russel and A Mehrabian. Evidence for athree-factor-theory of emotions. Journal ofResearch in Personality. Elsevier (1977)
[7] Julie Baker, A. Parasuraman, DhruvGrewal, Glenn B. Voss. The Influence ofMultiple Store Environment Cues onPerceived Merchandise Value andPatronage In tent i ons . Amer i canMarketing Association (2002)
[8] F E Brown. Price image versus price reality.Journal of Marketing Research. JSTOR(1969)
[9] K K Desai and D Talukdar. Relationshipbetween product groups' price perceptions,shopper's basket size, and grocery store'soverall store price image. Psychology andMarketing. Willey (2003
[10] DR Bell & JM Lattin. Shopping Behaviorand Consumer Preference for Store PriceFormat: Why “Large Basket” ShoppersPrefer EDLPMarketing Science. JSTOR(1998
[11] V Kumar & RP Leone. Measuring the effectof retail store promotions on brand andstore substitution. Journal of MarketingResearch. JSTOR (1988)
[12] PR Messinger and C Narasimhan. A modelof retail formats based on consumers'economizing on shopping time. MarketingScience. JSTOR (1997)
[13] L McAlister & E Pessemier. Variety seekingbehavior: An interdisciplinary review.Journal of Consumer Research. JSTOR(1982
[14] BE Kahn. Consumer variety-seekingamong goods and services: An integrativereview. Journal of Retailing and ConsumerServices. Elsevier (1995)
[15] BE Kahn & B Wansink. The influence ofassortment structure on perceived varietyand consumption quantities. Journal ofConsumer Research. UChicago Press(2004)
[16] SJ Hoch & S Banerji. When do privatelabels succeed. Sloan Management Review
(1993)
[17] VR Nijs , MG Dekimpe & JBEMSteenkamp. The category-demand effectsof price promotions. Marketing Science.JSTOR (2001)
[18] P Richardson, AK Jain & A Dick. Theinfluence of store aesthetics on evaluationof private label brands. Journal of Product& Brand Management. Emeraldinsight(1996)
[19] David E. Mills. Why Retailers Sell PrivateLabels . Journal of Economics &Management Strategy. Willey InterScience(1995))
[20] SJ Hoch, AL Montgomery & YH Park. Longterm growth trends in private label marketshare. Citeseer (2004)
[21] I Simonson. The effect of productassortment on buyer preference. Journal ofRetailing. Elsevier (1999)
[22] A C Nielsen Research 2007
[23] KL Ailawadi, DR Lehmann and SA Neslin.Revenue Premium as an outcome measureof brand equity. Journal of Marketing.American Marketing Association (2003)
Indian Retail Report, IMAGES (2011)
Volume 2 Issue 1 IAPOTHEOSIS : Tirpude's National Journal of Business Research (TNJBR)
[48]
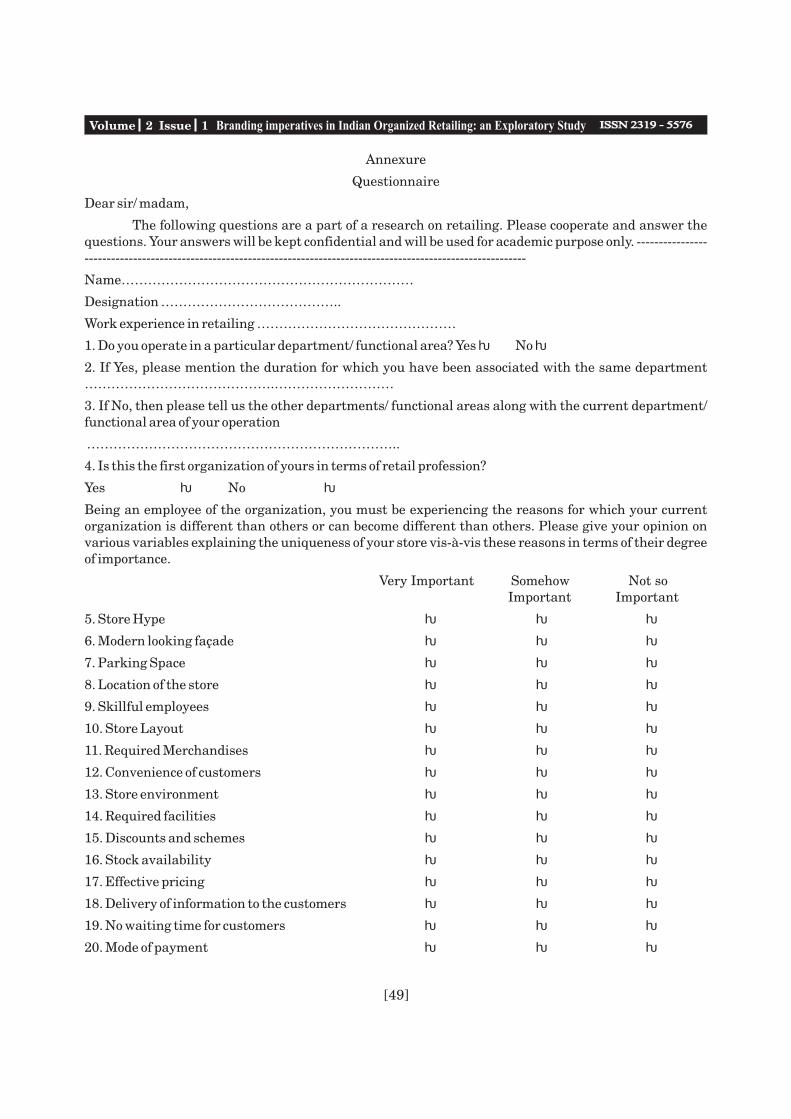
Annexure
Questionnaire
Dear sir/ madam,
The following questions are a part of a research on retailing. Please cooperate and answer thequestions. Your answers will be kept confidential and will be used for academic purpose only. --------------------------------------------------------------------------------------------------------------------
Name…………………………………………………………
Designation …………………………………..
Work experience in retailing ………………………………………
1. Do you operate in a particular department/ functional area? Yes □ No □
2. If Yes, please mention the duration for which you have been associated with the same department…………………………………….………………………
3. If No, then please tell us the other departments/ functional areas along with the current department/functional area of your operation
……………………………………………………………..
4. Is this the first organization of yours in terms of retail profession?
Yes □ No □
Being an employee of the organization, you must be experiencing the reasons for which your currentorganization is different than others or can become different than others. Please give your opinion onvarious variables explaining the uniqueness of your store vis-à-vis these reasons in terms of their degreeof importance.
Very Important Somehow Not so Important Important
5. Store Hype □ □ □
6. Modern looking façade □ □ □
7. Parking Space □ □ □
8. Location of the store □ □ □
9. Skillful employees □ □ □
10. Store Layout □ □ □
11. Required Merchandises □ □ □
12. Convenience of customers □ □ □
13. Store environment □ □ □
14. Required facilities □ □ □
15. Discounts and schemes □ □ □
16. Stock availability □ □ □
17. Effective pricing □ □ □
18. Delivery of information to the customers □ □ □
19. No waiting time for customers □ □ □
20. Mode of payment □ □ □
Volume 2 Issue 1 Branding imperatives in Indian Organized Retailing: an Exploratory Study
[49]

21. Established brands
22. Private labels □ □ □
23. Substantial product range □ □ □
24. Cash rich customers □ □ □
25. In store events □ □ □
26. Returns and exchanges □ □ □
27. Query handling skills □ □ □
28. Motivated employees □ □ □
29. Home delivery facilities □ □ □
30. After sales service □ □ □
31. Loyal Customers □ □ □
32. Post- purchase relationships □ □ □
33. New arrivals □ □ □
34. One stop solution □ □ □
35. Sales effort □ □ □
36. Innovations on the floor □ □ □
37. Unique advertisements □ □ □
……Thank you…..
□ □ □
Volume 2 Issue 1 APOTHEOSIS : Tirpude's National Journal of Business Research (TNJBR)
[50]
Abstract : India offers attractive investment opportunities for foreign companies and has adopted anumber of policies to attract foreign direct investment into the country and the country seems to offerperhaps one of the most liberal FDI regimes in Asia. As a result, during the last two decade FDIinflows in India has increased considerably by 0.042 in 1980 to 2.8 in 2009 as a percentage of GDP.However, previous literature suggests that the FDI inflows have a positive impact on economic growthof host countries. This paper focuses on the FDI-led growth hypothesis in the case of India. This paperanalyzes trends in foreign direct investment (FDI) in India during the years surrounding three major,recent economic downturns. It first found that FDI flows inward generally continued upward trendsduring periods of Asian financial crisis surrounding 1998, and were also observed in surroundingsubsequent downturns in 2001 and 2009. Second relatively strong, negative (-0.5 or less) correlationsbetween trends in FDI-GDP ratios and economic growth were common among inward FDI flows in1996-2000 and in 2007-2009. On the other hand, positive correlations were not very common. It's evenreviewed that the investment climate has not improved in India as a result of lack of good governance,corruption, political instability and disturbance, bureaucratic inertia, and poor low and ordersituation.
[51]
* Associate Prof. ASM's IBMR- Chinchwad** Associate Prof. ASM's IBMR- Chinchwad
Volume 2 Issue 1 Recent Economic Downturns And Foreign Direct Investment Relationship With Economic Growth Of India
Key Words: FDI inflows, Economic Growth, India, GDP,
Recent Economic Downturns And Foreign Direct Investment
Relationship With Economic Growth Of India
Mr. Rakesh Kumar Bhati*, Col R K Puni,**
1. Introduction
The relationship between foreign directinvestment (FDI) and economic growth is awell-studied subject in the developmenteconomics literature, both theoretically andempirically. Despite the considerable volume ofresearch on the subject, there is conflictingevidence in the literature regarding thequestion as to how FDI relates to economicgrowth. Economic growth is conventionallymeasured as the percentage increase in GrossDomestic Product (GDP) or Gross NationalProduct (GNP) during one year. FDI eludesdefinition owing to the presence of manyauthorities: Organisation for Economic Co-operation and Development (OCED),International Monetary Fund (IMF),International Bank for Reconstruction andDevelopment (IBRD) and United NationsConference on Trade and Development(UNCTAD). All these bodies attempt toillustrate the nature of FDI with certainmeasuring methodologies. As per the PlanningCommission of India (2002) FDI refers to capital
inflows from abroad that invest in theproduction capacity of the economy and areusually preferred over other forms of externalfinance because they are non-debt creating,non-volatile and their returns depend on theperformance of the projects financed by theinvestors.
In this paper, we do not intend topresume how each of the two variables affectsthe other. Rather, our purpose is to test for thecausal relationship between FDI flow andeconomic growth of India. A major outcome ofthe economic reforms process from 1990sthrough lowering of barriers to trade andinvestment aimed at opening up the economyand embracing globalization has led totremendous increase in Foreign DirectInvestment inflows into India. The governmentis in the process of fine tuning FDI rules in orderto make India more attractive as FDIdestination. FDI inflows to India continued toincrease over the last decade as a result ofinvestment favorable policies adopted by thesuccessive government. Since the beginning of
[52]
Volume 2 Issue 1 APOTHEOSIS : Tirpude's National Journal of Business Research (TNJBR)
the 90's decade, the annual value of FDI inflowsto India has started to continue with anincreasing rate when compared to 80's decade.This kind of upward movement of FDI isinterpreted as an outcome of the liberalizationreforms. The incentives under structuraladjustment and stabilization programmeimplemented in 1990s were of great importancein generating a surge in FDI.
Foreign direct investment (FDI) is amajor component of capital flow for economicgrowth. Borensztein, De Gregorio, Lee, (1998)pointed out that FDI is considered importantdriver for economic development particularlyfor the developing countries were as Seetanahand Khadaroo, (2007) pointed out that the hostcountry must satisfy certain preconditions inorder to absorb and retain these benefits andnot all emerging markets possess suchqualities. India an emerging market requiresFDI to assist in alleviating some of its so-cioeconomic problems, such as unemployment,high level of unskilled labour and financecapital deficits. The Indian economy had beenaffected by the global financial meltdown as toattract FDI. Foreign direct investment (FDI)slumped 48 per cent to $1.04bn (£642m) inJanuary 2011 from $2.04bn (£1.25bnm) in thesame month last year. FDI in India has beendropping amid concerns over corruption,bureaucratic delays, rising inflation andperceived government resistance to opening upthe economy. In 2009-10, the country's FDI haddeclined to $25.88bn (£15.96bn) from $27.33(£16.86bn) in the previous financial year. Acasual look at the data does not reveal anyclearly discernible pattern involving GDPgrowth and FDI. However, it seems consistentwith a positive correlation between the twovariables.
2. Objectives
FDI and economic growth aredependent on a wide variety of factors, coveringeconomic factors to sociopolitical factors. FDI isvery much dependent upon foreign investors'perception on the status of the targeted country.
These perceptions are made up of partly,economic factors, as well as socio-economicfactors such as unemployment and politicalstability. Strong economic growth in the hostcountry attracts FDI, but the host country isrequired to have good infrastructure capacity,sophisticated human capital in order to takeadvantage. The main objectives of the paper are
1. To have a better understanding of therelationship between FDI and economicgrowth.
2. To examine whether higher FDI inflow caninduce economic growth.
3. To observe the relationship betweeneconomic growths as measured by GDPgrowth, with the change in FDI inflow intoIndia.
3. Hypothesis
The literature review thus far indicatesthat these factors are interdependent;therefore, the following hypotheses can bederived i.e. FDI-led growth.
It is hypothesized that the change ineconomic growth, as measured in GDP, willcause a change in FDI inflow,
H: FDI t+i = 1 GDP å1
å1 denotes a correction factor. All other factors that caninfluence FDI inflow are assumed to be included in thiscorrection factor. ë1 denotes the slope and i denotes thetime for the market to react to the changes.Furthermore, it can be hypothesised that this is apositive relationship, i.e. ë is positive.
4. Data Collection
This research paper is depended largelyon secondary data obtained from the IMFDatabase
(DIPP). Additional data were obtainedfrom the World Bank, the World Fact book aspublished by the Central Intelligent Agency
D lDt+
and Department of Industrial Policy& Promotion Ministry of Commerce andIndustry
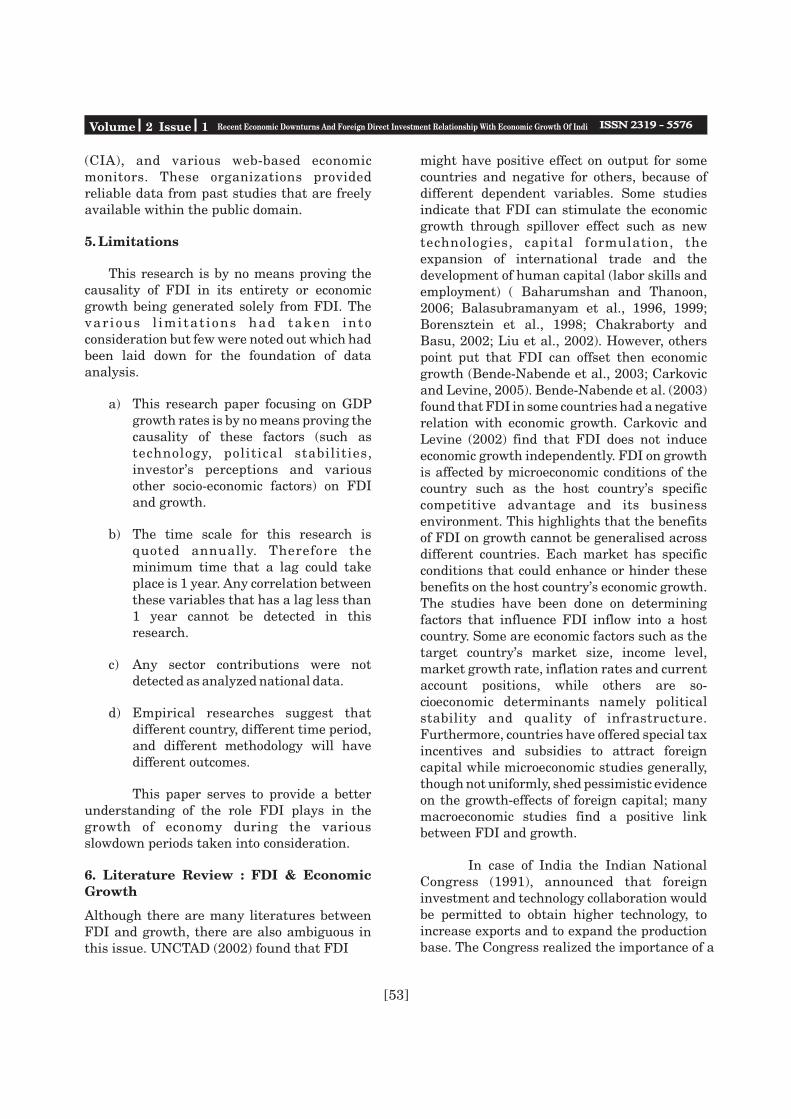
[53]
(CIA), and various web-based economicmonitors. These organizations providedreliable data from past studies that are freelyavailable within the public domain.
5. Limitations
This research is by no means proving thecausality of FDI in its entirety or economicgrowth being generated solely from FDI. Thevar ious l imitat ions had taken intoconsideration but few were noted out which hadbeen laid down for the foundation of dataanalysis.
a) This research paper focusing on GDPgrowth rates is by no means proving thecausality of these factors (such astechnology, political stabilities,investor's perceptions and variousother socio-economic factors) on FDIand growth.
b) The time scale for this research isquoted annually. Therefore theminimum time that a lag could takeplace is 1 year. Any correlation betweenthese variables that has a lag less than1 year cannot be detected in thisresearch.
c) Any sector contributions were not detected as analyzed national data.
d) Empirical researches suggest thatdifferent country, different time period,and different methodology will havedifferent outcomes.
This paper serves to provide a betterunderstanding of the role FDI plays in thegrowth of economy during the variousslowdown periods taken into consideration.
6. Literature Review : FDI & EconomicGrowth
Although there are many literatures betweenFDI and growth, there are also ambiguous inthis issue. UNCTAD (2002) found that FDI
might have positive effect on output for somecountries and negative for others, because ofdifferent dependent variables. Some studiesindicate that FDI can stimulate the economicgrowth through spillover effect such as newtechnologies, capital formulation, theexpansion of international trade and thedevelopment of human capital (labor skills andemployment) ( Baharumshan and Thanoon,2006; Balasubramanyam et al., 1996, 1999;Borensztein et al., 1998; Chakraborty andBasu, 2002; Liu et al., 2002). However, otherspoint put that FDI can offset then economicgrowth (Bende-Nabende et al., 2003; Carkovicand Levine, 2005). Bende-Nabende et al. (2003)found that FDI in some countries had a negativerelation with economic growth. Carkovic andLevine (2002) find that FDI does not induceeconomic growth independently. FDI on growthis affected by microeconomic conditions of thecountry such as the host country's specificcompetitive advantage and its businessenvironment. This highlights that the benefitsof FDI on growth cannot be generalised acrossdifferent countries. Each market has specificconditions that could enhance or hinder thesebenefits on the host country's economic growth.The studies have been done on determiningfactors that influence FDI inflow into a hostcountry. Some are economic factors such as thetarget country's market size, income level,market growth rate, inflation rates and currentaccount positions, while others are so-cioeconomic determinants namely politicalstability and quality of infrastructure.Furthermore, countries have offered special taxincentives and subsidies to attract foreigncapital while microeconomic studies generally,though not uniformly, shed pessimistic evidenceon the growth-effects of foreign capital; manymacroeconomic studies find a positive linkbetween FDI and growth.
In case of India the Indian NationalCongress (1991), announced that foreigninvestment and technology collaboration wouldbe permitted to obtain higher technology, toincrease exports and to expand the productionbase. The Congress realized the importance of a
Volume II Issue II Recent Economic Downturns And Foreign Direct Investment Relationship With Economic Growth Of IndiaVolume 2 Issue 1 Recent Economic Downturns And Foreign Direct Investment Relationship With Economic Growth Of India
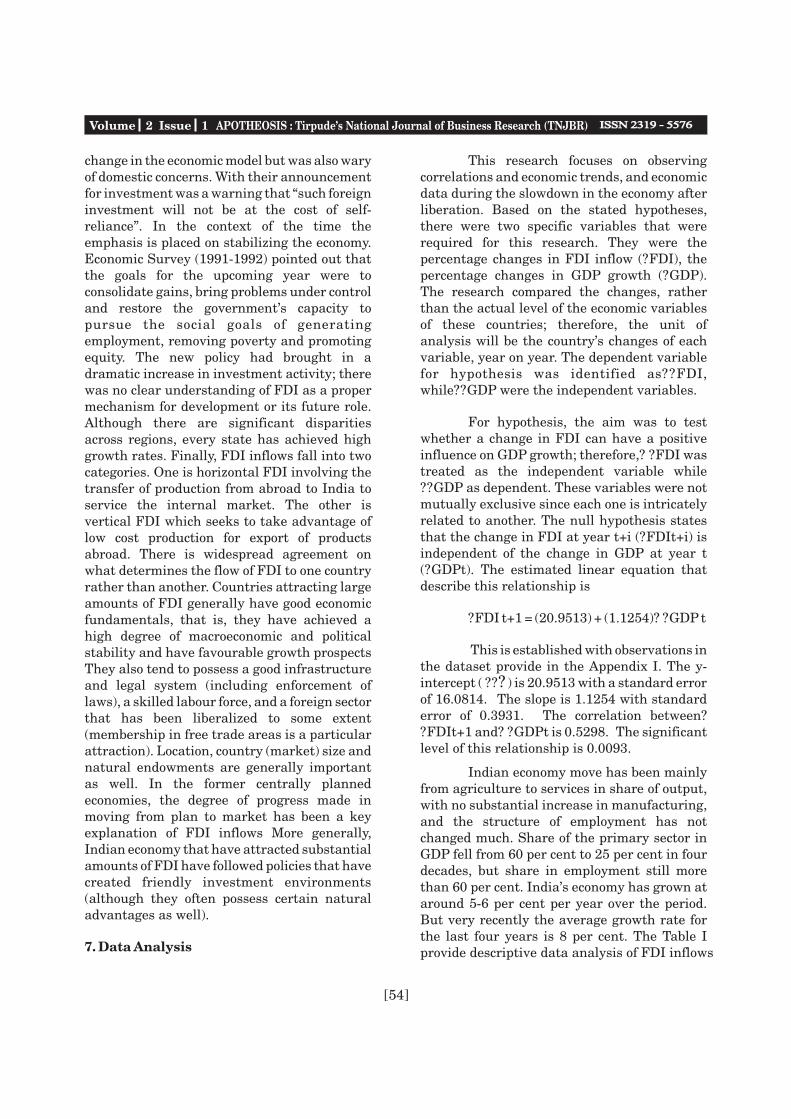
[54]
change in the economic model but was also waryof domestic concerns. With their announcementfor investment was a warning that “such foreigninvestment will not be at the cost of self-reliance”. In the context of the time theemphasis is placed on stabilizing the economy.Economic Survey (1991-1992) pointed out thatthe goals for the upcoming year were toconsolidate gains, bring problems under controland restore the government's capacity topursue the social goals of generatingemployment, removing poverty and promotingequity. The new policy had brought in adramatic increase in investment activity; therewas no clear understanding of FDI as a propermechanism for development or its future role.Although there are significant disparitiesacross regions, every state has achieved highgrowth rates. Finally, FDI inflows fall into twocategories. One is horizontal FDI involving thetransfer of production from abroad to India toservice the internal market. The other isvertical FDI which seeks to take advantage oflow cost production for export of productsabroad. There is widespread agreement onwhat determines the flow of FDI to one countryrather than another. Countries attracting largeamounts of FDI generally have good economicfundamentals, that is, they have achieved ahigh degree of macroeconomic and politicalstability and have favourable growth prospectsThey also tend to possess a good infrastructureand legal system (including enforcement oflaws), a skilled labour force, and a foreign sectorthat has been liberalized to some extent(membership in free trade areas is a particularattraction). Location, country (market) size andnatural endowments are generally importantas well. In the former centrally plannedeconomies, the degree of progress made inmoving from plan to market has been a keyexplanation of FDI inflows More generally,Indian economy that have attracted substantialamounts of FDI have followed policies that havecreated friendly investment environments(although they often possess certain naturaladvantages as well).
7. Data Analysis
This research focuses on observingcorrelations and economic trends, and economicdata during the slowdown in the economy afterliberation. Based on the stated hypotheses,there were two specific variables that wererequired for this research. They were thepercentage changes in FDI inflow (?FDI), thepercentage changes in GDP growth (?GDP).The research compared the changes, ratherthan the actual level of the economic variablesof these countries; therefore, the unit ofanalysis will be the country's changes of eachvariable, year on year. The dependent variablefor hypothesis was identified as??FDI,while??GDP were the independent variables.
For hypothesis, the aim was to testwhether a change in FDI can have a positiveinfluence on GDP growth; therefore,? ?FDI wastreated as the independent variable while??GDP as dependent. These variables were notmutually exclusive since each one is intricatelyrelated to another. The null hypothesis statesthat the change in FDI at year t+i (?FDIt+i) isindependent of the change in GDP at year t(?GDPt). The estimated linear equation thatdescribe this relationship is
?FDI t+1 = (20.9513) + (1.1254)? ?GDP t
This is established with observations inthe dataset provide in the Appendix I. The y-intercept ( ??? ) is 20.9513 with a standard errorof 16.0814. The slope is 1.1254 with standarderror of 0.3931. The correlation between??FDIt+1 and? ?GDPt is 0.5298. The significantlevel of this relationship is 0.0093.
Indian economy move has been mainlyfrom agriculture to services in share of output,with no substantial increase in manufacturing,and the structure of employment has notchanged much. Share of the primary sector inGDP fell from 60 per cent to 25 per cent in fourdecades, but share in employment still morethan 60 per cent. India's economy has grown ataround 5-6 per cent per year over the period.But very recently the average growth rate forthe last four years is 8 per cent. The Table Iprovide descriptive data analysis of FDI inflows
Volume 2 Issue 1 APOTHEOSIS : Tirpude's National Journal of Business Research (TNJBR)

[55]
and economic growth. FDI is found to have apositive effect on economic growth.
In all specifications the average annualgrowth rate of real GDP per capita over theperiod 1995 to 2009 is used as the dependentvariable. It is represented by the inflows of FDIas a percentage of GDP. The empirical part ofthe paper attempts to verify whether FDIinflows enhance economic growth. Analyzing
the data allows us to see whether the effects ofFDI on economic growth are stronger or weakerin Indian economy thus answering theobjectives of the study.
TABLE I: RATIOS OF ANNUAL INWARD FDI FLOWS TO GDP (PERCENT), ANDCORRELATION COEFFICEINTS WITH GDP GROWTH RATES
Year Ratios Of Annual Inward FDI Flows To GDP (Percent) 1995 0.606 1996 0.665 1997 0.876 1998 0.64 1999 0.493 2000 0.776 2001 1.157 2002 1.137 2003 0.754 2004 0.862 2005 0.97 2006 2.323 2007 2.315 2008 3.424 2009 2.755
CORRELATIONS OF ANNUAL INWARD FDI-GDP RATIOS 1996-2000AND CONCURRENT OR LAGGED GROWTH RATES
Real GDP -0.93 Lagged -0.43
Nom. GDP$ -0.46 Lagged 0.02
CORRELATIONS OF ANNUAL INWARD FDI-GDP RATIOS 1999-2003AND CONCURRENT OR LAGGED GROWTH RATES
Real GDP -0.93 Lagged -0.43
Nom. GDP$ -0.46 Lagged 0.29
CORRELATIONS OF ANNUAL INWARD FDI-GDP RATIOS 2007-2009AND CONCURRENT OR LAGGED GROWTH RATES
Real GDP -0.4 Lagged -0.05
Nom. GDP$ -0.6 Lagged 0.87
Table I : Ratios Of Annual Inward FDI Flows To GDP (Percent), AndCorrelation Coneffieints With GDP Growth Rates
Volume II Issue II Recent Economic Downturns And Foreign Direct Investment Relationship With Economic Growth Of IndiaVolume 2 Issue 1 Recent Economic Downturns And Foreign Direct Investment Relationship With Economic Growth Of India
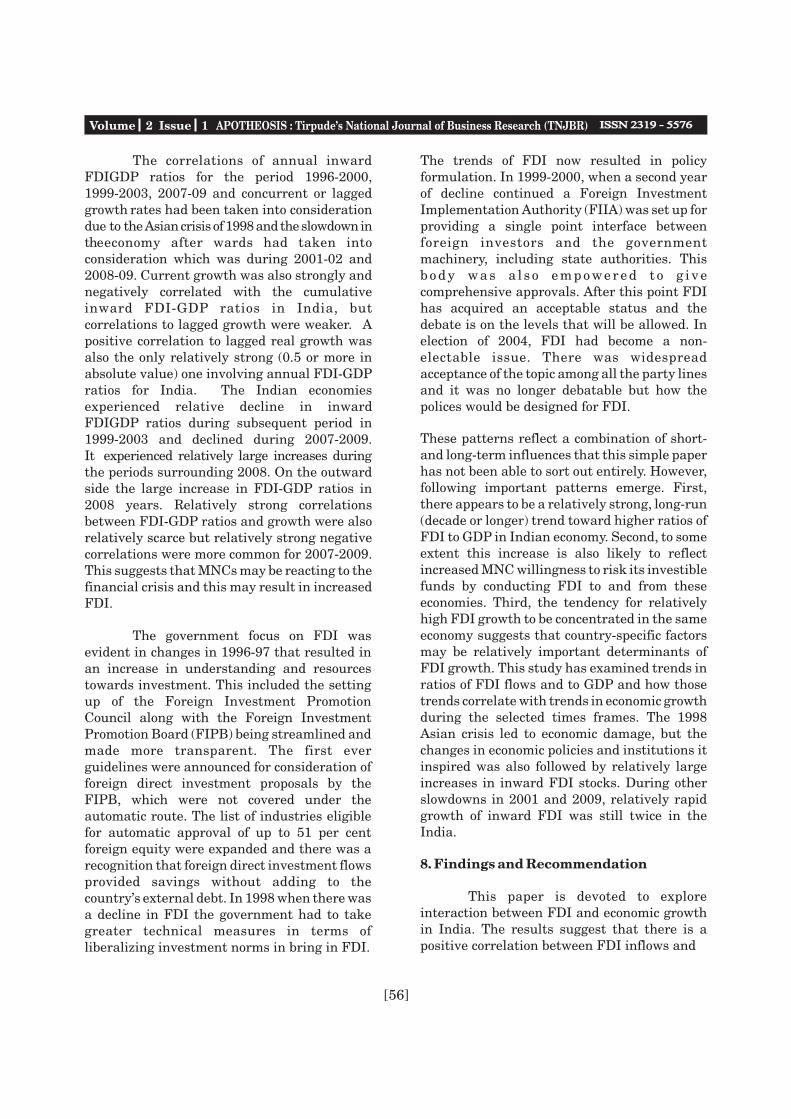
[56]
The correlations of annual inward FDIGDP ratios for the period 1996-2000, 1999-2003, 2007-09 and concurrent or lagged growth rates had been taken into consideration due to the Asian crisis of 1998 and the slowdown in theeconomy after wards had taken intoconsideration which was during 2001-02 and2008-09. Current growth was also strongly andnegatively correlated with the cumulativeinward FDI-GDP ratios in India, butcorrelations to lagged growth were weaker. Apositive correlation to lagged real growth wasalso the only relatively strong (0.5 or more inabsolute value) one involving annual FDI-GDPratios for India. The Indian economiesexperienced relative decline in inward FDIGDP ratios during subsequent period in 1999-2003 and declined during 2007-2009. It experienced relatively large increases duringthe periods surrounding 2008. On the outwardside the large increase in FDI-GDP ratios in2008 years. Relatively strong correlationsbetween FDI-GDP ratios and growth were alsorelatively scarce but relatively strong negativecorrelations were more common for 2007-2009.This suggests that MNCs may be reacting to thefinancial crisis and this may result in increasedFDI.
The government focus on FDI wasevident in changes in 1996-97 that resulted inan increase in understanding and resourcestowards investment. This included the settingup of the Foreign Investment PromotionCouncil along with the Foreign InvestmentPromotion Board (FIPB) being streamlined andmade more transparent. The first everguidelines were announced for consideration offoreign direct investment proposals by theFIPB, which were not covered under theautomatic route. The list of industries eligiblefor automatic approval of up to 51 per centforeign equity were expanded and there was arecognition that foreign direct investment flowsprovided savings without adding to thecountry's external debt. In 1998 when there wasa decline in FDI the government had to takegreater technical measures in terms ofliberalizing investment norms in bring in FDI.
The trends of FDI now resulted in policyformulation. In 1999-2000, when a second yearof decline continued a Foreign InvestmentImplementation Authority (FIIA) was set up forproviding a single point interface betweenforeign investors and the governmentmachinery, including state authorities. Thisb o d y w a s a l s o e m p o w e r e d t o g i v ecomprehensive approvals. After this point FDIhas acquired an acceptable status and thedebate is on the levels that will be allowed. Inelection of 2004, FDI had become a non-electable issue. There was widespreadacceptance of the topic among all the party linesand it was no longer debatable but how thepolices would be designed for FDI.
These patterns reflect a combination of short-and long-term influences that this simple paperhas not been able to sort out entirely. However,following important patterns emerge. First,there appears to be a relatively strong, long-run(decade or longer) trend toward higher ratios ofFDI to GDP in Indian economy. Second, to someextent this increase is also likely to reflectincreased MNC willingness to risk its investiblefunds by conducting FDI to and from theseeconomies. Third, the tendency for relativelyhigh FDI growth to be concentrated in the sameeconomy suggests that country-specific factorsmay be relatively important determinants ofFDI growth. This study has examined trends inratios of FDI flows and to GDP and how thosetrends correlate with trends in economic growthduring the selected times frames. The 1998Asian crisis led to economic damage, but thechanges in economic policies and institutions itinspired was also followed by relatively largeincreases in inward FDI stocks. During otherslowdowns in 2001 and 2009, relatively rapidgrowth of inward FDI was still twice in theIndia.
8. Findings and Recommendation
This paper is devoted to exploreinteraction between FDI and economic growthin India. The results suggest that there is apositive correlation between FDI inflows and
Volume 2 Issue 1 APOTHEOSIS : Tirpude's National Journal of Business Research (TNJBR)
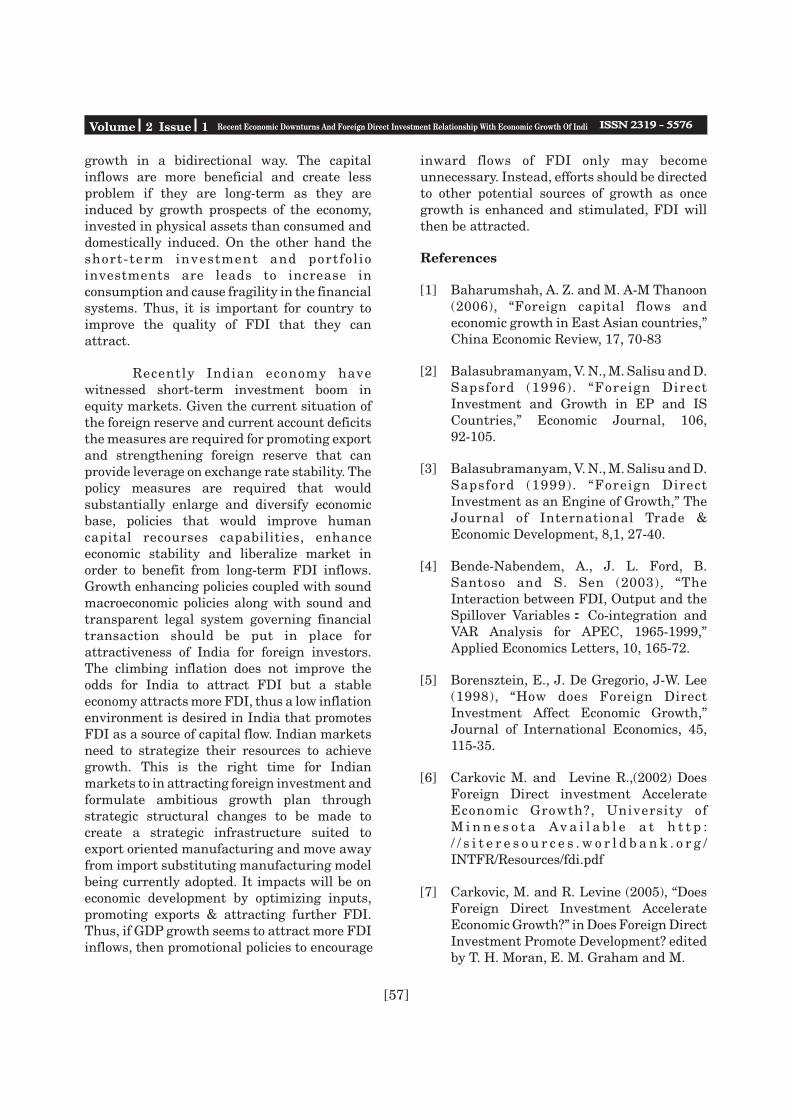
[57]
growth in a bidirectional way. The capitalinflows are more beneficial and create lessproblem if they are long-term as they areinduced by growth prospects of the economy,invested in physical assets than consumed anddomestically induced. On the other hand theshort-term investment and portfol ioinvestments are leads to increase inconsumption and cause fragility in the financialsystems. Thus, it is important for country toimprove the quality of FDI that they canattract.
Recently Indian economy havewitnessed short-term investment boom inequity markets. Given the current situation ofthe foreign reserve and current account deficitsthe measures are required for promoting exportand strengthening foreign reserve that canprovide leverage on exchange rate stability. Thepolicy measures are required that wouldsubstantially enlarge and diversify economicbase, policies that would improve humancapital recourses capabilities, enhanceeconomic stability and liberalize market inorder to benefit from long-term FDI inflows.Growth enhancing policies coupled with soundmacroeconomic policies along with sound andtransparent legal system governing financialtransaction should be put in place forattractiveness of India for foreign investors.The climbing inflation does not improve theodds for India to attract FDI but a stableeconomy attracts more FDI, thus a low inflationenvironment is desired in India that promotesFDI as a source of capital flow. Indian marketsneed to strategize their resources to achievegrowth. This is the right time for Indianmarkets to in attracting foreign investment andformulate ambitious growth plan throughstrategic structural changes to be made tocreate a strategic infrastructure suited toexport oriented manufacturing and move awayfrom import substituting manufacturing modelbeing currently adopted. It impacts will be oneconomic development by optimizing inputs,promoting exports & attracting further FDI.Thus, if GDP growth seems to attract more FDIinflows, then promotional policies to encourage
inward flows of FDI only may becomeunnecessary. Instead, efforts should be directedto other potential sources of growth as oncegrowth is enhanced and stimulated, FDI willthen be attracted.
References
[1] Baharumshah, A. Z. and M. A-M Thanoon(2006), “Foreign capital flows andeconomic growth in East Asian countries,”China Economic Review, 17, 70-83
[2] Balasubramanyam, V. N., M. Salisu and D.Sapsford (1996). “Foreign DirectInvestment and Growth in EP and ISCountries,” Economic Journal, 106, 92-105.
[3] Balasubramanyam, V. N., M. Salisu and D.Sapsford (1999). “Foreign DirectInvestment as an Engine of Growth,” TheJournal of International Trade &Economic Development, 8,1, 27-40.
[4] Bende-Nabendem, A., J. L. Ford, B.Santoso and S. Sen (2003), “TheInteraction between FDI, Output and theSpillover Variables: Co-integration andVAR Analysis for APEC, 1965-1999,”Applied Economics Letters, 10, 165-72.
[5] Borensztein, E., J. De Gregorio, J-W. Lee(1998), “How does Foreign DirectInvestment Affect Economic Growth,”Journal of International Economics, 45,115-35.
[6] Carkovic M. and Levine R.,(2002) DoesForeign Direct investment AccelerateEconomic Growth?, University ofM i n n e s o t a Av a i l a b l e a t h t t p :/ / s i t e r e s o u r c e s . w o r l d b a n k . o r g /INTFR/Resources/fdi.pdf
[7] Carkovic, M. and R. Levine (2005), “DoesForeign Direct Investment AccelerateEconomic Growth?” in Does Foreign DirectInvestment Promote Development? editedby T. H. Moran, E. M. Graham and M.
Volume II Issue II Recent Economic Downturns And Foreign Direct Investment Relationship With Economic Growth Of IndiaVolume 2 Issue 1 Recent Economic Downturns And Foreign Direct Investment Relationship With Economic Growth Of India

[58]
Blomstrom, Institute for InternationalE c o n o m i c s , C e n t e r f o r G l o b a lDevelopment.
[8] Chakraborty, C. and P. Basu (2002),“Foreign Direct Investment and Growth inIndia: a Cointegrating Approach,”Applied Economics, 34, 1061-73.
[9] Economic Department, Ministry ofFinance & Company Affairs. 1992.Economic Survey 1991-1992. New Delhi:Ministry of Finance & Company Affairs,Government of India. p. 2.
[10] Economic Department, Ministry ofFinance & Company Affairs. 1992.Economic Survey 1996-1997. New Delhi:Ministry of Finance & Company Affairs,Government of India. Available ath t t p : / / i n d i a b u d g e t . n i c . i n / e s 9 6-97/CHAPT7.HTM.
Electronic Sources
1] The World Bank: www.worldbank.org
2 ] Wo r l d D e v e l o p m e n t I n d i c a t o r s :http://go.worldbank.org/3JU2HA60D0
3] IMF:http://www.imf.org/external/pubs/ft/bopman/bopman.pdf
4] UNCTAD: http://www.unctad.org
5]DIPP:http://dipp.nic.in/fdi_statistics/india_fdi_index.htm
Volume 2 Issue 1 APOTHEOSIS : Tirpude's National Journal of Business Research (TNJBR)

[59]
APPENDIX –I ANNUAL GROWTH RATES OF REAL GDP , NOMINAL GDP ,ANNUAL
INWARD FDI FLOWS IN INDIAN ECONOMY, 1980-2009
MEASURE Annual Growth Rates of
Real GDP (percent) Nominal GDP in US$
(billions) Annual Inward FDI
Flows in US$ (billions)
YEAR1980 3.6 177 0.000 1981 6.2 190 0.000 1982 4.1 197 0.000 1983 6.4 213 0.000 1984 4.6 213 0.000 1985 4.9 221 0.000 1986 4.9 243 0.000 1987 4.2 268 0.000 1988 8.3 293 0.000 1989 6.8 291 0.000 1990 5.6 314 0.000 1991 2.1 279 0.074 1992 4.4 281 0.277 1993 4.9 275 0.550 1994 6.2 312 0.973 1995 7.4 354 2.144 1996 7.6 365 2.426 1997 4.6 408 3.577 1998 6.0 412 2.635 1999 6.9 439 2.169 2000 5.7 462 3.584 2001 3.9 473 5.472 2002 4.6 495 5.626 2003 6.9 573 4.323 2004 7.9 669 5.771 2005 9.2 784 7.606 2006 9.8 875 20.336 2007 9.4 1101 25.483 2008 7.3 1207 41.315 2009 5.4 1243 34.229 Source: International Monetary Fund
Appendix - I Annual Growth Rates Of Real GDP, Nominal GDP, Annual
Inward FDI Flows In Indian Economy, 1980 - 2009
Volume 2 Issue 1 Recent Economic Downturns And Foreign Direct Investment Relationship With Economic Growth Of India

[60]
APPENDIX –I A INWARD FOREIGN DIRECT INVESTMENT FLOWS IN INDIAN ECONOMY, ANNUAL,
1980-2009
MEASURE Percentage oftotal world
Percentageof imports
Percentageof exports
Percentage ofGross DomesticProduct
Percentage ofGross FixedCapital Formation
YEAR 1980 0.146385 0.532548 0.922015 0.042845 0.2075741981 0.132131 0.596179 1.108097 0.046641 0.221721982 0.124149 0.487485 0.77026 0.03582 0.1669621983 0.01122 0.040112 0.061655 0.002569 0.012481984 0.03385 0.12598 0.203569 0.008847 0.042041985 0.190017 0.66606 1.160778 0.046847 0.2119341986 0.136394 0.763435 1.252585 0.047449 0.209661987 0.15546 1.27326 1.879287 0.077326 0.334031988 0.05567 0.477706 0.689538 0.030041 0.1298971989 0.12773 1.2268 1.588382 0.083832 0.3487581990 0.113959 1.003791 1.317206 0.072428 0.2927591991 0.048698 0.366788 0.423088 0.025891 0.1094961992 0.151832 1.068766 1.283913 0.086623 0.3602781993 0.23808 2.334521 2.466206 0.187334 0.813691994 0.380303 3.628547 3.892606 0.299377 1.2710561995 0.627948 6.197615 7.022527 0.582548 2.227861996 0.649103 6.654859 7.627224 0.648819 2.6520151997 0.743921 8.734815 10.33761 0.856421 3.6765531998 0.372321 6.126119 7.87451 0.619131 2.6826541999 0.199356 4.614808 6.078499 0.478189 1.9779032000 0.256017 6.963874 8.466373 0.767012 3.2738332001 0.663731 10.86999 12.63261 1.134162 4.6793152002 0.896282 9.961058 11.17619 1.114905 4.5688672003 0.763793 5.955366 7.328467 0.730736 2.8252742004 0.78889 5.790813 7.538047 0.831362 2.794242005 0.773159 5.335804 7.650873 0.937117 2.9126652006 1.39314 11.38976 16.68864 2.230447 6.6089422007 1.190546 10.93252 16.67288 2.188595 6.2311122008 2.282399 12.59984 20.77735 3.223517 9.3988322009 3.106577 13.86828 21.28455 2.809991 ..
Source : http://unctadstat.unctad.org
Appendix - I A Inward Foreign Direct Investment Flows In Indian Economy, Annual,
1980-2009
Volume 2 Issue 1 APOTHEOSIS : Tirpude's National Journal of Business Research (TNJBR)

Abstract : The Banking Sector which is conservative in its operations is assigned a catalytic role foreconomic development of any country. The turbulent, competitive and demanding businessenvironment in the global banking industry is making it imperative for the banks to adhere to thecomparable global disclosure practices so that the shareholders and others can form right opinion ofthe banks, its functioning, and make decisions on the basis of disclosed information.
As the competition in the global banking industry is gaining momentum, bankers' greed continuesunabated. It is time to question once again the role of corporate governance. The concept of corporategovernance, which emerged as a response to corporate failures and widespread dissatisfaction withthe way many corporate function, has recently become one of the topics for wide and deep discussionsacross the globe.
This paper stresses on the need for corporate governance in the banking sector. This emerges from thefact that sound corporate governance is an important element of bank safety, soundness and thestability of the financial system. The failure of one bank can rapidly affect another through inter-institutional exposures and confidence effects. The extensive and momentous disturbance to thefinancial system can have potentially severe effects on the wider economy.
Against this backdrop, the study aims to compare the practices and trends of corporate governance in Banks.
The researcher has collected data from surveys through questionnaires. Statistical techniques likeFriedman's Test, Cross tabulations, multiple correlation techniques are used to test the extent towhich factors contribute to sound and ethical corporate practices. The present research can be foundof relevance to academicians and practitioners in the banking industry.
[61]
* Asst. Professor, Finance IES Management College and Research Centre, Mumbai
** Director, IES Management College and Research Centre
Volume 2 Issue 1 A Study of trends in corporate governance practices in Indian Commercial Banks
Keywords: Corporate Governance, banking sector, Basel Committee norms.
A Study of trends in corporate governance practices in Indian Commercial Banks.
Ms. Svetlana Tatuskar*, Dr. Dinesh .D.Harsolekar**
Introduction:
Globalization has made it important forfinancial institutions especially banks acrossthe world to adopt some necessary internationalprinciples of corporate governance. Eachcountry will, therefore, need country specificsystem that lays down precise and detailedregulations and procedures for the governanceof banks in that respective country. There isconsiderable divergence in the understandingand practice of corporate governance in generaland in respect of banks in particular but there isalso an increasing tendency towardsconvergence.
“Corporate Governance” remains an unclearand misunderstood phrase, evidently in the
banking sector. This is because of the followingreasons: The basic and important reason beingthe fact that there is no inimitable charter of“corporate governance” amongst banks in thedeveloped countries; nor is 'corporategovernance practices' of any country betterthan others. This makes it very difficult forIndian banks to devise a system of corporategovernance for Indian companies bymechanically importing one form or another.
Secondly, Indian companies, banks andfinancial institutions (FIs) can no longer affordto ignore better corporate practices. As Indiagets integrated in the world market, Indian aswell as international investors will demandgreater disclosure, more transparent
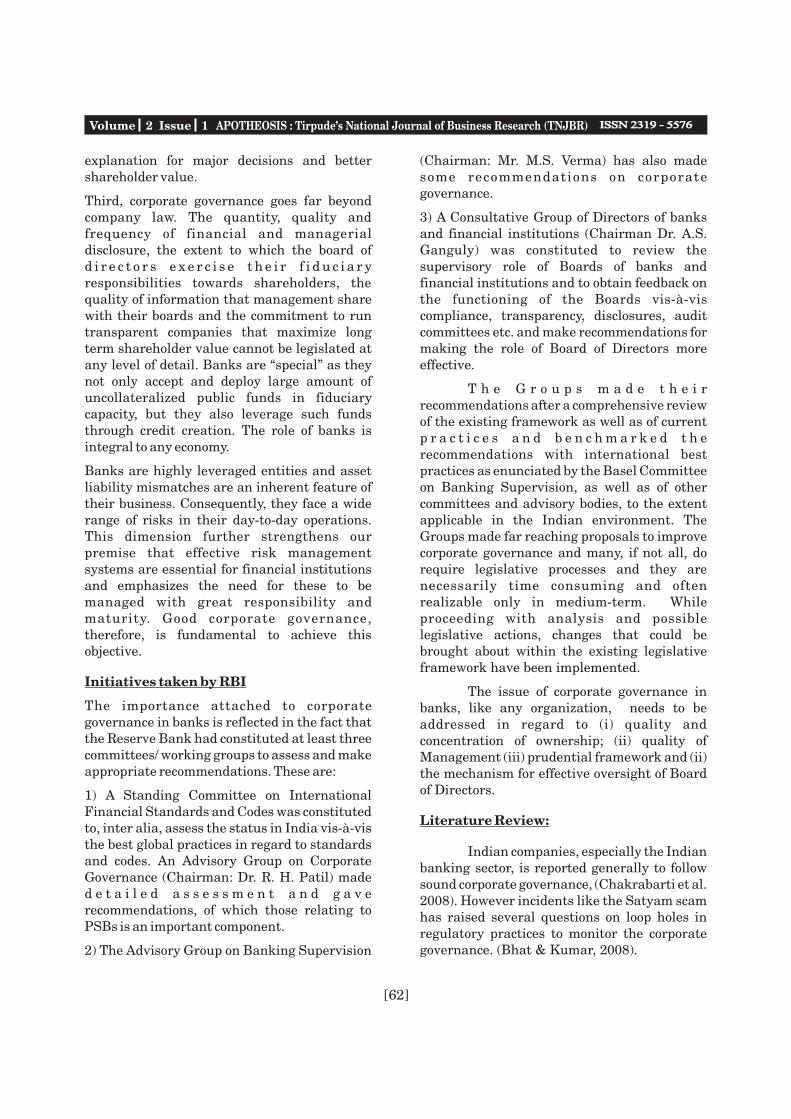
[62]
Volume 2 Issue 1 APOTHEOSIS : Tirpude's National Journal of Business Research (TNJBR)
explanation for major decisions and bettershareholder value.
Third, corporate governance goes far beyondcompany law. The quantity, quality andfrequency of financial and managerialdisclosure, the extent to which the board ofd i r e c t o r s e x e r c i s e t h e i r f i d u c i a r yresponsibilities towards shareholders, thequality of information that management sharewith their boards and the commitment to runtransparent companies that maximize longterm shareholder value cannot be legislated atany level of detail. Banks are “special” as theynot only accept and deploy large amount ofuncollateralized public funds in fiduciarycapacity, but they also leverage such fundsthrough credit creation. The role of banks isintegral to any economy.
Banks are highly leveraged entities and assetliability mismatches are an inherent feature oftheir business. Consequently, they face a widerange of risks in their day-to-day operations.This dimension further strengthens ourpremise that effective risk managementsystems are essential for financial institutionsand emphasizes the need for these to bemanaged with great responsibility andmaturity. Good corporate governance,therefore, is fundamental to achieve thisobjective.
Initiatives taken by RBI
The importance attached to corporategovernance in banks is reflected in the fact thatthe Reserve Bank had constituted at least threecommittees/ working groups to assess and makeappropriate recommendations. These are:
1) A Standing Committee on InternationalFinancial Standards and Codes was constitutedto, inter alia, assess the status in India vis-à-visthe best global practices in regard to standardsand codes. An Advisory Group on CorporateGovernance (Chairman: Dr. R. H. Patil) maded e t a i l e d a s s e s s m e n t a n d g a v erecommendations, of which those relating toPSBs is an important component.
2) The Advisory Group on Banking Supervision
(Chairman: Mr. M.S. Verma) has also madesome recommendations on corporategovernance.
3) A Consultative Group of Directors of banksand financial institutions (Chairman Dr. A.S.Ganguly) was constituted to review thesupervisory role of Boards of banks andfinancial institutions and to obtain feedback onthe functioning of the Boards vis-à-viscompliance, transparency, disclosures, auditcommittees etc. and make recommendations formaking the role of Board of Directors moreeffective.
T h e G r o u p s m a d e t h e i rrecommendations after a comprehensive reviewof the existing framework as well as of currentp r a c t i c e s a n d b e n c h m a r k e d t h erecommendations with international bestpractices as enunciated by the Basel Committeeon Banking Supervision, as well as of othercommittees and advisory bodies, to the extentapplicable in the Indian environment. TheGroups made far reaching proposals to improvecorporate governance and many, if not all, dorequire legislative processes and they arenecessarily time consuming and oftenrealizable only in medium-term. Whileproceeding with analysis and possiblelegislative actions, changes that could bebrought about within the existing legislativeframework have been implemented.
The issue of corporate governance inbanks, like any organization, needs to beaddressed in regard to (i) quality andconcentration of ownership; (ii) quality ofManagement (iii) prudential framework and (ii) the mechanism for effective oversight of Boardof Directors.
Literature Review:
Indian companies, especially the Indianbanking sector, is reported generally to followsound corporate governance, (Chakrabarti et al.2008). However incidents like the Satyam scamhas raised several questions on loop holes inregulatory practices to monitor the corporategovernance. (Bhat & Kumar, 2008).

[63]
A d v i s o r y G r o u p o n B a n k i n gSupervision (Chairman: Shri M. S. Verma): TheGroup assessed the position of the Indianbanking system vis-à-vis the principles laiddown in 16 papers brought out by the BaselCommittee on Banking Supervision. Thisassessment was done in seven major areas, viz.,core principles, corporate governance, internalcontrol, credit risk, loan accounting,transparency and disclosures, financialconglomerates and cross border banking. TheGroup concluded that, given the complexity anddevelopment of the Indian banking sector, theoverall level of compliance with the standardsand codes is of a high order. Wherever there aresignificant gaps, these can be remedied within areasonable time frame if the necessary legalreforms/amendments are undertaken withoutdelay. The Group has underlined the need to putin place scientific risk management systems inbanks.
The Basel Committee published apaper for banking organizations in September1999. The Committee suggested that it is theresponsibility of the banking supervisors toensure that there is effective corporategovernance in the banking industry. It alsohighlighted the need for having appropriateaccountability and checks and balances withineach bank to ensure sound corporategovernance, which in turn would lead toeffective and more meaningful supervision.
Efforts were taken for several years toremedy the deficiencies of Basel I norm andBasel committee came out with modifiedapproach in June 2004. The final version of theAccord titled “International Convergence ofCapital Measurement and Capital Standards-A- Revised Framework" was released by BIS.This is popularly known as New Basel Accord ofsimply Basel ll. Basel ll seeks to rectify most ofthe defects of Basel l Accord. The objectives ofBasel ll are the following:
1. To promote adequate capitalization of banks.
2. To ensure better risk management and
3. To strengthen the stability of banking
system.
Research Objective:
The objective of the research is toevaluate the soundness of corporate governanceof Indian banks in the post recession period.This paper stresses on the need for soundcorporate governance in the banking sector andaims to compare the practices and global trendsof corporate governance practices in Banks.
Some important parameters whichwere brought out by the literature review aidsto gauge the soundness of the bank: (i) Soundinternal control system; (ii) quality ofmanagement (iii) prudential monitoring systemframework and (iv) Core principles and values.Under this backdrop the paper studies:
1) The importance and degree to which qualityand concentration of ownership, quality ofmanagement, prudential monitoring systemframework and sound internal control systemattribute to sound corporate governance inBanks in India.
2) To identify all other factors that contribute tosound corporate governance in Banks.
3) To suggest Indian commercial banks thesteps that they can employ to ensure soundcorporate governance practices.
D a t a C o l l e c t i o n a n d R e s e a r c h Methodology:
The findings of the paper are based on adetailed analysis of data obtained byquestionnaires, observation and Interviewswith banking professionals and bank managersof Indian public commercial banks as well asIndian private commercial banks.
The data collection comprised of fourkey initiatives.
a) Online detailed questionnaires to across section 86 of customers in Mumbai,who use the banking facility.
b) In-depth interviews with bankmanagers who were responsible toensure sound corporate governancepractices at their banks.
Volume 2 Issue 1 A Study of trends in corporate governance practices in Indian Commercial Banks

[64]
Volume 2 Issue 1 APOTHEOSIS : Tirpude's National Journal of Business Research (TNJBR)
c) Extens ive desk research wasconducted, enquiring into theimportance and degree to which qualityand concentration of ownership, qualityof Management, prudential monitoringsystem framework and sound internalcontrol system attribute to soundcorporate governance in banks in India.
d) Surveys conducted by ResearchO r g a n i z a t i o n s i n q u i r i n g i n t osignificant challenges, issues andopportunities that is faced by bankingcustomers as well as Islamic banks andconventional banks in India.
The Data obtained from questionnaireswas transformed to SPSS compatible data form.The data was analyzed using descriptiveanalysis and non- parametric Friedman's Testto identify the significant trends in CorporateGovernance practices in Banks.
Analysis and Findings:
Data Analysis is based on the responsesreceived from the corresponding questionnairecirculated to respondents, who had relationshipwith either private sector Indian commercial
banks or public sector Indian commercial bankas bank manager or customers. Though thesample pool is quite small, the discussionsgauge the importance and degree to whichquality and concentration of ownership, qualityof Management, prudential monitoring systemframework and sound internal control systemattribute to sound corporate governance inBanks in India as well as it brings out clearly allother factors that contribute to sound corporategovernance practices.
Out of the total respondents, only 16%of the respondents were of the opinion that theIndian Commercials Banks having soundcorporate governance practices. But thesepractices are not completely sound or else wewould not have the case of Bank of Rajasthanthat had to lose its corporate identity due to lackof sound corporate governance practices.
Soundness of Corporate Governance
Practices16%
67%
7% 10%
COMPLETELY
SOMEWHAT
CAN'T SAY
NOT AT ALL
In order to assess the individual's preference to the various factors that contribute to soundness of thecorporate governance practices in banks, the respondents were asked to rank each of the four factors inascending order of preference, with 1 being most preferred choice of product. The non parametric-Friedman Test was conducted to examine if there was any significant difference in the ranking given bythe customers.
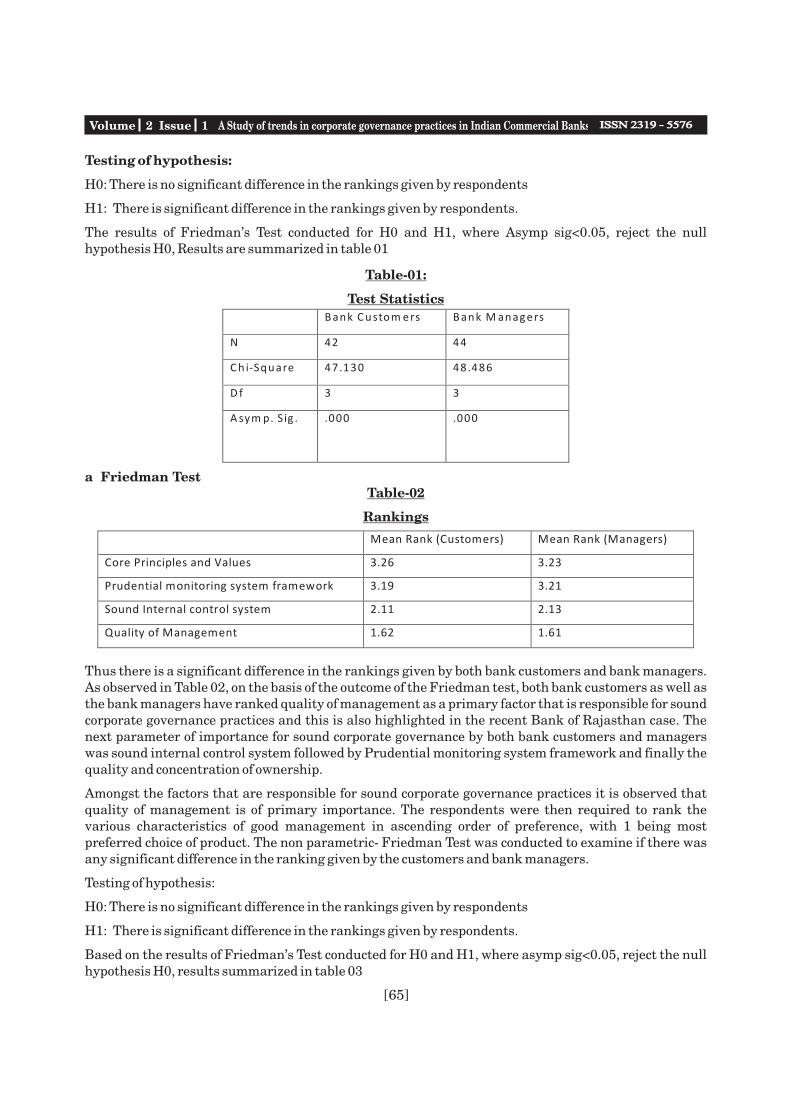
[65]
Testing of hypothesis:
H0: There is no significant difference in the rankings given by respondents
H1: There is significant difference in the rankings given by respondents.
The results of Friedman's Test conducted for H0 and H1, where Asymp sig<0.05, reject the nullhypothesis H0, Results are summarized in table 01
Table-01:
Test Statistics
B ank C ustom ers B ank M anagers
N 42 44
C h i-Square 47.130 48.486
D f 3 3
A sym p. S ig . .000 .000
a Friedman TestTable-02
Rankings
Mean Rank (Customers) Mean Rank (Managers)
Core Principles and Values 3.26 3.23
Prudential monitoring system framework 3.19 3.21
Sound Internal control system 2.11 2.13
Quality of Management 1.62 1.61
Thus there is a significant difference in the rankings given by both bank customers and bank managers.As observed in Table 02, on the basis of the outcome of the Friedman test, both bank customers as well asthe bank managers have ranked quality of management as a primary factor that is responsible for soundcorporate governance practices and this is also highlighted in the recent Bank of Rajasthan case. Thenext parameter of importance for sound corporate governance by both bank customers and managerswas sound internal control system followed by Prudential monitoring system framework and finally thequality and concentration of ownership.
Amongst the factors that are responsible for sound corporate governance practices it is observed thatquality of management is of primary importance. The respondents were then required to rank thevarious characteristics of good management in ascending order of preference, with 1 being mostpreferred choice of product. The non parametric- Friedman Test was conducted to examine if there wasany significant difference in the ranking given by the customers and bank managers.
Testing of hypothesis:
H0: There is no significant difference in the rankings given by respondents
H1: There is significant difference in the rankings given by respondents.
Based on the results of Friedman's Test conducted for H0 and H1, where asymp sig<0.05, reject the nullhypothesis H0, results summarized in table 03
Volume 2 Issue 1 A Study of trends in corporate governance practices in Indian Commercial Banks
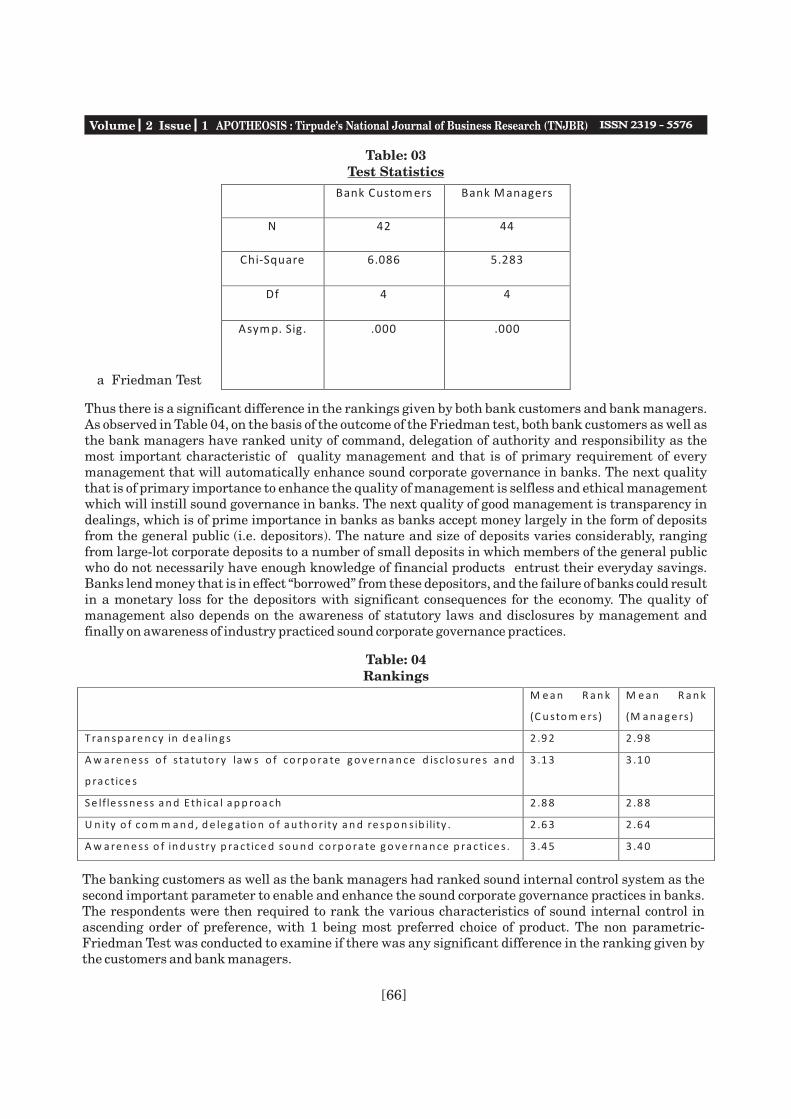
[66]
Volume 2 Issue 1 APOTHEOSIS : Tirpude's National Journal of Business Research (TNJBR)
Table: 03Test Statistics
Bank Custom ers Bank M anagers
N 42 44
Chi-Square 6.086 5.283
Df 4 4
Asym p. Sig. .000 .000
a Friedman Test
Thus there is a significant difference in the rankings given by both bank customers and bank managers.As observed in Table 04, on the basis of the outcome of the Friedman test, both bank customers as well asthe bank managers have ranked unity of command, delegation of authority and responsibility as themost important characteristic of quality management and that is of primary requirement of everymanagement that will automatically enhance sound corporate governance in banks. The next qualitythat is of primary importance to enhance the quality of management is selfless and ethical managementwhich will instill sound governance in banks. The next quality of good management is transparency indealings, which is of prime importance in banks as banks accept money largely in the form of depositsfrom the general public (i.e. depositors). The nature and size of deposits varies considerably, rangingfrom large-lot corporate deposits to a number of small deposits in which members of the general public who do not necessarily have enough knowledge of financial products entrust their everyday savings.Banks lend money that is in effect “borrowed” from these depositors, and the failure of banks could resultin a monetary loss for the depositors with significant consequences for the economy. The quality ofmanagement also depends on the awareness of statutory laws and disclosures by management andfinally on awareness of industry practiced sound corporate governance practices.
Table: 04Rankings
M e a n R a n k
(C u sto m e rs)
M e a n R a n k
(M a n a g e rs)
T ra n sp a re n cy in d e a lin g s 2 .9 2 2 .9 8
A w a re n e ss o f s ta tu to ry law s o f co rp o ra te g o v e rn a n ce d isc lo su re s a n d
p ra ctice s
3 .1 3 3 .1 0
S e lfle ssne ss a n d E th ica l a p p ro a ch 2 .8 8 2 .8 8
U n ity o f co m m a n d , d e le g a tio n o f a u th o rity a n d re sp o n s ib ility . 2 .6 3 2 .6 4
A w a re n e ss o f in d u stry p ra ctice d so u n d co rp o ra te g o v e rn a n ce p ra ctice s . 3 .4 5 3 .4 0
The banking customers as well as the bank managers had ranked sound internal control system as thesecond important parameter to enable and enhance the sound corporate governance practices in banks.The respondents were then required to rank the various characteristics of sound internal control inascending order of preference, with 1 being most preferred choice of product. The non parametric-Friedman Test was conducted to examine if there was any significant difference in the ranking given bythe customers and bank managers.
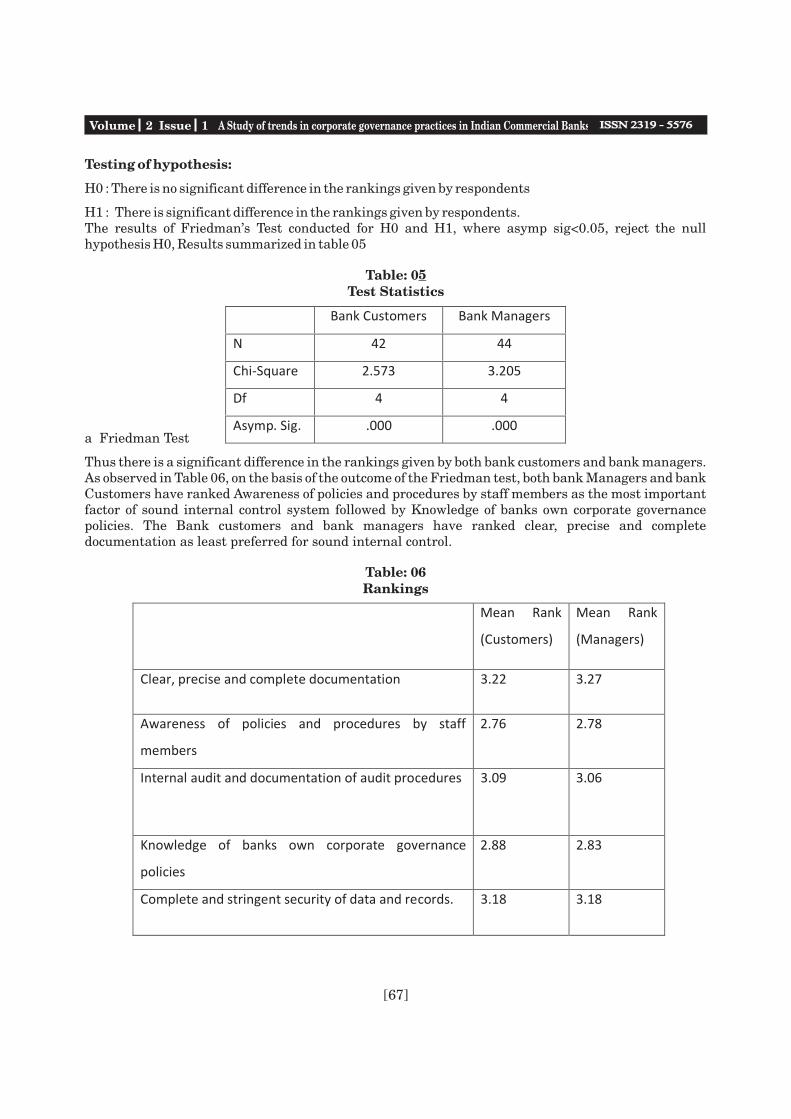
[67]
Testing of hypothesis:
H0 : There is no significant difference in the rankings given by respondents
H1 : There is significant difference in the rankings given by respondents.The results of Friedman's Test conducted for H0 and H1, where asymp sig<0.05, reject the nullhypothesis H0, Results summarized in table 05
Table: 0Test Statistics
5
Bank Customers Bank Managers
N 42 44
Chi-Square 2.573 3.205
Df 4 4
Asymp. Sig. .000 .000 a Friedman Test
Thus there is a significant difference in the rankings given by both bank customers and bank managers.As observed in Table 06, on the basis of the outcome of the Friedman test, both bank Managers and bankCustomers have ranked Awareness of policies and procedures by staff members as the most importantfactor of sound internal control system followed by Knowledge of banks own corporate governancepolicies. The Bank customers and bank managers have ranked clear, precise and completedocumentation as least preferred for sound internal control.
Table: 06Rankings
Mean Rank
(Customers)
Mean Rank
(Managers)
Clear, precise and complete documentation 3.22 3.27
Awareness of policies and procedures by staff
members
2.76 2.78
Internal audit and documentation of audit procedures 3.09 3.06
Knowledge of banks own corporate governance
policies
2.88 2.83
Complete and stringent security of data and records. 3.18 3.18
Volume 2 Issue 1 A Study of trends in corporate governance practices in Indian Commercial Banks

[68]
Volume 2 Issue 1 APOTHEOSIS : Tirpude's National Journal of Business Research (TNJBR)
The banking customers as well as the bank managers had ranked prudential monitoring systemframework as the third important parameter to enable and enhance the sound corporate governancepractices in banks. The respondents were then required to rank the various characteristics of prudentialmonitoring system framework in ascending order of preference, with 1 being most preferred choice ofproduct. The non parametric- Friedman Test was conducted to examine if there was any significantdifference in the ranking given by the customers and bank managers.
Testing of hypothesis:
H0: There is no significant difference in the rankings given by respondents
H1: There is significant difference in the rankings given by respondents.
The results of Friedman's Test conducted for H0 and H1, where asymp sig<0.05, reject the nullhypothesis H0, Results summarized in table 07
Thus there is a significant difference in the rankings given by both bank customers and bank managers.As observed in Table 08, on the basis of the outcome of the Friedman test, both bank Managers and bankCustomers have ranked conducting frequent and stringent audit of procedures and policies as theprimary characteristics of Prudential monitoring system framework, which will initiate soundcorporate governance in bank followed by defining significant performance parameters. The bankingofficials and customers were of the opinion that setting some minimum performance standards andscrutinizing whether minimum performance targets are met is least important characteristics ofprudential monitoring system framework to ensure sound corporate governance in banks.
Table: 07
Bank
Customers
Bank
Managers
N 42 44
Chi-Square 9.082 8.830
Df 4 4
Asymp. Sig. .000 .000

[69]
Table: 08
B a n k
C u sto m e rs
B a n k
M a n a g e rs
Se ttin g so m e m in im u m p e rfo rm a n ce
le v el.
3 .4 0 3 .3 6
C h e ck in g fo r G a p b e tw e e n a ctu a l
p e rfo rm a n ce a n d d e sire d
p e rfo rm a n ce .
3 .0 8 3 .0 7
D e fin in g S ig n ifica n t p e rfo rm a n ce
p a ra m e te rs
2 .7 2 2 .7 4
Fre q u e n t a n d Strin g e n t A u d it o f
P ro ce d u re s a n d p o lic ie s .
2 .3 8 2 .4 2
Scru tin iz in g w h e th e r th e m in im u m
p e rfo rm a n ce ta rg e ts a re m e t.
3 .4 0 3 .3 8
a Friedman Test
The banking customers as well as the bank managers had ranked core principles and values as thefourth important parameter to enable and enhance the sound corporate governance practices in banks.The respondents were then required to rank the various characteristics of core principles and values inascending order of preference, with 1 being most preferred choice of product. The non parametric-Friedman Test was conducted to examine if there was any significant difference in the ranking given bythe customers and bank managers.
Testing of hypothesis:
H0: There is no significant difference in the rankings given by respondents
H1: There is significant difference in the rankings given by respondents.
The results of Friedman's Test conducted for H0 and H1, where asymp sig<0.05, reject the nullhypothesis H0, Results summarized in table 09.
Thus there is a significant difference in the rankings given by both bank customers and bank managers.As observed in Table 10, on the basis of the outcome of the Friedman test, both bank managers and bankcustomers have ranked integrity and honesty as the core value for sound corporate governance in banks
Bank
Customers
Bank
Managers
N 42 44
Chi-Square 6.836 5.638
Df 4 4
Asymp. Sig. .000 .000
Table: 09
Volume 2 Issue 1 A Study of trends in corporate governance practices in Indian Commercial Banks
g
s
s a
p
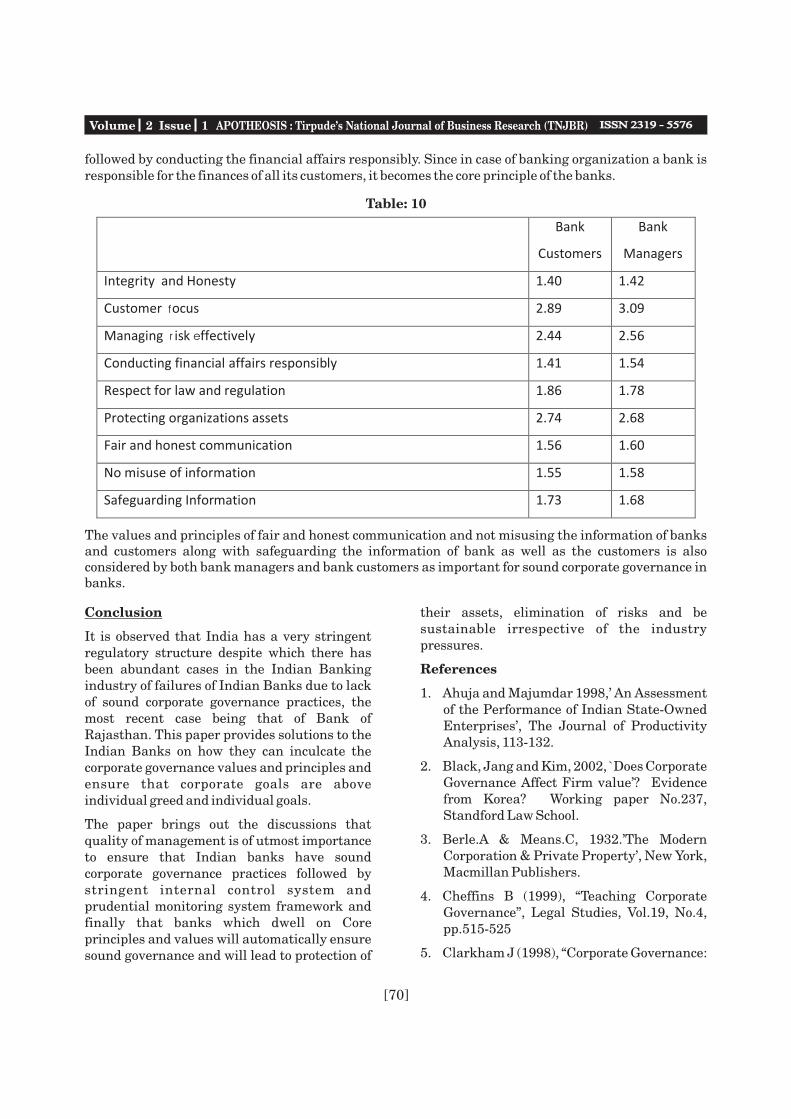
[70]
Volume 2 Issue 1 APOTHEOSIS : Tirpude's National Journal of Business Research (TNJBR)
followed by conducting the financial affairs responsibly. Since in case of banking organization a bank isresponsible for the finances of all its customers, it becomes the core principle of the banks.
The values and principles of fair and honest communication and not misusing the information of banksand customers along with safeguarding the information of bank as well as the customers is alsoconsidered by both bank managers and bank customers as important for sound corporate governance inbanks.
Table: 10
Bank
Customers
Bank
Managers
Integrity and Honesty 1.40 1.42
Customer Focus 2.89 3.09
Managing Risk Effectively 2.44 2.56
Conducting financial affairs responsibly 1.41 1.54
Respect for law and regulation 1.86 1.78
Protecting organizations assets 2.74 2.68
Fair and honest communication 1.56 1.60
No misuse of information 1.55 1.58
Safeguarding Information 1.73 1.68
Conclusion
It is observed that India has a very stringentregulatory structure despite which there hasbeen abundant cases in the Indian Bankingindustry of failures of Indian Banks due to lackof sound corporate governance practices, themost recent case being that of Bank ofRajasthan. This paper provides solutions to theIndian Banks on how they can inculcate thecorporate governance values and principles andensure that corporate goals are aboveindividual greed and individual goals.
The paper brings out the discussions thatquality of management is of utmost importanceto ensure that Indian banks have soundcorporate governance practices followed bystringent internal control system andprudential monitoring system framework andfinally that banks which dwell on Coreprinciples and values will automatically ensuresound governance and will lead to protection of
their assets, elimination of risks and besustainable irrespective of the industrypressures.
References
1. Ahuja and Majumdar 1998,' An Assessmentof the Performance of Indian State-OwnedEnterprises', The Journal of ProductivityAnalysis, 113-132.
2. Black, Jang and Kim, 2002, ̀ Does CorporateGovernance Affect Firm value'? Evidencefrom Korea? Working paper No.237,Standford Law School.
3. Berle.A & Means.C, 1932.'The ModernCorporation & Private Property', New York,Macmillan Publishers.
4. Cheffins B (1999), “Teaching CorporateGovernance”, Legal Studies, Vol.19, No.4,pp.515-525
5. Clarkham J (1998), “Corporate Governance:
f
r e
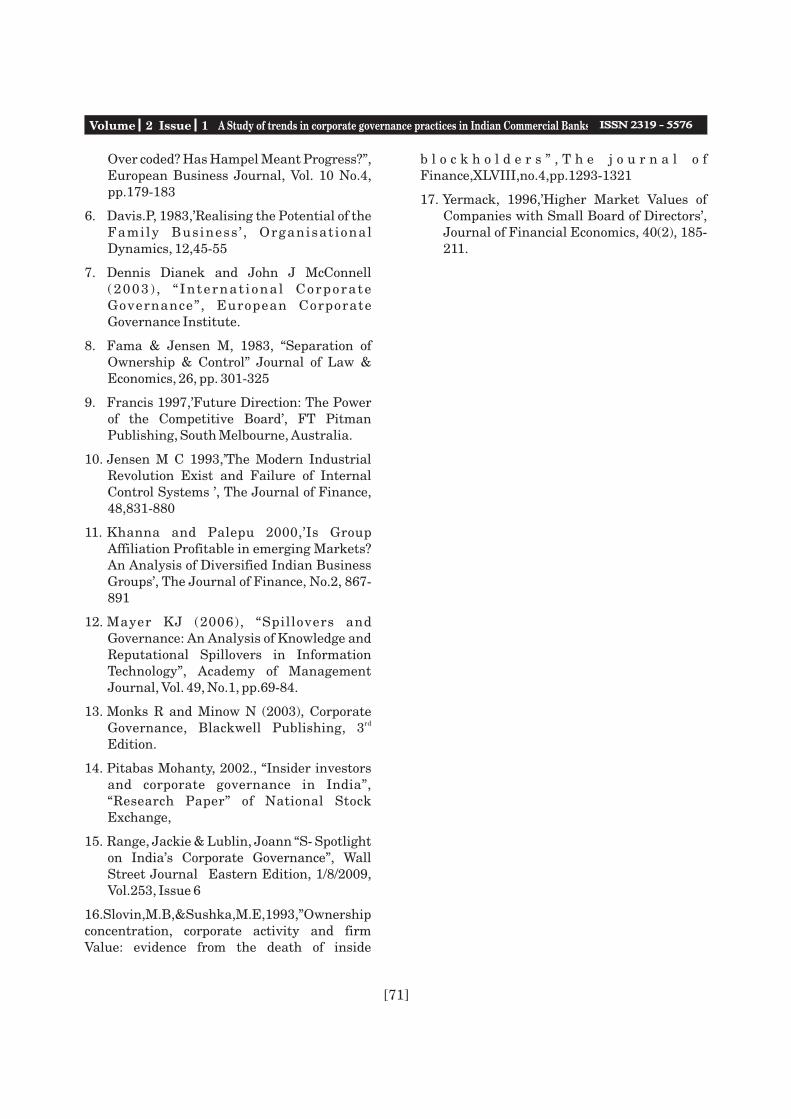
Over coded? Has Hampel Meant Progress?”,European Business Journal, Vol. 10 No.4,pp.179-183
6. Davis.P, 1983,'Realising the Potential of theFamily Business ' , Organisat ionalDynamics, 12,45-55
7. Dennis Dianek and John J McConnell(2003) , “ Internat iona l CorporateGovernance”, European CorporateGovernance Institute.
8. Fama & Jensen M, 1983, “Separation ofOwnership & Control” Journal of Law &Economics, 26, pp. 301-325
9. Francis 1997,'Future Direction: The Powerof the Competitive Board', FT PitmanPublishing, South Melbourne, Australia.
10. Jensen M C 1993,'The Modern IndustrialRevolution Exist and Failure of InternalControl Systems ', The Journal of Finance,48,831-880
11. Khanna and Palepu 2000,'Is GroupAffiliation Profitable in emerging Markets?An Analysis of Diversified Indian BusinessGroups', The Journal of Finance, No.2, 867-891
12. Mayer KJ (2006), “Spillovers andGovernance: An Analysis of Knowledge andReputational Spillovers in InformationTechnology”, Academy of ManagementJournal, Vol. 49, No.1, pp.69-84.
13. Monks R and Minow N (2003), Corporate rdGovernance, Blackwell Publishing, 3
Edition.
14. Pitabas Mohanty, 2002., “Insider investorsand corporate governance in India”,“Research Paper” of National StockExchange,
15. Range, Jackie & Lublin, Joann “S- Spotlighton India's Corporate Governance”, WallStreet Journal Eastern Edition, 1/8/2009,Vol.253, Issue 6
16.Slovin,M.B,&Sushka,M.E,1993,”Ownershipconcentration, corporate activity and firmValue: evidence from the death of inside
b l o c k h o l d e r s ” , T h e j o u r n a l o fFinance,XLVIII,no.4,pp.1293-1321
17. Yermack, 1996,'Higher Market Values ofCompanies with Small Board of Directors',Journal of Financial Economics, 40(2), 185-211.
Volume 2 Issue 1 A Study of trends in corporate governance practices in Indian Commercial Banks
[71]
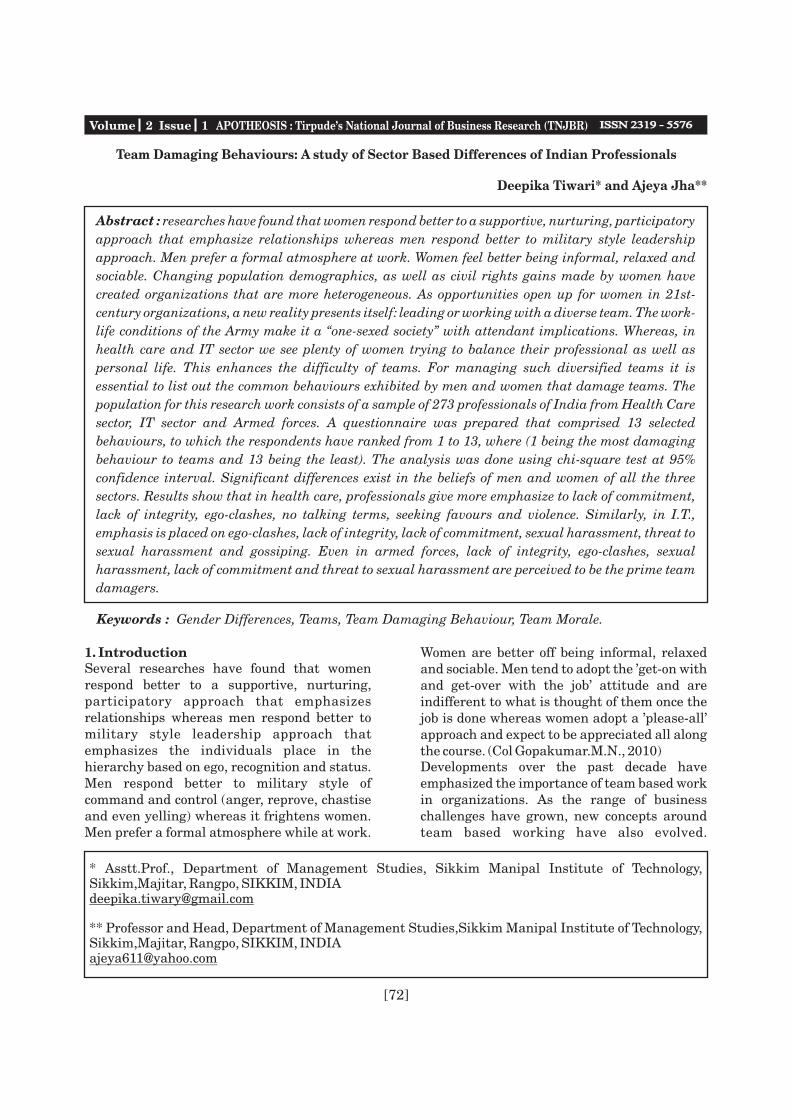
Abstract : researches have found that women respond better to a supportive, nurturing, participatory
approach that emphasize relationships whereas men respond better to military style leadership
approach. Men prefer a formal atmosphere at work. Women feel better being informal, relaxed and
sociable. Changing population demographics, as well as civil rights gains made by women have
created organizations that are more heterogeneous. As opportunities open up for women in 21st-
century organizations, a new reality presents itself: leading or working with a diverse team. The work-
life conditions of the Army make it a “one-sexed society” with attendant implications. Whereas, in
health care and IT sector we see plenty of women trying to balance their professional as well as
personal life. This enhances the difficulty of teams. For managing such diversified teams it is
essential to list out the common behaviours exhibited by men and women that damage teams. The
population for this research work consists of a sample of 273 professionals of India from Health Care
sector, IT sector and Armed forces. A questionnaire was prepared that comprised 13 selected
behaviours, to which the respondents have ranked from 1 to 13, where (1 being the most damaging
behaviour to teams and 13 being the least). The analysis was done using chi-square test at 95%
confidence interval. Significant differences exist in the beliefs of men and women of all the three
sectors. Results show that in health care, professionals give more emphasize to lack of commitment,
lack of integrity, ego-clashes, no talking terms, seeking favours and violence. Similarly, in I.T.,
emphasis is placed on ego-clashes, lack of integrity, lack of commitment, sexual harassment, threat to
sexual harassment and gossiping. Even in armed forces, lack of integrity, ego-clashes, sexual
harassment, lack of commitment and threat to sexual harassment are perceived to be the prime team
damagers.
[72]
* Asstt.Prof., Department of Management Studies, Sikkim Manipal Institute of Technology,Sikkim,Majitar, Rangpo, SIKKIM, INDIA [email protected]
** Professor and Head, Department of Management Studies,Sikkim Manipal Institute of Technology,Sikkim,Majitar, Rangpo, SIKKIM, INDIA [email protected]
Keywords : Gender Differences, Teams, Team Damaging Behaviour, Team Morale.
Team Damaging Behaviours: A study of Sector Based Differences of Indian Professionals
Deepika Tiwari* and Ajeya Jha**
1. IntroductionSeveral researches have found that womenrespond better to a supportive, nurturing,participatory approach that emphasizesrelationships whereas men respond better tomilitary style leadership approach thatemphasizes the individuals place in thehierarchy based on ego, recognition and status.Men respond better to military style ofcommand and control (anger, reprove, chastiseand even yelling) whereas it frightens women.Men prefer a formal atmosphere while at work.
Women are better off being informal, relaxedand sociable. Men tend to adopt the 'get-on withand get-over with the job' attitude and areindifferent to what is thought of them once thejob is done whereas women adopt a 'please-all'approach and expect to be appreciated all alongthe course. (Col Gopakumar.M.N., 2010)Developments over the past decade haveemphasized the importance of team based workin organizations. As the range of businesschallenges have grown, new concepts aroundteam based working have also evolved.
Volume 2 Issue 1 APOTHEOSIS : Tirpude's National Journal of Business Research (TNJBR)

Volume 2 Issue 1 Team Damaging Behaviours: A study of Sector Based Differences of Indian Professionals
[73]
Although teams within organizations arehardly new, they have recently gainedimportance as a fundamental unit oforganization structure (Drucker, 1988). Asorganizations have become more decentralized,less bureaucratic, and flatter, teams have beencreated to carry out new initiatives and to crossthe traditional boundaries both within the firmand with external constituents such ascustomers and suppliers (Kanter, 1983; vonHippel, 1988; Walton & Hackman, 1986). Teameffectiveness experts have narrowed thecharacteristics of high-performing teams downto a relatively workable number of factors suchas: common purpose, clear roles, acceptedleadership, effective processes, solidrelationships and good communication(MacMillan, P. 2001). LaFasto, F., & Larson C.(2001)have studied another approach byfocusing at the abilities and behaviors that aremost important in selecting effective teammembers, such as experience, problem-solvingability, openness, supportiveness and actionorientation. In the present day global economywhere a “high technology firm” adapts andprogresses in a 'high velocity environment”(Mishra, Deshmukh, & Vrat, 2002) ,organizations have to develop their competitiveadvantage by coping up with continualtechnological changes and unforeseen shifts incustomers demand. Internet and the “dot.com”phenomena have made IT one of the primaryenablers in the proper functioning of anyorganization. As a result there is a gradualtransformation from traditional workplaces toan IT enabled 'e-workplace' (Arnison & Miller,2002). Using the advancement in IT as aprimary enabler, organizations are looking fornew forms and dynamics that will aid them torespond more rapidly to the ever-changingcustomer needs and requirements (Jarvenpaa& Ives, 1994; Powell, Piccoli, & Ives, 2004).Thus, more and more organizations are leaningtowards the development of “teams”.
Most organizations have moved to waysof doing work that include less hierarchicalorganizational structures and the use of varioustypes of work groups and teams to get tasksdone (Applebaum & Batt, 1994; Ilgen, 1999;
Jackson, Stone, & Alvarez, 1992; Tolbert,Andrews, & Simons, 1995) On the other hand,changing population demographics, as well ascivil rights gains made by women and racial/ethnic minorities, have created organizationsthat are more and more heterogeneous(''Affirmative Action,'' 1995; Triandis,Kurowski, & Gelfand, 1993). To remain
stcompetitive in the 21 century global economy,organizations want their workforce to be highlyspecialized, yet have to work together in cross-functional teams; this creates a demand forsophisticated coordination and management(Lipnack & Stamps, 1993; Mohrman, Cohen, &Mohrman, 1995). Increased diversity in theworkplace includes not only better utilization oftalent and understanding of the marketplacebut also enhanced creativity and problem-solving ability (Robinson & Dechant, 1997).
Our research primarily focuses on threesectors, viz, health care sector, IT sector andarmed forces. Reason behind the choice of thesectors was purely based on the nature of teamsfound in these sectors. For example, in armedforces we find maximum number of maleexclusive teams only, in health care sector alsowe find many female exclusive teams whereeven the doctors are females. But in IT sectorwith the increase in number of women enteringthis sector, we come across mixed teams havingboth men and women.
The work-life conditions of the Armymake it a “one-sexed society” with attendantimplications. Moreover, soldiering is anocturnal activity with minimal activitiesplanned during daytime. George Orwellconveyed the idea in unambiguous terms:“People sleep peacefully in their beds at nightonly because rough men stand ready to doviolence on their behalf.” Since Army is sworn toserve @ 24x7x365 basis, there is no scope for“flexi-timings”, (Col Gopakumar.M.N., 2010).
More often than not, women officersposted (on paper) to perform duties (outdoorsonly) are assigned 'safe', directly supervised,indoor- duties only. It suits every one: womendue to their perceived fears tend to become“work-safe” and male officers tend to become“daddy- figures” to ensure 'safe' conditions to

[74]
prevent 'troubles', (Col Gopakumar.M.N.,2010).
Let us now focus on our second choice ofsector i.e. IT Sector, which is being recognizedas highly paying sector that attracts both malesand females through attractive packages anddemanding profound contribution at workplaces. Women's position in the IT sector hasseen both the positive and negative trends inthe last decade in the Indian sub-continent.There are studies that have highlighted the fasttrack that women have made in the IT relatedindustries. Women's composition in the ITworkforce has risen from 10% in 1993 to 18% in1998 which is much higher than the nationalaverage of 12 percent (NASSCOM 1999). To agreat surprise, the entry of women has shotupto 21 percent in 2002 (NASSCOM, 2002) andhas gone up to 35 percent by 2005. (Suriya,M. &Nagarajan,R. 2003).
Though women are better representedin the IT sector, they have not assumedsignificant role and status. Vittal (2003)observed the emergence of 'metro-sexual men',men who are sharing the responsibility of thefamily which might help women to be an activeagent in the IT workforce. It is also observedthat the dropout rates of women get increasedwith their marriage and childbirth. It is becausechildcare and housework remain women'sresponsibilities, irrespective of her income,educational level or employment. This places agreat burden on women and restricts women'schoices in terms of better job opportunities. TheJobs Ahead survey substantiates the fact thatwomen were not able to continue their job withthe sustained interest due to variousinterruptions happening in their lives, whichforced them to drop out from their aspiration ofbuilding a better career in IT. It is also observedthat the social barriers are so strong and womenwho manage to enter workplaces by risingabove societal biases are probably very strongand, therefore, do well when given theopportunity.2. Need for Study
As opportunities open up for women in21st-century organizations, a new realitypresents itself - leading or working with a
diverse team - which is a complicated issue(Bridges, 1994; Ely & Thomas, 2001; Ilgen,1999). Research shows that diversity can havenegative effects on social integration,communication, and conflict in groups (e.g.,Chatman, Polzer, Barsade, & Neale, 1998; E.Hoffman, 1985; Jehn, Northcraft, & Neale,1999; Pelled, Eisenhardt, & Xin, 1999; Watson,Kumar, & Michaelson, 1993; Webber &Donohue, 2001) and can result in poorerperformance and lowered satisfaction for groupmembers (e.g., Ancona & Caldwell, 1992;Riordan & Shore, 1997; Tsui, Egan, & O'Reilly,1992). As such, diversity is a difficult state forteams - and it is an equally difficult state tomanage (Hewstone & Brown, 1986). Formanaging such diversified teams, it is essentialto have some key characteristics that facilitatea team effort. Only when these factors aremissing or partially present, a team tends tobreak down. Studies have proved that few of thefactors that can or may damage the team are:poor communication or lack of properunderstanding, inadequate leadership stylepracticed by the team leader, ego-clashes withother members of the team and lack of trust onother team members (Anonymous, 2010).Without these elements being in balance, teamwill inevitably never work to their very best.Even Sahu R.K., 2010, believes that thecommon problems faced by teams are that ofhaving an unclear focus about their group goals,sticking to the status quo and restricting newideas or ways of operations, missing out followup actions and feedbacks and lack of commitment on part of each and every member.However, the increased use of teams and its amplified nature of diversity call for serious attention towards the factors that lead to the break-down of effective teams. Therefore, we will identify such significant factors (in the chosen three sectors i.e health care sector, IT sector and armed forces), which if present in a team or practiced by team members can damage the team. We will also suggest the re-medial factors for building up effective teams.
3. Statement of ProblemVar ious r esearches show the
Volume II Issue II Team Damaging Behaviours: A study of Sector Based Differences of Indian ProfessionalsVolume 2 Issue 1 APOTHEOSIS : Tirpude's National Journal of Business Research (TNJBR)
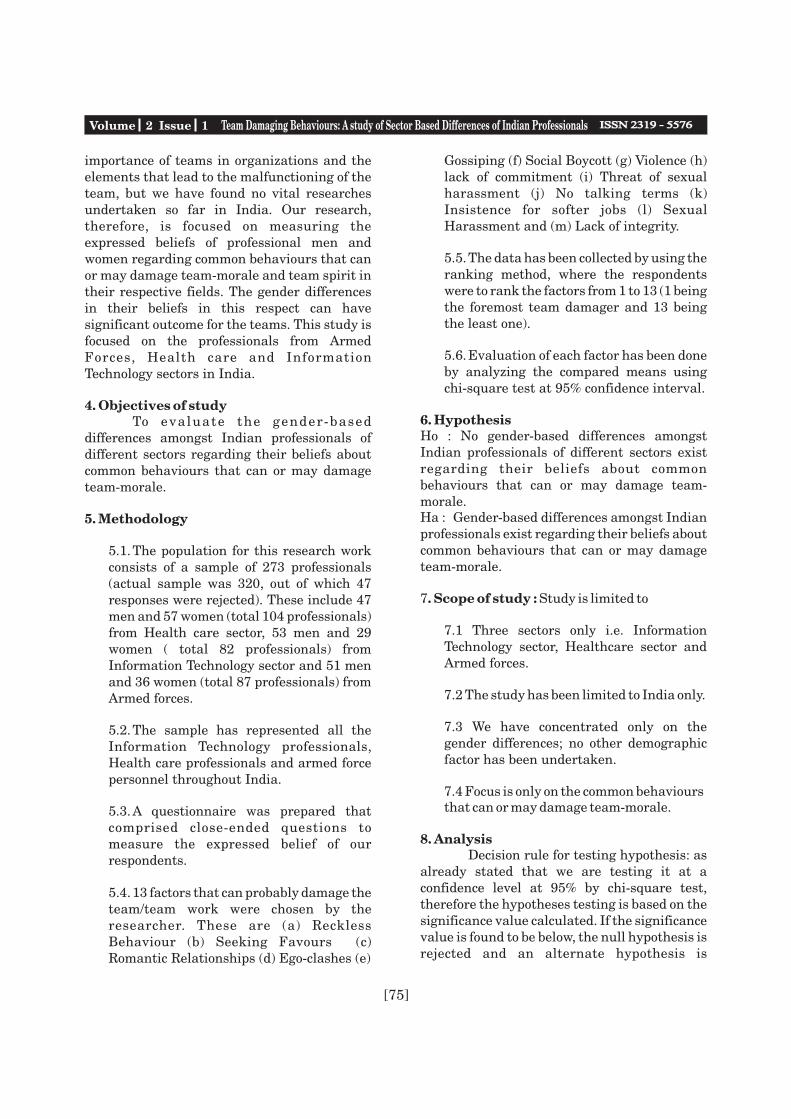
[75]
importance of teams in organizations and theelements that lead to the malfunctioning of theteam, but we have found no vital researchesundertaken so far in India. Our research,therefore, is focused on measuring theexpressed beliefs of professional men andwomen regarding common behaviours that canor may damage team-morale and team spirit intheir respective fields. The gender differencesin their beliefs in this respect can havesignificant outcome for the teams. This study isfocused on the professionals from ArmedForces, Health care and InformationTechnology sectors in India.
4. Objectives of studyTo evaluate the gender-based
differences amongst Indian professionals ofdifferent sectors regarding their beliefs aboutcommon behaviours that can or may damageteam-morale.
5. Methodology
5.1.The population for this research workconsists of a sample of 273 professionals(actual sample was 320, out of which 47responses were rejected). These include 47men and 57 women (total 104 professionals)from Health care sector, 53 men and 29women ( total 82 professionals) fromInformation Technology sector and 51 menand 36 women (total 87 professionals) fromArmed forces.
5.2.The sample has represented all theInformation Technology professionals,Health care professionals and armed forcepersonnel throughout India.
5.3.A questionnaire was prepared thatcomprised close-ended questions tomeasure the expressed belief of ourrespondents.
5.4.13 factors that can probably damage theteam/team work were chosen by theresearcher. These are (a) RecklessBehaviour (b) Seeking Favours (c)Romantic Relationships (d) Ego-clashes (e)
Gossiping (f) Social Boycott (g) Violence (h)lack of commitment (i) Threat of sexualharassment (j) No talking terms (k)Insistence for softer jobs (l) SexualHarassment and (m) Lack of integrity.
5.5.The data has been collected by using theranking method, where the respondentswere to rank the factors from 1 to 13 (1 beingthe foremost team damager and 13 beingthe least one).
5.6.Evaluation of each factor has been doneby analyzing the compared means usingchi-square test at 95% confidence interval.
6. HypothesisHo : No gender-based differences amongstIndian professionals of different sectors existregarding their beliefs about commonbehaviours that can or may damage team-morale.Ha : Gender-based differences amongst Indianprofessionals exist regarding their beliefs aboutcommon behaviours that can or may damageteam-morale.
7. Scope of study : Study is limited to
7.1 Three sectors only i.e. InformationTechnology sector, Healthcare sector andArmed forces.
7.2 The study has been limited to India only.
7.3 We have concentrated only on thegender differences; no other demographicfactor has been undertaken.
7.4 Focus is only on the common behavioursthat can or may damage team-morale.
8. AnalysisDecision rule for testing hypothesis: as
already stated that we are testing it at aconfidence level at 95% by chi-square test,therefore the hypotheses testing is based on thesignificance value calculated. If the significancevalue is found to be below, the null hypothesis isrejected and an alternate hypothesis is
Volume 2 Issue 1 Team Damaging Behaviours: A study of Sector Based Differences of Indian Professionals

[76]
accepted. Whereas, if it is more than .05, then null hypotheses is accepted and alternate hypotheses isrejected.
Case Processing Summary
Cases
Valid Missing Total
N Percent N Percent N Percent
Sector 273 100.0% 0 .0% 273 100.0%
S.No. 1 - Recklessness:
Table-1.1 shows that in mean rank assigned torecklessness as a team damager is 7.72 byHealthcare; 8.9 by IT and 9.2 by armed forceprofessionals. From the result we may alsoconclude that recklessness is considered amoderate team-damager by all the three sectorsstudied.
Are the differences reflected in male and femalebelief significant?
In table 1.2 the sector-wise difference is found tobe significant as the corresponding Pearson chisquare value is 0.000 which is well below 0.05.We, therefore, reject the null hypothesis andaccept the alternate one. Hence, there aresignificant differences in the beliefs of men andwomen about recklessness as a team damagerin all the three sectors.
S.No. 2 - Seeking Favours:
Table-2.1 shows that in mean rank assigned toseeking favours as a team damager is 5.9 byHealthcare; 7.9 by IT and 7.1 by armed forceprofessionals. The results show that seekingfavours is considered a vital team-damager byHealthcare and a moderate team-damager byIT and armed forces.
Are the differences reflected in male and femalebelief significant?
In table 2.2 the sector-wise difference is found tobe significant as the corresponding Pearson chisquare value is 0.000 which is well below 0.05.
We therefore reject the null hypothesis andaccept the alternate one. Hence, there aresignificant differences in the beliefs of men andwomen about seeking favours as a teamdamager in all the three sectors.
S.No. 3 - Romantic Relationships:Table-3.1 depicts that in mean rank assigned toRomantic Relationships as a team damager is 9.6 by Healthcare; 7.7 by IT and 9.4 by ArmedForce professionals. It can be proved thatromantic relationships are considered to be aless prioritized team-damager by Healthcareand Armed forces and a moderate team-damager by IT.
Are the differences reflected in male and femalebelief significant?
In table 3.2 the sector-wise difference is found tobe significant as the corresponding Pearson chisquare value is 0.000 which is well below 0.05.We therefore reject the null hypothesis andaccept the alternate one. Hence, there aresignificant differences in the beliefs of men andwomen about romantic relationships as a teamdamager in all the three sectors.
S.No. 4 - Ego-Clashes:
Table-4.1 illustrates that in mean rank assigned to Ego-Clashes as a team
damager is 4.9 by Healthcare; 3.6 by IT and 4.4 by ArmedForce professionals. The results out here show avery interesting picture where all the threesectors are considering ego-clashes to be a vitalteam-damager and that this should be givendue consideration.
Volume 2 Issue 1 APOTHEOSIS : Tirpude's National Journal of Business Research (TNJBR)

[77]
Are the differences reflected in male and femalebelief significant?
In table 4.2 the sector-wise difference is found tobe significant as the corresponding Pearson chisquare value is 0.000 which is well below 0.05.We therefore reject the null hypothesis andaccept the alternate one. Hence, there aresignificant differences in the beliefs of men andwomen about ego-clashes as a team damager inall the three sectors.
S.No. 5 Gossiping:
Table-5.1 shows that in mean rank assigned toGossiping as a team damager is 7.8 byHealthcare; 6.9 by IT and 9.4 by Armed Forceprofessionals, which shows significantdifference. The results prove that gossiping isconsidered to be a moderate team-damager byHealthcare and IT and a below moderate team-damager by Armed Forces.
Are the differences reflected in male and femalebelief significant?
In table 5.2 the sector-wise difference is found tobe significant as the corresponding Pearson chisquare value is 0.000 which is well below 0.05.We therefore reject the null hypothesis andaccept the alternate one. Hence, there aresignificant differences in the beliefs of men andwomen about gossiping as a team damager inall the three sectors.
S.No. 6 - Social Boycott:
Table-6.1 explains that in mean rank assignedto Social Boycott as a team damager is 7.6 byHealthcare; 7.5 by IT and 9.1 by Armed Forceprofessionals. We therefore, conclude from theabove results that social boycott is considered tobe a moderate team-damager by Healthcareand IT and a below moderate team-damager byArmed Forces.
Are the differences reflected in male and femalebelief significant?
In table 6.2 the sector-wise difference is found to
be significant as the corresponding Pearson chisquare value is 0.000 which is well below 0.05.We therefore reject the null hypothesis andaccept the alternate one. Hence, there aresignificant differences in the beliefs of men andwomen about social boycott as a team damagerin all the three sectors.
S.No. 7 Violence:
Table-7.1 illustrates that in mean rankassigned to Violence as a team damager is 6.6 byHealthcare; 8.0 by IT and 7.8 by Armed Forceprofessionals, which again depicts that violenceis considered to be a less moderate team-damager by Healthcare, moderate team-damager by Armed forces and IT.
Are the differences reflected in male and femalebelief significant?
In table 7.2 the sector-wise difference is found tobe significant as the corresponding Pearson chisquare value is 0.000 which is well below 0.05.We therefore reject the null hypothesis andaccept the alternate one. Hence, there aresignificant differences in the beliefs of men andwomen about violence as a team damager in allthe three sectors.
S.No. 8 - Lack of Commitment:
Table- 8.1 depicts that in mean rank assigned tolack of commitment as a team damager is 3.7 byHealthcare; 5.5 by IT and 4.8 by Armed Forceprofessionals. This shows a very interestingpicture where lack of commitment is consideredas a vital team damager preferably byprofessionals working in Health care, ArmedForces followed by IT sector. This means thatdeep sense of commitment is extremelyessential, especially in health care sector andarmed forces.
Are the differences reflected in male and femalebelief significant?
In table 8.2 the sector-wise difference is found tobe significant as the corresponding Pearson chisquare value is 0.000 which is well below 0.05.
Volume 2 Issue 1 Team Damaging Behaviours: A study of Sector Based Differences of Indian Professionals
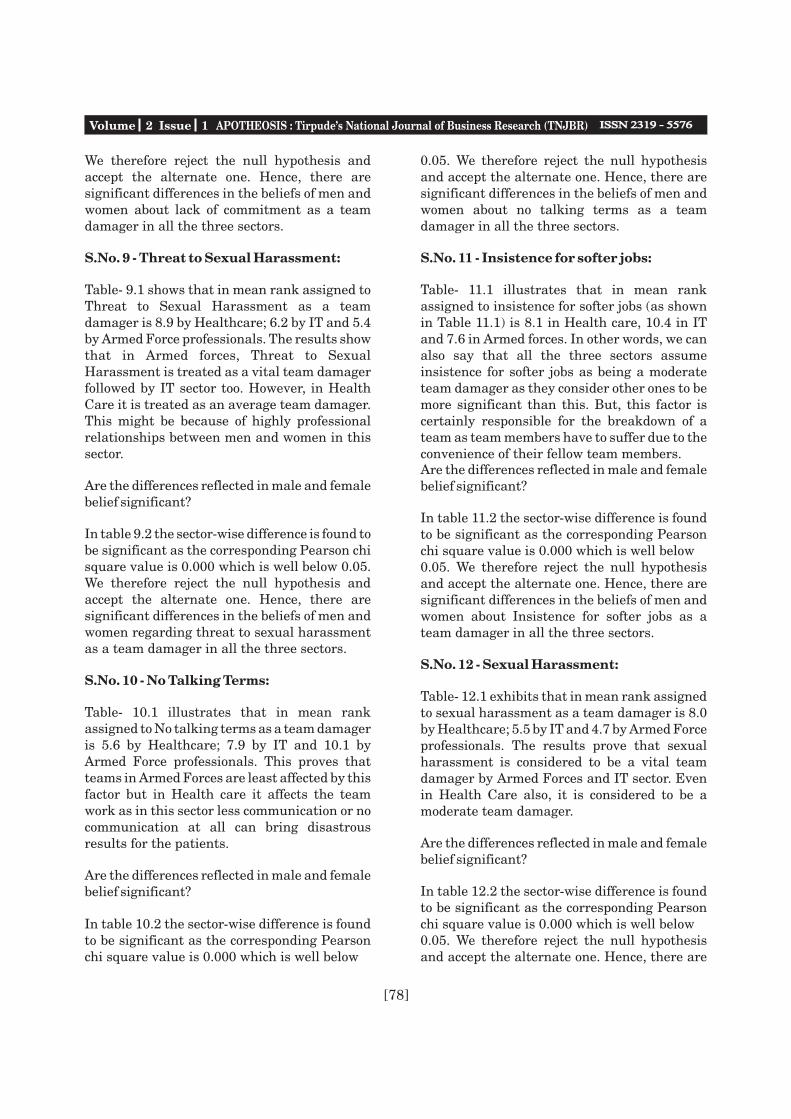
[78]
We therefore reject the null hypothesis andaccept the alternate one. Hence, there aresignificant differences in the beliefs of men andwomen about lack of commitment as a teamdamager in all the three sectors.
S.No. 9 - Threat to Sexual Harassment:
Table- 9.1 shows that in mean rank assigned toThreat to Sexual Harassment as a teamdamager is 8.9 by Healthcare; 6.2 by IT and 5.4by Armed Force professionals. The results showthat in Armed forces, Threat to SexualHarassment is treated as a vital team damagerfollowed by IT sector too. However, in HealthCare it is treated as an average team damager.This might be because of highly professionalrelationships between men and women in thissector.
Are the differences reflected in male and femalebelief significant?
In table 9.2 the sector-wise difference is found tobe significant as the corresponding Pearson chisquare value is 0.000 which is well below 0.05.We therefore reject the null hypothesis andaccept the alternate one. Hence, there aresignificant differences in the beliefs of men andwomen regarding threat to sexual harassmentas a team damager in all the three sectors.
S.No. 10 - No Talking Terms:
Table- 10.1 illustrates that in mean rankassigned to No talking terms as a team damageris 5.6 by Healthcare; 7.9 by IT and 10.1 byArmed Force professionals. This proves thatteams in Armed Forces are least affected by thisfactor but in Health care it affects the teamwork as in this sector less communication or nocommunication at all can bring disastrousresults for the patients.
Are the differences reflected in male and femalebelief significant?
In table 10.2 the sector-wise difference is foundto be significant as the corresponding Pearsonchi square value is 0.000 which is well below
0.05. We therefore reject the null hypothesisand accept the alternate one. Hence, there aresignificant differences in the beliefs of men andwomen about no talking terms as a teamdamager in all the three sectors.
S.No. 11 - Insistence for softer jobs:
Table- 11.1 illustrates that in mean rankassigned to insistence for softer jobs (as shownin Table 11.1) is 8.1 in Health care, 10.4 in ITand 7.6 in Armed forces. In other words, we canalso say that all the three sectors assumeinsistence for softer jobs as being a moderateteam damager as they consider other ones to bemore significant than this. But, this factor iscertainly responsible for the breakdown of ateam as team members have to suffer due to theconvenience of their fellow team members.Are the differences reflected in male and femalebelief significant?
In table 11.2 the sector-wise difference is foundto be significant as the corresponding Pearsonchi square value is 0.000 which is well below 0.05. We therefore reject the null hypothesisand accept the alternate one. Hence, there aresignificant differences in the beliefs of men andwomen about Insistence for softer jobs as ateam damager in all the three sectors.
S.No. 12 - Sexual Harassment:
Table- 12.1 exhibits that in mean rank assignedto sexual harassment as a team damager is 8.0by Healthcare; 5.5 by IT and 4.7 by Armed Forceprofessionals. The results prove that sexualharassment is considered to be a vital teamdamager by Armed Forces and IT sector. Evenin Health Care also, it is considered to be amoderate team damager.
Are the differences reflected in male and femalebelief significant?
In table 12.2 the sector-wise difference is foundto be significant as the corresponding Pearsonchi square value is 0.000 which is well below 0.05. We therefore reject the null hypothesisand accept the alternate one. Hence, there are
Volume 2 Issue 1 APOTHEOSIS : Tirpude's National Journal of Business Research (TNJBR)
[79]
significant differences in the beliefs of men andwomen about sexual harassment as a teamdamager in all the three sectors.
S.No. 13 - Lack of Integrity:
Table- 13.1 shows that in mean rank assigned tolack of integrity as a team damager is 3.7 byHealthcare; 5.1 by IT and 1.9 by Armed Forceprofessionals. This also shows a veryinteresting picture where lack of integrity isconsidered to be the primary team damager inall the three sectors. In Armed Force sectorespecially; due importance and priority is givento Integrity as they have to fight against enemycountries to protect their own nation; followedby Health Care where again the professionalshave to be dedicated towards their patients andlastly the IT sector. Are the differences reflected in male and female
belief significant?
In table 13.2 the sector-wise difference is foundto be significant as the corresponding Pearsonchi square value is 0.000 which is well below 0.05. We therefore reject the null hypothesisand accept the alternate one. Hence, there aresignificant differences in the beliefs of men andwomen about lack of integrity as a teamdamager in all the three sectors.
9. Findings and Suggestions: There are differences, as evinced by this
research work, in all the three sectors regarding the
behavior that may have detrimental effects on
teams. The findings can be shown through table no.
14, where a sector wise difference has been depicted
regarding the perception about the primary team
damagers followed by others respectively:
R A N K H E A L T H C A R E IN F O R M A T IO N
T E C H N O L O G Y
A R M E D F O R C E S
1 L a ck of C o m m itm en t &
L a ck of In tegr ity
E g o-C la sh es L a ck of In tegr ity
2 E g o-C la sh es L a ck of In tegr ity E g o-C la sh es
3 N o T a lkin g T er m s L a ck of C o m m itm en t &
S ex u a l H a ra ssm ent
S ex u a l H a ra ssm ent
4 S eek in g F a vou rs T hrea t to S ex u a l
H a ra ssm ent
L a ck of C o m m itm en t
5 V iolen c e G oss ip in g T hrea t to S ex u a l
H a ra ssm ent
6 S ocia l B o y c ott S ocia l B o y c ott S eek in g F a vou rs
7 R ec k less B eha v iou r R o m a nt ic R ela tio ns hip s Ins is tenc e for S ofter
Job s
8 G ossip in g S eek in g F a vou rs & N
o
T a lk in g T erm s
V iolen c e
9 S ex u a l H a ra ssm ent V iolen c e S ocia l B o y c ott
1 0 Ins is tenc e for S ofter
Job s
R ec k less B eha v iou r R ec k less B eha v iou r
1 1 T hrea t to S ex u a l
H a ra ssm ent
Ins is tenc e for S ofter
Job s
G oss ip in g & R o m a ntic
R ela tio ns h ip s
1 2 R o m a nt ic R ela tio ns hip s N o T a lkin g T er m s
1 3 N IL N IL N IL
Table: 14
Volume 2 Issue 1 Team Damaging Behaviours: A study of Sector Based Differences of Indian Professionals
[80]
Our study finds that in Health Care Sector theprofessionals give more emphasis to lack ofcommitment, lack of integrity, ego-clashes, notalking terms, seeking favours and violence.Similarly, in I.T. sector, emphasize is placed onego-clashes, lack of integrity, lack ofcommitment, sexual harassment, threat tosexual harassment and gossiping. Even inarmed forces, lack of integrity, ego-clashes,sexual harassment, lack of commitment andthreat to sexual harassment are perceived to bethe prime team damagers.
It is interesting to see that all theprofessionals of the above mentioned threesectors stress on the importance of integrity andcommitment and that if it lacks than it could bea vital team damager. Similarly all theprofessionals agree to the importance of ego-clashes, sexual harassment, no talking terms,violence, seeking favours, social boycott andgossiping as important team damagers.
It is important to understand thesedifferences because all the three sectors workon their unique functionalities, where forexample in healthcare and armed-forces it isvery important to be loyal, ethical anddedicated towards the society. Hence, if theteam lacks the sense of integrity, commitmentand togetherness, then it might prove to be amajor set back for the teams working in thesesectors. Whereas in I.T. sector if the teammembers keep on having ego-clashes, fear ofsexual harassment or if any of the memberlooses commitment and integrity towards theattainment of team goals, then the team willhave to suffer a lot. Hence, it is recommended bythe researcher that organizations mustsensitize their professionals in this respectthrough awareness and training programmes.This will not only secure the team work but willa l s o f a c i l i t a t e t h e a c h i e v e m e n t o forganizational goals.
References[1] Affirmative Action: A strong prejudice.(1995, June 17). The Economist, 335, 6970. [2] Applebaum, E., & Batt, R. (1994). The newAmerican workplace. Ithaca, NY: ILR Press.3. Ancona, D., & Caldwell, D. (1992).Demography & design: Predictors of new
product team performance. OrganizationScience, 3, 321341. 4 . A n o n y m o u s , 2 0 1 0 ,http://www.wildevents.co.uk/team-building-problems.htm.5. Arnison, L., & Miller, P. (2002). Virtualteams: A virtue for the conventional team.Journal of Workplace Learning, 14(4), 166-173. 6. Bridges, W. (1994). Jobshift: How to prosperin a workplace without jobs. Reading, MA:Addison-Wesley.\7. Chatman, J., Polzer, J., Barsade, S., & Neale, M. (1998). Being different yet feeling similar:The influence of demographic composition andorganizational culture on work processes andoutcomes. Administrative Science Quarterly,43, 749780.8. Col Gopakumar.M.N., Oct-Dec'2010, Womenin the Indian Army I&II, Indian DefenceReview, Vol-25.9. Drucker, P.F. 1988. The coming of the neworganization. Harvard Business Review, 88(1):45-53.10. Ilgen, D. (1999). Teams embedded inorganizations: Some implications. AmericanPsychologist, 54, 129139.11. Ely, R. & Thomas, D. (2001). Culturaldiversity at work: The effects of diversityperspectives on work group processes andoutcomes. Administrative Science Quarterly,46, 229273.12. Hewstone, M., & Brown, R. (1986). Contact and conflict in intergroup encounters. Oxford,UK: Blackwell.13. Hoffman, E. (1985). The effect of race-rationcomposition on the frequency of organizationalcommunication. Social Psychology Quarterly,48, 1726.14. Jackson, S., Stone, V., & Alvarez, E. (1992).Socialization amidst diversity: The impact ofdemographics on work team old-timers andnewcomers. Research in OrganizationalBehavior, 15, 45109.15. Jarvenpaa, S. L., & Ives, B. (1994). TheGlobal Network Organization of the Future:Information Management Opportunities andChallenges. Journal of ManagementInformation Systems, 10(4), 25-57. 16. Jehn, K.A., Northcraft, G.B., & Neale, M.A.(1999). Why differences make a difference: A
Volume 2 Issue 1 APOTHEOSIS : Tirpude's National Journal of Business Research (TNJBR)

[81]
field study of diversity, conflict, andperformance in workgroups. AdministrativeScience Quarterly, 44, 741763.17. Kanter, R.M. 1983. The change masters:Innovation for productivity in the Americancorporation. New York: Simon and Schuster.18. LaFasto, F., & Larson C. (2001). When teamswork best.19. Lipnack, J., & Stamps, J. (1993). Theteamnet factor: Bringing the power of boundarycrossing into the heart of your business. EssexJunction, VT: Oliver Wight Publishers.20. MacMillan, P. (2001). The performancefactor. Nashville, Tennessee: Broadman &Holman Publishers.21. Mishra, S., Deshmukh, S. G., & Vrat, P.(2002). Matching of technological forecastingtechnique to a technology TechnologicalForecasting and Social Change, 69(1), 1-27. 22. Mohrman, S., Cohen, S., & Mohrman, A.(1995). Designing team-based organizations:New forms for knowledge work. San Francisco,CA: Jossey-Bass.23. Pelled, L., Eisenhardt, K., & Xin, K. (1999).Exploring the black box: An analysis ofworkgroup diversity, conflict, and performance.Administrative Science Quarterly, 44, 128.24. Powell, A., Piccoli, G., & Ives, B. (2004).Virtual Teams: A Review of Current Literatureand Directions for Future Research. Databasefor Advances in Information Systems, 35(1), 6-36.25. Robinson, G., & Dechant, K. (1997).Building a business case for diversity. Academyof Management Executive, 11(3), 2131.26. Riordan, C., & Shore, L. (1997).Demographic diversity and employee attitudes:An empirical examination of relationaldemography within work units. Journal ofApplied Psychology, 82, 342358.27. Sahu, R., K., (2010). Group dynamics andteam building, (pp. 67-70). Excel Books, NewDelhi.28. Suriya,M. & Nagarajan,R. 2003, genderdemocracy in digital economy: An Indianexperience,
. 29. Tolbert, P., Andrews, A., & Simons, T.(1995). The effects of group proportions ongroup dynamics. In S. Jackson & M. Ruderman
unpan1.un.org/intradoc/groups/public/.../apcity/unpan038255
(Eds.), Diversity in work teams (pp. 131159).Washington, DC: APA Books.30. Triandis, H., Kurowski, L., & Gelfand, M.(1993). Workplace diversity. In H. Triandis, M.Dunnette, & L. Hough (Eds.), Handbook ofindustrial and organizational psychology (Vol.4, pp. 769827). Palo Alto, CA: ConsultingPsychologists Press.31. Tsui, A., Egan, T., & O'Reilly, C. (1992).Being different: Relational demography andorganizational attachment. AdministrativeScience Quarterly, 37, 549579.32. Vittal (2003), “ Strategies to empowerwomen in the IT sector” In: The InternationalConference on women in the digitalera:opportunities and challenges, December 10-12,Annamalai University, India.33. Von Hippel, E.A. 1988. Task partitioning: Aninnovation process variable. Working Paper2030-88, Sloan School of Management,Cambridge, MA.34. Walton, R.E. & Hackman, J.R. 1986. Groupsunder contrasting management strategies. InPaul Goodman (Ed.), Designing effective workgroups, 238-254. San Francisco: Jossey-Bass.35. Webber & Donohue, 2001. Perceivedcohesion in a heterogeneous team, Academy ofManagement Journal, 35(1), 91-121.
Volume 2 Issue 1 Team Damaging Behaviours: A study of Sector Based Differences of Indian Professionals
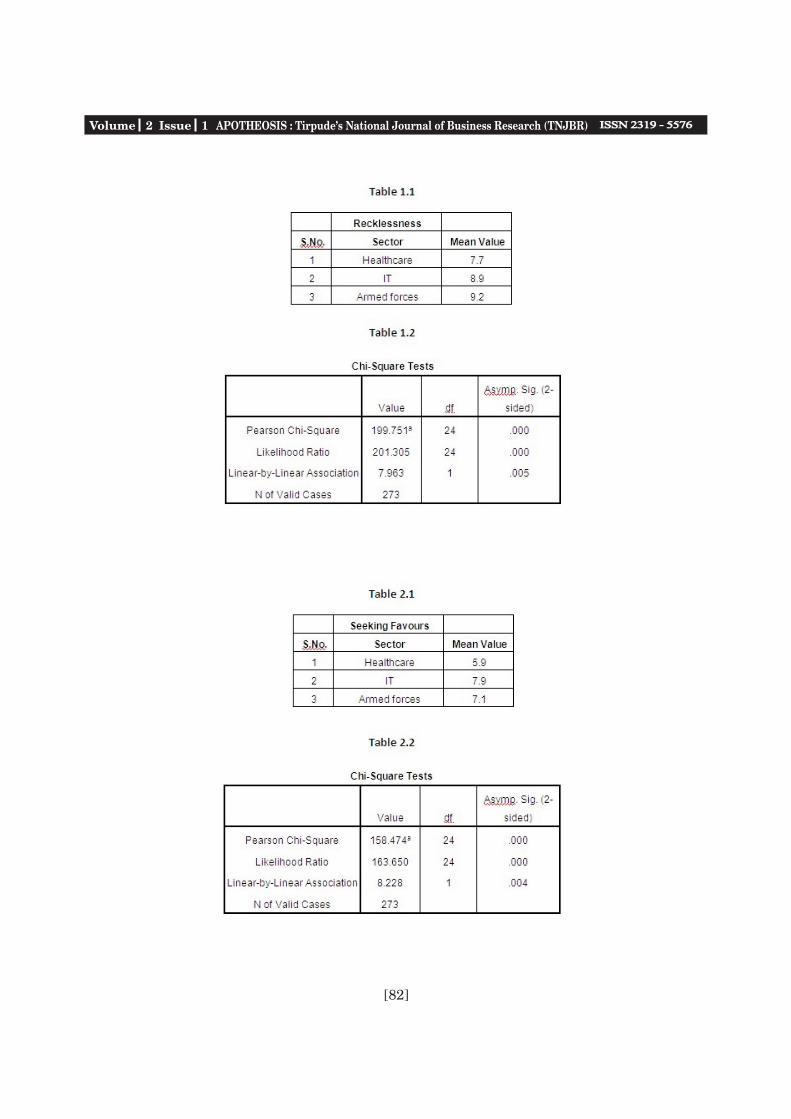
Volume 2 Issue 1 APOTHEOSIS : Tirpude's National Journal of Business Research (TNJBR)
[82]
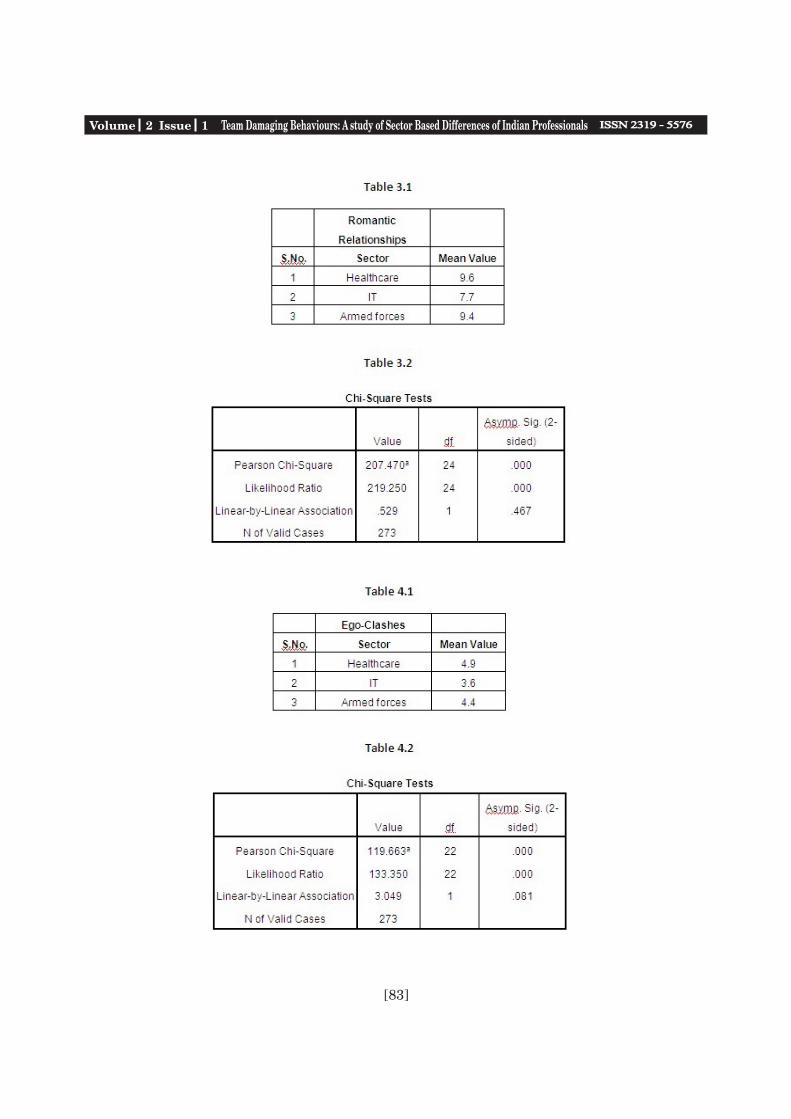
[83]
Volume 2 Issue 1 Team Damaging Behaviours: A study of Sector Based Differences of Indian Professionals

[84]
Volume 2 Issue 1 APOTHEOSIS : Tirpude's National Journal of Business Research (TNJBR)
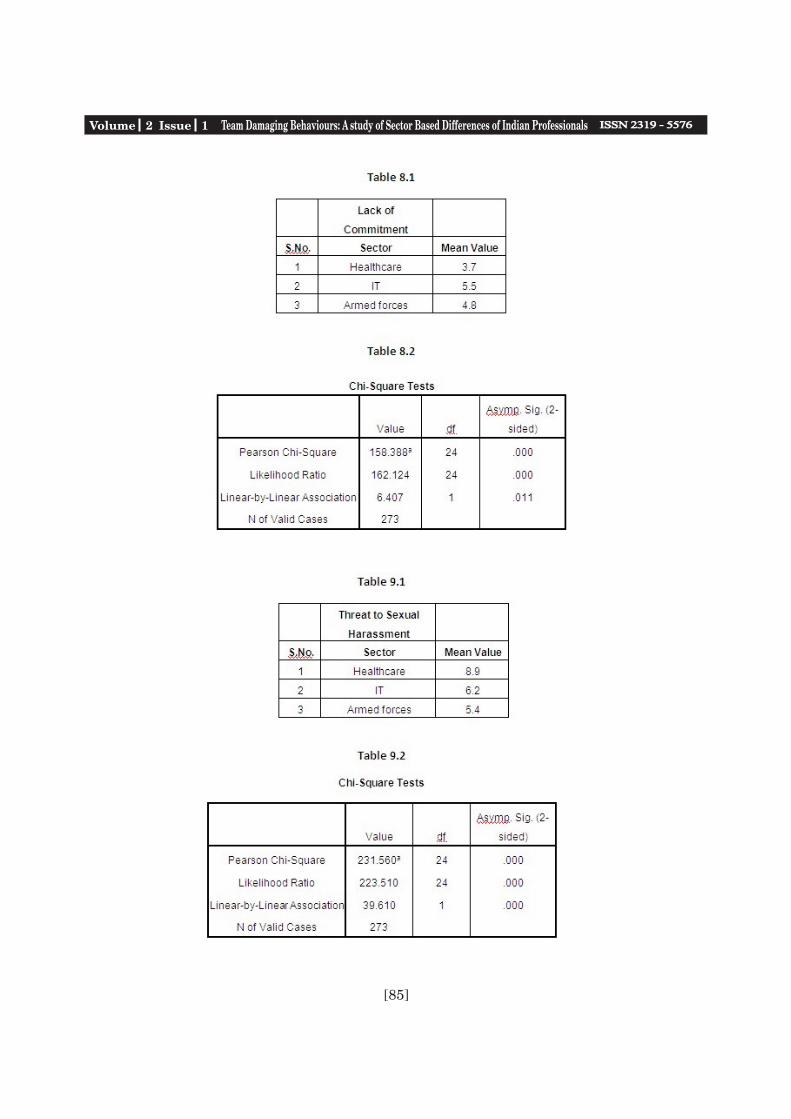
[85]
Volume 2 Issue 1 Team Damaging Behaviours: A study of Sector Based Differences of Indian Professionals
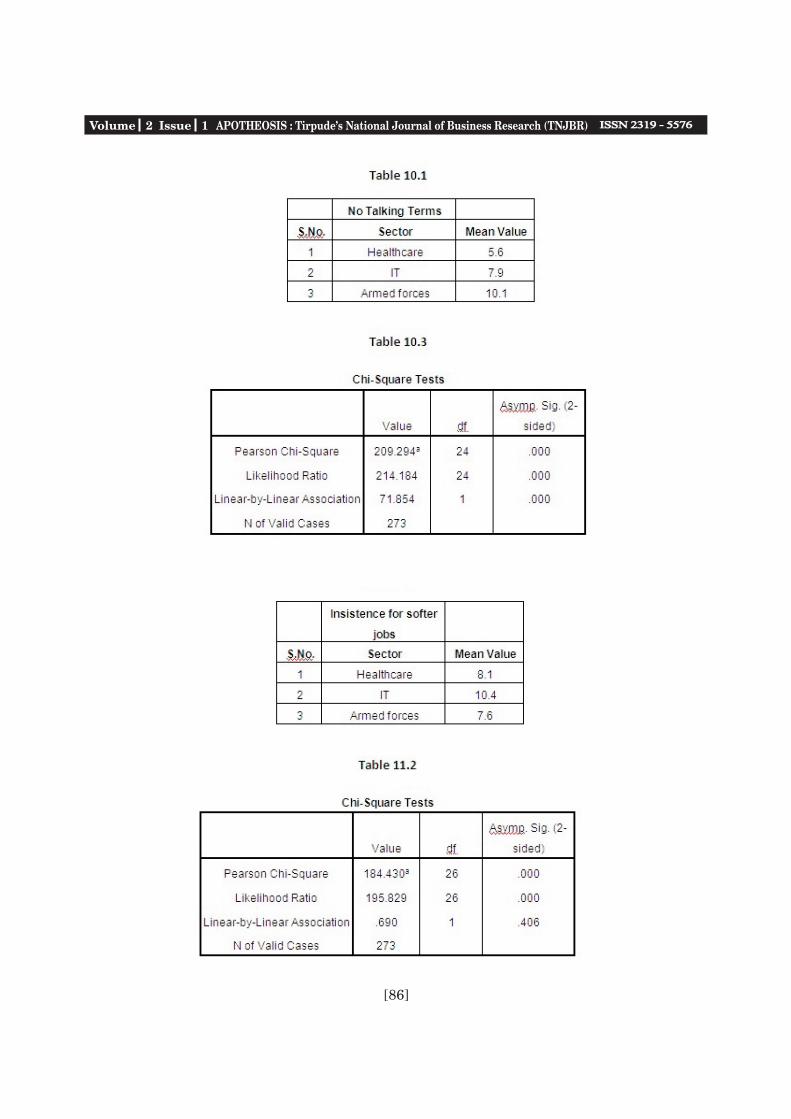
Volume 2 Issue 1 APOTHEOSIS : Tirpude's National Journal of Business Research (TNJBR)
[86]
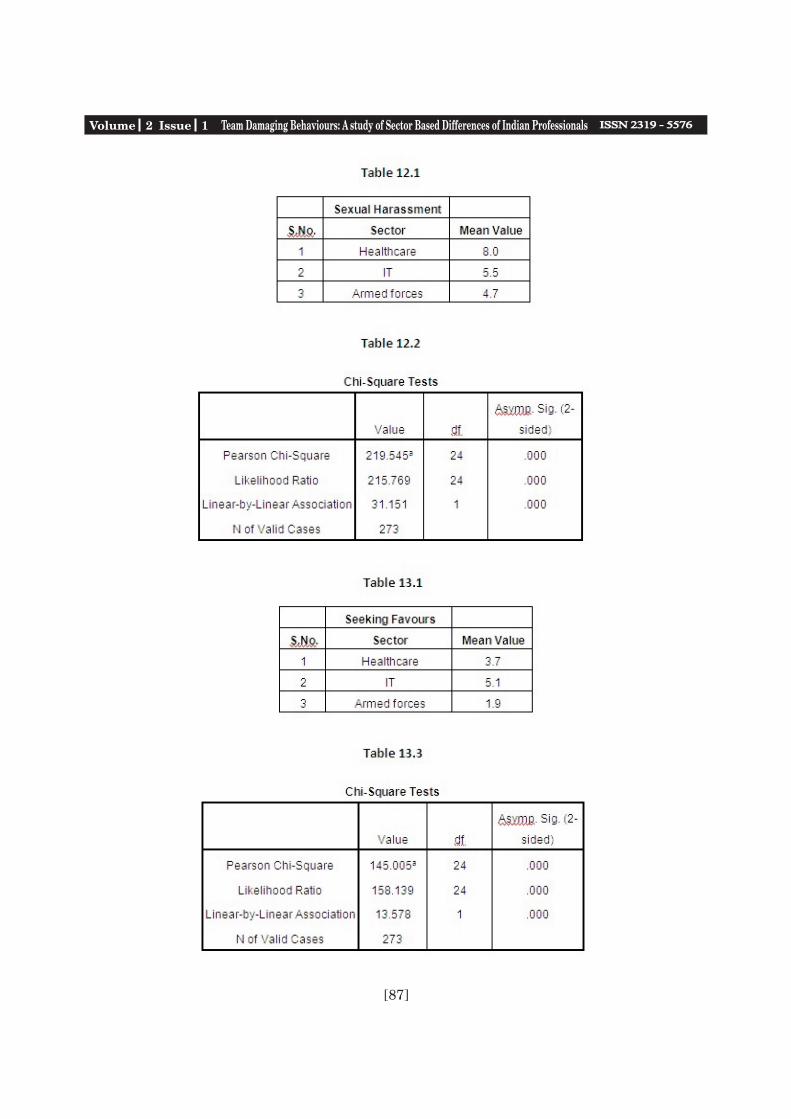
[87]
Volume 2 Issue 1 Team Damaging Behaviours: A study of Sector Based Differences of Indian Professionals

Volume 2 Issue 1 APOTHEOSIS : Tirpude's National Journal of Business Research (TNJBR)
Abstract : Aviation Industry in India is one of the fastest growing industries in the world. DuringJanuary-August 2010, 339.09 lakh (33.9 million) passengers travelled across India, as against 284.24lakh (28.42 million) passengers in the year 2009, registering a growth of 19.3 per cent. The studyprimarily aims to examine the job satisfaction of employees in Airlines industry. The study was basedon primary data and 50 employees from various airline companies who were surveyed for the purpose.The data was collected for the period November 2007 to January 2008 and it was tabulated andanalysed using simple percentages, Chi-square test, Multiple Linear regression model anddiscriminant analysis. The study found that most of the employees in airlines industry were satisfied intheir jobs although not because of enough salary but due to favourable working conditions and someother benefits, which are exclusively available to them when compared to other workers.
[88]
Keywords : Airline industry, Employees, Job satisfaction, Chi-square test, Multiple Linear regressionmodel and discriminant analysis.
A Study on Job Satisfaction of Employees in Airlines Industry
P. Manimalathi*, Dr. B. Vanitha**
Aviation Industry in India is one of thefastest growing industries in the world. Nowdays, airlines become a common man's vehicleand have revolutionized the way a commonIndian traveler used for travel. With theliberalization of the Indian aviation sector ithas undergone a rapid transformation. Frombeing primarily a government-owned industry,the Indian aviation industry is now dominatedby privately owned full service airlines and lowcost carriers. Private airlines account foraround 75 per cent share of the domesticaviation market.
Indian aviation industry is the ninthlargest in the world. During January-August2010, 339.09 lakh (33.9 million) passengerstravelled across India, as against 284.24 lakh (28.42 million) in the year 2009, registering agrowth of 19.3 per cent. There are a few playersin the industry such as Kingfisher Airlines andKingfisher Red (previously Air Deccan), JetAirways and Jet Lite (previously Air Sahara),Air India and Indian (previously IndianAirlines), IndiGo, SpiceJet, GoAir, ParamountAirways and MDLR Airlines. Jet Airways is themarket leader with a share of 27 per cent.
During the British period in India,Coimbatore entered the aviation map of India.The seeds of air route were sowed by the Britishand easily picked up by the government of Indiain the aviation sector. The Coimbatore Airport
is constructed at Peelamedu on the Avinashiroad about 13 Kms from Coimbatore City. Thepeople of Coimbatore, Tiruppur, Erode,Pollachi, Udulmalpet and hilly regions of Ooty,Kothagiri and Coonoor enjoy the advantages of Coimbatore Airport.
I. Objectives of the Study
The major objectives of the study are givenbelow:1) To examine the socioeconomic profile of theemployees in airline industry. 2) To examine the level of job satisfaction amongthe airline employees.3) To make recommendations to improve the level of job satisfaction of the airline employees.
II. Review of Literature Peng S. Chant and Toshiyuki Sueyoshis
(1991) examined the impact of deregulation onstrategic management and performance in the U.S Airline industry. Bahram Adrangi et al.,(1999) examined the effects of market structureand technology on airline fleet composition inthe domestic airline industry. Numerousresearchers (Brueckner, Dyer, and Spiller 1992;Kim and Singal 1993) have analyzed theindustry with empirical studies emphasizingthe competitive interaction and pricingbehaviour of airline firms in an oligopolystructure in the wake of mergers. Borenstein
***
[89]
1989 examined the effect of hub-and-spokenetworks on airline competition, thecompetitive effects of the industry's significantentry barriers, and the effect of low-farecarriers. Charles K. Ng and Paul Sea Bright(2001) in their study, made an attempt toexamine the extent to which the costs of airlineoperations are affected by rents accruing toworkers and the extent to which these rentsdepend inter alias upon the degree ofcompetition in the industry.
III. MethodologyThe locale of the study was confined to
Coimbatore city limits on the grounds of ease tocollect data and time constraints. The studywas based on the primary data, which wascollected with the help of well-structured andpre-tested interview schedule, administered to50 airline employees in the City. The data wascollected during the period November 2007 toJanuary 2008 and it was tabulated andanalysed by using simple percentages, Chi-square test and discriminant analysis. In thisstudy, Likert scale was used to determine thesatisfaction of employees on various aspects.
IV. Limitations of the Study1) It is micro level study. Thus the findings ofthe study may not be applicable for macro level. 2) The study was based on primary data. Hence,the inadequacies of primary data also hold here. 3) Due to limited time, money and other factors,the study could cover only small number ofrespondents in Coimbatore city.
V. The Major Findings of the Study 4.1 Socio-Economic Profile1) In the airline industry most of the employeesbelong to the age group of 20-30 (94%) and theremaining employees belong to the age group of30-40 (6%).2) Among the 50 employees, 52 per cent of theemployees were male and 48 per cent of theemployees were females.3) Most of the employees were unmarried in theindustry.4) Concerning educational status, majority ofthe employees were under graduates.5) Out of 50 employees, most of the employeeswere earning monthly income of Rs.10, 000-
20,000.6) The distance between office and place ofresidence for most of the employees (62%) wasbetween 5-10 kilometers.7) Majority of the employees had 0-4 years ofexperience (82%).8) Most of the employees were working only theday shift.
4.2 Job Satisfaction among the AirlineEmployees1) Majority of the employees were satisfied withthe nature of work allotted to them.2) Most of the employees (74 per cent) wanted tocontinue their present job due to somemonetary benefits existing in their company.3) Majority of the employees were highlysatisfied with the existing working conditionspresently available to them.4) All the employees have facilities such ascanteen, rest room and recreation facilityexcept residential accommodation (32 per cent)in their company.5) Majority of the employees were highlysatisfied with the facilities such as leave facility,medical facility and adequate trainingprogrammes provided by the employers.6) There is less interference from higherauthorities in job and all of the employees weregetting timely help and guidance from theircolleagues.7) Most of the employees get enough freedomand they were more satisfied with therelationship among their customers.8) Most of the employees were highly satisfiedwith the present salary, prevailing level ofincentives and allowances.9) Majority (62 per cent) of the employees haveopined that merit cum seniority is an importantfactor to determine one's promotion in acompany.
4.3 Association between Income of AirlineEmployees and Selected Socio-EconomicFactors : Chi-square test was done to examinethe association between income of airlineemployees and selected socio-economicvariables. This is because income is oftenconsidered to be an important determinant tomeasure job satisfaction of employees. Hence,Null hypothesis is framed as below:
Volume 2 Issue 1 A Study on Job Satisfaction of Employees in Airlines Industry

[90]
H o : T h e r e i s n o a s s o c i a t i o n b e t w e e n i n c o m e o f t h e e m p l o y e e s a n d selected socio-economic factors.Ha: The variables are associated.The estimated Chi-square values are given in table 1.
Table 1 Association of Income of Airline Employees and Selected
Socioeconomic Variables
S.NO Variables Degrees offreedom
Level ofsignificance
Calculatedvalue
Result
1. Age 2 5 percent 3.240 Rejected 2. Sex 2 5 percent 4.142 Rejected 3. Educational level 4 5 percent 3.344 Rejected 4. Marital status 6 5 percent 7.923 Rejected 5. Work experience 4 5 percent 26.946 Accepted 6. Distance between company
and residence 4 5 percent 3.357
Rejected
7. Mode of conveyance 4 5 percent 34.551 Accepted 8. Working pattern 4 5 percent 1.458 Rejected 9. Nature of work 8 5 percent 6.766 Rejected
Source: Based on primary data
The table evident it is evident from the table that work experience and mode of conveyancediffered with regard to income of the airline employees. However, the remaining variables such as age,sex, educational level, marital status, distance between company and residence, working pattern andnature of work significantly did not differ with regard to income of the employees who participated onthe study.4.4 Determinants of Income of the Employees : In order to find the factors which influence theincome of the employees, variables such as sex, educational qualifications, work experience andpattern of work were considered. The estimated multiple regression model of the form is given below. Y = ß 0 + ß1X1 + ß2X2+ ß3X3+ ß4X4+ u Where, Y Income of the employees, X1 Sex, X2 Educational qualifications, X3 Work experience, X4 Pattern of work, u Error term, ß1, ß2, ß3, ß4 Partial regression co-efficient, ß0 Intercept. Theestimated results are shown in Table 2.
Table 2 Partial Regression Co-Efficient and Level of Significance
S.NO Variables Partial regression co-efficient
Standarderror
T value
1. Work experience .868 .174 4.982@ 2. Pattern of work -.059 .135 -.440 3. Educational level -.017 .107 -.157 4. Sex .148 .154 .342
@ - significant at 5% level The estimated multiple regression equation is given below: Y = .274 + .148X1 - .017X2 + .868X3 - .059X4 + u R² = 0.42
Volume 2 Issue 1 APOTHEOSIS : Tirpude's National Journal of Business Research (TNJBR)
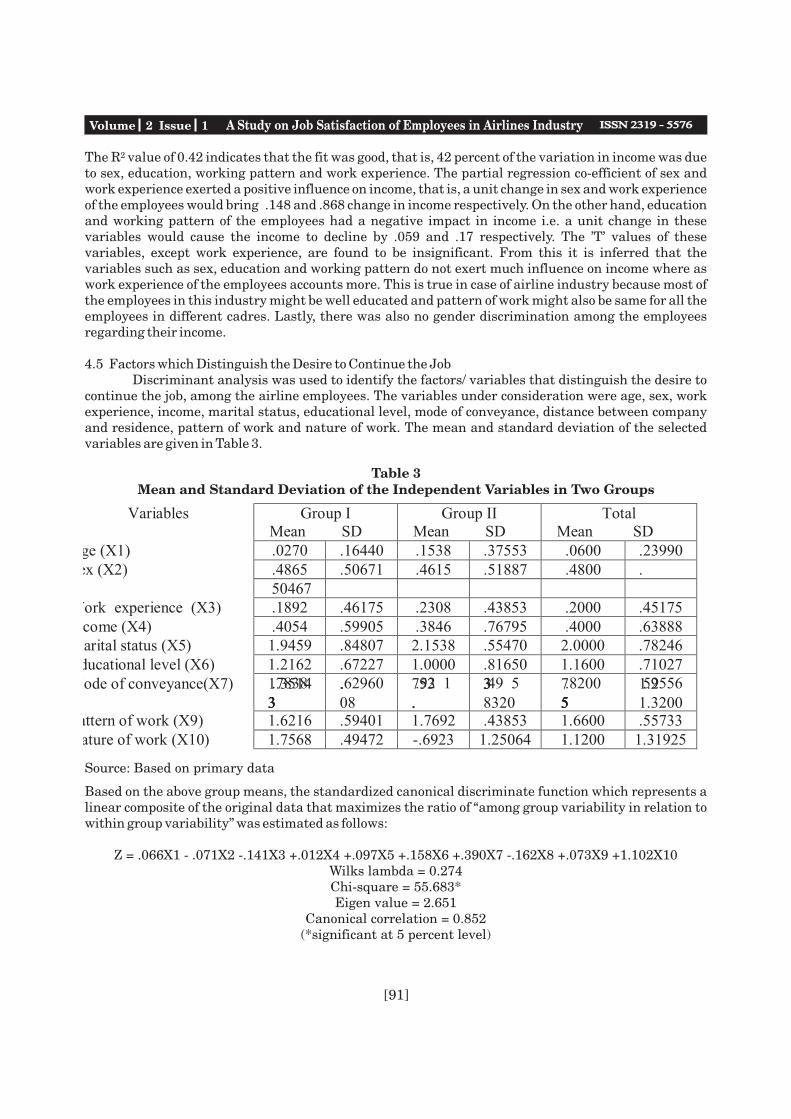
[91]
The R² value of 0.42 indicates that the fit was good, that is, 42 percent of the variation in income was dueto sex, education, working pattern and work experience. The partial regression co-efficient of sex andwork experience exerted a positive influence on income, that is, a unit change in sex and work experienceof the employees would bring .148 and .868 change in income respectively. On the other hand, educationand working pattern of the employees had a negative impact in income i.e. a unit change in thesevariables would cause the income to decline by .059 and .17 respectively. The 'T' values of thesevariables, except work experience, are found to be insignificant. From this it is inferred that thevariables such as sex, education and working pattern do not exert much influence on income where aswork experience of the employees accounts more. This is true in case of airline industry because most ofthe employees in this industry might be well educated and pattern of work might also be same for all theemployees in different cadres. Lastly, there was also no gender discrimination among the employeesregarding their income.
4.5 Factors which Distinguish the Desire to Continue the Job Discriminant analysis was used to identify the factors/ variables that distinguish the desire to
continue the job, among the airline employees. The variables under consideration were age, sex, workexperience, income, marital status, educational level, mode of conveyance, distance between companyand residence, pattern of work and nature of work. The mean and standard deviation of the selectedvariables are given in Table 3.
Table 3 Mean and Standard Deviation of the Independent Variables in Two Groups
Variables Group I Mean SD
Group II Mean SD
Total Mean SD
Age (X1) .0270 .16440 .1538 .37553 .0600 .23990 Sex (X2) .4865 .50671 .4615 .51887 .4800 .
50467 Work experience (X3) .1892 .46175 .2308 .43853 .2000 .45175Income (X4) .4054 .59905 .3846 .76795 .4000 .63888 Marital status (X5) 1.9459 .84807 2.1538 .55470 2.0000 .78246Educational level (X6) 1.2162 .67227 1.0000 .81650 1.1600 .71027Mode of conveyance(X7) 1.3514 ... 753 333 7 1.2
333 08 ... 8320 555 1.3200... 76772
Distance between company and residence (X8)
.7838 62960 .92 1 49 5 .8200 59556
Pattern of work (X9) 1.6216 .59401 1.7692 .43853 1.6600 .55733Nature of work (X10) 1.7568 .49472 -.6923 1.25064 1.1200 1.31925
Source: Based on primary data
Based on the above group means, the standardized canonical discriminate function which represents alinear composite of the original data that maximizes the ratio of “among group variability in relation towithin group variability” was estimated as follows:
Z = .066X1 - .071X2 -.141X3 +.012X4 +.097X5 +.158X6 +.390X7 -.162X8 +.073X9 +1.102X10Wilks lambda = 0.274 Chi-square = 55.683*Eigen value = 2.651
Canonical correlation = 0.852(*significant at 5 percent level)
Volume 2 Issue 1 A Study on Job Satisfaction of Employees in Airlines Industry

[92]
In the above function the variables age, income, marital status, education, mode of conveyance,pattern of work and nature of work had a positive sign indicating that these variables had higherdiscriminating power between groups. In short, it was these variables which distinguished theemployees on who want to continue the job and who do not want to continue the job. Hence, the othervariables such as sex, work experience and distance between company and residence had a negative signimplying that these variables were commonly regarded as suppressor variables. The Wilks lambda andChi-square value indicated that the function was significant at 5 percent level. The canonical correlationassociated with the discriminant function was 0.85 which implies that 85 percent of the variation in thedependent variable was accounted by this model.
The relative discriminating power of the variables in differentiating group1 from group2 aregiven in Table 4.
Table 4 Relative Discriminating Power
Variable Discriminating power Relative discriminatingpower
Age 0.0354 0.93 Sex 0.0038 0.10
Work experience 0.0129 0.34 Income 0.0040 0.11
Marital status 0.0256 0.67 Educational level 0.0480 1.26
Mode of conveyance 0.0607 1.59 Distance between company
and residence 0.0378 0.99
Pattern of work 0.0193 0.51 Nature of work 3.5610 93.50
Source: Based on primary data
I. Conclusion Aviation sector is one of the fastest
growing sectors in the Indian economy but nocommon people have sufficient knowledgeabout this industry unlike railways. The studyfound that the most of the employees in airlineindustry were satisfied in their job though notbecause of enough salary but due to favorableworking conditions and some other benefitswhich are exclusively available to them whencompared to other workers.
II. Suggestions to Improve the Level of JobSatisfaction among Airline Employees\1) The main problem in airline industry is thatthe facilities provided for the workers were notsame for all the employees in different cadres.Hence, the management can take proper stepsin order to reach the facilities beyond
discriminations in cadre positions. 2 ) T h e m a n a g e m e n t c a n p r o v i d eaccommodation facility to increase the level ofjob satisfaction of their employees.3) The management can also give incentives forthose workers who do their job very sincerelyand efficiently.Reference 1) Adrangi B., G. Chow, and K. Raffiee (1996),'Passenger output and labour productivity inthe U.S. airline industry after deregulation: Aprofit function approach', Logistics andtransportation review, vol: 32, pp: 389-407.2) Bahram Adrangi et al (1999), 'The effects ofmarket structure and technology on airlinefleet composition after deregulation', review ofindustrial organization, vol: 15, pp: 77-88.3) Borenstein S. (1989), 'Hubs and high fares:Dominance and market power in the U.S.
Volume 2 Issue 1 APOTHEOSIS : Tirpude's National Journal of Business Research (TNJBR)
[93]
airline industry', Rand journal of economics,vol: 14, pp: 344-365.4) Charles K. Ng and Paul Seabright (2001),competition privatization and productiveefficiency: Evidence from the airline industry',The economic journal, vol: 111, pp: 591-619. 5) Kevin Pak and Nanda Piersma (2002),'Overview of OR techniques for airline revenuemanagement', Statistica Neerlandica, vol:56(4), pp: 480-496.6) Klein, Stefan and Loebbecke, Claudia (2003),'Emerging pricing strategies on the web:Lessons from the airline industry', Electronicmarkets, vol: 13(1), pp: 46-58.www.Blackwellsynergy.comwww.spingerlink.Comwww.informaworld.com
Volume 2 Issue 1 A Study on Job Satisfaction of Employees in Airlines Industry
Abstract : As equity markets decline, REITs (Real Estate Investment Trusts) become moreappealing to investors. Although REITs stocks are equity based their continual return is more bond-like in nature. This paper analyses realization of alpha (excess market returns) through investing inREITs and the process for investing in real estate based equities. (US and Australia)
Design/methodology/approach The usually suggested multivariate normal or variance-covariance approach is applied, the dependence structure between returns of Australian REITs andthe Australian stock market. The value-at-risk measure is applied for quantification of the risks fora portfolio solely dependent on real estate or stock markets.
Findings The findings suggest that the univariate normal model is appropriate to measuredependence between the returns of the two asset classes. It further illustrates that the usuallyapplied variance-covariance approach leads to a fairly accurate estimation of the actual risk for aportfolio consisting of investments in REITs and equity indices. The nature of risk is adequatelycaptured by the suggested univariate models. Also, the results clearly illustrate that investing inREIT gives higher returns as compared to stock markets of US and Australia.
[94]
* Symbiosis Centre for Management and Human Resource Development (SCMHRD)
* Symbiosis International University Symbiosis Infotech Campus,
Plot No. 15, Rajiv Gandhi Infotech Park,
MIDC, Hinjewadi,
Amit Sharma*, Abishek Sharma**, Rudhreesh Kapur***
Introduction
Alpha is a measure of an assets riskrelative to the overall market. It reflects thedifference between an assets actualperformance and the performance expectedbased on risk level taken by the fund's manager.A fund that produced the expected return forthe level of risk assumed has an Alpha of zero. Apositive Alpha shows that the managerproduced a return greater than expected for therisk taken. A negative Alpha indicates that themanager has produced a return smaller thanexpected relative to the risk taken.
In the last decade, the market for realestate investment trusts (REITs) has shownsubstantial growth rates. REITs were originallya tax design for corporations investing in realestate assets in order to reduce or eliminate thecorporate income tax. Overall, the REITstructure was designed to provide a somewhatsimilar vehicle for investments in real estatemarkets as mutual funds provide forinvestments in stocks. For instance, Australianreal estate investment trusts (AREITS) are a
unitized portfolio of property assets, listed onthe Australian stock exchange, which allowinvestors to purchase a share in a diversifiedand professionally managed portfolio of realestate.
According to 2011 Australian REITSurvey conducted by (BDO Corporate Finance)the top 40 REITs in Australia had assets of $148billion as of June 30, 2011. It excluded entitieswith a market capitalisation of less than $10million. In the US, REITs gained 28.0% on atotal-return basis during 2010, much higherthan the S&P 500 (+14.8%). Fundamentals areclearly improving across the space, and REITdisplayed high positive alpha. Also, theperception that REITs could serve as a hedge inthe event of an economic downturn makes REITan excellent opportunity to invest.
Overall, the market can be classified byoffering four different types of REITs:
(1) Equity trusts where the assets are investedin ownership claims to various types ofproperties like residential, commercial orindustrial property.
Volume 2 Issue 1 APOTHEOSIS : Tirpude's National Journal of Business Research (TNJBR)
Seeking Alpha through REITs
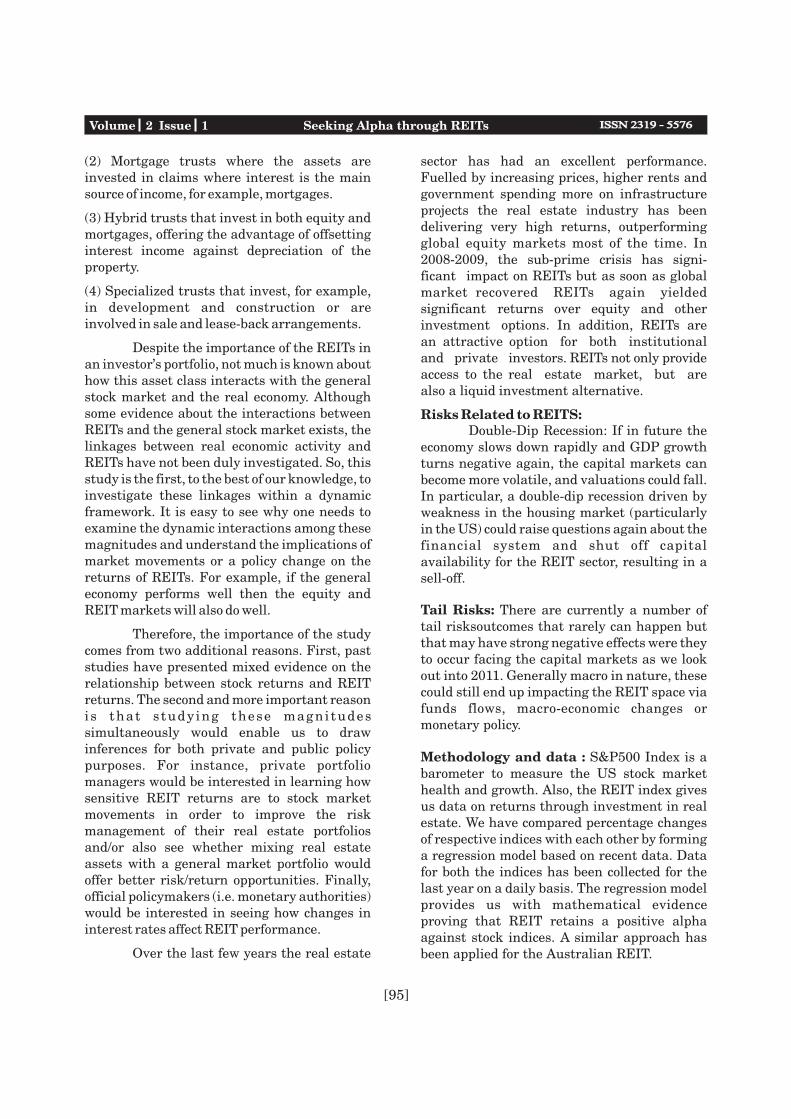
Volume 2 Issue 1 Seeking Alpha through REITs
[95]
(2) Mortgage trusts where the assets areinvested in claims where interest is the mainsource of income, for example, mortgages.
(3) Hybrid trusts that invest in both equity andmortgages, offering the advantage of offsettinginterest income against depreciation of theproperty.
(4) Specialized trusts that invest, for example,in development and construction or areinvolved in sale and lease-back arrangements.
Despite the importance of the REITs inan investor's portfolio, not much is known abouthow this asset class interacts with the generalstock market and the real economy. Althoughsome evidence about the interactions betweenREITs and the general stock market exists, thelinkages between real economic activity andREITs have not been duly investigated. So, thisstudy is the first, to the best of our knowledge, toinvestigate these linkages within a dynamicframework. It is easy to see why one needs toexamine the dynamic interactions among thesemagnitudes and understand the implications ofmarket movements or a policy change on thereturns of REITs. For example, if the generaleconomy performs well then the equity andREIT markets will also do well.
Therefore, the importance of the studycomes from two additional reasons. First, paststudies have presented mixed evidence on therelationship between stock returns and REITreturns. The second and more important reasonis that s tudying these magni tudessimultaneously would enable us to drawinferences for both private and public policypurposes. For instance, private portfoliomanagers would be interested in learning howsensitive REIT returns are to stock marketmovements in order to improve the riskmanagement of their real estate portfoliosand/or also see whether mixing real estateassets with a general market portfolio wouldoffer better risk/return opportunities. Finally,official policymakers (i.e. monetary authorities)would be interested in seeing how changes ininterest rates affect REIT performance.
Over the last few years the real estate
sector has had an excellent performance.Fuelled by increasing prices, higher rents andgovernment spending more on infrastructureprojects the real estate industry has beendelivering very high returns, outperformingglobal equity markets most of the time. In 2008-2009, the sub-prime crisis has signi-ficant impact on REITs but as soon as global market recovered REITs again yielded significant returns over equity and other investment options. In addition, REITs are an attractive option for both institutional and private investors. REITs not only provide access to the real estate market, but are also a liquid investment alternative.
Risks Related to REITS:Double-Dip Recession: If in future the
economy slows down rapidly and GDP growthturns negative again, the capital markets canbecome more volatile, and valuations could fall.In particular, a double-dip recession driven byweakness in the housing market (particularlyin the US) could raise questions again about thefinancial system and shut off capitalavailability for the REIT sector, resulting in asell-off.
Tail Risks: There are currently a number oftail risksoutcomes that rarely can happen butthat may have strong negative effects were theyto occur facing the capital markets as we lookout into 2011. Generally macro in nature, thesecould still end up impacting the REIT space viafunds flows, macro-economic changes ormonetary policy.
Methodology and data : S&P500 Index is abarometer to measure the US stock markethealth and growth. Also, the REIT index givesus data on returns through investment in realestate. We have compared percentage changesof respective indices with each other by forminga regression model based on recent data. Datafor both the indices has been collected for thelast year on a daily basis. The regression modelprovides us with mathematical evidenceproving that REIT retains a positive alphaagainst stock indices. A similar approach hasbeen applied for the Australian REIT.

[96]
Data and preliminary statistical resultsThe data sample contains daily
observations that combine the followingvariables. For the four categories of REITsnamely equity, mortgage, hybrid and compositewe obtained the total index return. Thesample's period is from December 2010 toDecember 2011 and the main source isBloomberg. The other variables are the S&P500 continuously compounded returns and the
growth rate of industrial production. Industrialproduction is a proxy for real economic activity.As there are different REIT structures indifferent economies, we have performedregression on last one year data of bothAustralia and the US.
RESULTS (Performed in Excel2007)
SUMMARY OUTPUT
Regression Statistics
Multiple R 0.747552469
R Square 0.558834693
Adjusted R Square 0.557062945
Standard Error 0.788836885
Observations 251
Coefficients Standard Error t Stat P-value
Intercept 0.021286388 0.049845456 0.4270477 0.6697136
X Variable 1 0.727341538 0.040954131 17.759906 3.813E-46
Y=0.0213+0.73X
TABLE1-Results for regression analysis- REIT index (Australia) & S&P500 stock index.(daily
percentage change)
Volume 2 Issue 1 APOTHEOSIS : Tirpude's National Journal of Business Research (TNJBR)
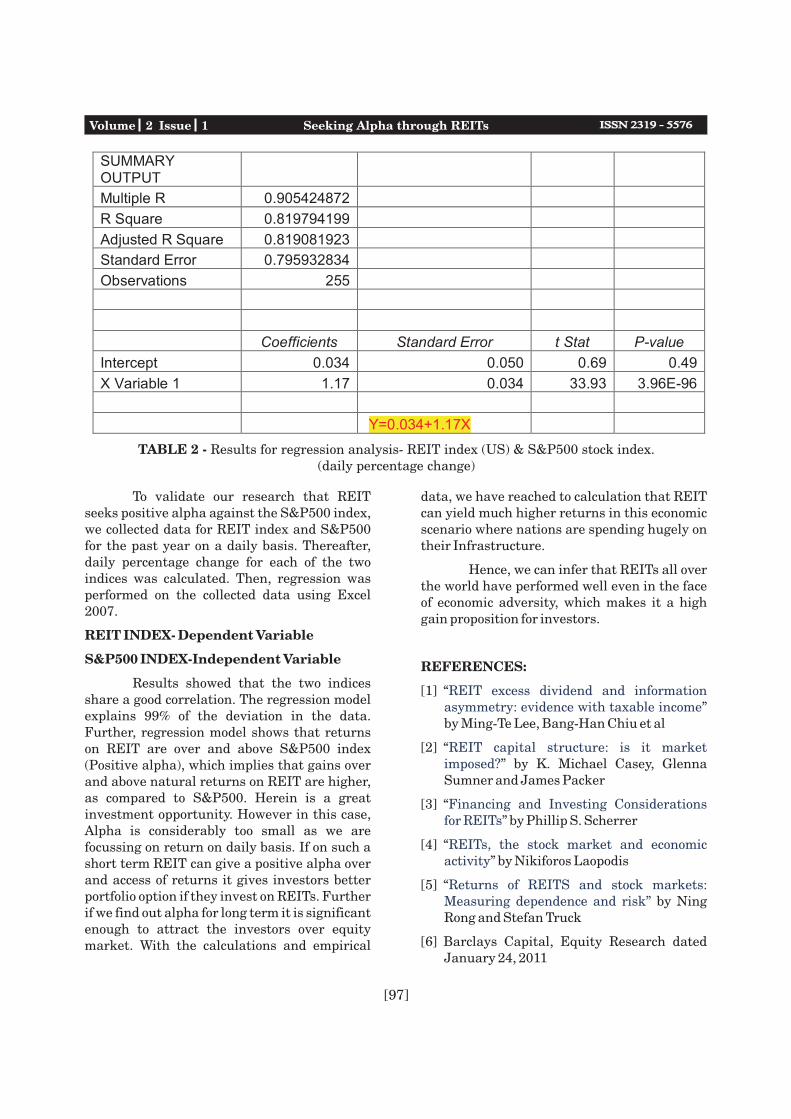
[97]
SUMMARYOUTPUT
Multiple R 0.905424872
R Square 0.819794199
Adjusted R Square 0.819081923
Standard Error 0.795932834
Observations 255
Coefficients Standard Error t Stat P-value
Intercept 0.034 0.050 0.69 0.49
X Variable 1 1.17 0.034 33.93 3.96E-96
Y=0.034+1.17X
To validate our research that REITseeks positive alpha against the S&P500 index,we collected data for REIT index and S&P500for the past year on a daily basis. Thereafter,daily percentage change for each of the twoindices was calculated. Then, regression wasperformed on the collected data using Excel2007.
REIT INDEX- Dependent Variable
S&P500 INDEX-Independent Variable
Results showed that the two indicesshare a good correlation. The regression modelexplains 99% of the deviation in the data.Further, regression model shows that returnson REIT are over and above S&P500 index(Positive alpha), which implies that gains overand above natural returns on REIT are higher,as compared to S&P500. Herein is a greatinvestment opportunity. However in this case,Alpha is considerably too small as we arefocussing on return on daily basis. If on such ashort term REIT can give a positive alpha overand access of returns it gives investors betterportfolio option if they invest on REITs. Furtherif we find out alpha for long term it is significantenough to attract the investors over equitymarket. With the calculations and empirical
data, we have reached to calculation that REITcan yield much higher returns in this economicscenario where nations are spending hugely ontheir Infrastructure.
Hence, we can infer that REITs all overthe world have performed well even in the faceof economic adversity, which makes it a highgain proposition for investors.
REFERENCES:
[1] “”
by Ming-Te Lee, Bang-Han Chiu et al
[2] “” by K. Michael Casey, Glenna
Sumner and James Packer
[3] “” by Phillip S. Scherrer
[4] “” by Nikiforos Laopodis
[5] “by Ning
Rong and Stefan Truck
[6] Barclays Capital, Equity Research datedJanuary 24, 2011
REIT excess dividend and informationasymmetry: evidence with taxable income
REIT capital structure: is it marketimposed?
Financing and Investing Considerationsfor REITs
REITs, the stock market and economicactivity
Returns of REITS and stock markets:Measuring dependence and risk”
TABLE 2 - Results for regression analysis- REIT index (US) & S&P500 stock index.(daily percentage change)
Volume 2 Issue 1 Seeking Alpha through REITs

Abstract : In the recent times, there has never been any concept of management that is notconsistently considered a crucial element of work system design in modern organizations. As isconsidered by both the practitioners and the researchers, the concept of empowerment is known morefor its straight forward linkages to performance and productivity in the west. However, after adecade and odd years the research and practice cases proved that such linkages are not uniformacross the world. Contrary to the western coceptualisation, this paper presents alternative view thatEmpowerment is a managerial approach for motivating employees to work in an immediate workplace on one hand and an including technique for long term commitment among them on the otherhand. Thus, empowerment is related to employee loyalty in this study, which is also supportedstatistically when both were measured. Implications are drawn for improving empowerment foremployee loyalty.
[98]
* Associate Professor & Head, Commerce Department, M.J.College of Commerce, Bhavnagar University, Bhavnagar-364001, (Guj)
“Employee Empowerment and Loyalty: An Analysis of their Relationship”
Dr. Brijrajsinh P.Gohil*
“Employee Empowerment and Loyalty:An Analysis of their Relationship”
Introduction to Empowerment:
T h e i m p o r t a n c e o f e m p l o y e eempowerment as a concept for research is everincreasing, despite being recognized as aproven modern management technique thatenables employees to have personal motivationto work and to commit to the goal of theorganization while expressing a sense ofresponsibility in the organization (Conger andKanangoo, 1988).
Literature on empowerment is quitereplete with large number of theoreticalspeculations rather than empirically testedaspects of employee empowerment. However, inthe recent times, there have been some studiesconducted to reemphasize the importance ofempowerment. For instance, Empowerment isthe process that transforms fellows intoeffective self-leaders (Sims and Manz, 1996)and it is a process of helping employees achievesjob mastery, providing successful role models,using social reinforcement and persuasion andgiving emotional support (Newstrom andDavis, 1994). Thomas and velthouse (1990) intheir study highlighted that empowered
workers have higher levels of concentration,initiative and resilience which make themeffective on their jobs.
Empowered workers have higher levelsof concentration, initiative and resilience; as aresult they are more effective on their jobs.Other studies provide evidence suggesting thatempowerment related cognitions should bepositively related to increased effort, higherlevels of performance, and improved jobsatisfaction.
The concept of empowerment isunderstood differently by different peoplerepresenting different professions. Forinstance, in health care studies, it is referred toas health empowerment, in population studiesit is women empowerment, in developmentstudies, it is called community empowermentand lastly, in organizational studies, it isreferred to as employee empowerment. Despiteall such nomenclatures, the concept ofempowerment is based on the view that peopleseek as much personal satisfaction andfulfillment as possible from all situations thatinclude work, responsibility and control, whichlead to increased level of satisfaction (Scott andJafee, 1992). Hyde and Pethe (1995) state thatempowerment means creating an environment
Volume 2 Issue 1 APOTHEOSIS : Tirpude's National Journal of Business Research (TNJBR)
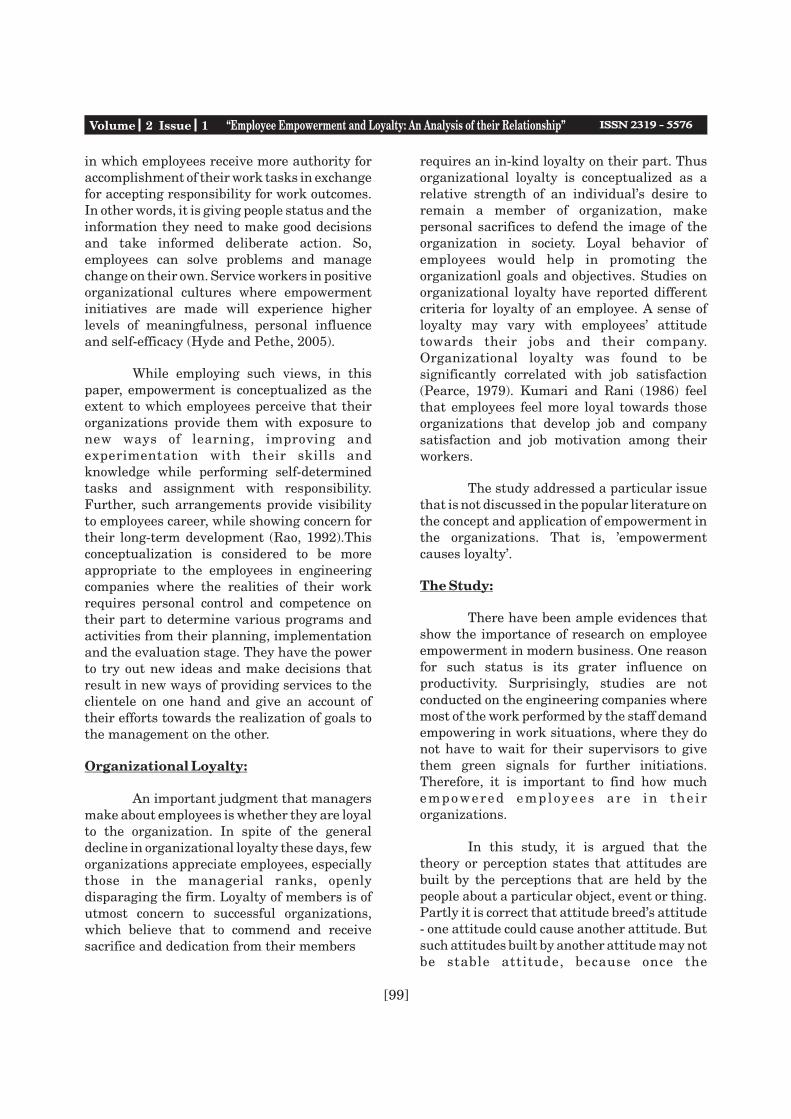
Volume 2 Issue 1 “Employee Empowerment and Loyalty: An Analysis of their Relationship”
[99]
in which employees receive more authority foraccomplishment of their work tasks in exchangefor accepting responsibility for work outcomes.In other words, it is giving people status and theinformation they need to make good decisionsand take informed deliberate action. So,employees can solve problems and managechange on their own. Service workers in positiveorganizational cultures where empowermentinitiatives are made will experience higherlevels of meaningfulness, personal influenceand self-efficacy (Hyde and Pethe, 2005).
While employing such views, in thispaper, empowerment is conceptualized as theextent to which employees perceive that theirorganizations provide them with exposure tonew ways of learning, improving andexperimentation with their skills andknowledge while performing self-determinedtasks and assignment with responsibility.Further, such arrangements provide visibilityto employees career, while showing concern fortheir long-term development (Rao, 1992).Thisconceptualization is considered to be moreappropriate to the employees in engineeringcompanies where the realities of their workrequires personal control and competence ontheir part to determine various programs andactivities from their planning, implementationand the evaluation stage. They have the powerto try out new ideas and make decisions thatresult in new ways of providing services to theclientele on one hand and give an account oftheir efforts towards the realization of goals tothe management on the other.
Organizational Loyalty:
An important judgment that managersmake about employees is whether they are loyalto the organization. In spite of the generaldecline in organizational loyalty these days, feworganizations appreciate employees, especiallythose in the managerial ranks, openlydisparaging the firm. Loyalty of members is ofutmost concern to successful organizations,which believe that to commend and receivesacrifice and dedication from their members
requires an in-kind loyalty on their part. Thusorganizational loyalty is conceptualized as arelative strength of an individual's desire toremain a member of organization, makepersonal sacrifices to defend the image of theorganization in society. Loyal behavior ofemployees would help in promoting theorganizationl goals and objectives. Studies onorganizational loyalty have reported differentcriteria for loyalty of an employee. A sense ofloyalty may vary with employees' attitudetowards their jobs and their company.Organizational loyalty was found to besignificantly correlated with job satisfaction(Pearce, 1979). Kumari and Rani (1986) feelthat employees feel more loyal towards thoseorganizations that develop job and companysatisfaction and job motivation among theirworkers.
The study addressed a particular issuethat is not discussed in the popular literature onthe concept and application of empowerment inthe organizations. That is, 'empowermentcauses loyalty'.
The Study:
There have been ample evidences thatshow the importance of research on employeeempowerment in modern business. One reasonfor such status is its grater influence onproductivity. Surprisingly, studies are notconducted on the engineering companies wheremost of the work performed by the staff demandempowering in work situations, where they donot have to wait for their supervisors to givethem green signals for further initiations.Therefore, it is important to find how muchempowered employees are in the i rorganizations.
In this study, it is argued that thetheory or perception states that attitudes arebuilt by the perceptions that are held by thepeople about a particular object, event or thing.Partly it is correct that attitude breed's attitude- one attitude could cause another attitude. Butsuch attitudes built by another attitude may notbe stable attitude, because once the

[100]
determinant attitude fades, the consequentialattitude also fades away. Thus, stableperception build stable attitude. As statedempowerment is a perception and loyalty is anattitude. Hence, such perception could buildloyal attitude.
Objectives:
The study conducted is two fold:
(i) It is proposed to assess the level ofempowerment perceived by employees.
(ii) To assess the relationships betweenperceived empowerment and the reportedloyalty responses of the employees in orderto test the null hypothesis that 'perceivedempowerment is not related withemployee's loyalty'
Research Methodology :
This study is carried out in private heavyengineering company in Ahmedabad city ofGujarat State. This company is involved inmanufacturing electrical equipment for othermanufacturing companies. Systematic randomsampling technique was used for the selectionof participants of the study. Out ofapproximately 500 employees in total, 50percent were selected randomly from themuster rolls maintained in the time office of thecompany. This has resulted in 250 employeesrepresenting productive and administrativeunits of the company. However 161 participantscould be contacted and responses elicitedduring the field work time.
A structured interview schedule wasprepared which includes two parts. Part A forprofile of respondents, part B for thestandardized scale to measure empowermentand loyalty. Empowerment scale of Rao (1992),which has 16 items, measures sub-dimensionsnamely; giving exposure, visibility &protection, facilitating career advancement,acceptance & encouragement. Coefficients ofalpha reliabilities of all these sub-scales are.5403, .4891, .7826. The overall scale yielded
the alpha coefficient of *8392*. These valuesindicate that the scales to measure employee'sloyalty have been developed exclusively for thisstudy which consists of 6 items with five- pointresponse pattern. The alpha coefficient is 7301
Using correlation coefficients, Cross-tabulationand chi-square the correlation tests arecomputed to examine the association andrelationships between independent anddependent variables of the study while testingthe hypotheses. Profile of the respondent ispresented in table: 1.
Volume 2 Issue 1 APOTHEOSIS : Tirpude's National Journal of Business Research (TNJBR)
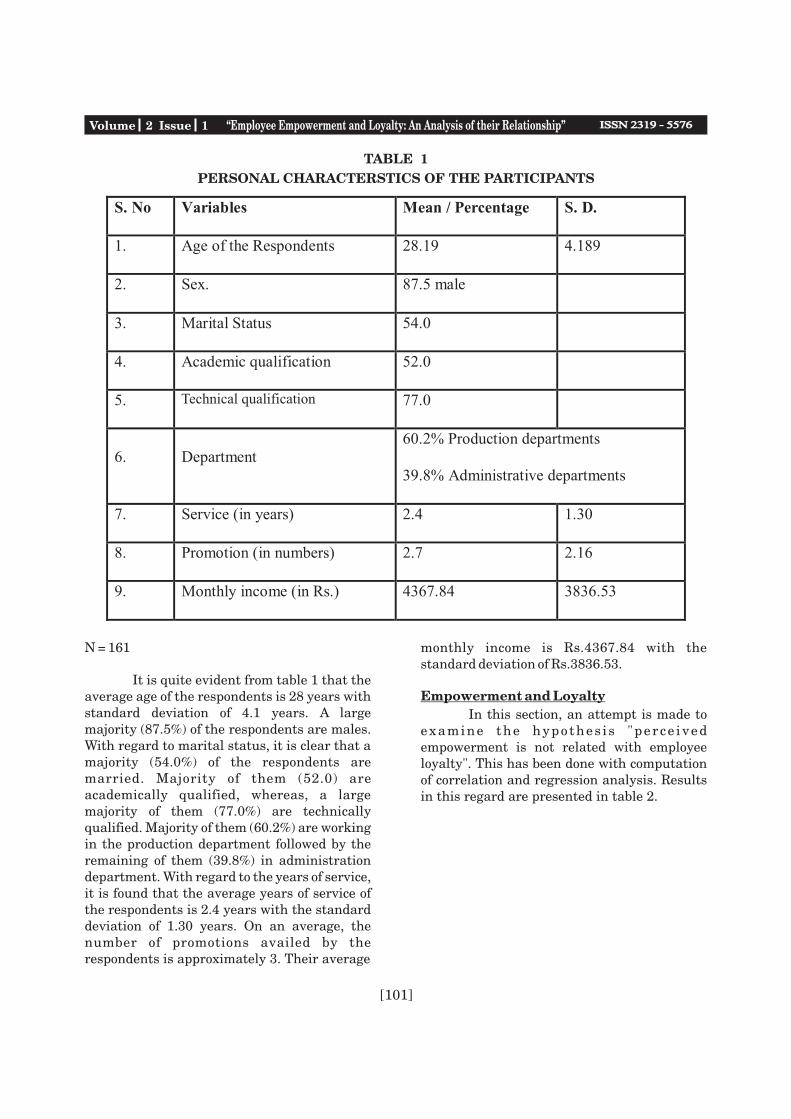
[101]
TABLE 1
PERSONAL CHARACTERSTICS OF THE PARTICIPANTS
S. No Variables Mean / Percentage S. D.
1. Age of the Respondents 28.19 4.189
2. Sex. 87.5 male
3. Marital Status 54.0
4. Academic qualification 52.0
5. Technically qualification 77.0
6. Department 60.2% Production departments
39.8% Administrative departments
7. Service (in years) 2.4 1.30
8. Promotion (in numbers) 2.7 2.16
9. Monthly income (in Rs.) 4367.84 3836.53
N = 161
It is quite evident from table 1 that theaverage age of the respondents is 28 years withstandard deviation of 4.1 years. A largemajority (87.5%) of the respondents are males.With regard to marital status, it is clear that amajority (54.0%) of the respondents aremarried. Majority of them (52.0) areacademically qualified, whereas, a largemajority of them (77.0%) are technicallyqualified. Majority of them (60.2%) are workingin the production department followed by theremaining of them (39.8%) in administrationdepartment. With regard to the years of service,it is found that the average years of service ofthe respondents is 2.4 years with the standarddeviation of 1.30 years. On an average, thenumber of promotions availed by therespondents is approximately 3. Their average
monthly income is Rs.4367.84 with thestandard deviation of Rs.3836.53.
Empowerment and Loyalty
In this section, an attempt is made toexamine the hypothes i s "perce ivedempowerment is not related with employeeloyalty". This has been done with computationof correlation and regression analysis. Resultsin this regard are presented in table 2.
Technical qualification
Volume 2 Issue 1 “Employee Empowerment and Loyalty: An Analysis of their Relationship”
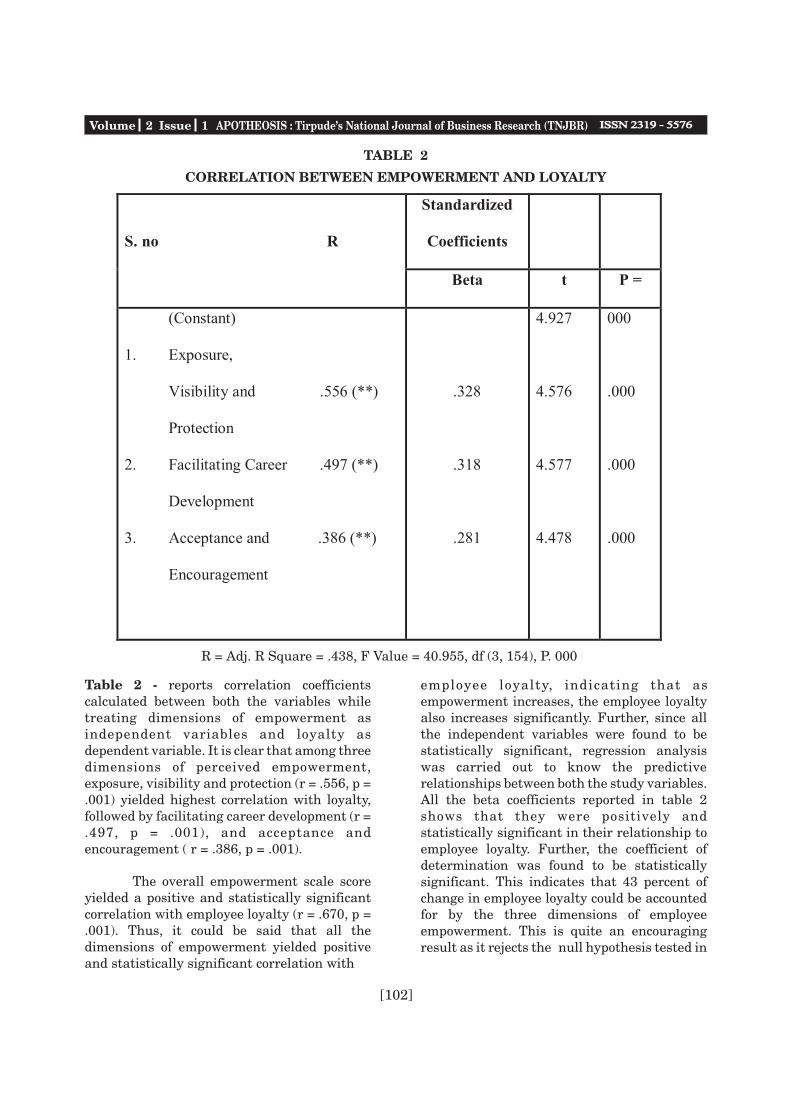
[102]
TABLE 2
CORRELATION BETWEEN EMPOWERMENT AND LOYALTY
Standardized
Coefficients S. no R
Beta t P =
(Constant)
1. Exposure,
Visibility and .556 (**)
Protection
2. Facilitating Career .497 (**)
Development
3. Acceptance and .386 (**)
Encouragement
.328
.318
.281
4.927
4.576
4.577
4.478
000
.000
.000
.000
R = Adj. R Square = .438, F Value = 40.955, df (3, 154), P. 000
Table 2 - reports correlation coefficientscalculated between both the variables whiletreating dimensions of empowerment asindependent variables and loyalty asdependent variable. It is clear that among threedimensions of perceived empowerment,exposure, visibility and protection (r = .556, p =.001) yielded highest correlation with loyalty,followed by facilitating career development (r =.497, p = .001), and acceptance andencouragement ( r = .386, p = .001).
The overall empowerment scale scoreyielded a positive and statistically significantcorrelation with employee loyalty (r = .670, p =.001). Thus, it could be said that all thedimensions of empowerment yielded positiveand statistically significant correlation with
employee loyalty, indicating that asempowerment increases, the employee loyaltyalso increases significantly. Further, since allthe independent variables were found to bestatistically significant, regression analysiswas carried out to know the predictiverelationships between both the study variables.All the beta coefficients reported in table 2shows that they were positively andstatistically significant in their relationship toemployee loyalty. Further, the coefficient ofdetermination was found to be statisticallysignificant. This indicates that 43 percent ofchange in employee loyalty could be accountedfor by the three dimensions of employeeempowerment. This is quite an encouragingresult as it rejects the null hypothesis tested in
Volume 2 Issue 1 APOTHEOSIS : Tirpude's National Journal of Business Research (TNJBR)

[103]
this study. Thus, the alternative is that there isa positive relationship between employeeempowerment and the employee loyalty. Thus,indicating that there is a need to rethink on theinclusion of employee empowerment as anelement of work system design for future workdesign considerations by the HR functionariesin manufacturing companies.
Discussion
The findings that are made in thisstudy have certain interesting issuesp e r t a i n i n g t o t h e i m p r o v e m e n t o fempowerment and the consequent employeeresponse of being loyal to his work and tohis/her organization. Firstly, the concept ofloyalty is simply rubbed off stating that onecannot buy loyalty and quite likely many otheremployee responses. If the concepts arep r o p e r l y u n d e r s t o o d f r o m t h e i rcontextualization, perhaps it is possible toevoke responses from the employees suitable tothe realization of business objectives.
This study sufficiently reported thatproviding exposure, visibility and protection tothe employees would pave a way towardsmaking the employees committed to their workpurposes. Further, if management supportsand facilitates career development for theemployees, it further strengths their normativeresponsibility towards the organization. Lastly,if management manifests acceptance ofemployee creativity and innovation in the formof encouragement through proper rewardsystems, the employees would be morecommitted to their clients and eventually totheir organizations.
Whether an individual is loyal towardshis organization depends also upon the natureof his personality. Some individuals are moresubmissive and can easily be subjugated beforethe authority while others are authoritarian,rigid and inflexible. But if an organizationprovides opportunity to its members to delegatepower or satisfy their higher order needs, thepossibility is that the persons who are power-oriented or authoritarian may feel more loyal
and committed towards their organizations.Authoritarianism essentially indicates thepreference of a person to control or to becontrolled by his or her environment (House,1974). Adorno and his associates (1950) saw atthe core of authoritarian pattern, a set ofbehavioral and attitudinal characteristicsreflecting a preoccupation with the factors ofpower and authority in interpersonalrelationships. On the one hand, the individualhigh in authoritarianism turns his aggressioninward; he adopts a respectful, obedient,deferential posture towards authority anduncritically accepts a set of conventional,moralistic values. On other hand, he partiallyidentifies with powerful figures and has a needto see himself as strong and powerful.
Implications
In organizations with effective leaders,it is suggested that the design of empowermentwith evolving work systems could keep thenecessary element of employee loyalty as anoutcome of empowerment. Therefore, suchwork system design consideration is mostevident in four themes.
! People feel significant: Every one feels thathe /she makes a difference to the success ofthe organization. The difference may besmall, but where they are empowered peoplefeel that what they do has meaning andsignificance.
ii) Learning and Competence Matter:Leaders value learning and mastery and sodo people who work for leaders. Leadersmake it clear that there is no failure; onlymistakes that give us feedback and tell uswhat to do next.
iii) People are Part of a Community: Wherethere is leadership there is team, a family, aunity. Even people who do not especially likeeach other feel the sense of community.'When Neil Armstrong talks about the ApolloExploration, he describes how a teamcarried out an almost unimaginable complexset of interdependent tasks. Until there
Volume 2 Issue 1 “Employee Empowerment and Loyalty: An Analysis of their Relationship”

[104]
were women astronauts, the men referred tothis feeling as "brotherhood". I suggest theyrename it "family".
iv) Work is exciting: Where there areleaders, work is stimulating, challenging,fascinating and fun. An essential ingredientin organizational leadership is pullingrather than pushing people toward a goal. A"Pull" style of influence attracts andenergizes people to enroll in an excitingvision of the future. It motivates throughidentification rather than through rewardsand punishments. Leaders articulate andembody the ideals toward which theorganization strives.
Conclusion
This study addressed interesting issuesof relationship between empowerment and loyalty among employees. The first one is aconscious design by the management and thesecond one is the outcome in the form ofemployee loyalty. This study reported positiverelationships between both the concepts,necessitating future managerial strategies ofimproving empowerment for employeecommitment and loyalty.
REFERENCES:
Argyris C (1998) Empowerment: The Emperor'sNew Clothes, Harvard Business Review, May-June, pp9l;3105
Ashforth, E.B and Lee, R.T (1989) "DefensiveBehavior in Organizations: A Preliminary-model", Human Relations, 43, 7, pp.621-648.
Conger, J.A and Kanungo, R.N (1988) "Theempowering process : Integrating Theory and-Practice", Academy of Management Review,July, 471-82.
Darraugh, B (1991). Basics of employeeempowerment, American society for trainingand development, May, 1-12.
Decl, et.al (1989) Self Determination in a Work
Organization, Journal of A p p l i e d Psychology, 74, 580-90.
Dumain, B (1993) "The New Non-ManagerManagers", Fortune, Feb.22, 80-84.
House, R.J (1974) Notes on the path-goal theoryof leadership. Unpublished manuscript,university of Toronto.
Hyde M, Anukool And Pethe, Sanjyot (2005)Impact Of HRD Climate On Empowerment AndOrganization Citizenship Behavior, ICFAIJournal Of Organizational Behavior, Iv, 3, 40-50
Kanter, R.M (1983) Change masters: innovationfor productivity in American culture, Simon &Schuster, New York.
Kumari, P and Rani, M (1986) "A Study ofo r g a n i z a t i o n a l l o y a l t y,
authoritarianism and job satisfaction of middleand bottom level managers", ManagerialPsychology, 7, 2, 27-36.
Levinson, N (1966) "Whatever happened toloyalty?" Public management, 48, 160-65.
Luthans, F (2003). Organizational Behavior,New York : McGraw Hill.
Pearce, J.A (1979) An assessment of supervisor'sorganizat ional loyal ty . Managementpragmatics: readings on basic elements ofmanaging organizations, Richard D.lrwin, Inc.,Home. wood, Illinois.
Sashkin, M (1984) "Participative ManagementIs an Ethical Imperative", OrganizationalDynamics, Sprin, 5-22.
Steward, N. (1961) "Organizational loyalty",Management Review, 50, P-21.
Volume 2 Issue 1 APOTHEOSIS : Tirpude's National Journal of Business Research (TNJBR)
Abstract :
Indian market has high complexities in terms of a wide geographic spread and distinct consumerpreferences varying by each region necessitating a need for localization even within the geographiczones. Most Indian shopping takes place in open markets and millions of independent grocery shopscalled kirana shops. In organized retail the supermarkets accounts for just 4% of the market as of2008. India's organized retail market is likely to grow from the current $4 billion to $64 billion byfinancial year 2015. In this context, improving service quality is believed to improve profitabilityand enhance retail store performance. Such improvements, however, require monitoring andcontinuous measurement of performance along service dimensions that determine standards ofservice quality. This study assesses the service quality of retail stores in Hyderabad with specialreference on expected and actual service quality.
[105]
* MBA, M.Phil, MIMA, (Ph.D)Asst. Professor, Padmasri Dr. B.V. Raju Institute of Technology, Narsapur,Medak District-502313, Andhra Pradesh, India.
Volume 2 Issue 1 Gap between Expected and Actual Service Quality of Retailing in Hyderabad An Empirical Study
Gap between Expected and Actual Service Quality of Retailing
in Hyderabad An Empirical Study
Keywords : Retailing, Service Quality, Expected quality, perceived quality
1. Introduction
The concept of retailing draws strengthfrom the French word retaille which means apiece cut off'. The range of activities carried outby a modern retailer encompasses sourcing awide range of products at huge volumes andthrough intelligent use of systems andprocesses, getting them across to consumers atattractive prices. Today, retailing is one of thelargest institutions in India and is estimated tobe the largest employment provider both directand indirect. With more than 30,000 retailoutlets and a total estimated retail turnover ofaround Rs.10,00,000 crore, the industry isgrowing fast.
Organized retailing was absent in Indiatill the 1990s, though the roots can be tracedback to the late 1800s with the establishment ofthe 'Spencers' departmental store in SouthIndia in 1897, which had a different sub-division within itself, a phenomenon commonin hypermarkets and large retail stores today.India's organized retail market is likely to growfrom the current $4 billion to $64 billion byfinancial year 2015.
Decision-making in retailing is very
similar to consumers decision-making forgoods. With brands, the consumer goes throughthe entire process beginning with 'needs' to “ post-purchase decision-making” . A consumerevaluates the quality of goods or services beforemaking a purchase.
Juran (1999) defines customer ledquality as, “ feature of products which meetcustomer's needs and thereby providesatisfaction” , and service quality relates tomeeting customers' needs, 'perceived servicequality' is identified to understand theconsumer. Zeithaml (1987) defined perceivedquality as 'the consumers' judgment about anentity's overall excellence or superiority' whichcan be viewed as distinct from 'objective' qualityin as much as it is a form of attitude, related inpart to satisfaction and resulting from acomparison of expectations with perceptions ofperformance.
The purpose of the study is to assess thegap between expected and actual servicequality of organized retail stores of Hyderabad.Accordingly, the study has the following
Service Quality
2. Objectives
Mr. Suresh Kandulapati*
Volume 2 Issue 1 APOTHEOSIS : Tirpude's National Journal of Business Research (TNJBR)
objectives:
1) To investigate the dimensions of servicequality related to the retail sector in general.
2) To identify the service quality differencesbetween the expected service and perceivedservices of retail stores in Hyderabad.
1) There is no significant difference between theexpected and actual service quality of retailstores in Hyderabad.
2) There is no significant difference betweenexpected physical aspects, reliability, personalinteraction, problem solving and empathy andactual physical aspects, reliability, personalinteraction, problem solving and empathy.
Dabholkar (1996) developed the RetailService Quality Scale (RSQS) to study retailing-related dimensions. The scale that has highconstruct reliability and validity in measuringservice quality in a department store includes:
1) Physical Aspects
2) Reliability
3) Personal Interaction
4) Problem-Solving
5) Policy
In this study, some of these suitabledimensions are used. The study considers thedimensions and sub-dimensions, which areevaluated in retail outlets in Hyderabad. Theservice quality of the retail sector depends uponthe difference between the expectations of thecustomer and the perception on receiving theservice.
The primary data is collected from 200customers by administering a structuredquestionnaire. The secondary data is collectedfrom various journals, magazines, andwebsites.
3. Hypotheses
4. Research Methodology
4.1 Data Collection
4.2 Sampling Technique
The size of sample is 200 retailcustomers. The customers are selected byadopting non-random sampling techniques.The major retail stores considered for the studyare Spencer's, More, Reliance Fresh, andHeritage in Hyderabad.
The RSQS scale is applied to measurefive-dimensions of service quality viz., PhysicalAspects, Reliability, Personal Interaction,Problem-Solving Capacity and Empathy. Theattributes of each dimension are analyzed indetail. The collected data is analyzed by usingstatistical tools such as mean and weightedaverages and x -test.
1) This store has modern-looking equipmentand fixtures.
2) The physical facilities at this store arevisually appealing.
3) Materials associated with this store'sservice (such as shopping bags, catalogs, orstatements) are visually appealing.
4) This store has clean, attractive, andconvenient public areas (restrooms, fittingroom).
5) The store layout makes it easy forcustomers to find what they need.
6) The store layout makes it easy forcustomers to move around the store.
1) When this store promises to do somethingby a certain time, it will do so.
2) This store insists on error-free salestransactions and records.
1) Employees in this store give prompt serviceto customers.
4.3 Statistical tools for data analysis
4.4 Dimensions
The following sub-dimensions are
included in the questionnaire:
Physical Aspects
Reliability
Personal Interaction
2
[106]

2) Employees in this store are never too busyto respond to customer's requests.
3) Employees in this store are consistentlycourteous with customers.
1) When a customer has a problem, this storeshows a sincere interest in solving it.
2) Employees of this store are able to handlecustomer complaints directly andimmediately.
1) This store offers high quality merchandise.
2) This store gives customers individualattention.
1) The study covered only convenience stores.
2) The sample size is 200 respondents and itmay not represent the total population ofretail industry in Hyderabad.
3) Time and Money for data collection isanother constraint for the study.
Problem-Solving Capacity
Empathy
Limitations
5. Data Analysis
5.1 Physical Aspects
Table 1
Likert fivepoint scale is also employedfor the study. Respondents are asked toevaluate parameters on overall service qualityin a five-point scale anchored at 'stronglydisagree ' and 'strongly agree ' . Thequestionnaire consists of 15 statements onexpectations and 15 statements on perceptions.On comparing the two aspects like expectationsand actual service encountered, one can knowthe gap as explained below.
H : There is no significant difference betweenexpected and actual physical aspects.
Ha: There is significant difference betweenexpected and actual physical aspects.
shows that materials associated withretail store's services (such as shopping bags,catalogs, or statements) are visually appealing.The respondents feel that modern-lookingequipment and fixtures, physical facilities, theambience and store layout are up to the mark.
0
Volume 2 Issue 1 Gap between Expected and Actual Service Quality of Retailing in Hyderabad An Empirical Study
[107]
Parameters
Expected service (E)
(weighted average)
Actual Service (A)
(weighted average)
Difference
(E-A)
(weighted average)
The store has modern-looking equipment
and fixtures (A)
3.76 3.50 0.26
The physical facilities at this store are
visually appealing (B)
3.74 3.44 0.30
Materials associated with this store’s
service (such as shopping bags, catalogs,
or statements) are visually appealing (C)
3.48 3.50 -0.02
The store has clean, attractive, and
convenient public areas (restrooms,
fitting room) (D)
3.74 3.26 0.48
The store layout at this store makes it
easy for customers to find what they
need (E)
3.68 3.62 0.06
The store layout at this store makes it
easy for customers to move around the
store (F)
3.92 3.50 0.42
Table 1: Physical Aspects

Volume 2 Issue 1 APOTHEOSIS : Tirpude's National Journal of Business Research (TNJBR)
By applying Chi-square test, the table value for 5 degrees of freedom at 5% level of significance is 11.07.The calculated value ofx 0.9996 is much lower than the table value. Hence, the result of the experimentsupports the hypothesis. We can thus conclude that, “ There is no significant difference between actualand expected physical aspects” .
2
[108]
Source: Primary data
-1
0
1
2
3
4
Retail Service
Parameters
Physical Aspects
Expected service (E) 3.76 3.74 3.48 3.74 3.68 3.92
Actual Service (A) 3.5 3.44 3.5 3.26 3.62 3.5
Gap(E-A) 0.26 0.3 -0.02 0.48 0.06 0.42
A B C D E F
Figure 1: Physical Aspects
5.2 Reliability
H : There is no significant difference between actual and expected reliability by customers.
Ha: There is significant difference between actual and expected reliability by customers.
Table 2 shows that there is no remarkable difference between expected and actual reliability withreference to time management and error-free sales transactions and records by the retail stores.
0
Table 2: Reliability
Parameters
Expected service (E)
(weighted average)
Actual Service (A)
(weighted average)
Difference (E-A)
(weighted average)
When this store promises to do
something by a certain time, it will
do so (A)
3.80 3.06 0.74
This store insists on error-free sales
transactions and records (B)
3.84 3.42 0.42
Source: Primary data
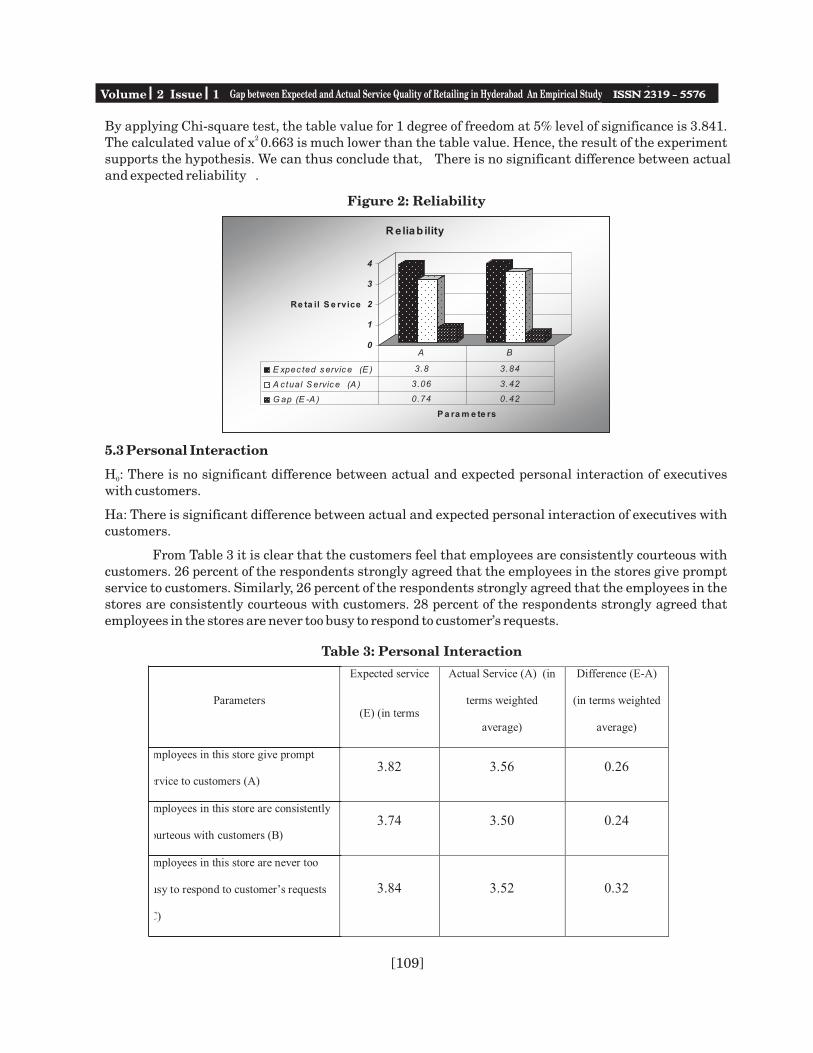
Table 3: Personal Interaction
By applying Chi-square test, the table value for 1 degree of freedom at 5% level of significance is 3.841.The calculated value of 0.663 is much lower than the table value. Hence, the result of the experimentsupports the hypothesis. We can thus conclude that, “ There is no significant difference between actualand expected reliability” .
x2
5.3 Personal Interaction
H : There is no significant difference between actual and expected personal interaction of executiveswith customers.
Ha: There is significant difference between actual and expected personal interaction of executives withcustomers.
From Table 3 it is clear that the customers feel that employees are consistently courteous withcustomers. 26 percent of the respondents strongly agreed that the employees in the stores give promptservice to customers. Similarly, 26 percent of the respondents strongly agreed that the employees in thestores are consistently courteous with customers. 28 percent of the respondents strongly agreed thatemployees in the stores are never too busy to respond to customer's requests.
0
0
1
2
3
4
Re ta il S e rvice
P a ra m e te rs
R eliab ility
E xpec ted s ervic e (E ) 3.8 3.84
A ctual S ervic e (A ) 3.06 3.42
G ap (E -A ) 0.74 0.42
A B
Figure 2: Reliability
Volume 2 Issue 1 Gap between Expected and Actual Service Quality of Retailing in Hyderabad An Empirical Study
[109]
Parameters
Expected service
(E) (in terms
weighted average)
Actual Service (A) (in
terms weighted
average)
Difference (E-A)
(in terms weighted
average)
Employees in this store give prompt
service to customers (A)
3.82 3.56 0.26
Employees in this store are consistently
courteous with customers (B)
3.74 3.50 0.24
Employees in this store are never too
busy to respond to customer’s requests
(C)
3.84 3.52 0.32

Source: Primary data
By applying Chi-square test, the table value for 2 degrees of freedom at 5% level of significance is5.991. The calculated value of 0.971 is much lower than the table value. Hence, the result of theexperiment supports the hypothesis. We can thus conclude that, “ There is no significant differencebetween actual and expected personal interaction of executives with customers” .
x2
0
1
2
3
4
Retail Service
Parameters
Personal Interaction
Expected service (E) 3.82 3.74 3.84
Actual Service (A) 3.56 3.5 3.52
Gap (E-A) 0.26 0.24 0.32
A B C
Figure 3: Personal Interaction
Volume 2 Issue 1 APOTHEOSIS : Tirpude's National Journal of Business Research (TNJBR)
[110]
5.4 Problem-Solving Capacity
H : There is no significant difference between actual and expected customer problem solving capacity tostore executives.
Ha: There is significant difference between actual and expected customer problem solving capacity tostore executives.
Table 4 shows that sales persons are able to handle customer complaints directly and immediately. 48%of the respondents are strongly agreed that employees of the store are able to handle customercomplaints directly and immediately. 34% of the respondents are agreed that when a customer has aproblem, the store shows a sincere interest in solving it.
0
Table 4: Problem-Solving Capacity
Parameters
Expected service (E)
(weighted average)
Actual Service (A)
(weighted average)
Difference (E-A)
(weighted average)
When a customer has a problem,
this store shows a sincere interest
in solving it (A)
3.90 3.44 0.46
Employees of this store are able
to handle customer complaints
directly and immediately (B)
4.22 3.70 0.52

Volume 2 Issue 1 Gap between Expected and Actual Service Quality of Retailing in Hyderabad An Empirical Study
[111]
Source: Primary data
0
1
2
3
4
5
Re ta il Se rvice
Pa ra m e te rs
P roblem Solving C apacity
Expec ted service (E ) 3.9 4.22
Ac tual Service (A ) 3.44 3.7
Gap (E -A ) 0.46 0.52
A B
Figure 4: Problem-Solving Capacity
5.5 Empathy
H : There is no significant difference between actual and expected store empathy.
Ha: There is significant difference between actual and expected store empathy.
According to Table 5, the qualities of merchandise are up to mark and employees are giving individualattention to the customers. 34% of the respondents are agreed that the store offers high qualitymerchandise. Similarly, 34% of the respondents also agreed that the store gives customers individualattention.
0
By applying Chi-square test, the table value for 1 degree of freedom at 5% level of significance is3.841. The calculated value of x 0.892 is much lower than the table value. Hence, the result of theexperiment supports the hypothesis. We can thus conclude that, “ There is no significant differencebetween actual and expected store empathy” .
2
Table 5: Empathy
Parameters
Expected service (E)
(weighted average)
Actual Service (A)
(weighted average)
Difference (E-A)
(weighted average)
The store offers high quality
merchandise (A)
3.50 3.32 0.18
This store gives customers
individual attention (B)
3.52 3.34 0.18
Source: Primary data
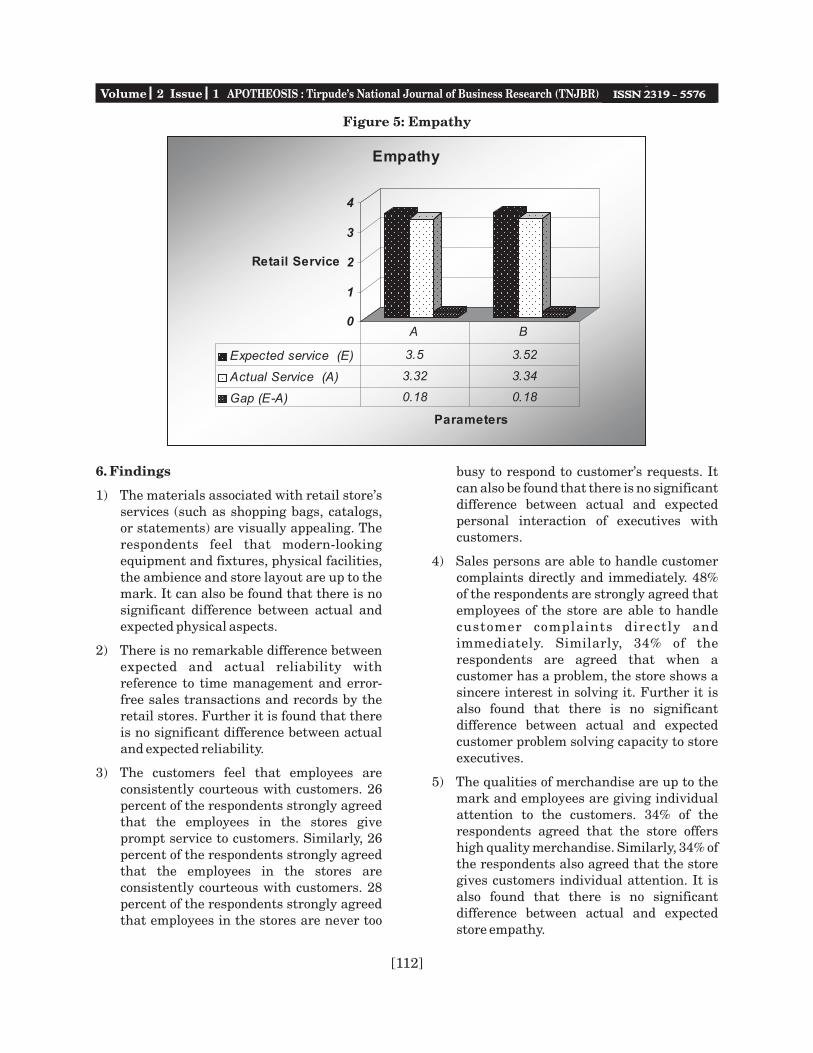
Volume 2 Issue 1 APOTHEOSIS : Tirpude's National Journal of Business Research (TNJBR)
[112]
0
1
2
3
4
Retail Service
Parameters
Empathy
Expected service (E) 3.5 3.52
Actual Service (A) 3.32 3.34
Gap (E-A) 0.18 0.18
A B
Figure 5: Empathy
busy to respond to customer's requests. Itcan also be found that there is no significantdifference between actual and expectedpersonal interaction of executives withcustomers.
4) Sales persons are able to handle customercomplaints directly and immediately. 48%of the respondents are strongly agreed thatemployees of the store are able to handlecustomer complaints directly andimmediately. Similarly, 34% of therespondents are agreed that when acustomer has a problem, the store shows asincere interest in solving it. Further it isalso found that there is no significantdifference between actual and expectedcustomer problem solving capacity to storeexecutives.
5) The qualities of merchandise are up to themark and employees are giving individualattention to the customers. 34% of therespondents agreed that the store offershigh quality merchandise. Similarly, 34% ofthe respondents also agreed that the storegives customers individual attention. It isalso found that there is no significantdifference between actual and expectedstore empathy.
6. Findings
1) The materials associated with retail store'sservices (such as shopping bags, catalogs,or statements) are visually appealing. Therespondents feel that modern-lookingequipment and fixtures, physical facilities,the ambience and store layout are up to themark. It can also be found that there is nosignificant difference between actual andexpected physical aspects.
2) There is no remarkable difference betweenexpected and actual reliability withreference to time management and error-free sales transactions and records by theretail stores. Further it is found that thereis no significant difference between actualand expected reliability.
3) The customers feel that employees areconsistently courteous with customers. 26percent of the respondents strongly agreedthat the employees in the stores giveprompt service to customers. Similarly, 26percent of the respondents strongly agreedthat the employees in the stores areconsistently courteous with customers. 28percent of the respondents strongly agreedthat employees in the stores are never too

Volume 2 Issue 1 Gap between Expected and Actual Service Quality of Retailing in Hyderabad An Empirical Study
[113]
7. Conclusion
8. Suggestion
References
Majority of the retail stores inHyderabad are operating the storesapproximately up to the satisfaction level oftheir customers. Broadly, customers found nodifference between their expected servicequality and actual service quality. Also majorityof the customers strongly agreed that thephysical facilities associated with the retailstores are visually appealing, there is goodreliability, employees are consistentlycourteous, sales persons handle complaintseffectively and the quality of merchandise aresatisfactory.
Though, the current study revels thatorganized retail stores are operating up to thedesired level of its customers, still they arelagging behind the traditional stores inattracting a customer. Some of the main tips forthe modern retail sector to attract all types ofcustomers are:
1) The employees and management should bewell versed with local language; theyshould give common attention towards thecustomers irrespective of their economicand social status.
2) The stores should take steps to minimizethe waiting time of the customers beforethe billing and delivery line.
3) The employees should pay attentionalways while inviting customer to enhancethe 'sense of trust' shared between thecustomer and the store, which in somecases develops over generations ofpurchases.
[1] Dr. S. V. Pathak, Aditya P. Tripathi (2009),“ Customer Shopping Behavior AmongModern Retail Formats: A Study of Delhi &NCR” , Indian Journal of Marketing,February, 2009, pp. 3 12.
[2] Dabholkar P A, Thorpe D I and Rentz J O(1996), “ A Measure of Service Quality forRetail Stores: Scale Development and
Validation” , Journal of the Academy ofMarketing Science, Vol. 24, No. 1.
[3] Edvardsen B, Tomasson B and Ovretveit J(1994), Quality of Service: Making it ReallyWork, McGraw-Hill, New York.
[4] Garvin D A (1983), “ Quality on the Line” ,Harvard Business Review, Vol. 61, pp. 65-73.
[5] Gronroos C (1982), Strategic Managementand Marketing in the Service Sector,Swedish School of Economics and BusinessAdministration, Helsingfors.
[6] Hjorth-Anderson C (1984), “ The Concept ofQuality and the Efficiency of Markets forConsumer Products” , Journal of ConsumerResearch, Vol. 11, pp. 708-718.
[7] Holbrook M B and Corfman K P (1985),“ Quality and Value in the ConsumptionExperience: Phaldrus Rides Again” , inJacoby J and Olson J (Eds.), PerceivedQuality, Lexington Books, MA.
[8] Juran J M (1999), “ How to Think AboutQuality” , in Juran J M and Godfrey A B(Eds.), Juran's Quality and Book, 5Edition, pp. 2.1-2.3, McGraw-Hill, NewYork.
[9] Nikhil Chandra Shil, Dr. Bhagaban Das(2009), “ Analysis of Gap In Service QualityThrough SERVQUAL: A Case of DepositService Provided By a Bank inBangladesh” , Indian Journal of Marking,June 2009, pp. 3 11.
[10]Olshavsky R W (1985), “ Perceived Qualityin Consumer Decision-Making: AnIntegrated Theoretical Perspective” , inJacoby J and Olson J (Eds.), PerceivedQuality, Lexington Books, MA.
[11] Parasuraman A, Zeithaml V A and Berry LL (1985), “ A Conceptual Model of ServiceQuality and its Implications for FutureResearch” , Journal of Marketing, Vol. 49,pp. 41-50.
[12]Parasuraman A, Zeithaml V A and Berry LL (1988), “ SERVQUAL: A Multi-item Scalefor Measuring Consumer Perceptions of the
th

Volume 2 Issue 1 APOTHEOSIS : Tirpude's National Journal of Business Research (TNJBR)
[114]
Service Quality” , Journal of Retailing, Vol.64, No. 1, pp. 12-40.
[13]Sasser W E Jnr., Olsen R P and Wyckoff D D(1978) , “ Management o f Serv iceOperations: Text and Cases” , Allyn &Bacon, Boston.
[14]Sunayna Khurana (2008), “ CustomerExpectation and Perception: A Study ofRetail Sector of Haryana State” , The IcfaiUniversity Journal of Consumer Behavior,Vol. III, No. 3, pp. 47-58.
[15]Wisniewski M (2001), “ Using SERVQUALto Assess Customer Satisfaction withPublic Sector Services” , ManagementService Quality, Vol. 11, No. 6, pp. 380-388.
[16]Zeithaml V A (1987), “ Defining andRelating Price, Perceived Quality andPerceived Value” , Report No. 87-101,Cambridge, MA.
[17]Zeithaml V A, Parasuraman A and Berry LL (1990), “ Delivering Quality Service:Balancing Customer Perceptions andExpectations” , The Free Press, New York.
Abstract : From last few years, the growth of Indian economy registered substantial increase inpurchasing power of rural India which attracts the Indian Inc. & MNCs. Simultaneously inreference to FMCG products, the saturated urban market forced the companies to tap the virginIndian rural market. The prologue of currency, transport, and communication has increased thereach of rural market.
This paper highlights the factors responsible for the boom in rural marketing, consumers'
preference for FMCG products based on 4 'A's (i.e. Awareness, Affordability, Adoptability and
Availability). The study is analytical in nature. Convenient sampling method has been adopted for
administering the questionnaires using Likert Scale. Questionnaire / schedule have been
administered to total 200 respondents of HUL & ITC in rural areas of Agra district. Secondary data
have been collected from reputed journals, websites and magazines. The study has been carried out
from Jan. 2011 to June.2011.
In parameters like, Image, Shape /size, Packaging, Durability, Small size products, Low
priced sample packets, Price scheme, Celebrity endorsement & Use of transport like autos, camel
carts, HUL has an edge over ITC.
In today's scenario, Consumer is the king because he has got various choices around him. If
you are not able of providing him the desired result he will definitely switch over to the other
provider. Therefore to survive in this competitive competition, you need to be the best. Consumer is no
more loyal in today's scenario, so you need to be always on your toes. Hence the consumers are Fish
Where Fish Are “Reaching villages that offer better potential”.
[115]
* Research Scholar, Department of Applied Business Economics, Faculty of Commerce,** Dayalbagh Educational Institute (Deemed University), Dayalbagh, Agra-282005*** Director, Ashoka Centre for Business & Computer Studies, Nashik & Ashoka Business School,Nashik
Volume 2 Issue 1 Consumers' Preference For FMCG Products In Rural India (A Comparative Study of HUL & ITC)
Consumers' Preference For FMCG Products In Rural India
(A Comparative Study of HUL & ITC)
Keywords : Consumers` Preference, FMCG Products, Rural India
1. Introduction
"The future lies with those companies who see the poor as their customers."- C. K. Prahalad
Addressing Indian CEOs, Jan 2000.
Ms Nitika Gautam*, Dr. Vijay Kumar Gangal**
India`s fast moving consumer goods(FMCG) is on a roll. Riding on the back ofincreasing demand and changing consumerpreferences- thanks to higher disposableincomes and the retail revolution. The sectorhas been posting double-digit growth over thepast couple of years. The sector has seen theemergence of new product categories andproducts that seek to fulfill the increasingaspirations of a new generation of Indians, who
are turning out to be very demanding 1consumers.
All marketing starts with theconsumer. So consumer is a very importantperson to a marketer. Consumer decides what topurchase, for whom to purchase, why topurchase, from where to purchase, and howmuch to purchase. In order to become asuccessful marketer, he must know the likes or

Volume 2 Issue 1 APOTHEOSIS : Tirpude's National Journal of Business Research (TNJBR)
dislikes of the customers. He must also knowthe time and the quantity of goods and services,a consumer may purchase, so that he may storethe goods or provide the services according tothe likings of the consumers. Gone are the dayswhen the concept of market was let the buyer'sbeware or when the market was mainly theseller's market. Now the whole concept ofconsumer's sovereignty prevails. Themanufacturers produce and the sellers sellwhatever the consumer likes. In this sense,“consumer is supreme in the market”.
As consumers, we play a very vital rolein the health of the economy at local, national orinternational level. The decision we makeconcerning our consumption behavior affect thedemand for the basic raw materials, fortransportation, for banking, for production.They affect employment of workers anddeployment of resources and success of someindustries and failure of others. Thus marketermust understand this.
Preference (or "taste") is a concept, usedin the social sciences, particularly in economics.It assumes a real or imagined "choice" betweenalternatives and the possibility of rank orderingof these alternatives based on happiness,satisfaction, gratification, enjoyment, utilitythey provide. More generally, it can be seen as asource of motivation. In cognitive sciences,individual preferences enable choice ofobjectives/goals. The study of the consumerpreference not only focuses on how and whyconsumers make buying decision, but alsofocuses on how and why consumers make choiceof the goods they buy and their evaluation ofthese goods after use. So for success of anycompany or product promotion it is verynecessary to depart its concentration towardsconsumer preference.
Fast moving consumer goods (FMCG)are popularly named as consumer packagedgoods. Items in this category include allconsumables (other than groceries/pulses)people buy at regular intervals. The mostcommon in the list are toilet soaps, detergents,shampoos, tooth paste, shaving products, shoepolish, packaged food stuff, household
accessories, extends to certain electronic goods.These items are meant for daily or frequentconsumption & have a high return.
A major portion of the monthly budgetof each household is reserved for FMCGproducts. The volume of products circulated inthe economy against FMCG products is veryhigh, as the number of products the consumeruses is comparatively very high. Competition inFMCG sector is very high resulting in highpressure on margins.
FMCG companies maintain intensedistribution network. Companies spend a largeportion of their budget on maintainingdistribution networks. New entrants who wishto bring their products in the national levelneed to invest huge sums of money onpromoting brands. Manufacturing can beoutsourced. A recent phenomenon in the sectorwas entry of multinationals and cheaperimports. Also the market is more pressurizedwith presence of local players in rural areas andstate brands.
1) Changing lifestyles:
Rising per capita income, increased literacy andrapid urbanization have caused rapid growthand change in demand patterns. The risingaspiration levels & increase in spending powerhas led to a change in the consumption pattern.
2) Low penetration and low per capitaconsumption:
Due to the large size of the market, penetrationlevel in most product categories like jams,toothpaste, skin care, hair wash etc. in India islow. This is more visible when comparison isdone between the rural and the urban areas.The average consumption by rural householdsis much lower than their urban counterparts.Existence of unsaturated markets provides ane x c e l l e n t o p p o r t u n i t y f o r t h eindustry players in the form of a vastlyuntapped market as the income levels rise.
[116]

Company Profile
Volume 2 Issue 1 Consumers' Preference For FMCG Products In Rural India (A Comparative Study of HUL & ITC)
[117]
Type Public Limited Public company Public limited company
Industry Fast Moving Consumer Goods (FMCG) Conglomerate
Founded 1933 24 August 1910
Headquarters Mumbai, India Kolkata, India
Key people Harish Manwani (Chairman)
Nitin Paranjpe (CEO & Managing Director)
Yogesh C. Deveshwar (Chairman)
K. Vaidyanath, Director
Products Home & Personal Care, Foods, Water Purifier Cigarettes, Hotels , Apparel, Tobacco,
Foods, Stationery, Personal Care,
Paperboard and specialty papers,
Printing and packaging, Matches and
Agarbattis InfoTech
Revenue Rs 20,869.57 crore. & 4064.3 ( USD in
Millions)
? US$6 billion (2010)
Employees Over 65,000 direct & indirect employees 26,150 (2010)
Parent Unilever Plc ITCportal.com

Volume 2 Issue 1 APOTHEOSIS : Tirpude's National Journal of Business Research (TNJBR)
2. Review of Literature
Rural market is one of the bestopportunities for the FMCG sector. In somesense we can say that rural market is future ofFMCG. As per research of Purba Basu (facultyof ICFAI business school), the lifestyle of ruralconsumers is changing. Rural Indian marketand the marketing strategy have become thelatest marketing buzzword for most of theFMCG majors. She added the strategies ofdifferent FMCG companies for capturing ruralmarket like Titan's Sonata watches, Coco Cola's200 ml bottle, different strategies are used byHUL and Marico.
She takes into consideration the studyof National Council for Applied EconomicResearch (NCAER). According to the NCAERprojections, the number of middle and high-income households in rural India is expected togrow from 80 million to 111 million by 2007. Inurban India, this is expected to grow from 46million to 59 million. Thus, the absolute size ofrural India is expected to be double that of
2urban India.
According to Pradeep Tognatta (former 3vice president of LG), the economic growth in
India's agricultural sector in last year was over7%, compared with 3% in the industrial sector.This implies a huge market potentiality for themarketer to meet up increasing demand.Factors such as village psyche, strongdistribution network and market awarenessa r e f e w p r e r e q u i s i t e sfor making a dent in the rural markets. Themodel is of the stolid Anglo-Dutch conglomerateUnilever Group, which has enjoyed a century-long presence in India through its subsidiaryHindustan Lever Ltd. It was Hindustan Leverthat several years ago popularized the idea ofselling its products in tiny packages. Its sachetsof detergent and shampoo are in great demandi n I n d i a nvillages. Britannia with its low priced Tigerbrand biscuits has become a success story inrural marketing.
4Rajesh K Aithal of IIM(L) had done hisresearch on rural telecom in India. He explain
that Rural markets are an important andgrowing market for most products and servicesincluding telecom. The characteristics of themarket in terms of low and spread outpopulation and limited purchasing power makeit a difficult market to capture. The Bottom ofthe pyramid marketing strategies and the 4 A'smodel o f Avai labi l i ty, Af fordabi l i ty,Acceptability and Awareness provide us with ameans of developing appropriate strategies totackle the marketing issues for marketingtelecom services in rural areas. Successful caseslike the Grameen Phone in Bangladesh andSmart Communications Inc in Philippines alsoprovide us with some guidelines for states thattackling the issue.
The Economic Times (2003), "The ruralmarket likes it strong" is the strength of ruralmarkets for Indian companies. Financialexpress, June 19, 2000 has published thestrategies which FMCG majors HLL, MaricoIndustries, Colgate Palmolive have for ruralmarkets.
5 Dr. Vijay Pithadia stated that Promotion of brands in rural markets requiresspecial measures. Due to the social andbackward condition, the personal selling effortshave a challenging role to play in this regard.The word of mouth is an important messagecarrier in rural areas. Infect the opinion leadersare the most influencing part of promotionstrategy of rural promotion efforts.
T. Mamatha (2008) says that consumerbehavior is a very complex phenomenon whichneeds more efforts to understand, explain andpredict. In order to get a clear understanding ofthe same, every marketer should realize thatconsumer behavior is, in fact, an assumptionevery marketing manager must make, if heplans to market on any basis other than hit-or-miss. Although some individuals find it difficultto make this assumption, one must agree thatbehavior is not so erratic or mysterious that itdefies explanation.
Dr. Sanjeev Kumar and Dr Singh M R P(2008) in “Brand aspirations and brandswitching behavior of rural consumers a case
[118]
6 study of Haryana” state that changing socio-economic environment was greatly affecting theruralities and marketer`s influence was clearlyobservable in terms of changing consumptionpattern which was reflecting in products andbrand choices of ruralities. Income is thebiggest influence on the purchase decisions andconsumption pattern.
Study of rural marketing in the presentscenario in India (2009) states that ''While weall accept that the heart of India lives in itsvillages and the Indian rural market with itsvast size and demand base offers greatopportunities to marketers, we tend to concludethat the purse does not stay with them. Nothingcan be far from truth. Rural marketing involvesaddressing around 700 million potentialconsumers, over 40 per cent of the Indianmiddle-class and about half the country'sdisposable income.
3. Need of The Study
India's rural market is gainingimportance day by day. As the income level ofconsumers also increases, the demand of FMCGproducts is increasing continuously. The studyof consumer preference in FMCG helps formarketer to understand consumer preferenceto survive and succeed in the competitivemarket of FMCG. The potentiality of ruralmarket is seen by MNC`s as a 'woken upsleeping giant'. Most Fast Moving ConsumerGoods (FMCG) companies in India areintroducing customized products especially forrural population. The various needs of the studyis given as follows:-
1) To know the determinants that contribute tothe rural market boom, 4 A`s of rural marketingmix (Affordability, Awareness, Availability andAcceptability) of selected FMCG Companies.
2) Know about the choices of rural consumers.
4. Objectives of the Study
The main objective of this study is:
To find out the motives of purchase andthe factors affecting purchase decision based on4 'A's (i.e. Awareness, Affordability,Adoptability and Availability) of HUL & ITC
Companies in rural India.
5. Hypothesis
Ho: There is no significant difference in theConsumers` Preference regarding FMCG
products of HUL and those of ITC.
Ha: There is a significant difference in theConsumers` Preference regarding FMCG
Products of HUL and those of ITC.
6. Research Methodology
The study is analytical in nature and LikertScale has been adopted. Convenient samplingmethod has been used for administering thequestionnaires.
Primary data have been collected witht h e h e l p o f a s t r u c t u r e dQues t i onna i re / in f o rmat i on s chedu leadministered to total 200 Respondents of HUL& ITC in rural areas of Agra district. Secondarydata have been collected from reputed journals,websites and magazines. The study has beencarried out from Jan. 2011 to June.2011.
Volume 2 Issue 1 Consumers' Preference For FMCG Products In Rural India (A Comparative Study of HUL & ITC)
[119]
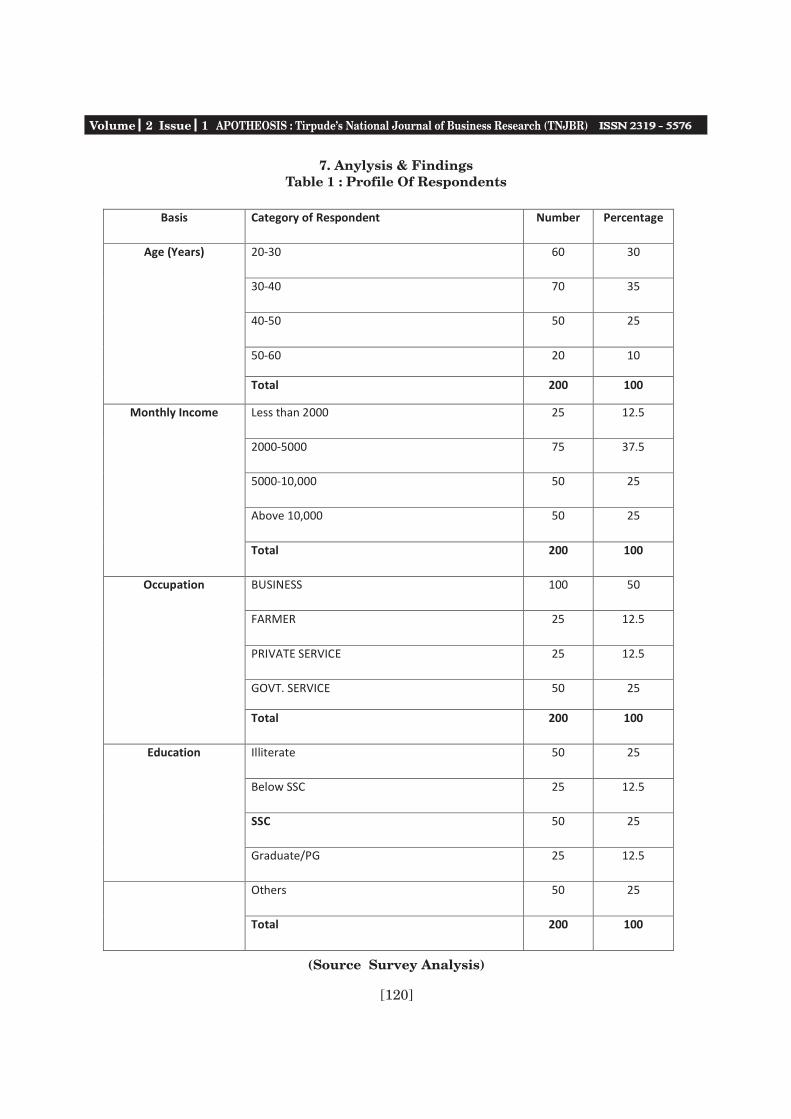
Volume 2 Issue 1 APOTHEOSIS : Tirpude's National Journal of Business Research (TNJBR)
Basis Category of Respondent Number Percentage
20-30 60 30
30-40 70 35
40-50 50 25
50-60 20 10
Age (Years)
Total 200 100
Less than 2000 25 12.5
2000-5000 75 37.5
5000-10,000 50 25
Above 10,000 50 25
Monthly Income
Total 200 100
BUSINESS 100 50
FARMER 25 12.5
PRIVATE SERVICE 25 12.5
GOVT. SERVICE 50 25
Occupation
Total 200 100
Illiterate 50 25
Below SSC 25 12.5
SSC 50 25
Education
Graduate/PG 25 12.5
Others 50 25
Total 200 100
(Source Survey Analysis)
7. Anylysis & FindingsTable 1 : Profile Of Respondents
[120]
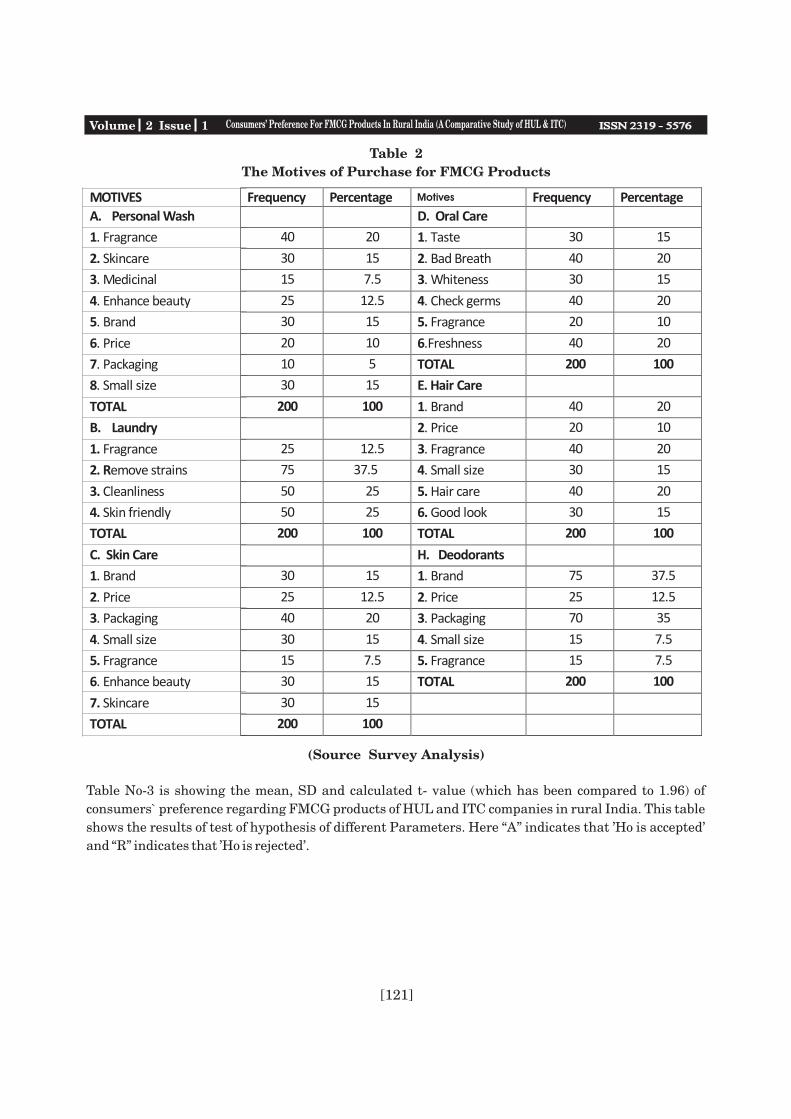
Table 2
The Motives of Purchase for FMCG Products
MOTIVES Frequency Percentage MOTIVES Frequency Percentage
A. Personal Wash D. Oral Care
1. Fragrance 40 20 1. Taste 30 15
2. Skincare 30 15 2. Bad Breath 40 20
3. Medicinal 15 7.5 3. Whiteness 30 15
4. Enhance beauty 25 12.5 4. Check germs 40 20
5. Brand 30 15 5. Fragrance 20 10
6. Price 20 10 6.Freshness 40 20
7. Packaging 10 5 TOTAL 200 100
8. Small size 30 15 E. Hair Care
TOTAL 200 100 1. Brand 40 20
B. Laundry 2. Price 20 10
1. Fragrance 25 12.5 3. Fragrance 40 20
2. Remove strains 75 37.5 4. Small size 30 15
3. Cleanliness 50 25 5. Hair care 40 20
4. Skin friendly 50 25 6. Good look 30 15
TOTAL 200 100 TOTAL 200 100
C. Skin Care H. Deodorants
1. Brand 30 15 1. Brand 75 37.5
2. Price 25 12.5 2. Price 25 12.5
3. Packaging 40 20 3. Packaging 70 35
4. Small size 30 15 4. Small size 15 7.5
5. Fragrance 15 7.5 5. Fragrance 15 7.5
6. Enhance beauty 30 15 TOTAL 200 100
7. Skincare 30 15
TOTAL 200 100
(Source Survey Analysis)
Table No-3 is showing the mean, SD and calculated t- value (which has been compared to 1.96) of
consumers` preference regarding FMCG products of HUL and ITC companies in rural India. This table
shows the results of test of hypothesis of different Parameters. Here “A” indicates that 'Ho is accepted'
and “R” indicates that 'Ho is rejected'.
Motives
Volume 2 Issue 1 Consumers' Preference For FMCG Products In Rural India (A Comparative Study of HUL & ITC)
[121]
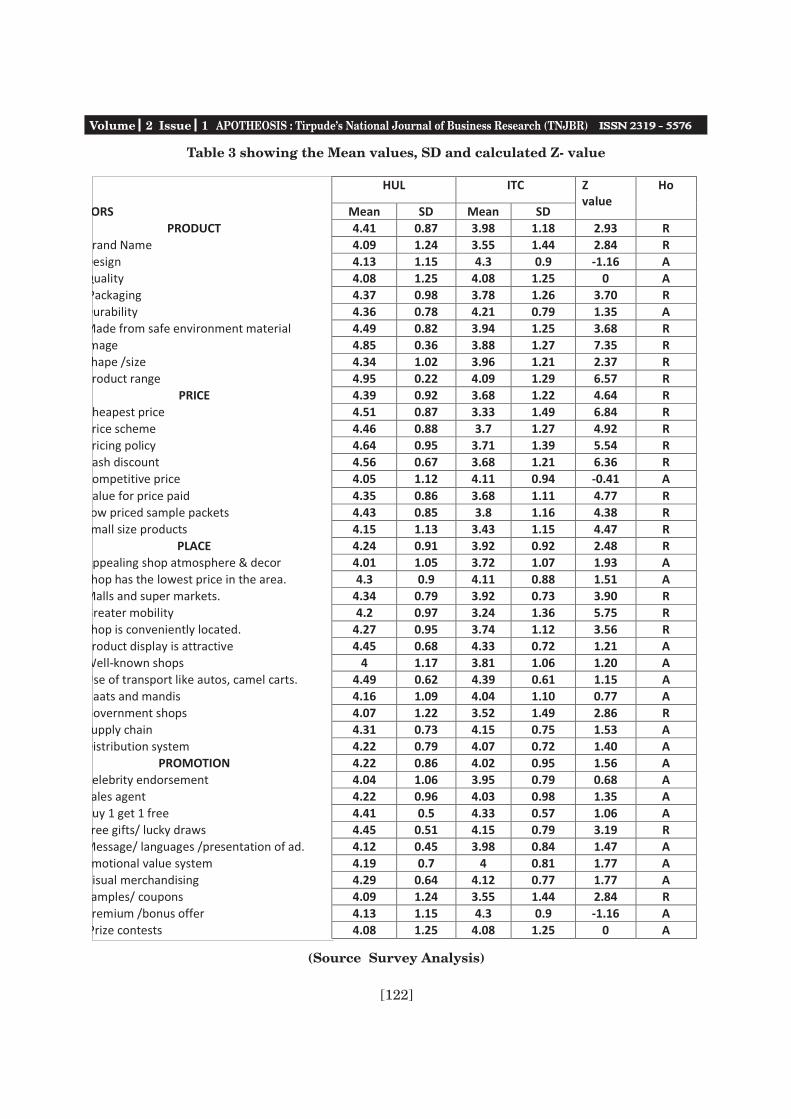
Volume 2 Issue 1 APOTHEOSIS : Tirpude's National Journal of Business Research (TNJBR)
Table 3 showing the Mean values, SD and calculated Z- value
HUL ITC
FACTORS Mean SD Mean SD
Zvalue
Ho
PRODUCT 4.41 0.87 3.98 1.18 2.93 R
1. Brand Name 4.09 1.24 3.55 1.44 2.84 R
2. Design 4.13 1.15 4.3 0.9 -1.16 A
3. Quality 4.08 1.25 4.08 1.25 0 A
4. Packaging 4.37 0.98 3.78 1.26 3.70 R
5. Durability 4.36 0.78 4.21 0.79 1.35 A
6. Made from safe environment material 4.49 0.82 3.94 1.25 3.68 R
7. Image 4.85 0.36 3.88 1.27 7.35 R
8. Shape /size 4.34 1.02 3.96 1.21 2.37 R
9. product range 4.95 0.22 4.09 1.29 6.57 R
PRICE 4.39 0.92 3.68 1.22 4.64 R
1. Cheapest price 4.51 0.87 3.33 1.49 6.84 R
2. Price scheme 4.46 0.88 3.7 1.27 4.92 R
3. Pricing policy 4.64 0.95 3.71 1.39 5.54 R
4. Cash discount 4.56 0.67 3.68 1.21 6.36 R
5. Competitive price 4.05 1.12 4.11 0.94 -0.41 A
6. Value for price paid 4.35 0.86 3.68 1.11 4.77 R
7. Low priced sample packets 4.43 0.85 3.8 1.16 4.38 R
8. Small size products 4.15 1.13 3.43 1.15 4.47 R
PLACE 4.24 0.91 3.92 0.92 2.48 R
1. Appealing shop atmosphere & decor 4.01 1.05 3.72 1.07 1.93 A
2. Shop has the lowest price in the area. 4.3 0.9 4.11 0.88 1.51 A
3. Malls and super markets. 4.34 0.79 3.92 0.73 3.90 R
4. Greater mobility 4.2 0.97 3.24 1.36 5.75 R
5. Shop is conveniently located. 4.27 0.95 3.74 1.12 3.56 R
6. Product display is attractive 4.45 0.68 4.33 0.72 1.21 A
7. Well-known shops 4 1.17 3.81 1.06 1.20 A
8. Use of transport like autos, camel carts. 4.49 0.62 4.39 0.61 1.15 A
9. Haats and mandis 4.16 1.09 4.04 1.10 0.77 A
10. Government shops 4.07 1.22 3.52 1.49 2.86 R
11. Supply chain 4.31 0.73 4.15 0.75 1.53 A
12. Distribution system 4.22 0.79 4.07 0.72 1.40 A
PROMOTION 4.22 0.86 4.02 0.95 1.56 A
1. Celebrity endorsement 4.04 1.06 3.95 0.79 0.68 A
2. Sales agent 4.22 0.96 4.03 0.98 1.35 A
3. Buy 1 get 1 free 4.41 0.5 4.33 0.57 1.06 A
4. Free gifts/ lucky draws 4.45 0.51 4.15 0.79 3.19 R
5. Message/ languages /presentation of ad. 4.12 0.45 3.98 0.84 1.47 A
6. Emotional value system 4.19 0.7 4 0.81 1.77 A
7. Visual merchandising 4.29 0.64 4.12 0.77 1.77 A
8. Samples/ coupons 4.09 1.24 3.55 1.44 2.84 R
9. Premium /bonus offer 4.13 1.15 4.3 0.9 -1.16 A
10. Prize contests 4.08 1.25 4.08 1.25 0 A
(Source Survey Analysis)
[122]
Survey reveals that weighted mean andstandard deviation was used to find theconsumer preference towards FMCG productsof HUL & ITC in rural areas of Agra districtbased on 4 'A's (i.e. Awareness, Affordability,Adoptability and Availability).
Findings
On the basis of survey analysis the followingfindings have been observed:
1) It gauges that the skincare & fragrancehave been found as the prime reasons forusing bathing soaps (personal wash).However meager numbers of respondentshave mentioned that they use it formedicinal purpose and enhance beauty(table no. 2).
2) It can be traced from table no. 2 that theutilitarian aspect of detergent (laundry) i.e.,removal strains has been found the mostdominating reasons for its purpose. The fewrespondents bought it for its fragrancevalue. The consumers buy detergent due toits primary function for cleanliness & fewrespondents buy it for its fragrance.
3) Table no. 2 highlights that the cleanlinessfollowed by freshness have been theprimary motives for the purpose of buyingtoothpaste (oral care). Some of therespondents also purchase it for the purposeof protection of gums and whiteness value.
4) Table no. 2 gauges the reason for buyinghair oil & it is found that the respondentshave been buying it for hair care and goodlooks.
5) Table no. 3 discusses the factors influencingthe purchase decision of the respondentsconsumers buying is influence the most bythe product factor due to design, quality ,durability, made from safe environment andproduct range but few respondents are notsatisfied with the packaging, image and sizeof the product.
6) On competitive price, Shape /size, Design,Haats and mandis & Message/ languages
/presentation of advertisement both thecompanies are almost on the same platform.
7) Malls and super markets, Greater mobility,Shop is conveniently located, Productdisplay is attractive, Value for price paid,Cash discount, and pricing policy, thec o n s u m e r s a r e s h o w i n g t h e i rdissatisfaction.
8) While in case of Promotion, consumersprefer some promotional offers like Buy 1get 1 free, Samples/ coupons etc. These arevariables under 4 A`s which affect theconsumer preference in FMCG products inrural areas and HUL has edge over the ITC as is shown in table no 3.
9) There are product factors that affectpurchase by consumers like Image, Shape/size, Packaging, Durability etc. Similarlyon factors like Small size products, Lowpriced sample packets, Price scheme in caseof price of any product HUL is in betterposition in comparison to ITC.
10) Table no. 3 discusses that factorsinfluencing purchase decision of therespondent consumer are influenced themost by product factors like design, qualityand durability but few respondents are notsatisfied with the product range ,packaging, image and size of the products.
11) Appealing shop atmosphere & décor, Shophaving the lowest price in the area,attractive product display, Well-knownshops, Use of transport like autos, camelcarts and Haats and mandis are somefactors that are good and satisfying toconsumers.
8. Suggetions
1) The study reveals that soaps and detergentbrands of HUL are more popular in urbanmarkets. Since real India lives in ruralareas it is potential market for all types ofsoaps and detergents. In the study it isadvised to the company to develop a tailormade marketing mix with more emphasison product mix. Rural sales promotionalactivities should be strengthened especially
Volume 2 Issue 1 Consumers' Preference For FMCG Products In Rural India (A Comparative Study of HUL & ITC)
[123]

Volume 2 Issue 1 APOTHEOSIS : Tirpude's National Journal of Business Research (TNJBR)
by HUL to take advantage of rural marketpotential.
2) Rural consumer environment must beunderstood before the creation of add.
3) HUL should introduce low priced samplepacks of products & initiate low unit packsof products.
4) Rural mindset accepts the brands easily,which are close to their culture. This pointmust be reflected in advertising for ruralmarkets.
5) ITC should introduce Small size products,Low priced sample packets to the ruralconsumers.
6) Sponsorships to the Melas and Haats mustbe considered in a significant manner.
7) Selection of brand ambassadors, lyrics mustnot be ignored in this regard.
8) Companies should introduce special ruralproducts, like Chic Shampoo sachets @ Re 1,Parle G Tikki Packs @ Rs 2, customized TVsby LG, Shanti Amla oil by Marico. All thesebring positive results for them.
9) If a product is for kids, anganwadis andschools are a good place to tap them andtheir mothers. Similarly, mandis andvillage influencers act as a catalyst inpushing a brand/product.
10) The Language and content must beaccording to the suitability of ruralenvironment. Background figures are also adetermining factor. Admissibility of brandambassadors plays an important role in thisregard. Special promotion measures are thestrong applicable factors in this regard.
11) To think local we have to act local.
9. Conclusion
Indian rural market has a huge size anddemand base. The rural market has changedsignificantly in the past one decade. In today'sscenario, Consumer is the king because he hasgot various choices around him. If you are notable of provide him the desired result he willdefinitely switch over to the other provider.
Therefore to survive in this competitive market,you need to be the best. Consumer is no moreloyal in today's scenario, so you need to bealways on your toes. Hence the consumers areFish Where Fish Are “Reaching villages thatoffer better potential”.
REFERENCES
1. Binay Kumar: BBA (M&S) Amity School ofBusiness, Amity University, Noida ProjectTitle: Rural Marketing.
2. European Association for ComparativeEconomics Studies (EACES) 9th Bi-Annual
3. Conference: Development Strategies - AComparative View.
4. SCMS Journal of Indian Management,January - March, 2008.
5. Market ing to Rura l Consumers -Understanding and tapping the ruralmarket potential 3,4, 5 April, 2008
6. International Journal of Business andManagement September, 2008.
7. Marketing Mastermind, September, 2010.
8) Neeraj Jha, "Gung-ho on rural marketing",The Financial Express, June 19, 2000.
9) Rural Marketing, Ravindranath V. Badiand Naranyansa V. Badi, HimalayaPublishing, 2004
www. ncaer.com
www.mgmtparadise.com
w w w . i n d i a m b a . c o m / f a c u l t ycolumns/Articles.
www.ruralmart.com
www.businessmapsofindia.com
[124]
A PO TH EO SIS – T irpude’s N ationa l Jou rna l o f B usiness Research(TN JB R )
Web: www.dmsr-tcsw.org, Email: [email protected]
------------------------------------------------------------------------------------------------------------------------------------SUBSCRIPTION FORM
Name of Institute / Organization:
Name of Head of Institute:
Contact number of Head of Institute:
Fax: Tel. No. with STDcode:
E-mail of Head of Institute:
Address for Correspondence:
Dist: State: Pin Code:
Nature of Principal Activity: Education Research and Development Consultancy
Whether institution is affiliated to any University: Yes / No
University of Affiliation:
Name and address of the officer in charge authorized to act on behalf of the institution (He/She has to sign the application form)Subscription Duration: One Year Three Year Five years
Amount(Rs). D.D number #: Date:
Bank:
We wish to subscribe Apotheosis-TNJBR for the year 201 to 201
Signature: Date:
#Application form and D.D in favor of “President, DMSR, Tirpude College of Social Work” payableat Nagpur (MS) . Kindly mention the duration of subscription, Name of the subscriber and contactnumber at the back of the Demand Draft and send the same along-with subscription form to:The EditorApotheosis-Tirpude’s National Journal of Business Research(TNJBR)DEPARTMENT OF MANAGEMENT STUDIES & RESEARCH, Tirpude College of Social Work,1-Balasaheb Tirpude Marg, Civil Lines,Sadar,Nagpur-440001Tel: 0712-2525781, Fax: 0712-2543965


